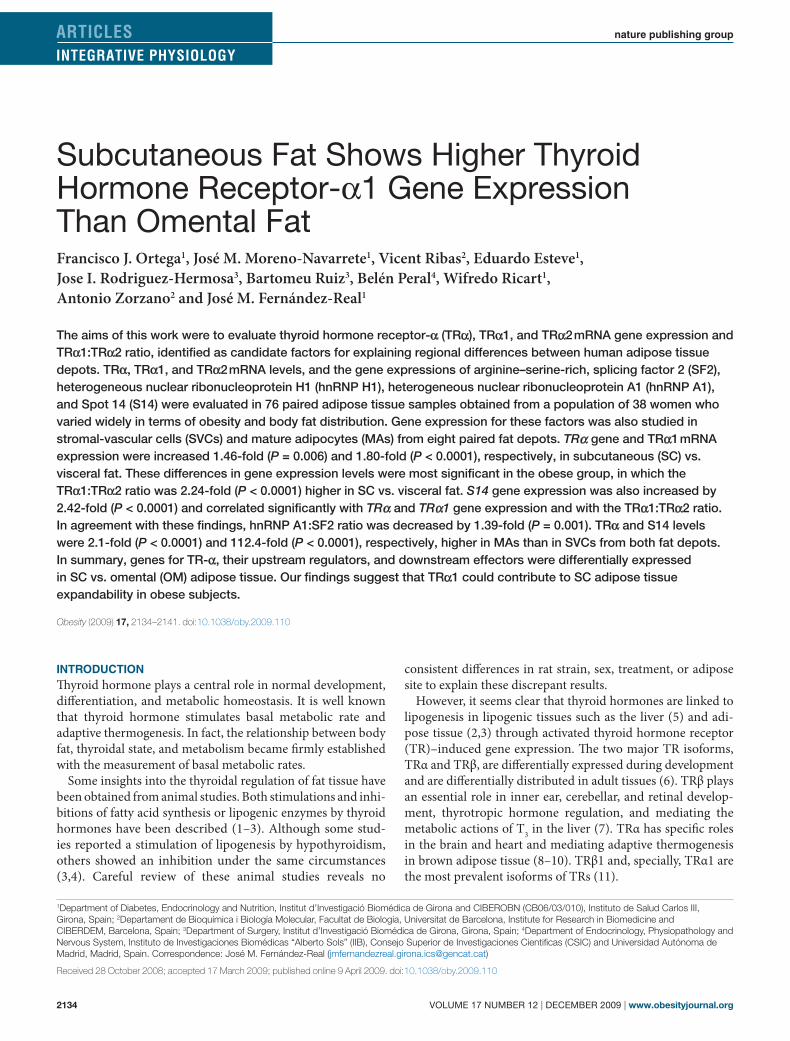
Subcutaneous Fat Shows Higher Thyroid Hormone Receptor-α1 Gene Expression Than Omental Fat
8
2134 VOLUME 17 NUMBER 12 | DECEMBER 2009 | www.obesityjournal.org ARTICLES nature publishing group INTEGRATIVE PHYSIOLOGY INTRODUCTION yroid hormone plays a central role in normal development, differentiation, and metabolic homeostasis. It is well known that thyroid hormone stimulates basal metabolic rate and adaptive thermogenesis. In fact, the relationship between body fat, thyroidal state, and metabolism became firmly established with the measurement of basal metabolic rates. Some insights into the thyroidal regulation of fat tissue have been obtained from animal studies. Both stimulations and inhi- bitions of fatty acid synthesis or lipogenic enzymes by thyroid hormones have been described (1–3). Although some stud- ies reported a stimulation of lipogenesis by hypothyroidism, others showed an inhibition under the same circumstances (3,4). Careful review of these animal studies reveals no consistent differences in rat strain, sex, treatment, or adipose site to explain these discrepant results. However, it seems clear that thyroid hormones are linked to lipogenesis in lipogenic tissues such as the liver (5) and adi- pose tissue (2,3) through activated thyroid hormone receptor (TR)–induced gene expression. e two major TR isoforms, TRα and TRβ, are differentially expressed during development and are differentially distributed in adult tissues (6). TRβ plays an essential role in inner ear, cerebellar, and retinal develop- ment, thyrotropic hormone regulation, and mediating the metabolic actions of T 3 in the liver (7). TRα has specific roles in the brain and heart and mediating adaptive thermogenesis in brown adipose tissue (8–10). TRβ1 and, specially, TRα1 are the most prevalent isoforms of TRs (11). Subcutaneous Fat Shows Higher Thyroid Hormone Receptor-α1 Gene Expression Than Omental Fat Francisco J. Ortega 1 , José M. Moreno-Navarrete 1 , Vicent Ribas 2 , Eduardo Esteve 1 , Jose I. Rodriguez-Hermosa 3 , Bartomeu Ruiz 3 , Belén Peral 4 , Wifredo Ricart 1 , Antonio Zorzano 2 and José M. Fernández-Real 1 The aims of this work were to evaluate thyroid hormone receptor- α (TR α), TR α1, and TR α2 mRNA gene expression and TR α1:TR α2 ratio, identified as candidate factors for explaining regional differences between human adipose tissue depots. TR α, TR α1, and TR α2 mRNA levels, and the gene expressions of arginine–serine-rich, splicing factor 2 (SF2), heterogeneous nuclear ribonucleoprotein H1 (hnRNP H1), heterogeneous nuclear ribonucleoprotein A1 (hnRNP A1), and Spot 14 (S14) were evaluated in 76 paired adipose tissue samples obtained from a population of 38 women who varied widely in terms of obesity and body fat distribution. Gene expression for these factors was also studied in stromal-vascular cells (SVCs) and mature adipocytes (MAs) from eight paired fat depots. TR α gene and TR α1 mRNA expression were increased 1.46-fold (P = 0.006) and 1.80-fold (P < 0.0001), respectively, in subcutaneous (SC) vs. visceral fat. These differences in gene expression levels were most significant in the obese group, in which the TR α1:TR α2 ratio was 2.24-fold (P < 0.0001) higher in SC vs. visceral fat. S14 gene expression was also increased by 2.42-fold (P < 0.0001) and correlated significantly with TR α and TR α1 gene expression and with the TR α1:TR α2 ratio. In agreement with these findings, hnRNP A1:SF2 ratio was decreased by 1.39-fold (P = 0.001). TR α and S14 levels were 2.1-fold (P < 0.0001) and 112.4-fold (P < 0.0001), respectively, higher in MAs than in SVCs from both fat depots. In summary, genes for TR- α, their upstream regulators, and downstream effectors were differentially expressed in SC vs. omental (OM) adipose tissue. Our findings suggest that TR α1 could contribute to SC adipose tissue expandability in obese subjects. Obesity (2009) 17, 2134–2141. doi:10.1038/oby.2009.110 1 Department of Diabetes, Endocrinology and Nutrition, Institut d’Investigació Biomédica de Girona and CIBEROBN (CB06/03/010), Instituto de Salud Carlos III, Girona, Spain; 2 Departament de Bioquímica i Biología Molecular, Facultat de Biología, Universitat de Barcelona, Institute for Research in Biomedicine and CIBERDEM, Barcelona, Spain; 3 Department of Surgery, Institut d’Investigació Biomédica de Girona, Girona, Spain; 4 Department of Endocrinology, Physiopathology and Nervous System, Instituto de Investigaciones Biomédicas “Alberto Sols” (IIB), Consejo Superior de Investigaciones Cientificas (CSIC) and Universidad Autónoma de Madrid, Madrid, Spain. Correspondence: José M. Fernández-Real ([email protected]) Received 28 October 2008; accepted 17 March 2009; published online 9 April 2009. doi:10.1038/oby.2009.110
-
Upload
independent -
Category
Documents
-
view
1 -
download
0
Transcript of Subcutaneous Fat Shows Higher Thyroid Hormone Receptor-α1 Gene Expression Than Omental Fat
2134 VOLUME 17 NUMBER 12 | dEcEMBER 2009 | www.obesityjournal.org
articles nature publishing group
integrative Physiology
IntroductIonThyroid hormone plays a central role in normal development, differentiation, and metabolic homeostasis. It is well known that thyroid hormone stimulates basal metabolic rate and adaptive thermogenesis. In fact, the relationship between body fat, thyroidal state, and metabolism became firmly established with the measurement of basal metabolic rates.
Some insights into the thyroidal regulation of fat tissue have been obtained from animal studies. Both stimulations and inhi-bitions of fatty acid synthesis or lipogenic enzymes by thyroid hormones have been described (1–3). Although some stud-ies reported a stimulation of lipogenesis by hypothyroidism, others showed an inhibition under the same circumstances (3,4). Careful review of these animal studies reveals no
consistent differences in rat strain, sex, treatment, or adipose site to explain these discrepant results.
However, it seems clear that thyroid hormones are linked to lipogenesis in lipogenic tissues such as the liver (5) and adi-pose tissue (2,3) through activated thyroid hormone receptor (TR)–induced gene expression. The two major TR isoforms, TRα and TRβ, are differentially expressed during development and are differentially distributed in adult tissues (6). TRβ plays an essential role in inner ear, cerebellar, and retinal develop-ment, thyrotropic hormone regulation, and mediating the metabolic actions of T3 in the liver (7). TRα has specific roles in the brain and heart and mediating adaptive thermogenesis in brown adipose tissue (8–10). TRβ1 and, specially, TRα1 are the most prevalent isoforms of TRs (11).
Subcutaneous Fat Shows Higher Thyroid Hormone Receptor-α1 Gene Expression Than Omental FatFrancisco J. Ortega1, José M. Moreno-Navarrete1, Vicent Ribas2, Eduardo Esteve1, Jose I. Rodriguez-Hermosa3, Bartomeu Ruiz3, Belén Peral4, Wifredo Ricart1, Antonio Zorzano2 and José M. Fernández-Real1
The aims of this work were to evaluate thyroid hormone receptor-α (TRα), TRα1, and TRα2 mRNA gene expression and TRα1:TRα2 ratio, identified as candidate factors for explaining regional differences between human adipose tissue depots. TRα, TRα1, and TRα2 mRNA levels, and the gene expressions of arginine–serine-rich, splicing factor 2 (SF2), heterogeneous nuclear ribonucleoprotein H1 (hnRNP H1), heterogeneous nuclear ribonucleoprotein A1 (hnRNP A1), and Spot 14 (S14) were evaluated in 76 paired adipose tissue samples obtained from a population of 38 women who varied widely in terms of obesity and body fat distribution. Gene expression for these factors was also studied in stromal-vascular cells (SVCs) and mature adipocytes (MAs) from eight paired fat depots. TRα gene and TRα1 mRNA expression were increased 1.46-fold (P = 0.006) and 1.80-fold (P < 0.0001), respectively, in subcutaneous (SC) vs. visceral fat. These differences in gene expression levels were most significant in the obese group, in which the TRα1:TRα2 ratio was 2.24-fold (P < 0.0001) higher in SC vs. visceral fat. S14 gene expression was also increased by 2.42-fold (P < 0.0001) and correlated significantly with TRα and TRα1 gene expression and with the TRα1:TRα2 ratio. In agreement with these findings, hnRNP A1:SF2 ratio was decreased by 1.39-fold (P = 0.001). TRα and S14 levels were 2.1-fold (P < 0.0001) and 112.4-fold (P < 0.0001), respectively, higher in MAs than in SVCs from both fat depots. In summary, genes for TR-α, their upstream regulators, and downstream effectors were differentially expressed in SC vs. omental (OM) adipose tissue. Our findings suggest that TRα1 could contribute to SC adipose tissue expandability in obese subjects.
Obesity (2009) 17, 2134–2141. doi:10.1038/oby.2009.110
1Department of Diabetes, Endocrinology and Nutrition, Institut d’Investigació Biomédica de Girona and CIBEROBN (CB06/03/010), Instituto de Salud Carlos III, Girona, Spain; 2Departament de Bioquímica i Biología Molecular, Facultat de Biología, Universitat de Barcelona, Institute for Research in Biomedicine and CIBERDEM, Barcelona, Spain; 3Department of Surgery, Institut d’Investigació Biomédica de Girona, Girona, Spain; 4Department of Endocrinology, Physiopathology and Nervous System, Instituto de Investigaciones Biomédicas “Alberto Sols” (IIB), Consejo Superior de Investigaciones Cientificas (CSIC) and Universidad Autónoma de Madrid, Madrid, Spain. Correspondence: José M. Fernández-Real ([email protected])
Received 28 October 2008; accepted 17 March 2009; published online 9 April 2009. doi:10.1038/oby.2009.110
obesity | VOLUME 17 NUMBER 12 | dEcEMBER 2009 2135
articlesintegrative Physiology
In mammals, transcripts from the c-erbA-α gene (NR1A1; Nuclear Receptors Committee, 1999) code for two major TR isoforms, TRα1 (NR1A1a) and TRα2 (NR1A1b), which are functionally antagonistic (for a review, see ref. 12). TRα1 is an authentic TR that binds thyroid hormone (T3) and mediates its activity in many cells and tissues. Interestingly, impaired adi-pogenesis caused by a mutated TRα1 has been described (3). TRα2 (also known to be expressed in human adipose tissue) is a variant receptor that lacks a functional hormone- binding site and antagonizes the ability of TRα1 to activate gene transcription in the presence of T3 (ref. 13). Although both isoforms are expressed in most mammalian cells, the levels of each vary widely in different tissues and at different stages of development. Thus, the regulation of TRα alternative process-ing is important for determining cellular levels of TRα1 and TRα2 mRNAs, which, in turn, are critical for modulating the response to T3.
The balance of the TRα1:TRα2 ratio may be responsible for variations in thyroid hormone sensitivity between different tissues. The TRα1:TRα2 ratio is tissue-specific and depends on cell differentiation status (11,14). The TRα1:TRα2 ratio also depends on certain components of the general splicing mecha-nism, such as the family of serine–arginine proteins and heter-ogeneous nuclear ribonucleoprotein (hnRNP) related proteins (15,16) and the balance between them. These proteins bind the RNA on specific sequences and thereby regulate the splicing direction and the expression pattern of proteins encoded by a single gene in a dose-dependent manner (15). Among these splicing factors, hnRNP H1 seems to enhance the arginine–serine-rich, splicing factor 2 (SF2) splicing effect (17). While hnRNP A1 mediates silencing, hnRNP H1 antagonizes this silencing and hnRNP A1 competes with SF2 in the binding to some G-rich pre-mRNA tracts (18). This phenomenon has been previously described with β-tropomyosin exon 6B alternative splicing (19) and in the c-src exon N1 (ref. 20). The presence of an splicing enhancer element (SEα2), a purine-rich sequence with several G-rich motifs in the final intronic sequences of c-erbA-α gene, supports the idea that these splicing factors could be involved in the tissue TRα1:TRα2 ratio (16). SEα2 would stimulate TRα2 production interacting with serine–arginine and hnRNP proteins.
It is commonly assumed that omental (OM) and subcuta-neous (SC) adipocytes are different at lipogenic and lipolytic activities. Although findings on this subject are not at all unan-imous, these differences include differential GLUT4, RBP4, peroxisome proliferator–activated receptor-γ, and insulin receptor gene expression (21), lipoprotein lipase activity, lipo-lytic rate under maximal stimulation by β-adrenergic agonist, and adipocyte size (22,23), among others (24). To our knowl-edge, none of these studies have linked these documented dif-ferences in both human fat depots to thyroid hormone-induced effects through TRα1:TRα2 ratio. We thus aimed to examine the expression of TRα1 and TRα2 mRNA in human adipose tissue samples representing the two largest fat mass depots, OM and SC adipose tissue, and to test whether this expres-sion is different in obese and nonobese subjects. We found that
the TRα expression was significantly higher in human SC than in OM adipose tissue and that the TRα1:TRα2 ratio was also higher in SC than in OM adipose tissue. To further substanti-ate our results, we analyzed Spot 14 (S14) gene expression. The most striking aspect of S14 gene expression is its T3 depend-ence, very useful in the study of thyroid hormone action in lipogenic tissues, at least in the liver (25). Finally, we also eval-uated SF2, hnRNP H1 and hnRNP A1 gene expression levels, and hnRNP A1:SF2 ratio as a possible determinant factor for alternative c-erbA-α gene 5′-splice-site selection in vivo as well as in vitro (26).
Methods And ProceduressubjectsA group of 76 samples, 38 OM, and 38 SC adipose tissue fragments, from 38 women, with a BMI between 20 and 68 kg/m2, who were recruited at the Endocrinology Service of the Hospital Universitari Dr Josep Trueta (Girona, Spain), were analyzed. All subjects were of white origin, euthyroid, and reported that their body weight had been stable for at least 3 months before the study. Liver and renal diseases were specifically excluded by biochemical work-up. All subjects gave written informed consent after the purpose of the study was explained to them. The institutional review board approved the protocol, so we certify that all applicable institutional regulations concerning the ethical use of information and samples from human volunteers were followed during this research.
Anthropometric measurementsBMI was calculated as weight (in kilograms) divided by height (in meters) squared. The subjects’ waist was measured with a soft tape midway between the lowest rib and the iliac crest. The hip circumfer-ence was measured at the widest part of the gluteal region. The waist-to-hip ratio was then calculated. Deurenberg formula (27) was used to estimate body fat composition in those subjects. According to these anthropometric parameters, subjects were classified on nonobese (BMI <30 kg/m2) and obese (BMI ≥30 kg/m2) following World Health Organization guidelines.
samples treatmentAdipose tissue samples were obtained from SC and visceral depots during elective surgical procedures (cholecystectomy, surgery of abdominal hernia, and gastric by-pass surgery). All samples were washed, fragmented, and immediately flash-frozen in liquid nitrogen before be stored at −80 °C.
Approximately 5 g of SC and OM adipose tissue samples from eight subjects were aseptically isolated and all visible connective tissue was removed. Tissues were finely minced and subjected to a 1-h digestion at 37 °C in a shaking water bath. The digestion buffer included 100 mmol/l HEPES (Sigma-Aldrich, St Louis, MO) buffer containing 120 mmol/l NaCl, 50 mmol/l KCl, 5 mmol/l D-glucose, 1 mmol/l CaCl2, 1.5% type-V bovine serum albumin (Sigma-Aldrich), 2% P/S, and 0.075% collagenase type I (Sigma-Aldrich) solution. The collagenase type I solution used to isolate stromal-vascular cells (SVCs) and mature adipocytes (MAs) from fat samples contained ~1.5 mg collagenase type I/ml. The remain-ing procedure was similar to a previously described method for isolating SVCs from adipose tissue (28). Briefly, upon disintegration of the adipose tissue aggregates, digested tissue was centrifuged and two cellular frac-tions, a pellet of SVCs and a supernatant of MAs, were placed in 20 ml of phosphate buffered saline 2% P/S and passed through sterile nylon mesh filters (autoclaved metal screen) to isolate digested cells. Finally, both SVCs and MAs filtered fractions were washed and centrifuged for 1 min at 400g before being stored at −80 °C.
RNA was prepared from all these samples (both fat biopsies and cellular debris) using RNeasy Lipid Tissue Mini Kit (Qiagen, Gaithersburg, MD).

2136 VOLUME 17 NUMBER 12 | dEcEMBER 2009 | www.obesityjournal.org
articlesintegrative Physiology
The integrity of each RNA sample was checked by either agarose gel elec-trophoresis or with an Agilent Bioanalyzer (Agilent Technologies, Palo Alto, CA). Total RNA was quantified by means of spectrophotometer (GeneQuant; GE Healthcare, Piscataway NJ) or with the bioanalyzer and reverse transcribed to cDNA using High Capacity cDNA Archive Kit (Applied Biosystems, Darmstadt, Germany) according to the manufac-turer’s protocol.
cell cultureSVCs from both visceral and SC fat samples (two paired samples) were resuspended in 2 ml of red cell lysis buffer (ammonium chloride) for 10 min on ice, washed two times with 20 ml of phosphate buffered saline 2% P/S and centrifuged at 400g for 5 min at 37 °C. SVCs (n = 4) were then plated on T-75 cell culture flasks and cultured at 37 °C and 5% CO2 in Dulbecco’s modified Eagle’s medium/Nutrient Mix F-12 medium (1:1, v/v) supplemented with 10 U/ml P/S, fetal bovine serum 10%, HEPES 1% and glutamine 1% (all from Gibco BRL, Grand Island, NY). One week later, human visceral and SC preadipocytes were resuspended and cultured (~40,000 cells/cm2) in 12-well plates in preadipocytes medium (Zen-Bio, Research Triangle Park, NC) composed of Dulbecco’s modi-fied Eagle’s medium/Nutrient Mix F-12 medium (1:1, v/v), HEPES, fetal bovine serum, penicillin, and streptomycin in a humidified 37 °C incu-bator with 5% CO2. At 24 h after plating, cells were checked for complete confluence (day 0) and differentiation was induced using differentia-tion medium (Zen-Bio) composed of preadipocytes medium, human insulin, dexamethasone, isobutylmethylxanthine, and peroxisome proliferator–activated receptor-γ agonists (rosiglitazone). After 7 days, differentiation medium was replaced with fresh adipocyte medium (Zen-Bio) composed of Dulbecco’s modified Eagle’s medium/Nutrient Mix F-12 medium (1:1, v/v), HEPES, fetal bovine serum, biotin, pan-tothenate, human insulin, dexamethasone, penicillin, streptomycin, and amphotericin. Two weeks after initiation of differentiation (day 14), cells appeared rounded with large lipid droplets apparent in the cyto-plasm. Cells were then considered MAs, harvested, and stored at −80 °C for RNA extraction following the aforementioned methods.
Analytical determinationsThe serum glucose concentrations were measured in duplicate by the glucose oxidase method with the use of a Beckman Glucose Analyzer II (Beckman Instruments, Brea, CA). Total serum cholesterol was meas-ured through the reaction of cholesterol esterase/oxidase/peroxidase, using a BM/Hitachi 747. High-density lipoprotein–cholesterol was quantified after precipitation with polyethylene glycol at room temper-ature. Total serum triglycerides were measured through the reaction of glycerol-phosphate-oxidase and peroxidase. Free T4, free T3, and thyro-tropic hormone were measured by electro-chemiluminescence (Roche Diagnostics, Basel, Switzerland) with intra- and interassay coefficients of variation <5%.
Gene expression analysesGene expression was assessed by real-time PCR using an ABI Prism 7000 Sequence Detection System (Applied Biosystems), using SybrGreen and TaqMan technology suitable for relative genetic expres-sion quantification. The human Cyclophilin A (peptidylprolyl isomerase A (PPIA)) was used as endogenous control and gene expression results are expressed as expression ratio relative to PPIA gene expression, ratio relative to TRα2 in TRα1:TRα2 or to SF2 in hnRNP A1:SF2 ratio, using the delta threshold cycle (ΔCt) method with SybrGreen primer and TaqMan primer/probes (Applied Biosystems) according to the manu-facturer’s protocol.
The SybrGreen primer sets used were previously validated to give an optimal amplification over serial dilutions of target, and analysis of melting curves demonstrated specific single product for each gene primer. Primer sequences were as follows: PPIA forward/reverse primer sequences were 5′-CAAATGCTGGACCCAACACAA/CCTCCACAATATTCATGCCTTCTT-3′; TRα1 and TRα2 forward/reverse primer sequences were 5′-GTTCCCAGGACCCCATCCT/GGGTGAGTTG
AGGGCATCTTC-3′ and 5′-GGCCCCAACTCAAGTGTCAC/CTTGGGAAACAGACTCATGCC-3′, respectively. TRα gene expression was assessed by adding up relative TRα1 and TRα2 mRNA values in each sample.
The commercially available and prevalidated TaqMan primer/probe sets used were as follows: endogenous control PPIA (4333763, RefSeq. NM_002046.3, cyclophilin A) and target genes THRSP14 (Hs00930058_m1, RefSeq. NM_003251.2, Spot 14), HNRPH1 (Hs00800662_sH, RefSeq. NM_005520.1, heterogeneous nuclear ribonucleoprotein H1), HNRPA1 (Hs01656228_s1, RefSeq. NM_031157.2 and NM_002136.2, heterogeneous nuclear ribonucleoprotein A1), and SF2 (Hs00199471_m1, RefSeq. NM_006924.4 and NM_001078166.1, arginine–serine-rich, splicing factor 2).
In both RT-PCR techniques, SybrGreen and TaqMan, the reaction was performed in a final volume of 25 μl. The cycle program consisted of an initial denaturing of 10 min at 95 °C then 40 cycles of 15-s denaturizing phase at 95 °C and 1-min annealing and extension phase at 60 °C. A Ct value was obtained for each amplification curve and a ∆Ct value was first calculated by subtracting the Ct value for human Cyclophilin A (PPIA) RNA from the Ct value for each sample. Fold changes compared with the endogenous control were then determined by calculating 2−ΔCt, so gene expression results are expressed as expression ratio relative to PPIA gene expression according to manufacturers’ guidelines. The TRα1:TRα2 ratio was performed using TRα2 mRNA gene expression as reference and TRα1 mRNA as target gene. The same analysis was performed to establish hnRNP A1:SF2 ratio. Positive and negative controls were included in all reactions.
statistical analysesDescriptive results of continuous variables are expressed as mean ± s.d. Before statistical analysis, normal distribution and homogeneity of the variances were evaluated using Levene’s test. Student’s paired two-sample t-test was used to compare groups of adipose tissue samples according to its origin, SC or visceral. All data from human samples are expressed as mean ± s.d. Relation between quantitative variables were tested using Pearson’s test. The statistical analyses and graphics were performed using the program SPSS (version 13.0; SPSS, Chicago, IL).
resultstrα gene expression and trα1:trα2 ratio in both adipose tissue samplesThe anthropometric and metabolic characteristics of the study subjects and the relative gene expression levels in both fat depots are summarized in Tables 1 and 2, respectively, for both nonobese (BMI <30, n = 15) and obese (BMI ≥30, n = 23) subjects. Analysis of these 76 samples (38 pairs) of OM and SC fat depots revealed that TRα gene expression (the sum of TRα1 and TRα2 relative gene expression levels) was significantly increased in the SC vs. OM adipose tissue of obese women (1.61-fold, P = 0.010) (Table 2). TRα1 gene expression was also significantly increased only in SC fat depot from obese women (P < 0.0001, Figure 1a, Table 2).
TRα2 gene expression was not significantly different in the SC vs. OM fat depots. In all subjects as a whole, the TRα1:TRα2 ratio was 2.18-fold higher (P < 0.0001) (Figure 1b) in SC than in OM fat depots (2.07-fold higher (P = 0.002) in nonobese and 2.39-fold higher (P < 0.0001) in obese women) (Table 2). We calculated that ~35% of the TRα gene is spliced into the orphan receptor isoform, TRα2, in OM adipose tissue but only ~21% in the SC fat depot (Figure 1c,d). Thyroid function was not significantly associated with the expression of any of these factors.

obesity | VOLUME 17 NUMBER 12 | dEcEMBER 2009 2137
articlesintegrative Physiology
s14 gene expression analysesTo gain further insight in the detected gene expression differences, we analyzed S14 gene expression and the splicing factors involved in this process. S14 gene expression was also increased by 2.42-fold (P < 0.0001) in SC vs. visceral adipose tissue depots (Figure 2a) in both groups. In fact, S14 gene
expression correlated significantly with TRα (P = 0.001), with TRα1 gene expression (P < 0.0001), and with the TRα1:TRα2 ratio (P = 0.001) in both obese and nonobese subjects.
differential hnrnP A1:sF2 ratio between adipose tissuesTrying to analyze more in depth the molecular processes involved, we analyzed the expression of three splicing proteins, hnRNP H1, hnRNP A1, and SF2, the levels of which are supposed to determine TRα gene alternative and constitutive splicing. We found no differences in hnRNP H1 gene expression in OM vs. SC adipose tissue from non-obese subjects. Interestingly, hnRNP A1 expression was significantly higher in OM vs. SC adipose tissue from obese subjects (Table 2). In fact, in all subjects as a whole, hnRNP A1 gene expression was significantly higher in OM vs. SC fat depots (1.32-fold, P = 0.025) (Figure 2b). Because SF2 gene expression levels were not different between fat depots (Table 2), hnRNP A1:SF2 ratio was 1.39-fold (P = 0.001) higher in OM vs. SC fat in all subjects (1.55-fold, P = 0.003) and 1.33-fold (P = 0.030) in nonobese and obese women, respectively) (Figure 2c).
OM adiposetissue
**
0.00
0.02
0.04
0.06
0.08
0.10
0.12
a
c d
6.0
5.0
4.0
3.0
2.0
1.0
0.0
b **
TR
α1 g
ene
expr
essi
on
TR
α1:T
Rα2
rat
io
SC adiposetissue
OM adiposetissue
TRα2, 34.6%
TRα1, 65.4%
TRα2, 21.2%
TRα1, 78.8%
SC adiposetissue
Figure 1 Regional differences in TRα gene expression levels and TRα1:TRα2 ratios: (a) relative TRα1 mRNA gene expression and (b) TRα1:TRα2 ratio in omental (OM) and subcutaneous (SC) adipose tissue samples from both nonobese (n = 15) and obese (n = 23) women. The mean relative prevalence for each TRα isoform (TRα1 and TRα2) is represented in c for OM and in d for SC fat depot. Values are mean and 95% confidence interval for the mean. **P < 0.001 for comparisons between fat depots in all subjects as a whole. TR, thyroid hormone receptor.
table 1 Anthropometric and metabolic characteristics of the study group
Lean (BMI < 30)
Obese (BMI ≥ 30)
PMean ± s.d.
N (Women) 15 23
Age (years) 47 ± 11 45 ± 13 0.581
BMI (kg/m2) 26.1 ± 2.7 42.9 ± 9.1 <0.0001
Blood glucose (mg/dl) 101.9 ± 53.9 95.0 ± 18.5 0.675
Free T3 (pg/ml) 3.0 ± 0.7 2.6 ± 0.7 0.270
Free T4 (ng/dl) 1.5 ± 0.7 1.3 ± 0.3 0.519
TSH (nU/l) 1.2 ± 0.3 2.2 ± 1.3 0.044
Total cholesterol (mg/dl) 205.4 ± 45.5 195.3 ± 31.6 0.504
HDL-cholesterol (mg/dl) 69.0 ± 18.3 64.7 ± 68.4 0.781
LDL-cholesterol (mg/dl) 113.0 ± 48.3 119.5 ± 31.0 0.683
Triglycerides (mg/dl) 117.5 ± 72.5 121.1 ± 43.6 0.881
Values are means ± s.d. Significative differences (P < 0.05) are shown in bold.HDL, high-densiy lipoprotein; LDL, low-density lipoprotein; TSH, thyrotropic hormone.
table 2 differences in relative gene expression levels and ratios between omental (oM) and subcutaneous (sc) fat depots for nonobese (upper panel) and obese (lower panel) women
OM SC
PMean ± s.d.
Nonobese women (n = 15)
TRα 0.076 ± 0.053 0.098 ± 0.050 0.263
TRα1 0.052 ± 0.040 0.077 ± 0.033 0.081
TRα2 0.024 ± 0.016 0.021 ± 0.019 0.689
TRα1:TRα2 2.275 ± 1.477 4.708 ± 2.279 0.002
hnRNP H1 1.213 ± 0.425 0.861 ± 0.358 0.064
hnRNP A1 0.026 ± 0.007 0.021 ± 0.016 0.469
SF2 0.151 ± 0.047 0.141 ± 0.058 0.675
hnRNP A1:SF2 0.160 ± 0.043 0.103 ± 0.030 0.003
S14 0.228 ± 0.116 0.573 ± 0.336 0.005
Obese women (n = 23)
TRα 0.067 ± 0.027 0.108 ± 0.068 0.010
TRα1 0.041 ± 0.019 0.086 ± 0.054 <0.0001
TRα2 0.025 ± 0.012 0.022 ± 0.015 0.326
TRα1:TRα2 1.749 ± 0.853 4.183 ± 1.339 <0.0001
hnRNP H1 1.144 ± 0.424 0.923 ± 0.516 0.203
hnRNP A1 0.025 ± 0.009 0.018 ± 0.008 0.017
SF2 0.163 ± 0.063 0.146 ± 0.064 0.439
hnRNP A1:SF2 0.163 ± 0.061 0.123 ± 0.029 0.030
S14 0.219 ± 0.132 0.518 ± 0.165 <0.0001
Expression values (means ± s.d.) are the ratio relative to endogenous control PPIA (cyclophilin A). Significative differences (P < 0.05) are shown in bold.hnRNP, heterogeneous nuclear ribonucleoprotein; PPIA, peptidylprolyl isomerase A; SF2, arginine–serine-rich, splicing factor 2; S14, Spot 14; TR, thyroid hor-mone receptor.

2138 VOLUME 17 NUMBER 12 | dEcEMBER 2009 | www.obesityjournal.org
articlesintegrative Physiology
In fact, hnRNP A1 gene expression correlated significantly with TRα2 gene expression (r = 0.78, P < 0.0001; Figure 3 upper panel) and inversely with TRα1:TRα2 ratio (r = −0.39,
P = 0.05; Figure 3 lower panel). This suggests that the rela-tive presence of these splicing factors in human adipose tis-sue from different depots could determine c-erbA-α gene processing.
trα, s14, hnrnP A1, and sF2 levels in sVcs and MAs from oM and sc fat samplesAdipose tissue represents a pool of adipocytes, preadipocytes, and macrophages. Analysis of these 32 samples (16 pairs) of SVCs and MAs obtained from OM (eight pairs) and SC (eight pairs) fat depots revealed that TRα gene expression was 2.1-fold (P < 0.0001) higher in MAs than in SVCs from both fat depots (Figure 4a). On the other hand, S14 levels were 112-fold (P < 0.0001) higher in MAs (Figure 4b). It should be noted that also hnRNP A1 (but not SF2) levels were higher in MAs than in SVCs (Figure 4c,d).
The expression of these factors was similar in cells from SC or OM adipose tissue (Table 3). Interestingly, under the same culture conditions (free T3 = 1.68 pg/ml), preadipocytes from SC fat depots differentiated earlier (lipid droplets were detected at ~5th day vs. ~7th day) and “better” (Figure 5) than those from OM fat. Furthermore, S14 gene expression levels were significantly increased in preadipocytes from SC
OM adipose tissue SC adipose tissue
OM adipose tissue SC adipose tissue OM adipose tissue SC adipose tissue
0.8
0.8
0.4
S14
gen
e ex
pres
sion
hnR
NP
A1
gene
exp
ress
ion
hnR
NP
A1:
SF
2 ra
tio
0.2
0.0
a
0.035 0.25
0.20
0.15
0.10
0.05
0.00
0.030
0.025
0.020
0.015
0.010
0.005
0.000
b
**
* c *
Figure 2 Regional differences in S14 and hnRNP A1 gene expression levels and hnRNP A1:SF2 ratio: (a) relative Spot 14 and (b) hnRNP A1 gene expression levels and hnRNP A1:SF2 ratio (c) in omental (OM) and subcutaneous (SC) adipose tissue samples from both nonobese (n = 15) and obese (n = 23) women. Values are mean and 95% confidence interval for the mean. **P < 0.001 and *P < 0.05 for comparisons between fat depots in all subjects as a whole. hnRNP, heterogeneous nuclear ribonucleoprotein; SF2, arginine–serine-rich, splicing factor 2; S14, Spot 14.
table 3 differences in relative gene expression levels and ratios between stromal-vascular cells (sVcs, upper panel) and mature adipocytes (MA, lower panel) from omental (oM) and subcutaneous (sc) fat depots
OM SC
PMean ± s.d.
SVCs (n = 8)
TRα1:TRα2 1.71 ± 1.01 2.58 ± 1.51 0.201
hnRNP A1:SF2 0.195 ± 0.263 0.143 ± 0.070 0.599
S14 0.0020 ± 0.0013 0.0075 ± 0.0039 0.002
MAs (n = 8)
TRα1:TRα2 1.99 ± 0.45 2.56 ± 1.06 0.182
hnRNP A1:SF2 0.617 ± 0.584 0.590 ± 0.702 0.943
S14 0.532 ± 0.131 0.692 ± 0.338 0.243
Expression values (means ± s.d.) are the ratio relative to endogenous control PPIA (cyclophilin A). Significative differences (P < 0.05) are shown in bold.hnRNP, heterogeneous nuclear ribonucleoprotein; PPIA, peptidylprolyl isomerase A; SF2, arginine–serine-rich, splicing factor 2; S14, Spot 14; TR, thyroid hormone receptor.

obesity | VOLUME 17 NUMBER 12 | dEcEMBER 2009 2139
articlesintegrative Physiology
samples at the 1st day (~300%), and remained higher (~33%) at the 14th day in MAs from SC fat depots than in those from OM samples.
dIscussIonWe here describe that TRα and TRα1 gene expressions were significantly increased in SC vs. OM fat depot from obese women (P < 0.0001) but not in nonobese subjects. According to these findings, human SC adipose tissue from obese subjects is supposed to be more T3-responsive than OM adipose tissue. In this regard, S14 gene expression was also higher in SC than in OM fat depots. Furthermore, we also found that MA is the cell responsible for TRα gene expression levels (Figure 4a), for both TRα1 and TRα2, and for S14 expression levels (Figure 4b). These data could help to understand the role of thyroid hor-mone in the development of the obesity.
TRα2 is an alternative product of the c-erbA-α gene expres-sion that lacks the intact ninth intronic sequence and acquires a unique carboxyl-terminal region. Given its inability to bind T3, the TRα2 capacity to act as a transcription factor is abol-ished (12) but not to bind thyroid hormone response elements.
As a result, TRα2 exerts a dominant negative effect by compet-ing for TR binding to thyroid hormone response elements on DNA (29). The balance between TRα1 and TRα2 is thus impor-tant given their clearly opposite effects on T3-responsive gene expression (5). In this regard, the balance of the TRα1:TRα2 ratio could be responsible for development changes through
0.00
0.00
0.01
0.02
0.03
0.04
TR
α2
0.05
0.06
0.07
a
b
0.01 0.02 0.03
hnRNP A1
0.04 0.05 0.06
0.00
0
2
4TR
α1:T
Rα2 6
8
10
0.01 0.02 0.03hnRNP A1
0.04 0.05 0.06
Figure 3 Linear relationship between hnRNP A1 expression and (a) thyroid hormone receptor α2 (r = 0.78, P < 0.0001) and (b) thyroid hormone receptor α1/α2 ratio (r = −0.39, P = 0.05) in subcutaneous adipose tissue from nonobese (gray circles) and obese (black circles) women. hnRNP, heterogeneous nuclear ribonucleoprotein.
** **
1.0
0.8
0.6
0.4
0.2
0.0
0.18
0.15
0.12
0.09
0.06
0.03
0.00
0.12
0.14
a b
c d
0.10
0.08
0.06
TR
α ge
ne e
xpre
ssio
nhn
RN
PA1
gene
exp
ress
ion
S14
gen
e ex
pres
sion
SF
2 ge
ne e
xpre
ssio
n
0.04
0.02
0.00
0.07
0.06
0.05
0.04
0.03
0.02
0.01
0.00
SVCs MAs SVCs MAs
SVCs MAs SVCs MAs
Figure 4 TRα, S14, hnRNP A1, and SF2 gene expression levels in isolated fat cells: (a) TRα gene expression and (b) Spot 14, (c) hnRNP A1, and (d) SF2 levels in stromal-vascular cells (SVCs) and mature adipocytes (MAs) isolated from 16 adipose tissue biopsies. Values are mean and 95% confidence interval for the mean. **P < 0.001 for comparisons between cells from both SC and OM fat depots. hnRNP, heterogeneous nuclear ribonucleoprotein; PPIA, peptidylprolyl isomerase A; SF2, arginine–serine-rich, splicing factor 2; S14, Spot 14; TR, thyroid hormone receptor.
Adipocytes (14th day) from OM fat
Adipocytes (14th day) from SC fat
Figure 5 Appearance of human preadipocytes isolated from visceral (upper panels) and subcutaneous (lower panels) fat depots, differentiated to mature adipocytes (MAs) during 14 days under the same conditions.

2140 VOLUME 17 NUMBER 12 | dEcEMBER 2009 | www.obesityjournal.org
articlesintegrative Physiology
the control of growth and homeostasis (30). The present results showed higher TRα gene expression in SC fat, mainly due to increased TRα1 mRNA isoform levels, in detriment to TRα2, in SC adipose tissue. Considering the sum of TRα1 and TRα2 values as the total c-erbA-α gene expression, TRα1 constituted the 78.8% of the total expression in SC but only the 65.4% in OM adipose tissue depot.
Additionally, our results imply the existence of differential splicing events of c-erbA-α pre-mRNA according to adipose depots. To further study this differential pre-mRNA process-ing, we aimed to analyze the involved splicing factors, such as hnRNP A1, hnRNP H1, and SF2. We found that hnRNP H1 and hnRNP A1 (but not SF2) tended to be under-expressed in SC samples. Importantly, in parallel to TRα and TRα1 changes, hnRNP A1 was significantly downregulated in the SC adipose tissue depot of obese subjects. Our findings suggest that hnRNP A1:SF2 ratio could be responsible for tissue-specific TRα1:TRα2 ratio differences detected between SC and OM adipose tissue depots. The distal splicing site leading to TRα2 is chosen over polyadenylation of TRα1. This relationship has been previously reported in in vitro studies (31) but, to our knowledge, this phenomenon has not been observed in vivo.
Serine–arginine-rich protein factors are important media-tors of splicing enhancement in both constitutive and alterna-tive splicing (32). hnRNPs constitute a set of polypeptides that bind heterogeneous nuclear RNA with a full rage of functions, most of them presently unknown (33). Among these splicing factors, hnRNP A1 seems to be implicated in a variety of cellu-lar splicing silencing mechanism, through its cooperative rec-ognition of UAGGG[U/A] and related motifs, in a manner that is opposite to the effects exerted by serine–arginine proteins (18). On the other hand, hnRNP H acts as dose-dependent splicing enhancer cooperating with serine–arginine proteins (17). The relative abundance of these spliceosome-related fac-tors and, in particular, the ratio of SF2 or hnRNP H1 to its antagonist, hnRNP A1, could be important in regulating the patterns of alternative splicing in a tissue-specific or develop-mentally regulated manner (19).
Thyroid status influences specifically for each tissue the expression of a number of genes involved in lipid and glucose metabolism. Examples of T3-regulated genes include S14 (2), peroxisome proliferator–activated receptor, malic enzyme, and adenosine triphosphate citrate liase (34), fatty acid syn-thase and glucose transporters (35), acetyl-CoA carboxylase I, and β-adrenoceptor genes (36). S14, commonly related to lipogenic pathways, and β2-adrenergic receptor, associated to lipolytic processes (37), are especially prominent among the most T3-responsive genes in lipogenic tissues.
Others studies have previously focused on TRα1:TRα2 ratio as a reflection of T3-sensitivity. This ratio increases with age and severity of illness in liver samples of critically ill patients (38) but decreases in the liver of patients with chronic liver disease (39) or in fasted rats (30). On the other hand, many studies have investigated the differences between OM and SC adipose depots. Although findings of these studies are not at all unambiguous, most of them showed higher basal lipolysis
rates per cell but lower absolute response to lipolytic stimuli above basal levels to isoproterenol or other catecholamines in SC fat (40), in parallel to increased adipocyte size (22).
In summary, SC fat was characterized by higher TRα gene expression and TRα1:TRα2 ratio. These differences are asso-ciated with differential S14 gene expression. Regional differ-ences in TRα1:TRα2 ratio between both adipose depots can be explained thought differential hnRNP A1:SF2 ratios, also detected between both fat depots. The significantly higher expression of the TRα1 in SC vs. OM fat in obese subjects sug-gests that TRα1 could contribute to SC adipose tissue expanda-bility in obese subjects. Further investigations will be required to evaluate the functional consequences of these findings.
AcknowledGMentsWe greatly appreciate the technical assistance of Judit Bassols, Gerard Pardo, and Oscar Rovira (Unit of diabetes, Endocrinology and Nutrition, Institut d’Investigació Biomèdica de Girona (IdIBGi), Hospital Universitari dr Josep Trueta de Girona). This work was supported by research grants from the Ministerio de Educación y ciencia (SAF2008-02073 and SAF2006-02354), Generalitat de catalunya (2005SGR00947 and 2005SGR00467), and the Instituto de Salud carlos III (IScIIIRETIc Rd06, REdIMET, cIBERdEM).
dIsclosureThe authors declared no conflict of interest.
© 2009 The Obesity Society
reFerences1. Hellström L, Wahrenberg H, Reynisdottir S, Arner P. Catecholamine-induced
adipocyte lipolysis in human hyperthyroidism. J Clin Endocrinol Metab 1997;82:159–166.
2. Jiang W, Miyamoto T, Kakizawa T et al. Expression of thyroid hormone receptor α in 3T3-L1 adipocytes; triiodothyronine increases the expression of lipogenic enzyme and triglyceride accumulation. J Endocrinol 2004;182:295–302.
3. Ying H, Araki O, Furuya F, Kato Y, Cheng SY. Impaired adipogenesis caused by a mutated thyroid hormone α1 receptor. Mol Cell Biol 2007;27:2359–2371.
4. Bjorntorp P. The regulation of adipose tissue distribution in humans. Int J Obes Relat Metab Disord 1996;20:291–302.
5. Cachefo A, Boucher P, Vidon C et al. Hepatic lipogenesis and cholesterol synthesis in hyperthyroid patients. J Clin Endocrinol Metab 2001;86:5353–5357.
6. Forrest D, Sjöberg M, Vennström B. Contrasting developmental and tissue-specific expression of α and β thyroid hormone receptor genes. EMBO J 1990;9:1519–1528.
7. Weiss RE, Murata Y, Cua K et al. Thyroid hormone action on liver, heart, and energy expenditure in thyroid hormone receptor β-deficient mice. Endocrinology 1998;139:4945–4952.
8. Gullberg H, Rudling M, Forrest D, Angelin B, Vennström B. Thyroid hormone receptor β-deficient mice show complete loss of the normal cholesterol 7α-hydroxylase (CYP7A) response to thyroid hormone but display enhanced resistance to dietary cholesterol. Mol Endocrinol 2000;14:1739–1749.
9. Ribeiro MO, Carvalho SD, Schultz JJ et al. Thyroid hormone--sympathetic interaction and adaptive thermogenesis are thyroid hormone receptor isoform--specific. J Clin Invest 2001;108:97–105.
10. Bernal J. Action of thyroid hormone in brain. J Endocrinol Invest 2002;25:268–288.
11. Reyne Y, Nouguès J, Cambon B, Viguerie-Bascands N, Casteilla L. Expression of c-erbAα, c-erbAβ and Rev-erbAα mRNA during the conversion of brown adipose tissue into white adipose tissue. Mol Cell Endocrinol 1996;116:59–65.
12. Lazar MA. Thyroid hormone receptors: multiple forms, multiple possibilities. Endocr Rev 1993;14:184–193.
13. Lazar MA, Chin WW. Nuclear thyroid hormone receptors. J Clin Invest 1990;86:1777–1782.

obesity | VOLUME 17 NUMBER 12 | dEcEMBER 2009 2141
articlesintegrative Physiology
14. Hastings ML, Milcarek C, Martincic K, Peterson ML, Munroe SH. Expression of the thyroid hormone receptor gene, erbAα, in B lymphocytes: alternative mRNA processing is independent of differentiation but correlates with antisense RNA levels. Nucleic Acids Res 1997;25:4296–4300.
15. Hanamura A, Cáceres JF, Mayeda A, Franza BR, Krainer AR. Regulated tissue-specific expression of antagonistic pre-mRNA splicing factors. RNA 1998;4:430–444.
16. Hastings ML, Wilson CM, Munroe SH. A purine-rich intronic element enhances alternative splicing of thyroid hormone receptor mRNA. RNA 2001;7:859–874.
17. Caputi M, Zahler AM. SR proteins and hnRNP H regulate the splicing of the HIV-1 tev-specific exon 6D. EMBO J 2002;21:845–855.
18. Eperon IC, Makarova OV, Mayeda A et al. Selection of alternative 5′ splice sites: role of U1 snRNP and models for the antagonistic effects of SF2/ASF and hnRNP A1. Mol Cell Biol 2000;20:8303–8318.
19. Expert-Bezançon A, Sureau A, Durosay P et al. hnRNP A1 and the SR proteins ASF/SF2 and SC35 have antagonistic functions in splicing of β-tropomyosin exon 6B. J Biol Chem 2004;279:38249–38259.
20. Rooke N, Markovtsov V, Cagavi E, Black DL. Roles for SR proteins and hnRNP A1 in the regulation of c-src exon N1. Mol Cell Biol 2003;23:1874–1884.
21. Lefebvre AM, Laville M, Vega N et al. Depot-specific differences in adipose tissue gene expression in lean and obese subjects. Diabetes 1998;47:98–103.
22. Tchernof A, Bélanger C, Morisset AS et al. Regional differences in adipose tissue metabolism in women: minor effect of obesity and body fat distribution. Diabetes 2006;55:1353–1360.
23. Boivin A, Brochu G, Marceau S et al. Regional differences in adipose tissue metabolism in obese men. Metab Clin Exp 2007;56:533–540.
24. Vohl MC, Sladek R, Robitaille J et al. A survey of genes differentially expressed in subcutaneous and visceral adipose tissue in men. Obes Res 2004;12:1217–1222.
25. LaFave LT, Augustin LB, Mariash CN. S14: insights from knockout mice. Endocrinology 2006;147:4044–4047.
26. Cáceres JF, Stamm S, Helfman DM, Krainer AR. Regulation of alternative splicing in vivo by overexpression of antagonistic splicing factors. Science 1994;265:1706–1709.
27. Deurenberg P, van der Kooy K, Leenen R, Weststrate JA, Seidell JC. Sex and age specific prediction formulas for estimating body composition from bioelectrical impedance: a cross-validation study. Int J Obes 1991;15:17–25.
28. Bunnell BA, Flaat M, Gagliardi C, Patel B, Ripoll C. Adipose-derived stem cells: isolation, expansion and differentiation. Methods 2008;45:115–120.
29. Burgos-Trinidad M, Koenig RJ. Dominant negative activity of thyroid hormone receptor variant α2 and interaction with nuclear corepressors. Mol Cell Endocrinol 1999;149:107–114.
30. Bakker O, Razaki H, de Jong J, Ris-Stalpers C, Wiersinga WM. Expression of the α1, α2, and β1 T3-receptor mRNAs in the fasted rat measured using competitive PCR. Biochem Biophys Res Commun 1998;242:492–496.
31. Timmer DC, Bakker O, Wiersinga WM. Triiodothyronine affects the alternative splicing of thyroid hormone receptor α mRNA. J Endocrinol 2003;179:217–225.
32. Graveley BR. Sorting out the complexity of SR protein functions. RNA 2000;6:1197–1211.
33. Dreyfuss G, Matunis MJ, Piñol-Roma S, Burd CG. hnRNP proteins and the biogenesis of mRNA. Annu Rev Biochem 1993;62:289–321.
34. Brown SB, Maloney M, Kinlaw WB. “Spot 14” protein functions at the pretranslational level in the regulation of hepatic metabolism by thyroid hormone and glucose. J Biol Chem 1997;272:2163–2166.
35. Xiong S, Chirala SS, Hsu MH, Wakil SJ. Identification of thyroid hormone response elements in the human fatty acid synthase promoter. Proc Natl Acad Sci USA 1998;95:12260–12265.
36. Wahrenberg H, Engfeldt P, Arner P, Wennlund A, Ostman J. Adrenergic regulation of lipolysis in human adipocytes: findings in hyper- and hypothyroidism. J Clin Endocrinol Metab 1986;63:631–638.
37. Viguerie N, Millet L, Avizou S et al. Regulation of human adipocyte gene expression by thyroid hormone. J Clin Endocrinol Metab 2002;87:630–634.
38. Thijssen-Timmer DC, Peeters RP, Wouters P et al. Thyroid hormone receptor isoform expression in livers of critically ill patients. Thyroid 2007;17:105–112.
39. Williams GR, Franklyn JA, Neuberger JM, Sheppard MC. Thyroid hormone receptor expression in the “sick euthyroid” syndrome. Lancet 1989;2:1477–1481.
40. Hellmér J, Marcus C, Sonnenfeld T, Arner P. Mechanisms for differences in lipolysis between human subcutaneous and omental fat cells. J Clin Endocrinol Metab 1992;75:15–20.