Abdominal subcutaneous fat gene expression and circulating levels of leptin and adiponectin in...
6
Abdominal subcutaneous fat gene expression and circulating levels of leptin and adiponectin in polycystic ovary syndrome Sheila B€ unecker Lecke, Ph.D., a Fabricio Mattei, B.Sc., a,b D ebora Martinho Morsch, Ph.D., a and Poli Mara Spritzer, M.D., Ph.D. a,b,c a Gynecologic Endocrinology Unit, Division of Endocrinology, Hospital de Cl ınicas de Porto Alegre, Porto Alegre, Brazil; b Laboratory of Molecular Endocrinology, Department of Physiology, Universidade Federal do Rio Grande do Sul, Porto Alegre, Brazil; and c National Institute of Hormones and Women’s Health, Conselho Nacional de Pesquisa e Desenvolvimento, Porto Alegre, Brazil Objective: To determine leptin and adiponectin serum levels and gene expression in subcutaneous adipose tissue from women with polycystic ovary syndrome (PCOS) and nonhirsute, ovulatory women; and leptin/adiponectin (L/A) ratio. Design: Case–control study. Setting: University hospital gynecologic endocrinology unit. Patient(s): Thirty-one women with PCOS and 57 controls. Intervention(s): Anthropometric, hormonal, and metabolic assessment; subcutaneous adipose tissue biopsy. Main Outcome Measure(s): Leptin and adiponectin serum levels, L/A ratio, controlled by age, and gene expression in women with PCOS and controls, stratified by body mass index and variables associated with androgen excess and insulin resistance. Result(s): Serum leptin was higher in overweight/obese patients with PCOS than in all normal-weight control women. Adiponectin levels were similar in all subgroups. The L/A ratio was lower in normal-weight controls (1.80; range 0.94–3.72) than in overweight/obese controls (5.27; range 2.66–13.58) and patients with PCOS (7.73; range 3.81–15.04). Subcutaneous leptin messenger RNA was higher in overweight/obese women with PCOS than in normal-weight controls (2.316 [range 1.987–2.580] vs. 1.687 [range 1.518–2.212]). Adiponectin gene expression was similar in all groups. Positive correlations were found between serum and messenger RNA levels for both leptin and adiponectin. On multiple regression analysis, percentage of body fat contributed significantly to L/A ratio in PCOS, independently of body mass index and free androgen index. Conclusion(s): In PCOS, altered adipocyte secretion seems to relate to adiposity rather than to androgen excess. (Fertil Steril Ò 2011;95:2044–9. Ó2011 by American Society for Reproductive Medicine.) Key Words: Adipokines, real-time polymerase chain reaction, PCOS, adipose tissue, insulin resistance, central obesity Adipocyte-secreted proteins, or adipokines, have been proposed as mediators for metabolic syndrome components. Two adipokines, leptin and adiponectin, have been associated with body mass index (BMI), insulin action, and glucose metabolism. However, different or complementary mechanisms seem to be involved in leptin or adiponectin regulation of metabolic homeostasis (1, 2). Obesity, predominantly abdominal, is observed in 30%–75% of women with PCOS (3–6). In these patients, elevated serum leptin levels are associated with obesity and metabolic disturbances (7–10). In contrast, adiponectin levels have been reported to be decreased (9, 11–15) or unchanged (16–18) in PCOS. Xita et al. (19) have proposed that leptin/adiponectin ratio (L/A ratio), rather than adiponectin or leptin alone, relates to insulin resistance in women with PCOS (19). Leptin gene expression in subcutaneous adipose tissue is also positively correlated with BMI in obese subjects (20–23). For adiponectin gene expression, an inverse correlation with BMI, obesity, and metabolic risk factors has been reported by some investigators (20, 24–27) but not by others (22, 28). The few studies investigating adipokine gene expression in adipose tissue from women with PCOS show lower leptin and adiponectin expression (13). Therefore, our aims were to characterize leptin and adiponectin gene expression in subcutaneous adipose tissue from women with PCOS and nonhirsute, ovulatory control women, and to determine the circulating levels of these adipokines and the L/A ratio. We also investigated the association between leptin and adiponectin features and adiposity, androgens, and insulin resistance. MATERIALS AND METHODS Patients and Controls This case–control study was carried out with women of reproductive age, with BMI between 18.5 and 39.9 kg/m 2 , consulting at a university hospital clinic in Brazil. Thirty-one hirsute women presenting oligo/amenorrheic cy- cles (few than nine per year), increased levels of serum T or free androgen Received October 28, 2010; revised February 18, 2011; accepted February 21, 2011; published online March 21, 2011. S.B.L. has nothing to disclose. F.M. has nothing to disclose. D.M.M. has nothing to disclose. P.M.S. has nothing to disclose. Supported by grants from Conselho Nacional de Desenvolvimento Cient ıfico e Tecnol ogico (573747/2008-3), Coordenac ¸ ~ ao de Aperfei- c ¸ oamento de Pessoal de N ıvel Superior (1289/05), and Fundo de Apoio a Pesquisa do Hospital de Cl ınicas de Porto Alegre (340/2004), Brazil. Reprint requests: Poli Mara Spritzer, M.D., Ph.D., Division of Endocrinol- ogy, Hospital de Cl ınicas de Porto Alegre, Rua Ramiro Barcelos 2350, CEP 90035-003 Porto Alegre, Brazil (E-mail: [email protected]). Fertility and Sterility â Vol. 95, No. 6, May 2011 0015-0282/$36.00 Copyright ª2011 American Society for Reproductive Medicine, Published by Elsevier Inc. doi:10.1016/j.fertnstert.2011.02.041 2044
-
Upload
independent -
Category
Documents
-
view
2 -
download
0
Transcript of Abdominal subcutaneous fat gene expression and circulating levels of leptin and adiponectin in...

Received
Februar
S.B.L. has
nothing
Supported
Cient�ıfic
coamen�a Pesqu
Reprint req
ogy, Ho
CEP 900
FC
2044
Abdominal subcutaneous fat gene expression andcirculating levels of leptin and adiponectin inpolycystic ovary syndrome
Sheila B€unecker Lecke, Ph.D.,a Fabricio Mattei, B.Sc.,a,b D�ebora Martinho Morsch, Ph.D.,a
and Poli Mara Spritzer, M.D., Ph.D.a,b,c
a Gynecologic Endocrinology Unit, Division of Endocrinology, Hospital de Cl�ınicas de Porto Alegre, Porto Alegre, Brazil;b Laboratory of Molecular Endocrinology, Department of Physiology, Universidade Federal do Rio Grande do Sul, Porto Alegre,
Brazil; and c National Institute of Hormones and Women’s Health, Conselho Nacional de Pesquisa e Desenvolvimento, Porto
Alegre, Brazil
Objective: To determine leptin and adiponectin serum levels and gene expression in subcutaneous adipose tissuefrom women with polycystic ovary syndrome (PCOS) and nonhirsute, ovulatory women; and leptin/adiponectin(L/A) ratio.Design: Case–control study.Setting: University hospital gynecologic endocrinology unit.Patient(s): Thirty-one women with PCOS and 57 controls.Intervention(s): Anthropometric, hormonal, and metabolic assessment; subcutaneous adipose tissue biopsy.Main OutcomeMeasure(s): Leptin and adiponectin serum levels, L/A ratio, controlled by age, and gene expressionin womenwith PCOS and controls, stratified by bodymass index and variables associated with androgen excess andinsulin resistance.Result(s): Serum leptin was higher in overweight/obese patients with PCOS than in all normal-weight controlwomen. Adiponectin levels were similar in all subgroups. The L/A ratio was lower in normal-weight controls(1.80; range 0.94–3.72) than in overweight/obese controls (5.27; range 2.66–13.58) and patients with PCOS(7.73; range 3.81–15.04). Subcutaneous leptin messenger RNA was higher in overweight/obese women withPCOS than in normal-weight controls (2.316 [range 1.987–2.580] vs. 1.687 [range 1.518–2.212]). Adiponectingene expression was similar in all groups. Positive correlations were found between serum and messenger RNAlevels for both leptin and adiponectin. On multiple regression analysis, percentage of body fat contributedsignificantly to L/A ratio in PCOS, independently of body mass index and free androgen index.Conclusion(s): In PCOS, altered adipocyte secretion seems to relate to adiposity rather than to androgen excess.(Fertil Steril� 2011;95:2044–9. �2011 by American Society for Reproductive Medicine.)
Key Words: Adipokines, real-time polymerase chain reaction, PCOS, adipose tissue, insulin resistance, central obesity
Adipocyte-secreted proteins, or adipokines, have been proposed asmediators for metabolic syndrome components. Two adipokines,leptin and adiponectin, have been associated with body mass index(BMI), insulin action, and glucose metabolism. However, differentor complementary mechanisms seem to be involved in leptin oradiponectin regulation of metabolic homeostasis (1, 2).
Obesity, predominantly abdominal, is observed in 30%–75% ofwomen with PCOS (3–6). In these patients, elevated serum leptinlevels are associated with obesity and metabolic disturbances(7–10). In contrast, adiponectin levels have been reported to bedecreased (9, 11–15) or unchanged (16–18) in PCOS. Xita et al.(19) have proposed that leptin/adiponectin ratio (L/A ratio), rather
October 28, 2010; revised February 18, 2011; accepted
y 21, 2011; published online March 21, 2011.
nothing to disclose. F.M. has nothing to disclose. D.M.M. has
to disclose. P.M.S. has nothing to disclose.
by grants from Conselho Nacional de Desenvolvimento
o e Tecnol�ogico (573747/2008-3), Coordenac~ao de Aperfei-
to de Pessoal de N�ıvel Superior (1289/05), and Fundo de Apoio
isa do Hospital de Cl�ınicas de Porto Alegre (340/2004), Brazil.
uests: Poli Mara Spritzer, M.D., Ph.D., Division of Endocrinol-
spital de Cl�ınicas de Porto Alegre, Rua Ramiro Barcelos 2350,
35-003 Porto Alegre, Brazil (E-mail: [email protected]).
ertility and Sterility� Vol. 95, No. 6, May 2011opyright ª2011 American Society for Reproductive Medicine, P
than adiponectin or leptin alone, relates to insulin resistance inwomen with PCOS (19).
Leptin gene expression in subcutaneous adipose tissue is alsopositively correlated with BMI in obese subjects (20–23). Foradiponectin gene expression, an inverse correlation with BMI,obesity, and metabolic risk factors has been reported by someinvestigators (20, 24–27) but not by others (22, 28). The fewstudies investigating adipokine gene expression in adipose tissuefrom women with PCOS show lower leptin and adiponectinexpression (13).
Therefore, our aims were to characterize leptin and adiponectingene expression in subcutaneous adipose tissue from women withPCOS and nonhirsute, ovulatory control women, and to determinethe circulating levels of these adipokines and the L/A ratio. Wealso investigated the association between leptin and adiponectinfeatures and adiposity, androgens, and insulin resistance.
MATERIALS AND METHODSPatients and ControlsThis case–control study was carried out with women of reproductive age,
with BMI between 18.5 and 39.9 kg/m2, consulting at a university hospital
clinic in Brazil. Thirty-one hirsute women presenting oligo/amenorrheic cy-
cles (few than nine per year), increased levels of serum T or free androgen
0015-0282/$36.00ublished by Elsevier Inc. doi:10.1016/j.fertnstert.2011.02.041

index (FAI), and/or polycystic ovaries, without other disorders causing hir-
sutism (8, 29) were enrolled. A control group was set up with 57 women
of reproductive age, recruited through public advertisement at the same
clinic. Inclusion criteria were absence of hirsutism and regular, ovulatory
cycles (luteal-phase P >3.8 ng/mL). Transabdominal/transvaginal ovarian
ultrasound was performed in all patients. None of the participants had
received drugs known to interfere with hormonal levels for at least 3
months. Women with diabetes, liver or renal disease, thyroid dysfunction,
or pregnancy were excluded. The study protocol was approved by the
institutional review board. Written informed consent was obtained from all
subjects.
Study ProtocolMedical interview and physical examination were performed as previously
described (30, 31). Hirsutism was defined as a modified Ferriman-Gallwey
score R8 (32). Blood pressure was measured after a 10-minute rest (33).
Anthropometric measurements included body weight, height, BMI, waist cir-
cumference (30, 34), hip circumference (35), waist/hip ratio, and percentage of
body fat (sumof triceps, subscapular, suprailiac, and abdominal skinfolds) (36).
Skinfold thickness was estimated in triplicate with a caliper (Cescorf, Mitu-
toyo, Porto Alegre, Brazil) with 0.1-mm scale and pressure of 10 g/mm2 (37).
Hormonal and metabolic assessment, as well as transvaginal/transabdomi-
nal ultrasound, were performed between days 2 and 10 of the menstrual cycle
or on any day if the patient was amenorrheic. Polycystic ovary appearance
was defined as previously reported (29, 38). After an overnight 12-hour
fast, blood samples were drawn between 8 AM and 10 AM from an
antecubital vein for determination of plasma leptin, adiponectin, and lipid
profile at baseline and glucose and insulin before and 2 hours after
ingestion of 75 g oral anhydrous glucose (oral glucose tolerance test).
Blood samples were also assessed for measurement of highly sensitive
C-reactive protein (hs-CRP), E2, LH, sex hormone–binding globulin
(SHBG), and total T (TT). Free androgen index was estimated by dividing
TT (nmol/L) by SHBG (nmol/L) � 100. Serum and subcutaneous L/A
ratios were calculated by dividing serum leptin by serum adiponectin and
leptin messenger RNA (mRNA) by adiponectin mRNA, respectively.
Homeostasis model assessment index to estimate insulin resistance
(HOMA-IR) was calculated by multiplying insulin (mIU/mL) by glucose
(mmol/L) and dividing this product by 22.5 (39). Low-density lipoprotein
cholesterol was estimated indirectly with the Friedewald formula (40). Lipid
accumulation product index was calculated using the formula (waist circum-
ference [cm] � 58) � triglycerides (mmol/L) (31). Twelve normal-weight
and 10 overweight/obese control patients did not return for an additional con-
sultation and 2-hour blood tests. Therefore, 35 controls underwent complete
clinical, anthropometric, and metabolic evaluation and the oral glucose
tolerance test.
Biochemical and Hormonal AssaysTotal cholesterol, high-density lipoprotein cholesterol, triglycerides, and
glucose were determined by colorimetric-enzymatic methods. Enzyme-
linked immunosorbent assay (Linco Research, St. Charles Missouri) was
used to measure serum leptin and total adiponectin, with sensitivity (S) of
0.5 and 1.56 ng/mL respectively, and coefficient of variation (CV) of
<10% and<15%. Serum hs-CRP levels were measured using the nephelom-
etry method (Siemens Dade Behring, Deerfield, IL), with S ¼ 0.17 mg/L and
CV<5%. Serum insulin (S¼ 0.2 mIU/mL), E2 (S¼ 5.0 pg/mL), LH (S¼ 0.1
mIU/mL), and SHBG (S ¼ 0.35 nmol/L) levels were measured with electro-
chemiluminescent immunoassays (Roche Diagnostics, Mannhein, Germany),
with intra-assay CV <3% and interassay CV <5%. Total serum T levels
were measured with RIA (Diagnostics Systems Laboratories Inc., Webster,
TX), with S <0.1 ng/mL and CV <9.6%.
Tissue CollectionAdipose tissue biopsy was performed by surgeons from the Plastic Surgery
Service in 29 women with PCOS and 47 control women to obtain a
250-mg sample of umbilical subcutaneous fat. Samples were immediately
frozen in liquid nitrogen and stored at �80�C until total RNA isolation.
Fertility and Sterility�
RNA IsolationAdipose tissue total RNA extraction was carried out in phenol-guanidine iso-
thiocyanate (Trizol; Invitrogen Life Technologies, Foster City, CA) (41, 42).
Concentration and quality of total RNA were assessed using a GeneQuant
spectrophotometer (Pharmacia Biotech, Cambridge, England).
Real-Time RT-PCR ProtocolReverse transcription of 1 mg of total RNAwas carried out using the Super-
script II First-Strand Synthesis System for reverse transcriptase–polymerase
chain reaction (RT-PCR) (Invitrogen Life Technologies), according to the
manufacturer’s instructions in a PCT-100 Programmable Thermal Controller
(MJ Research, Watertown, MA).
Real-time PCR was performed in triplicate in a 7500 Fast Real-Time PCR
System thermal cycler with 7500 Fast System Sequence Detection 1.4 soft-
ware (Applied Biosystems, Foster City, CA). Experiments monitored in real
time the increased fluorescence of the SYBR Green dye (43–45). Primers
were designed using Primer Express 3.0 software for real-time PCR (Applied
Biosystems) and obtained from Invitrogen Life Technologies. Primer
sequences were projected to target two exons of an mRNA transcript with re-
spect to known splice variants and single nucleotide polymorphism positions.
The forward and reverse primer sequences for leptin (NM_000230.2) were
(50 to 30) TCCCCTCTTGACCCATCTC and GGGAACCTTGTTCTGGT
CAT, respectively. These primers anneal between residues 858 to 876 (for-
ward) and 967 to 948 (reverse), producing a PCR product of 110 bp. The
forward and reverse primer sequences for adiponectin (NM_004797.2)
were (50 to 30) TGGAGTGTTGGTAGGTGTCTGT and GGGCCATTGAGT
AGTAGTCCTT, respectively. These primers anneal between residues 1,280
to 1,301 (forward) and 1,431 to 1,410 (reverse), producing a 152-bp ampli-
con. Glyceraldehyde-3-phosphate dehydrogenase (GAPDH; NM_
002046.3) normalized mRNA quantitation. ACCCACTCCTCCACCTTTG
and CTCTTGTGCTCTTGCTGGG (50 to 30), respectively, forward and
reverse GAPDH sequences, anneal between residues 970 to 988 and 1,147
to 1,129, resulting in an amplicon of 178 bp. Complementary DNA samples
(0.25 ng/mL) were mixed with a predetermined forward and reverse primer
volume (respectively, 0.9 and 0.7 mL for leptin, 0.3 and 0.7 mL for adiponec-
tin, 0.9 and 0.9 mL for GAPDH) and 12.5 mL of 2� Fast SYBRGreenMaster
Mix (Applied Biosystems) in 25 mL. Protocol conditions consisted of dena-
turation at 94�C for 2 min, followed by 50 cycles (30 sec, 94�C and 30 sec,
60�C) for leptin or (30 sec, 94�C; 30 sec, 55�C; and 30 sec, 72�C for adipo-
nectin). Amplicons produced single sharp peaks during melting curve
analysis.
Data were analyzed by relative quantitation using the comparative CT
method (46). Validation assays included amplification of the target and ref-
erence genes, separately, using serial dilutions of an mRNA sample. Both tar-
get and reference mRNAs presented equal efficiencies of amplification. The
DDCT method calculates changes in gene expression as relative fold differ-
ence between an experimental and the calibrator sample, correcting nonideal
amplification efficiencies (47).
Statistical AnalysisData were described as mean� SD or median and interquartile range (25%–
75%). The sample size was calculated according to data from the literature
about gene expression of leptin and adiponectin in non-PCOS populations
(20, 22).
Comparisons between means were analyzed by the unpaired two-tailed
Student’s t-test or Mann-Whitney U test. Group means were compared by
one-way analysis of variance (ANOVA) followed by Tukey’s post hoc test.
Analyses were also adjusted by age (linear regression), except for gene ex-
pression. Pearson’s or Spearman’s rank correlation coefficients were calcu-
lated between variables using a two-tailed test for significance. A forward
stepwise multiple regression model was also calculated for patients with
PCOS using serum L/A ratio as a dependent variable, and BMI, percentage
of body fat, and FAI as independent variables. Log10 transformation was used
to normalize the distribution of non-Gaussian variables, and mean values
were back-transformed for presentation. Data were considered statistically
2045

TABLE 1Anthropometric, clinical, metabolic, and hormonal features for control women and women with PCOS, stratified according to
BMI (kg/m2).
Characteristic
BMI <25 BMI R25
P Adjusted forage (linear regression)
Control(n [ 19)
PCOS(n [ 8)
Control(n [ 38)
PCOS(n [ 23)
Age (y) 29.3 � 5.9a,b 25.4 � 5.3b,c 32.5 � 4.9a 23.4 � 6.1c < .001
(unadjusted for age)BMI (kg/m2) 22.5 � 1.9a 22.5 � 2.3a 30.8 � 4.0b 32.7 � 4.2b < .001
Waist circumference (cm) 72.9 � 6.5a,d 74.0 � 7.0a 88.8 � 8.3b,e 95.1 � 9.8b < .001
WHR 0.74 � 0.04a,d 0.74 � 0.04a 0.78 � 0.05a,e 0.85 � 0.08b < .001
Body fat (%) 18.7 � 5.2a,d 19.6 � 2.8a 28.9 � 4.1b,e 31.4 � 4.6b < .001Ferriman-Gallwey score 3 (0–5)a,d 9 (8–13)b 2 (0–5)a,e 9 (7–15)b < .001
Systolic BP (mm Hg) 115 � 14d 119 � 11 117 � 9e 117 � 18 .969
Diastolic BP (mm Hg) 72 � 4d 74 � 9 75 � 10e 74 � 12 .945Fasting glucose (mg/dL) 87 � 6d 88 � 4 90 � 7e 91 � 8 .311
Glucose 2 h (mg/dL) 86 � 11a,d 91 � 16a 98 � 19a,e 124 � 26b < .001
Fasting insulin (uIU/mL) 4 (3–7)a 7 (4–8)a,b 11 (6–14)b 14 (11–20)c < .001
Insulin 2 h (uIU/mL) 23 (22–70)a,d 45 (34–62)a 52 (34–87)a,e 113 (56–191)b < .001HOMA-IR 1.0 (0.8–1.7)a,d 1.5 (0.8–1.7)a 2.4 (1.6–3.2)b,e 3.4 (2.3–4.3)c < .001
Triglycerides (mg/dL) 54 (38–66)a 61 (41–67)a,b 69 (50–116)b 89 (51–123)b .005
Total cholesterol (mg/dL) 157 � 31 152 � 28 155 � 45 177 � 42 .172
HDL cholesterol (mg/dL) 56 � 18 53 � 9 47 � 17 51 � 10 .179LDL cholesterol (mg/dL) 91 � 28 90 � 26 92 � 33 108 � 37 .253
LAP 8.5 (5.3–9.2)a,d 8.5 (6.2–17.4)a 25.1 (14.4–40.3)b,e 38.4 (22.0–50.7)b < .001
hs-CRP (mg/L) 0.66 (0.16–0.80)a,d 3.03 (0.66–10.14)a,b 2.27 (0.91–4.13)b,e 4.31 (0.75–12.00)b .004
LH (mIU/mL) 6.1 (5.2–7.0)a,b,d 11.0 (8.4–14.2)a,c 5.4 (3.7–7.9)b,e 12.5 (6.5–18.1)c .012SHBG (nmol/L) 64.9 (53.0–78.0)a 48.1 (46.6–60.6)a,b 32.6 (23.4–49.3)b,c 26.8 (16.9–41.5)c < .001
Total T (ng/mL) 0.60 (0.46–0.71)a 0.94 (0.78–1.52)b 0.57 (0.49–0.65)a 1.27 (0.92–1.46)b < .001
FAI 3.4 (2.1–4.6)a 5.9 (3.2–11.8)b,c 5.1 (4.0–7.1)b 14.0 (7.9–22.8)c < .001E2 (pg/mL) 100.6 (44.4–156.6) 44.7 (35.4–69.6) 44.9 (32.7–88.2) 55.6 (39.7–68.3) .050
Note: Values are expressed as mean � SD or median and interquartile range (25%–75%). BP¼ blood pressure; HDL ¼ high-density lipoprotein; LAP ¼ lipid
accumulation product; LDL ¼ low-density lipoprotein; WHR ¼ waist/hip ratio.a,b,c Different letters indicate statistical difference by one-way ANOVA plus Tukey post hoc test.d n ¼ 7.e n ¼ 28.
Lecke. Role of leptin and adiponectin in PCOS. Fertil Steril 2011.
significant at P<.05. The Statistical Package for the Social Sciences 16
(SPSS, Chicago, IL) was used in the analysis.
RESULTSTable 1 shows BMI-stratified data for control women and womenwith PCOS (<25 or R25 kg/m2). Hirsutism score and T levelswere higher in PCOS (P<.001). Although FAI was significantlyhigher in PCOS subgroups than in controls (P<.001), lean patientswith PCOS did not differ from overweight/obese controls. Luteiniz-ing hormone was higher in PCOS subgroups, but normal-weightwomen with PCOSwere similar to normal-weight controls. Sex hor-mone–binding globulin levels were strikingly lower in overweight/obese women with PCOS than in normal-weight controls. Over-weight/obese patients with PCOS were younger than controls(P<.001) but presented hyperinsulinemia, as indicated by insulinand HOMA-IR. Two-hour glucose levels were also higher in theoverweight/obese PCOS subgroup (P<.001). Insulin, triglycerides,and hs-CRP were similar in normal-weight patients with PCOS andoverweight/obese controls (P<.005). Waist/hip ratio was higher inoverweight/obese patients with PCOS vs. all other subgroups(P<.001).Waist circumference, percentage of body fat, and lipid ac-cumulation product were significantly higher in overweight/obese
2046 Lecke et al. Role of leptin and adiponectin in PCOS
than in normal-weight subgroups with or without PCOS (P<.001)(Table 1). Polycystic ovaries were more frequent in PCOS than con-trol subgroups (P¼.02). The group differences remained significantafter adjustment for age.
Leptin concentrations were significantly higher in overweight/obese women with PCOS and controls (36.78 [27.38–52.57] ng/mL and 27.39 [21.46-34.57] ng/mL) than in normal-weight womenwith PCOS and controls (12.47 [5.87–16.57] ng/mL and 8.61 [5.12–13.73] ng/mL; P<.001) (Fig. 1A). Serum adiponectin was similar inall subgroups, but serum L/A ratio was strikingly higher in over-weight/obese control women and women with PCOS vs. normal-weight controls (5.27 [2.66–13.58] and 7.73 [3.81–15.04] vs. 1.80[0.94–3.72]; P<.001) (Fig. 1B and C). Again, age adjustment didnot affect these results (P<.001 for leptin and L/A ratio andP¼.789 for adiponectin).
Subcutaneous leptin mRNA was significantly higher in over-weight/obese women with PCOS than in normal-weight controls(2.316 [1.987–2.580] vs. 1.687 [1.518–2.212] n fold change in rela-tion to calibrator sample; P¼.038) (Fig. 2A). Adiponectin geneexpression and subcutaneous L/A ratio were similar in all subgroups(P>.05) (Fig. 2B and C). In addition, positive correlations were foundbetween serum and mRNA levels for both leptin (r¼ 0.321, P¼.005)
Vol. 95, No. 6, May 2011

FIGURE 1
(A) Serum leptin, (B) adiponectin, and (C) L/A ratio for control women and women with PCOS, stratified according to BMI (in kg/m2). The
number of serum samples tested per group appears within parentheses. Values are expressed asmedian and interquartile range (25%–75%).*P< .001 in relation to overweight/obese control and PCOS groups by one-way ANOVA plus Tukey post hoc test.
Lecke. Role of leptin and adiponectin in PCOS. Fertil Steril 2011.
and adiponectin (r¼ 0.266,P¼.024). Serum leptin and L/A ratiowerepositively correlated with BMI and negatively with SHBG in controls.In women with PCOS, serum leptin and L/A ratio were correlatedwith BMI, waist circumference, percentage of body fat, fasting insu-lin, postprandial glucose and insulin levels, HOMA-IR, and FAI. OnlyL/A ratio was correlated with LH. Stepwise regression revealed thatpercentage of body fat contributed positively and significantly to se-rum L/A ratio in women with PCOS, independently of BMI or FAI(Table 2).
DISCUSSIONIn this study, leptin gene expression and levels were higher in obesewomen with PCOS than in normal-weight controls, but no differenceswere observed regarding adiponectin. Subcutaneous adipose tissue
FIGURE 2
(A) Leptin, (B) adiponectin, and (C) L/A ratio subcutaneous gene expressBMI (in kg/m2). Messenger RNA was expressed as n fold change differe
biopsies analyzed per group appears within parentheses. Values are ex
relation to overweight/obese PCOS group by one-way ANOVA plus Tuk
Lecke. Role of leptin and adiponectin in PCOS. Fertil Steril 2011.
Fertility and Sterility�
production of adiponectin seems to be the main determinant of serumadiponectin concentrations. Our data agree with previous reports con-cerning non-PCOS populations (20, 21, 25) but differ from oneprevious work reporting lower leptin and adiponectin geneexpression in subcutaneous fat in women with PCOS vs. weight-matched controls (13). Ethnic variation could explain this difference,because that study focused onAmerican patients andMexican controls.
Leptin gene expression in subcutaneous adipose tissuewas higherin our overweight/obese patients with PCOS as compared withnormal-weight controls, but not compared with normal-weightwomen with PCOS and overweight/obese controls. Others haveshown that leptin mRNA expression in subcutaneous fat is signifi-cantly elevated in the presence of obesity (20, 22, 23).Additionally, there is evidence that subcutaneous fat leptin may be
ion for control women andwomenwith PCOS, stratified according tonces from the calibrator sample (DDCT method). The number of
pressed as median and interquartile range (25%–75%). *P¼ .038 in
ey post hoc test.
2047
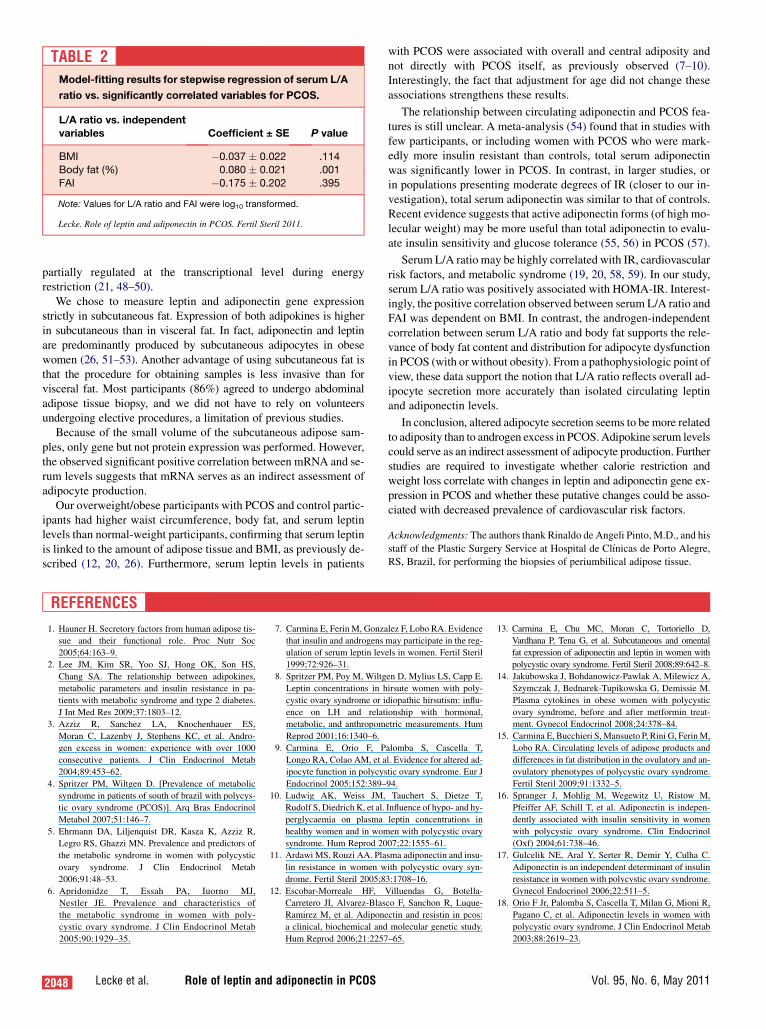
TABLE 2Model-fitting results for stepwise regression of serum L/A
ratio vs. significantly correlated variables for PCOS.
L/A ratio vs. independentvariables Coefficient ± SE P value
BMI �0.037 � 0.022 .114
Body fat (%) 0.080 � 0.021 .001
FAI �0.175 � 0.202 .395
Note: Values for L/A ratio and FAI were log10 transformed.
Lecke. Role of leptin and adiponectin in PCOS. Fertil Steril 2011.
partially regulated at the transcriptional level during energyrestriction (21, 48–50).
We chose to measure leptin and adiponectin gene expressionstrictly in subcutaneous fat. Expression of both adipokines is higherin subcutaneous than in visceral fat. In fact, adiponectin and leptinare predominantly produced by subcutaneous adipocytes in obesewomen (26, 51–53). Another advantage of using subcutaneous fat isthat the procedure for obtaining samples is less invasive than forvisceral fat. Most participants (86%) agreed to undergo abdominaladipose tissue biopsy, and we did not have to rely on volunteersundergoing elective procedures, a limitation of previous studies.
Because of the small volume of the subcutaneous adipose sam-ples, only gene but not protein expression was performed. However,the observed significant positive correlation between mRNA and se-rum levels suggests that mRNA serves as an indirect assessment ofadipocyte production.
Our overweight/obese participants with PCOS and control partic-ipants had higher waist circumference, body fat, and serum leptinlevels than normal-weight participants, confirming that serum leptinis linked to the amount of adipose tissue and BMI, as previously de-scribed (12, 20, 26). Furthermore, serum leptin levels in patients
2048 Lecke et al. Role of leptin and adiponectin in PCOS
with PCOS were associated with overall and central adiposity andnot directly with PCOS itself, as previously observed (7–10).Interestingly, the fact that adjustment for age did not change theseassociations strengthens these results.
The relationship between circulating adiponectin and PCOS fea-tures is still unclear. A meta-analysis (54) found that in studies withfew participants, or including women with PCOS who were mark-edly more insulin resistant than controls, total serum adiponectinwas significantly lower in PCOS. In contrast, in larger studies, orin populations presenting moderate degrees of IR (closer to our in-vestigation), total serum adiponectin was similar to that of controls.Recent evidence suggests that active adiponectin forms (of high mo-lecular weight) may be more useful than total adiponectin to evalu-ate insulin sensitivity and glucose tolerance (55, 56) in PCOS (57).
Serum L/A ratio may be highly correlated with IR, cardiovascularrisk factors, and metabolic syndrome (19, 20, 58, 59). In our study,serum L/A ratio was positively associated with HOMA-IR. Interest-ingly, the positive correlation observed between serum L/A ratio andFAI was dependent on BMI. In contrast, the androgen-independentcorrelation between serum L/A ratio and body fat supports the rele-vance of body fat content and distribution for adipocyte dysfunctionin PCOS (with or without obesity). From a pathophysiologic point ofview, these data support the notion that L/A ratio reflects overall ad-ipocyte secretion more accurately than isolated circulating leptinand adiponectin levels.
In conclusion, altered adipocyte secretion seems to be more relatedto adiposity than to androgen excess in PCOS.Adipokine serum levelscould serve as an indirect assessment of adipocyte production. Furtherstudies are required to investigate whether calorie restriction andweight loss correlate with changes in leptin and adiponectin gene ex-pression in PCOS and whether these putative changes could be asso-ciated with decreased prevalence of cardiovascular risk factors.
Acknowledgments: The authors thank Rinaldo de Angeli Pinto, M.D., and his
staff of the Plastic Surgery Service at Hospital de Cl�ınicas de Porto Alegre,
RS, Brazil, for performing the biopsies of periumbilical adipose tissue.
REFERENCES
1. Hauner H. Secretory factors from human adipose tis-
sue and their functional role. Proc Nutr Soc
2005;64:163–9.
2. Lee JM, Kim SR, Yoo SJ, Hong OK, Son HS,
Chang SA. The relationship between adipokines,
metabolic parameters and insulin resistance in pa-
tients with metabolic syndrome and type 2 diabetes.
J Int Med Res 2009;37:1803–12.
3. Azziz R, Sanchez LA, Knochenhauer ES,
Moran C, Lazenby J, Stephens KC, et al. Andro-
gen excess in women: experience with over 1000
consecutive patients. J Clin Endocrinol Metab
2004;89:453–62.
4. Spritzer PM, Wiltgen D. [Prevalence of metabolic
syndrome in patients of south of brazil with polycys-
tic ovary syndrome (PCOS)]. Arq Bras Endocrinol
Metabol 2007;51:146–7.
5. Ehrmann DA, Liljenquist DR, Kasza K, Azziz R,
Legro RS, Ghazzi MN. Prevalence and predictors of
the metabolic syndrome in women with polycystic
ovary syndrome. J Clin Endocrinol Metab
2006;91:48–53.
6. Apridonidze T, Essah PA, Iuorno MJ,
Nestler JE. Prevalence and characteristics of
the metabolic syndrome in women with poly-
cystic ovary syndrome. J Clin Endocrinol Metab
2005;90:1929–35.
7. Carmina E, Ferin M, Gonzalez F, Lobo RA. Evidence
that insulin and androgens may participate in the reg-
ulation of serum leptin levels in women. Fertil Steril
1999;72:926–31.
8. Spritzer PM, Poy M, Wiltgen D, Mylius LS, Capp E.
Leptin concentrations in hirsute women with poly-
cystic ovary syndrome or idiopathic hirsutism: influ-
ence on LH and relationship with hormonal,
metabolic, and anthropometric measurements. Hum
Reprod 2001;16:1340–6.
9. Carmina E, Orio F, Palomba S, Cascella T,
Longo RA, Colao AM, et al. Evidence for altered ad-
ipocyte function in polycystic ovary syndrome. Eur J
Endocrinol 2005;152:389–94.
10. Ludwig AK, Weiss JM, Tauchert S, Dietze T,
Rudolf S, Diedrich K, et al. Influence of hypo- and hy-
perglycaemia on plasma leptin concentrations in
healthy women and in women with polycystic ovary
syndrome. Hum Reprod 2007;22:1555–61.
11. Ardawi MS, Rouzi AA. Plasma adiponectin and insu-
lin resistance in women with polycystic ovary syn-
drome. Fertil Steril 2005;83:1708–16.
12. Escobar-Morreale HF, Villuendas G, Botella-
Carretero JI, Alvarez-Blasco F, Sanchon R, Luque-
Ramirez M, et al. Adiponectin and resistin in pcos:
a clinical, biochemical and molecular genetic study.
Hum Reprod 2006;21:2257–65.
13. Carmina E, Chu MC, Moran C, Tortoriello D,
Vardhana P, Tena G, et al. Subcutaneous and omental
fat expression of adiponectin and leptin in women with
polycystic ovary syndrome. Fertil Steril 2008;89:642–8.
14. Jakubowska J, Bohdanowicz-Pawlak A, Milewicz A,
Szymczak J, Bednarek-Tupikowska G, Demissie M.
Plasma cytokines in obese women with polycystic
ovary syndrome, before and after metformin treat-
ment. Gynecol Endocrinol 2008;24:378–84.
15. Carmina E, Bucchieri S,Mansueto P, Rini G, FerinM,
Lobo RA. Circulating levels of adipose products and
differences in fat distribution in the ovulatory and an-
ovulatory phenotypes of polycystic ovary syndrome.
Fertil Steril 2009;91:1332–5.
16. Spranger J, Mohlig M, Wegewitz U, Ristow M,
Pfeiffer AF, Schill T, et al. Adiponectin is indepen-
dently associated with insulin sensitivity in women
with polycystic ovary syndrome. Clin Endocrinol
(Oxf) 2004;61:738–46.
17. Gulcelik NE, Aral Y, Serter R, Demir Y, Culha C.
Adiponectin is an independent determinant of insulin
resistance in women with polycystic ovary syndrome.
Gynecol Endocrinol 2006;22:511–5.
18. Orio F Jr, Palomba S, Cascella T, Milan G, Mioni R,
Pagano C, et al. Adiponectin levels in women with
polycystic ovary syndrome. J Clin Endocrinol Metab
2003;88:2619–23.
Vol. 95, No. 6, May 2011
19. Xita N, Papassotiriou I, Georgiou I, Vounatsou M,
Margeli A, Tsatsoulis A. The adiponectin-to-leptin
ratio in women with polycystic ovary syndrome: rela-
tion to insulin resistance and proinflammatory
markers. Metabolism 2007;56:766–71.
20. Vardhana PA, Dicken C, Tortoriello DV, Chu M,
Carmina E, Lobo RA. Increasing adiposity in normal
ovulatory women affects adipocytokine expression in
subcutaneous and visceral abdominal fat. Int J Gynae-
col Obstet 2009;104:121–4.
21. Knerr I, Herzog D, Rauh M, Rascher W, Horbach T.
Leptin and ghrelin expression in adipose tissues and
serum levels in gastric banding patients. Eur J Clin In-
vest 2006;36:389–94.
22. Skopkova M, Penesova A, Sell H, Radikova Z,
VlcekM, Imrich R, et al. Protein array reveals differen-
tially expressed proteins in subcutaneous adipose tissue
in obesity. Obesity (Silver Spring) 2007;15:2396–406.
23. Kouidhi S, Jarboui S, Clerget Froidevaux MS,
Abid H, Demeneix B, Zaouche A, et al. Relationship
between subcutaneous adipose tissue expression of
leptin and obesity in tunisian patients. Tunis Med
2010;88:569–72.
24. Kern PA, Di Gregorio GB, Lu T, Rassouli N,
Ranganathan G. Adiponectin expression from human
adipose tissue: relation to obesity, insulin resistance,
and tumor necrosis factor-alpha expression. Diabetes
2003;52:1779–85.
25. Garaulet M, Viguerie N, Porubsky S, Klimcakova E,
Clement K, Langin D, et al. Adiponectin gene expres-
sion and plasma values in obese women during very-
low-calorie diet. Relationship with cardiovascular
risk factors and insulin resistance. J Clin Endocrinol
Metab 2004;89:756–60.
26. You T, Yang R, Lyles MF, Gong D, Nicklas BJ. Ab-
dominal adipose tissue cytokine gene expression: re-
lationship to obesity and metabolic risk factors. Am J
Physiol Endocrinol Metab 2005;288:E741–7.
27. Broch M, Auguet MT, Ramirez R, Olona M,
Aguilar C, Megia A, et al. Parallel downregulation
of retinol-binding protein-4 and adiponectin expres-
sion in subcutaneous adipose tissue of non-morbidly
obese subjects. Eur J Endocrinol 2009;161:87–94.
28. Koistinen HA, Forsgren M, Wallberg-Henriksson H,
Zierath JR. Insulin action on expression of novel ad-
ipose genes in healthy and type 2 diabetic subjects.
Obes Res 2004;12:25–31.
29. Revised 2003 consensus on diagnostic criteria and
long-term health risks related to polycystic ovary
syndrome. Fertil Steril 2004;81:19–25.
30. Toscani M, Migliavacca R, Sisson de Castro JA,
Spritzer PM. Estimation of truncal adiposity using
waist circumference or the sum of trunk skinfolds:
a pilot study for insulin resistance screening in hirsute
patients with or without polycystic ovary syndrome.
Metabolism 2007;56:992–7.
31. Wiltgen D, Benedetto IG, Mastella LS, Spritzer PM.
Lipid accumulation product index: a reliable marker
of cardiovascular risk in polycystic ovary syndrome.
Hum Reprod 2009;24:1726–31.
32. Ferriman D, Gallwey JD. Clinical assessment of body
hair growth in women. J Clin Endocrinol Metab
1961;21:1440–7.
Fertility and Sterility�
33. Third report of the National Cholesterol Education
Program (NCEP) Expert Panel on Detection, Evalua-
tion, and Treatment of High Blood Cholesterol in
Adults (Adult Treatment Panel III) final report. Circu-
lation 2002;106:3143–421.
34. Donato GB, Fuchs SC, Oppermann K, Bastos C,
Spritzer PM. Association between menopause status
and central adiposity measured at different cutoffs
of waist circumference and waist-to-hip ratio. Meno-
pause 2006;13:280–5.
35. Physical status: the use and interpretation of anthro-
pometry. Report of aWHO Expert Committee. World
Health Organ Tech Rep Ser 1995;854:1–452.
36. Faulkner JA. Physiology of swimming and diving. In:
Falls H, editor. Exercise physiology. Baltimore: Aca-
demic Press; 1968. p. 415–45.
37. Harrison GG, Buskirk ER, Lindsay Carter JE,
Johnston FE, Lohman TG, Pollock ML, et al. Skin-
fold thicknesses and measurement technique. In:
Lohman TG, Roche AF, Artorell R, editors. Anthro-
pometric standardization reference manual. Cham-
paign, IL: Human Kinetics; 1988. p. 55–70.
38. Wiltgen D, Spritzer PM. Variation in metabolic and
cardiovascular risk in women with different polycys-
tic ovary syndrome phenotypes. Fertil Steril
2010;94:2493–6.
39. Matthews DR, Hosker JP, Rudenski AS, Naylor BA,
Treacher DF, Turner RC. Homeostasis model assess-
ment: insulin resistance and beta-cell function from
fasting plasma glucose and insulin concentrations in
man. Diabetologia 1985;28:412–9.
40. FriedewaldWT, Levy RI, FredricksonDS. Estimation
of the concentration of low-density lipoprotein cho-
lesterol in plasma, without use of the preparative ul-
tracentrifuge. Clin Chem 1972;18:499–502.
41. Morsch DM, Carneiro MM, Lecke SB, Araujo FC,
Camargos AF, Reis FM, et al. C-fos gene and protein
expression in pelvic endometriosis: a local marker of
estrogen action. J Mol Histol 2009;40:53–8.
42. Oliveira IO, Lhullier C, Brum IS, Spritzer PM. Gene
expression of type 2 17 beta hydroxysteroid dehydro-
genase in scalp hairs of hirsute women. Steroids
2003;68:641–9.
43. Higuchi R, Dollinger G, Walsh PS, Griffith R. Simul-
taneous amplification and detection of specific DNA
sequences. Biotechnology (N Y) 1992;10:413–7.
44. Higuchi R, Fockler C, Dollinger G,Watson R. Kinetic
pcr analysis: real-time monitoring of DNA amplifica-
tion reactions. Biotechnology (N Y) 1993;11:
1026–30.
45. Zipper H, Brunner H, Bernhagen J, Vitzthum F. Inves-
tigations on DNA intercalation and surface binding
by SYBR Green I, its structure determination and
methodological implications. Nucleic Acids Res
2004;32:e103.
46. Applied Biosystems. Relative quantitation of gene
expression experimental design and analysis: relative
standard curve method and comparative ct method
(ddct). Guide to performing relative quantitation of
gene expression using real-time quantitative PCR
(Part Number 4371095 Rev A). Foster City, CA: Ap-
plied Byosystems; 2004:34–49.
47. Livak KJ, Schmittgen TD. Analysis of relative gene
expression data using real-time quantitative pcr and
the 2(-delta delta c(t)) method. Methods
2001;25:402–8.
48. Zamboni M, Di Francesco V, Garbin U, Fratta
Pasini A, Mazzali G, Stranieri C, et al. Adiponectin
gene expression and adipocyte NF-kappaB transcrip-
tional activity in elderly overweight and obese
women: inter-relationships with fat distribution, hs-
CRP, leptin and insulin resistance. Int J Obes
(Lond) 2007;31:1104–9.
49. Viguerie N, Vidal H, Arner P, Holst C, Verdich C,
Avizou S, et al. Adipose tissue gene expression in
obese subjects during low-fat and high-fat hypo-
caloric diets. Diabetologia 2005;48:123–31.
50. Arvidsson E, Viguerie N, Andersson I, Verdich C,
Langin D, Arner P. Effects of different hypocaloric di-
ets on protein secretion from adipose tissue of obese
women. Diabetes 2004;53:1966–71.
51. Zha JM, Di WJ, Zhu T, Xie Y, Yu J, Liu J, et al.
Comparison of gene transcription between subcuta-
neous and visceral adipose tissue in chinese adults.
Endocr J 2009;56:935–44.
52. Fain JN, Madan AK, Hiler ML, Cheema P,
Bahouth SW. Comparison of the release of adipokines
by adipose tissue, adipose tissue matrix, and adipo-
cytes from visceral and subcutaneous abdominal adi-
pose tissues of obese humans. Endocrinology
2004;145:2273–82.
53. Michalakis KG, Segars JH. The role of adiponectin in
reproduction: from polycystic ovary syndrome to as-
sisted reproduction. Fertil Steril 2010;94:1949–57.
54. Toulis KA, Goulis DG, Farmakiotis D,
Georgopoulos NA, Katsikis I, Tarlatzis BC, et al. Adi-
ponectin levels in women with polycystic ovary syn-
drome: a systematic review and a meta-analysis. Hum
Reprod Update 2009;15:297–307.
55. Wickham EP 3rd, Cheang KI, Clore JN,
Baillargeon JP, Nestler JE. Total and high-molecular
weight adiponectin in women with the polycystic
ovary syndrome. Metabolism 2011;60:366–72.
56. Hara K, Horikoshi M, Yamauchi T, Yago H,
Miyazaki O, Ebinuma H, et al. Measurement of
the high-molecular weight form of adiponectin in
plasma is useful for the prediction of insulin resis-
tance and metabolic syndrome. Diabetes Care
2006;29:1357–62.
57. O’Connor A, Phelan N, Tun TK, Boran G, Gibney J,
Roche HM. High-molecular-weight adiponectin is se-
lectively reduced in women with polycystic ovary
syndrome independent of body mass index and sever-
ity of insulin resistance. J Clin Endocrinol Metab
2010;95:1378–85.
58. Oda N, Imamura S, Fujita T, Uchida Y, Inagaki K,
Kakizawa H, et al. The ratio of leptin to adiponectin
can be used as an index of insulin resistance. Metab-
olism 2008;57:268–73.
59. Zhuo Q, Wang Z, Fu P, Piao J, Tian Y, Xu J, et al.
Comparison of adiponectin, leptin and leptin to adi-
ponectin ratio as diagnostic marker for metabolic syn-
drome in older adults of chinese major cities.
Diabetes Res Clin Pract 2009;84:27–33.
2049