Inhibition of hyaluronan synthase-3 decreases subcutaneous colon cancer growth in mice
Upload
independentCategory
view
0download
0
Journal of Pharmacokinetics and Biopharmaceutics, VoL 17, No. 1, 1989
Modeling Absorption Kinetics of Subcutaneous Injected Soluble Insulin
Erik Moseki lde , ~'3 Klaus Skovbo Jensen, ! Christian Binder, 2 Stig Pramming, 2 and Birger Thorsteinsson 2
Received July 16, 1987--Final May 16, 1988
Absorption o f subcutaneously injected soluble insulin deviates markedly from simple first-order kinetics and depends both on the volume and concentration of the injected solution. This paper presents a model of the absorption process in which insulin is presumed to be present in subcutis in a low molecular weight form, a high molecular weight form, and an immobile form where the molecules are bound to the tissue. The model describes how diffusion and absorption gradually reduce the insulin concentrations in the subcutaneous depot and thereby shift the balance between the three forms in accordance with usual laws o f chemical kinetics. By presuming that primarily low molecular weight insulin penetrates the capillary walls, the model can account for experimentally observed variations in the absorption rate over a wide range o f volumes and o f concentrations. The model is used to determine the effective diffusion constant D for insulin in subcutis, the absorption rate constant B for low molecular weight insulin, the equilibrium constant Q between high and low molecular weight insulin, the binding capacity C for insulin in the tissue, and the average life time T for insulin in its bound state. Typical values for a bolus injection in the thigh of fasting type I diabetic patients are D = 0.9• t0-4 cm2/min, B = 1.3 x l O-e/min, and Q = O. 13 (ml/IU) z. Binding o f insulin in the tissue is significant only at small concentrations. The binding capacity is o f the order of C = 0.05 IU/cm 3 with a typical average life time in the bound state of T = 80,0 rain. Combined with a simplified model for distribution and degradation o f insulin in the body, the absorption model is used to simulate variations in plasma free insulin concentrations with different delivery schedules, i.e., bolus injection and dosage by means of an infusion pump. The simulations show that a pump repetition frequency o f I -2 per hr is sufficient to secure an almost constant plasma insulin concentration.
KEY WORDS: insulin pharmacokinetics; subcutaneous absorption; dissolved insulin; simula- tion model; diffusion; polymerization; binding; infusion pump.
I N T R O D U C T I O N
The absorpt ion kinetics o f subcutaneously injected insulin has been widely studied (1-6). Both for regular and for intermediate acting insulin,
1Physics Laboratory III, The Technical University of Denmark, 2800 Lyngby, Denmark. 2Steno Memorial Hospital, 2860 Gentofte, Denmark. 3To whom correspondence should be addressed.
67 0090-466x/89/0200-0067506.00/0 �9 1989 Plenum P'ablishing Corporation

68 Mosekilde, Jensen, Binder, Pramming, and Thorsteinsson
considerable inter- and intrapatient variability is known to occur. Charac- teristic changes have thus been observed for subjects with lipodystrophy (6), ketoacidosis (7), and low body weight (6), and, particularly for adipose subjects, the absorption rate has been found to vary significantly from injection to injection (8). Exercise, local massage, hot water baths, smoking, etc., are also known to influence the rate of absorption (9-11).
Better understanding of the absorption process could provide the basis for significant improvements in the metabolic control of insulin requiring diabetic patients. However, in spite of considerable experimental work, the detailed mechanisms of the absorption process are still unknown. A testable hypothesis, in terms of a mathematical model, therefore seems appropriate. In particular, for soluble insulin, some of the most prominent features in the variation of the absorption rate remain unexplained: 1. For a typical bolus injection of 0.2 ml, 40 IU/ml, soluble insulin, the
absorption rate does not follow a simple monoexponential time course (3,10,12). Instead, the absorption is relatively slow in the beginning, and only after 3-4 hr does it reach its full rate.
2. The rate of absorption is observed to vary "inversely" with the concentra- tion of insulin in the injected solution (3,5,13,14). This means that, for instance, the same volume of 0.1 ml is absorbed considerably faster if injected as 4 IU/ml than if given as 40 IU/ml.
3. At very low concentrations and injection volumes, a tail is found to develop on the disappearance curve, indicating that a fraction of the injected insulin is slowly absorbed (3).
Figure 1 shows the results of a typical study of subcutaneous insulin absorption (12). Seven type I diabetic patients (age 16-50 years, diabetes duration 4-24 years), received subcutaneous (sc) injections of 0.1 IU/kg body weight of 40 IU/ml radiolabeled purified porcine insulin (Velosolin R, Nordisk Gentofte, Denmark), and the disappearance of radioactivity from the injection site was monitored over an 8-hr period by external counting. The patients remained fasting and resting in a supine position during the experiment. Blood samples were drawn hourly for determination of plasma free insulin concentrations and blood glucose levels. Further details about the experimental procedure may be found in refs. 2 and 12.
Subjects were selected at random from the clinical files of Steno Memorial Hospital. Inclusion criteria were vanishing endogenous insulin production, low insulin binding to antibodies, near-average body weight, absence of palpable lipodystrophy, and no diseases other than diabetes. One patient was found to have a considerably faster absorption than the rest. Another patient was found to have a delayed absorption in the experi- ment with porcine insulin (Fig. 1) and a near-average absorption in a parallel experiment with semisynthetic human insulin (12). This exemplifies the

Absorption Kinetics of Soluble Insulin 69
100
80
60
40
20
10
8
6
4
% RESIDUAL RADIOACTIVITY
7 IU ,1'.0 IU /m l PORCINE INSULIN
\ \
13'
\ x ,% , \ 6 7
\ x
I I I I , I 2 3 4 5 B 9 h
TIME AFTER BOLUS INJECTION
Fig. 1. Disappearance curves obtained by external counting on radiolabeled, sub- cutaneously injected soluble insulin in a double-blind crossover study of the absorp- tion of purified porcine and semisynthetic human insulin (details of the experimental procedure are given in refs. 3, 12, and 35). Seven type I diabetic patients received injections in the thigh of 0.1 IU/kg body weight of 40 IU/ml dissolved insulin (Velosulin R, Nordisk Gentofte). Note the reduced initial absorption rate.
inter- and intrapatient variability of the absorption process. The fully drawn curve in Fig. 1 represents the average absorption curve for the remaining five subjects. This curve clearly illustrates the delayed initial absorption rate.
The deviation from monoexponential absorption course has tentatively been ascribed to "self-depression," i.e., to the release of compounds in the subcutaneous tissue that reduce the absorption rate, presumably by decreas- ing the capillary membrane area (3,6,15). Such a release could be brought about by the injection trauma. The presence of capillary contracting agents seems not to have been demonstrated, however. To the contrary, it has been found by photoelectric plethysmography that insulin injection can cause pronounced increases in local blood flow (16). For normal subjects and for stable diabetics, the hyperemic condition was found to be sustained for at

70 Mosekilde, Jensen, Binder, Pramming, and Thorsteinsson
least 60 min after the injection, presumably leading to an enhancement of the absorption rate in this period. Although insulin-related changes in local blood flow may be significant controlling factors of subcutaneous insulin absorption, such changes are unlikely to explain the initial reduced absorp- tion rate. In a few experiments, a monoexponential absorption process appears to have been observed (13).
It has been suggested that a reason for the faster absorption of insulin with low concentration could be that the interaction surface between insulin and capillary blood would be greater (6). This explanation does not hold under closer examination, however, unless it is assumed that diffusion of insulin across the capillary membrane is a saturable process.
Unfortunately, only a single study has been published in which con- centration and volume have been independently varied over a sufficiently wide range to give a complete picture of the dependence on these variab!es (3). According to this study, the initial slow absorption phase becomes shorter with reduced concentration and volume of the injected dose. The slow phase practically disappears if, for a 40-IU/ml insulin solution, the injection volume is reduced to about 0.01 ml. Likewise, the period of reduced absorption almost vanishes if, for a 1-ml injection volume, the insulin concentration is reduced to about 4 IU/ml. It was proposed that the con- centration dependence could be due to self-depression, but no attempts were made to explain the volume effect.
To our knowledge, the tail phenomenon has not been reported by other investigators, presumably because similar minute concentrations and volumes have not been studied.
It is the purpose of this paper to develop a pharmacokinetic model that can explain all the above phenomena in terms of as simple mechanisms and as few parameters as possible. Our model presumes that insulin is present in the subcutaneous depot in three forms: (i) a low molecular weight form, (ii) a higher molecular weight form, and (iii) an immobile form in which the molecules are bound in the tissue or precipitated as polymeric insulin. The low molecular weight form is tentatively identified as dimeric insulin, and the higher molecular weight form as hexameric insulin. It is further presumed that primarily dimeric insulin penetrates the capillary membrane.
At high concentrations, a significant fraction of insulin in the depot is in hexameric form, and the absorption rate is correspondingly low. As absorption and diffusion gradually reduce the insulin concentration, the balance is shifted from hexameric toward dimeric form, and the absorption rate increases. Finally, at very low concentrations, almost all free insulin in the depot has been absorbed, and the terminal part of the process is governed by the liberation of bound insulin.

Absorption Kinetics of Soluble Insulin 71
It appears to us that this model represents a set of plausible hypotheses. It is reasonable to assume, that the absorption of soluble insulin is governed by the physicochemical properties of the subcutaneous tissue, by the chemical properties of the insulin molecule, by the capillary pore size, and by the capillary membrane area. Combination of such considerations with absorption data has previously led to the conclusion that insulin is absorbed in a form not greater than dimeric (17). It has also been suggested both that polymerization plays a role for the rate of insulin absorption (18), and that insulin can be locally bound in the tissue (19).
Previous models developed to describe insulin absorption kinetics have usually adjusted relatively simple mathematical expressions to a set of plasma insulin appearance data without attempting to give a more detailed explanation of the involved mechanisms (20,21,22,23). Such models can seldom be used to predict absorption rates at different concentrations or injection volumes. In addition, appearance data are less sensitive to details of the absorption process than data obtained by external counting on radiolabeled insulin. It has been suggested, though, that several biotransfor- reed insulin products could be involved (20), and a split-pool model has been proposed to account for the initial delay (23).
ABSORPTION MODEL
The present absorption model is formulated in terms of well-established physical and pharmacokinetic principles, i.e., diffusion, equilibration between different multimeric forms of soluble insulin, and either reversible binding of insulin molecules in the tissue or precipitation in situ of polymer- ized insulin. In more detail, our model is based upon the following assump- tions: 1. After injection, soluble insulin is present in the subcutaneous tissue in
several multimeric forms, primarily hexameric and dimeric. Calcula- tions of restricted capillary pore area and diffusion radii for insulin have previously indicated that absorption takes place in a molecular form no greater than dimer (17). On the other hand, the hexameric form is known to dominate in solutions of normal therapeutic strength.
2. The depot is cleared by absorption of dimeric insulin molecules into the vascular bed, and the depot is widened through diffusion of insulin molecules in the tissue.
3. Local degradation of insulin in the subcutaneous tissue is relatively insignificant (3,24). If the rate of degradation can be established from independent measurements, this phenomenon can easily be included in the model.

72 Mosekilde, Jensen, Binder, Pramming, and Thorsteinsson
4. Small amounts of insulin can either be reversibly bound in the tissue or become precipitated as insoluble polymerized insulin. In both cases, absorption will be inhibited.
We thus think of soluble insulin as being on either hexameric or dimeric form, with an equilibrium controlled by the mass balance
C . = QC~ (1)
Here CH and CD denote the concentrations of hexameric and dimeric insulin, respectively, and Q is the chemical equilibrium constant. A reduc- tion of the total insulin concentration will shift the balance towards the low molecular weight form. Provided that only dimeric molecules can penetrate the capillary membrane, this explains at least qualitatively both the existence of an initial slow absorption phase, and the variation of the absorption rate with insulin concentration. Spreading of the injected depot by diffusion also reduces the insulin concentration. This process is important if the molecules can travel over distances comparable to the characteristic extension of the depot before being absorbed, i.e., for small injection volumes. Combined with diffusive spreading, a shift in the chemical balance between two multimeric forms therefore also offers an explanation to the volume effect: With small injection volumes, diffusion reduces the insulin concentration and thereby shifts the balance towards dimeric insulin rapidly enough to shorten or completely remove the initial slow absorption phase.
According to the experimental results in Fig. 2, the initial phase of slow absorption disappears when the injection volume is reduced below 0.1 ml. This suggests that diffusion expands a depot of this size by something of the order of 0.1 ml during the first 15-30 min. A simple estimate shows that this will be the case if the diffusion constant is of the order of D = 0 . 5 - 1 . 0 • 10-4cm2/min. For comparison, the diffusion constant of insulin in water at 37~ has been measured to be DH2O = 0.9 X 10 -4 cm2/min (25). Our simple estimate thus shows that it is possible to establish a semiquantitative explanation of the volume effect in terms of diffusive depot spreading.
During the monoexponential part of the absorption process (4-9 hr on Fig. 1), the depot concentration is assumed to be sufficiently small for a major part of the insulin to be on dimeric form. The absorption constant B for dimeric insulin can therefore approximately be estimated from the terminal slope of the absorption curve. From Fig. 1 we have B ~ 0.9 • 10-2/rain in average for the five patients. The absorption constant is a measure of the restricted pore area per unit tissue volume (17) and therefore varies with the subcutaneous blood flow. The interpatient variation of B in the material depicted in Fig. 1 is from 0.5 x 10⁻²/min to 1.3 • 10-2/rain. The above estimates of B are somewhat too small since the

Absorption Kinetics of Soluble Insulin 7 3
,.,, 100- ~ 401u/ml ~ 40 IU/ml ~ 40|u/ml "" 60 1 . . lml
~ 40 ~ �9
.E 2 o
.E ,- 1 0 0 , , , , , , , , , , , ,
'~ 8 0 : % ' 4 IU/ml ~ ' 4 IU/ml ~ _ 41U/ml
. E 401
. E 2 0 ,
" 6 c 1 0 0 , , , , , , , , , , ,
.0 80 ~ G 0.41u/re' ~ 0.4 lu/ml ~ 0.4 Iu/ml
�9 - 40
2O
10 o ~ ~ ~ ~o ~ ~ ~. ~o ~ ;~ ~ ~
T i m e ( h )
Fig. 2. Absorption curves for soluble insulin injected in the thigh for a range of different volumes and concentrations. For practical reasons no more than three determinations of absorption could be carried out simultaneously in the individual patient. The total of 18 absorption curves was therefore obtained with 6 different patients. At high injected doses, a delayed initial absorption phase is observed, while a tail is found to develop on the absorption curves for low injected doses. Redrawn by perm'ssion from ref. 3.
apparen t absorpt ion rate is inf luenced by the s imul taneous t rans format ion from hexameric to dimeric insulin.
In the t rans format ion between the two mul t imer ic forms, dimeric insu l in
is p roduced at a net rate of
dCD - P ( C H - - QC 3) ( 2 )
dt
with P being an appropr ia te rate constant . There is no ind ica t ion that the
t ransformat ion rate should be a l imit ing factor. We therefore assume the hexamer ic -d imer ic ba lance to be near equi l ib r ium dur ing the entire absorp-
t ion process. This requires a large equi l ibra t ion rate constant P compared
to the absorp t ion cons tant B. We have chosen P = 0.5/rain. Even relatively
large changes in P do not inf luence the s imula t ion results significantly.

74 Mosekilde, Jensen, Binder, Pramming, and Thorsteinsson
In the quasi-stationary equilibrium between dimeric and hexameric insulin established immediately after the injection we have
C.o 1 - d O - C 3 ~ - d3C2to (3)
where Cto is the total initial insulin concentration and d is the initial fraction of dimeric insulin. From the experimental results in Fig. 1, we can obtain a preliminary estimate of d as the ratio between the initial and the terminal slopes of the absorption curve. This gives d = 0.2 or Q - 0.06 (ml/IU) 2.
The tail phenomenon in Fig. 2 is ascribed to temporary binding of insulin in the subcutaneous tissue. Since tails are observed only when very small doses are used, we must assume that the binding capacity per unit tissue volume C is small compared to the concentration of normal therapeutic solutions. Capture of insulin molecules by cell surfaces or by proteins in the intercellular space is presumably a relatively rapid process. Once bound, the molecules are released at a rate determined by the average lifetime in the bound states T.
Since insulin binding is significant only at low concentrations we shall assume that the capture rate is controlled by the concentration of dimeric insulin. The net binding rate can thus be written as
d A B = S C D ( C . V - AB) - A B / T (4)
dt
where AB is the amount of bound insulin, S is the capture rate constant, and V the effective depot volume. Provided that S is large (fast capture), we can estimate C by extrapolating the tail of the absorption curve back to the injection time. This typically gives C = 0.08 IU/cm 3. The reciprocal average lifetime 1 / T is given by the slope of the tail. From the experimental results in Fig. 2, we deduce T ~-800 min.
Figure 3 gives an overview of the model for subcutaneous absorption of soluble insulin. Listed are also the corresponding set of three coupled partial differential equations. In these equations, terms involving the Lap- l ac ian operator V2=02/OX2+O2/Oy2+O2/OZ2 describe diffusion of free insulin, terms involving the rate constant P describe transformations between hexameric and dimeric insulin, terms involving the rate constant S describe capture of insulin in the tissue, and terms involving the time constant T describe release of bound insulin. To reduce the number of parameters, the diffusion constants for hexameric and dimeric insulin have been taken to be the same. This is permissible in view of the assumed high equilibration rate Q which secures that the two multimeric forms locally are in equilibrium.
The pharmacokinetic equations are solved numerically by dividing the subcutaneous layer into a number of rings, centered around the injection

Absorption Kinetics of Soluble Insulin 75
SUBCUTANEOUS DEPOT
INJECTION
_l 7
HEXAMERIC I INSULIN
]~ TRANSFORMATION I PLASMA SPACE
l~~_~i PLASMA DIMERIC INSULIN
I
I BINDING I
I ....... I
I I BOUND I INSULIN [ I I I
Fig. 3. Overview of the model of subcutaneous absorption of soluble insulin. Three different forms of insulin are assumed to be present in subcutis , with the amount of dimeric insulin controlling the absorption rate. The pharmacokinetic equations corresponding to the model are
O C H = p ( O f 3 _ CH ) -t- D V 2 C H Ot
0 C D 3 2 CB = - P ( Q C D - C~t) + D V C D - B C D - S C D( C - CB) + - -
Ot T
O C t = SCt~( C - CB) - C_~B
Ot T
site. In practice, 20 such rings are used. Their radii are adjusted such that the injected volume fills out the innermost 3-8 rings, while the outermost ring has an inner radius large enough to ensure that less than 5% of the injected insulin will reach this ring by diffusion during the experimental period. Injection of a particular dose is simulated by assigning appropriate initial values to the amounts of hexameric and dimeric insulin for each of the rings. The amount of bound insulin is taken to be zero at the beginning.

76 Mosekilde, Jensen, Binder, Pramming, and Thorsteinsson
In order to study the influence of the various unit processes separately, in the first simulations we have ignored binding of insulin by setting C = 0. Figure 4(a) displays computed absorption curves for 40 IU/ml dissolved insulin with different injection volumes. For absorption volumes greater than 0.3 ml, the absorption rate is practically volume independent. For smaller injected volumes, the initial phase of slow absorption becomes shorter with decreasing volume. Figure 4(b) shows similar curves computed
100
10 �84
% RESIDUAL INSULIN IN DEPOT
~ increasing injec!ion
0.01 ml ~
40 IU /ml I I I I I I I 1 2 3 4 5 6 7 8h
TIME AFTER BOLUS INJECTION
% RESIDUAL INSULIN IN DEPOT 100
IIU/mI~
0.3 ml injection 1 I I I I I I I 7
1 2 3 4 5 6 8h TIME AFTER BOLUS INJECTION
Fig. 4. Simulated absorption curves for various volumes and concentrations of the bolus injection: (a) absorption of 0.01 ml, 0.03 ml, 0.1 ml, and 0.3 ml, 40 [U/ml insulin solution; (b) absorption of 0.3 ml insulin solution of 1.0 IU/ml, 4.0 lU/ml, 10 IU/ml, and 40 IU/ml, respec- tively. The same parameter values are used in all simulations.
Absorption Kinetics of Soluble Insulin 77
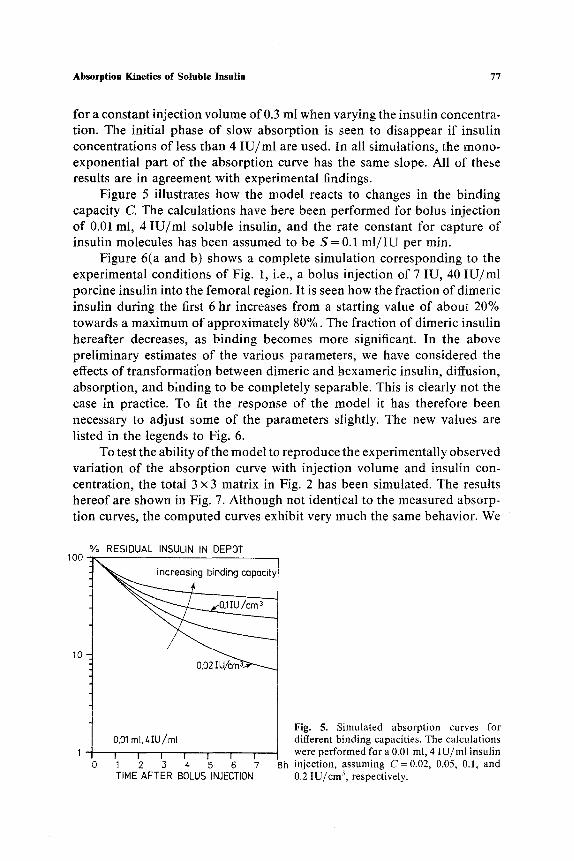
for a constant injection volume of 0.3 ml when varying the insulin concentra- tion. The initial phase of slow absorption is seen to disappear if insulin concentrations of less than 4 IU/ml are used. In all simulations, the mono- exponential part of the absorption curve has the same slope. All of these results are in agreement with experimental findings.
Figure 5 illustrates how the model reacts to changes in the binding capacity C. The calculations have here been performed for bolus injection of 0.01 ml, 4 IU/ml soluble insulin, and the rate constant for capture of insulin molecules has been assumed to be S = 0.1 ml / IU per min.
Figure 6(a and b) shows a complete simulation corresponding to the experimental conditions of Fig. 1, i.e., a bolus injection of 7 IU, 40 IU/ml porcine insulin into the femoral region. It is seen how the fraction of dimeric insulin during the first 6 hr increases from a starting value of about 20% towards a maximum of approximately 80%. The fraction of dimeric insulin hereafter decreases, as binding becomes more significant. In the above preliminary estimates of the various parameters, we have considered the effects of transformation between dimeric and hexameric insulin, diffusion, absorption, and binding to be completely separable. This is clearly not the case in practice. To fit the response of the model it has therefore been necessary to adjust some of the parameters slightly. The new values are listed in the legends to Fig. 6.
To test the ability of the model to reproduce the experimentally observed variation of the absorption curve with injection volume and insulin con- centration, the total 3 • 3 matrix in Fig. 2 has been simulated. The results hereof are shown in Fig. 7. Although not identical to the measured absorp- tion curves, the computed curves exhibit very much the same behavior. We
100
10.
% RESIDUAL INSULIN IN DEPOT
0.01 mI, Z, IU/m[
I I I I 1 I I 1 2 3 4 5 6 7 TIME AFTER BOLUS INJECTION
Fig. 5. Simulated absorption curves for different binding capacities. The calculations were performed for a 0.01 ml, 4 IU/ml insulin
8h injection, assuming C=0.02, 0.05, 0.1, and 0.2 IU/cm 3, respectively.

78 Mosekilde, Jensen, Binder, Pramming, and Thorsteinsson
% RESIDUAL INSULIN IN DEPOT I O0
0,175 mL Z,O IU/mt. 1 ! t I 1 1 t ' ' f " I
0 1 2 3 4 5 6 7 8 9h TIME AFTER BOLUS INJECTION
IU RESIDUAL INSULIN IN DEPOT 6 1,0
b
5
~ .hexameric .."'"" .... '"'. " 4 - " ~ ~ ' / ..""
. , " f r oc t i on of dimeric
2 . . ' ' " "
0 1 i i i i i l - r ' " i 0 1 2 ,3 4 5 6 7 8
TIME AFTER BOLUS INJECTION Fig. 6, Simulation of the absorption course following a 0,175 ml, 40 IU/ml insulin injection: (a) the disappearance curve (to be compared with the experimental results in Fig, 1); (b) residual amounts of hexameric (full curve) and dimeric insulin (broken curve). The amount of bound insulin is too small to be seen on the chosen scale, Also shown is the fraction of dimeric insulin (dotted curve), The calculations were performed with the following parameter values B = 1,3 x 10 .2 min, D = 0.9 x 10 -4 cm2/min, Q = 0,13 (ml / IU) 2, C = 0.05 IU / cm 3, and T = 800 rnin.
0.8
0.6 ~Z
LU :E
- 0 , 4 ta. o z
-0,2
D_ 0.0
9h

Absorption Kinetics of Soluble Insulin 79
100 8o
~- 60 0 Q_
' " 40
z_
20 Z
Z <
100 uJ 80 r r
z 60 . .J D ~0 ,J)
Z
o 20 Z 0
~o0 < 80 r r
EL 60
40
20
10
40IU/m[
I i I i
]ml
I ! I
I I I /
0 2 4 6 8 0 2
TIME (h)
40 IU/ml 0,01 m I
I I
I I I i
\ 0.4 IU/mt
I l f I
8 0 2 4 6 8
Fig. 7. Complete 3 • 3 latin square of simulated absorption curves for comparison with the experimental results in Fig. 2. All curves were computed with the same set of parameter values.
therefore conclude that the assumed mechanisms of transformation between dimeric and hexameric insulin, diffusion, binding, and absorption together explain the experimental results for a wide range of injection volumes and insulin concentrations. One should not give too much attention to the missing tail in Fig. 2H. With the limited number of patients investigated, interpatient variations in the binding capacity will of course be significant.
PLASMA INSULIN C O N C E N T R A T I O N
In order to describe the variation in plasma free insulin concentration upon a subcutaneous injection, we have connected a two-compartment distribution-degradation model to the above absorption model. The distri- but ion-degradat ion model is similar to those proposed by Eaton et al. (26) and by Kobayashi et al. (22). The two compartments represent a plasma space of about 2.8 L and an extravascular space with a typical distribution

80 Mosekilde, Jensen, Binder, Pramming, and Thorsteinsson
volume of 11 L. A diagram for the model is sketched in Fig. 8 which also gives the corresponding pharmacokinetic equations. In these equations, terms involving the time constant % represent hepatic and renal insulin removal, terms involving the time constant rE represent degradation in muscle and adipose tissue, and terms involving the transfer constant K represent insulin exchange between the two compartments. Only first-order processes are considered. Ap and Cp denote the amount and concentration of insulin in the plasma, respectively. Similarly, AE and CE denote the amount and concentration of insulin in the extravascular space.
Provided that the endogenous insulin production can be neglected, the supply of insulin to the plasma space equals the amount absorbed from the subcutaneous tissue. This is obtained as an integral of the local absorption rate over the depot volume. Exchange between the two compartments is assumed to be controlled by passive diffusion driven by a difference in concentration. The effective transfer constant K is a measure of the total capillary membrane area and the diffusion constant for insulin across this membrane. Clinical observations indicate the existence of a time delay of about 10 min from when an iv infusion is performed until a significant insulin concentration has built up in the extravascular space. This corre- sponds to a transfer constant of K ---- 1.0 L/min. In order of magnitude, it also agrees with the rate constant of about 0.05/min found by Kobayashi et al. (22).
PLASMA SPACE EXTRAVASCULAR SPACE
ABSORPTION EXCHANGE
0 X 'N OL'N' 1_ r PLASMA ~ ' ~ . .
/ - - - -_X
[~ ./I HEPATIC AND ~.I RENAL
DEGRADATION
<)
I INSULIN IN
INTERCELLULAR Y LIQUID
MUSCLE AND ADIPOSE TISSUE DEGRADATION
Fig. 8. Overview of the two compartment distribution-degradation model. The corre- sponding differential equations are
dAp = Id BCDdV- K ( C e - CE) -
Ap
dt epot Tp
dAE AE = K ( C p - CE) - - -
dt rE

Absorption Kinetics of Soluble Insulin 81
Several independent processes for insulin removal are known to occur (26,27). The liver typically removes 50% of the insulin which passes this organ. With a liver plasma flow of 850 ml/min, and a total plasma volume of 2.8 L this corresponds to a time constant for hepatic insulin degradation of the order of rH = 7 min. Renal insulin removal has been examined by arteriovenous sampling (28). With a renal plasma flow of 650 ml/min and an arteriovenous insulin extraction ratio of 0.29, the time constant for renal insulin removal is ~'T~ 15 rain. The combined time constant for hepatic and renal removal can thus be estimated to be % ~ 5 min. Similar arteriovenous sampling studies across muscle and adipose tissue have reported the frac- tional removal of insulin to be of the order of 0.01/min. The time constant for insulin degradation in the extravascular space is thus rE ------- 100 min.
Figure 9 shows computed results (full curve) for the variation in plasma free insulin concentration following a 7 IU, 40 IU/ml sc bolus injection. We have here assumed rp=3.5 min, ~-E=80min, and K =3 L/min. K primarily controls the initial rate of increase of the plasma insulin concentra- tion. For K < 1.0 L/min, this rate is relatively high, because distribution to
nmol/I PLASMA INSULIN CONCENTRATION mU/I .20 j 30
/ x .15 / / A
1 / " \ \X.
�9 1 o - ~ A\\\
�9 o o / , , , , , , 7 - - o 0 1 2 3 4 5 6 7 8h
TIME AFTER BOLUS INJECTION Fig. 9. Simulated appearance curve following a subcutaneous injection of 7 IU, 40 IU/ml soluble insulin. The curve was calcu- lated with K =3.0 L/min, ~'p=3.5 min, and rE=80 min. Also shown are 4 experimental determinations of the variation in plasma free insulin. Details about the experimental procedure are given in ref. 12.

82 Mosekilde, Jensen, Binder, Pramming, and Thorsteinsson
the intercellular space is delayed. Zp controls the maximum of the curve for a given injection dose, while ZE is relatively insignificant as long as rE >> Zp.
For comparison, Fig. 9 also shows typical experimental results for the variation in plasma free insulin concentration following a 7 ml, 40 IU/ml sc insulin injection. To clear the subcutaneous tissue for remaining inter- mediately acting insulin, each patient received only soluble insulin for the last 44 hr before the study began. To secure comparable starting levels of blood glucose, overnight iv infusions were given for the last 10 hr, aiming at a fasting blood glucose level of 10 mmol/L. The iv infusions were stopped 10 min before the beginning of the experiment, at which time the first blood samples were taken. To have comparable initial conditions in the simulation, we have specified appropriate starting values for the amounts of insulin in the two compartments. The plasma insulin concentration thus starts at 8 mU/L.
The experimental curves typically show maxima of 0.05-0.20 nmol /L about 2 hr after the bolus injection. The computed insulin appearance curve reproduces the experimental results in a satisfactory manner. This supports the assumptions of the absorption model. It should be noted, though, that a single compartment degradation model with a distribution volume of 14 L and an effective time constant for insulin degradation of about 3.0 rain would have reproduced the experimental appearance curves with similar accuracy. This is a consequence of the relatively fast equilibration between the two compartments. A one-compartment model is not useful, however, if insulin is administered intravenously. It should also be noticed that the appearance curve is much less sensitive to the details of the absorption process than is the directly measured absorption curve. This is due to the fact that the appearance curve is strongly influenced by the size of the distribution volume, by the transfer rate between different parts of this volume, and by the rate of insulin removal.
CONTINUOUS SUBCUTANEOUS INFUSION
In formulating the equations of and determining the parameter values for the above absorption-distribution-degradation model, we have con- sidered "single shot" injections only. By virtue of the comprehensive nature of the model, i.e., the fact that it builds upon a combination of well- understood unit processes with parameters that have direct physical interpre- tation, the model can also be used to compute the variation in plasma free insulin concentration when insulin is continuously infused by means of portable pump (15,23,29,30,31,32,33). By mimicking the physiological insulin secretion pattern more closely than it can be done with bolus injections, the objective of the pump technique is to maintain a near normal

Absorption Kinetics of Soluble Insulin 83
blood glucose level. This again is based on the assumption that normogly- cemia can help prevent the development of late complications to diabetes melitus (30,34).
In practice, the insulin is given through a cannula taped to the skin in the abdominal region where the density of capillaries and hence the absorp- tion constant are somewhat higher than for the thigh (2). A tube connects the cannula to the pump that is usually driven in pulse model, i.e., small volumes of soluble insulin are delivered at a given repetition frequency.
By supplying a series of infusion pulses to the innermost rings of the absorption model, periodic injections can be handled in the same way as single shots. Figure 10 displays simulation results for the variation in plasma free insulin at various pump repetition frequencies. In all runs we have used a mean infusion rate of 20 IU per 24 hr, corresponding to about half of the body's insulin requirement. The second half is supposed to be administered as major doses before each meal. Since most commercial pumps use 100 IU/ml solutions, we have chosen this concentration of infused soluble insulin. Furthermore, we have changed the absorption rate constant to B = 2.0 x 10⁻²/min to allow for the faster absorption from the abdominal region.
Finally, in Fig. 11, we show a frequency characteristic for the combined delivery-absorption-distribution-degradation system. The curve is based
gE v E
"6E
O O._ c
1 6 , 5 -
16.0
1 5 . 5
FREQ1
- - - FREQ2
. . . . FREQ3
~ ~ ~ r > ~ " : . . . - - . . 5 - " : - -- "<-.7.>'4 ..--<-C.."- -
0 6 0 1 2 0 Time (min) Fig. 10. Plasma insulin variation during continuous subcutaneous insulin infusion with 3 different pump repetition frequencies: 1/hr, 2,25/hr, and 4/hr. In these simulations we have assumed an injected insulin concentration of 100 IU/ml. To account for the faster absorption in the abdominal region, the absorption rate constant has been increased to B = 2,0 x 10- 2/min,

84 Mosekiide, Jensen, Binder, Pramming, and Thorsteinsson
z~C ~'C5 (%1
10.
.1.
.01 i i i i i i i i I i I t I i i i i I
.1 1 10 Frequency (/hr)
Fig. 11. Frequency characteristic for the delivery-absorption-distribu- tion-degradation system. AC is the peak to peak variation in insulin concentration as seen in Fig. 10, and (C)= 16.0 mU/L is the mean concentration.
on five simulations using repetition frequencies in the interval 0.5/hr- 10.8/hr, and it shows the pulse periodic variations of the plasma insulin concentration as a function of the pump frequency. Most commercial pumps are designed for frequencies above 4/hr. From Fig. 11 it can be seen that a ripple of less than 1% can be obtained with a repetition frequency of only 2/hr. This result is based on the fact that the infusion pump builds up a depot in the subcutaneous tissue, and this depot serves as a buffer to smooth out variations in the delivery rate. Our results are concurrent with the experimental observation that plasma glucose as well as metabolic intermediates remain essentially the same with intermittent as with con- tinuous insulin infusion, even if the former is administered as infrequently as with 2-hr pulse intervals (33).
D I S C U S S I O N
A comprehensive model of subcutaneous insulin absorption has been described. The main hypothesis in this model is that the injected soluble insulin is present in the subcutaneous tissue in (at least) two multimeric forms. We have shown that this hypothesis alone can explain both the volume and concentration effects and the deviation from a monoexponential absorption course. We cannot identify the actual forms of insulin in the tissue. It can be shown, however, that at least a third-order process is

Absorption Kinetics of Soluble Insulin 85
required to produce a bending of the absorption curve as sharp as that observed experimentally. Transformation between monomeric and dimeric insulin is therefore not a possible explanation. Transformation between monomeric and hexameric insulin, on the other hand, cannot be rejected.
It is clear that we have analyzed the consequences of a range of alternative hypotheses. Besides self-depression and saturable diffusion through the capillary membrane, we have considered the possibility that the injected solution creates a separate space in subcutis from which there is reduced contact with the capillary system. Such a hypothesis might explain the delayed absorption observed at large injection volumes. It cannot explain the concentration dependence, however. Moreover, clinical experience indi- cates that the injected water is absorbed within a few minutes, and the formation of a separate space could therefore not explain a delay of several hours.
We have also considered the possibility that the volume and concentra- tion effects could be caused by biotransformations of insulin into a low molecular weight product (identified as monoiodotyrosine) and a high molecular weight form that is a mixture of subcutaneous components bound to undegraded insulin and to insulin degradation products (20). Such a hypothesis might explain the concentration effect and possibly also the delayed absorption phase. As long as the model only contains first-order processes, however, it cannot explain the dependence of the absorption rate on the injected volume. Among possible higher order processes, polymeriz- ation seems to be the most plausible.
Changes in the local blood flow close to the injection site may influence the absorption rate. However, such changes are more likely to increase than to reduce the initial absorption rate. Allowing for such phenomena would introduce an additional level of complexity in the model which we find unjustified at the present stage.
By adjusting the model to fit available experimental data one can determine the effective diffusion constant D for insulin in subcutis, the absorption rate constant B for dimeric insulin, the equilibrium constant Q between hexameric and dimeric insulin, the typical binding capacity C for insulin in the tissue, and the average life time T for insulin in its bound state. Typical values for the thigh of fasting type I diabetics are D = 0.9 x 10 - 4 cm2/min, B = 1.3 x 10⁻²/min, Q = 0.13 (ml/IU) 2, C = 0.05 IU/cm 3, and T = 800 min. This value of D equals the diffusion constant for insulin in water at 37~ and D may thus be considered an independently determined parameter. The small amounts of insulin remaining in the depot when the tailing phenomenon is observed are clearly without clinical sig- nificance. In the range of therapeutic solutions and injection volumes, the only important parameters of the model are thus the absorption rate constant

86 Mosekilde, Jensen, Binder, Pramming, and Thorsteinsson
B for dimeric insulin and the equilibrium constant Q between hexameric and dirneric insulin.
A C K N O W L E D G M E N T
We thank Rikke Frederiksen for her careful and patient preparation of the manuscript.
REFERENCES
1. M. Berger, H. J. Cfippers, H. Hegner, V. J6rgens, and P. Berchtold. Absorption kinetics and biologic effects of subcutaneously injected insulin preparations. Diabetes Care 5:77-91 (1982).
2. C. Binder, T. Lauritzen, O. Faber, and S. Pramming. Insulin pharmacokinetics. Diabetes Care 7:188-199 (1984).
3. C. Binder. Absorption of injected insulin. Aeta PharmacoL ToxicoL 27(Suppl. 2):1-84 (1969).
4. E. W. Moore, M. L. Mitchell, and T. C. Chalmers. Variability in absorption ofinsulin-P 3t in normal and diabetic subjects after subcutaneous and intramuscular injection. J. Clin. Invest. 38:1222-1227 (1959).
5. J. A. Galloway, C. T. Spradlin, R. L. Nelson, S. M. Wentworth, J. A. Davidson, and J. L. Swarner. Factors influencing the absorption, serum insulin concentration, and blood glucose responses after injections of regular insulin and various insulin mixtures. Diabetes Care 4:366-376 (1981).
6. K. Kolendorf, J. Bojsen, and T. Deckert. Clinical factors influencing the absorption of 125I-NPH insulin in diabetic patients. Horm. Metab. Res. 15:274-78 (1983).
7. K. Kolendorf, and J. Bojsen. Storage telemetry for detection subcutaneous absorption of protamine 12sI-insulin in newly diagnosed, ketotic and non-ketotic insulin dependent diabetes. Acta Endocrinol. (Suppl.) 88:51 (1978).
8. D. A. Henry, J. M. Lowe, D. Citrin, and W. G. Manderson. Defective absorption of injected insulin. Lancet 2:741 (1978).
9. K. Kolendorf, J. Bojsen, and S. L. Nielsen. Adipose tissue blood flow and insulin disappearance from subcutaneous tissue. Clin. Pharmacol. Ther. 25:598-604 (1979).
10. V. A. Koivisto, and P. Felig. Effects of leg exercise on insulin absorption in diabetic patients. New Engl. J. Med. 298:79-83 (1978).
11. V. A. Koivisto. Sauna-induced acceleration in insulin absorption from subcutaneous injection site. Br. Med. J. 280:1411-13 (1980).
12. S. Pramming, T. Lauritzen, B. Thorsteinsson, K. Johansen, and C. Binder. Absorption of soluble and isophane semi-synthetic human and porcine insulin in insulin-dependent diabetic subjects. Acta EndocrinoL 105:215-220 (1984).
13. K. Kolendorf, J. Bojsen, and T. Deckert. Absorption and miscibility of regular porcine insuline after subcutaneous injection of insulin-treated diabetic patients. Diabetes Care 6:6-9 (1983).
14. A. Murat and G. Slama. Influence of concentration on the kinetics of sc-infused insulin. Comparison between square-wave sc infusion and bolus sc injection, metabolism 34:120- 123 (1985).
15. J. Schou. Absorption of drugs from subcutaneous connective tissue. Pharmacol. Rev. 13:441-464 (1964).
16. G. Williams, J. Pickup, A. Clark, S. Bowcock, E. Cooke, and H. Keen. Changes in blood flow close to sucutaneous insulin injection sites in stable and brittle diabetics. Diabetes 32:466-473 (1983).
17. C. Binder. A theoretical model for the absorption of soluble insulin. In P. Brunetti et al. (eds.), Artificial Systems for Insulin Delivery, Raven Press, New York, 1983, pp. 53-57.

Absorption Kinetics of Soluble Insulin 87
18. P. Hildebrandt, P. Sejrsen, S. L. Nielsen, K. Birch, and L. Sestoft. Diffusion and polymeriz- ation determines the insulin absorption from subcutaneous tissue in diabetic patients. Scand. J. Clin. lab. Invest. 45:685-690 (1985).
19. E. A. Rasio. The displacement of insulin from blood capillarites. Diabetologia 5:416-419 (1969).
20. K. Okumura, F. Komada, and R. Hori. Fate of porcine and human insulin at the subcutaneous injection site. I. Degradation and absorption of insulin in the rat. J. Phar- macobiodyn. 8:25-32 (1985).
21. U. Fischer, E.-J. Freyse, E. Jutzi, W. Besch, M. Raschke, S. H6fer, and G. Albrecht. Absorption rates of subcutaneously injected insulin the dog as calculated from the plasma insulin levels of means of a simple mathematical model. Diabetologia 24:196-201 (1983).
22. T. Kobayashi, S. Sawano, T. Itoh, K. Kosaka, H. Hirayama, and Y. Kasya. The phar- macokinetics of insulin after continuous subcutaneous infusion or bolus subcutaneous injection in diabetic patients. Diabetes 32:331-336 (1983).
23. E. W. Kraegen and D. J. Chisholm. Insulin responses to varying profiles of subcutaneous insulin infusion: Kinetic modelling studies. Diabetologia 26:208-213 (1984).
24. T. Deckert, B. Hansen, K. Kolendorf, J. S. D. Poulsen, and M. Smith. Absorption of NPH-insulin from subcutaneous tissue: A methodological study in pigs. Acta Pharmacol. Toxicol. 51:30-37 (1982).
25. J. M. Creeth. Maximum molecular weight of insulin. Nature 170:210 (1952). 26. R. P. Eaton, R. C. Allen, and D. S. Schade. Hepatic removal of insulin in normal man:
Dose response to endogeneous insulin secretion. J. Clin. Endocrinol. Metab. 56:1294-1300 (1983).
27. R. Rabkin, M. P. Ryan, and W. C. Duckworth. The renal metabolism of insulin. Diabetologia 27:351-357 (1984).
28. M.J. Chamberlain and L. Stimmler. The renal handling of insulin. J. Clin. Invest. 46:911-919 (1967).
29. T. Lauritzen, S. Pramming, T. Deckert, and C. Binder. Pharmacokinetics of continuous subcutaneous insulin infusion. Diabetologia 24:326-329 (1983).
30. J. C. Pickup, H. Keen, J. A. Parsons, and K. G. M. M. Alberti. Continuous subcutaneous insulin infusion: An approach to achieving normoglycemia. Br. Med. J. 1:204-207 (1978).
31. K. Kolendorf, J. Bojsen, and B. Lorup. Improvement of glucose homeostasis in insulin- dependent diabetics using a miniature insulin infusion pump with a fixed profile. Diabetologia 18:141-145 (1980)~
32. P. Hildenbrandt, K. Birch, B. Moiler Jensen, C. Kfihl, and J. Brange. Absorption of subcutaneously infused insulin: Influence of the basal rate pulse interval. Diabetes Care 8:287-289 (1985).
33. C. Levy-Marchal, A. M. Albisser, and B. Zinman. Overnight metabolic control with pulsed intermittent versus continuous subcutaneous insulin infusion. Diabetes Care 6:356-360 (1983).
34. K. F. Hanssen, K. Dahl-Jorgensen, T. Lauritzen, B. Feldt-Rasmussen, O. Brinchrnann- Hansen, and T. Deckert. Diabetic control and microvascular complications: The near- normoglycaemic experience. Diabetologia 29:677-684 (1986).
35. K. J/Srgensen and C. Binder. ~ 25 I-insulin as a tracer of insulin in different chemical processes. In L. Donato, G. Milhaud, and J. Sirchis (eds.) Labelled Proteins in Tracer Studies, EURATOM, Brussels, 1960, pp. 329-333.
Copyright © 2022 FDOKUMEN