
Analysis of Oil-Injected Twin-Screw Compressor with ... - MDPI
19
Designs 2019, 3, 54; doi:10.3390/designs3040054 www.mdpi.com/journal/designs Article Analysis of Oil‐Injected Twin‐Screw Compressor with Multiphase Flow Models Nausheen Basha 1, *, Ahmed Kovacevic 1 and Sham Rane 2 1 Centre for Compressor Technology, City, University of London, London ECIV 0HB, UK; [email protected] 2 Department of Engineering Science, University of Oxford, Oxford OX2 0ES, UK; [email protected] * Correspondence: [email protected] Received: 26 September 2019; Accepted: 2 December 2019; Published: 16 December 2019 Abstract: Growing demands for energy are motivating researchers to conduct in‐depth analysis of positive displacement machines such as oil‐injected screw compressors which are frequently used in industrial applications like refrigeration, oil and gas and air compression. The performance of these machines is strongly dependent on the oil injection. Optimisation of oil has a great energy saving potential by both increasing efficiency and reducing other impacts on the environment. Therefore, a three‐dimensional, transient computational fluid dynamics study of oil injection in a twin‐screw compressor is conducted in this research. This study explores pseudo single‐fluid multiphase (SFM) models of VOF (Volume of Fluid) and a mixture for their capability to predict the performance of the oil‐injected twin screw compressor and compare this with the experimental values. SCORG TM (Screw Compressor Rotor Grid Generator) is used to generate numerical grids for unstructured solver Fluent with the special interface developed to facilitate user defined nodal displacement (UDND). The performance predictions with both VOF and mixture models provide accurate values for power consumption and flow rates with low deviation between computational fluid dynamics (CFD) and the experiment at 6000 RPM and 7.0 bar discharge pressure. In addition, the study reflects on differences in predicting oil distribution with VOF, mixture and Eulerian‐ Eulerian two‐fluid models. Overall, this study provides an insight into multiphase flow‐modelling techniques available for oil‐injected twin‐screw compressors comprehensively accounting for the details of oil distribution in the compression chamber and integral compressor performance. Keywords: oil‐injected compressor; Fluent; VOF; mixture; user defined nodal displacement 1. Introduction Twin‐screw compressors have been widely used in compression processes due to their advantages such as compact structure, stable operation and high efficiency. They are used in a number of industries such as oil and gas, refrigeration, processing or mining. In many cases, twin‐ screw compressors have replaced reciprocating compressors [1]. The market for compressors is projected to grow at a compound annual growth rate (CAGR) of 6.62% from 2016–2021, to reach a market size of USD 11.01 billion by 2021 [2]. With this growing pace, more and more researchers and engineers are interested in looking for ways to improve efficiency and reduce the carbon footprint [3]. Oil‐injected compressors are popular compared to oil‐free compressors as achieving high‐ pressure ratios within single stage with reduced mechanical elements is possible. Oil is injected for cooling, sealing gaps and lubricating rotors. Excessive amount of oil can lead to frictional and momentum losses [4]. In early years of screw machines, analytical modelling was used to understand the effect of oil injection. In 1986, Singh and Bowman [5] developed a mathematical model to evaluate
-
Upload
khangminh22 -
Category
Documents
-
view
4 -
download
0
Transcript of Analysis of Oil-Injected Twin-Screw Compressor with ... - MDPI

Designs 2019, 3, 54; doi:10.3390/designs3040054 www.mdpi.com/journal/designs
Article
Analysis of Oil‐Injected Twin‐Screw Compressor
with Multiphase Flow Models
Nausheen Basha 1,*, Ahmed Kovacevic 1 and Sham Rane 2
1 Centre for Compressor Technology, City, University of London, London ECIV 0HB, UK;
[email protected] 2 Department of Engineering Science, University of Oxford, Oxford OX2 0ES, UK; [email protected]
* Correspondence: [email protected]
Received: 26 September 2019; Accepted: 2 December 2019; Published: 16 December 2019
Abstract: Growing demands for energy are motivating researchers to conduct in‐depth analysis of
positive displacement machines such as oil‐injected screw compressors which are frequently used
in industrial applications like refrigeration, oil and gas and air compression. The performance of
these machines is strongly dependent on the oil injection. Optimisation of oil has a great energy
saving potential by both increasing efficiency and reducing other impacts on the environment.
Therefore, a three‐dimensional, transient computational fluid dynamics study of oil injection in a
twin‐screw compressor is conducted in this research. This study explores pseudo single‐fluid
multiphase (SFM) models of VOF (Volume of Fluid) and a mixture for their capability to predict the
performance of the oil‐injected twin screw compressor and compare this with the experimental
values. SCORGTM (Screw Compressor Rotor Grid Generator) is used to generate numerical grids for
unstructured solver Fluent with the special interface developed to facilitate user defined nodal
displacement (UDND). The performance predictions with both VOF and mixture models provide
accurate values for power consumption and flow rates with low deviation between computational
fluid dynamics (CFD) and the experiment at 6000 RPM and 7.0 bar discharge pressure. In addition,
the study reflects on differences in predicting oil distribution with VOF, mixture and Eulerian‐
Eulerian two‐fluid models. Overall, this study provides an insight into multiphase flow‐modelling
techniques available for oil‐injected twin‐screw compressors comprehensively accounting for the
details of oil distribution in the compression chamber and integral compressor performance.
Keywords: oil‐injected compressor; Fluent; VOF; mixture; user defined nodal displacement
1. Introduction
Twin‐screw compressors have been widely used in compression processes due to their
advantages such as compact structure, stable operation and high efficiency. They are used in a
number of industries such as oil and gas, refrigeration, processing or mining. In many cases, twin‐
screw compressors have replaced reciprocating compressors [1]. The market for compressors is
projected to grow at a compound annual growth rate (CAGR) of 6.62% from 2016–2021, to reach a
market size of USD 11.01 billion by 2021 [2]. With this growing pace, more and more researchers and
engineers are interested in looking for ways to improve efficiency and reduce the carbon footprint
[3].
Oil‐injected compressors are popular compared to oil‐free compressors as achieving high‐
pressure ratios within single stage with reduced mechanical elements is possible. Oil is injected for
cooling, sealing gaps and lubricating rotors. Excessive amount of oil can lead to frictional and
momentum losses [4]. In early years of screw machines, analytical modelling was used to understand
the effect of oil injection. In 1986, Singh and Bowman [5] developed a mathematical model to evaluate

Designs 2019, 3, 54 2 of 19
the effect of oil droplet size. They reported that with 10 times reduction in oil droplet size, specific
power could be reduced by 7%. A parametric study on oil injection variants conducted by Stosic et
al. [6] concluded that oil mass flow and oil port position had more significant effect on integral
performance. These key analytical studies had promised improvements in performance which lead
to further experimental research. Peng et al. [7] studied the effect of oil to gas mass ratio at varying
rotational speeds and de Paepa et al. [8] studied the effect of cooling effectiveness. Further to this,
authors have carried out elaborate experiments to understand the effect of oil flow on compressor
performance at varying shaft speeds and discharge pressures [9]. Study has strongly indicated that,
for lower discharge pressures (6.5 bar and 8.5 bar), power consumption increased with the increase
in oil flow. Meanwhile, at higher discharge pressures (10.5 bar and 12.5 bar) the power consumption
decreased with the increase in the oil flow. Hence, an optimal quantity of oil exists for a compressor
running at a certain design or operating condition.
There is a growing interest in visualising distribution of oil in the compression chamber because
experimental investigations of two‐phase flows in a compressor are often difficult and cumbersome.
Physical or optical access to measure the chamber pressures or temperatures is limited, which makes
it hard to determine internal flow characteristics of the oil phase. Hence, computational fluid
dynamics (CFD) provides an excellent insight to visualise flow pattern and oil distribution within
compression chamber.
Very little work was done on CFD before the break of 20th Century as reliable grids were not
available for complex deforming domains of twin‐screw machines. Kovacevic [10–12] made a
breakthrough in CFD modelling of screw machines by developing a methodology to produce block‐
structured grids for deforming domains and this was further developed to form single domain‐type
mesh. This had resulted in better solution accuracy for single phase flow of air in oil free compressor
[13,14]. Rane et al. [15] conducted analysis with non‐homogenous Eulerian‐Eulerian approach which
showed distribution of oil as it was expected based on experience. The difference in power
predictions were noticed as the mechanical losses were estimated. The highest deviations in power
from experimental data around 10% was noticed at 8.0 bar discharge pressure and 6000 RPM. At the
same time, the flow predictions were only 2% different.
Further to this, authors conducted investigation using CFD solver Ansys CFX to compare the
inhomogeneous Euler‐Euler approach, and homogeneous model. The homogeneous approach
resulted in lower flow and power predictions than the Eulerian‐Eulerian model [16]. However, the
calculation time of the homogeneous model was shorter than non‐homogeneous model. The only
available SFM model which represents homogeneous approach in CFX is comparable to VOF
(Volume of Fluid) modelling. However, it is known that the fluid‐fluid interphase is better resolved
in ANSYS Fluent where additional interface reconstruction algorithms are used when compared to
CFX within the VOF approach [17]. This encouraged authors to explore Fluent as a solver which is
known for resolving sharper interphase well and reducing smearing problems for fluids with high‐
density ratios compared to CFX. In Fluent, the interface between two phases is reconstructed for
every time step based on calculated volume fraction distributions.
Another solver used for a case study of oil‐injected twin‐screw compressors is Pumplinx which
has only one multiphase flow model available VOF [18]. As presented in this case study, the mass
imbalance for both air and oil is as low as 1%, although integral parameters are not compared with
experimental data. Another study looks at oil droplet trajectories in terms of diameter size (0.5 μm,
5.0 μm and 50.0 μm), simulation is conducted for a static mesh for single screw compressor domain
in Star CCM+ [19]. Although this modelling gives an indication of distributed oil droplets, the effects
of rotation or compression cycle are neglected and the results do not always look as expected.
Eulerian‐Eulerian modelling with Fluent has been explored by Papes et al., but the simulation results
have not been validated experimentally nor mass balance was shown [20]. Therefore, further
exploration is required with SFM models to obtain a stable and reliable approach towards modelling
of oil injection within twin‐screw compressors.
In the light of above considerations, SFM models of VOF and mixture are explored in Fluent to
check for their stability, calculation speed and more importantly performance predictions. For
Designs 2019, 3, 54 3 of 19
achieving solution, SCORGTM is used with UDND to transition the nodes for each time step.
Successful running of UDND code in parallel framework is used for the case of oil‐injected
compressor operating at discharge pressure of 7.0 bar with the male rotor shaft speed of 6000 RPM.
Research questions investigated in this paper are,
1. How is Fluent solver customised to solve for oil‐injected twin screw compressor?
2. Are pseudo‐SFM models capable of predicting integral performance comparable to
experimental data?
3. How is the oil distributed within the compression chamber for various multiphase flow models
and what is its effect on integral performance?
2. Multiphase Flow Modelling
Two‐phase flow includes all complexities of single‐phase flow such as non‐linearities, transition
to turbulence and instabilities, and additional multiphase characteristics such as motion and
deformation of the interface, non‐equilibrium effects and momentum interaction between phases. Oil
is initially injected as a continuous fluid which is dispersed due to the shear of the incoming rotor
lobe leading to the formation of droplets. Smaller droplets leave the compression chamber faster
while others coalescence to form the oil lubrication film on the rotors and casing. It would be difficult
to capture all these flow regimes that occur in twin‐screw machines within one multiphase scheme.
Key challenges faced for modelling of oil‐injected flows in a screw compressor are,
i. Binary fluids with high‐density ratios
Air and oil exist with the density ratio of magnitude of approximately 900. Challenges here are
attributed largely to the difference in material properties between phases, which can lead to
formation of high interfacial forces [21]. Numerical simulations with high density ratios tend to have
sharp discontinuities across the interface resulting in instability. Various interpolation schemes are
available in Fluent for advection of volume fraction. These are geometric construction, donor‐
acceptor and compressive scheme. Out of these, a compressive discretisation scheme is useful for
blending sudden jump in material properties [17]. Therefore, this scheme is chosen in this study.
ii. Compressible fluids
Interpolation schemes for volume fraction advection applied to the interphase cells can
sometimes result in smearing of density. This smeared density if not treated carefully can affect
Pressure‐velocity coupling equations as pressure is a function of density. As a result, unphysical
pressures can occur in the solution leading to instability for iterative solution of continuity equation.
This instability is cautiously controlled by under‐relaxation factor of 0.01 for current case.
iii. Mesh quality
Poor mesh quality can lead to problems in resolving higher volume fraction gradients. Higher
aspect ratio, orthogonality and a sudden change in cell sizes can affect conservativeness of pressure‐
velocity‐density balancing and result in abrupt changes in physical properties. This in turn can lead
to localised and unphysical increase in pressure and temperature. However, for this study, good‐
quality mesh was obtained with aspect ratio‐ 326, expansion factor‐ 96 and orthogonal angle‐ 6.9.
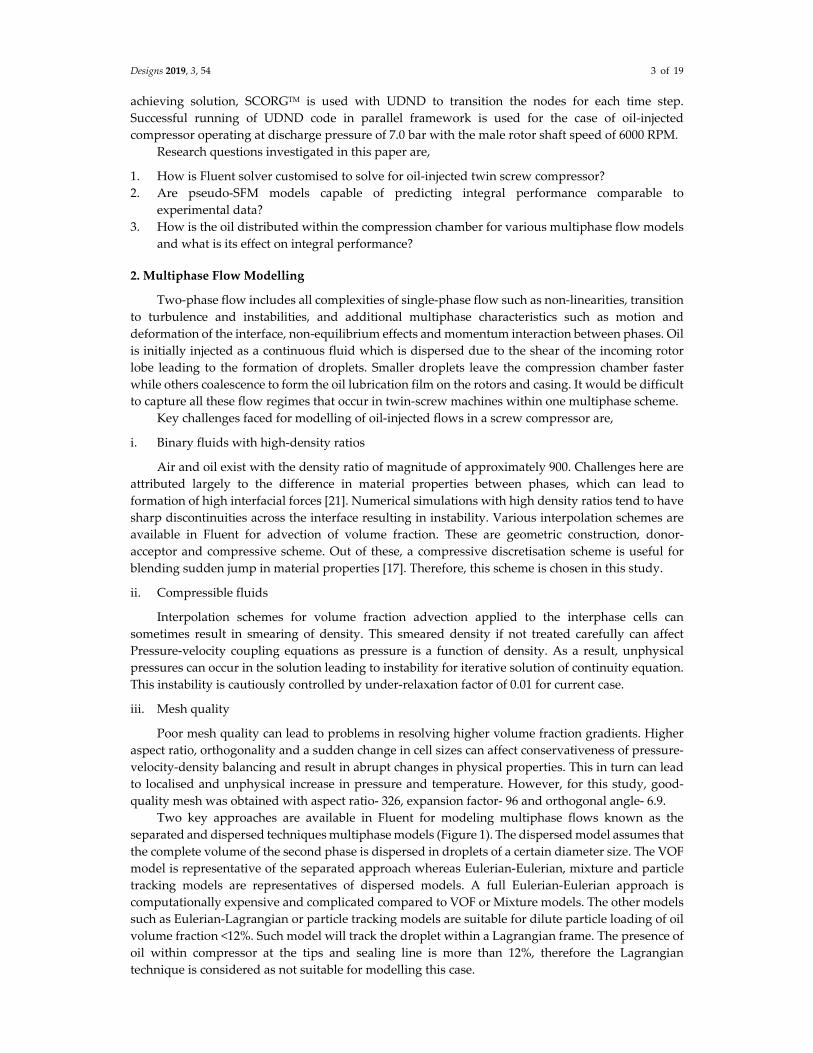
Two key approaches are available in Fluent for modeling multiphase flows known as the
separated and dispersed techniques multiphase models (Figure 1). The dispersed model assumes that
the complete volume of the second phase is dispersed in droplets of a certain diameter size. The VOF
model is representative of the separated approach whereas Eulerian‐Eulerian, mixture and particle
tracking models are representatives of dispersed models. A full Eulerian‐Eulerian approach is
computationally expensive and complicated compared to VOF or Mixture models. The other models
such as Eulerian‐Lagrangian or particle tracking models are suitable for dilute particle loading of oil
volume fraction <12%. Such model will track the droplet within a Lagrangian frame. The presence of
oil within compressor at the tips and sealing line is more than 12%, therefore the Lagrangian
technique is considered as not suitable for modelling this case.
Designs 2019, 3, 54 4 of 19
Figure 1. Multiphase flow models within Fluent
More details about the mentioned multiphase models are given in Section 2.1.
2.1. Governing Equations
The governing equations of the mathematical model describing Eulerian‐Eulerian, VOF and
mixture models in the section below are adopted from the Fluent theory guide [22].
2.1.1. Eulerian‐Eulerian Model
This model in Fluent is known as a TFM (Two Fluid Model). The number of conservation
equations depends on the number of phases. In this case, there are two phases, air and oil which have
separate governing equations. The model describes multiphase flow as interpenetrating continua
incorporating the concept of phasic volume fraction (αq). Volume fraction here represents the space
occupied by each phase.
Volume of phase q, Vq is defined as,
𝑉 𝛼 𝑑𝑉 (1)
Continuity equation:
1𝜌
𝜕 𝛼 𝜌𝜕𝑡
∇. 𝛼 𝜌 �⃗� 𝑚 𝑚 (2)
Momentum equation:
𝜕 𝛼 𝜌 �⃗�𝜕𝑡
∇. 𝛼 𝜌 �⃗� �⃗�
𝛼 ∇𝑃 ∇. 𝜏 𝛼 𝜌 �⃗� 𝑅 𝑚 �⃗� 𝑚 �⃗� �⃗�
�⃗� , �⃗� ,
(3)
Transient and convection terms are located on the left‐hand side of the equation. Terms on the
right‐hand side are pressure gradient, stress strain, gravity, interaction between phases, mass
transfer, external body, lift and mass forces.
Interphase momentum transfer Rpq can be written as,
�⃗� 𝐾 �⃗� �⃗� (4)
𝑅𝛼 𝛼 𝜌 𝑓
𝜏�⃗� �⃗� (5)
𝑓𝐶 𝑅𝑒
24 (6)
𝐶24 1 0.15𝑅𝑒 .
𝑅𝑒 𝑅𝑒 1000
0.44 𝑅𝑒 1000 (7)

Designs 2019, 3, 54 5 of 19
𝜏𝜌 𝑑18𝜇
(8)
In the above set of equations, ρ is density, v is velocity, p is pressure, 𝜏 is shear stress, g is gravity, 𝑚 is mass flow rate, F is drag force, α is volume fraction, 𝐶 is drag coefficient, Re is
Reynolds number, S is source term, dp is diameter of the droplet, μ is viscosity and τ is particle
relaxation time. Subscripts p and q indicate first and second phase, respectively.
The interphase momentum transfer term (Rpq) is dependent on the velocity of each phase, phase
volume fraction, phase densities and droplet diameter.
Energy equation:
𝜕𝜕𝑡
𝛼 𝜌 ℎ ∇. 𝛼 𝜌 𝑢⃗ℎ 𝛿∇𝑇 𝑄 𝑚 ℎ 𝑚 ℎ 𝑆 (9)
Here, h, T and δ denote static enthalpy, temperature and thermal conductivity of the phase q. Sq
describes external heat sources (momentum, continuity etc.). Qpq is the interface heat transfer which
is a heat transfer coefficient between the phases, interface area and temperature difference.
2.1.2. VOF Model
The VOF model consist of a single set of governing equations. In this model, the phases of gas
and oil are treated as immiscible and not interpenetrating. Variables fields and properties in each
equation are shared by both phases and are represented by the volume‐averaged values (example
shown for density in Equation (10)). Variable/property in any given cell is either a pure representative
of one of the phases or mixture of both the phases that is represented as an interface.
𝜌 𝛼 𝜌 (10)
k represents number of phases.
Continuity:
1𝜌
𝜕 𝛼 𝜌𝜕𝑡
∇. 𝛼 𝜌 �⃗� 𝑚 𝑚 (11)
Momentum:
𝜕𝜕𝑡
𝜌�⃗� ∇. 𝜌�⃗��⃗� ∇𝑃 ∇. µ ∇�⃗� ∇�⃗� 𝜌�⃗� �⃗� 𝑚 𝑚 (12)
Unlike Eulerian‐Eulerian model, the VOF model does not account for the interphase momentum
transfer within momentum equation.
Energy:
𝜕𝜕𝑡
𝛼 𝜌 ℎ ∇. 𝛼 𝜌 𝑢⃗ℎ 𝛿∇𝑇 𝑆 (13)
An essential part of VOF model is the interface reconstruction scheme, which attempts to
explicitly approximate the location of the interface within a computational cell, based on the volume
fraction of the current and surrounding cells. The compressive scheme is based on the algebraic
formulation, which is known for its application when the viscosity ratio between two phases is high
thus ensuring smoothness of the interface [23]. This interface‐capturing technique is used in this
study.
2.1.3. Mixture Model
Both mixture and VOF models are single phase models. However, the mixture model differs
from the VOF model by,
i. Including the additional term for the interphase momentum transfer in the momentum Equation
(16).
ii. Treating the phases to be interpenetrating continua similar to the Eulerian‐Eulerian model.

Designs 2019, 3, 54 6 of 19
Continuity:
1𝜌
𝜕 𝛼 𝜌𝜕𝑡
∇. 𝛼 𝜌 �⃗� ∇. 𝛼 𝜌 �⃗� , 𝑚 𝑚 (14)
�⃗�𝛼 𝜌 �⃗�𝜌
(15)
Momentum: 𝜕𝜕𝑡
𝜌 �⃗� 𝛻. 𝜌 �⃗� �⃗�
𝛻𝑝 𝛻. 𝜇 𝛻�⃗� 𝛻�⃗� 𝜌 �⃗� �⃗� 𝛻. 𝛼 𝜌 �⃗� , �⃗� ,
𝑚 �⃗� , 𝑚 �⃗� ,
(16)
�⃗� , �⃗� 𝑐 �⃗� (17)
�⃗�𝜏𝑓
𝜌 𝜌𝜌
�⃗� (18)
𝜏𝜌 𝑑18𝜇
(19)
The velocity of only one phase is solved. For the second phase, the directional velocity (�⃗� is
used which depends on the slip velocity (�⃗� ) and the concentration of the second phase (𝑐 . The slip
velocity depends on the particle relaxation time (τp), phase and mixture densities, droplet diameters
(dp) and drag forces (fdrag). In the equations above, the annotation subscript ‘m’ stands for mixture and
�⃗� is the secondary‐phase particle’s acceleration. Slip velocity between the phases is obtained
according to Algebraic slip model or Manninen et al. model [24].
The energy equation for the mixture model is the same as in the VOF model (Equation (13)).
2.2. Comparison of Computational Multiphase Flow Models
Which multiphase flow model will be used depends on the dominant flow regime and average
cell or grid size. In a twin‐screw compressor, oil can exist in the form of film as well as droplets which
should ideally be treated with different multiphase models. Therefore, available multiphase models
are explored in this study.
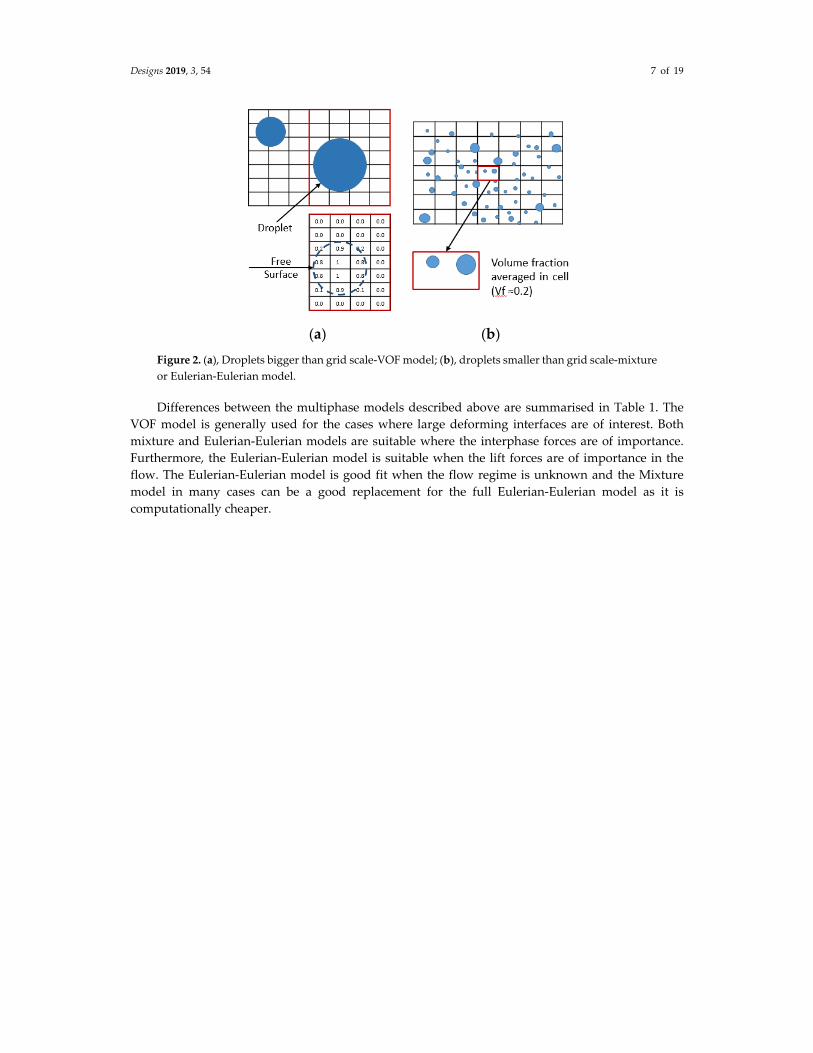
VOF model better resolves average oil droplet size larger than the average cell size in a mesh.
Whereas the mixture and Eulerian‐Eulerian models are suitable for resolving droplets with size
smaller than average cell size (Figure 2). Using the VOF model based on the cell volume fraction and
the interface‐tracking algorithm, the free surface is obtained. Mixture properties are applied to the
cells with partial volume fraction. On the other hand, for the mixture/Eulerian‐Eulerian model phase
properties are averaged based on volume fraction in a discrete domain and no free surface is
obtained.
Designs 2019, 3, 54 7 of 19
(a) (b)
Figure 2. (a), Droplets bigger than grid scale‐VOF model; (b), droplets smaller than grid scale‐mixture
or Eulerian‐Eulerian model.
Differences between the multiphase models described above are summarised in Table 1. The
VOF model is generally used for the cases where large deforming interfaces are of interest. Both
mixture and Eulerian‐Eulerian models are suitable where the interphase forces are of importance.
Furthermore, the Eulerian‐Eulerian model is suitable when the lift forces are of importance in the
flow. The Eulerian‐Eulerian model is good fit when the flow regime is unknown and the Mixture
model in many cases can be a good replacement for the full Eulerian‐Eulerian model as it is
computationally cheaper.

Designs 2019, 3, 54 8 of 19
Table 1. Parameters considered within multiphase flow models.
Suitability Continuity Equation (C) Momentum Equation (M) Energy Equation (E) Droplet
Dia.
Equations
Solved
Eulerian‐
Eulerian
Strong coupling between phases.
Ex: bubble columns, particle suspension and fluidised
beds
Solved for each phase
‐ Separate equation for each phase.
‐ Strong coupling term between
phases
‐ Separate enthalpy equation
for each phase.
‐ Additional term for heat
exchange
Yes
C‐2
M‐6
E‐2
Total: 10
VOF
Suitable when a clear interface is present between the
phases and this interface is of interest.
Ex: Stratified or free surface flows
Single equation
‐ Single equation with properties
mass averaged.
‐ No considered for interphase
momentum transfer
‐ Single energy equation
shared.
‐ Properties mass averaged in
a cell
No
C‐1
M‐3
E‐1
VF‐1
Total: 6
Mixture
Suitable for a wide range of dispersed phases and flows.
Ex. Droplet laiden flows, sedimentation or cyclone
separators
Single equation.
Presence of drift &
mixture velocities
‐ Single equation with properties
mass averaged.
‐ Additional term on interphase
forces and slip velocities
Similar to VOF Yes
C‐1
M‐3
E‐1
VF‐1
Total: 6
In the table above, ‘C’ represents the continuity equation, ‘M’ represents the momentum equation, ‘E’ represents the energy equation and ‘VF’ represents the volume
fraction equation.

Designs 2019, 3, 54 9 of 19
3. Case Study
In this case study, the performance of oil‐injected air twin‐screw compressor was obtained with
Fluent using different multiphase modelling techniques. This compressor has a radial suction port
and an axial discharge port with an oil injection port on the female side of the rotor. The lobe
combination is 4–5 with ‘N’ profile. The compressor operates at 6000 RPM and discharge pressure of
7.0 bar. The rotor center distance is 67.5 mm, the outer diameter of the male rotor is 98.8 mm and the
outer diameter of the female rotor is 77.8 mm. The length of the rotors is 153.1 mm with the male
rotor wrap angle of 306.6° and volume index of 4.6.
Test measurements for the compressor performance were carried out at City University of
London’s oil‐injected test rig (ISO 1217:2009—Displacement Compressor‐acceptance testing).
Discharge pressure is controlled via the check valve; the flow is measured using an orifice plate in
the discharge line, a speed encoder on the male rotor shaft, and a torque meter installed between the
transmission system and the compressor.
Figure 3 shows the compressor in the test rig. Measurement data acquisition is carried out using
CompactRIO. At least 15 readings were taken at the operating condition of 6000 RPM and 7.0 bar,
which was later averaged in order to obtain the performance values. Considering the instrumentation
error and dependent variables of the integral values of flow rate and power, the measured error
propagation for the flow rate and power was estimate to be 4.7% and 2.7%, respectively [9].
Figure 3. Compressor in a test rig.
3.1. Grids
A single‐domain mesh was used for calculating performance prediction in this case. The
technique used to generate the single domain rotor mesh is based on the algebraic background
blocking technique as described in [13]. Figure 4a shows the rotor grid in one transverse cross section.
Figure 4b shows the mesh of the complete fluid volume with rotors represented by the first layer of
numerical cells on the rotor surface. The nominal interlobe, radial and axial leakage gaps are 50 μm.
Oil injection port diameter is 5 mm.

Designs 2019, 3, 54 10 of 19
Figure 4. (a) Circumferential: 60, Radial: 5, Angular: 90 and Interlobe: 77, grid distribution on rotor
with divisions and (b), Numerical grid of flow domain.
3.2 Interface with Fluent
User‐defined functions (UDF) are written and compiled in ‘C’ programing language. Their
function is to link meshes generated in SCORG TM and the Fluent parallel multiprocessor calculation
framework. This is based on the integration for sliding vane machines developed by authors [25], and
has been extended to the parallel framework for twin‐screw machines [26–28].
With some unstructured cell‐centered solvers like Fluent, the node numbers need to be updated
each time the new mesh is loaded in the solver. Figure 5 shows the mesh generated from SCORGTM
for 4–5 lobe combination compressor. This mesh is loaded into Fluent as a customised grid. Mismatch
in the cell node numbers occur between the imported mesh and the existing definition in Fluent.
Therefore, the node mapping procedure needs to be performed in order to align the nomenclature of
nodes. Node mapping is computationally intensive. Since majority of simulations are performed with
parallel solver, it is advantageous to perform the node mapping also in the parallel framework using
this tailor made UDF. Without parallelisation of node mapping, it is possible that the node numbers
would be repeated which can result in error and mismatch of nodal information.
(a) (b)

Designs 2019, 3, 54 11 of 19
Figure 5. Node number mismatching between mesh loaded in Fluent and customised grid generated
by SCORG.
After the node mapping code is executed, the node numbers are aligned between SCORG mesh
and mesh in Fluent. Files generated from SCORG contain x, y, z coordinates of each node. With
marching time steps, x, y, z positions of the node positions are updated in Fluent mesh resulting in
the correct transition of nodes with time. This technique ensures that the cell connectivity and
conservation of intrinsic quantities are preserved.
3.3 Numerical Set‐Up
Air is simulated as an ideal gas and the injected oil is treated as an incompressible fluid. The
properties of these fluids are described in Table 2. Oil is injected at 65 °C and with pressure of 7.0 bar.
Compressor suction or inlet is at atmospheric pressure and 293K while the discharge or outlet is at
7.0 bar.
Table 2. Phase properties.
Phase Density
(kg/m3) Specific Heat Capacity (J/kg∙K) Dynamic Viscosity (kg/m∙s)
Thermal Conductivity
(W/m∙K)
Air 1.225 1.0044 1.831 × 10⁻⁵ 2.61 × 10⁻²
Oil 800 1800.0 0.0088 0.18
Table 3 shows the numerical setup with both VOF and mixture models in Fluent. For first 270
time steps of the simulation, solver relaxation for continuity equation is set as 0.005 and this is
gradually increased to 0.01. To ensure convergence of the case, the cyclic repeatability of the chamber
pressure, suction and discharge flow rates were observed for every male rotor rotation at various
points. The solution is regarded converged if these values are repeated over three consecutive
interlobe rotations.
Table 3. Numerical setup with Fluent.
Criteria Selection‐FLUENT
Turbulence Model SST (Menter’s Shear Stress Transport) k‐omega (Mixture)
Inlet Boundary Condition Inlet (specified pressure and temperature)
Outlet Boundary Condition Pressure outlet (with specified pressure and temperature)
Pressure‐Velocity Coupling Coupled (second order upwind)
Gradient Green‐Gauss Node Based
Volume Fraction Compressive (with phase localised zonal discretisation schemes)

Designs 2019, 3, 54 12 of 19
Turbulence Scheme Second order upwind
Transient Scheme Second order implicit
Iterations per time step 200
Convergence Criteria Continuity 0.07, Velocity 0.001, Energy 1 × 10⁻⁶, Turbulence 0.001,
Volume Fraction 0.001
Relaxation parameters 0.01
As mentioned in Section 2.1.3, the Mixture model drag forces are required to account for slip
between the phases. Drag forces depend on the droplet diameter and drag coefficient (CD). Droplet
diameter (dp) is assumed to be of 50 μm.
𝐶24
𝑅𝑒 1 0.15𝑅𝑒 . 𝑅𝑒 1000
0.44 𝑅𝑒 1000 (20)
𝑅𝑒𝜌𝑣𝑑
𝜇 0.3𝜇 (21)
Drag coefficient in the mixture model is calculated based on the model of Bannari et al. (equation
20) [29]. Here, Reynolds number (Re) depends both on laminar (𝜇 and turbulent viscosity 𝜇 of
the fluid. ρ and v are density and viscosity of fluid in the region.
For stability reasons and better initialisation of the case, both discharge pressure and oil injection
pressures are gradually increased until the full values are reached. The discharge pressure and oil
injection pressure are ramped up across 270 time steps. The case was solved for 990 time steps
observing cyclic repetitions in the pressure and flow rates.
4. Results and Discussions
Using developed interface with Fluent and the numerical setup explained in section 3, this oil‐
injected compressor is calculated with VOF and the mixture models. The 3D analysis provides
pressure, oil and temperature distribution within the compression chamber. Integral parameter
prediction for both models are assessed and compared with the test data.
4.1. Pressure Distribution
Figure 6 shows variation of pressure in the compression chamber as function of the angle of the
male rotor rotation. Oil is injected at 67°. At 7.0 bar pressure and 6000 RPM, the peak pressure reaches
around 9.0 bar just before the discharge port opens at 260°. Once the port is open, pressure drops in
the discharge port to the outlet pressure of 7.0 bar. Some pulsations are noticed which are similar for
both of the models. The mixture model achieves slightly higher peak pressure, 0.08 bar higher than
the VOF model. This difference is very small compared to the order of magnitude of the peak
pressure.
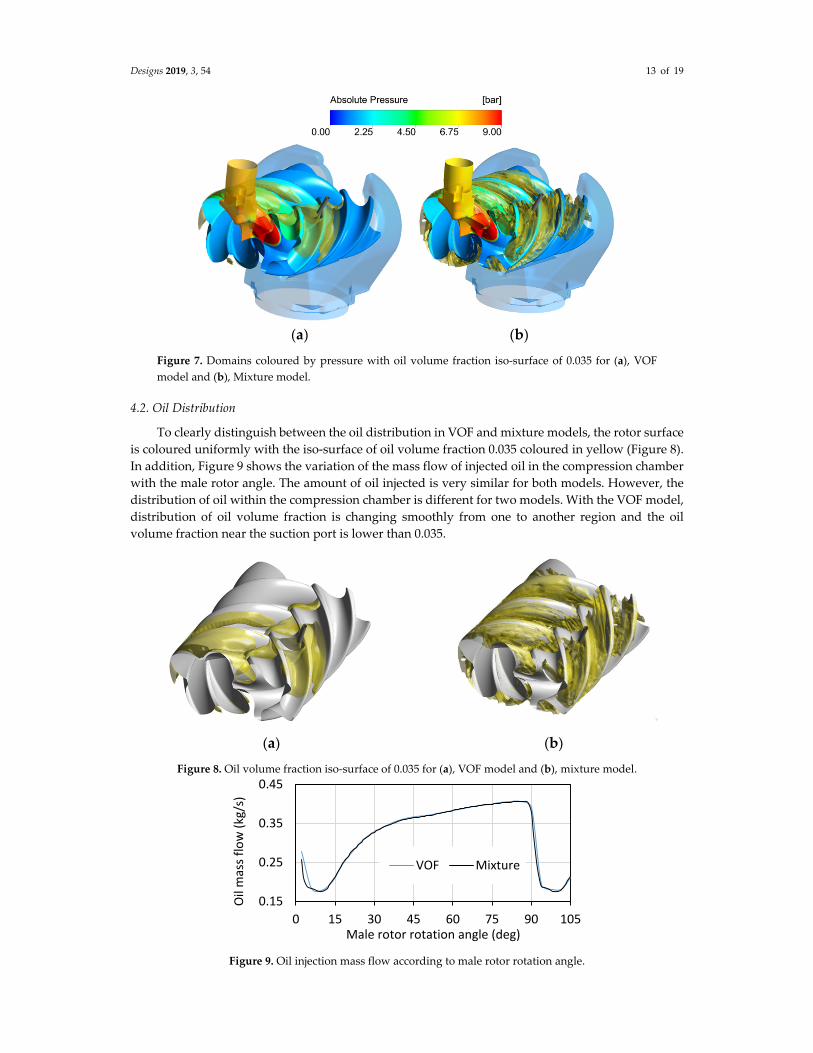
The distribution of pressure on rotors as well as on the port surfaces and the oil iso‐volume
fraction of 0.035 is shown in Figure 7 for both models. The pressure distribution on surfaces is similar
to both models. From the same figure, the distribution of oil is different for VOF and mixture models
which is further discussed in the next section.
Figure 6. Variation in pressure with male rotor angle.
0
2
4
6
8
10
‐100 0 100 200 300 400
Pressure (bara)
Male rotor rotation angle (deg)
VOFMixture
Designs 2019, 3, 54 13 of 19
(a) (b)
Figure 7. Domains coloured by pressure with oil volume fraction iso‐surface of 0.035 for (a), VOF
model and (b), Mixture model.
4.2. Oil Distribution
To clearly distinguish between the oil distribution in VOF and mixture models, the rotor surface
is coloured uniformly with the iso‐surface of oil volume fraction 0.035 coloured in yellow (Figure 8).
In addition, Figure 9 shows the variation of the mass flow of injected oil in the compression chamber
with the male rotor angle. The amount of oil injected is very similar for both models. However, the
distribution of oil within the compression chamber is different for two models. With the VOF model,
distribution of oil volume fraction is changing smoothly from one to another region and the oil
volume fraction near the suction port is lower than 0.035.
(a) (b)
Figure 8. Oil volume fraction iso‐surface of 0.035 for (a), VOF model and (b), mixture model.
Figure 9. Oil injection mass flow according to male rotor rotation angle.
0.15
0.25
0.35
0.45
0 15 30 45 60 75 90 105
Oil mass flow (kg/s)
Male rotor rotation angle (deg)
VOF Mixture
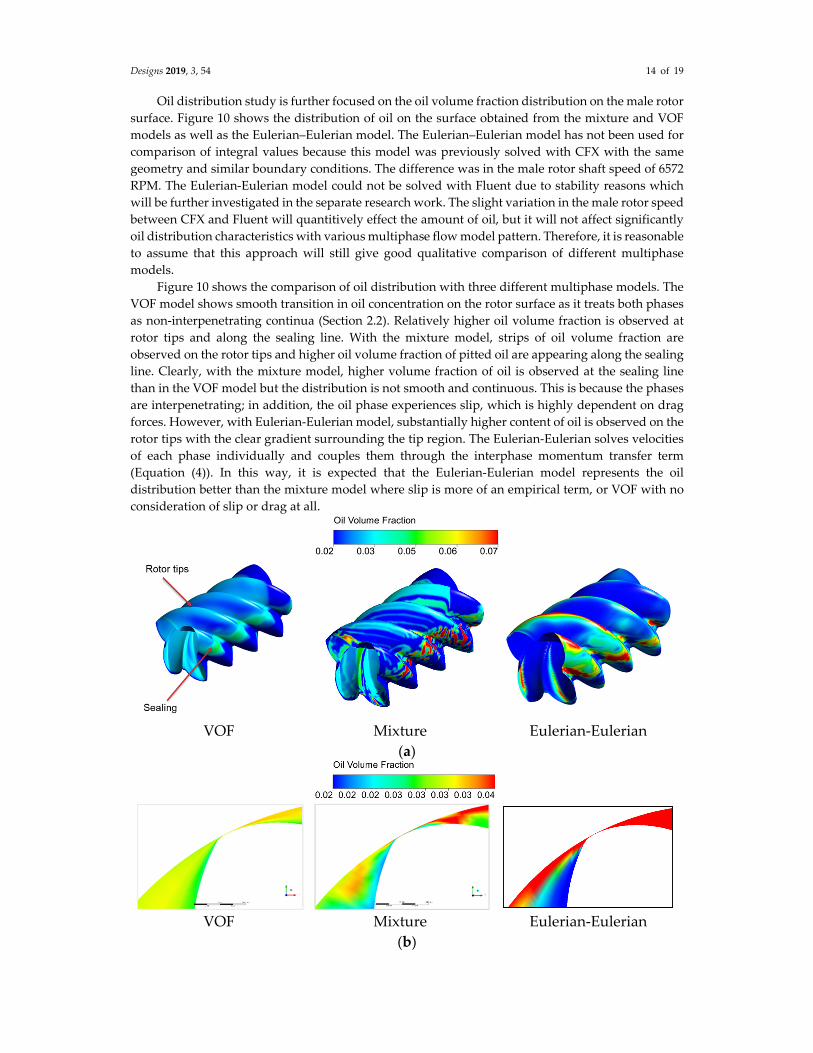
Designs 2019, 3, 54 14 of 19
Oil distribution study is further focused on the oil volume fraction distribution on the male rotor
surface. Figure 10 shows the distribution of oil on the surface obtained from the mixture and VOF
models as well as the Eulerian–Eulerian model. The Eulerian–Eulerian model has not been used for
comparison of integral values because this model was previously solved with CFX with the same
geometry and similar boundary conditions. The difference was in the male rotor shaft speed of 6572
RPM. The Eulerian‐Eulerian model could not be solved with Fluent due to stability reasons which
will be further investigated in the separate research work. The slight variation in the male rotor speed
between CFX and Fluent will quantitively effect the amount of oil, but it will not affect significantly
oil distribution characteristics with various multiphase flow model pattern. Therefore, it is reasonable
to assume that this approach will still give good qualitative comparison of different multiphase
models.
Figure 10 shows the comparison of oil distribution with three different multiphase models. The
VOF model shows smooth transition in oil concentration on the rotor surface as it treats both phases
as non‐interpenetrating continua (Section 2.2). Relatively higher oil volume fraction is observed at
rotor tips and along the sealing line. With the mixture model, strips of oil volume fraction are
observed on the rotor tips and higher oil volume fraction of pitted oil are appearing along the sealing
line. Clearly, with the mixture model, higher volume fraction of oil is observed at the sealing line
than in the VOF model but the distribution is not smooth and continuous. This is because the phases
are interpenetrating; in addition, the oil phase experiences slip, which is highly dependent on drag
forces. However, with Eulerian‐Eulerian model, substantially higher content of oil is observed on the
rotor tips with the clear gradient surrounding the tip region. The Eulerian‐Eulerian solves velocities
of each phase individually and couples them through the interphase momentum transfer term
(Equation (4)). In this way, it is expected that the Eulerian‐Eulerian model represents the oil
distribution better than the mixture model where slip is more of an empirical term, or VOF with no
consideration of slip or drag at all.
VOF Mixture Eulerian‐Eulerian
(a)
VOF Mixture Eulerian‐Eulerian
(b)

Designs 2019, 3, 54 15 of 19
Figure 10. (a), Male rotor surface coloured by oil volume fraction and (b), rotor tips coloured by oil
volume fraction.
Comparing this case with the water flow (in air) over the stepped spill ways taken from literature
[30]. With three different multiphase models, a similar distribution of second phase is observed, as
shown in Figure 11.VOF has a clear interface with none of the two phases mixing with each other,
the mixture model is able to predict mixing of two phases, and lastly the Eulerian‐Eulerian model
better resolves for velocities leading to saturation of water on steps. When compared with
experiments, it was reported that the Eulerian‐Eulerian model best matched experimental
visualisation, the mixture model showing most of the flow features and VOF being least comparable
to experimental visualisation.
(a) (b) (c)
Figure 11. (a) VOF, (b) Mixture, (c) Eulerian‐Eulerian. Water volume fraction over stepped spillways
[30].
4.3. Temperature Distribution
With built‐in Vi of 4.6, the adiabatic discharge temperature of air without oil will be around 420
K. Injecting oil cools the gas substantially. Figure 12 shows variation in the discharge temperature
with both VOF and mixture models. Similar prediction of the discharge temperature is observed for
both models. Therefore, Figure 13 shows similar temperature distribution on the rotor and discharge
port surfaces.
Figure 12. Variation of discharge temperature with male rotor angle
30
40
50
60
70
80
0 15 30 45 60 75 90
Discharge
Temperature (degC)
Male rotor angle (deg)
VOF
Mixture

Designs 2019, 3, 54 16 of 19
(a) (b)
Figure 13. (a) VOF, (b) Mixture. Temperature distribution on rotor surfaces with oil iso‐surface of
volume fraction 0.05.
Both VOF and mixture models are single phase models where cell temperatures are based on
the phase volume fraction averaged in a cell, similar to other properties like density and viscosity.
Distribution of the oil volume fraction based on the phase velocities plays a role in energy
distribution. From one region to another, the change in oil volume fraction and temperature are
observed with both investigated models. The effects of oil on the temperature field are higher in the
mixture model than in VOF.
4.4. Overall Performance with Measurements
Table 4 shows comparison of calculated flow rate and power with the experimentally obtained
data along with the mass imbalance error. Both models are capable of predicting overall values of
flow and power close to measured data with a good mass balance.
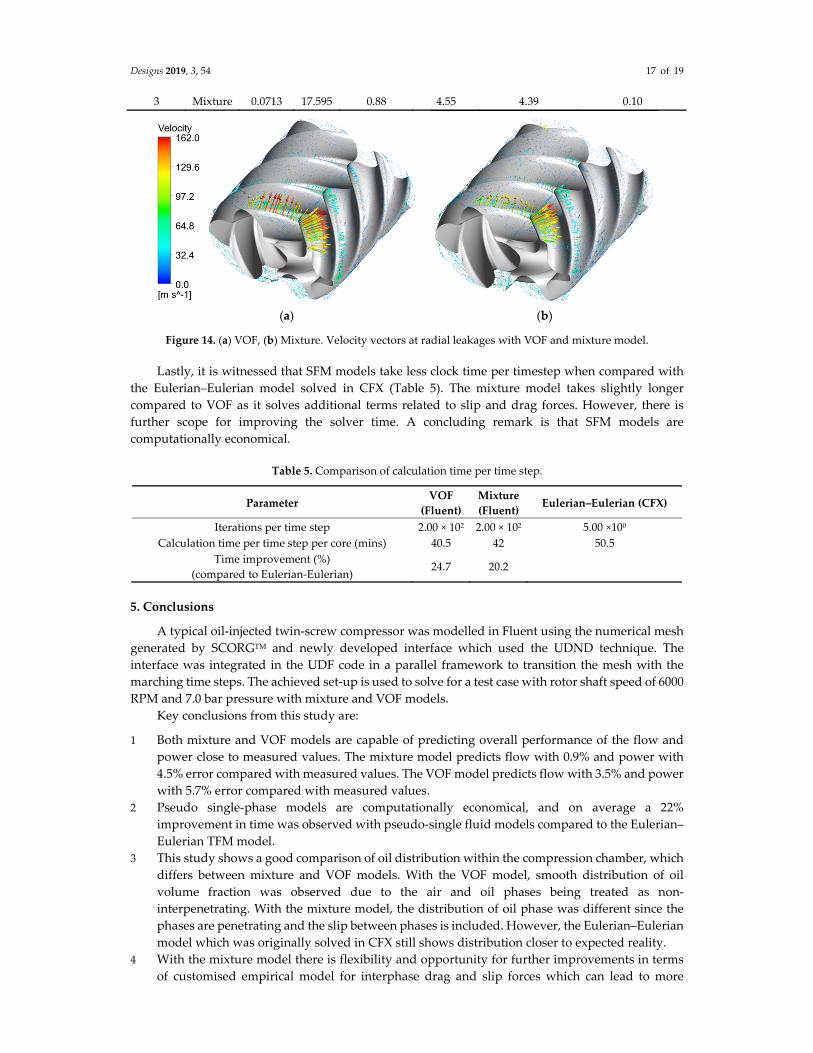
Performance of a helical screw compressor is influenced by the internal gas leakage. Typical
leakages are through the axial, radial and interlobe gaps. According to the leakage areas, radial
leakage will be higher compared to other forms of leakages. Therefore, Figure 14 shows velocity
vectors through the radial gaps. Overall, growth in the magnitude of velocity vectors increase
consecutively from one pressure chamber to another depending on the difference in pressure ratios
between the chambers. Oil has an important tendency to seal leakage gaps. Higher oil volume fraction
is observed in the rotor tips with the mixture model compared to VOF. This oil seals the radial leakage
gaps. Hence, relatively higher radial leakages velocities are observed with VOF compared to the
mixture model. Due to these effects, flow predictions with the mixture model are as close as 0.88%
and with VOF model the difference is 3.46% when compared to experimental value.
Overall, power is slightly better predicted at 4.55% error percentage with the mixture model
than VOF at 5.68% (Table 4). Using a chamber model from SCORG at the same operating conditions,
it was noticed that indicated power is 83% of total power. This estimate is applied for comparison
with the experiment.
Also, it can be noticed that the percentage of mass imbalance is higher with VOF model at 9.54%
leading to higher error in flow prediction at 3.46%.
Table 4. Integral performance results with various models.
Serial
No. Air
Flow Power
Air Flow
Error
Power
Error
Specific Power
Error
Mass Imbalance
Error
(kg/s) (kW) (%) (%) (%) (%)
1 Expt. 0.0706 18.434
2 VOF 0.0682 17.387 −3.46 5.68 2.30 9.54
Designs 2019, 3, 54 17 of 19
3 Mixture 0.0713 17.595 0.88 4.55 4.39 0.10
(a) (b)
Figure 14. (a) VOF, (b) Mixture. Velocity vectors at radial leakages with VOF and mixture model.
Lastly, it is witnessed that SFM models take less clock time per timestep when compared with
the Eulerian–Eulerian model solved in CFX (Table 5). The mixture model takes slightly longer
compared to VOF as it solves additional terms related to slip and drag forces. However, there is
further scope for improving the solver time. A concluding remark is that SFM models are
computationally economical.
Table 5. Comparison of calculation time per time step.
Parameter VOF
(Fluent)
Mixture
(Fluent) Eulerian–Eulerian (CFX)
Iterations per time step 2.00 × 10² 2.00 × 10² 5.00 ×100
Calculation time per time step per core (mins) 40.5 42 50.5
Time improvement (%)
(compared to Eulerian‐Eulerian) 24.7 20.2
5. Conclusions
A typical oil‐injected twin‐screw compressor was modelled in Fluent using the numerical mesh
generated by SCORGTM and newly developed interface which used the UDND technique. The
interface was integrated in the UDF code in a parallel framework to transition the mesh with the
marching time steps. The achieved set‐up is used to solve for a test case with rotor shaft speed of 6000
RPM and 7.0 bar pressure with mixture and VOF models.
Key conclusions from this study are:
1 Both mixture and VOF models are capable of predicting overall performance of the flow and
power close to measured values. The mixture model predicts flow with 0.9% and power with
4.5% error compared with measured values. The VOF model predicts flow with 3.5% and power
with 5.7% error compared with measured values.
2 Pseudo single‐phase models are computationally economical, and on average a 22%
improvement in time was observed with pseudo‐single fluid models compared to the Eulerian–
Eulerian TFM model.
3 This study shows a good comparison of oil distribution within the compression chamber, which
differs between mixture and VOF models. With the VOF model, smooth distribution of oil
volume fraction was observed due to the air and oil phases being treated as non‐
interpenetrating. With the mixture model, the distribution of oil phase was different since the
phases are penetrating and the slip between phases is included. However, the Eulerian–Eulerian
model which was originally solved in CFX still shows distribution closer to expected reality.
4 With the mixture model there is flexibility and opportunity for further improvements in terms
of customised empirical model for interphase drag and slip forces which can lead to more

Designs 2019, 3, 54 18 of 19
realistic oil distribution. The mixture model can be a good replacement for the full Eulerian–
Eulerian models as it is computationally more efficient, but further investigation into better
interphase modelling forces will be required.
Author Contributions: Conceptualization, N.B., A.K. and S.R.; methodology, N.B. and A.K.; software, N.B. and
SR.; writing—original draft preparation, N.B; writing—review and editing, A.K., S.R.; supervision, A.K.; project
administration, A.K.; funding acquisition, A.K.
Funding: This research was funded by the Centre for Compressor Technology at City, University of London.
Conflicts of Interest: The authors declare no conflict of interest.
References
1. Stosic, N.; Smith, I.; Kovacevic, A.; Mujic, E. Three Decades of Modern Practice in Screw Compressors. In
Proceedings of the International Compressor Engineering Conference, Purdue, IN, USA, 12–15 July 2010.
2. Wood, L. Screw Compressor Market 2017—Global Forecast to 2021. Research and Markets. Available
online: https://www.globenewswire.com/news‐release/2017/01/26/911099/0/en/Global‐Screw‐
Compressor‐Market‐2017‐2021‐Atlas‐Copco‐Ingersoll‐Rand‐GE‐Oil‐Gas‐Gardner‐Denver‐and‐Siemens‐
Lead‐the‐11‐Billion‐Market.html (accessed on 26 January 2017)
3. Abdan, S.; Basha, N.; Kovacevic, A.; Stosic, N.; Birari, A.; Asati, N. Development and Design of Energy
Efficient Oil‐Flooded Screw Compressors. In IOP Conference Series: Materials Science and Engineering; IOP
Publishing: Bristol, UK, 2019; Volume 604.
4. Deipenwisch, R.; Kauder, K. Oil as a design parameter in screw‐type compressors: Oil distribution and
power losses caused by oil in the working chamber of a screw‐type compressor. In Proceedings of the
International Conference on Compressor and their Systems, London, UK, 13–15 September 1999; pp. 49–
58.
5. Singh, P.; Bowman, J. Heat Transfer in Oil‐Flooded Screw Compressors. In Proceedings of the International
Compressor Engineering Conference, West Lafayette, IN, USA, 4–7 August 1986; pp. 135–153.
6. Stošic, N.; Milutinović, L.; Hanjalić, K.; Kovačević, A. Investigation of the influence of oil injection upon the
screw compressor working process. Int. J. Refrig. 1992, 15, 206–220.
7. Peng, X.; Xing, Z.; Cui, T.; Shu, P. Experimental Study of Oil Injection and Its Effect On Performance of
Twin Screw Compressors. In Proceedings of the International Compressor Engineering Conference, West
Lafayette, IN, USA, 25–28 July 2000.
8. De Paepe, M.; Bogaert, W.; Mertens, D. Cooling of oil injected screw compressors by oil atomisation. Appl.
Therm. Eng. 2005, 25, 2764–2779.
9. Basha, N.; Kovacevic, A.; Stosic, N.; Smith, I. Effect of oil‐injection on twin screw compressor performance.
In IOP Conference Series: Materials Science and Engineering; IOP Publishing: Bristol, UK, 2018.
10. Kovacevic, A. Three‐Dimensional Numerical Analysis for Flow Prediction in Positive Displacement Screw
Machines. Ph.D. Thesis, City University London, Lodon, UK, 2002.
11. Kovacevic, A. Boundary adaptation in grid generation for CFD analysis of screw compressors. Int. J. Numer.
Methods Eng. 2005, 64, 401–426.
12. Kovacevic, A.; Stosic, N.; Smith, I. Screw Compressors: Three Dimensional Computational Fluid Dynamics
and Solid Fluid Interaction; Springer: Berlin, Germany, 2005.
13. Kovacevic, A.; Rane, S.; Stosic, N.; Jiang, Y.; Furmanczyk, M.; Lowry, S. Influence of approaches in CFD
Solvers on Performance Prediction in Screw Compressors. In Proceedings of the International Compressor
Engineering Conference, Purdue, IN, USA, 14–17 July 2014.
14. Kovacevic, A.; Rane, S. Algebraic generation of single domain computational grid for twin screw machines
Part II—Validation. Adv. Eng. Softw. 2017, 109, 31–43.
15. Rane, S.; Kovacevic, A.; Stosic, N. CFD Analysis of Oil Flooded Twin Screw Compressors. In Proceedings
of the 23rd International Compressor Engineering Conference, West Lafayette, IN, USA, 11–14 July 2016.
16. Basha, N.; Rane, S.; Kovacevic, A. Multiphase Flow Analysis in Oil‐injected Twin Screw Compressor. In
Proceedings of the 3rd International Conference on Multiphase Flow and Heat Transfer, Budapest,
Hungary, 12–14 April 2018.
17. Yeoh, G.H.; Barber, T. Assessment of interface capturing methods in Computational Fluid Dynamics (CFD)
codes—A case study. J. Comput. Multiph. Flows 2009, 1, 201–215.
Designs 2019, 3, 54 19 of 19
18. Ding, H.; Jiang, Y. CFD simulation of a screw compressor with oil injection. In Proceedings of the 10th
International Conference on Compressors and their Systems, London, UK, 11–13 September 2017.
19. Randi, S.; Suman, A.; Casari, N.; Pinelli, M.; Ziviani, D. Numerical analysis of oil injection effects in a single
screw expander. In IOP Conference Series: Materials Science and Engineering; IOP Publishing: Bristol, UK,
2018.
20. Papes, I.; Degroote, J.; Vierendeels, J. 3D CFD Analysis of an Oil Injected Twin Screw Expander. In ASME
2013 International Mechanical Engineering Congress and Exposition IMECE2013; Fairfield, CT, USA; 15–21
November 2014.
21. Manik, J.; Dalal, A.; Natarajan, G. International Journal of Multiphase Flow A generic algorithm for three‐
dimensional multiphase flows on unstructured meshes. Int. J. Multiph. Flow 2018, 106, 228–242.
22. Fluent, A. ANSYS Fluent 12.0 User’s Guide; Ansys Inc.: Pittsburgh, PA, USA, 2009; Volume 15317; pp. 1–
2498.
23. Ubbink, O.; Issa, R.I. A Method for Capturing Sharp Fluid Interfaces on Arbitrary Meshes. J. Comput. Phys.
1999, 153, 26–50.
24. Kallio, S.; Akademi, A. On the Mixture Model for Multiphase Flow; VTT: Espoo, Finland, 1996; Volume 288.
25. Bianchi, G.; Rane, S.; Kovacevic, A.; Cipollone, R. Deforming grid generation for numerical simulations of
fluid dynamics in sliding vane rotary machines. Adv. Eng. Softw. 2017, 112, 180–191.
26. Basha, N.; Kovacevic, A.; Rane, S. User defined nodal displacement of numerical mesh for analysis of screw
machines in FLUENT. In IOP Conference Series: Materials Science and Engineering; IOP Publishing: Bristol,
UK, 2019; Volume 604.
27. Lu, Y.; Kovacevic, A.; Basha, N.; Read, M. CFD Analysis of Twin Screw Vacuum Pump. In Proceedings of
the 9th International Conference on Compressor and Refrigeration, Xi′an, China, 10–12 July 2019.
28. Lu, Y.; Kovacevic, A.; Read, M.; Basha, N. Numerical Study of Customised Mesh for Twin Screw Vacuum
Pumps. Designs 2019, 3, 1–18.
29. Bannari, R.; Kerdouss, F.; Selma, B.; Bannari, A; Proulx, P;. Three‐dimensional mathematical modelling of
dispersed two‐phase flow using class method of population balance in bubble columns. Comput. Chem. Eng.
2008, 32, 3224‐3237.
30. Van Alwon, J.; Borman, D.; Sleigh, A.; Kapur, N.I.K. Experimental and numerical modelling of aerated
flows over stepped spillways. In Proceedings of IAHR 2017 37th IAHR World Congress, Kuala Lumpur,
Malaysia, 13–18 August 2017.
© 2019 by the authors. Licensee MDPI, Basel, Switzerland. This article is an open access
article distributed under the terms and conditions of the Creative Commons Attribution
(CC BY) license (http://creativecommons.org/licenses/by/4.0/).