Identification of Even-Order Harmonics Injected by ... - MDPI
18
Citation: Brandis, A.; Pelin, D.; Klai´ c, Z.; Šljivac, D. Identification of Even-Order Harmonics Injected by Semiconverter into the AC Grid. Energies 2022, 15, 1614. https:// doi.org/10.3390/en15051614 Academic Editor: Boštjan Blaži´ c Received: 7 January 2022 Accepted: 18 February 2022 Published: 22 February 2022 Publisher’s Note: MDPI stays neutral with regard to jurisdictional claims in published maps and institutional affil- iations. Copyright: © 2022 by the authors. Licensee MDPI, Basel, Switzerland. This article is an open access article distributed under the terms and conditions of the Creative Commons Attribution (CC BY) license (https:// creativecommons.org/licenses/by/ 4.0/). energies Article Identification of Even-Order Harmonics Injected by Semiconverter into the AC Grid Andrej Brandis *, Denis Pelin , Zvonimir Klai´ c and Damir Šljivac Faculty of Electrical Engineering, Computer Science and Information Technology Osijek, Josip Juraj Strossmayer University of Osijek, 31000 Osijek, Croatia; [email protected] (D.P.); [email protected] (Z.K.); [email protected] (D.Š.) * Correspondence: [email protected] Abstract: In this study, the feedback effects of a three-phase half-controlled rectifier (also known as a semiconverter) to three-phase AC power grid was analyzed. Special attention was paid to the identification of harmonic order of the phase current. As a reference point for analysis, the mathematical model of an uncontrolled rectifier was used. The harmonic order of the phase current was identified by displaying the measurement results as well as using a mathematical model that is easily applicable, although this is unusual for harmonic analysis because it is based on time domain data. For this purpose, laboratory models of uncontrolled and half-controlled rectifiers were assembled. For both converters, the results obtained by practical laboratory measurements were compared to the mathematically obtained results, with the commutation in the mathematical model being ignored. The effects of commutation were analyzed in more detail for the laboratory model. For the semiconverter, the characteristic waveforms were studied for few different firing angles of the thyristor. Additionally, total power factor and total harmonic distortion of phase current were determined for all chosen firing angles. Finally, a comprehensive conclusion was drawn based on theoretically and practically obtained results on the appearance of even-order current harmonics, which should be taken into consideration when designing input filters and which contributes to power quality of the AC power grid. Keywords: half-controlled rectifier; semiconverter; power quality; even-order current harmonics; mathematical model; u–i characteristic; harmonic analysis 1. Introduction The use of the power electronic (PE) converters is now widespread in the world, including domestic and industry power supplies, motor drives, and emerging applications such as renewables, energy storage, hybrid and electrical vehicles, etc. [1]. Such ubiquitous penetration of PE in all segments of modern industry increases certain unwanted occur- rences regarding power quality (PQ) in the AC power grid, as presented, for example, in [2,3]. These occurrences are the consequences of three main issues. The first issue is nonlinearity of the switching components, which results in a distorted current (current with higher-order harmonic content) that is directly related to the appearance of higher voltage harmonics in the AC network [4]. The second issue is related to the commuta- tion of the converter components, which results in periodic voltage dips [5]. Finally, the third issue is the appearance of even-order harmonics in half-controlled rectifiers, which can result in asymmetry of the AC voltage (e.g., DC magnetic bias phenomenon in AC transformers) [6]. Furthermore, issues regarding PQ require careful study and monitoring of the impact of each disturbance type produced by PE converters [7]. Most DC loads are connected to the power grid using some type of PE converter. If the observed energy flow is from the AC grid to the DC load, the commonly used converters are AC to DC converters, also commonly known as rectifiers. Among all types of PE converters, these Energies 2022, 15, 1614. https://doi.org/10.3390/en15051614 https://www.mdpi.com/journal/energies
-
Upload
khangminh22 -
Category
Documents
-
view
0 -
download
0
Transcript of Identification of Even-Order Harmonics Injected by ... - MDPI

Citation: Brandis, A.; Pelin, D.; Klaic,
Z.; Šljivac, D. Identification of
Even-Order Harmonics Injected by
Semiconverter into the AC Grid.
Energies 2022, 15, 1614. https://
doi.org/10.3390/en15051614
Academic Editor: Boštjan Blažic
Received: 7 January 2022
Accepted: 18 February 2022
Published: 22 February 2022
Publisher’s Note: MDPI stays neutral
with regard to jurisdictional claims in
published maps and institutional affil-
iations.
Copyright: © 2022 by the authors.
Licensee MDPI, Basel, Switzerland.
This article is an open access article
distributed under the terms and
conditions of the Creative Commons
Attribution (CC BY) license (https://
creativecommons.org/licenses/by/
4.0/).
energies
Article
Identification of Even-Order Harmonics Injected bySemiconverter into the AC GridAndrej Brandis *, Denis Pelin , Zvonimir Klaic and Damir Šljivac
Faculty of Electrical Engineering, Computer Science and Information Technology Osijek, Josip Juraj StrossmayerUniversity of Osijek, 31000 Osijek, Croatia; [email protected] (D.P.); [email protected] (Z.K.);[email protected] (D.Š.)* Correspondence: [email protected]
Abstract: In this study, the feedback effects of a three-phase half-controlled rectifier (also knownas a semiconverter) to three-phase AC power grid was analyzed. Special attention was paid tothe identification of harmonic order of the phase current. As a reference point for analysis, themathematical model of an uncontrolled rectifier was used. The harmonic order of the phase currentwas identified by displaying the measurement results as well as using a mathematical model thatis easily applicable, although this is unusual for harmonic analysis because it is based on timedomain data. For this purpose, laboratory models of uncontrolled and half-controlled rectifiers wereassembled. For both converters, the results obtained by practical laboratory measurements werecompared to the mathematically obtained results, with the commutation in the mathematical modelbeing ignored. The effects of commutation were analyzed in more detail for the laboratory model.For the semiconverter, the characteristic waveforms were studied for few different firing angles ofthe thyristor. Additionally, total power factor and total harmonic distortion of phase current weredetermined for all chosen firing angles. Finally, a comprehensive conclusion was drawn based ontheoretically and practically obtained results on the appearance of even-order current harmonics,which should be taken into consideration when designing input filters and which contributes topower quality of the AC power grid.
Keywords: half-controlled rectifier; semiconverter; power quality; even-order current harmonics;mathematical model; u–i characteristic; harmonic analysis
1. Introduction
The use of the power electronic (PE) converters is now widespread in the world,including domestic and industry power supplies, motor drives, and emerging applicationssuch as renewables, energy storage, hybrid and electrical vehicles, etc. [1]. Such ubiquitouspenetration of PE in all segments of modern industry increases certain unwanted occur-rences regarding power quality (PQ) in the AC power grid, as presented, for example,in [2,3]. These occurrences are the consequences of three main issues. The first issue isnonlinearity of the switching components, which results in a distorted current (currentwith higher-order harmonic content) that is directly related to the appearance of highervoltage harmonics in the AC network [4]. The second issue is related to the commuta-tion of the converter components, which results in periodic voltage dips [5]. Finally, thethird issue is the appearance of even-order harmonics in half-controlled rectifiers, whichcan result in asymmetry of the AC voltage (e.g., DC magnetic bias phenomenon in ACtransformers) [6]. Furthermore, issues regarding PQ require careful study and monitoringof the impact of each disturbance type produced by PE converters [7]. Most DC loadsare connected to the power grid using some type of PE converter. If the observed energyflow is from the AC grid to the DC load, the commonly used converters are AC to DCconverters, also commonly known as rectifiers. Among all types of PE converters, these
Energies 2022, 15, 1614. https://doi.org/10.3390/en15051614 https://www.mdpi.com/journal/energies

Energies 2022, 15, 1614 2 of 18
produce most noticeable current harmonics, which may reflect the RMS value of the phasevoltage, thus creating potential PQ problems in the AC grid [1]. According to [8], this typeof converters can be classified into two major groups according to the phase number (withsingle-phase and three-phase being the most common) and the output voltage waveform(half-wave or full-wave). Furthermore, rectifiers can be classified as uncontrolled (diode)rectifiers, semiconverters (half-controlled phase rectifiers), and phase-controlled (fullycontrolled) rectifiers.
Uncontrolled rectifiers have a fixed output voltage and are the simplest rectifiersas they do not need any additional control circuit for operation. Semiconverters consistof a combination of diodes and thyristors, while phase-controlled rectifiers have onlythyristors [9,10]. The output voltage of these converters can be controlled via gate controlby changing the fire angle of the thyristor [11]. Compared to a phase-controlled rectifier,the complexity and cost of a control circuit can be greatly reduced for semiconverters,mostly due to implementation of a simpler control logic. Therefore, semiconverters maybe more attractive in applications where only a single quadrant operation is required andwhere feed of industrial loads up to several hundred kilowatts is needed [12]. However,semiconverters have some drawbacks regarding feedback influence on the AC powergrid. In particular, semiconverters generate an excessive amount of even-order currentharmonics, which are injected into the AC power grid, the effects of which are unwantedas many research papers have stated [13–21]. For example, when semiconverters werefirst introduced to industries, Duff and Ludbrook presented [13] the problems associatedwith them being used in high-power DC armature applications. Zander [14] presented theproblem of reactive power production by thyristor rectifiers used in electrical drives. Smithand Stratford [15] presented the problem of current harmonic injection to the power grid inspecific cement plant facilities where thyristor rectifiers were utilized.
The issue of even-order harmonic generation associated with semiconverters has alsobeen investigated and presented in a few research papers. Tang and Melhorn [12] discussedthe basics of even-order harmonic generation by semiconverters. The same problem waspresented by Mansoor et al. [16] with a case study of multiple semiconverters used asheater drives in one industrial facility. Buddingh [17] discussed how even-order currentharmonics (in this case mainly the fourth) in the power grid can cause the unusual problemof even harmonic resonance. Problems regarding current harmonic spectrum and thesecond harmonic, which is studied in the present paper, are given in [18–21]. The effects ofsemiconverters on the AC grid are so significant that Orr and Emanuel [21] recommendedrestriction (or even a ban) of semiconverter use in industries.
Even-order current harmonics produced by semiconverters can be reduced to someextent through the implementation of PWM, as presented in [22], or by installing somesort of filtering on the AC side, as presented in [23]. However, the problem here is theprice of the technical solution, which can easily exceed the price of using different kinds ofPE converters. Although the use of semiconverters today is greatly reduced (largely dueto DC motors being replaced by AC motors), they are still in use in some form, as noted,for example, in [24–31]. Apart from industrial applications, semiconverters can be usedfor research purposes where harmonics (especially the second) are of interest. One suchexample is the work by Goh et al. [20], where semiconverters were used to investigate theissue of voltage flicker.
In this study, a procedure is proposed that identifies the occurrence of harmonic orderin phase current (without conducting spectral analysis measurements) based on mutualcomparison of phase voltage and current. The u–i characteristic is introduced as an easilyapplicable way of presenting the measurement results, with the shape and position in thephase plane indicating the evenness/oddness of phase current harmonics. The unilateralor bilateral property of the u–i characteristic can be related to the order of appearance ofcurrent harmonics, while the described u–i characteristic area can be linked to the reactivepower produced. The u–i characteristic is not a new concept. It is generally used in networktheory to determine the properties of network elements, especially dissipative elements
Energies 2022, 15, 1614 3 of 18
(e.g., nonlinearity/linearity, passivity/activity, etc.) [32]. However, in rectifiers, the u–icharacteristic can be used as a PQ indicator. According to the reviewed literature, the u–icharacteristic has not been utilized in harmonic identification so far.
The rest of the paper is organized into five sections. An introduction to the topic andliterature review of semiconverter issues, starting from early research to today, is given inSection 1. The mathematical model of an uncontrolled rectifier, which is used as a referencepoint to properly understand the u–i characteristics of a semiconverter, is presented inSection 2. Section 3 presents an analysis of the mathematical model of a semiconverter.In Section 4, analyses of the current harmonics, power components, and power factor aregiven. Laboratory measurements conducted on the real assembled uncontrolled rectifierand three-phase semiconverter are presented and discussed in Section 5. Finally, concludingremarks are made in Section 6.
2. Mathematical Model of an Uncontrolled Rectifier
To understand how a three-phase semiconverter operates and to have a reference pointof u–i characteristics, it is essential to begin with analysis of a three-phase uncontrolledrectifier. The analysis of an uncontrolled rectifier is well known and given in most booksdealing with this issue. Therefore, only the essential expressions and waveforms are givenbelow to analyze the current harmonic spectrum, which is the main focus of this study.
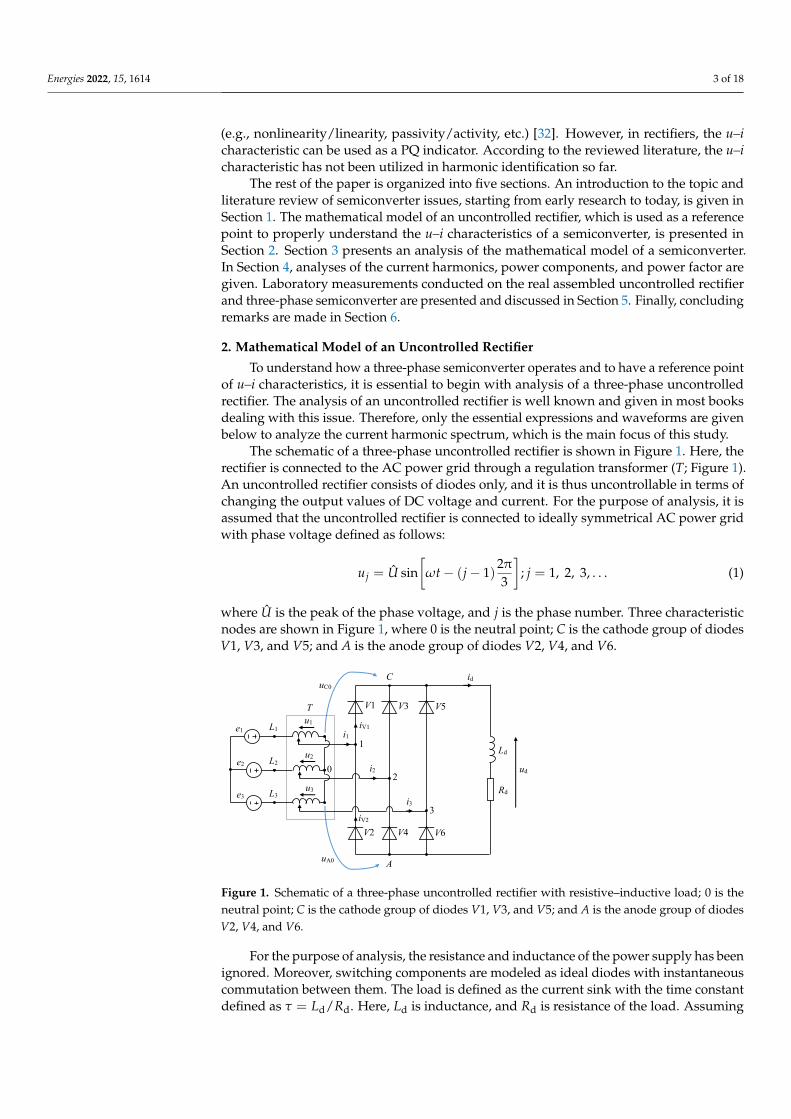
The schematic of a three-phase uncontrolled rectifier is shown in Figure 1. Here, therectifier is connected to the AC power grid through a regulation transformer (T; Figure 1).An uncontrolled rectifier consists of diodes only, and it is thus uncontrollable in terms ofchanging the output values of DC voltage and current. For the purpose of analysis, it isassumed that the uncontrolled rectifier is connected to ideally symmetrical AC power gridwith phase voltage defined as follows:
uj = U sin[
ωt− (j− 1)2π3
]; j = 1, 2, 3, . . . (1)
where U is the peak of the phase voltage, and j is the phase number. Three characteristicnodes are shown in Figure 1, where 0 is the neutral point; C is the cathode group of diodesV1, V3, and V5; and A is the anode group of diodes V2, V4, and V6.
Energies 2022, 15, x FOR PEER REVIEW 3 of 19
elements (e.g., nonlinearity/linearity, passivity/activity, etc.) [32]. However, in rectifiers, the u–i characteristic can be used as a PQ indicator. According to the reviewed literature, the u–i characteristic has not been utilized in harmonic identification so far.
The rest of the paper is organized into five sections. An introduction to the topic and literature review of semiconverter issues, starting from early research to today, is given in Section 1. The mathematical model of an uncontrolled rectifier, which is used as a refer-ence point to properly understand the u–i characteristics of a semiconverter, is presented in Section 2. Section 3 presents an analysis of the mathematical model of a semiconverter. In Section 4, analyses of the current harmonics, power components, and power factor are given. Laboratory measurements conducted on the real assembled uncontrolled rectifier and three-phase semiconverter are presented and discussed in Section 5. Finally, conclud-ing remarks are made in Section 6.
2. Mathematical Model of an Uncontrolled Rectifier To understand how a three-phase semiconverter operates and to have a reference
point of u–i characteristics, it is essential to begin with analysis of a three-phase uncon-trolled rectifier. The analysis of an uncontrolled rectifier is well known and given in most books dealing with this issue. Therefore, only the essential expressions and waveforms are given below to analyze the current harmonic spectrum, which is the main focus of this study.
The schematic of a three-phase uncontrolled rectifier is shown in Figure 1. Here, the rectifier is connected to the AC power grid through a regulation transformer (T; Figure 1). An uncontrolled rectifier consists of diodes only, and it is thus uncontrollable in terms of changing the output values of DC voltage and current. For the purpose of analysis, it is assumed that the uncontrolled rectifier is connected to ideally symmetrical AC power grid with phase voltage defined as follows: 𝑢 = 𝑈 sin 𝜔𝑡 − (𝑗 − 1) 2π3 ; 𝑗 = 1, 2, 3, … (1)
where 𝑈 is the peak of the phase voltage, and 𝑗 is the phase number. Three characteristic nodes are shown in Figure 1, where 0 is the neutral point; C is the cathode group of diodes V1, V3, and V5; and A is the anode group of diodes V2, V4, and V6.
iV1 i1
iV2
id
V4 V2
V3 V1
Ld
Rd
ud
V6
V5
1
2
3
C
A
uC0
uA0
i2
i3
u1
u2
u3
e1
e2
e3
L1
L2
L3
0
T
Figure 1. Schematic of a three-phase uncontrolled rectifier with resistive–inductive load; 0 is the neutral point; C is the cathode group of diodes V1, V3, and V5; and A is the anode group of diodes V2, V4, and V6.
Figure 1. Schematic of a three-phase uncontrolled rectifier with resistive–inductive load; 0 is theneutral point; C is the cathode group of diodes V1, V3, and V5; and A is the anode group of diodesV2, V4, and V6.
For the purpose of analysis, the resistance and inductance of the power supply has beenignored. Moreover, switching components are modeled as ideal diodes with instantaneouscommutation between them. The load is defined as the current sink with the time constantdefined as τ = Ld/Rd. Here, Ld is inductance, and Rd is resistance of the load. Assuming

Energies 2022, 15, 1614 4 of 18
that τ T/6, the current sink will maintain the current Id smoothed with the currentamount is as follows [8]:
Id =3√
3π·Rd
∧U (2)
Taking into consideration all assumptions given above, the typical waveforms of themathematical model of an uncontrolled rectifier can be created, as illustrated in Figure 2.
Energies 2022, 15, x FOR PEER REVIEW 4 of 19
For the purpose of analysis, the resistance and inductance of the power supply has been ignored. Moreover, switching components are modeled as ideal diodes with instan-taneous commutation between them. The load is defined as the current sink with the time constant defined as 𝜏 = 𝐿 /𝑅 . Here, 𝐿 is inductance, and 𝑅 is resistance of the load. Assuming that 𝜏 ≫ 𝑇 6⁄ , the current sink will maintain the current 𝐼 smoothed with the current amount is as follows [8]: 𝐼 = 3√3π ∙ 𝑅 𝑈∧ (2)
Taking into consideration all assumptions given above, the typical waveforms of the mathematical model of an uncontrolled rectifier can be created, as illustrated in Figure 2.
uA0
i1
V4 V6 V4
V1 V3 V5
V2
0
u3
3π
u2
3π5
u1
ωt
UC0
3π2 3π4 π2
3π2 Id
Id
ωt
ud
Conduction intervals
π2
uV1
0
0 ωt
uV1
ud
√2U
Figure 2. Typical waveforms of the mathematical model of a three-phase uncontrolled rectifier.
As can be seen from Figure 2, the uncontrolled rectifier has symmetrical waveforms of phase current covering half of the voltage period. Specifically, symmetry refers to the first zero instance of the corresponding phase voltage. This observation should be noted before the concept of mutual phase voltage and current display is introduced.
Concept of u–i Characteristic The u–i characteristic can be obtained if the characteristics of the current and voltage
are shown in the phase plane. A typical u–i characteristic (phase 1; Figure 1), along with the corresponding waveforms of phase current and voltage, is shown in Figure 3.
Figure 2. Typical waveforms of the mathematical model of a three-phase uncontrolled rectifier.
As can be seen from Figure 2, the uncontrolled rectifier has symmetrical waveforms ofphase current covering half of the voltage period. Specifically, symmetry refers to the firstzero instance of the corresponding phase voltage. This observation should be noted beforethe concept of mutual phase voltage and current display is introduced.
Concept of u–i Characteristic
The u–i characteristic can be obtained if the characteristics of the current and voltageare shown in the phase plane. A typical u–i characteristic (phase 1; Figure 1), along withthe corresponding waveforms of phase current and voltage, is shown in Figure 3.
Energies 2022, 15, x FOR PEER REVIEW 5 of 19
(a) (b)
i1
π/3 ωt 2π/3
Id
Id
0
u1
√2U
π 4π/3 5π/3 2π
π/3 ωt 2π/3 0 π
4π/3 5π/3
2π A
B
C
D
Figure 3. Typical voltage and current waveforms (a) and corresponding u−i characteristic (b) of an uncontrolled rectifier of phase 1.
Here, selected significant points A–D on the u–i characteristic (Figure 3b) corre-sponds to the voltage and current waveforms (Figure 3a). The starting point for analysis is A. The u–i characteristic (Figure 3b) is symmetrical and distinctly shaped with respect to the origin of the coordination system. This characteristic is also called bilateral.
Similarly, the same procedure of analysis can be applied on a fully controlled recti-fier, where the property of bilateral characteristic is also valid.
3. Mathematical Model of a Semiconverter A three-phase semiconverter (Figure 4) consists of series combination of a controlled
three-phase half-wave converter with common cathode (C) and an uncontrolled half-wave rectifier with common anode (A). The upper bridge is phase-controlled with thyris-tors (V1, V3, and V5) as the main switching components, while the lower bridge is uncon-trolled and is built with diodes (V2, V4, and V6), as shown in Figure 4. The thyristor is a three-terminal semiconductor device where the on-state can be controlled by the gate ter-minal, while the off-state is not controllable [33]. When the gate signal is applied on a thyristor, the thyristor latches the current and stays in the on-state mode until the anode current falls below the holding point. Such control allows thyristors to be used in semi-converters as switching devices that can be turned on at a specific instant.
iV1 i1
iV2
id
V4 V2
V3 V1
Ld
Rd
ud
V6
V5
1
2
3
C
A
uC0
uA0
i2
i3
u1
u2
u3
e1
e2
e3
L1
L2
L3
0
T
Figure 4. Schematic of a three-phase semiconverter with resistive–inductive load; 0 is the neutral point; C is the cathode group of thyristors V1, V3, and V5; and A is the anode group of diodes V2, V4, and V6.
i1
u1
Id
-Id
A
B
C
D
¿¿− U U
Figure 3. Typical voltage and current waveforms (a) and corresponding u–i characteristic (b) of anuncontrolled rectifier of phase 1.
Here, selected significant points A–D on the u–i characteristic (Figure 3b) correspondsto the voltage and current waveforms (Figure 3a). The starting point for analysis is A. The

Energies 2022, 15, 1614 5 of 18
u–i characteristic (Figure 3b) is symmetrical and distinctly shaped with respect to the originof the coordination system. This characteristic is also called bilateral.
Similarly, the same procedure of analysis can be applied on a fully controlled rectifier,where the property of bilateral characteristic is also valid.
3. Mathematical Model of a Semiconverter
A three-phase semiconverter (Figure 4) consists of series combination of a controlledthree-phase half-wave converter with common cathode (C) and an uncontrolled half-waverectifier with common anode (A). The upper bridge is phase-controlled with thyristors (V1,V3, and V5) as the main switching components, while the lower bridge is uncontrolled andis built with diodes (V2, V4, and V6), as shown in Figure 4. The thyristor is a three-terminalsemiconductor device where the on-state can be controlled by the gate terminal, while theoff-state is not controllable [33]. When the gate signal is applied on a thyristor, the thyristorlatches the current and stays in the on-state mode until the anode current falls below theholding point. Such control allows thyristors to be used in semiconverters as switchingdevices that can be turned on at a specific instant.
Energies 2022, 15, x FOR PEER REVIEW 5 of 19
(a) (b)
i1
π/3 ωt 2π/3
Id
Id
0
u1
√2U
π 4π/3 5π/3 2π
π/3 ωt 2π/3 0 π
4π/3 5π/3
2π A
B
C
D
Figure 3. Typical voltage and current waveforms (a) and corresponding u−i characteristic (b) of an uncontrolled rectifier of phase 1.
Here, selected significant points A–D on the u–i characteristic (Figure 3b) corre-sponds to the voltage and current waveforms (Figure 3a). The starting point for analysis is A. The u–i characteristic (Figure 3b) is symmetrical and distinctly shaped with respect to the origin of the coordination system. This characteristic is also called bilateral.
Similarly, the same procedure of analysis can be applied on a fully controlled recti-fier, where the property of bilateral characteristic is also valid.
3. Mathematical Model of a Semiconverter A three-phase semiconverter (Figure 4) consists of series combination of a controlled
three-phase half-wave converter with common cathode (C) and an uncontrolled half-wave rectifier with common anode (A). The upper bridge is phase-controlled with thyris-tors (V1, V3, and V5) as the main switching components, while the lower bridge is uncon-trolled and is built with diodes (V2, V4, and V6), as shown in Figure 4. The thyristor is a three-terminal semiconductor device where the on-state can be controlled by the gate ter-minal, while the off-state is not controllable [33]. When the gate signal is applied on a thyristor, the thyristor latches the current and stays in the on-state mode until the anode current falls below the holding point. Such control allows thyristors to be used in semi-converters as switching devices that can be turned on at a specific instant.
iV1 i1
iV2
id
V4 V2
V3 V1
Ld
Rd
ud
V6
V5
1
2
3
C
A
uC0
uA0
i2
i3
u1
u2
u3
e1
e2
e3
L1
L2
L3
0
T
Figure 4. Schematic of a three-phase semiconverter with resistive–inductive load; 0 is the neutral point; C is the cathode group of thyristors V1, V3, and V5; and A is the anode group of diodes V2, V4, and V6.
i1
u1
Id
-Id
A
B
C
D
¿¿− U U
Figure 4. Schematic of a three-phase semiconverter with resistive–inductive load; 0 is the neutralpoint; C is the cathode group of thyristors V1, V3, and V5; and A is the anode group of diodes V2, V4,and V6.
A firing (delay) angle α can easily be described as a delay between the instance whenthe diode would naturally start to conduct (if thyristors are replaced with diodes) andthe instance where the thyristor actually starts to conduct [11], as shown in Figure 5.The schematic of a semiconverter is shown in Figure 4. Due to mutual comparability,the semiconverter is connected to the AC power grid through a regulation transformer(T; Figure 4) in the same manner as an uncontrolled rectifier (T; Figure 1).
Energies 2022, 15, x FOR PEER REVIEW 6 of 19
A firing (delay) angle 𝛼 can easily be described as a delay between the instance when the diode would naturally start to conduct (if thyristors are replaced with diodes) and the instance where the thyristor actually starts to conduct [11], as shown in Figure 5. The schematic of a semiconverter is shown in Figure 4. Due to mutual comparability, the semiconverter is connected to the AC power grid through a regulation transformer (T; Figure 4) in the same manner as an uncontrolled rectifier (T; Figure 1).
The switches of the common anode group A are uncontrolled and basically act as a half-wave diode rectifier. In the model, the firing angle 𝛼 of the semiconverter can be set anywhere between 0° and 180° [8]. If the firing angle 𝛼 is set to zero, semiconverter acts in the same manner as a diode rectifier. However, it is worth mentioning that, in practice, a firing angle 𝛼 cannot be set to exactly zero due to the specific physical construction of a thyristor [33]. This is the reason for using an uncontrolled rectifier in semiconverter anal-ysis. Although there is a solution to this shortage in the form of original schematic modi-fication, it is not carried out due to better model understanding and analysis. Neverthe-less, if the thyristor is fired with firing angle greater than zero (𝛼 > 0), the semiconverter can work in two basic operational modes: three-pulse and six-pulse. The operational mode depends exclusively on the upper bridge thyristor control. The converter operates in six-pulse mode for firing angles of 𝛼 < 60°, while it operates in a three-pulse mode for 𝛼 > 60°.
For the purpose of mathematical model analysis, the assumption is that the three-phase system is symmetrical, as defined by expression (1). An additional assumption is that the resistance and inductance of the power grid are ignored with the following con-dition: 𝐿𝑅 ≫ 𝑇3 ; 𝑇 = 2π𝜔
In a semiconverter, all thyristors are symmetrically controlled with the same firing angle. The commutation between switches is instantaneous, the load current 𝑖 is smoothed and equal to 𝐼 , and the phase currents form a three-phase symmetrical system (Figure 6). The firing angle can be determined, as shown in Figure 5, for two studied cases: 𝛼 < 60° (Figure 5a; 𝛼 = 45° or 𝛼 = 2.5 ms) and 𝛼 > 60° (Figure 5b; 𝛼 = 90° or 𝛼 =5 ms). Likewise, the firing angle 𝛼 can be approximately determined by control factor 𝜐(𝛼) [8]: 𝜐(𝛼) = 𝑈 (0)𝑈 (0) = 12 (1 + cosα); cosα = 2 𝑈 (0)𝑈 (0) − 1 (3)
where 𝑈 (0) is the mean value of ideal output voltage of the converter at a chosen 𝛼, and 𝑈 (0) is the mean value of ideal output voltage of the rectifier when 𝛼 = 0°.
(a) (b)
α
α
Figure 5. Voltage waveforms of the thyristor for firing angle of 𝛼 = 45° (a) and firing angle 𝛼 =90° (b). Figure 5. Voltage waveforms of the thyristor for firing angle of α = 45 (a) and firing angle α = 90 (b).

Energies 2022, 15, 1614 6 of 18
The switches of the common anode group A are uncontrolled and basically act as ahalf-wave diode rectifier. In the model, the firing angle α of the semiconverter can be setanywhere between 0 and 180 [8]. If the firing angle α is set to zero, semiconverter actsin the same manner as a diode rectifier. However, it is worth mentioning that, in practice,a firing angle α cannot be set to exactly zero due to the specific physical construction of athyristor [33]. This is the reason for using an uncontrolled rectifier in semiconverter analysis.Although there is a solution to this shortage in the form of original schematic modification,it is not carried out due to better model understanding and analysis. Nevertheless, if thethyristor is fired with firing angle greater than zero (α > 0), the semiconverter can work intwo basic operational modes: three-pulse and six-pulse. The operational mode dependsexclusively on the upper bridge thyristor control. The converter operates in six-pulse modefor firing angles of α < 60, while it operates in a three-pulse mode for α > 60.
For the purpose of mathematical model analysis, the assumption is that the three-phase system is symmetrical, as defined by expression (1). An additional assumption is thatthe resistance and inductance of the power grid are ignored with the following condition:
LdRd T
3; T =
2πω
In a semiconverter, all thyristors are symmetrically controlled with the same firingangle. The commutation between switches is instantaneous, the load current id is smoothedand equal to Id, and the phase currents form a three-phase symmetrical system (Figure 6).The firing angle can be determined, as shown in Figure 5, for two studied cases: α < 60
(Figure 5a; α = 45 or α = 2.5 ms) and α > 60 (Figure 5b; α = 90 or α = 5 ms). Likewise,the firing angle α can be approximately determined by control factor υ(α) [8]:
υ(α) =Udiα(0)Udi0(0)
=12(1 + cosα); cosα = 2
Udiα(0)Udi0(0)
− 1 (3)
where Udiα(0) is the mean value of ideal output voltage of the converter at a chosen α, andUdi0(0) is the mean value of ideal output voltage of the rectifier when α = 0.
Energies 2022, 15, x FOR PEER REVIEW 7 of 19
Typical waveforms of the mathematical model of a three-phase semiconverter for 𝛼 < 60° and 𝛼 > 60° are shown in Figure 6a,b, respectively. (a) (b)
uA0
u1 u2 u3 u1 u1
ud
uV1
i1
uC0
u1-u3 u2-u1 u3-u2
α
√6U
V6 V2 V5 V4
V1 V6 Id
Id
ωt
ωt
ωt
ωt
u1-u3 u1-u2
V3 V1
V1 fire imp. V1 fire imp.
u1
ud
uV1
i1
u1 u2 u3 u1 uC0
u1-u3 uA0 u2-u1 u3-u2
ωt
ωt
ωt
ωt Id
Id
√6U
α
u1-u3 u1-u2
V1 V6
V5 V4 V2 V6
V3 V1
V1 fire imp. V1 fire imp.
Figure 6. Typical waveforms of the mathematical model of a three−phase semiconverter with induc-tive load for (a) 𝛼 < 60° (six−pulse mode) and (b) 𝛼 > 60° (three−pulse mode).
As shown in Figure 6, if the voltage 𝑢 of thyristor V1 is observed, the mean value of the voltage in both cases relates to 𝑈 (0) < 0. When the firing angle exceeds 𝛼 > 90°, the mean value of V1 starts to be 𝑈 (0) > 0. Strictly speaking, this means that the cathode group (thyristor group) operates in rectifier mode for angles of 0 < 𝛼 < 90° and in in-verter mode for firing angles of 90° < 𝛼 < 180°. According to the waveforms of the out-put voltage for both modes (Figure 6), it can be observed that the mean value of the output voltage is always positive, which is the reason semiconverter cannot operate in an inverter regime. Therefore, the firing angle is limited between 0° < 𝛼 < 90°.
Concept of u–i Characteristic The theoretical u–i characteristics of a semiconverter (for node 1; Figure 4) for firing
angles of 𝛼 < 60° and 𝛼 > 60° are shown in Figures 7 and 8, respectively. For firing an-gle 𝛼 < 60°, significant points A 0, 𝑈sin𝛼 , B(𝐼 , 0), C 0, −𝑈sin𝛼 , D −𝐼 , −𝑈sin𝛼 are de-picted on the corresponding voltage and current waveforms (Figure 7a) as well as the u–i characteristic (Figure 7b).
(a) (b)
π/2
i1
ωt
Id
Id
√2U
4π/3
u1
2π
ωt α+5π/6 0 7π/6A
B
C
D
0
π/6 α
α+π/6
π
11π/6 π/6
Figure 7. Typical waveforms of current and voltage (a) and u−i characteristic (b) of a semicon-verter for 𝛼 < 60°.
D
CA
B
u1
-Id
i1Id
− U U
Figure 6. Typical waveforms of the mathematical model of a three−phase semiconverter withinductive load for (a) α < 60 (six–pulse mode) and (b) α > 60 (three–pulse mode).
Typical waveforms of the mathematical model of a three-phase semiconverter forα < 60 and α > 60 are shown in Figure 6a,b, respectively.
As shown in Figure 6, if the voltage uV1 of thyristor V1 is observed, the mean value ofthe voltage in both cases relates to UV1(0) < 0. When the firing angle exceeds α > 90, the

Energies 2022, 15, 1614 7 of 18
mean value of V1 starts to be UV1(0) > 0. Strictly speaking, this means that the cathodegroup (thyristor group) operates in rectifier mode for angles of 0 < α < 90 and in invertermode for firing angles of 90 < α < 180. According to the waveforms of the outputvoltage for both modes (Figure 6), it can be observed that the mean value of the outputvoltage is always positive, which is the reason semiconverter cannot operate in an inverterregime. Therefore, the firing angle is limited between 0 < α < 90.
Concept of u–i Characteristic
The theoretical u–i characteristics of a semiconverter (for node 1; Figure 4) for firingangles of α < 60 and α > 60 are shown in Figures 7 and 8, respectively. For firing angleα < 60, significant points A
(0, U sin α
), B(Id, 0), C
(0,−U sin α
), D(−Id,−U sin α
)are
depicted on the corresponding voltage and current waveforms (Figure 7a) as well as theu–i characteristic (Figure 7b).
Energies 2022, 15, x FOR PEER REVIEW 7 of 19
Typical waveforms of the mathematical model of a three-phase semiconverter for 𝛼 < 60° and 𝛼 > 60° are shown in Figure 6a,b, respectively. (a) (b)
uA0
u1 u2 u3 u1 u1
ud
uV1
i1
uC0
u1-u3 u2-u1 u3-u2
α
√6U
V6 V2 V5 V4
V1 V6 Id
Id
ωt
ωt
ωt
ωt
u1-u3 u1-u2
V3 V1
V1 fire imp. V1 fire imp.
u1
ud
uV1
i1
u1 u2 u3 u1 uC0
u1-u3 uA0 u2-u1 u3-u2
ωt
ωt
ωt
ωt Id
Id
√6U
α
u1-u3 u1-u2
V1 V6
V5 V4 V2 V6
V3 V1
V1 fire imp. V1 fire imp.
Figure 6. Typical waveforms of the mathematical model of a three−phase semiconverter with induc-tive load for (a) 𝛼 < 60° (six−pulse mode) and (b) 𝛼 > 60° (three−pulse mode).
As shown in Figure 6, if the voltage 𝑢 of thyristor V1 is observed, the mean value of the voltage in both cases relates to 𝑈 (0) < 0. When the firing angle exceeds 𝛼 > 90°, the mean value of V1 starts to be 𝑈 (0) > 0. Strictly speaking, this means that the cathode group (thyristor group) operates in rectifier mode for angles of 0 < 𝛼 < 90° and in in-verter mode for firing angles of 90° < 𝛼 < 180°. According to the waveforms of the out-put voltage for both modes (Figure 6), it can be observed that the mean value of the output voltage is always positive, which is the reason semiconverter cannot operate in an inverter regime. Therefore, the firing angle is limited between 0° < 𝛼 < 90°.
Concept of u–i Characteristic The theoretical u–i characteristics of a semiconverter (for node 1; Figure 4) for firing
angles of 𝛼 < 60° and 𝛼 > 60° are shown in Figures 7 and 8, respectively. For firing an-gle 𝛼 < 60°, significant points A 0, 𝑈sin𝛼 , B(𝐼 , 0), C 0, −𝑈sin𝛼 , D −𝐼 , −𝑈sin𝛼 are de-picted on the corresponding voltage and current waveforms (Figure 7a) as well as the u–i characteristic (Figure 7b).
(a) (b)
π/2
i1
ωt
Id
Id
√2U
4π/3
u1
2π
ωt α+5π/6 0 7π/6A
B
C
D
0
π/6 α
α+π/6
π
11π/6 π/6
Figure 7. Typical waveforms of current and voltage (a) and u−i characteristic (b) of a semicon-verter for 𝛼 < 60°.
D
CA
B
u1
-Id
i1Id
− U U
Figure 7. Typical waveforms of current and voltage (a) and u–i characteristic (b) of a semiconverterfor α < 60.
Energies 2022, 15, x FOR PEER REVIEW 8 of 19
Likewise, for the second firing angle of 𝛼 > 60 (Figure 8), the significant points cor-responding to A 0, 𝑈sin𝛼 , B 𝐼 , −𝑈sin𝛼 , C 0, −𝑈sin𝛼 , D(−𝐼 , −𝑈sin𝛼) are depicted on voltage and current waveforms (Figure 8a) as well as the u–i characteristic (Figure 8b).
(a) (b)
π/2
i1
ωt
Id
Id
√2U
4π/3
u1
2π
ωt
α+5π/6 0 7π/6
A
B
C
D
0
π/6 α
α+π/6
π
11π/6 π/6
Figure 8. Typical waveforms of current and voltage (a) and u−i characteristic (b) of a semicon-verter for 𝛼 > 60°.
The obtained u–i characteristics (𝛼 < 60° (Figure 7) and 𝛼 > 60° (Figure 8)) are asymmetrical regarding the origin of the coordinate system i1–u1, where the u–i character-istics are considered as unilateral characteristics. It is common (based on the waveform) that even-order harmonics are associated with the existence of a DC component. Other-wise, it is considered that only odd harmonics are present. Thus, observing the waveforms of the phase currents from Figures 7 and 8, one would expect only odd harmonics when measuring the harmonic content.
4. Current Harmonics, Power Components, and Power Factor of a Semiconverter In order to analyze the u–i characteristic in detail and to connect the theoretical part
with the practical part, the analytics behind current harmonics, power components, and power factor of a semiconverter should be first clarified. In an analytical approach, the apparent power 𝑆, reactive power 𝑄, and the power factor 𝜆 can be put into relationship with the maximum of a DC power and firing angle 𝛼. When the firing angle is changed, the waveform of the AC current also changes qualitatively and quantitatively and, conse-quently, reactive power is produced. The phase current of a semiconverter on the AC side is still alternating current but not sinusoidal. As a result, the AC current contains a great number of odd-order and even-order higher harmonics, except multiples of the third har-monic, i.e., 𝑛 ≠ 3𝑝, 𝑝 = 1, 2, 3 … [34]. All of the above assumptions will be validated later in laboratory measurements.
According to [8], the RMS value of the fundamental current 𝐼(1) is as follows: 𝐼(1) = √6𝐼π cos 𝛼2 (4)
where 𝐼 is the mean value of the DC output current, and 𝛼 is the firing angle. According to [8], the RMS values of phase current 𝐼 for odd and even harmonics can
be derived. The odd order of harmonics is as follows:
𝐼(𝑛) = √6𝐼π ∙ cos𝑛 𝛼2𝑛 ; 𝑛 = 6𝑝 ∓ 1, 𝑝 = 1,2,3, … (5)
where n is the order of odd harmonic, and p is the auxiliary counter. The RMS value of the phase current 𝐼 of even harmonics can be calculated as follows:
u1
C
B
D
A
i1
-Id
Id
U− U
Figure 8. Typical waveforms of current and voltage (a) and u–i characteristic (b) of a semiconverterfor α > 60.
Likewise, for the second firing angle of α > 60 (Figure 8), the significant pointscorresponding to A
(0, U sin α
), B(
Id,−U sin α), C(0,−U sin α
), D(−Id,−U sin α
)are de-
picted on voltage and current waveforms (Figure 8a) as well as the u–i characteristic(Figure 8b).
The obtained u–i characteristics (α < 60 (Figure 7) and α > 60 (Figure 8)) are asym-metrical regarding the origin of the coordinate system i1–u1, where the u–i characteristicsare considered as unilateral characteristics. It is common (based on the waveform) thateven-order harmonics are associated with the existence of a DC component. Otherwise,it is considered that only odd harmonics are present. Thus, observing the waveforms of

Energies 2022, 15, 1614 8 of 18
the phase currents from Figures 7 and 8, one would expect only odd harmonics whenmeasuring the harmonic content.
4. Current Harmonics, Power Components, and Power Factor of a Semiconverter
In order to analyze the u–i characteristic in detail and to connect the theoretical partwith the practical part, the analytics behind current harmonics, power components, andpower factor of a semiconverter should be first clarified. In an analytical approach, theapparent power S, reactive power Q, and the power factor λ can be put into relationshipwith the maximum of a DC power and firing angle α. When the firing angle is changed, thewaveform of the AC current also changes qualitatively and quantitatively and, consequently,reactive power is produced. The phase current of a semiconverter on the AC side is stillalternating current but not sinusoidal. As a result, the AC current contains a great numberof odd-order and even-order higher harmonics, except multiples of the third harmonic,i.e., n 6= 3p, p = 1, 2, 3 . . . [34]. All of the above assumptions will be validated later inlaboratory measurements.
According to [8], the RMS value of the fundamental current I(1) is as follows:
I(1) =√
6Idπ
cosα
2(4)
where Id is the mean value of the DC output current, and α is the firing angle.According to [8], the RMS values of phase current I for odd and even harmonics can
be derived. The odd order of harmonics is as follows:
I(n) =√
6Idπ·cos n α
2n
; n = 6p∓ 1, p = 1, 2, 3, . . . (5)
where n is the order of odd harmonic, and p is the auxiliary counter. The RMS value of thephase current I of even harmonics can be calculated as follows:
I(n) =√
6Idπ·sin n α
2n
; n = 3(2p− 1)∓ 1, p = 1, 2, 3 . . . (6)
From Equation (6), it can be concluded that an even-order current harmonics is present.This can be connected to the property of unilateral u–i characteristic found in semiconvert-ers, which differs from the bilateral property of u–i characteristic found in uncontrolledrectifiers (as well as fully controlled rectifiers), [8]. Therefore, the u–i characteristic (whichcan be easily measured from the x–y mode of the oscilloscope) becomes an indicator ofappearance of the order of harmonics in the phase current spectral analysis. The u–i char-acteristic with its shape and position in the phase plane undoubtedly indicates the above,which cannot be concluded only by observing the waveform of the phase current.
Even-order current harmonics can produce severe problems, such as the magnetic DCtransformer bias phenomena or problems in AC filter design (filters are usually designedfor dominant odd-order harmonics, e.g., n = 5, n = 7, but even-order harmonics arepresent here: n = 2, n = 4, . . . ).
Furthermore, active power P of the semiconverter can be expressed through the DCquantities as follows:
P = 3π
3√
31√2
Udi0(0)
√6Idπ
cos2 α
2= Pd
1 + cos α
2(7)

Energies 2022, 15, 1614 9 of 18
where Udi0(0) is the ideal mean output voltage value of the semiconverter when firingangle α is set to zero, and Pd is the maximum active power of the semiconverter at thegiven DC current Id. The reactive power Q at fundamental harmonic is as follows:
Q(1) =3
∑k=1
Uk Ik(1) sin ϕ = 3UI(1) sinα
2; Q(1) = Pd
sin α
2(8)
where k is the phase number, Uk is the phase voltage of phase k, I is the phase current, andϕ is the phase shift between voltage and current of phase k. It can be seen from Equation (8)that the reactive power Q depends on the maximum DC active power of a semiconverterand also on the firing angle α. From the Equations (7) and (8), the apparent power atfundamental harmonic S(1) can be derived as follows:
S(1) =√
P2(1) + Q2(1) = Pd
√1 + cos α
2= Pd cos
α
2(9)
where P(1) is the active power at fundamental harmonic, and Q(1) is the reactive power atfundamental harmonic. By the known definition, the apparent power S of a three-phasesymmetrical power system can be calculated as follows:
S = 3·U·I (10)
The RMS of the phase current I can be derived from the AC current waveforms byintegrating the phase current i1 (Figure 6). Thus, the phase current depends on the firingangle α as follows:
Iα<60 =
√2
3; Iα>60 = Id
√π− α
π(11)
As shown by Equation (11), the RMS of the phase current I is linear and does notdepend on the firing angle for α < 60, while the RMS of the phase current depends on thefiring angle for α > 60. Furthermore, according to [8], the apparent power S is as follows:
Sα<60 =π
3Pd; Sα>60 =
√π
6(π− α)Pd (12)
Finally, the power factor λ can be calculated as the ratio between active and apparentpower:
λ =PS=
S(1)S
PS(1)
; λα<60 =3π·1 + cos α
2; λα>60 =
1 + cos α√2π3 (π− α)
(13)
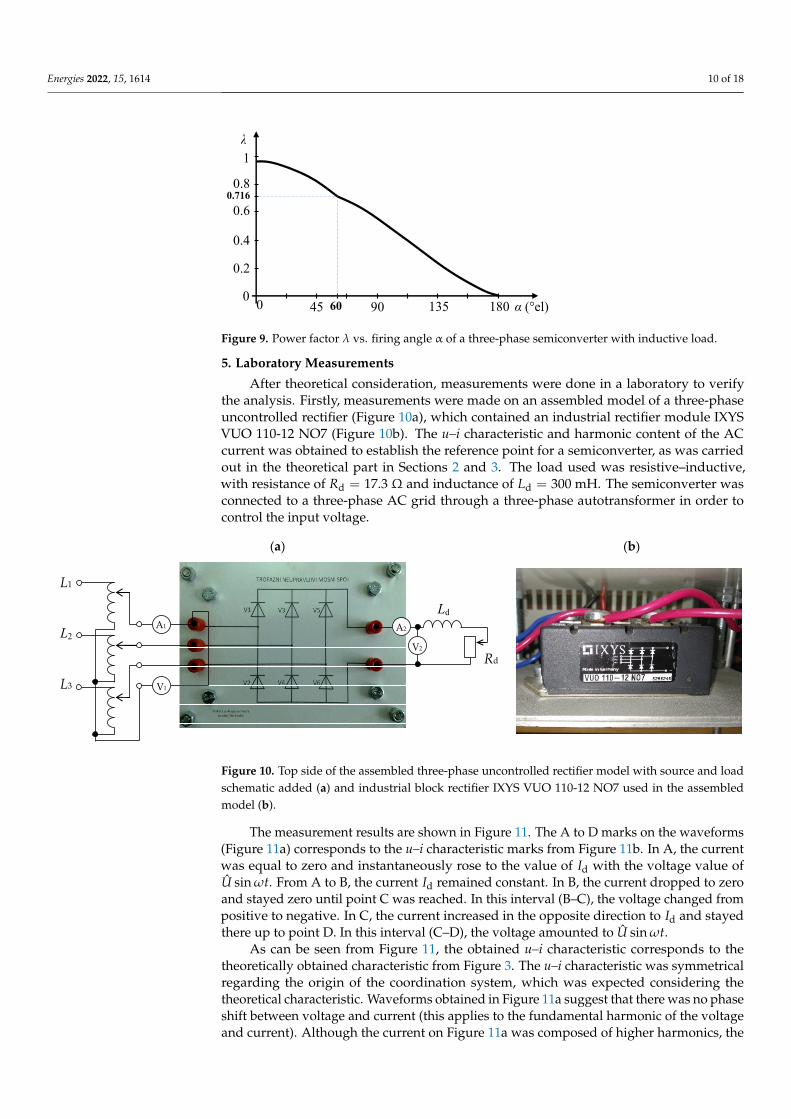
where P is the active power of the power grid side, S is the apparent power on the grid side,S(1) is the apparent power on the grid side at fundamental harmonic. The dependance ofpower factor λ and firing angle α is shown in Figure 9 [8]. Later, Equation (13) will be usedto calculate the power factor λcalc for measurement validation.
As can be seen from Figure 9, along with Equation (13), the greater the firing angle α,the lower the power factor λ tends to be. Thus, the amount of reactive power Q produced bythe semiconverter increases with the firing angle α, which will be confirmed by laboratorymeasurements.
Energies 2022, 15, 1614 10 of 18
Energies 2022, 15, x FOR PEER REVIEW 10 of 19
Finally, the power factor 𝜆 can be calculated as the ratio between active and appar-ent power: 𝜆 = 𝑃𝑆 = 𝑆(1)𝑆 𝑃𝑆(1) ; 𝜆 ° = 3π ∙ 1 + cos𝛼2 ; 𝜆 ° = 1 + cos𝛼2π3 (π − 𝛼) (13)
where 𝑃 is the active power of the power grid side, 𝑆 is the apparent power on the grid side, 𝑆(1) is the apparent power on the grid side at fundamental harmonic. The depend-ance of power factor 𝜆 and firing angle 𝛼 is shown in Figure 9 [8]. Later, Equation (13) will be used to calculate the power factor 𝜆 for measurement validation.
1
0.8
0.6
0.4
0.2
0 0
0.716
45 90 135 180 60
λ
α (°el)
Figure 9. Power factor λ vs. firing angle α of a three-phase semiconverter with inductive load.
As can be seen from Figure 9, along with Equation (13), the greater the firing angle 𝛼, the lower the power factor 𝜆 tends to be. Thus, the amount of reactive power 𝑄 pro-duced by the semiconverter increases with the firing angle 𝛼, which will be confirmed by laboratory measurements.
5. Laboratory Measurements After theoretical consideration, measurements were done in a laboratory to verify the
analysis. Firstly, measurements were made on an assembled model of a three-phase un-controlled rectifier (Figure 10a), which contained an industrial rectifier module IXYS VUO 110-12 NO7 (Figure 10b). The u–i characteristic and harmonic content of the AC current was obtained to establish the reference point for a semiconverter, as was carried out in the theoretical part in Sections 2 and 3. The load used was resistive–inductive, with resistance of 𝑅 = 17.3 Ω and inductance of 𝐿 = 300 mH. The semiconverter was connected to a three-phase AC grid through a three-phase autotransformer in order to control the input voltage.
(a) (b)
L1
L2
L3
A1
V1
A2
V2
Ld
Rd
Figure 9. Power factor λ vs. firing angle α of a three-phase semiconverter with inductive load.
5. Laboratory Measurements
After theoretical consideration, measurements were done in a laboratory to verifythe analysis. Firstly, measurements were made on an assembled model of a three-phaseuncontrolled rectifier (Figure 10a), which contained an industrial rectifier module IXYSVUO 110-12 NO7 (Figure 10b). The u–i characteristic and harmonic content of the ACcurrent was obtained to establish the reference point for a semiconverter, as was carriedout in the theoretical part in Sections 2 and 3. The load used was resistive–inductive,with resistance of Rd = 17.3 Ω and inductance of Ld = 300 mH. The semiconverter wasconnected to a three-phase AC grid through a three-phase autotransformer in order tocontrol the input voltage.
Energies 2022, 15, x FOR PEER REVIEW 10 of 19
Finally, the power factor 𝜆 can be calculated as the ratio between active and appar-ent power: 𝜆 = 𝑃𝑆 = 𝑆(1)𝑆 𝑃𝑆(1) ; 𝜆 ° = 3π ∙ 1 + cos𝛼2 ; 𝜆 ° = 1 + cos𝛼2π3 (π − 𝛼) (13)
where 𝑃 is the active power of the power grid side, 𝑆 is the apparent power on the grid side, 𝑆(1) is the apparent power on the grid side at fundamental harmonic. The depend-ance of power factor 𝜆 and firing angle 𝛼 is shown in Figure 9 [8]. Later, Equation (13) will be used to calculate the power factor 𝜆 for measurement validation.
1
0.8
0.6
0.4
0.2
0 0
0.716
45 90 135 180 60
λ
α (°el)
Figure 9. Power factor λ vs. firing angle α of a three-phase semiconverter with inductive load.
As can be seen from Figure 9, along with Equation (13), the greater the firing angle 𝛼, the lower the power factor 𝜆 tends to be. Thus, the amount of reactive power 𝑄 pro-duced by the semiconverter increases with the firing angle 𝛼, which will be confirmed by laboratory measurements.
5. Laboratory Measurements After theoretical consideration, measurements were done in a laboratory to verify the
analysis. Firstly, measurements were made on an assembled model of a three-phase un-controlled rectifier (Figure 10a), which contained an industrial rectifier module IXYS VUO 110-12 NO7 (Figure 10b). The u–i characteristic and harmonic content of the AC current was obtained to establish the reference point for a semiconverter, as was carried out in the theoretical part in Sections 2 and 3. The load used was resistive–inductive, with resistance of 𝑅 = 17.3 Ω and inductance of 𝐿 = 300 mH. The semiconverter was connected to a three-phase AC grid through a three-phase autotransformer in order to control the input voltage.
(a) (b)
L1
L2
L3
A1
V1
A2
V2
Ld
Rd
Figure 10. Top side of the assembled three-phase uncontrolled rectifier model with source and loadschematic added (a) and industrial block rectifier IXYS VUO 110-12 NO7 used in the assembledmodel (b).
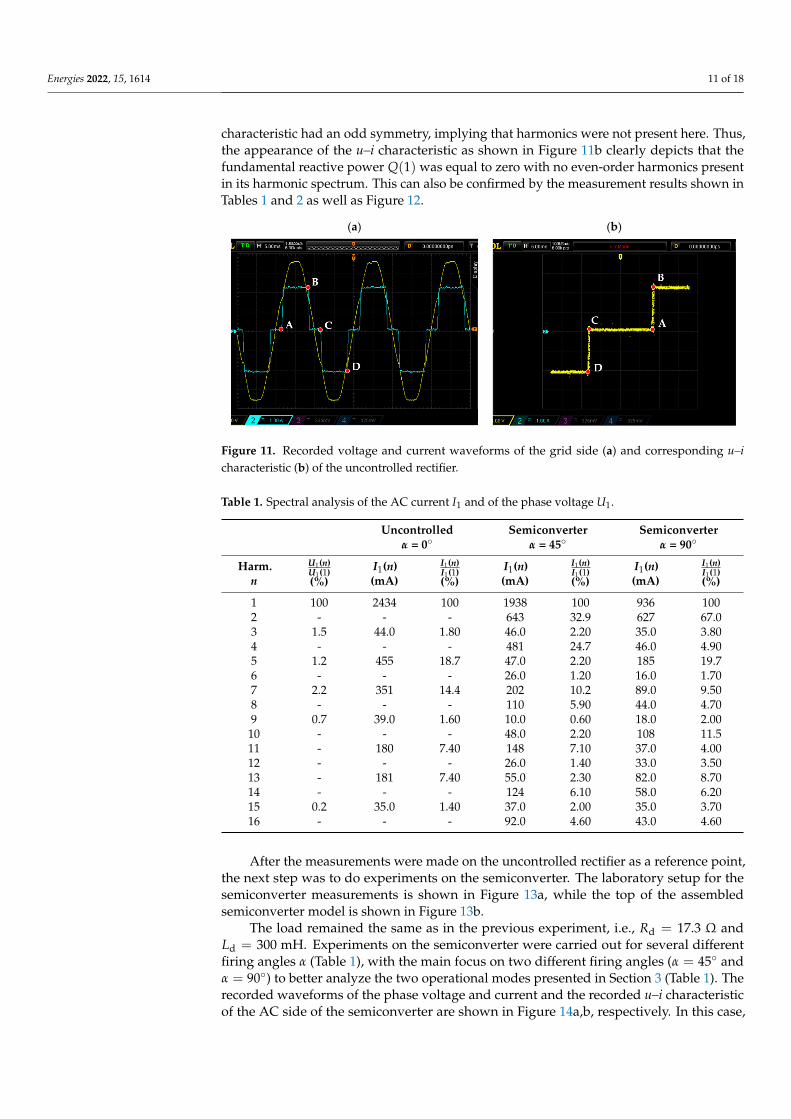
The measurement results are shown in Figure 11. The A to D marks on the waveforms(Figure 11a) corresponds to the u–i characteristic marks from Figure 11b. In A, the currentwas equal to zero and instantaneously rose to the value of Id with the voltage value ofU sin ωt. From A to B, the current Id remained constant. In B, the current dropped to zeroand stayed zero until point C was reached. In this interval (B–C), the voltage changed frompositive to negative. In C, the current increased in the opposite direction to Id and stayedthere up to point D. In this interval (C–D), the voltage amounted to U sin ωt.
As can be seen from Figure 11, the obtained u–i characteristic corresponds to thetheoretically obtained characteristic from Figure 3. The u–i characteristic was symmetricalregarding the origin of the coordination system, which was expected considering thetheoretical characteristic. Waveforms obtained in Figure 11a suggest that there was no phaseshift between voltage and current (this applies to the fundamental harmonic of the voltageand current). Although the current on Figure 11a was composed of higher harmonics, the
Energies 2022, 15, 1614 11 of 18
characteristic had an odd symmetry, implying that harmonics were not present here. Thus,the appearance of the u–i characteristic as shown in Figure 11b clearly depicts that thefundamental reactive power Q(1) was equal to zero with no even-order harmonics presentin its harmonic spectrum. This can also be confirmed by the measurement results shown inTables 1 and 2 as well as Figure 12.
Energies 2022, 15, x FOR PEER REVIEW 11 of 19
Figure 10. Top side of the assembled three-phase uncontrolled rectifier model with source and load schematic added (a) and industrial block rectifier IXYS VUO 110-12 NO7 used in the assembled model (b).
The measurement results are shown in Figure 11. The A to D marks on the waveforms (Figure 11a) corresponds to the u–i characteristic marks from Figure 11b. In A, the current was equal to zero and instantaneously rose to the value of 𝐼 with the voltage value of 𝑈sin𝜔𝑡. From A to B, the current 𝐼 remained constant. In B, the current dropped to zero and stayed zero until point C was reached. In this interval (B–C), the voltage changed from positive to negative. In C, the current increased in the opposite direction to 𝐼 and stayed there up to point D. In this interval (C–D), the voltage amounted to 𝑈sin𝜔𝑡.
(a) (b)
Figure 11. Recorded voltage and current waveforms of the grid side (a) and corresponding u–i char-acteristic (b) of the uncontrolled rectifier.
As can be seen from Figure 11, the obtained u–i characteristic corresponds to the the-oretically obtained characteristic from Figure 3. The u–i characteristic was symmetrical regarding the origin of the coordination system, which was expected considering the the-oretical characteristic. Waveforms obtained in Figure 11a suggest that there was no phase shift between voltage and current (this applies to the fundamental harmonic of the voltage and current). Although the current on Figure 11a was composed of higher harmonics, the characteristic had an odd symmetry, implying that harmonics were not present here. Thus, the appearance of the u–i characteristic as shown in Figure 11b clearly depicts that the fundamental reactive power 𝑄(1) was equal to zero with no even-order harmonics present in its harmonic spectrum. This can also be confirmed by the measurement results shown in Tables 1 and 2 as well as Figure 12.
Figure 11. Recorded voltage and current waveforms of the grid side (a) and corresponding u–icharacteristic (b) of the uncontrolled rectifier.
Table 1. Spectral analysis of the AC current I1 and of the phase voltage U1.
Uncontrolledα = 0
Semiconverterα = 45
Semiconverterα = 90
Harm.n
U1(n)U1(1)(%)
I1(n)(mA)
I1(n)I1(1)(%)
I1(n)(mA)
I1(n)I1(1)(%)
I1(n)(mA)
I1(n)I1(1)(%)
1 100 2434 100 1938 100 936 1002 - - - 643 32.9 627 67.03 1.5 44.0 1.80 46.0 2.20 35.0 3.804 - - - 481 24.7 46.0 4.905 1.2 455 18.7 47.0 2.20 185 19.76 - - - 26.0 1.20 16.0 1.707 2.2 351 14.4 202 10.2 89.0 9.508 - - - 110 5.90 44.0 4.709 0.7 39.0 1.60 10.0 0.60 18.0 2.00
10 - - - 48.0 2.20 108 11.511 - 180 7.40 148 7.10 37.0 4.0012 - - - 26.0 1.40 33.0 3.5013 - 181 7.40 55.0 2.30 82.0 8.7014 - - - 124 6.10 58.0 6.2015 0.2 35.0 1.40 37.0 2.00 35.0 3.7016 - - - 92.0 4.60 43.0 4.60
After the measurements were made on the uncontrolled rectifier as a reference point,the next step was to do experiments on the semiconverter. The laboratory setup for thesemiconverter measurements is shown in Figure 13a, while the top of the assembledsemiconverter model is shown in Figure 13b.
The load remained the same as in the previous experiment, i.e., Rd = 17.3 Ω andLd = 300 mH. Experiments on the semiconverter were carried out for several differentfiring angles α (Table 1), with the main focus on two different firing angles (α = 45 andα = 90) to better analyze the two operational modes presented in Section 3 (Table 1). Therecorded waveforms of the phase voltage and current and the recorded u–i characteristicof the AC side of the semiconverter are shown in Figure 14a,b, respectively. In this case,

Energies 2022, 15, 1614 12 of 18
the firing angle of α = 45 was used to analyze the AC side in the six-pulse mode ofsemiconverter operation (Figure 6a; α < 60).
Table 2. Measured and calculated values for different firing angles.
α () 0 30 45 60 75 90
U1 (V) 24.2 24.2 24.3 24.2 24.6 24.67I1 (A) 2.5 2.33 2.15 1.88 1.55 1.18Ud (V) 50.1 47.9 44.16 38.8 33.27 27.13Id(A) 3.01 2.89 2.66 2.34 2.01 1.64
P1 (W) 58.5 50.8 43.0 33.0 24.9 16.3Q1 (var) 17.5 24.6 29.4 31.2 29.0 24.1S1 (VA) 61.1 56.4 52.12 45.4 38.2 29.1λ (ind.) 0.99 0.90 0.83 0.73 0.65 0.56
λcalc. (ind.) 0.99 0.89 0.81 0.71 0.64 0.55THDI (%) 0.23 0.37 0.48 0.60 0.66 0.77
Significant harmonic (n) I1[I1(n)/I1(1)] (%)
2 - 20.7 32.9 46 56.8 674 - 18.6 24.7 24.7 17.8 4.95 18.7 10.4 2.2 14.7 21.4 19.77 14.4 1.6 10.2 14.6 6.9 9.5
Energies 2022, 15, x FOR PEER REVIEW 12 of 19
Figure 12. Chart of conducted harmonic analysis of the AC phase current I1.
After the measurements were made on the uncontrolled rectifier as a reference point, the next step was to do experiments on the semiconverter. The laboratory setup for the semiconverter measurements is shown in Figure 13a, while the top of the assembled sem-iconverter model is shown in Figure 13b.
(a) (b)
Figure 13. Laboratory measurement setup (a) and the top side of the assembled semiconverter (b).
The load remained the same as in the previous experiment, i.e., 𝑅 = 17,3 Ω and 𝐿 = 300 mH. Experiments on the semiconverter were carried out for several different fir-ing angles 𝛼 (Table 1), with the main focus on two different firing angles (𝛼 = 45° and 𝛼 = 90°) to better analyze the two operational modes presented in Section 3 (Table 1). The recorded waveforms of the phase voltage and current and the recorded u–i characteristic of the AC side of the semiconverter are shown in Figure 14a,b, respectively. In this case, the firing angle of 𝛼 = 45° was used to analyze the AC side in the six-pulse mode of sem-iconverter operation (Figure 6a; 𝛼 < 60°).
As can be seen from Figure 14, the measured u–i characteristic was similar to the mathematically obtained u–i characteristic (Figure 7) with some specific deviations. The reason for the deviation was that the analysis assumed commutation was instantaneous,
0
10
20
30
40
50
60
70
80
90
100
1 2 3 4 5 6 7 8 9 10 11 12 13 14 15 16
𝐼 1(𝑛) / 𝐼1(1
) (%
)
Harmonic (n)
Uncontrolled α=45° α=90°
Figure 12. Chart of conducted harmonic analysis of the AC phase current I1.
Energies 2022, 15, x FOR PEER REVIEW 12 of 19
Figure 12. Chart of conducted harmonic analysis of the AC phase current I1.
After the measurements were made on the uncontrolled rectifier as a reference point, the next step was to do experiments on the semiconverter. The laboratory setup for the semiconverter measurements is shown in Figure 13a, while the top of the assembled sem-iconverter model is shown in Figure 13b.
(a) (b)
Figure 13. Laboratory measurement setup (a) and the top side of the assembled semiconverter (b).
The load remained the same as in the previous experiment, i.e., 𝑅 = 17,3 Ω and 𝐿 = 300 mH. Experiments on the semiconverter were carried out for several different fir-ing angles 𝛼 (Table 1), with the main focus on two different firing angles (𝛼 = 45° and 𝛼 = 90°) to better analyze the two operational modes presented in Section 3 (Table 1). The recorded waveforms of the phase voltage and current and the recorded u–i characteristic of the AC side of the semiconverter are shown in Figure 14a,b, respectively. In this case, the firing angle of 𝛼 = 45° was used to analyze the AC side in the six-pulse mode of sem-iconverter operation (Figure 6a; 𝛼 < 60°).
As can be seen from Figure 14, the measured u–i characteristic was similar to the mathematically obtained u–i characteristic (Figure 7) with some specific deviations. The reason for the deviation was that the analysis assumed commutation was instantaneous,
0
10
20
30
40
50
60
70
80
90
100
1 2 3 4 5 6 7 8 9 10 11 12 13 14 15 16
𝐼 1(𝑛) / 𝐼1(1
) (%
)
Harmonic (n)
Uncontrolled α=45° α=90°
Figure 13. Laboratory measurement setup (a) and the top side of the assembled semiconverter (b).

Energies 2022, 15, 1614 13 of 18
Energies 2022, 15, x FOR PEER REVIEW 13 of 19
while this is not the case in the real world. Some characteristics that were not present in the analysis (marked with red circle) and the missing current jump (marked with the white circle) are shown in Figure 14b. Points marked with numbers 1 to 10 in Figure 14a correspond to the points marked on Figure 14b for easier evaluation. Furthermore, at point 5 on Figure 14a, when the current increased from zero to 𝐼 , a voltage drop occurred (marked with purple circle), which was not present in the analysis. At points 9 and 10 (where the current needed to fall from 𝐼 to zero), a current overshoot occurred (marked with a blue circle), which did not exist in the model (Figure 7).
(a) (b)
Figure 14. Recorded phase voltage and current waveforms on the AC grid side (a) and correspond-ing u–i characteristic (b) of the semiconverter. Firing angle 𝛼 = 45°.
The second mode of operation (three-pulse) was when the firing angle was set to 𝛼 >60° (Figure 6b). The measurement results for firing angle 𝛼 = 90° are shown in Figure 15.
(a) (b)
Figure 15. Recorded voltage and current waveforms of the grid side (a) and corresponding u–i characteristic (b) of the semiconverter. Firing angle 𝛼 = 90°.
Here, the anomalies are marked with the white circles. As can be seen, they were more pronounced than in the case of the six-pulse mode of operation (Figure 14). The u–i characteristic (Figure 15b) is marked with 12 specific points for easier characteristic anal-ysis. These points correspond to the points marked on Figure 15a. As can be seen from Figure 15b, the u–i characteristic did not show the current leap between points 6 and 7, while this was present in the mathematical model (Figure 8b). The measured u–i charac-teristics notably differed from the theoretically obtained characteristics. Detailed analysis
Figure 14. Recorded phase voltage and current waveforms on the AC grid side (a) and correspondingu–i characteristic (b) of the semiconverter. Firing angle α = 45.
As can be seen from Figure 14, the measured u–i characteristic was similar to themathematically obtained u–i characteristic (Figure 7) with some specific deviations. Thereason for the deviation was that the analysis assumed commutation was instantaneous,while this is not the case in the real world. Some characteristics that were not presentin the analysis (marked with red circle) and the missing current jump (marked with thewhite circle) are shown in Figure 14b. Points marked with numbers 1 to 10 in Figure 14acorrespond to the points marked on Figure 14b for easier evaluation. Furthermore, atpoint 5 on Figure 14a, when the current increased from zero to Id, a voltage drop occurred(marked with purple circle), which was not present in the analysis. At points 9 and 10(where the current needed to fall from Id to zero), a current overshoot occurred (markedwith a blue circle), which did not exist in the model (Figure 7).
The second mode of operation (three-pulse) was when the firing angle was set toα > 60 (Figure 6b). The measurement results for firing angle α = 90 are shown inFigure 15.
Energies 2022, 15, x FOR PEER REVIEW 13 of 19
while this is not the case in the real world. Some characteristics that were not present in the analysis (marked with red circle) and the missing current jump (marked with the white circle) are shown in Figure 14b. Points marked with numbers 1 to 10 in Figure 14a correspond to the points marked on Figure 14b for easier evaluation. Furthermore, at point 5 on Figure 14a, when the current increased from zero to 𝐼 , a voltage drop occurred (marked with purple circle), which was not present in the analysis. At points 9 and 10 (where the current needed to fall from 𝐼 to zero), a current overshoot occurred (marked with a blue circle), which did not exist in the model (Figure 7).
(a) (b)
Figure 14. Recorded phase voltage and current waveforms on the AC grid side (a) and correspond-ing u–i characteristic (b) of the semiconverter. Firing angle 𝛼 = 45°.
The second mode of operation (three-pulse) was when the firing angle was set to 𝛼 >60° (Figure 6b). The measurement results for firing angle 𝛼 = 90° are shown in Figure 15.
(a) (b)
Figure 15. Recorded voltage and current waveforms of the grid side (a) and corresponding u–i characteristic (b) of the semiconverter. Firing angle 𝛼 = 90°.
Here, the anomalies are marked with the white circles. As can be seen, they were more pronounced than in the case of the six-pulse mode of operation (Figure 14). The u–i characteristic (Figure 15b) is marked with 12 specific points for easier characteristic anal-ysis. These points correspond to the points marked on Figure 15a. As can be seen from Figure 15b, the u–i characteristic did not show the current leap between points 6 and 7, while this was present in the mathematical model (Figure 8b). The measured u–i charac-teristics notably differed from the theoretically obtained characteristics. Detailed analysis
Figure 15. Recorded voltage and current waveforms of the grid side (a) and corresponding u–icharacteristic (b) of the semiconverter. Firing angle α = 90.
Here, the anomalies are marked with the white circles. As can be seen, they weremore pronounced than in the case of the six-pulse mode of operation (Figure 14). The u–icharacteristic (Figure 15b) is marked with 12 specific points for easier characteristic analysis.These points correspond to the points marked on Figure 15a. As can be seen from Figure 15b,the u–i characteristic did not show the current leap between points 6 and 7, while this waspresent in the mathematical model (Figure 8b). The measured u–i characteristics notablydiffered from the theoretically obtained characteristics. Detailed analysis of this issuetherefore needed to be carried out to avoid the influence of measuring equipment and

Energies 2022, 15, 1614 14 of 18
further tests were needed to determine the problems. Due to this reason, a differentoscilloscope was utilized.
For this purpose, the available higher-resolution DPO oscilloscope Tektronix 3012Bwas used (100 MHz and 1.25 GS/s sample rate, as opposed to the previously used RigolDS1054Z with 50 MHz and 500 MS/s sample rate). The firing angle α = 45 was chosen forthe waveforms and to compare the u–i characteristics obtained in Figure 14. Accordingly,the measured waveforms (Figure 16a) and u–i characteristic (Figure 16b) were similar tothose obtained in Figure 14a,b.
Energies 2022, 15, x FOR PEER REVIEW 14 of 19
of this issue therefore needed to be carried out to avoid the influence of measuring equip-ment and further tests were needed to determine the problems. Due to this reason, a dif-ferent oscilloscope was utilized.
For this purpose, the available higher-resolution DPO oscilloscope Tektronix 3012B was used (100 MHz and 1.25 GS/s sample rate, as opposed to the previously used Rigol DS1054Z with 50 MHz and 500 MS/s sample rate). The firing angle 𝛼 = 45° was chosen for the waveforms and to compare the u–i characteristics obtained in Figure 14. Accord-ingly, the measured waveforms (Figure 16a) and u–i characteristic (Figure 16b) were sim-ilar to those obtained in Figure 14a,b.
As can be seen from Figure 16a, there was presence of voltage and current spikes as well as voltage drops. One of the conclusions regarding current and voltage on the AC side of the semiconverter was that the voltage and current incidences increased with in-creasing firing angle 𝛼, as shown in Figures 14–16. To closely analyze what was going on in the problematic areas in the waveforms in Figure 16, the areas marked with 1 and 2 were zoomed in, and the results are shown in Figure 17.
(a) (b)
Figure 16. Phase voltage and current waveforms (a) and corresponding u–i characteristic (b) of the AC side of the semiconverter. Firing angle 𝛼 = 45°.
A zoomed image of mark 1 (Figure 16a) is shown in Figure 17a. The first point of analysis of Figure 17a was mark 1, when the thyristor voltage started to lower (thyristor V1 started to conduct, Figure 4). The voltage (blue) fell to the value of mark 2 and stayed at this value for about 26 µs. The current (cyan) in the same time period increased from mark 1 to mark 2 and continued to increase to mark 3. The voltage in mark 3 reached its maximum and started to oscillate (together with the current) to mark 4, where it continued to follow the sine function, as was the case before the transient appearance. It was obvious that commutation occurred between mark 1 and mark 4 (lasting about 40 µs).
Analyzing Figure 17b, a similar conclusion could be drawn. On mark 1, the thyristor V1 (Figure 4) unlatched phase current 𝑖 , and the current started to drop. The voltage increased from mark 1 to mark 2 and stabilized there until the current started unlatching (mark 3). From mark 3 to mark 4, voltage and current oscillations occurred, after which thyristor V1 no longer conducted. Commutation occurred here as well.
Figure 16. Phase voltage and current waveforms (a) and corresponding u–i characteristic (b) of theAC side of the semiconverter. Firing angle α = 45.
As can be seen from Figure 16a, there was presence of voltage and current spikesas well as voltage drops. One of the conclusions regarding current and voltage on theAC side of the semiconverter was that the voltage and current incidences increased withincreasing firing angle α, as shown in Figures 14–16. To closely analyze what was going onin the problematic areas in the waveforms in Figure 16, the areas marked with 1 and 2 werezoomed in, and the results are shown in Figure 17.
Energies 2022, 15, x FOR PEER REVIEW 15 of 19
(a) (b)
Figure 17. Voltage (blue) and current (cyan) transients; (a) refers to the mark 1 and (b) to the mark 2 in Figure 16. The time base is 10 µs.
It can be noticed that the AC voltage dropped in the first case (Figure 17a) of com-mutation, while it increased in the second case (Figure 17b). This phenomenon cannot be avoided due to the nature of thyristors (gate and reverse recovery time), but it can be reduced to a certain point by adjusting the control, i.e., adjusting the dead time of the thyristors.
Notches, spikes, and oscillation caused by commutations have significant impact on the shape of the u–i characteristic and changes its appearance in such a way that it differs greatly from the theoretically obtained u–i characteristics. Consequently, recorded u–i characteristics are more difficult to interpret than those obtained by theory. Nevertheless, the same conclusions can be drawn regarding the u–i characteristic, i.e., the symmetry of the characteristic indicates the existence of an even-order current harmonics, while the apparent surface on the characteristic quantitatively indicates the reactive power pro-duced by the semiconverter.
Apart from the u–i characteristic recording, a harmonic analysis of the phase current was conducted to draw the link between u–i characteristic shape and harmonic content. The harmonic analysis was carried out for both uncontrolled and controlled rectifiers. Two different firing angles were chosen for the semiconverter according to previous measurements, namely 𝛼 = 45° and 𝛼 = 90°. The measurement results are shown in Ta-ble 1 as well as in the chart in Figure 12.
As can be seen from Table 1 and Figure 12, the most significant even-order harmonic was the second (2nd) harmonic, and the most significant odd-order higher harmonic was the fifth (5th) harmonic. The detail power analysis is shown in Table 2 for different firing angles 𝛼. Moreover, the two most significant odd-order and even-order phase current I1
harmonics were extracted to demonstrate the influence of change in firing angle 𝛼 on the dominant current harmonic value.
The measured phase voltage harmonic spectrum showed the presence of higher har-monics, but they were all odd-order voltage harmonics (the most significant harmonic was 7th with 2.2% of the fundamental voltage), which can be ignored for the purpose of current spectrum analysis. This clearly indicates that appearance of even-order current harmonics is exclusively due to the converter’s topology, i.e., due to the difference in con-trollability of the cathode and anode groups in the converter’s components (Figure 4).
Figure 17. Voltage (blue) and current (cyan) transients; (a) refers to the mark 1 and (b) to the mark 2in Figure 16. The time base is 10 µs.
A zoomed image of mark 1 (Figure 16a) is shown in Figure 17a. The first point ofanalysis of Figure 17a was mark 1, when the thyristor voltage started to lower (thyristorV1 started to conduct, Figure 4). The voltage (blue) fell to the value of mark 2 and stayedat this value for about 26 µs. The current (cyan) in the same time period increased frommark 1 to mark 2 and continued to increase to mark 3. The voltage in mark 3 reached its

Energies 2022, 15, 1614 15 of 18
maximum and started to oscillate (together with the current) to mark 4, where it continuedto follow the sine function, as was the case before the transient appearance. It was obviousthat commutation occurred between mark 1 and mark 4 (lasting about 40 µs).
Analyzing Figure 17b, a similar conclusion could be drawn. On mark 1, the thyristorV1 (Figure 4) unlatched phase current i21, and the current started to drop. The voltageincreased from mark 1 to mark 2 and stabilized there until the current started unlatching(mark 3). From mark 3 to mark 4, voltage and current oscillations occurred, after whichthyristor V1 no longer conducted. Commutation occurred here as well.
It can be noticed that the AC voltage dropped in the first case (Figure 17a) of commuta-tion, while it increased in the second case (Figure 17b). This phenomenon cannot be avoideddue to the nature of thyristors (gate and reverse recovery time), but it can be reduced to acertain point by adjusting the control, i.e., adjusting the dead time of the thyristors.
Notches, spikes, and oscillation caused by commutations have significant impact onthe shape of the u–i characteristic and changes its appearance in such a way that it differsgreatly from the theoretically obtained u–i characteristics. Consequently, recorded u–icharacteristics are more difficult to interpret than those obtained by theory. Nevertheless,the same conclusions can be drawn regarding the u–i characteristic, i.e., the symmetry ofthe characteristic indicates the existence of an even-order current harmonics, while theapparent surface on the characteristic quantitatively indicates the reactive power producedby the semiconverter.
Apart from the u–i characteristic recording, a harmonic analysis of the phase currentwas conducted to draw the link between u–i characteristic shape and harmonic content.The harmonic analysis was carried out for both uncontrolled and controlled rectifiers. Twodifferent firing angles were chosen for the semiconverter according to previous measure-ments, namely α = 45 and α = 90. The measurement results are shown in Table 1 as wellas in the chart in Figure 12.
As can be seen from Table 1 and Figure 12, the most significant even-order harmonicwas the second (2nd) harmonic, and the most significant odd-order higher harmonic wasthe fifth (5th) harmonic. The detail power analysis is shown in Table 2 for different firingangles α. Moreover, the two most significant odd-order and even-order phase current I1harmonics were extracted to demonstrate the influence of change in firing angle α on thedominant current harmonic value.
The measured phase voltage harmonic spectrum showed the presence of higherharmonics, but they were all odd-order voltage harmonics (the most significant harmonicwas 7th with 2.2% of the fundamental voltage), which can be ignored for the purpose ofcurrent spectrum analysis. This clearly indicates that appearance of even-order currentharmonics is exclusively due to the converter’s topology, i.e., due to the difference incontrollability of the cathode and anode groups in the converter’s components (Figure 4).
The total harmonic distortion of current (THDI) can be calculated as follows:
THDI =
√I2
I(1)2 − 1 =
√√√√ ∞
∑n>1
I(n)2
I(1)2 (14)
As can be seen from Table 2, the most significant even-order harmonic (2nd) increasedwith firing angle α, while the most significant odd harmonic (5th) did not have an increasingor decreasing pattern depending on the firing angle α. For better visual representation, achart of the total harmonic distortion of the phase current THDI and power factor λ for allfiring angles α is given in Figure 18.
The THDI increased with the firing angle α, as shown in Table 2 and Figure 18. Thepower factor λ (Table 2 and Figure 18) decreased with increasing firing angle α, as expected,according to expression (13) and Figure 9. The obtained results clearly show the negativeimpact of a semiconverter on the power grid with regard to power quality, especially if it isunderpowered most of the time (higher firing angle α).

Energies 2022, 15, 1614 16 of 18Energies 2022, 15, x FOR PEER REVIEW 17 of 19
Figure 18. Chart of total harmonic distortion of the phase current THDI and power factor λ for all firing angles 𝛼.
The THDI increased with the firing angle 𝛼, as shown in Table 2 and Figure 18. The power factor 𝜆 (Table 2 and Figure 18) decreased with increasing firing angle 𝛼, as ex-pected, according to expression (13) and Figure 9. The obtained results clearly show the negative impact of a semiconverter on the power grid with regard to power quality, espe-cially if it is underpowered most of the time (higher firing angle 𝛼).
6. Conclusions The most significant power quality analysis parameter used in the study is the u–i
characteristic recorded on the AC side of a semiconverter. Here, the symmetry of the u–i characteristic indicates higher-order harmonic presence, while the surface area of the char-acteristic quantitatively depicts the reactive power produced by the semiconverter and injected to the AC power grid.
Despite the simple DC load control, semiconverters have some drawbacks regarding feedback to the power grid that affect power quality. With increasing firing angle 𝛼, the current spectrum of AC grid deteriorates, while power factor 𝜆 decreases. The most neg-ative attribute of semiconverters is the generation of even-order harmonics in AC current spectrum (particularly the second harmonic), which can produce some severe effects, for example on AC transformers, due to the DC magnetic bias phenomenon. Thus, in many cases, they are not the most suitable solution for DC voltage control due to adverse effect on the power grid. While power quality can be improved to some extent with some sort of current filtration, the cost of additional filtering devices can easily exceed the use of a different technical solution.
If neglected, the influence of commutation will cause deviations in analysis between mathematically obtained and recorded u–i characteristic. In real rectifiers, commutation is always present, but its duration differs and depends on the dead time period of the switching devices. In addition to the very complex mathematical analysis of converters in which commutation should be taken into consideration, the problem of estimating dura-tion of the commutation further complicates the mathematical model. The commutation can be closely analyzed in laboratory measurements, where it can be seen that the com-mutation is the main reason mathematical and measured characteristics differ from each other.
Future work should analyze the u–i characteristics for different type of loads and quantify reactive power according to the closed area created by unilateral u–i characteris-tics.
0.000.100.200.300.400.500.600.700.800.901.00
0° 30° 45° 60° 75° 90°
THD
I, 𝜆
Firing angle 𝛼 (°)
THDI λ
Figure 18. Chart of total harmonic distortion of the phase current THDI and power factor λ for allfiring angles α.
6. Conclusions
The most significant power quality analysis parameter used in the study is the u–icharacteristic recorded on the AC side of a semiconverter. Here, the symmetry of theu–i characteristic indicates higher-order harmonic presence, while the surface area of thecharacteristic quantitatively depicts the reactive power produced by the semiconverter andinjected to the AC power grid.
Despite the simple DC load control, semiconverters have some drawbacks regardingfeedback to the power grid that affect power quality. With increasing firing angle α, thecurrent spectrum of AC grid deteriorates, while power factor λ decreases. The mostnegative attribute of semiconverters is the generation of even-order harmonics in ACcurrent spectrum (particularly the second harmonic), which can produce some severeeffects, for example on AC transformers, due to the DC magnetic bias phenomenon. Thus,in many cases, they are not the most suitable solution for DC voltage control due to adverseeffect on the power grid. While power quality can be improved to some extent with somesort of current filtration, the cost of additional filtering devices can easily exceed the use ofa different technical solution.
If neglected, the influence of commutation will cause deviations in analysis betweenmathematically obtained and recorded u–i characteristic. In real rectifiers, commutationis always present, but its duration differs and depends on the dead time period of theswitching devices. In addition to the very complex mathematical analysis of converters inwhich commutation should be taken into consideration, the problem of estimating durationof the commutation further complicates the mathematical model. The commutation can beclosely analyzed in laboratory measurements, where it can be seen that the commutation isthe main reason mathematical and measured characteristics differ from each other.
Future work should analyze the u–i characteristics for different type of loads andquantify reactive power according to the closed area created by unilateral u–i characteristics.
Author Contributions: Conceptualization, A.B.; methodology, A.B. and D.P.; validation, D.P., Z.K.and D.Š.; formal analysis, A.B.; investigation, A.B.; resources, A.B. and D.P.; data curation, D.P.;writing—original draft preparation, A.B.; writing—review and editing, D.P. and Z.K.; supervision,D.P.; project administration, D.Š. All authors have read and agreed to the published version ofthe manuscript.
Funding: This work was funded by the European Union through the European Regional Develop-ment Fund Operational Programme Competitiveness and Cohesion 2014–2020 of the Republic ofCroatia under project KK.01.1.1.04.0034 “Connected Stationary Battery Energy Storage”.
Conflicts of Interest: The authors declare no conflict of interest.

Energies 2022, 15, 1614 17 of 18
References1. Fang, J. More-Electronics Power Systems: Power Quality and Stability, 1st ed.; Power Systems; Springer: Singapore, 2021;
ISBN 978-981-15-8590-6.2. Kaleybar, H.J.; Brenna, M.; Foiadelli, F.; Fazel, S.S.; Zaninelli, D. Power Quality Phenomena in Electric Railway Power Supply
Systems: An Exhaustive Framework and Classification. Energies 2020, 13, 6662. [CrossRef]3. Galla, S.; Wlas, M. The Influence of a Photovoltaic Micro-Installation on the Low-Frequency Parameters of Electricity at PCC and
Its Impact on the Thermal Characteristics of Selected Devices. Energies 2021, 14, 2355. [CrossRef]4. Das, S.R.; Ray, P.K.; Sahoo, A.K.; Ramasubbareddy, S.; Babu, T.S.; Kumar, N.M.; Elavarasan, R.M.; Mihet-Popa, L. A Comprehen-
sive Survey on Different Control Strategies and Applications of Active Power Filters for Power Quality Improvement. Energies2021, 14, 4589. [CrossRef]
5. Jeong, S.-G.; Kim, K.-S.; Kwon, O.; Kwon, B.-H. Direct Single-Power-Conversion Bidirectional Grid-Connected Inverter SolvingCommutation Problem. IEEE Trans. Ind. Electron. 2020, 67, 10335–10345. [CrossRef]
6. Zhou, Y.; Qi, B.; Zheng, M.; Cong, B. A Novel DC Bias Suppression Strategy for Single-Phase Full-Bridge DC-DC Arc WeldingConverter. Electronics 2021, 10, 428. [CrossRef]
7. Gonzalez-Abreu, A.-D.; Delgado-Prieto, M.; Osornio-Rios, R.-A.; Saucedo-Dorantes, J.-J.; Romero-Troncoso, R.-J. A Novel DeepLearning-Based Diagnosis Method Applied to Power Quality Disturbances. Energies 2021, 14, 2839. [CrossRef]
8. Flegar, I. Elektronicki Energetski Pretvaraci; KIGEN d.o.o.: Zagreb, Croatia, 2010; ISBN 9536970856.9. Qi, H.-W.; Zou, D.-X.; Ma, X.-F. Three-Phase Thyristor Trigger Circuit Based on AVR Single-Chip Computer. In Proceedings of the
2016 6th International Conference on Information Communication and Management (ICICM), Hatfield, UK, 29–31 October 2016;pp. 249–252.
10. Huang, H.; Ma, J.; Wang, S.; Dong, Y.; Jiao, N.; Liu, T. Accurate Analysis of Harmonic Transmission of Line CommutatedConverter Considering Firing Angle Fluctuation. IEEE Access 2020, 8, 205206–205215. [CrossRef]
11. Plesca, A. Thermal Analysis of Power Semiconductor Device in Steady-State Conditions. Energies 2019, 13, 103. [CrossRef]12. Le, T.; Melhorn, C.J. Operational and Harmonic Concerns Associated with a Semiconverter. In Proceedings of the IEEE Technical
Conference on Rubber and Plastics Industry, Akron, OH, USA, 26–27 April 1994; pp. 35–41.13. Duff, D.L.; Ludbrook, A. Semiconverter Rectifiers Go High Power. IEEE Trans. Ind. Gen. Appl. 1968, IGA-4, 185–192. [CrossRef]14. Zander, H. Self-Commutated Rectifier to Improve Line Conditions. Proc. Inst. Electr. Eng. UK 1973, 120, 977. [CrossRef]15. Smith, R.L.; Stratford, R.P. Application Considerations in Handling Effects of SCR Generated Harmonics in Cement Plants. IEEE
Trans. Ind. Appl. 1981, IA-17, 63–70. [CrossRef]16. Mansoor, A.; McGee, J.; Peng, F.Z. Even-Harmonics Concerns at an Industrial Facility Using a Large Number of Half-Controlled
Rectifiers. In Proceedings of the APEC ’98 Thirteenth Annual Applied Power Electronics Conference and Exposition, Anaheim,CA, USA, 15–19 February 1998; Volume 2, pp. 994–1000.
17. Buddingh, P.C.; Eng, P. Even Harmonic Resonance—An Unusual Problem. IEEE Trans. Ind. Appl. 2003, 39, 1181–1186. [CrossRef]18. Second Harmonic Components in Power System Voltages and Currents. IEEE Trans. Power Deliv. 2005, 20, 521–523. [CrossRef]19. Department of Electronics and Computers; Escuela Técnica Superior de Nautica; University of Cantabria. Spain; Barros, J.;
de Apráiz, M.; Diego, R.I. Analysis of Second Order Harmonic Voltages in Power Systems. REPQJ 2007, 1, 163–167. [CrossRef]20. Goh, Z.P.; Radzi, M.A.M.; Hizam, H.; Abdul Wahab, N.I. Investigation of Severity of Voltage Flicker Caused by Second Harmonic.
IET Sci. Meas. Technol. 2017, 11, 363–370. [CrossRef]21. Orr, J.A.; Emanuel, A.E. On the Need for Strict Second Harmonic Limits. IEEE Trans. Power Deliv. 2000, 15, 5. [CrossRef]22. Biswas, S.K.; Basak, B.; Swamy, M.M. A Three-Phase Half-Controlled Rectifier with Pulse Width Modulation. IEEE Trans. Ind.
Electron. 1991, 38, 121–125. [CrossRef]23. Park, B.; Lee, J.; Yoo, H.; Jang, G. Harmonic Mitigation Using Passive Harmonic Filters: Case Study in a Steel Mill Power System.
Energies 2021, 14, 2278. [CrossRef]24. Buddingh, P.; Dabic, V.; Groten, H. Oil Field Harmonic Concerns Resulting from High Impedance Sources, Multiple Power
Converters and Long Cables. In Proceedings of the 2008 55th IEEE Petroleum and Chemical Industry Technical Conference,Cincinnati, OH, USA, 22–24 September 2008; pp. 1–9.
25. Yang, C.; Liu, K.; Wang, D.; Su, Y. Harmonic Pollution and Management Measures. In Proceedings of the 2009 InternationalConference on Sustainable Power Generation and Supply, Nanjing, China, 6–7 April 2009; pp. 1–4.
26. Kallio, S.; Piironen, P.; Silventoinen, P. Boost Operation of Three-Phase Half-Controlled Rectifier in Wind Power System UsingPermanent Magnet Generator. In Proceedings of the SPEEDAM 2010, Pisa, Italy, 14–16 June 2010; pp. 403–406.
27. Mao, Z.; Chen, Z.; Chen, Z. Research on the Field Current of a Doubly Salient Electromagnetic Generator with a Half-ControlledPWM Rectifier. In Proceedings of the IECON 2012—38th Annual Conference on IEEE Industrial Electronics Society, Montreal,QC, Canada, 25–28 October 2012; pp. 1405–1409.
28. Rizk, G.; Salameh, S.; Kanaan, H.Y.; Rachid, E.A. Design of Passive Power Filters for a Three-Phase Semi-Controlled Rectifier withTypical Loads. In Proceedings of the 2014 9th IEEE Conference on Industrial Electronics and Applications, Hangzhou, China,9–11 June 2014; pp. 590–595.
29. Bartl, M.; Rubas, P. Artificial Neural Network Regulator Implementation for 50kW Half Controlled Thyristor Rectifier.In Proceedings of the 2015 16th International Scientific Conference on Electric Power Engineering (EPE), Kouty nad Desnou,Czech Republic, 20–22 May 2015; pp. 697–700.

Energies 2022, 15, 1614 18 of 18
30. Doboseriu, D.R.; Bitoleanu, A.; Linca, M. Energetic Performances of an Induction Heating System with Half-Controlled RectifierDestined for Drying of Current Transformers. In Proceedings of the 2016 International Conference on Applied and TheoreticalElectricity (ICATE), Craiova, Romania, 6–8 October 2016; pp. 1–6.
31. Constantin, B.; Dumitru, T.; Adrian, M.; Oana, P. Electro-Mechanic Transient on Starting DC Electrical Machine Using a Semi-Controlled Rectifier. In Proceedings of the 2017 14th International Conference on Engineering of Modern Electric Systems (EMES),Oradea, Romania, 1–2 June 2017; pp. 99–102.
32. Moustafa, A.A.; Moussa, A.M.; El-Gammal, M.A. Separation of Customer and Supply Harmonics in Electrical Power Dis-tribution Systems. In Proceedings of the Ninth International Conference on Harmonics and Quality of Power. Proceedings(Cat. No.00EX441), Orlando, FL, USA, 1–4 October 2000; Volume 3, pp. 1035–1040.
33. Xiao, W. Power Electronics Step-by-Step: Design, Modeling, Simulation, and Control; McGraw Hill: New York, NY, USA, 2021;ISBN 978-1-260-45697-4.
34. Rashid, M.H. (Ed.) Power Electronics Handbook: Devices, Circuits, and Applications Handbook, 4th ed.; Butterworth-Heinemann,an Imprint of Elsevier: Oxford, UK, 2018; ISBN 978-0-12-811407-0.