Adiponectin Receptor1 Expression Is Decreased in the Pancreas of Obese Mice
Upload
independentCategory
view
5download
0
1
Orally active osteoanabolic agent 6-C-β-D-glucopyranosyl-(2S, 3S)-(+)- 5,7, 3',4'- 1
tetrahydroxydihydroflavonol binds to adiponectin receptors, with a preference for AdipoR1, 2
induces adiponectin-associated signaling and improves metabolic health in a rodent model of 3
diabetes. 4
Running title: GTDF is an orally active adiponectin mimetic 5
Abhishek Kumar Singh1,#, Amit Arvind Joharapurkar2,#, Mohd. Parvez Khan3, Jay Sharan Mishra1, 6
Nidhi Singh1, Manisha Yadav1, Zakir Hossain4, Kainat Khan3, Sudhir Kumar5, Nirav Anilkumar 7
Dhanesha2, Devendra Pratap Mishra
5, Rakesh Maurya
5, Sharad Sharma
6, Mukul Rameshchandra 8
Jain2, Arun Kumar Trivedi1, Madan Madhav Godbole7, Jiaur Rahaman Gayen4 , Naibedya 9
Chattopadhyay2 and Sabyasachi Sanyal1,* 10
11
Authors’ affiliations: 12
1Biochemistry Division, CSIR-Central Drug Research Institute, 10 Janakipuram Extn, Sitapur Road, Lucknow 13
226031, UP, India. 2Zydus Research Center, Sarkhej-Bavla NH#8A, Moraiya, Ahmedabad 382210, Gujarat, 14
India. 3Division of Endocrinology, CSIR-Central Drug Research Institute, 10 Janakipuram Extn, Sitapur Road, 15
Lucknow 226031, UP, India. 4Division of Phramacokinetics, CSIR-Central Drug Research Institute, 10 16
Janakipuram Extn, Sitapur Road, Lucknow 226031, UP, India. 5Division of Medicinal and Process Chemistry, 17
CSIR-Central Drug Research Institute, 10 Janakipuram Extn, Sitapur Road, Lucknow 226031, UP, India. 18
6Division of Toxicology, CSIR-Central Drug Research Institute, 10 Janakipuram Extn, Sitapur Road, Lucknow 19
226031, UP, India. 7Department of Molecular Medicine, Sanjay Gandhi Postgraduate Institute of Medical 20
Sciences, Lucknow 226014, UP, India. 21
# These authors contributed equally 22
*Address correspondence to Sabyasachi sanyal, e mail: [email protected], Biochemistry Division, 23
CSIR-Central Drug Research Institute, 10 Janakipuram Extn, Sitapur Road, Lucknow 226031, UP, 24
India ; Tel: (+91)-9792366322; Fax: (+91)-(522)-2771941 25
Word Count 5412 26
Number of Figures 7 27
Page 1 of 56 Diabetes
Diabetes Publish Ahead of Print, published online May 21, 2014
2
ABSTRACT 1
Adiponectin is an adipocytokine that signals through plasma membrane-bound adiponectin 2
receptors (AdipoR) -1 and -2. Plasma adiponectin depletion is associated with type 2 3
diabetes, obesity and cardiovascular diseases. Adiponectin therapy however, is yet 4
unavailable owing to its large size, complex multimerization and functional differences of the 5
multimers. We report discovery and characterization of 6-C-β-D-glucopyranosyl-(2S, 3S)-6
(+)- 5,7, 3',4'- tetrahydroxydihydroflavonol (GTDF) as an orally active adiponectin mimetic. 7
GTDF interacted with both AdipoRs, with a preference for AdipoR1. It induced adiponectin-8
associated signaling and enhanced glucose uptake and fatty acid oxidation in vitro, which 9
were augmented or abolished by AdipoR1 overexpression or silencing respectively. GTDF 10
improved metabolic health, characterized by elevated glucose-clearance, β-cell-survival, 11
reduced steatohepatitis, browning of white adipose tissue and improved lipid profile in an 12
AdipoR1-expressing but not an AdipoR1-depleted strain of diabetic mice. The discovery of 13
GTDF as an adiponectin mimetic provides a promising therapeutic tool for the treatment of 14
metabolic diseases. 15
16
17
18
19
20
21
22
23
24
25
Page 2 of 56Diabetes

3
The anti-inflammatory adipocytokine adiponectin (1; 2) signals through adiponectin 1
receptors (AdipoR) -1 and -2 (3). T-cadherin, a cadherin family member that lacks 2
transmembrane and cytoplasmic domains also binds adiponectin, and is proposed to affect its 3
bioavailability (4). Plasma adiponectin depletion is associated with type 2 diabetes, obesity 4
and cardiovascular diseases (5-7). Adiponectin administration or overexpression ameliorates 5
insulin resistance, metabolic syndrome and atherosclerosis in animals (3; 8-12) and enhances 6
pancreatic β cell survival (13). These evidences make AdipoRs important therapeutic targets 7
for metabolic diseases. 8
Structurally, adiponectin belongs to the complement 1q family (1; 14; 15). 9
Adipoenctin monomer is a 30 kDa protein consisting of an N-terminal collagenous and a C-10
terminal globular domains (1). Mammalian plasma adiponectin is present in several 11
multimeric forms; low-molecular-weight dimer or trimers, medium-molecular-weight 12
hexamers or high-molecular-weight (HMW) dodecamers and 18 mers (10; 16-18). The 13
globular domain of adiponectin (gAd) can form trimers and was initially shown to exist as a 14
proteolytic cleavage product in human plasma (10), although subsequent studies failed to 15
detect it in circulation, its ability to modulate AdipoRs is undisputed. All these forms display 16
different levels of physiological activity and the HMW complex is considered the most 17
clinically relevant form (10; 16-18). The HMW full-length adiponectin and gAd 18
preferentially signal through AdipoR2 and AdipoR1 respectively (3). Given the 19
multimerization-related complexities of adiponectin structure and function, it appears that 20
small molecule AdipoR ligands may provide the only viable therapeutic option against 21
diseases associated with defects in adiponectin expression or action. 22
We have previously identified GTDF, a novel natural analog of the dietary flavonoid 23
quercetin, as a potent orally bioavailable osteoanabolic compound that induced proliferation, 24
differentiation and mineralization of cultured primary osteoblasts at a nanomolar 25
Page 3 of 56 Diabetes
4
concentration that was 1000 fold less than effective concentration of quercetin or queretin-O-1
glucoside, and restored trabecular bones of osteopenic rats on a par with parathyroid hormone 2
(19). While studying its mechanism of action, we found that GTDF induced rapid AMP–3
dependent protein kinase (AMPK), AKT and p38 phosphorylation and elevated PGC-1α 4
expression in osteoblasts. GTDF also deacetylated tumor suppressor P53 via indirect 5
activation of NAD-dependent deacetylase Sirtuin1 (sirt1) [(20), and manuscript in 6
preparation, SS and NC)]. Literature search revealed that adiponectin elicits similar cellular 7
signaling (1; 3; 11). Interestingly, the quercetin group of compounds display functional 8
properties similar to adiponectin, such as AMPK activation, glucose uptake enhancement, 9
induction of fatty acid oxidation-related genes and amelioration of diabetes and insulin 10
resistance in vivo (21-23). We thus asked if GTDF, quercetin or other naturally occurring 11
quercetin analogs could be adiponectin mimetics. Here we report detailed characterization of 12
GTDF as an adiponectin mimetic that improves metabolic health in a rodent model of 13
diabetes. 14
15
RESEARCH DESIGN AND METHODS 16
Materials and kits: All cell culture reagents were from Invitrogen, Life Technologies 17
(Carlsbad, CA). Fine chemicals were from Sigma-Aldrich (St. Louis, MO) unless otherwise 18
indicated. Epoxy agarose beads conjugated with GTDF were constructed at Shantani Biotech 19
(Pune, India). Globular adiponectin (gAd) was purchased from Enzo Life Sciences 20
(Farmingdale, NY) and ATGen Global (Gyeonggi-do, South Korea) and compared; gAd 21
from both sources showed identical activity; gAd from ATGen Global was used in this study. 22
GW7647 was from Sigma-Aldrich, full length human AdipoR1 and AdipoR2 mammalian 23
expression constructs were from Open Biosystems (Huntsville, AL). 125
I-gAd was from 24
Phoenix Pharmaceuticals (Burlingame, CA), 125
I (20 MBq) used for radiolabeling GTDF was 25
Page 4 of 56Diabetes

5
from BARC (Mumbai, India). Glycogen assay kit was from Sigma-Aldrich (St. Louis, 1
Missouri). Serum concentrations of triglycerides, nonesterified free fatty acids (NEFA), 2
HDL, LDL,VLDL, total cholesterol, beta-hydroxybutyrate, and creatinine were determined 3
using kits purchased from Pointe Scientific (Canton, MI, USA).Circulating glucagon, insulin, 4
C-peptide, leptin, adiponectin, ghrelin, corticosterone and markers of inflammation (MCP-1, 5
TNF-α, and IL-6) were estimated using enzyme-linked immunosorbent assay (ELISA) assay 6
kits (R&D Systems, Minneapolis, MN). Serum concentrations of sodium and potassium were 7
measured using a Cobas c system (Roche Diagnostics; Indianapolis, IN). TUNEL assay kit 8
was from Roche Applied Science (Indianapolis, IN). Plasma membrane extraction kit was 9
from Biovision (Milpitas, CA). 10
Cell culture and induction of differentiation 11
HEK-293, CHO, C2C12 and 3T3L-1 cell-lines were cultured as reported (24). Mouse stromal 12
vascular fraction (SVF) was prepared from epididymal fat pad by collagenase digestion. 13
Human SVFs were prepared from human lipoaspirates (subcutaneous), collected following 14
approval of Institutional Ethical Committee. Cells were differentiated in presence of GTDF 15
or vehicle for 10d (3T3L-1 and mouse SVF) or 21d (human SVF), using standard procedure, 16
and then analyzed by QPCR, immunoblotting or microscopy. 17
Iodination and purification of 125
I-GTDF 18
GTDF was radio-labeled as previously described for quercetin1 with minor modifications. 19
Briefly, 10µl of 125
I (20 MBq; BARC, Mumbai, India) was added to 100µg GTDF in 5% 20
acetic acid/methanol, then chloramine-T (4µg in MilliQ H2O) was added, and the mixture 21
was allowed to react at room temperature (240C) for 5 min. The reaction was terminated by 22
adding 60µl sodium metabisulphite (4mg/ml in MilliQ H2O).The reaction mixture was dried 23
by passing nitrogen and was dissolved into methanol (100 µl). Reverse phase TLC (RP-18 24
Page 5 of 56 Diabetes
6
F254s, Merck, 8cm in length) was used to purify 125
I-GTDF from free iodine and unlabeled 1
compound using methanol-water (40%-60%) as mobile phase. Following run, the TLC plate 2
was cut into pieces of 0.5mm each and the distribution of radioactivity along the plate was 3
measured in a gamma Counter. TLC of the blank reaction suggested the location of free 125
I 4
in the TLC plate. The RF value of the labeled compound was determined by gamma 5
counting. The area showing maximum activity at distance of 40 to 60 mm was eluted from 6
the TLC plate, and was washed with methanol, centrifuged, decanted and dried under N2. 7
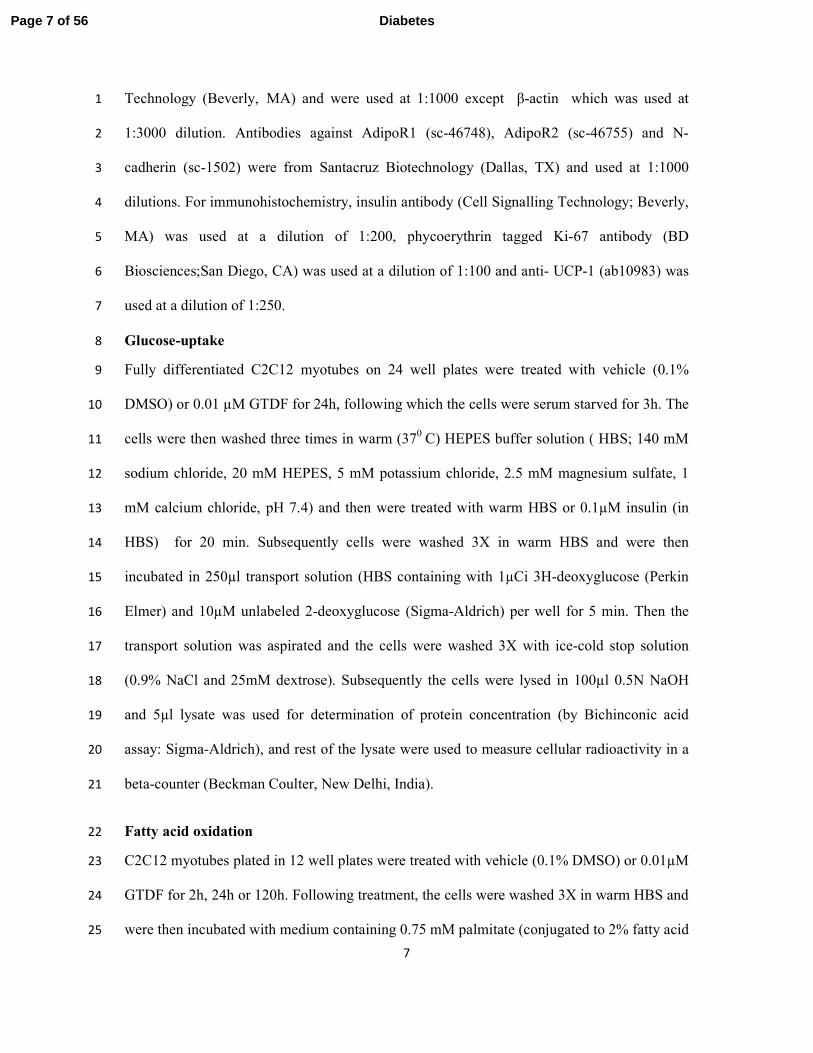
Overexpression and silencing experiments 8
Plasmid transfections were performed with Lipofectamine LTX (Life Technologies 9
Carlsbad, CA) reagent according to manufacturer’s protocols. For C2C12 transfections, 10
C2C12 myoblasts were trypsinized and transfected. The cells were then grown till 60-70% 11
confluence. They were then differentiated and assessed as required. For RNA interference, 12
siRNAs (siAdipoR1; L-063377-01-0010and siC; siRNA against luciferase GL3 duplex D-13
001400-01-50) were purchased from Thermo Scientific (Pittsburgh, PA). Cells were 14
transfected with 0.1µM of each siRNA using DharmaFECT 1 transfection reagent (Thermo 15
Scientific). 72 h after transfection cells were treated and were analyzed as required. 16
QPCR, Western blotting, co-immunoprecipitation 17
These studies were performed as previously described (24). List of primer sequences for 18
qPCR has been provided in supplementary table 5. Anti-PGC-1α (ST1202; Millipore, 19
Billerica, MA) was used at 1:2000 dilution and anti-CD36 (18836-1-AP; Proteintech 20
(Chicago, IL) was used at 1:1000 dilution. Anti-UCP-1 (ab10983) -UCP3 (ab3477) and -21
PPARα (ab8934); Abcam (Cambridge, MA) were used at 1:1000 dilutions. Phospho AMPK 22
(Thr172), AMPK, phospho p38(Thr 180/ Tyr 182), p38, phospho ACC, ACC, Glut4, P53, 23
Acetyl-P53 (Lys 382), C/EBPβ, and β-actin antibodies were from Cell Signalling 24
Page 6 of 56Diabetes
7
Technology (Beverly, MA) and were used at 1:1000 except β-actin which was used at 1
1:3000 dilution. Antibodies against AdipoR1 (sc-46748), AdipoR2 (sc-46755) and N-2
cadherin (sc-1502) were from Santacruz Biotechnology (Dallas, TX) and used at 1:1000 3
dilutions. For immunohistochemistry, insulin antibody (Cell Signalling Technology; Beverly, 4
MA) was used at a dilution of 1:200, phycoerythrin tagged Ki-67 antibody (BD 5
Biosciences;San Diego, CA) was used at a dilution of 1:100 and anti- UCP-1 (ab10983) was 6
used at a dilution of 1:250. 7
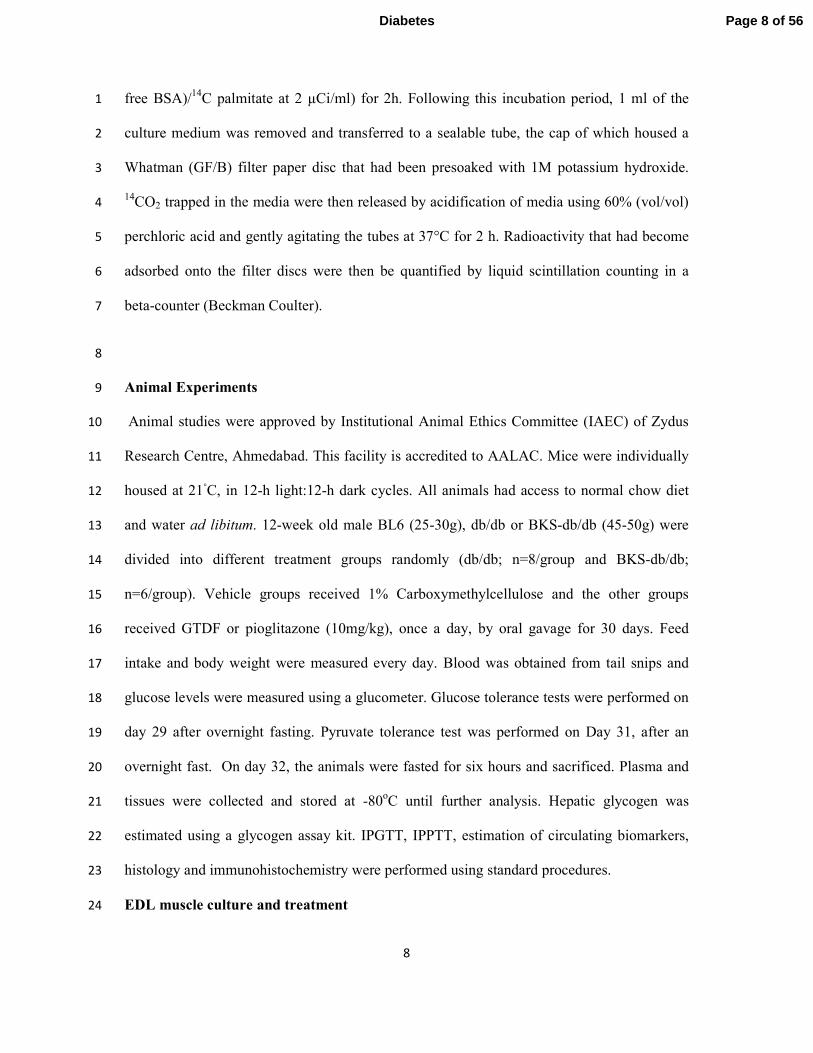
Glucose-uptake 8
Fully differentiated C2C12 myotubes on 24 well plates were treated with vehicle (0.1% 9
DMSO) or 0.01 µM GTDF for 24h, following which the cells were serum starved for 3h. The 10
cells were then washed three times in warm (370
C) HEPES buffer solution ( HBS; 140 mM 11
sodium chloride, 20 mM HEPES, 5 mM potassium chloride, 2.5 mM magnesium sulfate, 1 12
mM calcium chloride, pH 7.4) and then were treated with warm HBS or 0.1µM insulin (in 13
HBS) for 20 min. Subsequently cells were washed 3X in warm HBS and were then 14
incubated in 250µl transport solution (HBS containing with 1µCi 3H-deoxyglucose (Perkin 15
Elmer) and 10µM unlabeled 2-deoxyglucose (Sigma-Aldrich) per well for 5 min. Then the 16
transport solution was aspirated and the cells were washed 3X with ice-cold stop solution 17
(0.9% NaCl and 25mM dextrose). Subsequently the cells were lysed in 100µl 0.5N NaOH 18
and 5µl lysate was used for determination of protein concentration (by Bichinconic acid 19
assay: Sigma-Aldrich), and rest of the lysate were used to measure cellular radioactivity in a 20
beta-counter (Beckman Coulter, New Delhi, India). 21
Fatty acid oxidation 22
C2C12 myotubes plated in 12 well plates were treated with vehicle (0.1% DMSO) or 0.01µM 23
GTDF for 2h, 24h or 120h. Following treatment, the cells were washed 3X in warm HBS and 24
were then incubated with medium containing 0.75 mM palmitate (conjugated to 2% fatty acid 25
Page 7 of 56 Diabetes
8
free BSA)/14
C palmitate at 2 µCi/ml) for 2h. Following this incubation period, 1 ml of the 1
culture medium was removed and transferred to a sealable tube, the cap of which housed a 2
Whatman (GF/B) filter paper disc that had been presoaked with 1M potassium hydroxide. 3
14CO2 trapped in the media were then released by acidification of media using 60% (vol/vol) 4
perchloric acid and gently agitating the tubes at 37°C for 2 h. Radioactivity that had become 5
adsorbed onto the filter discs were then be quantified by liquid scintillation counting in a 6
beta-counter (Beckman Coulter). 7
8
Animal Experiments 9
Animal studies were approved by Institutional Animal Ethics Committee (IAEC) of Zydus 10
Research Centre, Ahmedabad. This facility is accredited to AALAC. Mice were individually 11
housed at 21◦C, in 12-h light:12-h dark cycles. All animals had access to normal chow diet 12
and water ad libitum. 12-week old male BL6 (25-30g), db/db or BKS-db/db (45-50g) were 13
divided into different treatment groups randomly (db/db; n=8/group and BKS-db/db; 14
n=6/group). Vehicle groups received 1% Carboxymethylcellulose and the other groups 15
received GTDF or pioglitazone (10mg/kg), once a day, by oral gavage for 30 days. Feed 16
intake and body weight were measured every day. Blood was obtained from tail snips and 17
glucose levels were measured using a glucometer. Glucose tolerance tests were performed on 18
day 29 after overnight fasting. Pyruvate tolerance test was performed on Day 31, after an 19
overnight fast. On day 32, the animals were fasted for six hours and sacrificed. Plasma and 20
tissues were collected and stored at -80oC until further analysis. Hepatic glycogen was 21
estimated using a glycogen assay kit. IPGTT, IPPTT, estimation of circulating biomarkers, 22
histology and immunohistochemistry were performed using standard procedures. 23
EDL muscle culture and treatment 24
Page 8 of 56Diabetes
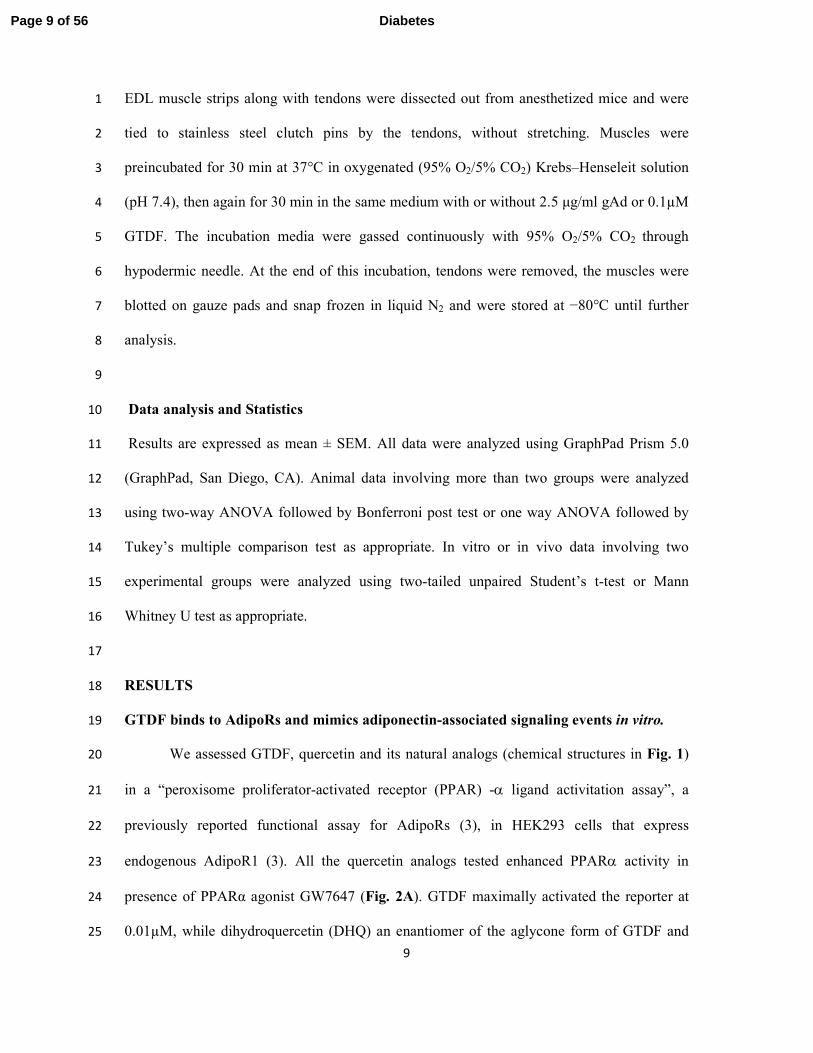
9
EDL muscle strips along with tendons were dissected out from anesthetized mice and were 1
tied to stainless steel clutch pins by the tendons, without stretching. Muscles were 2
preincubated for 30 min at 37°C in oxygenated (95% O2/5% CO2) Krebs–Henseleit solution 3
(pH 7.4), then again for 30 min in the same medium with or without 2.5 µg/ml gAd or 0.1µM 4
GTDF. The incubation media were gassed continuously with 95% O2/5% CO2 through 5
hypodermic needle. At the end of this incubation, tendons were removed, the muscles were 6
blotted on gauze pads and snap frozen in liquid N2 and were stored at −80°C until further 7
analysis. 8
9
Data analysis and Statistics 10
Results are expressed as mean ± SEM. All data were analyzed using GraphPad Prism 5.0 11
(GraphPad, San Diego, CA). Animal data involving more than two groups were analyzed 12
using two-way ANOVA followed by Bonferroni post test or one way ANOVA followed by 13
Tukey’s multiple comparison test as appropriate. In vitro or in vivo data involving two 14
experimental groups were analyzed using two-tailed unpaired Student’s t-test or Mann 15
Whitney U test as appropriate. 16
17
RESULTS 18
GTDF binds to AdipoRs and mimics adiponectin-associated signaling events in vitro. 19
We assessed GTDF, quercetin and its natural analogs (chemical structures in Fig. 1) 20
in a “peroxisome proliferator-activated receptor (PPAR) -α ligand activitation assay”, a 21
previously reported functional assay for AdipoRs (3), in HEK293 cells that express 22
endogenous AdipoR1 (3). All the quercetin analogs tested enhanced PPARα activity in 23
presence of PPARα agonist GW7647 (Fig. 2A). GTDF maximally activated the reporter at 24
0.01µM, while dihydroquercetin (DHQ) an enantiomer of the aglycone form of GTDF and 25
Page 9 of 56 Diabetes
10
quercetin-6-C-β-D-glucopyranoside (QCG) did so at 0.1µM, and quercetin, quercetin-3-O-β-1
D-glucopyranoside (QOG) or quercetin-3-O-α-L-rhamnopyranoside (QR) caused maximal 2
activation at 1µM (Fig. 2A). Amplitudes of activation of PPARα ligand activity by GTDF 3
and gAd were comparable (Fig. 2B). GTDF did not activate PPARα in absence of GW7647, 4
indicating that it was not a PPARα agonist per se (Fig. 2C). 5
To assess if GTDF and AdipoRs could physically interact, we immobilized GTDF on 6
agarose beads and performed a pull-down assay with purified plasma membrane from C2C12 7
myotubes that expressed both AdipoR1 and R2 (3). GTDF beads but not control beads 8
successfully pulled down AdipoR1 and R2, and free GTDF or QCG competed with this 9
binding (Fig. 2D). Cold GTDF competed with 125
I-adiponectin for binding to C2C12 cells in 10
a radioligand binding assay (Fig. 2E). Radioligand saturation assays with 125
I labeled GTDF 11
(Fig. 2F) or 125
I-gAd (Supplementary Figure 2) revealed that both these ligands bound to 12
AdipoR-deficient chinese hamster ovary (CHO) cells (25) transfected with AdipoR1 or R2 13
but not empty expression plasmids (Fig. 2G) (GTDF: Kd and BMAX; 4.90nM and 14
1410fmol/mg of protein for AdipoR1 and 326 nM and 3950 fmol/mg of protein for AdipoR2; 15
gAd: Kd and BMAX 0.25 µg/ml and 130ng/mg for AdipoR1 and 0.526 µg/ml and 200ng/mg for 16
AdipoR2). Thus GTDF displayed about 70 fold more affinity towards AdipoR1 over 17
AdipoR2. 18
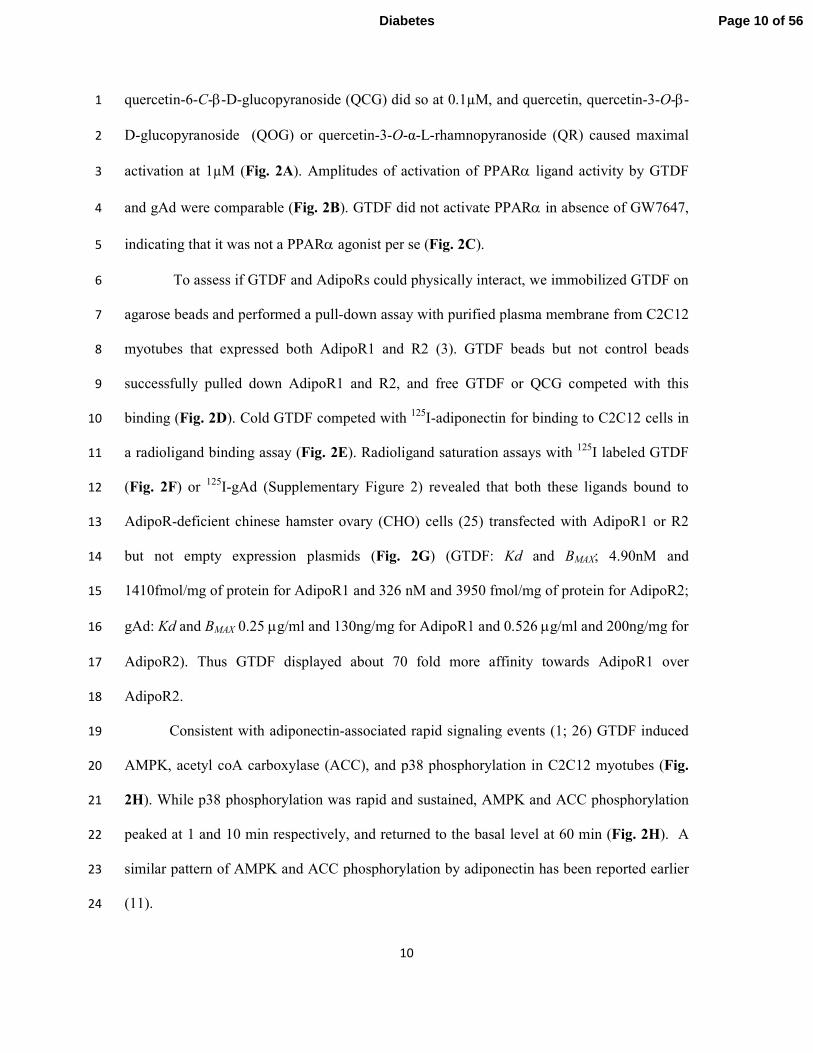
Consistent with adiponectin-associated rapid signaling events (1; 26) GTDF induced 19
AMPK, acetyl coA carboxylase (ACC), and p38 phosphorylation in C2C12 myotubes (Fig. 20
2H). While p38 phosphorylation was rapid and sustained, AMPK and ACC phosphorylation 21
peaked at 1 and 10 min respectively, and returned to the basal level at 60 min (Fig. 2H). A 22
similar pattern of AMPK and ACC phosphorylation by adiponectin has been reported earlier 23
(11). 24
Page 10 of 56Diabetes
11
Apart from adiponectin glutamate receptors also activate AMPK and p38 (27), and we 1
therefore assessed if GTDF could modulate these two receptors, however, GTDF failed to 2
bind to or activate/repress any of the ionotropic or metabotropic glutamate receptors (mGlu), 3
while quercetin strongly activated mGlu2 and inhibited mGlu 4,-6 and -8 (Supplementary 4
Tables S1 and S2). To also assess if these signaling events were mediated through one or 5
more G-protein coupled receptors (GPCR), GPCR modulation by GTDF was assessed and it 6
failed to activate or repress any of the 158 GPCRs tested (Supplementary Tables S3 and S4). 7
Consistent with its activation of adiponectin-associated signaling, GTDF enhanced 8
mRNA and protein levels of factors associated with fatty acid transport [CD36 and fatty acid 9
binding protein 3 (FABP3)], oxidation [(carnityl palmitoyl transferase 1 b; CPT1B), long 10
chain fatty acyl CoA synthetase (FACS), acetyl CoA oxidase (ACOX1), PPARα and 11
PPARδ)], mitochondrial biogenesis (PPARγ coactivator-1α; PGC-1α), mitochondrial 12
uncoupling protein (UCP) -3, and glucose transporter 4 (Glut4), while lipoprotein lipase 13
(LPL) and PPARγ were unchanged (Fig. 2I and 2J). Adiponectin deacetylates and activates 14
PGC-1α via indirect activation of Sirt1 (26), and consistent with its indirect sirt1 activation 15
(20), GTDF too deacetylated PGC-1α in C2C12 myotubes (Fig. 2K). This PGC-1α induction 16
and activation led to increased mitochondrial DNA copy number (Fig. 2L). gAd enhances 17
basal glucose uptake (3; 11) and increases insulin-sensitivity(28) in C2C12 myotubes, and in 18
consistence, GTDF too enhanced basal and insulin-stimulated glucose uptake in these cells 19
(Fig. 2M). Further, GTDF also significantly enhanced basal and insulin-dependent glucose 20
uptake in a C2C12 myotube model of palmitate-induced insulin resistance (Fig. 2N). Similar 21
to rapid enhancement of fatty acid oxidation by adiponectin (3; 11; 29), GTDF significantly 22
enhanced 14
C palmitate oxidation in C2C12 myotubes within 2h, which increased further 23
over time (Fig. 2O). 24
25
Page 11 of 56 Diabetes
12
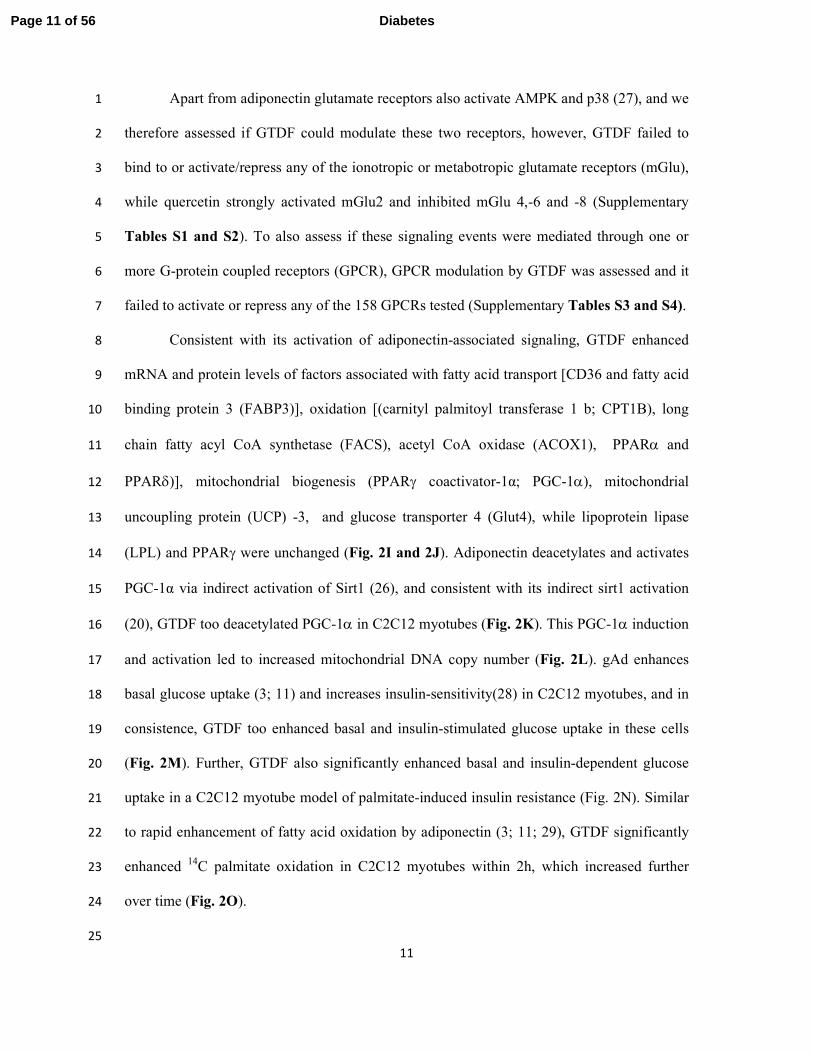
Overexpression or silencing of AdipoR1 augments or mitigates GTDF functions in vitro. 1
GTDF significantly enhanced insulin-stimulated glucose uptake in CHO/HIRc cells 2
[CHO cells expressing ectopic human insulin receptor (30)] transfected with AdipoR1 but not 3
empty plasmid (Fig. 3A). Consistent with the binding studies AdipoR1 but not AdipoR2 4
overexpression in C2C12 myotubes significantly enhanced GTDF-stimulated AMPK, ACC 5
and p38 phosphorylation (Fig. 3B). Small interfering RNA (siRNA) for AdipoR1 6
(siAdipoR1) but not control siRNA against luciferase (siC) abolished GTDF-induced AMPK, 7
ACC and p38 phosphorylation, without affecting AdipoR2 expression. Further, GTDF-8
stimulated glucose uptake and fatty acid oxidation were abolished by siAdipoR1 (Fig. 3C-9
3E), while insulin-stimulated glucose uptake was unaltered (Fig. 3D). Together with Fig 1 10
and supplementary tables 1-4, these results demonstrate that GTDF action indeed is 11
AdipoR1-specific. 12
13
BKS.Cg-Dock7m +/+ Lepr
db/db/J (BKS-db/db) mice have severely depleted plasma 14
membrane-associated AdipoR1 compared to B6.BKS(D)-Leprdb/db
/J (db/db) mice. 15
A relevant animal model to test AdipoR-specificity of GTDF would have been 16
AdipoR1/R2 knockout mice subjected to diet-induced obesity. However, our inability to 17
obtain the knockout mice led us to search for an alternate model. Since chronic high level of 18
plasma insulin causes an AdipoR-depletion mediated adiponectin-resistance (31), we 19
systematically investigated AdipoR expression in major adiponectin target organs, across 20
different age groups in two different strains of leptin receptor-deficient obese and diabetic 21
mice; db/db (in C57BL/6J background) and BKS-db/db (in BLKS/J background), and wild 22
type healthy C57BL/6J (BL6). 23
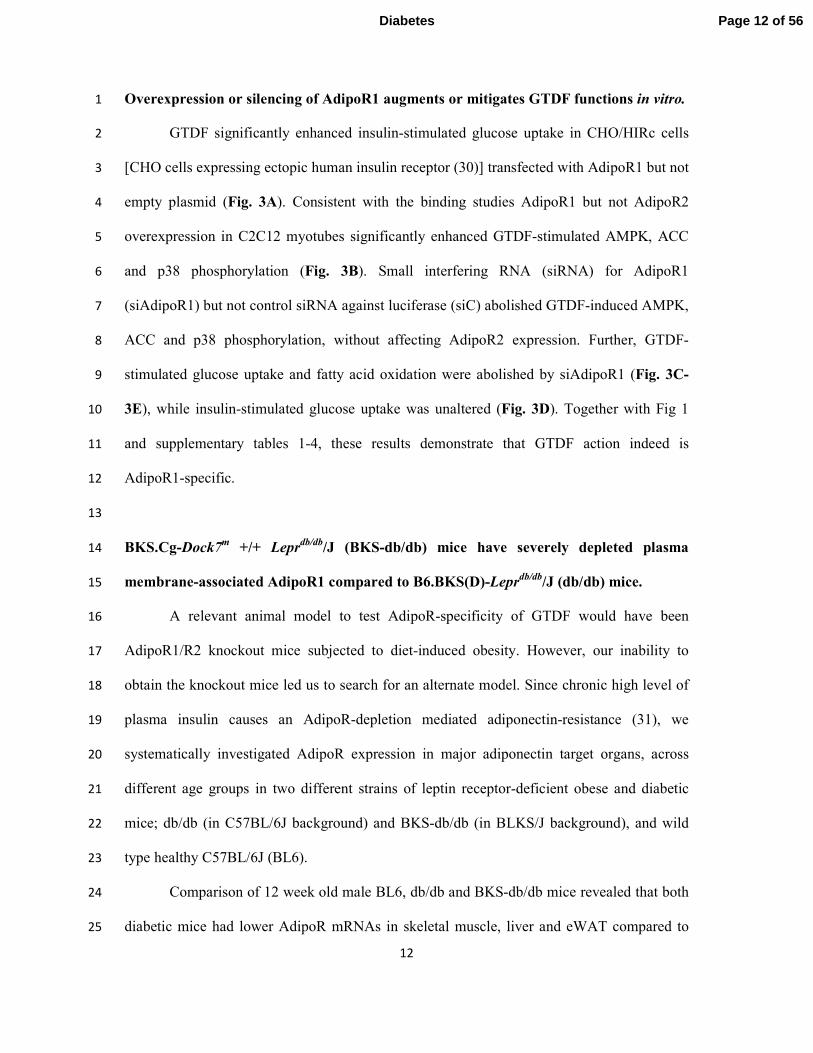
Comparison of 12 week old male BL6, db/db and BKS-db/db mice revealed that both 24
diabetic mice had lower AdipoR mRNAs in skeletal muscle, liver and eWAT compared to 25
Page 12 of 56Diabetes
13
the healthy BL6 mice, however, between the diabetic strains only modest differences were 1
observed (Fig. 4A). 2
Examination of total and plasma membrane (PM) -associated AdipoR protein levels 3
however, revealed striking differences between the two diabetic strains. While BKS-db/db 4
displayed >80% decrease in total and PM-associated and therefore functional AdipoR1 5
expression in skeletal muscle, BL6 and db/db did not show significant difference (Fig. 4B). 6
In liver, PM AdipoR1 but not AdipoR2 was strongly depleted (≥80%) in BKS-db/db but not 7
in db/db, while compared to BL6 total AdipoR1 and R2 proteins were diminished in both. In 8
WAT, both diabetic strains displayed >90% reduction in total AdipoR1 protein compared to 9
BL6, while AdipoR2 protein was not detected (Fig. 4B). AdipoR2 could not be detected in 10
PM fraction of skeletal muscle (Fig. 4B) and we failed to generate enough PM extract from 11
WAT for immunoblotting. Together, compared to db/db and BL6, BKS-db/db displayed 12
severely depleted total and PM AdipoR1 protein in skeletal muscle and liver at 12 weeks of 13
age. Consistent with this observation, gAd and GTDF failed to induce AMPK 14
phosphorylation in extensor digitorium longinus (EDL) muscles of BKS-db/db, while it did 15
so in EDL muscles from both BL6 and db/db mice (Fig. 4C). Thus, based on above evidences 16
we selected 12-week old male db/db mice as adiponectin-sensitive, and age and sex matched 17
BKS-db/db as adiponectin-resistant models for the in vivo pharmacological studies. 18
19
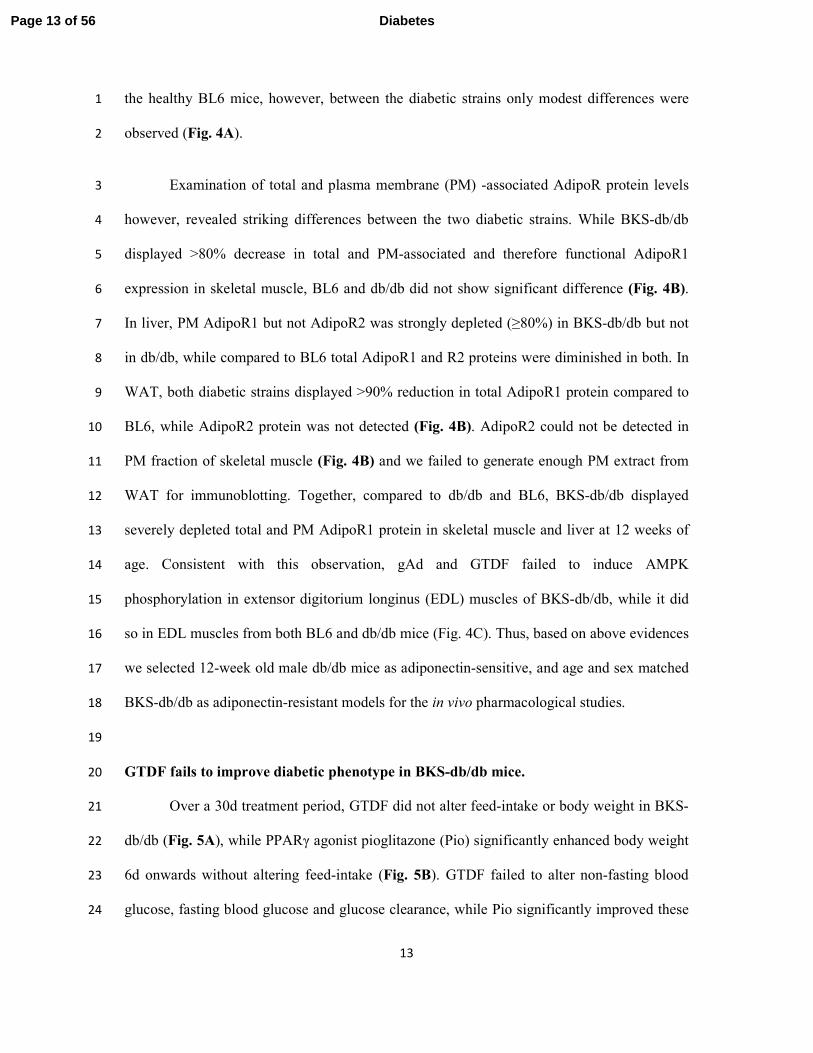
GTDF fails to improve diabetic phenotype in BKS-db/db mice. 20
Over a 30d treatment period, GTDF did not alter feed-intake or body weight in BKS-21
db/db (Fig. 5A), while PPARγ agonist pioglitazone (Pio) significantly enhanced body weight 22
6d onwards without altering feed-intake (Fig. 5B). GTDF failed to alter non-fasting blood 23
glucose, fasting blood glucose and glucose clearance, while Pio significantly improved these 24
Page 13 of 56 Diabetes
14
parameters (Fig. 5Cand 5D). GTDF failed to alter plasma glycated haemoglobin (HbA1c) 1
and insulin (Fig. 5E and 5F). GTDF was ineffective in improving the fasting lipid profile in 2
these mice, while pio modestly but significantly reduced plasma TG and VLDL (Fig. 5G). 3
These results indicate that GTDF is ineffective in BKS-db/db mice that display severely 4
depleted AdipoR1 protein in skeletal muscle and liver. That pio improved glycemic 5
parameters in these mice further indicates that GTDF did not function through the PPARγ 6
pathway. 7
8
GTDF ameliorates diabetic phenotype in AdipoR1-expressing db/db mice. 9
In contrast to its inefficacy in BKS-db/db (Fig. 5), GTDF was remarkably effective in 10
AdipoR1-expressing db/db mice. It reduced feed intake in db/db but not BL6 (Fig. 6A), 11
which could be correlated with a robust reduction in serum ghrelin (Fig. 6N). GTDF-treated 12
db/db mice displayed reducing trend in body weight, which however was not statistically 13
significant (Fig. 6B) and showed significantly reduced adipose tissue weight (Supplementary 14
Figure 3). GTDF remarkably reduced nonfasting blood glucose in db/db mice on the 7th
day 15
of treatment (Fig. 6C). Reduction in feed intake could not be responsible for the GTDF-16
induced reduction in nonfasting glucose level in db/db, as the feed intake was significantly 17
different only after 16d of treatment, while nonfasting blood glucose was drastically reduced 18
at the 7th
day and did not fall any further. 19
GTDF modestly yet significantly reduced fasting blood glucose in db/db but not in 20
BL6 (Fig. 6D), which was associated with modestly reduced hepatic gluconeogenesis as 21
revealed by a pyruvate tolerance test (PTT) (Fig. 6E). GTDF treatment prevented increase in 22
HbA1c in db/db, which increased in the vehicle-treated db/db during the treatment period 23
(Fig. 6F). In intraperitoneal glucose tolerance tests (IPGTT), GTDF-treated db/db mice 24
Page 14 of 56Diabetes
15
showed remarkably improved glucose clearance (Fig. 6G), however, both fasting insulin as 1
well as insulin levels during glucose challenge was higher in these mice over vehicle-treated 2
controls, while they were unchanged in BL6 mice (Fig. 6G-6I). The enhanced insulin level 3
was associated with increase in pancreatic C-peptide (Fig. 6J), indicating that insulin 4
production was higher in GTDF-treated db/db mice. However, hypokalemia, generally 5
associated with higher insulin, was not observed (Fig. 6K). 6
Pancreatic histomorphometry revealed that in vehicle-treated db/db mice, islet number 7
was diminished in comparison to BL6, and GTDF significantly increased it in the former but 8
not later (Fig. 6Land 6M). Furthermore, about 30% of the β cell population in the islets of 9
vehicle-treated db/db mice were apoptotic as determined by TUNEL staining whilst GTDF 10
markedly attenuated the number of apoptotic β cells (Fig. 6L and 6M). The increased islet 11
number in GTDF treated db/db pancreas was not due to cellular proliferation as the islets 12
from these mice did not stain for the proliferation marker Ki-67 (Fig. 6l), indicating that 13
GTDF might protect beta cells from gluco- and lipotoxicity-induced apoptosis. Serum 14
glucagon level was unchanged (Fig. 6N). 15
Consistent with anti-inflammatory properties of adiponectin, GTDF treatment in 16
db/db mice significantly lowered serum tumor necrosis factor alpha (TNFα), and interleukin 17
6 (IL6) showed a reducing trend, whilst monocyte / macrophage chemoattractant protein-1 18
(MCP-1) was unchanged (Fig. 6N). While serum adiponectin showed an increasing trend 19
upon GTDF treatment (p=0.082), leptin level was greatly diminished (Fig. 6N). We also 20
found a robust fall in serum corticosterone (Fig. 6N), indicating that GTDF might be cardio-21
protective. Analysis of serum lipid profile revealed significant reductions in total cholesterol, 22
triglyceride (TG), very low-density lipoprotein (VLDL), non-esterified fatty acids (NEFA) 23
and ketone bodies (β-OH butyrate) which supports an enhanced fatty acid oxidation rate, 24
while it significantly enhanced high density lipoprotein (HDL) level (Fig. 6N), reiterating its 25
Page 15 of 56 Diabetes
16
cardioprotective promise. Low–density lipoprotein (LDL) and creatinine levels were 1
unchanged (Fig. 6N). In light of the lipid profile data, we examined the hepatic histology, and 2
sections from GTDF-treated db/db mice displayed no vacuolation and lipid accumulation, 3
while the vehicle-treated db/db exhibited robust lipid accumulation (Fig. 6O). Hepatic 4
glycogen level was unchanged (Fig. 6P). Together, Fig. 5 and 6 indicated that GTDF stalls 5
diabetes progression in AdipoR-expressing db/db mice and improves their overall metabolic 6
health, while it is ineffective in AdipoR1-depleted BKS-db/db. 7
GTDF induces browning of white adipose tissue, evidence of involvements of direct and 8
indirect pathways. 9
GTDF induced and activated PGC-1α in myocytes and PGC-1α is reported to induce 10
FNDC5, a myokine that drives browning of myf-5-negative white adipocytes (32). GTDF 11
indeed enhanced FNDC5 expression in C2C12 myotubes and increased its secretion in 12
culture medium (Fig. 7A) indicating that it might induce FNDC5 in circulation and thereby 13
promote browning of WAT. Histological analysis of epididymal WAT (eWAT) from GTDF 14
treated db/db mice revealed robust fat mobilization characterized by reduction in adipocyte 15
size (Fig. 7B) and these eWATs stained strongly for the brown adipose marker UCP-1 (Fig. 16
7C), indicating that GTDF indeed induced a browning “like” phenomenon. 17
Adipocyte-specific transgenic overexpression of adiponectin is reported to mobilize 18
WAT, enhance UCPs and decrease TNFα and leptin level in this tissue (33), indicating that 19
adiponectin may also promote a FNDC5-independent browning of WAT through a direct 20
action on adipocytes. Differentiation of 3T3L-1 cells in presence of GTDF from day 0 or day 21
2 of differentiation reduced oil-droplet accumulation in these cells and significantly reduced 22
triglyceride content (Fig. 7D and 7E). Differentiation of 3T3L-1, mouse (epididymal) or 23
human SVFs in presence of GTDF enhanced expressions of UCP-1, UCP-2, PGC-1α, brown 24
adipose determination factor PRDM16, brown-fat-enriched protein CIDEA and adiponectin 25
Page 16 of 56Diabetes
17
(Fig. 7F-7H). PRDM16 and ccaat/enhancer protein beta (C/EBPβ) transcriptional complex 1
has been implicated in conversion of myf-5 positive myoblasts into BAT (34), and GTDF 2
also induced the expression of c/EBPβ in 3T3L-1, mouse and human SVF (Fig. 7H), 3
indicating that this complex may play an important role in the browning phenomenon 4
observed here. Consistent with elevated browning markers, GTDF increased mitochondrial 5
DNA content in mouse SVFs (Fig. 7I). Notably; GTDF did not activate β-adrenergic 6
receptors (Supplementary Tables 3 and 4 and Fig. 7J). 7
8
9
DISCUSSION 10
Following comprehensive molecular characterizations, we have identified GTDF as 11
an orally active, small molecule adiponectin mimic that improves metabolic parameters in a 12
preclinical disease setting and holds therapeutic promise in metabolic diseases caused by 13
adiponectin deficiency. 14
GTDF interacted with AdipoRs and displayed a 70 fold higher affinity for AdipoR1 15
over R2. It induced adiponectin-associated rapid signaling, gene expressions and functional 16
events in C2C12 myotubes which were respectively augmented or abolished by AdipoR1 17
overexpression or silencing. 18
Our inability to procure AdipoR knock-out mice inspired us to explore alternate 19
model systems and led to the identification of 12 week old male BKS-db/db mice as 20
AdipoR1-deficient, while age and sex matched db/db mice were found to be AdipoR1-intact. 21
Intriguingly, these differences were not apparent at the mRNA level but were pronounced in 22
the protein level, especially at the level of PM-associated and hence functional form of 23
AdipoR1 protein. These findings indicate that apart from transcriptional regulation by insulin 24
and Foxo1 (31), AdipoR1 expression and function may also be regulated by post -25
Page 17 of 56 Diabetes
18
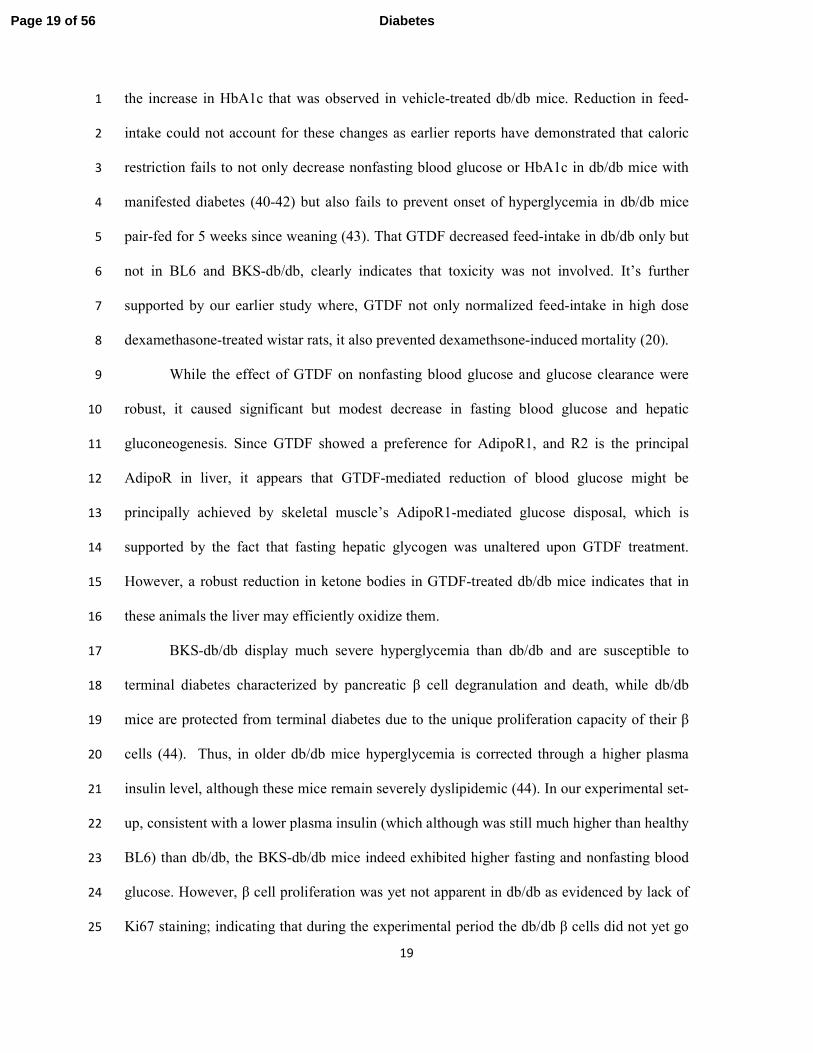
transcriptional or -translational events. Interestingly, a recent report characterized a 1
developmentally regulated alternate splice variant of AdipoR1 in human subjects that was 2
strongly enhanced during skeletal muscle differentiation and was decreased in diabetic 3
patients, and the protein level of AdipoR1 accurately represented these changes but not total 4
mRNA levels that accounted for all AdipoR1 splice variants(35). Our data gains further 5
support from another recent report, which describes that microRNA-221 and the RNA 6
binding protein polypyrimidine tract binding protein regulate AdipoR1 protein expression 7
and are induced in genetic and diet-induced mice models of obesity (36). 8
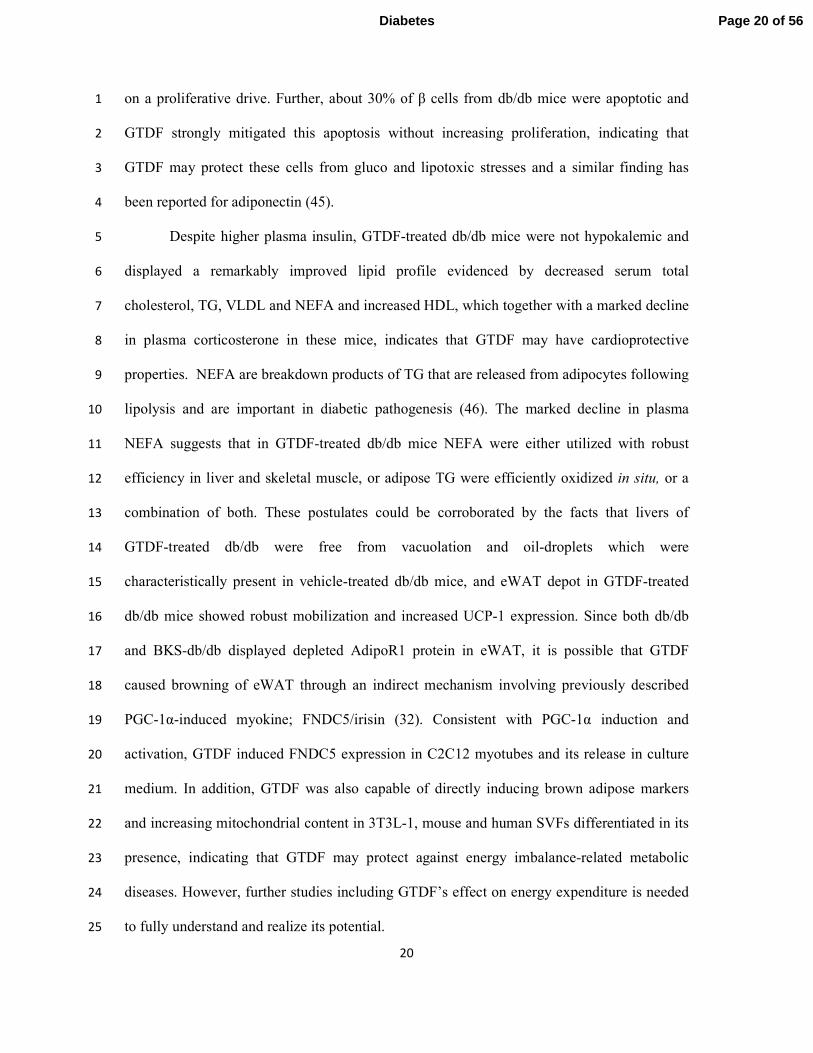
Consistent with AdipoR1 deficiency, BKS-db/db mice were refractory to GTDF, 9
while metabolism in db/db mice was remarkably improved. Interestingly, GTDF reduced 10
feed-intake in db/db mice from 16 day onwards. Effect of adiponectin on feed-intake is 11
controversial and all three possible outcomes have been reported (37-39). While the reason 12
for these differences is unclear, strain of mice, mode of administration and the administered 13
form of adiponectin appear to be responsible. It however, is important to note that we 14
delivered GTDF by oral route, in contrast to systemic delivery or transgene-based 15
overexpression of adiponectin, and thus GTDF may impact satiety related hormones from 16
gut. In agreement with this notion, plasma ghrelin level was greatly reduced in GTDF-treated 17
db/db mice. Ghrelin is chiefly produced by P/D1 cells lining the fundus of stomach and given 18
the current lack of information regarding expression of AdipoRs in these cells it’s presently 19
unclear if GTDF-mediated downregulation of ghrelin level is achieved through AdipoRs in 20
these cells. However, since GTDF did not alter feed-intake in adiponectin-insensitive BKS-21
db/db, it seems probable that these cells may express one or more AdipoRs which may act as 22
sensors for diet-derived putative AdipoR ligands. 23
In addition to alteration in feed-intake, GTDF remarkably reduced nonfasting blood 24
glucose that was significant from day 7 onwards and did not fall thereafter. GTDF also stalled 25
Page 18 of 56Diabetes
19
the increase in HbA1c that was observed in vehicle-treated db/db mice. Reduction in feed-1
intake could not account for these changes as earlier reports have demonstrated that caloric 2
restriction fails to not only decrease nonfasting blood glucose or HbA1c in db/db mice with 3
manifested diabetes (40-42) but also fails to prevent onset of hyperglycemia in db/db mice 4
pair-fed for 5 weeks since weaning (43). That GTDF decreased feed-intake in db/db only but 5
not in BL6 and BKS-db/db, clearly indicates that toxicity was not involved. It’s further 6
supported by our earlier study where, GTDF not only normalized feed-intake in high dose 7
dexamethasone-treated wistar rats, it also prevented dexamethsone-induced mortality (20). 8
While the effect of GTDF on nonfasting blood glucose and glucose clearance were 9
robust, it caused significant but modest decrease in fasting blood glucose and hepatic 10
gluconeogenesis. Since GTDF showed a preference for AdipoR1, and R2 is the principal 11
AdipoR in liver, it appears that GTDF-mediated reduction of blood glucose might be 12
principally achieved by skeletal muscle’s AdipoR1-mediated glucose disposal, which is 13
supported by the fact that fasting hepatic glycogen was unaltered upon GTDF treatment. 14
However, a robust reduction in ketone bodies in GTDF-treated db/db mice indicates that in 15
these animals the liver may efficiently oxidize them. 16
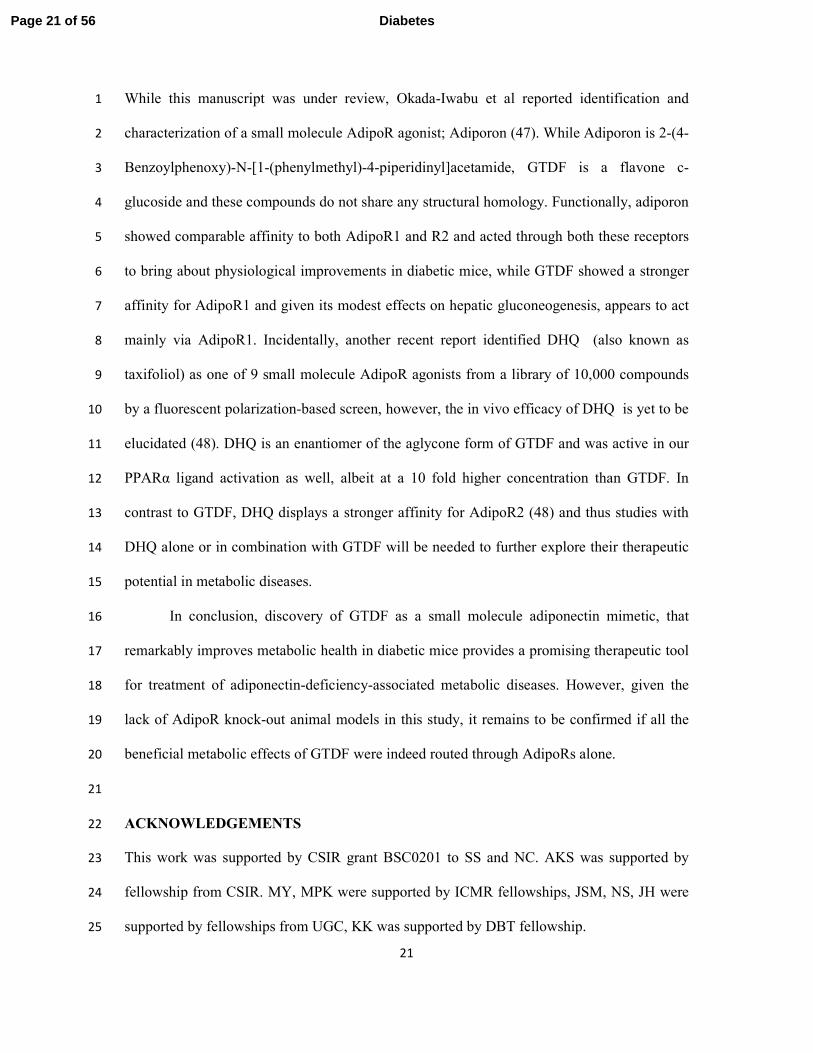
BKS-db/db display much severe hyperglycemia than db/db and are susceptible to 17
terminal diabetes characterized by pancreatic β cell degranulation and death, while db/db 18
mice are protected from terminal diabetes due to the unique proliferation capacity of their β 19
cells (44). Thus, in older db/db mice hyperglycemia is corrected through a higher plasma 20
insulin level, although these mice remain severely dyslipidemic (44). In our experimental set-21
up, consistent with a lower plasma insulin (which although was still much higher than healthy 22
BL6) than db/db, the BKS-db/db mice indeed exhibited higher fasting and nonfasting blood 23
glucose. However, β cell proliferation was yet not apparent in db/db as evidenced by lack of 24
Ki67 staining; indicating that during the experimental period the db/db β cells did not yet go 25
Page 19 of 56 Diabetes
20
on a proliferative drive. Further, about 30% of β cells from db/db mice were apoptotic and 1
GTDF strongly mitigated this apoptosis without increasing proliferation, indicating that 2
GTDF may protect these cells from gluco and lipotoxic stresses and a similar finding has 3
been reported for adiponectin (45). 4
Despite higher plasma insulin, GTDF-treated db/db mice were not hypokalemic and 5
displayed a remarkably improved lipid profile evidenced by decreased serum total 6
cholesterol, TG, VLDL and NEFA and increased HDL, which together with a marked decline 7
in plasma corticosterone in these mice, indicates that GTDF may have cardioprotective 8
properties. NEFA are breakdown products of TG that are released from adipocytes following 9
lipolysis and are important in diabetic pathogenesis (46). The marked decline in plasma 10
NEFA suggests that in GTDF-treated db/db mice NEFA were either utilized with robust 11
efficiency in liver and skeletal muscle, or adipose TG were efficiently oxidized in situ, or a 12
combination of both. These postulates could be corroborated by the facts that livers of 13
GTDF-treated db/db were free from vacuolation and oil-droplets which were 14
characteristically present in vehicle-treated db/db mice, and eWAT depot in GTDF-treated 15
db/db mice showed robust mobilization and increased UCP-1 expression. Since both db/db 16
and BKS-db/db displayed depleted AdipoR1 protein in eWAT, it is possible that GTDF 17
caused browning of eWAT through an indirect mechanism involving previously described 18
PGC-1α-induced myokine; FNDC5/irisin (32). Consistent with PGC-1α induction and 19
activation, GTDF induced FNDC5 expression in C2C12 myotubes and its release in culture 20
medium. In addition, GTDF was also capable of directly inducing brown adipose markers 21
and increasing mitochondrial content in 3T3L-1, mouse and human SVFs differentiated in its 22
presence, indicating that GTDF may protect against energy imbalance-related metabolic 23
diseases. However, further studies including GTDF’s effect on energy expenditure is needed 24
to fully understand and realize its potential. 25
Page 20 of 56Diabetes
21
While this manuscript was under review, Okada-Iwabu et al reported identification and 1
characterization of a small molecule AdipoR agonist; Adiporon (47). While Adiporon is 2-(4-2
Benzoylphenoxy)-N-[1-(phenylmethyl)-4-piperidinyl]acetamide, GTDF is a flavone c-3
glucoside and these compounds do not share any structural homology. Functionally, adiporon 4
showed comparable affinity to both AdipoR1 and R2 and acted through both these receptors 5
to bring about physiological improvements in diabetic mice, while GTDF showed a stronger 6
affinity for AdipoR1 and given its modest effects on hepatic gluconeogenesis, appears to act 7
mainly via AdipoR1. Incidentally, another recent report identified DHQ (also known as 8
taxifoliol) as one of 9 small molecule AdipoR agonists from a library of 10,000 compounds 9
by a fluorescent polarization-based screen, however, the in vivo efficacy of DHQ is yet to be 10
elucidated (48). DHQ is an enantiomer of the aglycone form of GTDF and was active in our 11
PPARα ligand activation as well, albeit at a 10 fold higher concentration than GTDF. In 12
contrast to GTDF, DHQ displays a stronger affinity for AdipoR2 (48) and thus studies with 13
DHQ alone or in combination with GTDF will be needed to further explore their therapeutic 14
potential in metabolic diseases. 15
In conclusion, discovery of GTDF as a small molecule adiponectin mimetic, that 16
remarkably improves metabolic health in diabetic mice provides a promising therapeutic tool 17
for treatment of adiponectin-deficiency-associated metabolic diseases. However, given the 18
lack of AdipoR knock-out animal models in this study, it remains to be confirmed if all the 19
beneficial metabolic effects of GTDF were indeed routed through AdipoRs alone. 20
21
ACKNOWLEDGEMENTS 22
This work was supported by CSIR grant BSC0201 to SS and NC. AKS was supported by 23
fellowship from CSIR. MY, MPK were supported by ICMR fellowships, JSM, NS, JH were 24
supported by fellowships from UGC, KK was supported by DBT fellowship. 25
Page 21 of 56 Diabetes
22
1
AKS, MPK, JSM, NS, MY, KK, DPM, RM, ShS, AKT, JRG, NC and SS have a pending 2
patent pertaining to some of the works in this manuscript. AAJ, NAD, MRJ are employees of 3
Zydus Research Center the research and development arm of Cadila Health Care limited, 4
Ahmedabad, India. This study was in no way sponsored or funded by an industry. 5
6
Part of the work was presented as an abstract in the “International Symposium on Molecular 7
Signaling” held at Visva-Bharati University, Santiniketan, India from February 18-21, 2013. 8
9
SS conceived the study. AKS, AAJ, JRG, MMG, NC and SS designed experiments. AKS, 10
AAJ, JSM, MPK, NS, MY, KK, JH, SK, NAD, DPM and MMG performed experiments. 11
MRJ, RM, AKT, MMG, NC, JRG and SS supervised experiments. ShS provided materials 12
and contributed to discussion. AKT, JRG, contributed to discussion. All authors analyzed 13
data. SS and NC contributed to discussion, wrote, edited and reviewed the manuscript. SS is 14
the guarantor of this work and, as such, had full access to all the data in the study and takes 15
responsibility for the integrity of the data and the accuracy of the data analysis. 16
17
Authors acknowledge Sophisticated Analytical Instrument Facility in CSIR-CDRI for help 18
with confocal microscopy. The authors acknowledge Prem N Yadav, Ph.D. (Division of 19
Pharmacology, CSIR, CDRI) for help with designing of the radioligand binding assays and 20
Durga Prasad Mishra, Ph.D. (Division of Endocrinology, CSIR-CDRI) for sharing antibodies. 21
22
REFERENCES 23
1. Kadowaki T, Yamauchi T: Adiponectin and adiponectin receptors. Endocr Rev 2005;26:439-451 24
2. Robinson K, Prins J, Venkatesh B: Clinical review: adiponectin biology and its role in 25
inflammation and critical illness. Crit Care 2011;15:221 26
Page 22 of 56Diabetes
23
3. Yamauchi T, Kamon J, Ito Y, Tsuchida A, Yokomizo T, Kita S, Sugiyama T, Miyagishi M, Hara 1
K, Tsunoda M, Murakami K, Ohteki T, Uchida S, Takekawa S, Waki H, Tsuno NH, Shibata Y, 2
Terauchi Y, Froguel P, Tobe K, Koyasu S, Taira K, Kitamura T, Shimizu T, Nagai R, Kadowaki T: 3
Cloning of adiponectin receptors that mediate antidiabetic metabolic effects. Nature 2003;423:762-4
769 5
4. Hug C, Wang J, Ahmad NS, Bogan JS, Tsao TS, Lodish HF: T-cadherin is a receptor for hexameric 6
and high-molecular-weight forms of Acrp30/adiponectin. Proceedings of the National Academy of 7
Sciences of the United States of America 2004;101:10308-10313 8
5. Hotta K, Funahashi T, Arita Y, Takahashi M, Matsuda M, Okamoto Y, Iwahashi H, Kuriyama H, 9
Ouchi N, Maeda K, Nishida M, Kihara S, Sakai N, Nakajima T, Hasegawa K, Muraguchi M, Ohmoto 10
Y, Nakamura T, Yamashita S, Hanafusa T, Matsuzawa Y: Plasma concentrations of a novel, adipose-11
specific protein, adiponectin, in type 2 diabetic patients. Arterioscler Thromb Vasc Biol 12
2000;20:1595-1599 13
6. Li S, Shin HJ, Ding EL, van Dam RM: Adiponectin levels and risk of type 2 diabetes: a systematic 14
review and meta-analysis. Jama 2009;302:179-188 15
7. Weyer C, Funahashi T, Tanaka S, Hotta K, Matsuzawa Y, Pratley RE, Tataranni PA: 16
Hypoadiponectinemia in obesity and type 2 diabetes: close association with insulin resistance and 17
hyperinsulinemia. J Clin Endocrinol Metab 2001;86:1930-1935 18
8. Berg AH, Combs TP, Du X, Brownlee M, Scherer PE: The adipocyte-secreted protein Acrp30 19
enhances hepatic insulin action. Nature medicine 2001;7:947-953 20
9. Yamauchi T, Kamon J, Waki H, Terauchi Y, Kubota N, Hara K, Mori Y, Ide T, Murakami K, 21
Tsuboyama-Kasaoka N, Ezaki O, Akanuma Y, Gavrilova O, Vinson C, Reitman ML, Kagechika H, 22
Shudo K, Yoda M, Nakano Y, Tobe K, Nagai R, Kimura S, Tomita M, Froguel P, Kadowaki T: The 23
fat-derived hormone adiponectin reverses insulin resistance associated with both lipoatrophy and 24
obesity. Nature medicine 2001;7:941-946 25
10. Fruebis J, Tsao TS, Javorschi S, Ebbets-Reed D, Erickson MR, Yen FT, Bihain BE, Lodish HF: 26
Proteolytic cleavage product of 30-kDa adipocyte complement-related protein increases fatty acid 27
oxidation in muscle and causes weight loss in mice. Proceedings of the National Academy of Sciences 28
of the United States of America 2001;98:2005-2010 29
11. Yamauchi T, Kamon J, Minokoshi Y, Ito Y, Waki H, Uchida S, Yamashita S, Noda M, Kita S, 30
Ueki K, Eto K, Akanuma Y, Froguel P, Foufelle F, Ferre P, Carling D, Kimura S, Nagai R, Kahn BB, 31
Kadowaki T: Adiponectin stimulates glucose utilization and fatty-acid oxidation by activating AMP-32
activated protein kinase. Nature medicine 2002;8:1288-1295 33
12. Yamauchi T, Kamon J, Waki H, Imai Y, Shimozawa N, Hioki K, Uchida S, Ito Y, Takakuwa K, 34
Matsui J, Takata M, Eto K, Terauchi Y, Komeda K, Tsunoda M, Murakami K, Ohnishi Y, Naitoh T, 35
Yamamura K, Ueyama Y, Froguel P, Kimura S, Nagai R, Kadowaki T: Globular adiponectin 36
protected ob/ob mice from diabetes and ApoE-deficient mice from atherosclerosis. The Journal of 37
biological chemistry 2003;278:2461-2468 38
13. Holland WL, Miller RA, Wang ZV, Sun K, Barth BM, Bui HH, Davis KE, Bikman BT, Halberg 39
N, Rutkowski JM, Wade MR, Tenorio VM, Kuo MS, Brozinick JT, Zhang BB, Birnbaum MJ, 40
Summers SA, Scherer PE: Receptor-mediated activation of ceramidase activity initiates the 41
pleiotropic actions of adiponectin. Nature medicine 2011;17:55-63 42
14. Hu E, Liang P, Spiegelman BM: AdipoQ is a novel adipose-specific gene dysregulated in obesity. 43
The Journal of biological chemistry 1996;271:10697-10703 44
15. Scherer PE, Williams S, Fogliano M, Baldini G, Lodish HF: A novel serum protein similar to 45
C1q, produced exclusively in adipocytes. The Journal of biological chemistry 1995;270:26746-26749 46
16. Shapiro L, Scherer PE: The crystal structure of a complement-1q family protein suggests an 47
evolutionary link to tumor necrosis factor. Curr Biol 1998;8:335-338 48
17. Tsao TS, Murrey HE, Hug C, Lee DH, Lodish HF: Oligomerization state-dependent activation of 49
NF-kappa B signaling pathway by adipocyte complement-related protein of 30 kDa (Acrp30). The 50
Journal of biological chemistry 2002;277:29359-29362 51
18. Tsao TS, Tomas E, Murrey HE, Hug C, Lee DH, Ruderman NB, Heuser JE, Lodish HF: Role of 52
disulfide bonds in Acrp30/adiponectin structure and signaling specificity. Different oligomers activate 53
different signal transduction pathways. The Journal of biological chemistry 2003;278:50810-50817 54
Page 23 of 56 Diabetes
24
19. Sharan K, Mishra JS, Swarnkar G, Siddiqui JA, Khan K, Kumari R, Rawat P, Maurya R, Sanyal 1
S, Chattopadhyay N: A novel quercetin analogue from a medicinal plant promotes peak bone mass 2
achievement and bone healing after injury and exerts an anabolic effect on osteoporotic bone: the role 3
of aryl hydrocarbon receptor as a mediator of osteogenic action. J Bone Miner Res 2011;26:2096-4
2111 5
20. Khan MP, Mishra JS, Sharan K, Yadav M, Singh AK, Srivastava A, Kumar S, Bhaduaria S, 6
Maurya R, Sanyal S, Chattopadhyay N: A novel flavonoid C-glucoside from Ulmus wallichiana 7
preserves bone mineral density, microarchitecture and biomechanical properties in the presence of 8
glucocorticoid by promoting osteoblast survival: A comparative study with human parathyroid 9
hormone. Phytomedicine : international journal of phytotherapy and phytopharmacology 2013; 10
21. Nieman DC, Williams AS, Shanely RA, Jin F, McAnulty SR, Triplett NT, Austin MD, Henson 11
DA: Quercetin's influence on exercise performance and muscle mitochondrial biogenesis. Med Sci 12
Sports Exerc 42:338-345 13
22. Jeong SM, Kang MJ, Choi HN, Kim JH, Kim JI: Quercetin ameliorates hyperglycemia and 14
dyslipidemia and improves antioxidant status in type 2 diabetic db/db mice. Nutr Res Pract 15
2012;6:201-207 16
23. Nieman DC, Williams AS, Shanely RA, Jin F, McAnulty SR, Triplett NT, Austin MD, Henson 17
DA: Quercetin's influence on exercise performance and muscle mitochondrial biogenesis. Medicine 18
and science in sports and exercise 2010;42:338-345 19
24. Dwivedi SK, Singh N, Kumari R, Mishra JS, Tripathi S, Banerjee P, Shah P, Kukshal V, Tyagi 20
AM, Gaikwad AN, Chaturvedi RK, Mishra DP, Trivedi AK, Sanyal S, Chattopadhyay N, 21
Ramachandran R, Siddiqi MI, Bandyopadhyay A, Arora A, Lundasen T, Anakk SP, Moore DD, 22
Sanyal S: Bile acid receptor agonist GW4064 regulates PPARgamma coactivator-1alpha expression 23
through estrogen receptor-related receptor alpha. Molecular endocrinology 2011;25:922-932 24
25. Neumeier M, Weigert J, Schaffler A, Weiss T, Kirchner S, Laberer S, Scholmerich J, Buechler C: 25
Regulation of adiponectin receptor 1 in human hepatocytes by agonists of nuclear receptors. Biochem 26
Biophys Res Commun 2005;334:924-929 27
26. Iwabu M, Yamauchi T, Okada-Iwabu M, Sato K, Nakagawa T, Funata M, Yamaguchi M, Namiki 28
S, Nakayama R, Tabata M, Ogata H, Kubota N, Takamoto I, Hayashi YK, Yamauchi N, Waki H, 29
Fukayama M, Nishino I, Tokuyama K, Ueki K, Oike Y, Ishii S, Hirose K, Shimizu T, Touhara K, 30
Kadowaki T: Adiponectin and AdipoR1 regulate PGC-1alpha and mitochondria by Ca(2+) and 31
AMPK/SIRT1. Nature 2010;464:1313-1319 32
27. Kim JH, Lee JO, Lee SK, Moon JW, You GY, Kim SJ, Park SH, Park JM, Lim SY, Suh PG, Uhm 33
KO, Song MS, Kim HS: The glutamate agonist homocysteine sulfinic acid stimulates glucose uptake 34
through the calcium-dependent AMPK-p38 MAPK-protein kinase C zeta pathway in skeletal muscle 35
cells. The Journal of biological chemistry 2011;286:7567-7576 36
28. Wang C, Mao X, Wang L, Liu M, Wetzel MD, Guan KL, Dong LQ, Liu F: Adiponectin sensitizes 37
insulin signaling by reducing p70 S6 kinase-mediated serine phosphorylation of IRS-1. The Journal of 38
biological chemistry 2007;282:7991-7996 39
29. Yoon MJ, Lee GY, Chung JJ, Ahn YH, Hong SH, Kim JB: Adiponectin increases fatty acid 40
oxidation in skeletal muscle cells by sequential activation of AMP-activated protein kinase, p38 41
mitogen-activated protein kinase, and peroxisome proliferator-activated receptor alpha. Diabetes 42
2006;55:2562-2570 43
30. Wilden PA, Backer JM, Kahn CR, Cahill DA, Schroeder GJ, White MF: The insulin receptor with 44
phenylalanine replacing tyrosine-1146 provides evidence for separate signals regulating cellular 45
metabolism and growth. Proceedings of the National Academy of Sciences of the United States of 46
America 1990;87:3358-3362 47
31. Tsuchida A, Yamauchi T, Ito Y, Hada Y, Maki T, Takekawa S, Kamon J, Kobayashi M, Suzuki 48
R, Hara K, Kubota N, Terauchi Y, Froguel P, Nakae J, Kasuga M, Accili D, Tobe K, Ueki K, Nagai 49
R, Kadowaki T: Insulin/Foxo1 pathway regulates expression levels of adiponectin receptors and 50
adiponectin sensitivity. The Journal of biological chemistry 2004;279:30817-30822 51
32. Bostrom P, Wu J, Jedrychowski MP, Korde A, Ye L, Lo JC, Rasbach KA, Bostrom EA, Choi JH, 52
Long JZ, Kajimura S, Zingaretti MC, Vind BF, Tu H, Cinti S, Hojlund K, Gygi SP, Spiegelman BM: 53
Page 24 of 56Diabetes
25
A PGC1-alpha-dependent myokine that drives brown-fat-like development of white fat and 1
thermogenesis. Nature 2012;481:463-468 2
33. Bauche IB, El Mkadem SA, Pottier AM, Senou M, Many MC, Rezsohazy R, Penicaud L, Maeda 3
N, Funahashi T, Brichard SM: Overexpression of adiponectin targeted to adipose tissue in transgenic 4
mice: impaired adipocyte differentiation. Endocrinology 2007;148:1539-1549 5
34. Kajimura S, Seale P, Kubota K, Lunsford E, Frangioni JV, Gygi SP, Spiegelman BM: Initiation of 6
myoblast to brown fat switch by a PRDM16-C/EBP-beta transcriptional complex. Nature 7
2009;460:1154-1158 8
35. Ashwal R, Hemi R, Tirosh A, Gordin R, Yissachar E, Cohen-Dayag A, Rosenberg A, Karasik A, 9
Bluher M, Kanety H: Differential expression of novel adiponectin receptor-1 transcripts in skeletal 10
muscle of subjects with normal glucose tolerance and type 2 diabetes. Diabetes 2011;60:936-946 11
36. Lustig Y, Barhod E, Ashwal-Fluss R, Gordin R, Shomron N, Baruch-Umansky K, Hemi R, 12
Karasik A, Kanety H: RNA binding protein PTB and microRNA-221 co-regulate AdipoR1 translation 13
and adiponectin signaling. Diabetes 2013; 14
37. Kubota N, Terauchi Y, Yamauchi T, Kubota T, Moroi M, Matsui J, Eto K, Yamashita T, Kamon 15
J, Satoh H, Yano W, Froguel P, Nagai R, Kimura S, Kadowaki T, Noda T: Disruption of adiponectin 16
causes insulin resistance and neointimal formation. The Journal of biological chemistry 17
2002;277:25863-25866 18
38. Qi Y, Takahashi N, Hileman SM, Patel HR, Berg AH, Pajvani UB, Scherer PE, Ahima RS: 19
Adiponectin acts in the brain to decrease body weight. Nature medicine 2004;10:524-529 20
39. Shklyaev S, Aslanidi G, Tennant M, Prima V, Kohlbrenner E, Kroutov V, Campbell-Thompson 21
M, Crawford J, Shek EW, Scarpace PJ, Zolotukhin S: Sustained peripheral expression of transgene 22
adiponectin offsets the development of diet-induced obesity in rats. Proceedings of the National 23
Academy of Sciences of the United States of America 2003;100:14217-14222 24
40. Tonra JR, Ono M, Liu X, Garcia K, Jackson C, Yancopoulos GD, Wiegand SJ, Wong V: Brain-25
derived neurotrophic factor improves blood glucose control and alleviates fasting hyperglycemia in 26
C57BLKS-Lepr(db)/lepr(db) mice. Diabetes 1999;48:588-594 27
41. Chen D, Liao J, Li N, Zhou C, Liu Q, Wang G, Zhang R, Zhang S, Lin L, Chen K, Xie X, Nan F, 28
Young AA, Wang MW: A nonpeptidic agonist of glucagon-like peptide 1 receptors with efficacy in 29
diabetic db/db mice. Proceedings of the National Academy of Sciences of the United States of 30
America 2007;104:943-948 31
42. Sleeman MW, Garcia K, Liu R, Murray JD, Malinova L, Moncrieffe M, Yancopoulos GD, 32
Wiegand SJ: Ciliary neurotrophic factor improves diabetic parameters and hepatic steatosis and 33
increases basal metabolic rate in db/db mice. Proceedings of the National Academy of Sciences of the 34
United States of America 2003;100:14297-14302 35
43. Bates SH, Kulkarni RN, Seifert M, Myers MG, Jr.: Roles for leptin receptor/STAT3-dependent 36
and -independent signals in the regulation of glucose homeostasis. Cell Metab 2005;1:169-178 37
44. Davis RC, Castellani LW, Hosseini M, Ben-Zeev O, Mao HZ, Weinstein MM, Jung DY, Jun JY, 38
Kim JK, Lusis AJ, Peterfy M: Early hepatic insulin resistance precedes the onset of diabetes in obese 39
C57BLKS-db/db mice. Diabetes 2010;59:1616-1625 40
45. Wijesekara N, Krishnamurthy M, Bhattacharjee A, Suhail A, Sweeney G, Wheeler MB: 41
Adiponectin-induced ERK and Akt phosphorylation protects against pancreatic beta cell apoptosis 42
and increases insulin gene expression and secretion. The Journal of biological chemistry 43
2010;285:33623-33631 44
46. Karpe F, Dickmann JR, Frayn KN: Fatty acids, obesity, and insulin resistance: time for a 45
reevaluation. Diabetes 2011;60:2441-2449 46
47. Okada-Iwabu M, Yamauchi T, Iwabu M, Honma T, Hamagami K, Matsuda K, Yamaguchi M, 47
Tanabe H, Kimura-Someya T, Shirouzu M, Ogata H, Tokuyama K, Ueki K, Nagano T, Tanaka A, 48
Yokoyama S, Kadowaki T: A small-molecule AdipoR agonist for type 2 diabetes and short life in 49
obesity. Nature 2013;503:493-499 50
48. Sun Y, Zang Z, Zhong L, Wu M, Su Q, Gao X, Zan W, Lin D, Zhao Y, Zhang Z: Identification of 51
adiponectin receptor agonist utilizing a fluorescence polarization based high throughput assay. PloS 52
one 2013;8:e63354 53
Page 25 of 56 Diabetes
26
49. Sharan K, Swarnkar G, Siddiqui JA, Kumar A, Rawat P, Kumar M, Nagar GK, Manickavasagam 1
L, Singh SP, Mishra G, Wahajuddin, Jain GK, Maurya R, Chattopadhyay N: A novel flavonoid, 6-C-2
beta-d-glucopyranosyl-(2S,3S)-(+)-3',4',5,7-tetrahydroxyflavanone, isolated from Ulmus wallichiana 3
Planchon mitigates ovariectomy-induced osteoporosis in rats. Menopause 2010;17:577-586 4
50. Siddiqui JA, Sharan K, Swarnkar G, Rawat P, Kumar M, Manickavasagam L, Maurya R, Pierroz 5
D, Chattopadhyay N: Quercetin-6-C-beta-D-glucopyranoside isolated from Ulmus wallichiana 6
planchon is more potent than quercetin in inhibiting osteoclastogenesis and mitigating ovariectomy-7
induced bone loss in rats. Menopause 2011;18:198-207 8
51. Siddiqui JA, Swarnkar G, Sharan K, Chakravarti B, Gautam AK, Rawat P, Kumar M, Gupta V, 9
Manickavasagam L, Dwivedi AK, Maurya R, Chattopadhyay N: A naturally occurring rare analog of 10
quercetin promotes peak bone mass achievement and exerts anabolic effect on osteoporotic bone. 11
Osteoporos Int 2011;22:3013-3027 12
52. Kumar M, Rawat P, Dixit P, Mishra D, Gautam AK, Pandey R, Singh D, Chattopadhyay N, 13
Maurya R: Anti-osteoporotic constituents from Indian medicinal plants. Phytomedicine : international 14
journal of phytotherapy and phytopharmacology 2010;17:993-999 15
53. Hosseinimehr SJ, Tolmachev V, Stenerlow B: 125I-labeled quercetin as a novel DNA-targeted 16
radiotracer. Cancer biotherapy & radiopharmaceuticals 2011;26:469-475 17
18
19
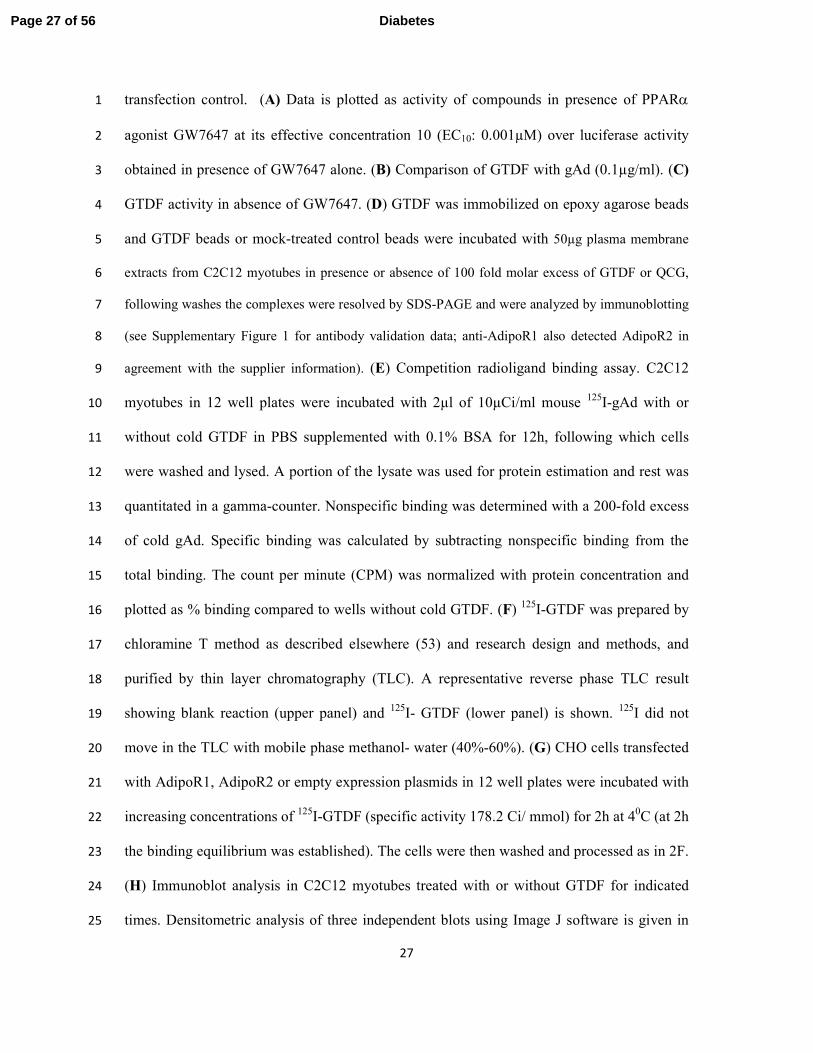
FIGURE LEGENDS 20
21
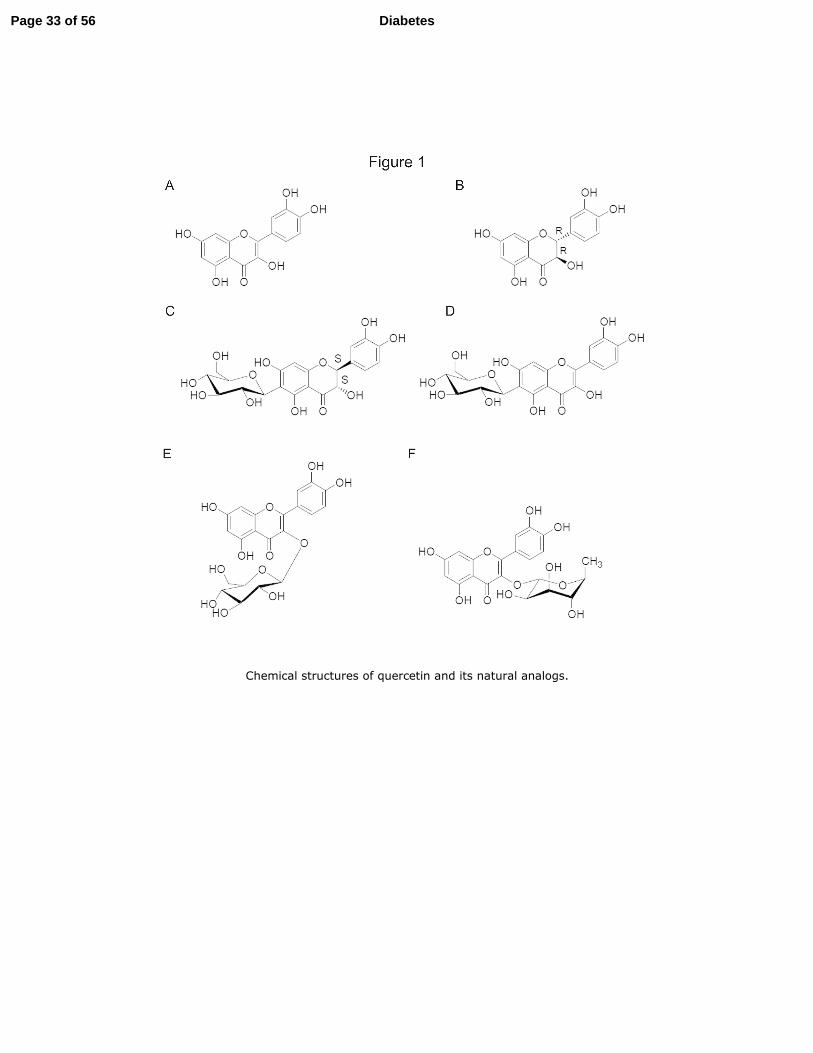
Fig. 1. Chemical structures of quercetin and its natural analogs. 22
(A) Quercetin (B) (2R, 3R)-dihydroquercetin (C) 6-C-β-D-glucopyranosyl-(2S, 3S) -(+)- 23
5,7, 3',4'- tetrahydroxydihydroflavonol (GTDF). (D) Quercetin-6-C-β-D-glucopyranoside 24
(QCG). (E) Quercetin-3-O-β-D-glucopyranoside (QOG). (F) Quercetin-3-O-α-L-25
rhamnopyranoside (QR). GTDF, QCG and DHQ were isolated from the stem-bark of Ulmus 26
wallichiana Planchon (19; 49-51). QR was prepared from stems of Cissus quadrangularis 27
(52). Quercetin and QOG were procured from Sigma Aldrich (St. Louis, MO). Purity of 28
GTDF, DHQ, QCG and QR were > 98%; quercetin was > 95% and QOG was >90%. 29
30
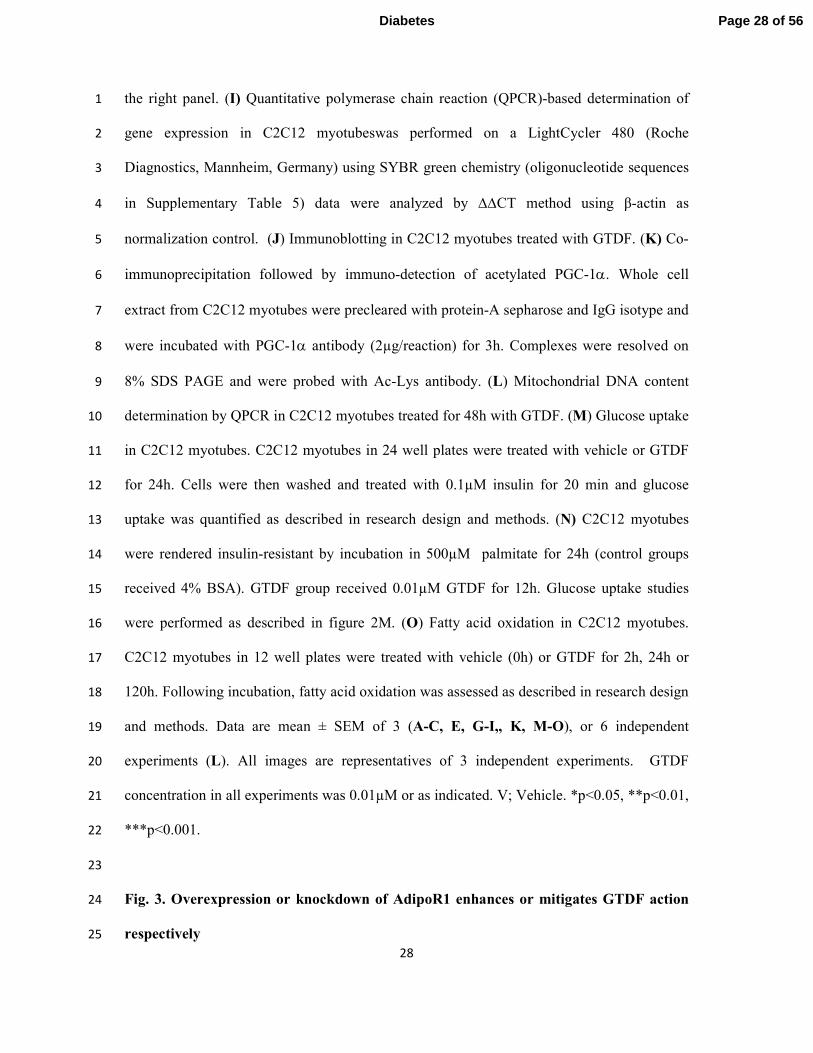
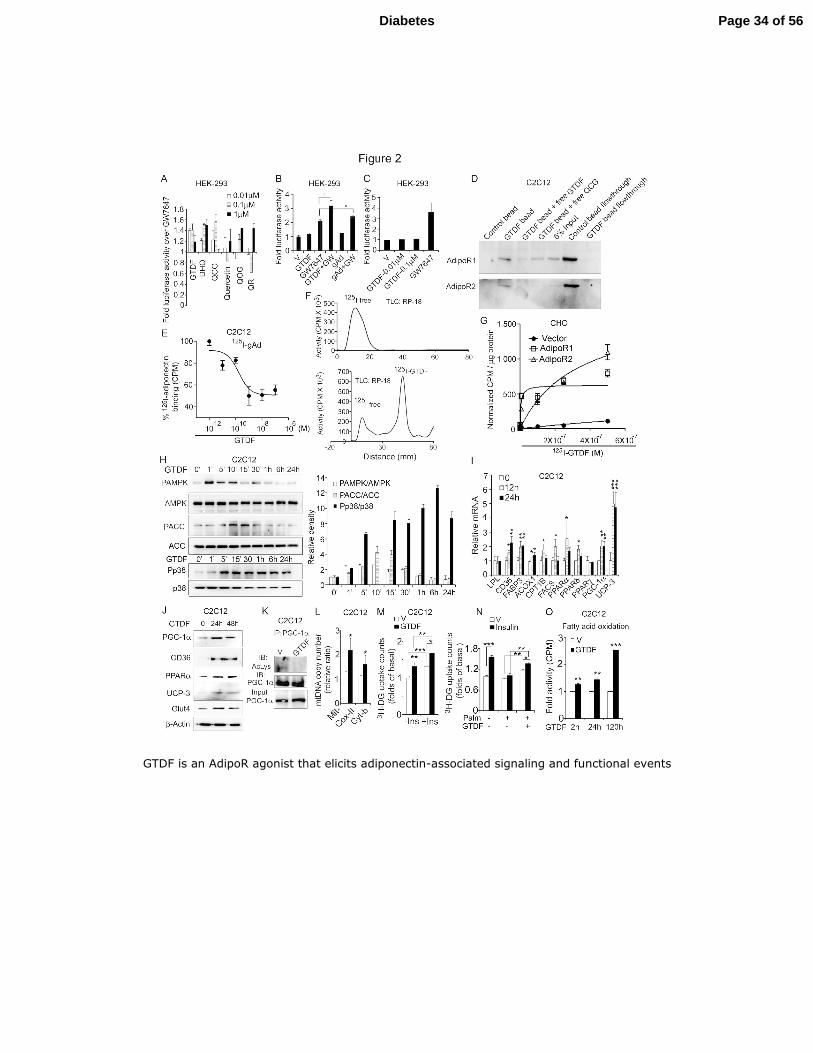
Fig. 2. GTDF is an AdipoR agonist that elicits adiponectin-associated signaling and 31
functional events 32
(A-C) PPARα-ligand activation assay in HEK-293 cells transfected with Gal4-UAS-Luc and 33
Gal4-PPARα. 24h after transfection cells were treated as indicated, luciferase activities were 34
normalized with GFP fluorescence obtained from cotransfected eGFPC1 plasmid; used as a 35
Page 26 of 56Diabetes
27
transfection control. (A) Data is plotted as activity of compounds in presence of PPARα 1
agonist GW7647 at its effective concentration 10 (EC10: 0.001µM) over luciferase activity 2
obtained in presence of GW7647 alone. (B) Comparison of GTDF with gAd (0.1µg/ml). (C) 3
GTDF activity in absence of GW7647. (D) GTDF was immobilized on epoxy agarose beads 4
and GTDF beads or mock-treated control beads were incubated with 50µg plasma membrane 5
extracts from C2C12 myotubes in presence or absence of 100 fold molar excess of GTDF or QCG, 6
following washes the complexes were resolved by SDS-PAGE and were analyzed by immunoblotting 7
(see Supplementary Figure 1 for antibody validation data; anti-AdipoR1 also detected AdipoR2 in 8
agreement with the supplier information). (E) Competition radioligand binding assay. C2C12 9
myotubes in 12 well plates were incubated with 2µl of 10µCi/ml mouse 125
I-gAd with or 10
without cold GTDF in PBS supplemented with 0.1% BSA for 12h, following which cells 11
were washed and lysed. A portion of the lysate was used for protein estimation and rest was 12
quantitated in a gamma-counter. Nonspecific binding was determined with a 200-fold excess 13
of cold gAd. Specific binding was calculated by subtracting nonspecific binding from the 14
total binding. The count per minute (CPM) was normalized with protein concentration and 15
plotted as % binding compared to wells without cold GTDF. (F) 125
I-GTDF was prepared by 16
chloramine T method as described elsewhere (53) and research design and methods, and 17
purified by thin layer chromatography (TLC). A representative reverse phase TLC result 18
showing blank reaction (upper panel) and 125
I- GTDF (lower panel) is shown. 125
I did not 19
move in the TLC with mobile phase methanol- water (40%-60%). (G) CHO cells transfected 20
with AdipoR1, AdipoR2 or empty expression plasmids in 12 well plates were incubated with 21
increasing concentrations of 125
I-GTDF (specific activity 178.2 Ci/ mmol) for 2h at 40C (at 2h 22
the binding equilibrium was established). The cells were then washed and processed as in 2F. 23
(H) Immunoblot analysis in C2C12 myotubes treated with or without GTDF for indicated 24
times. Densitometric analysis of three independent blots using Image J software is given in 25
Page 27 of 56 Diabetes
28
the right panel. (I) Quantitative polymerase chain reaction (QPCR)-based determination of 1
gene expression in C2C12 myotubeswas performed on a LightCycler 480 (Roche 2
Diagnostics, Mannheim, Germany) using SYBR green chemistry (oligonucleotide sequences 3
in Supplementary Table 5) data were analyzed by ∆∆CT method using β-actin as 4
normalization control. (J) Immunoblotting in C2C12 myotubes treated with GTDF. (K) Co-5
immunoprecipitation followed by immuno-detection of acetylated PGC-1α. Whole cell 6
extract from C2C12 myotubes were precleared with protein-A sepharose and IgG isotype and 7
were incubated with PGC-1α antibody (2µg/reaction) for 3h. Complexes were resolved on 8
8% SDS PAGE and were probed with Ac-Lys antibody. (L) Mitochondrial DNA content 9
determination by QPCR in C2C12 myotubes treated for 48h with GTDF. (M) Glucose uptake 10
in C2C12 myotubes. C2C12 myotubes in 24 well plates were treated with vehicle or GTDF 11
for 24h. Cells were then washed and treated with 0.1µM insulin for 20 min and glucose 12
uptake was quantified as described in research design and methods. (N) C2C12 myotubes 13
were rendered insulin-resistant by incubation in 500µM palmitate for 24h (control groups 14
received 4% BSA). GTDF group received 0.01µM GTDF for 12h. Glucose uptake studies 15
were performed as described in figure 2M. (O) Fatty acid oxidation in C2C12 myotubes. 16
C2C12 myotubes in 12 well plates were treated with vehicle (0h) or GTDF for 2h, 24h or 17
120h. Following incubation, fatty acid oxidation was assessed as described in research design 18
and methods. Data are mean ± SEM of 3 (A-C, E, G-I,, K, M-O), or 6 independent 19
experiments (L). All images are representatives of 3 independent experiments. GTDF 20
concentration in all experiments was 0.01µM or as indicated. V; Vehicle. *p<0.05, **p<0.01, 21
***p<0.001. 22
23
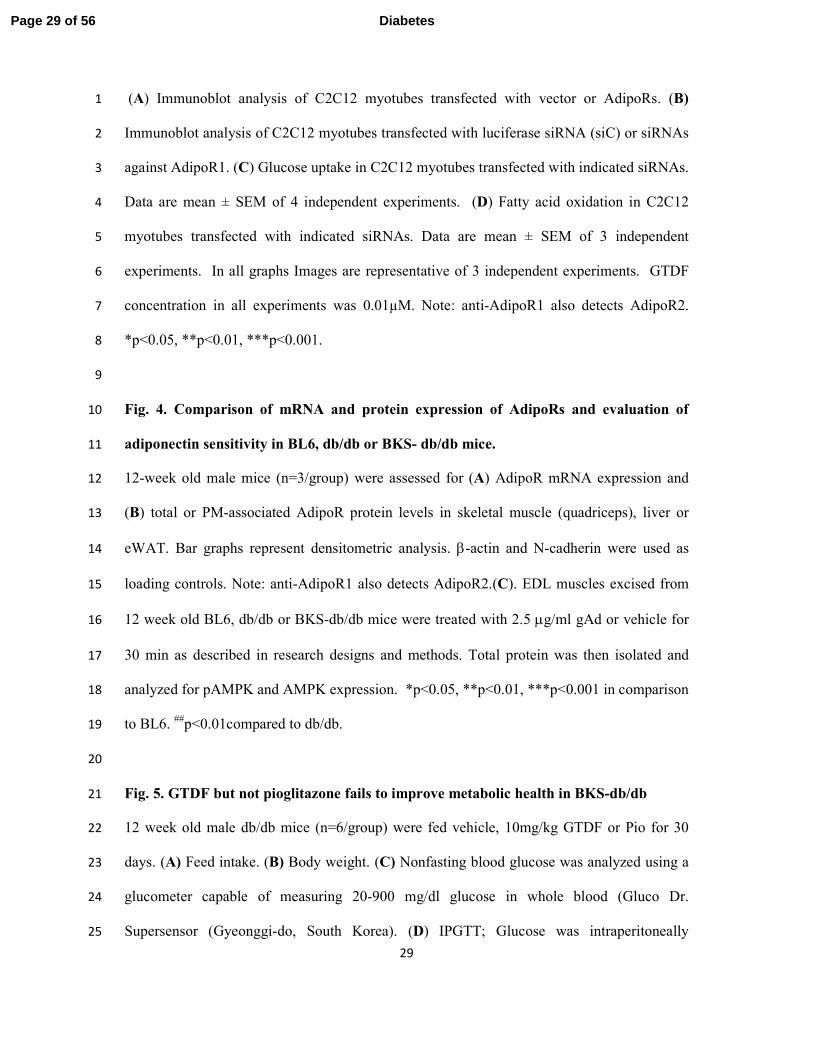
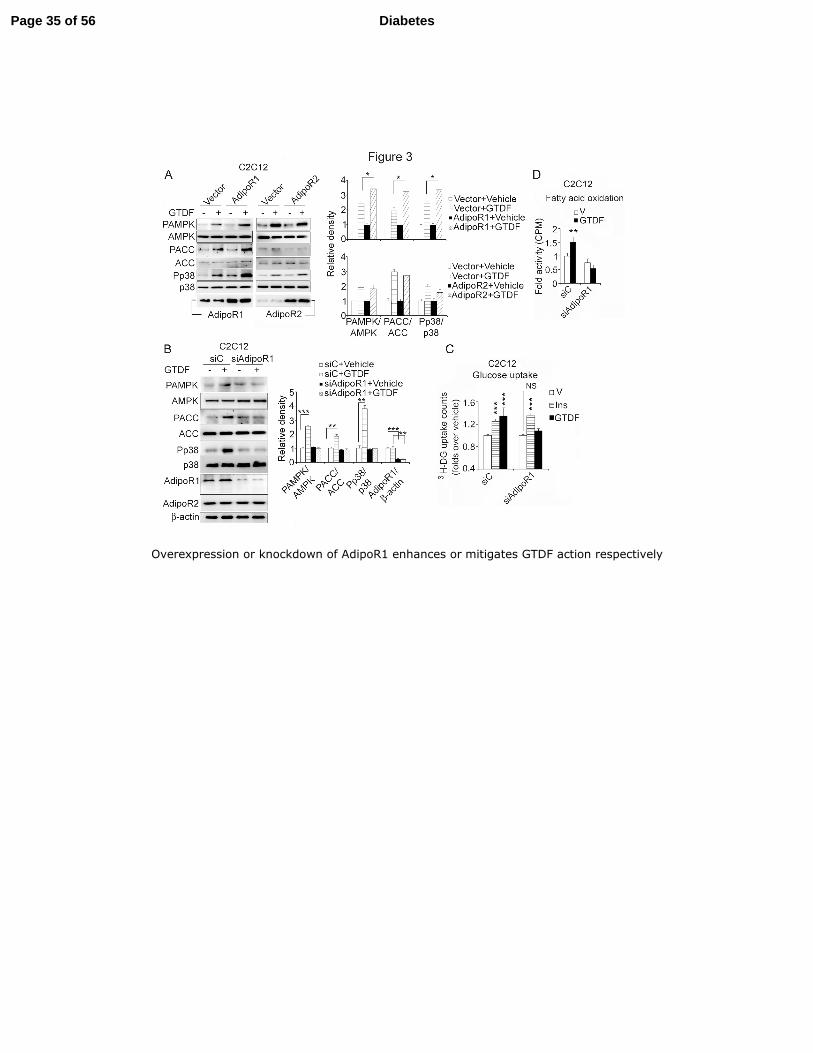
Fig. 3. Overexpression or knockdown of AdipoR1 enhances or mitigates GTDF action 24
respectively 25
Page 28 of 56Diabetes
29
(A) Immunoblot analysis of C2C12 myotubes transfected with vector or AdipoRs. (B) 1
Immunoblot analysis of C2C12 myotubes transfected with luciferase siRNA (siC) or siRNAs 2
against AdipoR1. (C) Glucose uptake in C2C12 myotubes transfected with indicated siRNAs. 3
Data are mean ± SEM of 4 independent experiments. (D) Fatty acid oxidation in C2C12 4
myotubes transfected with indicated siRNAs. Data are mean ± SEM of 3 independent 5
experiments. In all graphs Images are representative of 3 independent experiments. GTDF 6
concentration in all experiments was 0.01µM. Note: anti-AdipoR1 also detects AdipoR2. 7
*p<0.05, **p<0.01, ***p<0.001. 8
9
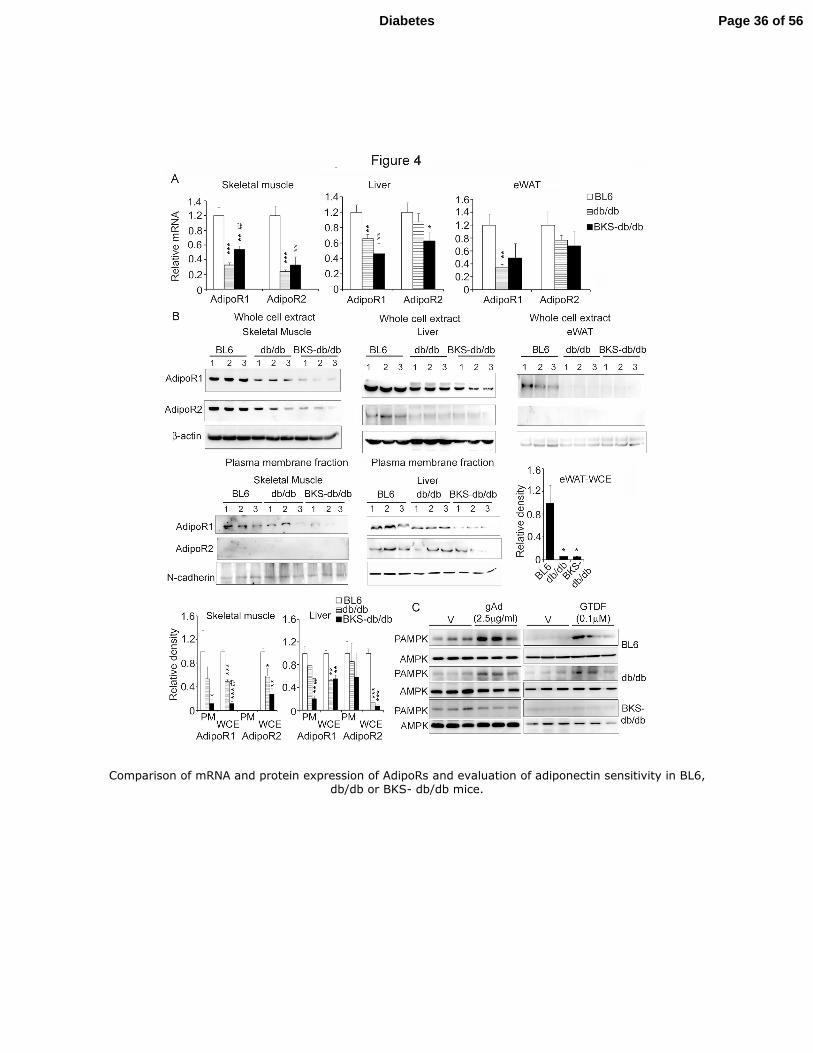
Fig. 4. Comparison of mRNA and protein expression of AdipoRs and evaluation of 10
adiponectin sensitivity in BL6, db/db or BKS- db/db mice. 11
12-week old male mice (n=3/group) were assessed for (A) AdipoR mRNA expression and 12
(B) total or PM-associated AdipoR protein levels in skeletal muscle (quadriceps), liver or 13
eWAT. Bar graphs represent densitometric analysis. β-actin and N-cadherin were used as 14
loading controls. Note: anti-AdipoR1 also detects AdipoR2.(C). EDL muscles excised from 15
12 week old BL6, db/db or BKS-db/db mice were treated with 2.5 µg/ml gAd or vehicle for 16
30 min as described in research designs and methods. Total protein was then isolated and 17
analyzed for pAMPK and AMPK expression. *p<0.05, **p<0.01, ***p<0.001 in comparison 18
to BL6. ##
p<0.01compared to db/db. 19
20
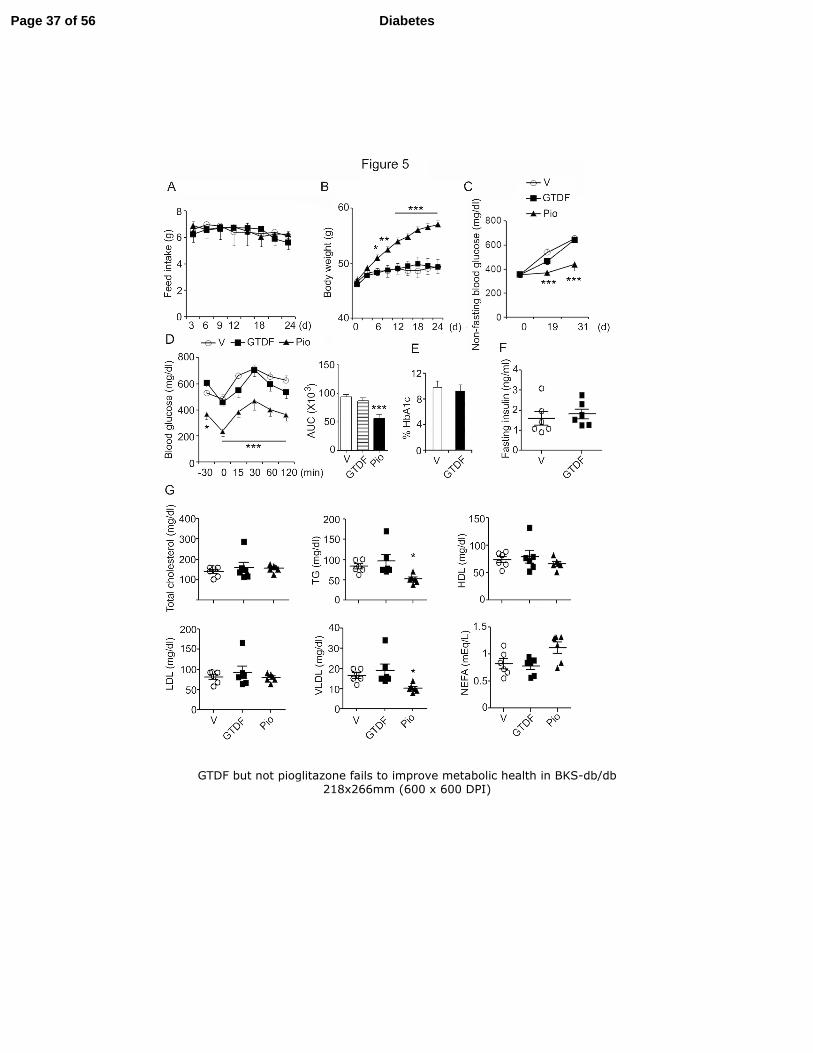
Fig. 5. GTDF but not pioglitazone fails to improve metabolic health in BKS-db/db 21
12 week old male db/db mice (n=6/group) were fed vehicle, 10mg/kg GTDF or Pio for 30 22
days. (A) Feed intake. (B) Body weight. (C) Nonfasting blood glucose was analyzed using a 23
glucometer capable of measuring 20-900 mg/dl glucose in whole blood (Gluco Dr. 24
Supersensor (Gyeonggi-do, South Korea). (D) IPGTT; Glucose was intraperitoneally 25
Page 29 of 56 Diabetes
30
administered in mice (1g/kg body weight) and at indicated time points blood was collected 1
from tail snips and blood glucose was measured by a glucometer. Inset represents area under 2
the curve (AUC). (E) Glycated haemoglobin level; vehicle vs GTDF 9.9±0.4% vs 9.3 ± 0.3% 3
(84.33 ± 4.29 vs 78.17±2.96 fmol/mol) (F) Fasting insulin was estimated by ELISA (G) 4
Fasting serum lipid profile.. *p<0.05, **p<0.01, ***p<0.001. 5
6
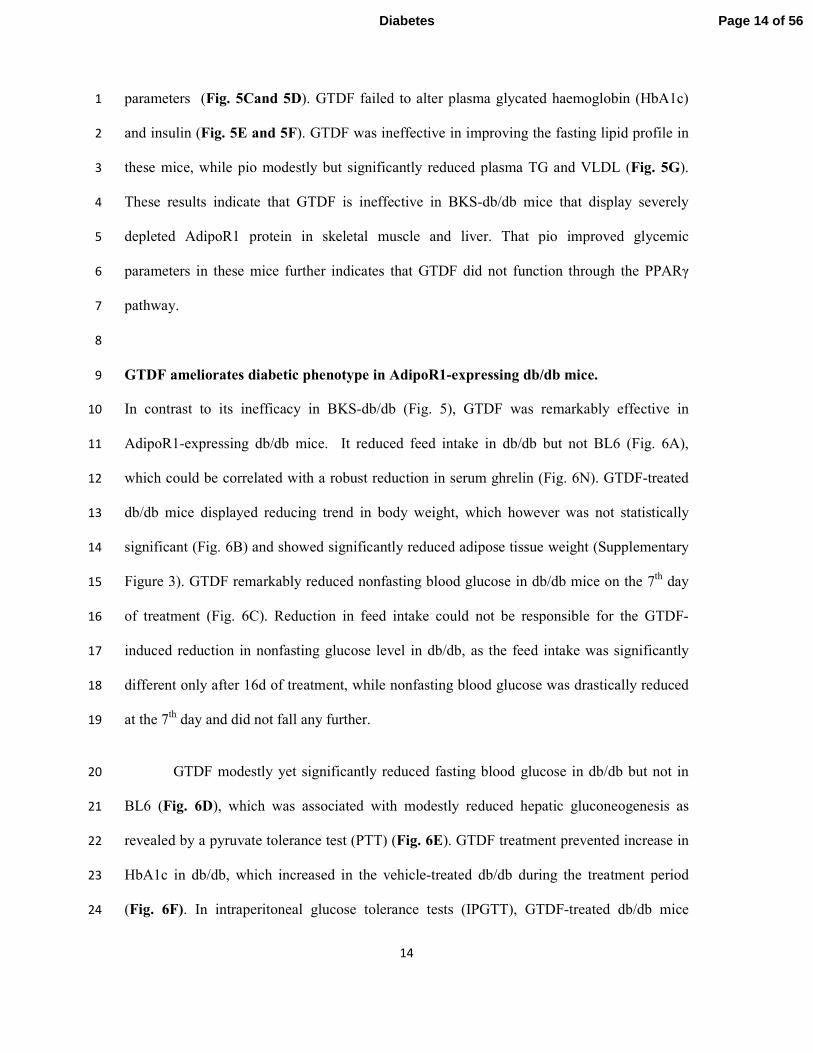
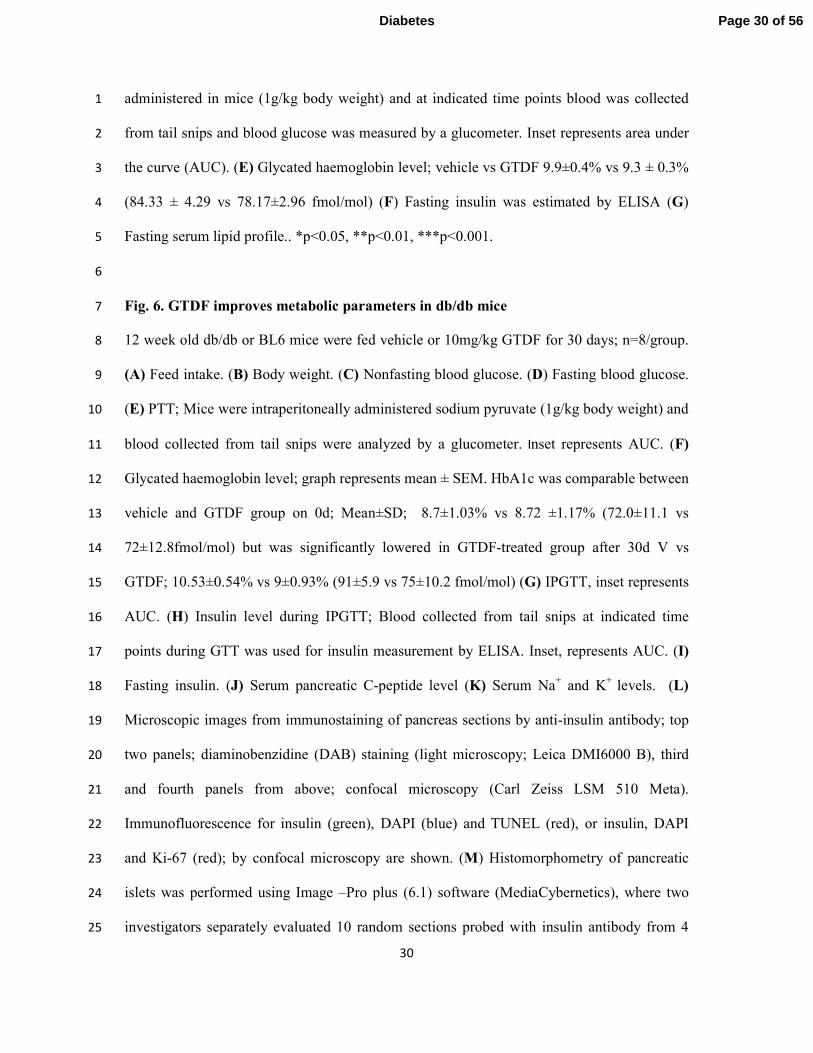
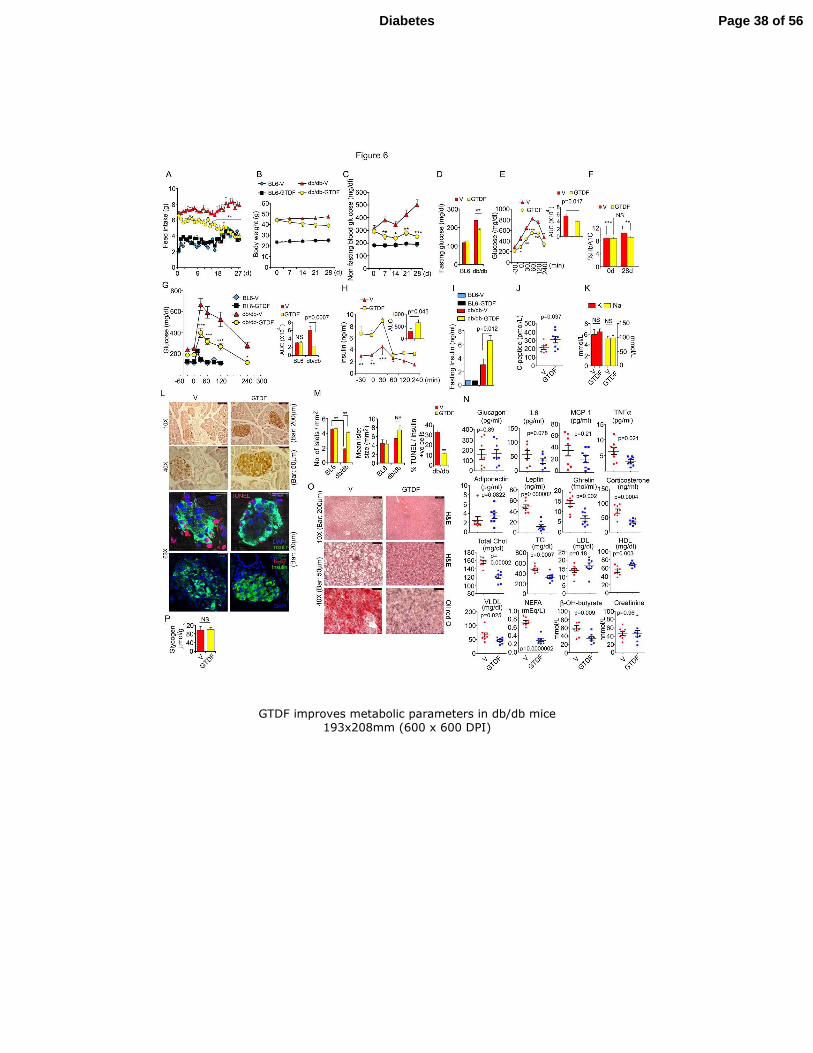
Fig. 6. GTDF improves metabolic parameters in db/db mice 7
12 week old db/db or BL6 mice were fed vehicle or 10mg/kg GTDF for 30 days; n=8/group. 8
(A) Feed intake. (B) Body weight. (C) Nonfasting blood glucose. (D) Fasting blood glucose. 9
(E) PTT; Mice were intraperitoneally administered sodium pyruvate (1g/kg body weight) and 10
blood collected from tail snips were analyzed by a glucometer. Inset represents AUC. (F) 11
Glycated haemoglobin level; graph represents mean ± SEM. HbA1c was comparable between 12
vehicle and GTDF group on 0d; Mean±SD; 8.7±1.03% vs 8.72 ±1.17% (72.0±11.1 vs 13
72±12.8fmol/mol) but was significantly lowered in GTDF-treated group after 30d V vs 14
GTDF; 10.53±0.54% vs 9±0.93% (91±5.9 vs 75±10.2 fmol/mol) (G) IPGTT, inset represents 15
AUC. (H) Insulin level during IPGTT; Blood collected from tail snips at indicated time 16
points during GTT was used for insulin measurement by ELISA. Inset, represents AUC. (I) 17
Fasting insulin. (J) Serum pancreatic C-peptide level (K) Serum Na+ and K
+ levels. (L) 18
Microscopic images from immunostaining of pancreas sections by anti-insulin antibody; top 19
two panels; diaminobenzidine (DAB) staining (light microscopy; Leica DMI6000 B), third 20
and fourth panels from above; confocal microscopy (Carl Zeiss LSM 510 Meta). 21
Immunofluorescence for insulin (green), DAPI (blue) and TUNEL (red), or insulin, DAPI 22
and Ki-67 (red); by confocal microscopy are shown. (M) Histomorphometry of pancreatic 23
islets was performed using Image –Pro plus (6.1) software (MediaCybernetics), where two 24
investigators separately evaluated 10 random sections probed with insulin antibody from 4 25
Page 30 of 56Diabetes
31
mice per group, blinded to experimental design. (N) Fasting serum levels of circulating 1
glucagon, leptin, adiponectin, ghrelin, corticosterone and markers of inflammation (MCP-1, 2
TNF-α, and IL-6) as determined by ELISA. (O) Microscopic images from hematoxylin and 3
eosin (H&E) stained or oil red-O stained liver sections. Top panel magnification 10X, bar 4
200µm. Middle and bottom panel magnification 40X, bar 50 µm. (P) Hepatic glycogen 5
content. n=8 for all experiments unless otherwise indicated. *p<0.05, **p<0.01, ***p<0.001. 6
7
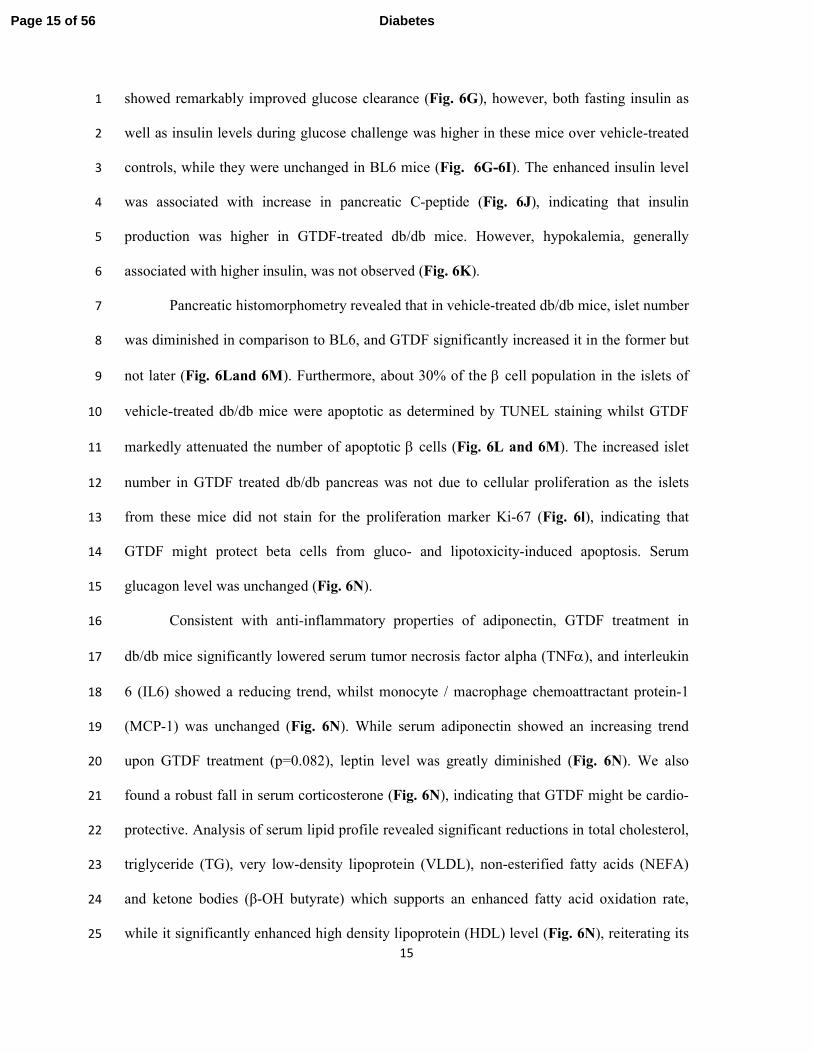
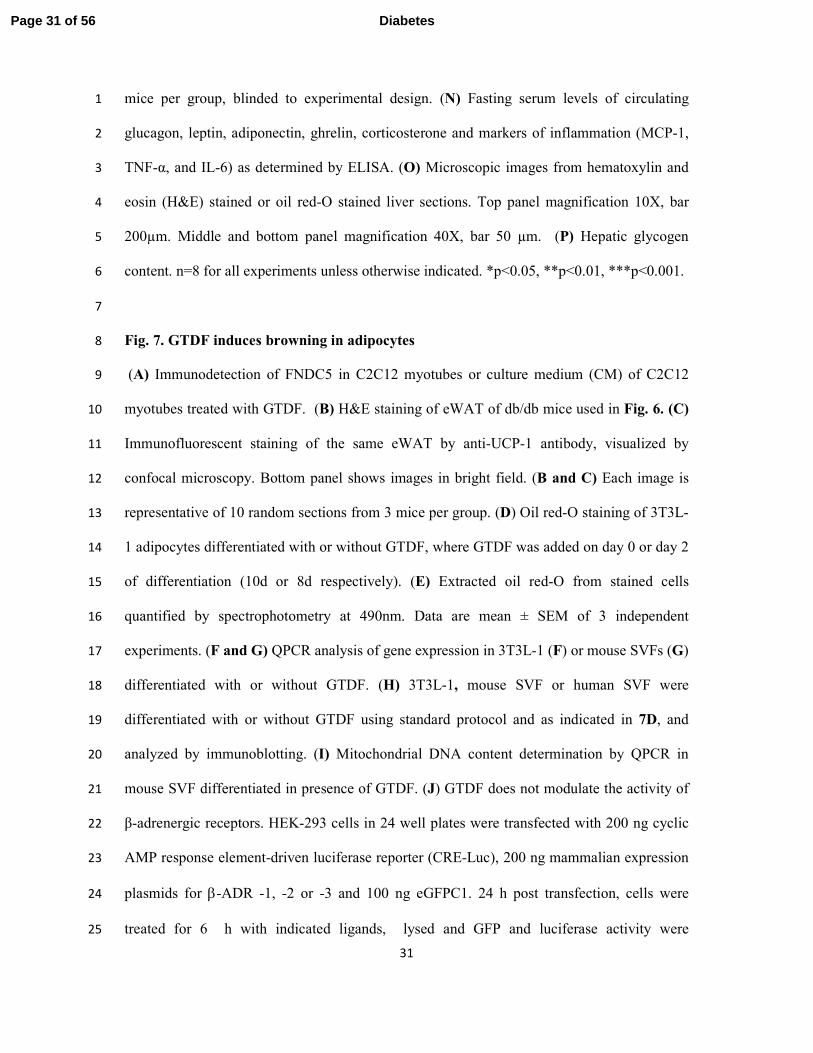
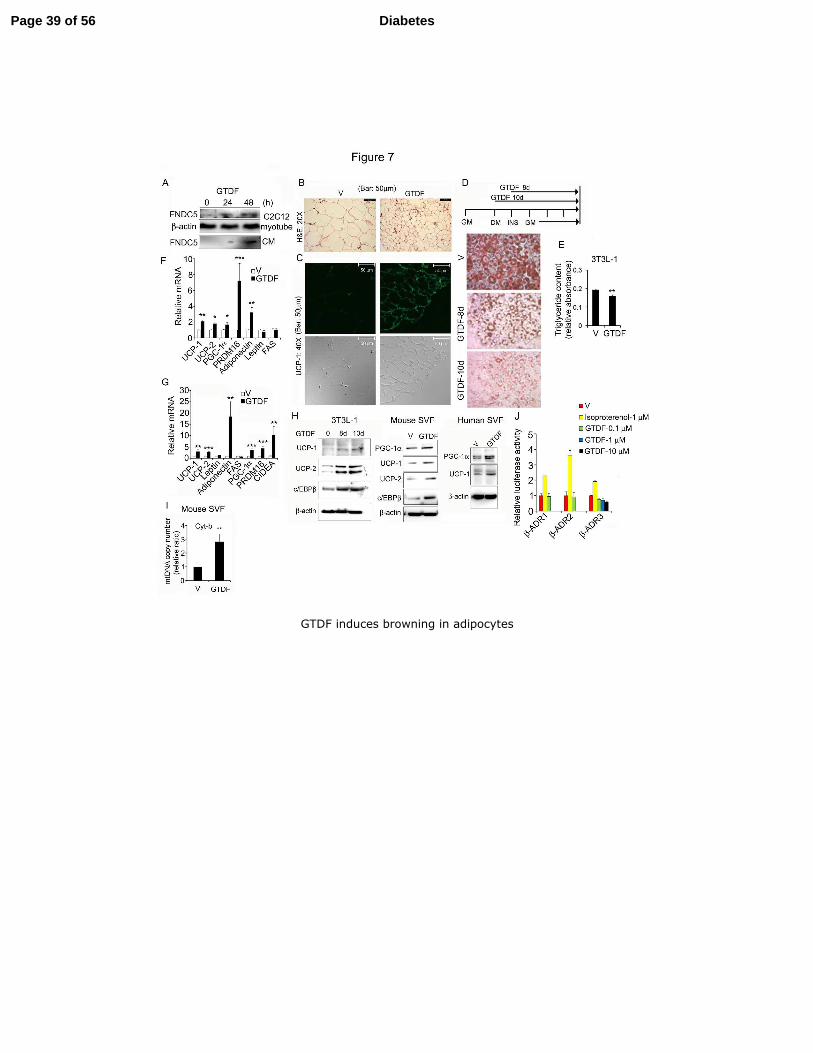
Fig. 7. GTDF induces browning in adipocytes 8
(A) Immunodetection of FNDC5 in C2C12 myotubes or culture medium (CM) of C2C12 9
myotubes treated with GTDF. (B) H&E staining of eWAT of db/db mice used in Fig. 6. (C) 10
Immunofluorescent staining of the same eWAT by anti-UCP-1 antibody, visualized by 11
confocal microscopy. Bottom panel shows images in bright field. (B and C) Each image is 12
representative of 10 random sections from 3 mice per group. (D) Oil red-O staining of 3T3L-13
1 adipocytes differentiated with or without GTDF, where GTDF was added on day 0 or day 2 14
of differentiation (10d or 8d respectively). (E) Extracted oil red-O from stained cells 15
quantified by spectrophotometry at 490nm. Data are mean ± SEM of 3 independent 16
experiments. (F and G) QPCR analysis of gene expression in 3T3L-1 (F) or mouse SVFs (G) 17
differentiated with or without GTDF. (H) 3T3L-1, mouse SVF or human SVF were 18
differentiated with or without GTDF using standard protocol and as indicated in 7D, and 19
analyzed by immunoblotting. (I) Mitochondrial DNA content determination by QPCR in 20
mouse SVF differentiated in presence of GTDF. (J) GTDF does not modulate the activity of 21
β-adrenergic receptors. HEK-293 cells in 24 well plates were transfected with 200 ng cyclic 22
AMP response element-driven luciferase reporter (CRE-Luc), 200 ng mammalian expression 23
plasmids for β-ADR -1, -2 or -3 and 100 ng eGFPC1. 24 h post transfection, cells were 24
treated for 6 h with indicated ligands, lysed and GFP and luciferase activity were 25
Page 31 of 56 Diabetes
32
determined using a microplate fluorimeter (Fluostar Omega; BMG Labtech) and a microplate 1
luminometer (GloMax; Promega). The luciferase values were normalized with GFP and 2
plotted as fold luciferase activity over vehicle-treated controls. Data are mean ± SEM of 3 3
independent experiments in all graphs. Images are representative of 3 independent 4
experiments. GM; Growth medium (DMEM with 4.5mg/ml glucose, 4.0mM glutamine, 1 5
mM sodium pyruvate, 10% FBS and 1X antibiotic-antimycotic solution) DM; Differentiation 6
medium (GM supplemented with 1.5µg/ml insulin, 0.5mM IBMX, 1.0µM dexamethasone 7
and 1µM rosiglitazone), INS; Insulin medium GM plus 1.5µg/ml insulin). For human SVFs 8
after DM and INS medium cells were cultured for 21d, at which matured adipocyte 9
phenotypes were observed. Cells were given fresh medium containing vehicle or 0.01µM 10
GTDF every day during the differentiation. *p<0.05, **p<0.01, ***p<0.005. 11
Supplementary information includes supplementary Figures 1-3 and supplementary tables 12
1-5. 13
Page 32 of 56Diabetes
Chemical structures of quercetin and its natural analogs.
Page 33 of 56 Diabetes
GTDF is an AdipoR agonist that elicits adiponectin-associated signaling and functional events
Page 34 of 56Diabetes
Overexpression or knockdown of AdipoR1 enhances or mitigates GTDF action respectively
Page 35 of 56 Diabetes
Comparison of mRNA and protein expression of AdipoRs and evaluation of adiponectin sensitivity in BL6,
db/db or BKS- db/db mice.
Page 36 of 56Diabetes
GTDF but not pioglitazone fails to improve metabolic health in BKS-db/db 218x266mm (600 x 600 DPI)
Page 37 of 56 Diabetes
GTDF improves metabolic parameters in db/db mice
193x208mm (600 x 600 DPI)
Page 38 of 56Diabetes
GTDF induces browning in adipocytes
Page 39 of 56 Diabetes
SUPPLEMENTARY DATA
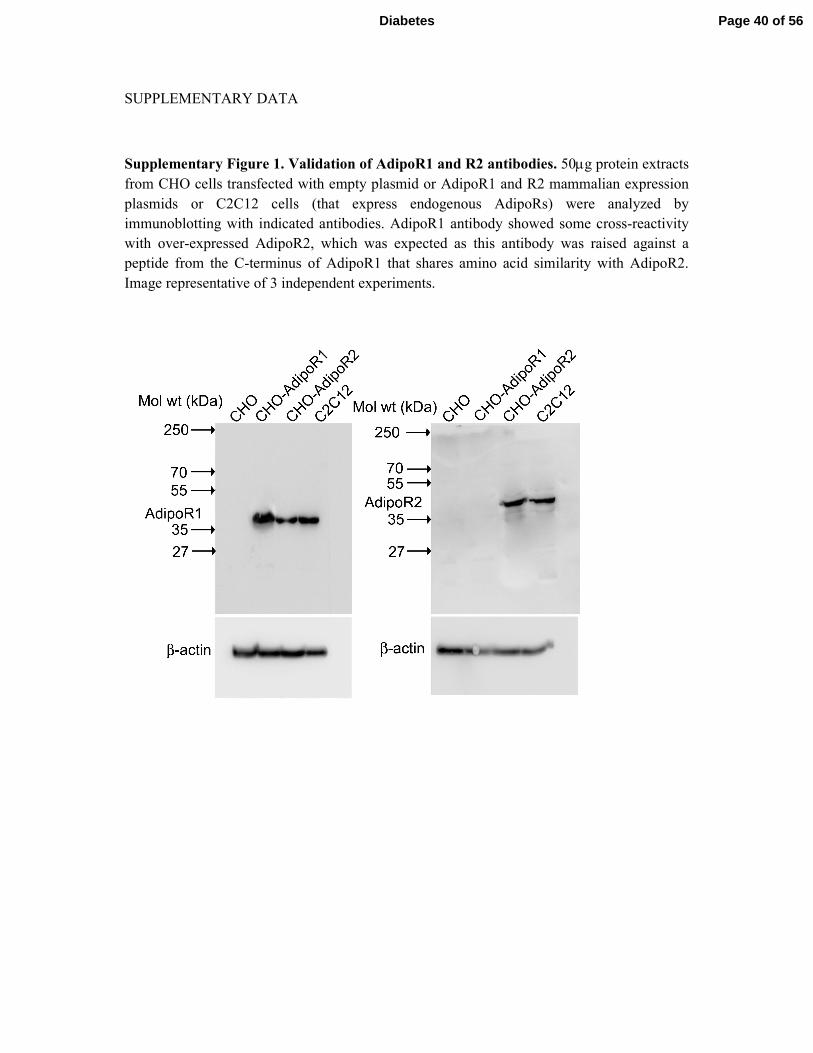
Supplementary Figure 1. Validation of AdipoR1 and R2 antibodies. 50µg protein extracts
from CHO cells transfected with empty plasmid or AdipoR1 and R2 mammalian expression
plasmids or C2C12 cells (that express endogenous AdipoRs) were analyzed by
immunoblotting with indicated antibodies. AdipoR1 antibody showed some cross-reactivity
with over-expressed AdipoR2, which was expected as this antibody was raised against a
peptide from the C-terminus of AdipoR1 that shares amino acid similarity with AdipoR2.
Image representative of 3 independent experiments.
Page 40 of 56Diabetes
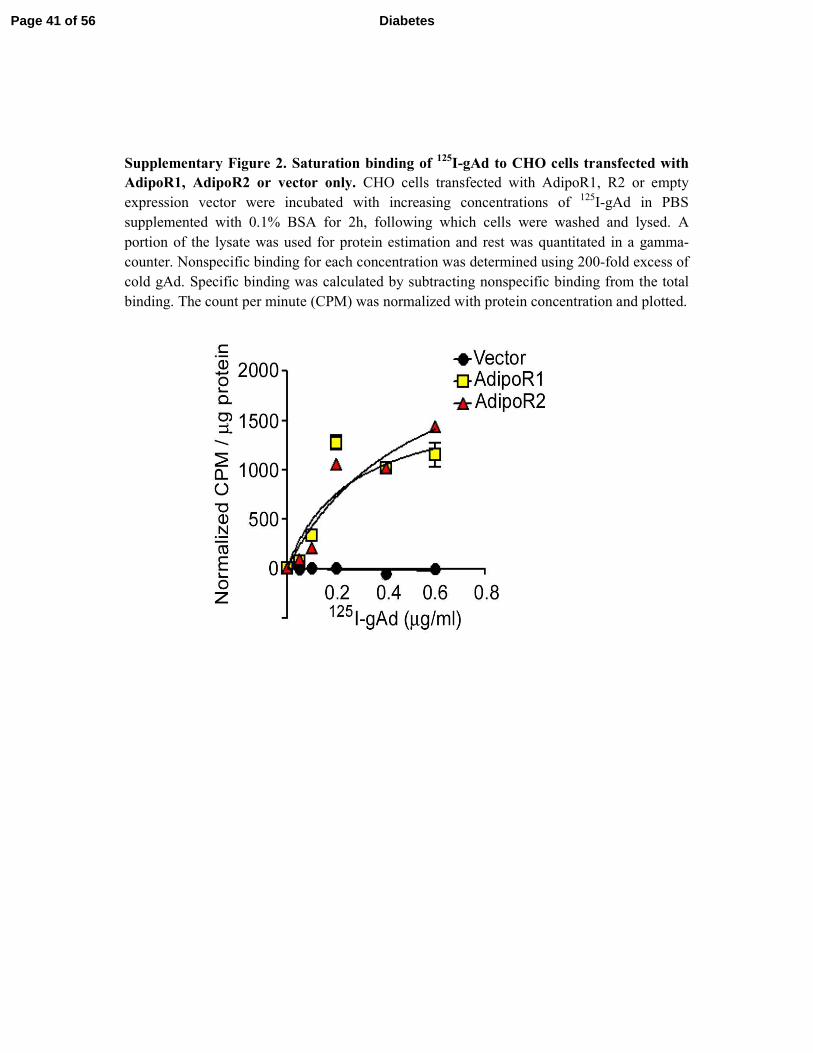
Supplementary Figure 2. Saturation binding of 125
I-gAd to CHO cells transfected with
AdipoR1, AdipoR2 or vector only. CHO cells transfected with AdipoR1, R2 or empty
expression vector were incubated with increasing concentrations of 125
I-gAd in PBS
supplemented with 0.1% BSA for 2h, following which cells were washed and lysed. A
portion of the lysate was used for protein estimation and rest was quantitated in a gamma-
counter. Nonspecific binding for each concentration was determined using 200-fold excess of
cold gAd. Specific binding was calculated by subtracting nonspecific binding from the total
binding. The count per minute (CPM) was normalized with protein concentration and plotted.
Page 41 of 56 Diabetes
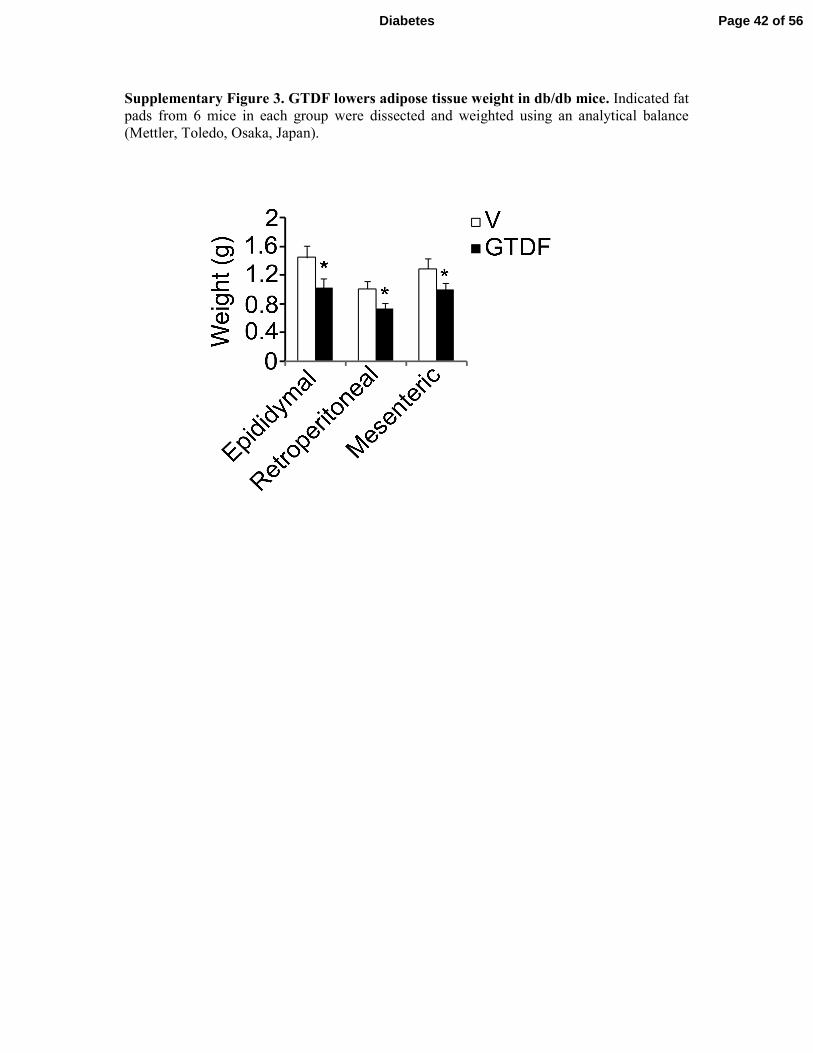
Supplementary Figure 3. GTDF lowers adipose tissue weight in db/db mice. Indicated fat
pads from 6 mice in each group were dissected and weighted using an analytical balance
(Mettler, Toledo, Osaka, Japan).
Page 42 of 56Diabetes
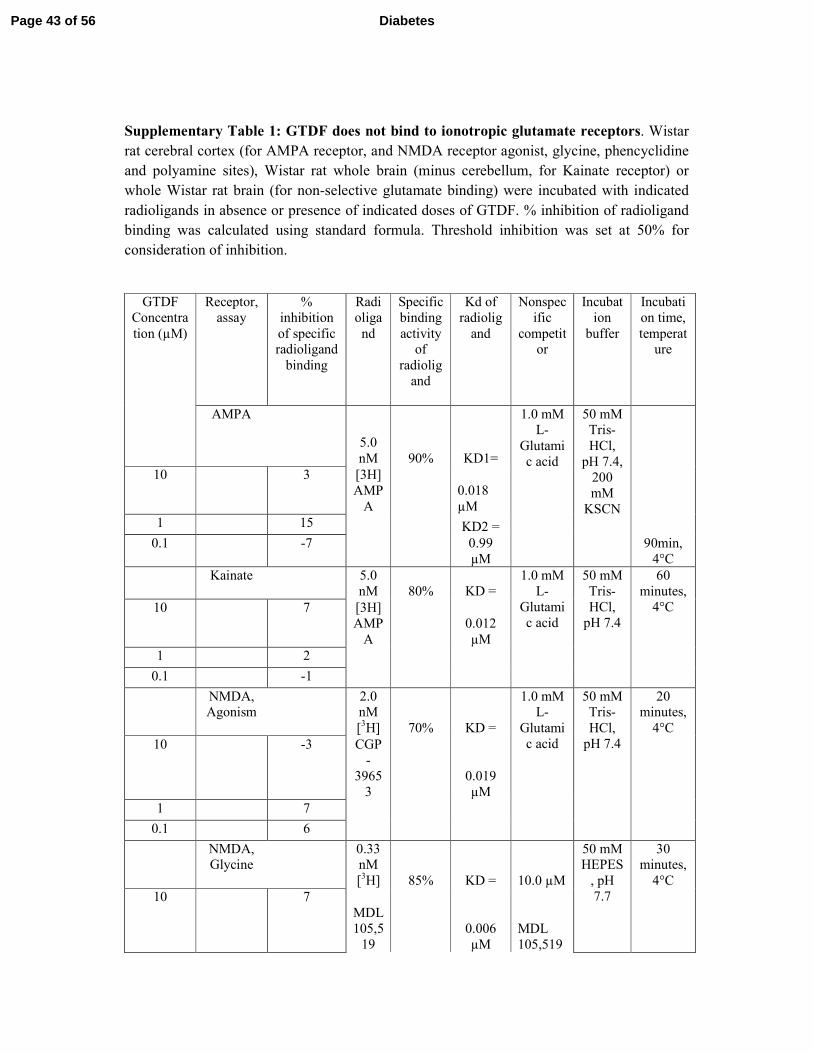
Supplementary Table 1: GTDF does not bind to ionotropic glutamate receptors. Wistar
rat cerebral cortex (for AMPA receptor, and NMDA receptor agonist, glycine, phencyclidine
and polyamine sites), Wistar rat whole brain (minus cerebellum, for Kainate receptor) or
whole Wistar rat brain (for non-selective glutamate binding) were incubated with indicated
radioligands in absence or presence of indicated doses of GTDF. % inhibition of radioligand
binding was calculated using standard formula. Threshold inhibition was set at 50% for
consideration of inhibition.
GTDF
Concentra
tion (µM)
Receptor,
assay
%
inhibition
of specific radioligand
binding
Radi
oliga
nd
Specific
binding
activity of
radiolig
and
Kd of
radiolig
and
Nonspec
ific
competitor
Incubat
ion
buffer
Incubati
on time,
temperature
AMPA
5.0
nM 90% KD1=
1.0 mM L-
Glutami
c acid
50 mM Tris-
HCl,
pH 7.4,
200
mM
KSCN
90min,
4°C
10 3 [3H]
AMP
A
0.018
µM
1 15 KD2 =
0.1 -7
0.99
µM
Kainate 5.0
nM 80% KD =
1.0 mM
L-
Glutami
c acid
50 mM
Tris-
HCl,
pH 7.4
60
minutes,
4°C 10 7 [3H]
AMP
A
0.012
µM
1 2
0.1 -1
NMDA, Agonism
2.0 nM
[3H] 70% KD =
1.0 mM L-
Glutami
c acid
50 mM Tris-
HCl,
pH 7.4
20 minutes,
4°C
10 -3 CGP
-
3965
3
0.019
µM
1 7
0.1 6
NMDA, Glycine
0.33 nM
[3H] 85% KD = 10.0 µM
50 mM HEPES
, pH
7.7
30 minutes,
4°C
10 7
MDL
105,5
19
0.006
µM
MDL
105,519
Page 43 of 56 Diabetes

1 3
0.1 3
NMDA, Phencycli
dine
4.0
nM
[3H] 94% KD =
1.0 µM Dizocilp
ine (+)-
MK-
801)
10 mM
Tris-HCl,
pH 7.4
45 minutes,
25°C
10 2
TCP
0.0084
µM
1 -5
0.1 -2
NMDA, Polyamin
e
2.0 nM
[3H] 80% KD =
10.0 µM
Ifenprodil
50 mM Tris-
HCl,
pH 7.4
2 hours, 4°C
10 4
Ifenp
rodil
0.026
µM
1 -8
0.1 -3
Glutamate
, Non-selective
3.75
nM
[3H] 90% KD =
50.0 µM
L-
Glutami
c acid
50 mM
Tris-HCl,
pH 7.4,
2.5 mM
CaCl2
30
minutes, 37°C
10 17 L-
Gluta
mic
acid
0.29
µM
1 13
0.1 14
Page 44 of 56Diabetes
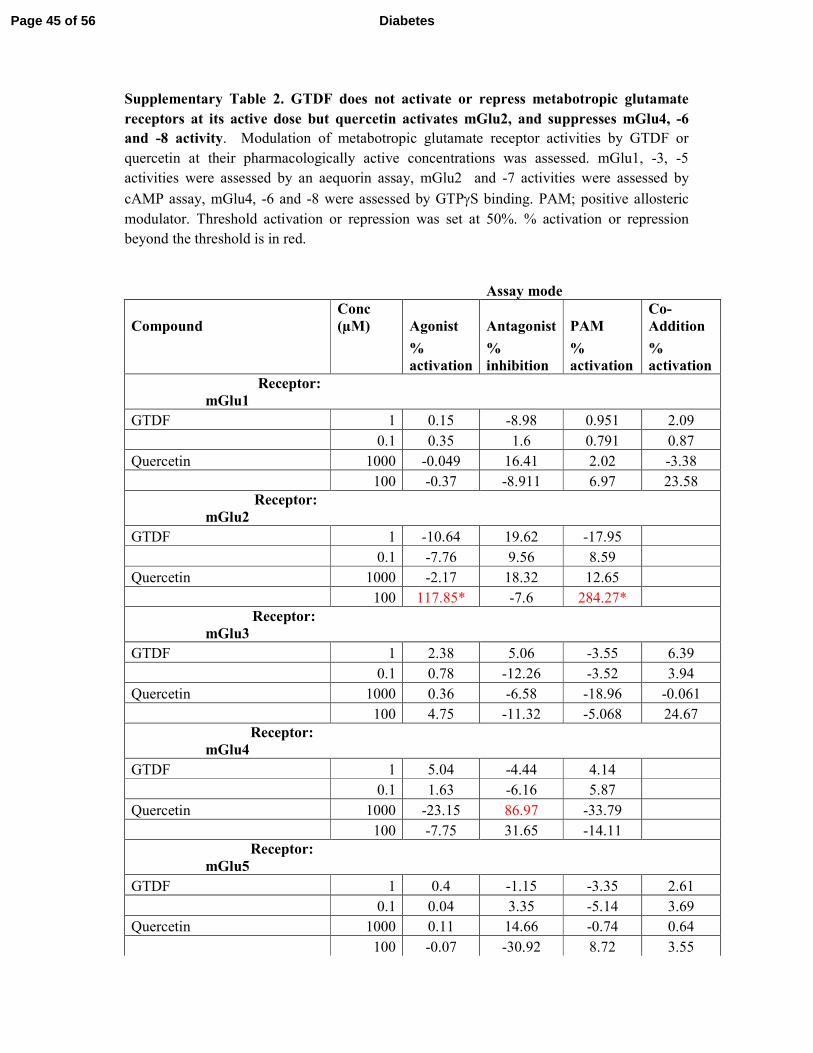
Supplementary Table 2. GTDF does not activate or repress metabotropic glutamate
receptors at its active dose but quercetin activates mGlu2, and suppresses mGlu4, -6
and -8 activity. Modulation of metabotropic glutamate receptor activities by GTDF or
quercetin at their pharmacologically active concentrations was assessed. mGlu1, -3, -5
activities were assessed by an aequorin assay, mGlu2 and -7 activities were assessed by
cAMP assay, mGlu4, -6 and -8 were assessed by GTPγS binding. PAM; positive allosteric
modulator. Threshold activation or repression was set at 50%. % activation or repression
beyond the threshold is in red.
Assay mode
Compound
Conc
(µM) Agonist Antagonist PAM
Co-
Addition
%
activation
%
inhibition
%
activation
%
activation
Receptor:
mGlu1
GTDF 1 0.15 -8.98 0.951 2.09
0.1 0.35 1.6 0.791 0.87
Quercetin 1000 -0.049 16.41 2.02 -3.38
100 -0.37 -8.911 6.97 23.58
Receptor:
mGlu2
GTDF 1 -10.64 19.62 -17.95
0.1 -7.76 9.56 8.59
Quercetin 1000 -2.17 18.32 12.65
100 117.85* -7.6 284.27*
Receptor:
mGlu3
GTDF 1 2.38 5.06 -3.55 6.39
0.1 0.78 -12.26 -3.52 3.94
Quercetin 1000 0.36 -6.58 -18.96 -0.061
100 4.75 -11.32 -5.068 24.67
Receptor:
mGlu4
GTDF 1 5.04 -4.44 4.14
0.1 1.63 -6.16 5.87
Quercetin 1000 -23.15 86.97 -33.79
100 -7.75 31.65 -14.11
Receptor:
mGlu5
GTDF 1 0.4 -1.15 -3.35 2.61
0.1 0.04 3.35 -5.14 3.69
Quercetin 1000 0.11 14.66 -0.74 0.64
100 -0.07 -30.92 8.72 3.55
Page 45 of 56 Diabetes
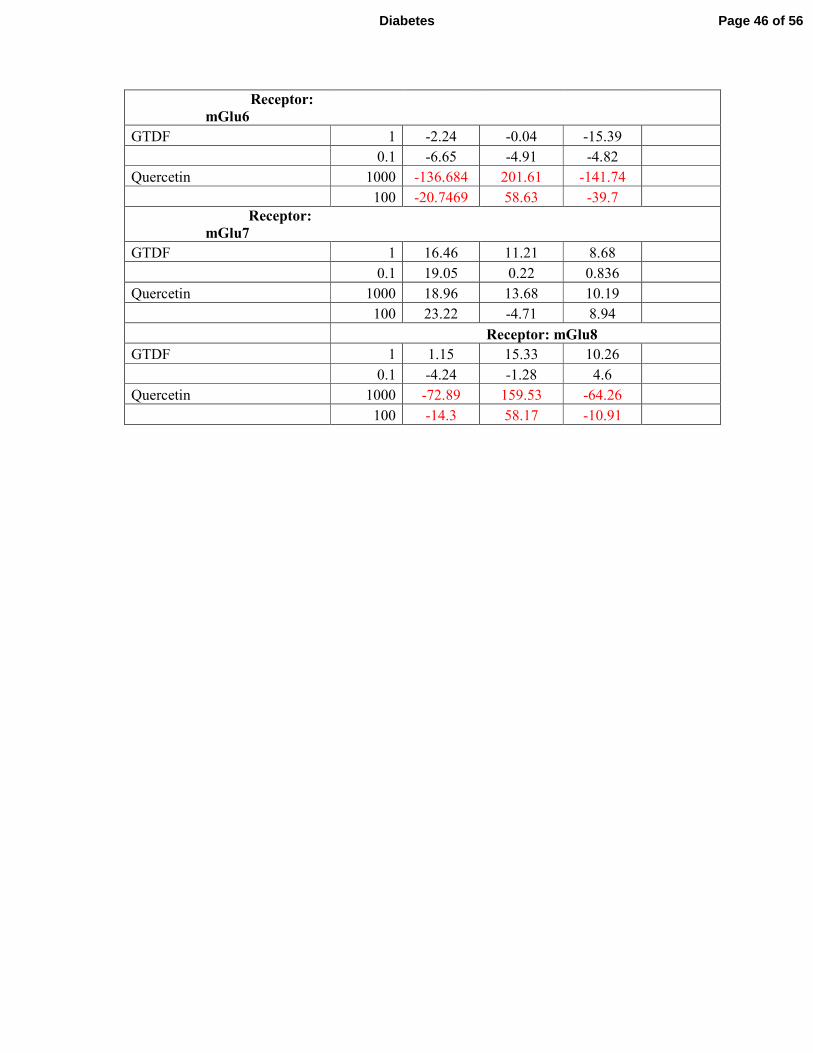
Receptor:
mGlu6
GTDF 1 -2.24 -0.04 -15.39
0.1 -6.65 -4.91 -4.82
Quercetin 1000 -136.684 201.61 -141.74
100 -20.7469 58.63 -39.7
Receptor:
mGlu7
GTDF 1 16.46 11.21 8.68
0.1 19.05 0.22 0.836
Quercetin 1000 18.96 13.68 10.19
100 23.22 -4.71 8.94
Receptor: mGlu8
GTDF 1 1.15 15.33 10.26
0.1 -4.24 -1.28 4.6
Quercetin 1000 -72.89 159.53 -64.26
100 -14.3 58.17 -10.91
Page 46 of 56Diabetes
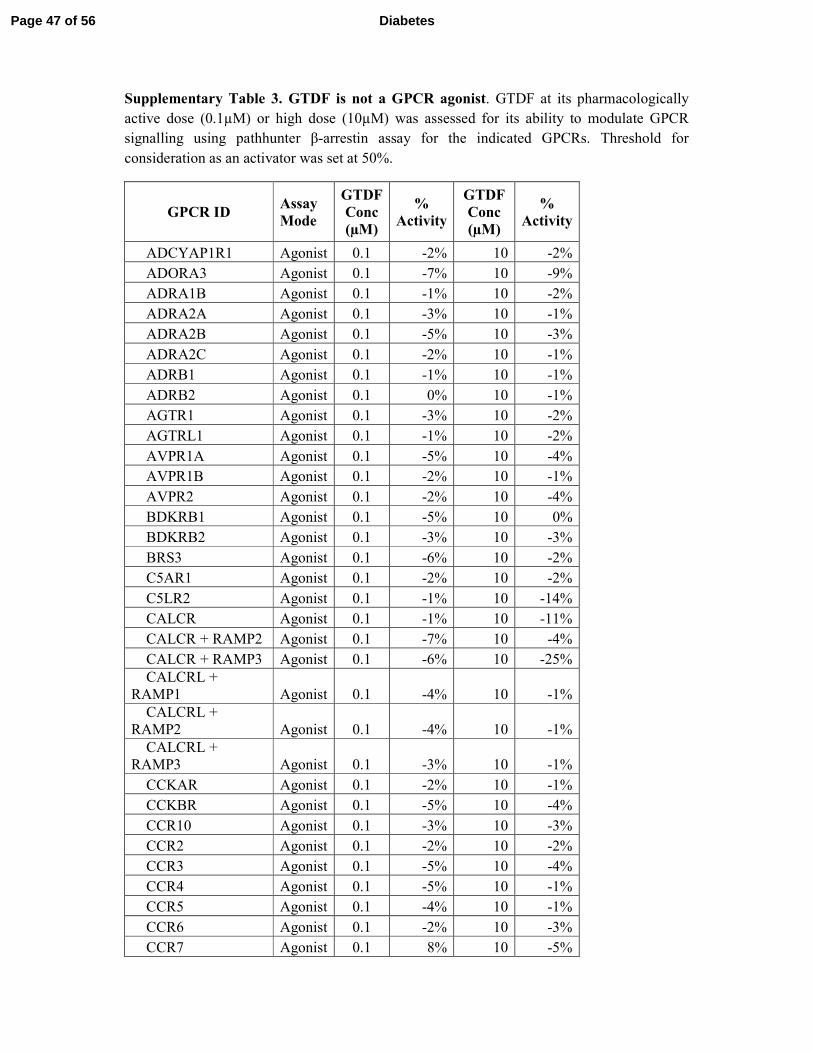
Supplementary Table 3. GTDF is not a GPCR agonist. GTDF at its pharmacologically
active dose (0.1µM) or high dose (10µM) was assessed for its ability to modulate GPCR
signalling using pathhunter β-arrestin assay for the indicated GPCRs. Threshold for
consideration as an activator was set at 50%.
GPCR ID Assay
Mode
GTDF
Conc
(µM)
%
Activity
GTDF
Conc
(µM)
%
Activity
ADCYAP1R1 Agonist 0.1 -2% 10 -2%
ADORA3 Agonist 0.1 -7% 10 -9%
ADRA1B Agonist 0.1 -1% 10 -2%
ADRA2A Agonist 0.1 -3% 10 -1%
ADRA2B Agonist 0.1 -5% 10 -3%
ADRA2C Agonist 0.1 -2% 10 -1%
ADRB1 Agonist 0.1 -1% 10 -1%
ADRB2 Agonist 0.1 0% 10 -1%
AGTR1 Agonist 0.1 -3% 10 -2%
AGTRL1 Agonist 0.1 -1% 10 -2%
AVPR1A Agonist 0.1 -5% 10 -4%
AVPR1B Agonist 0.1 -2% 10 -1%
AVPR2 Agonist 0.1 -2% 10 -4%
BDKRB1 Agonist 0.1 -5% 10 0%
BDKRB2 Agonist 0.1 -3% 10 -3%
BRS3 Agonist 0.1 -6% 10 -2%
C5AR1 Agonist 0.1 -2% 10 -2%
C5LR2 Agonist 0.1 -1% 10 -14%
CALCR Agonist 0.1 -1% 10 -11%
CALCR + RAMP2 Agonist 0.1 -7% 10 -4%
CALCR + RAMP3 Agonist 0.1 -6% 10 -25%
CALCRL +
RAMP1 Agonist 0.1 -4% 10 -1%
CALCRL +
RAMP2 Agonist 0.1 -4% 10 -1%
CALCRL +
RAMP3 Agonist 0.1 -3% 10 -1%
CCKAR Agonist 0.1 -2% 10 -1%
CCKBR Agonist 0.1 -5% 10 -4%
CCR10 Agonist 0.1 -3% 10 -3%
CCR2 Agonist 0.1 -2% 10 -2%
CCR3 Agonist 0.1 -5% 10 -4%
CCR4 Agonist 0.1 -5% 10 -1%
CCR5 Agonist 0.1 -4% 10 -1%
CCR6 Agonist 0.1 -2% 10 -3%
CCR7 Agonist 0.1 8% 10 -5%
Page 47 of 56 Diabetes
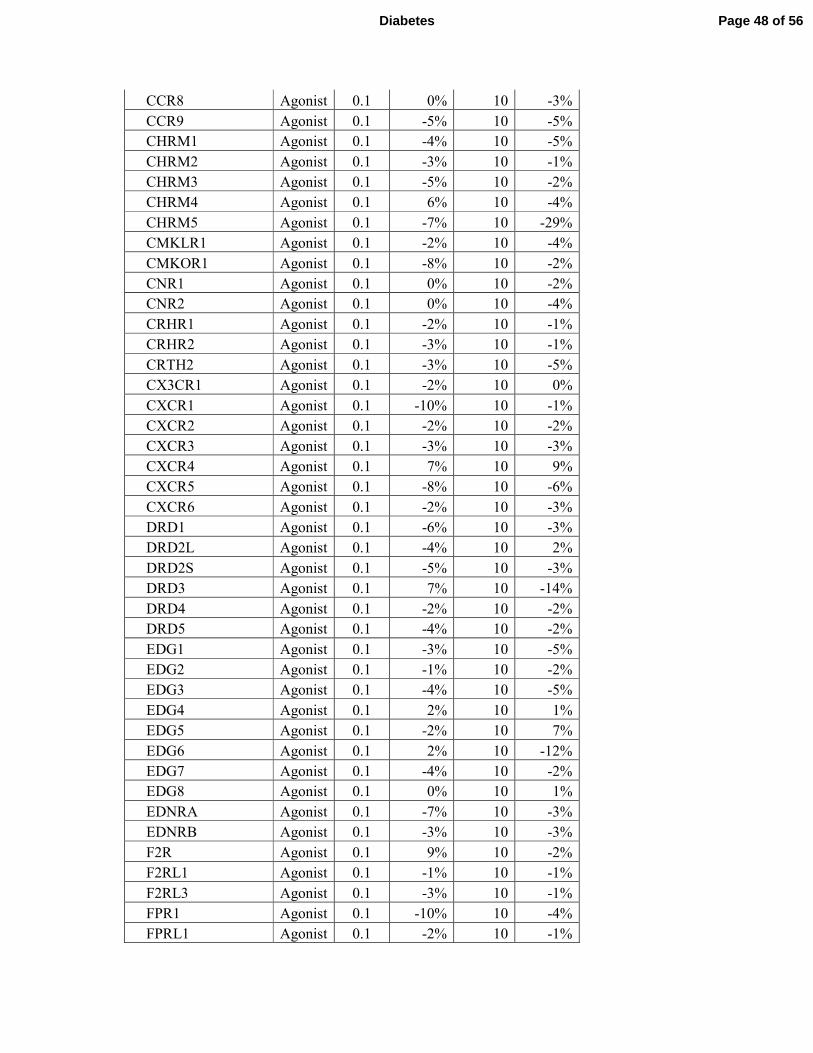
CCR8 Agonist 0.1 0% 10 -3%
CCR9 Agonist 0.1 -5% 10 -5%
CHRM1 Agonist 0.1 -4% 10 -5%
CHRM2 Agonist 0.1 -3% 10 -1%
CHRM3 Agonist 0.1 -5% 10 -2%
CHRM4 Agonist 0.1 6% 10 -4%
CHRM5 Agonist 0.1 -7% 10 -29%
CMKLR1 Agonist 0.1 -2% 10 -4%
CMKOR1 Agonist 0.1 -8% 10 -2%
CNR1 Agonist 0.1 0% 10 -2%
CNR2 Agonist 0.1 0% 10 -4%
CRHR1 Agonist 0.1 -2% 10 -1%
CRHR2 Agonist 0.1 -3% 10 -1%
CRTH2 Agonist 0.1 -3% 10 -5%
CX3CR1 Agonist 0.1 -2% 10 0%
CXCR1 Agonist 0.1 -10% 10 -1%
CXCR2 Agonist 0.1 -2% 10 -2%
CXCR3 Agonist 0.1 -3% 10 -3%
CXCR4 Agonist 0.1 7% 10 9%
CXCR5 Agonist 0.1 -8% 10 -6%
CXCR6 Agonist 0.1 -2% 10 -3%
DRD1 Agonist 0.1 -6% 10 -3%
DRD2L Agonist 0.1 -4% 10 2%
DRD2S Agonist 0.1 -5% 10 -3%
DRD3 Agonist 0.1 7% 10 -14%
DRD4 Agonist 0.1 -2% 10 -2%
DRD5 Agonist 0.1 -4% 10 -2%
EDG1 Agonist 0.1 -3% 10 -5%
EDG2 Agonist 0.1 -1% 10 -2%
EDG3 Agonist 0.1 -4% 10 -5%
EDG4 Agonist 0.1 2% 10 1%
EDG5 Agonist 0.1 -2% 10 7%
EDG6 Agonist 0.1 2% 10 -12%
EDG7 Agonist 0.1 -4% 10 -2%
EDG8 Agonist 0.1 0% 10 1%
EDNRA Agonist 0.1 -7% 10 -3%
EDNRB Agonist 0.1 -3% 10 -3%
F2R Agonist 0.1 9% 10 -2%
F2RL1 Agonist 0.1 -1% 10 -1%
F2RL3 Agonist 0.1 -3% 10 -1%
FPR1 Agonist 0.1 -10% 10 -4%
FPRL1 Agonist 0.1 -2% 10 -1%
Page 48 of 56Diabetes
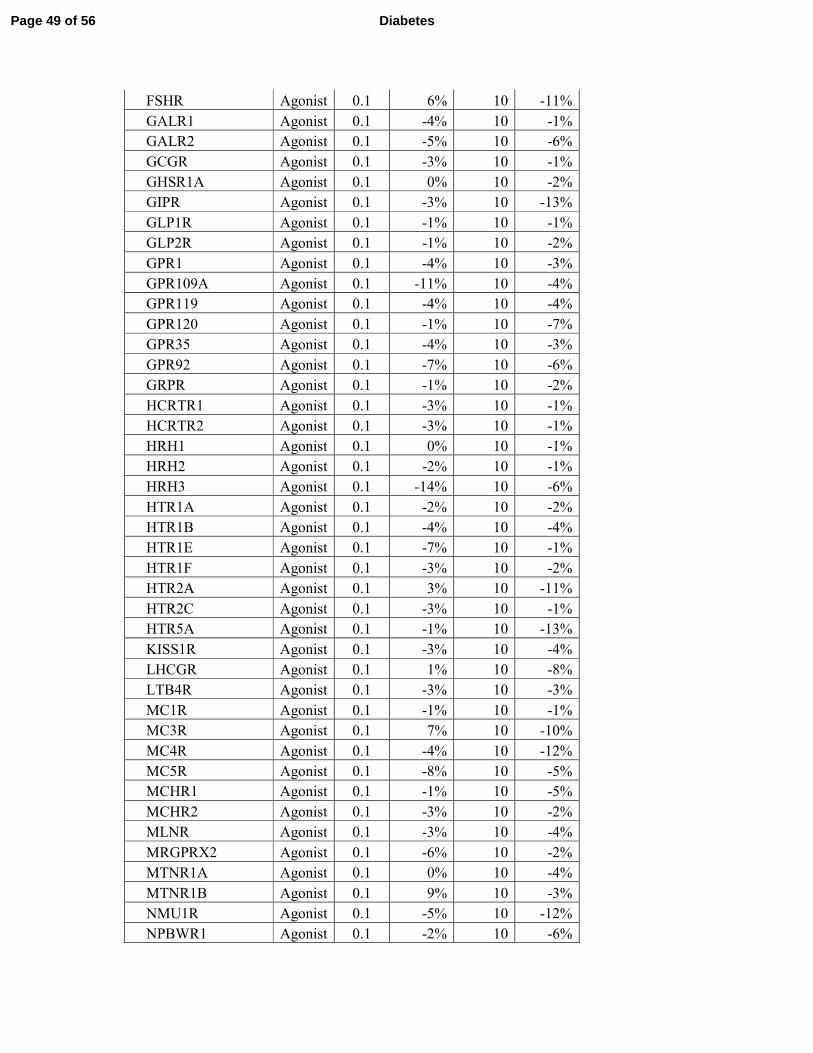
FSHR Agonist 0.1 6% 10 -11%
GALR1 Agonist 0.1 -4% 10 -1%
GALR2 Agonist 0.1 -5% 10 -6%
GCGR Agonist 0.1 -3% 10 -1%
GHSR1A Agonist 0.1 0% 10 -2%
GIPR Agonist 0.1 -3% 10 -13%
GLP1R Agonist 0.1 -1% 10 -1%
GLP2R Agonist 0.1 -1% 10 -2%
GPR1 Agonist 0.1 -4% 10 -3%
GPR109A Agonist 0.1 -11% 10 -4%
GPR119 Agonist 0.1 -4% 10 -4%
GPR120 Agonist 0.1 -1% 10 -7%
GPR35 Agonist 0.1 -4% 10 -3%
GPR92 Agonist 0.1 -7% 10 -6%
GRPR Agonist 0.1 -1% 10 -2%
HCRTR1 Agonist 0.1 -3% 10 -1%
HCRTR2 Agonist 0.1 -3% 10 -1%
HRH1 Agonist 0.1 0% 10 -1%
HRH2 Agonist 0.1 -2% 10 -1%
HRH3 Agonist 0.1 -14% 10 -6%
HTR1A Agonist 0.1 -2% 10 -2%
HTR1B Agonist 0.1 -4% 10 -4%
HTR1E Agonist 0.1 -7% 10 -1%
HTR1F Agonist 0.1 -3% 10 -2%
HTR2A Agonist 0.1 3% 10 -11%
HTR2C Agonist 0.1 -3% 10 -1%
HTR5A Agonist 0.1 -1% 10 -13%
KISS1R Agonist 0.1 -3% 10 -4%
LHCGR Agonist 0.1 1% 10 -8%
LTB4R Agonist 0.1 -3% 10 -3%
MC1R Agonist 0.1 -1% 10 -1%
MC3R Agonist 0.1 7% 10 -10%
MC4R Agonist 0.1 -4% 10 -12%
MC5R Agonist 0.1 -8% 10 -5%
MCHR1 Agonist 0.1 -1% 10 -5%
MCHR2 Agonist 0.1 -3% 10 -2%
MLNR Agonist 0.1 -3% 10 -4%
MRGPRX2 Agonist 0.1 -6% 10 -2%
MTNR1A Agonist 0.1 0% 10 -4%
MTNR1B Agonist 0.1 9% 10 -3%
NMU1R Agonist 0.1 -5% 10 -12%
NPBWR1 Agonist 0.1 -2% 10 -6%
Page 49 of 56 Diabetes
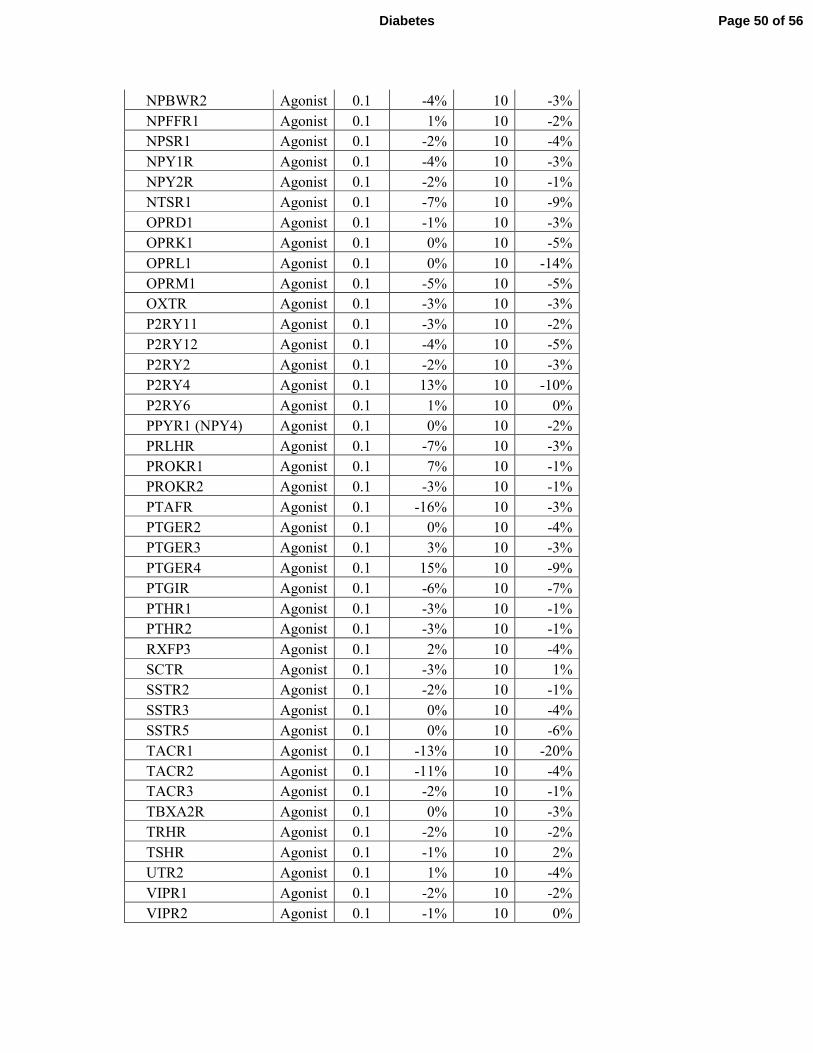
NPBWR2 Agonist 0.1 -4% 10 -3%
NPFFR1 Agonist 0.1 1% 10 -2%
NPSR1 Agonist 0.1 -2% 10 -4%
NPY1R Agonist 0.1 -4% 10 -3%
NPY2R Agonist 0.1 -2% 10 -1%
NTSR1 Agonist 0.1 -7% 10 -9%
OPRD1 Agonist 0.1 -1% 10 -3%
OPRK1 Agonist 0.1 0% 10 -5%
OPRL1 Agonist 0.1 0% 10 -14%
OPRM1 Agonist 0.1 -5% 10 -5%
OXTR Agonist 0.1 -3% 10 -3%
P2RY11 Agonist 0.1 -3% 10 -2%
P2RY12 Agonist 0.1 -4% 10 -5%
P2RY2 Agonist 0.1 -2% 10 -3%
P2RY4 Agonist 0.1 13% 10 -10%
P2RY6 Agonist 0.1 1% 10 0%
PPYR1 (NPY4) Agonist 0.1 0% 10 -2%
PRLHR Agonist 0.1 -7% 10 -3%
PROKR1 Agonist 0.1 7% 10 -1%
PROKR2 Agonist 0.1 -3% 10 -1%
PTAFR Agonist 0.1 -16% 10 -3%
PTGER2 Agonist 0.1 0% 10 -4%
PTGER3 Agonist 0.1 3% 10 -3%
PTGER4 Agonist 0.1 15% 10 -9%
PTGIR Agonist 0.1 -6% 10 -7%
PTHR1 Agonist 0.1 -3% 10 -1%
PTHR2 Agonist 0.1 -3% 10 -1%
RXFP3 Agonist 0.1 2% 10 -4%
SCTR Agonist 0.1 -3% 10 1%
SSTR2 Agonist 0.1 -2% 10 -1%
SSTR3 Agonist 0.1 0% 10 -4%
SSTR5 Agonist 0.1 0% 10 -6%
TACR1 Agonist 0.1 -13% 10 -20%
TACR2 Agonist 0.1 -11% 10 -4%
TACR3 Agonist 0.1 -2% 10 -1%
TBXA2R Agonist 0.1 0% 10 -3%
TRHR Agonist 0.1 -2% 10 -2%
TSHR Agonist 0.1 -1% 10 2%
UTR2 Agonist 0.1 1% 10 -4%
VIPR1 Agonist 0.1 -2% 10 -2%
VIPR2 Agonist 0.1 -1% 10 0%
Page 50 of 56Diabetes
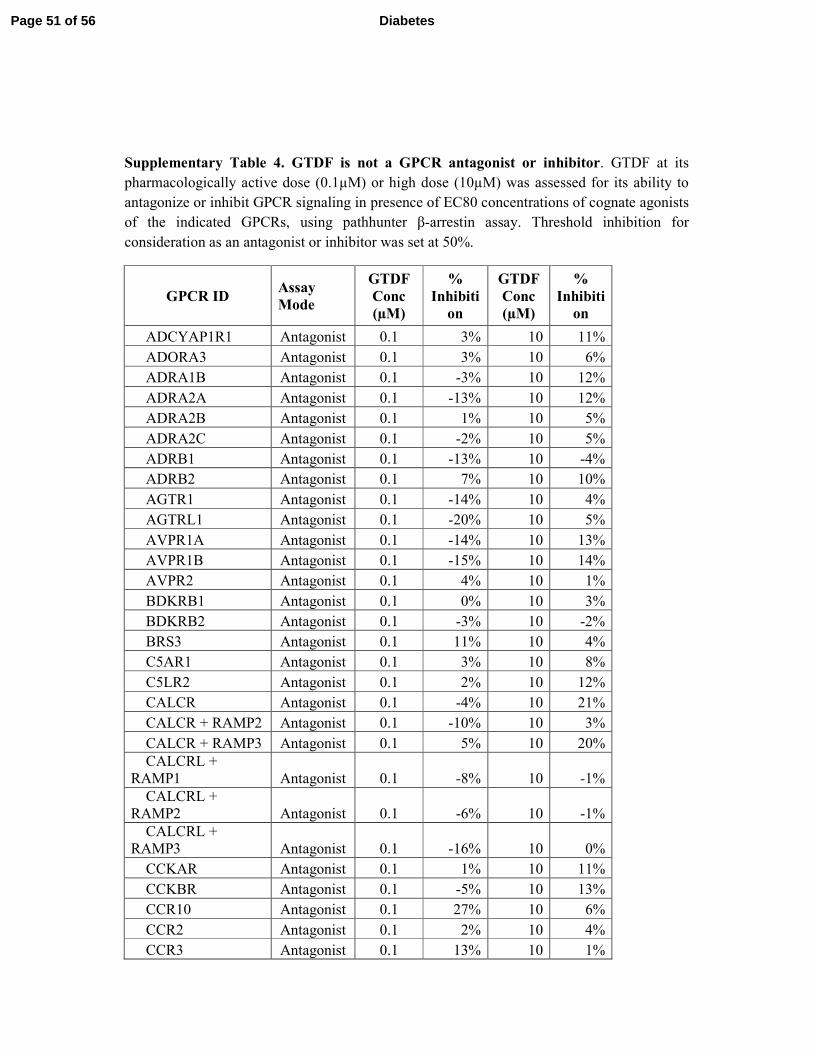
Supplementary Table 4. GTDF is not a GPCR antagonist or inhibitor. GTDF at its
pharmacologically active dose (0.1µM) or high dose (10µM) was assessed for its ability to
antagonize or inhibit GPCR signaling in presence of EC80 concentrations of cognate agonists
of the indicated GPCRs, using pathhunter β-arrestin assay. Threshold inhibition for
consideration as an antagonist or inhibitor was set at 50%.
GPCR ID Assay
Mode
GTDF
Conc
(µM)
%
Inhibiti
on
GTDF
Conc
(µM)
%
Inhibiti
on
ADCYAP1R1 Antagonist 0.1 3% 10 11%
ADORA3 Antagonist 0.1 3% 10 6%
ADRA1B Antagonist 0.1 -3% 10 12%
ADRA2A Antagonist 0.1 -13% 10 12%
ADRA2B Antagonist 0.1 1% 10 5%
ADRA2C Antagonist 0.1 -2% 10 5%
ADRB1 Antagonist 0.1 -13% 10 -4%
ADRB2 Antagonist 0.1 7% 10 10%
AGTR1 Antagonist 0.1 -14% 10 4%
AGTRL1 Antagonist 0.1 -20% 10 5%
AVPR1A Antagonist 0.1 -14% 10 13%
AVPR1B Antagonist 0.1 -15% 10 14%
AVPR2 Antagonist 0.1 4% 10 1%
BDKRB1 Antagonist 0.1 0% 10 3%
BDKRB2 Antagonist 0.1 -3% 10 -2%
BRS3 Antagonist 0.1 11% 10 4%
C5AR1 Antagonist 0.1 3% 10 8%
C5LR2 Antagonist 0.1 2% 10 12%
CALCR Antagonist 0.1 -4% 10 21%
CALCR + RAMP2 Antagonist 0.1 -10% 10 3%
CALCR + RAMP3 Antagonist 0.1 5% 10 20%
CALCRL +
RAMP1 Antagonist 0.1 -8% 10 -1%
CALCRL +
RAMP2 Antagonist 0.1 -6% 10 -1%
CALCRL +
RAMP3 Antagonist 0.1 -16% 10 0%
CCKAR Antagonist 0.1 1% 10 11%
CCKBR Antagonist 0.1 -5% 10 13%
CCR10 Antagonist 0.1 27% 10 6%
CCR2 Antagonist 0.1 2% 10 4%
CCR3 Antagonist 0.1 13% 10 1%
Page 51 of 56 Diabetes
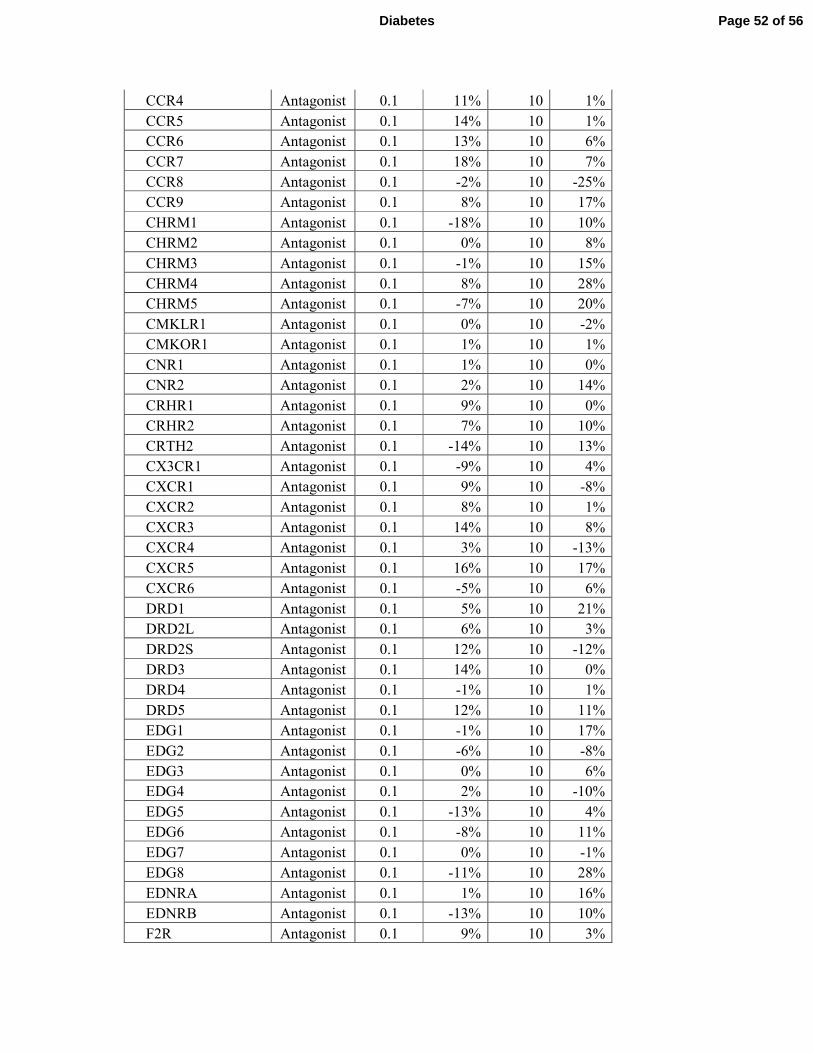
CCR4 Antagonist 0.1 11% 10 1%
CCR5 Antagonist 0.1 14% 10 1%
CCR6 Antagonist 0.1 13% 10 6%
CCR7 Antagonist 0.1 18% 10 7%
CCR8 Antagonist 0.1 -2% 10 -25%
CCR9 Antagonist 0.1 8% 10 17%
CHRM1 Antagonist 0.1 -18% 10 10%
CHRM2 Antagonist 0.1 0% 10 8%
CHRM3 Antagonist 0.1 -1% 10 15%
CHRM4 Antagonist 0.1 8% 10 28%
CHRM5 Antagonist 0.1 -7% 10 20%
CMKLR1 Antagonist 0.1 0% 10 -2%
CMKOR1 Antagonist 0.1 1% 10 1%
CNR1 Antagonist 0.1 1% 10 0%
CNR2 Antagonist 0.1 2% 10 14%
CRHR1 Antagonist 0.1 9% 10 0%
CRHR2 Antagonist 0.1 7% 10 10%
CRTH2 Antagonist 0.1 -14% 10 13%
CX3CR1 Antagonist 0.1 -9% 10 4%
CXCR1 Antagonist 0.1 9% 10 -8%
CXCR2 Antagonist 0.1 8% 10 1%
CXCR3 Antagonist 0.1 14% 10 8%
CXCR4 Antagonist 0.1 3% 10 -13%
CXCR5 Antagonist 0.1 16% 10 17%
CXCR6 Antagonist 0.1 -5% 10 6%
DRD1 Antagonist 0.1 5% 10 21%
DRD2L Antagonist 0.1 6% 10 3%
DRD2S Antagonist 0.1 12% 10 -12%
DRD3 Antagonist 0.1 14% 10 0%
DRD4 Antagonist 0.1 -1% 10 1%
DRD5 Antagonist 0.1 12% 10 11%
EDG1 Antagonist 0.1 -1% 10 17%
EDG2 Antagonist 0.1 -6% 10 -8%
EDG3 Antagonist 0.1 0% 10 6%
EDG4 Antagonist 0.1 2% 10 -10%
EDG5 Antagonist 0.1 -13% 10 4%
EDG6 Antagonist 0.1 -8% 10 11%
EDG7 Antagonist 0.1 0% 10 -1%
EDG8 Antagonist 0.1 -11% 10 28%
EDNRA Antagonist 0.1 1% 10 16%
EDNRB Antagonist 0.1 -13% 10 10%
F2R Antagonist 0.1 9% 10 3%
Page 52 of 56Diabetes
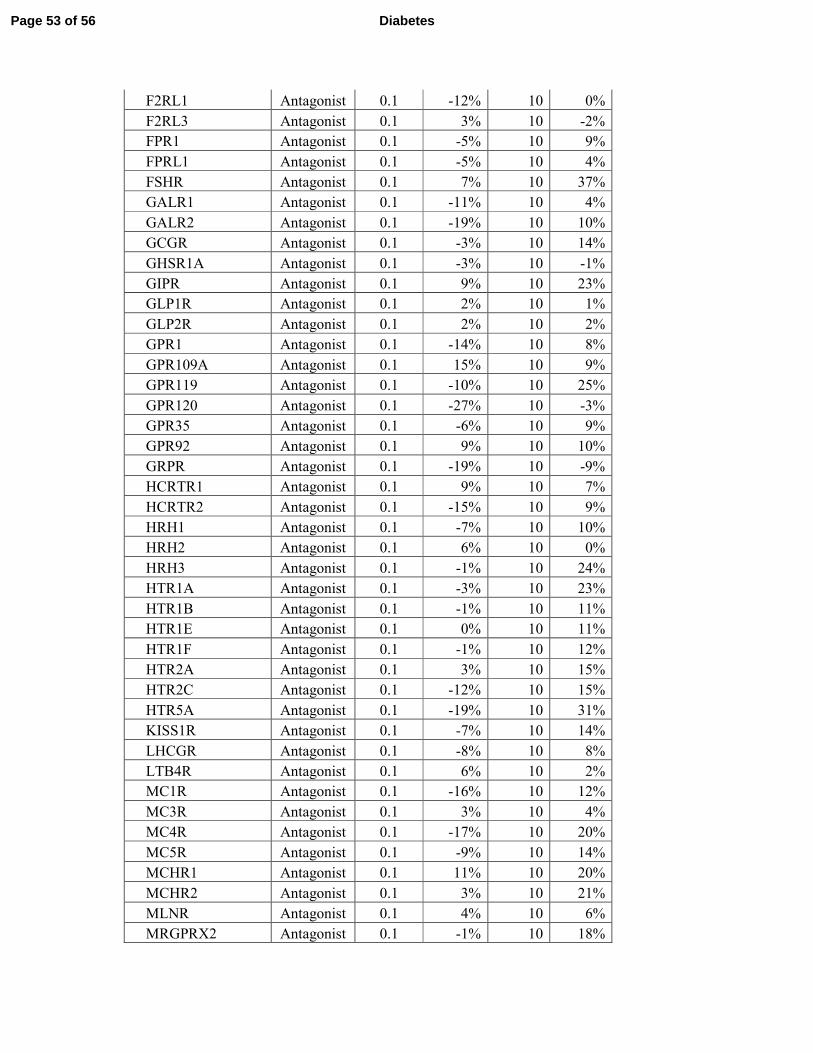
F2RL1 Antagonist 0.1 -12% 10 0%
F2RL3 Antagonist 0.1 3% 10 -2%
FPR1 Antagonist 0.1 -5% 10 9%
FPRL1 Antagonist 0.1 -5% 10 4%
FSHR Antagonist 0.1 7% 10 37%
GALR1 Antagonist 0.1 -11% 10 4%
GALR2 Antagonist 0.1 -19% 10 10%
GCGR Antagonist 0.1 -3% 10 14%
GHSR1A Antagonist 0.1 -3% 10 -1%
GIPR Antagonist 0.1 9% 10 23%
GLP1R Antagonist 0.1 2% 10 1%
GLP2R Antagonist 0.1 2% 10 2%
GPR1 Antagonist 0.1 -14% 10 8%
GPR109A Antagonist 0.1 15% 10 9%
GPR119 Antagonist 0.1 -10% 10 25%
GPR120 Antagonist 0.1 -27% 10 -3%
GPR35 Antagonist 0.1 -6% 10 9%
GPR92 Antagonist 0.1 9% 10 10%
GRPR Antagonist 0.1 -19% 10 -9%
HCRTR1 Antagonist 0.1 9% 10 7%
HCRTR2 Antagonist 0.1 -15% 10 9%
HRH1 Antagonist 0.1 -7% 10 10%
HRH2 Antagonist 0.1 6% 10 0%
HRH3 Antagonist 0.1 -1% 10 24%
HTR1A Antagonist 0.1 -3% 10 23%
HTR1B Antagonist 0.1 -1% 10 11%
HTR1E Antagonist 0.1 0% 10 11%
HTR1F Antagonist 0.1 -1% 10 12%
HTR2A Antagonist 0.1 3% 10 15%
HTR2C Antagonist 0.1 -12% 10 15%
HTR5A Antagonist 0.1 -19% 10 31%
KISS1R Antagonist 0.1 -7% 10 14%
LHCGR Antagonist 0.1 -8% 10 8%
LTB4R Antagonist 0.1 6% 10 2%
MC1R Antagonist 0.1 -16% 10 12%
MC3R Antagonist 0.1 3% 10 4%
MC4R Antagonist 0.1 -17% 10 20%
MC5R Antagonist 0.1 -9% 10 14%
MCHR1 Antagonist 0.1 11% 10 20%
MCHR2 Antagonist 0.1 3% 10 21%
MLNR Antagonist 0.1 4% 10 6%
MRGPRX2 Antagonist 0.1 -1% 10 18%
Page 53 of 56 Diabetes
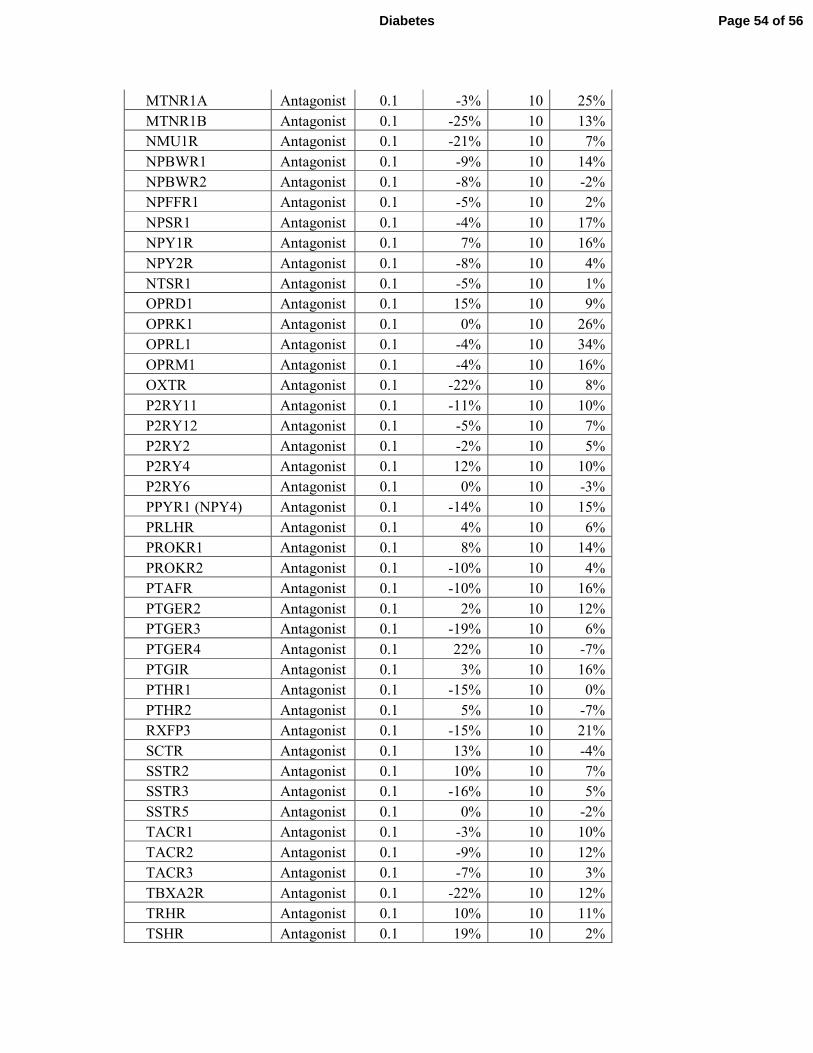
MTNR1A Antagonist 0.1 -3% 10 25%
MTNR1B Antagonist 0.1 -25% 10 13%
NMU1R Antagonist 0.1 -21% 10 7%
NPBWR1 Antagonist 0.1 -9% 10 14%
NPBWR2 Antagonist 0.1 -8% 10 -2%
NPFFR1 Antagonist 0.1 -5% 10 2%
NPSR1 Antagonist 0.1 -4% 10 17%
NPY1R Antagonist 0.1 7% 10 16%
NPY2R Antagonist 0.1 -8% 10 4%
NTSR1 Antagonist 0.1 -5% 10 1%
OPRD1 Antagonist 0.1 15% 10 9%
OPRK1 Antagonist 0.1 0% 10 26%
OPRL1 Antagonist 0.1 -4% 10 34%
OPRM1 Antagonist 0.1 -4% 10 16%
OXTR Antagonist 0.1 -22% 10 8%
P2RY11 Antagonist 0.1 -11% 10 10%
P2RY12 Antagonist 0.1 -5% 10 7%
P2RY2 Antagonist 0.1 -2% 10 5%
P2RY4 Antagonist 0.1 12% 10 10%
P2RY6 Antagonist 0.1 0% 10 -3%
PPYR1 (NPY4) Antagonist 0.1 -14% 10 15%
PRLHR Antagonist 0.1 4% 10 6%
PROKR1 Antagonist 0.1 8% 10 14%
PROKR2 Antagonist 0.1 -10% 10 4%
PTAFR Antagonist 0.1 -10% 10 16%
PTGER2 Antagonist 0.1 2% 10 12%
PTGER3 Antagonist 0.1 -19% 10 6%
PTGER4 Antagonist 0.1 22% 10 -7%
PTGIR Antagonist 0.1 3% 10 16%
PTHR1 Antagonist 0.1 -15% 10 0%
PTHR2 Antagonist 0.1 5% 10 -7%
RXFP3 Antagonist 0.1 -15% 10 21%
SCTR Antagonist 0.1 13% 10 -4%
SSTR2 Antagonist 0.1 10% 10 7%
SSTR3 Antagonist 0.1 -16% 10 5%
SSTR5 Antagonist 0.1 0% 10 -2%
TACR1 Antagonist 0.1 -3% 10 10%
TACR2 Antagonist 0.1 -9% 10 12%
TACR3 Antagonist 0.1 -7% 10 3%
TBXA2R Antagonist 0.1 -22% 10 12%
TRHR Antagonist 0.1 10% 10 11%
TSHR Antagonist 0.1 19% 10 2%
Page 54 of 56Diabetes

UTR2 Antagonist 0.1 5% 10 13%
VIPR1 Antagonist 0.1 3% 10 -2%
VIPR2 Antagonist 0.1 3% 10 1%
Page 55 of 56 Diabetes
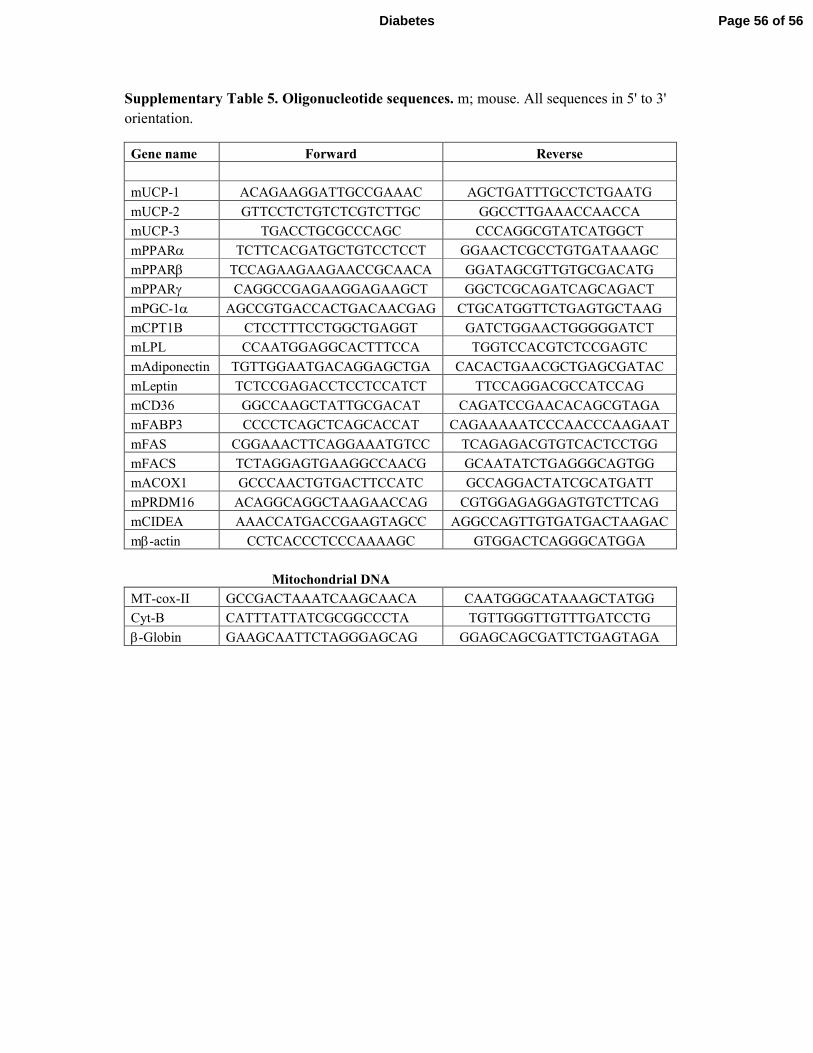
Supplementary Table 5. Oligonucleotide sequences. m; mouse. All sequences in 5' to 3'
orientation.
Gene name Forward Reverse
mUCP-1 ACAGAAGGATTGCCGAAAC AGCTGATTTGCCTCTGAATG
mUCP-2 GTTCCTCTGTCTCGTCTTGC GGCCTTGAAACCAACCA
mUCP-3 TGACCTGCGCCCAGC CCCAGGCGTATCATGGCT
mPPARα TCTTCACGATGCTGTCCTCCT GGAACTCGCCTGTGATAAAGC
mPPARβ TCCAGAAGAAGAACCGCAACA GGATAGCGTTGTGCGACATG
mPPARγ CAGGCCGAGAAGGAGAAGCT GGCTCGCAGATCAGCAGACT
mPGC-1α AGCCGTGACCACTGACAACGAG CTGCATGGTTCTGAGTGCTAAG
mCPT1B CTCCTTTCCTGGCTGAGGT GATCTGGAACTGGGGGATCT
mLPL CCAATGGAGGCACTTTCCA TGGTCCACGTCTCCGAGTC
mAdiponectin TGTTGGAATGACAGGAGCTGA CACACTGAACGCTGAGCGATAC
mLeptin TCTCCGAGACCTCCTCCATCT TTCCAGGACGCCATCCAG
mCD36 GGCCAAGCTATTGCGACAT CAGATCCGAACACAGCGTAGA
mFABP3 CCCCTCAGCTCAGCACCAT CAGAAAAATCCCAACCCAAGAAT
mFAS CGGAAACTTCAGGAAATGTCC TCAGAGACGTGTCACTCCTGG
mFACS TCTAGGAGTGAAGGCCAACG GCAATATCTGAGGGCAGTGG
mACOX1 GCCCAACTGTGACTTCCATC GCCAGGACTATCGCATGATT
mPRDM16 ACAGGCAGGCTAAGAACCAG CGTGGAGAGGAGTGTCTTCAG
mCIDEA AAACCATGACCGAAGTAGCC AGGCCAGTTGTGATGACTAAGAC
mβ-actin CCTCACCCTCCCAAAAGC GTGGACTCAGGGCATGGA
Mitochondrial DNA
MT-cox-II GCCGACTAAATCAAGCAACA CAATGGGCATAAAGCTATGG
Cyt-B CATTTATTATCGCGGCCCTA TGTTGGGTTGTTTGATCCTG
β-Globin GAAGCAATTCTAGGGAGCAG GGAGCAGCGATTCTGAGTAGA
Page 56 of 56Diabetes
Copyright © 2022 FDOKUMEN