Market Analysis Report
40
Market Analysis Report June 19, 2014
-
Upload
independent -
Category
Documents
-
view
2 -
download
0
Transcript of Market Analysis Report
Market Analysis Report June 19, 2014
Market Analysis Report
June 19, 2014
Forward-Looking Statements: Page 1
Agriculture Market Overview: Pages 2 – 6
Fertilizer Market Overview: Pages 7 – 17
World N,P,K Supply Profile: Pages 18 – 37
This PotashCorp Market Analysis Report was prepared for PotashCorp
stakeholders. It provides a concise and up-to-date analysis of the major
changes and events that shape the fertilizer industry and affect our
markets.
The following provides a table of contents:
MARKET ANALYSIS REPORT: 06.19.2014 1

MARKET ANALYSIS REPORT: 06.19.2014 2
MARKET ANALYSIS REPORT: 06.19.2014 3
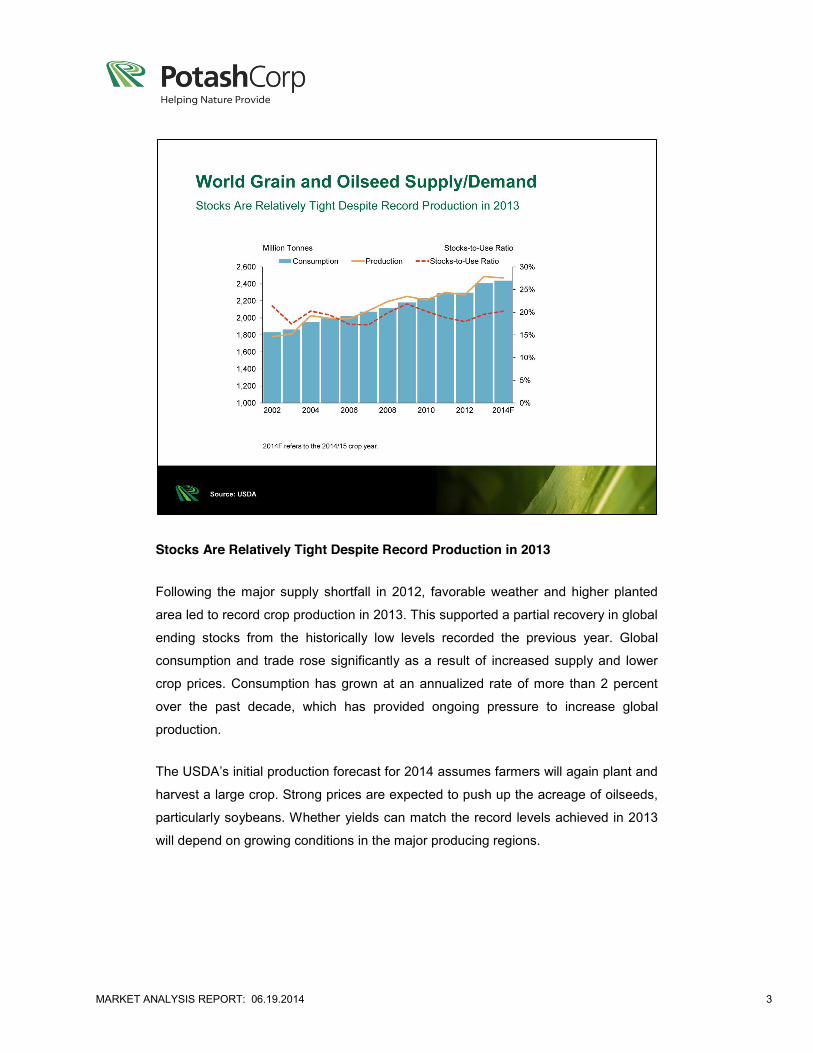
Stocks Are Relatively Tight Despite Record Production in 2013
Following the major supply shortfall in 2012, favorable weather and higher planted
area led to record crop production in 2013. This supported a partial recovery in global
ending stocks from the historically low levels recorded the previous year. Global
consumption and trade rose significantly as a result of increased supply and lower
crop prices. Consumption has grown at an annualized rate of more than 2 percent
over the past decade, which has provided ongoing pressure to increase global
production.
The USDA’s initial production forecast for 2014 assumes farmers will again plant and
harvest a large crop. Strong prices are expected to push up the acreage of oilseeds,
particularly soybeans. Whether yields can match the record levels achieved in 2013
will depend on growing conditions in the major producing regions.
MARKET ANALYSIS REPORT: 06.19.2014 4
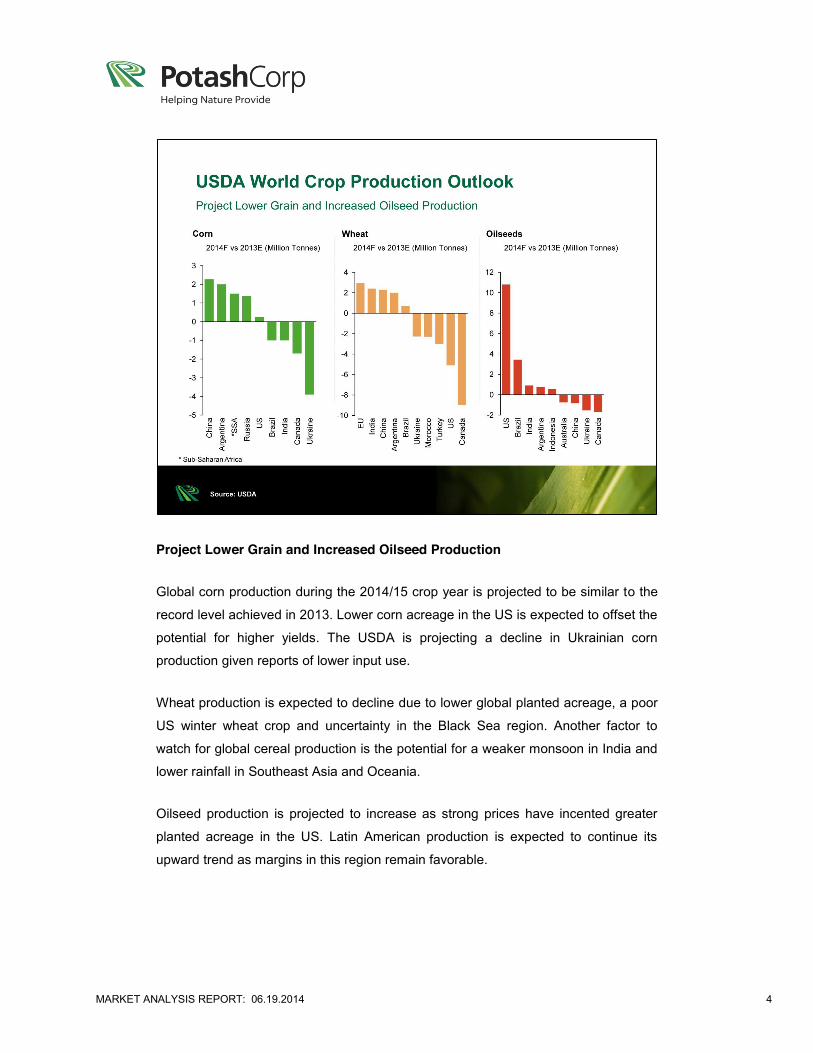
Project Lower Grain and Increased Oilseed Production
Global corn production during the 2014/15 crop year is projected to be similar to the
record level achieved in 2013. Lower corn acreage in the US is expected to offset the
potential for higher yields. The USDA is projecting a decline in Ukrainian corn
production given reports of lower input use.
Wheat production is expected to decline due to lower global planted acreage, a poor
US winter wheat crop and uncertainty in the Black Sea region. Another factor to
watch for global cereal production is the potential for a weaker monsoon in India and
lower rainfall in Southeast Asia and Oceania.
Oilseed production is projected to increase as strong prices have incented greater
planted acreage in the US. Latin American production is expected to continue its
upward trend as margins in this region remain favorable.
MARKET ANALYSIS REPORT: 06.19.2014 5
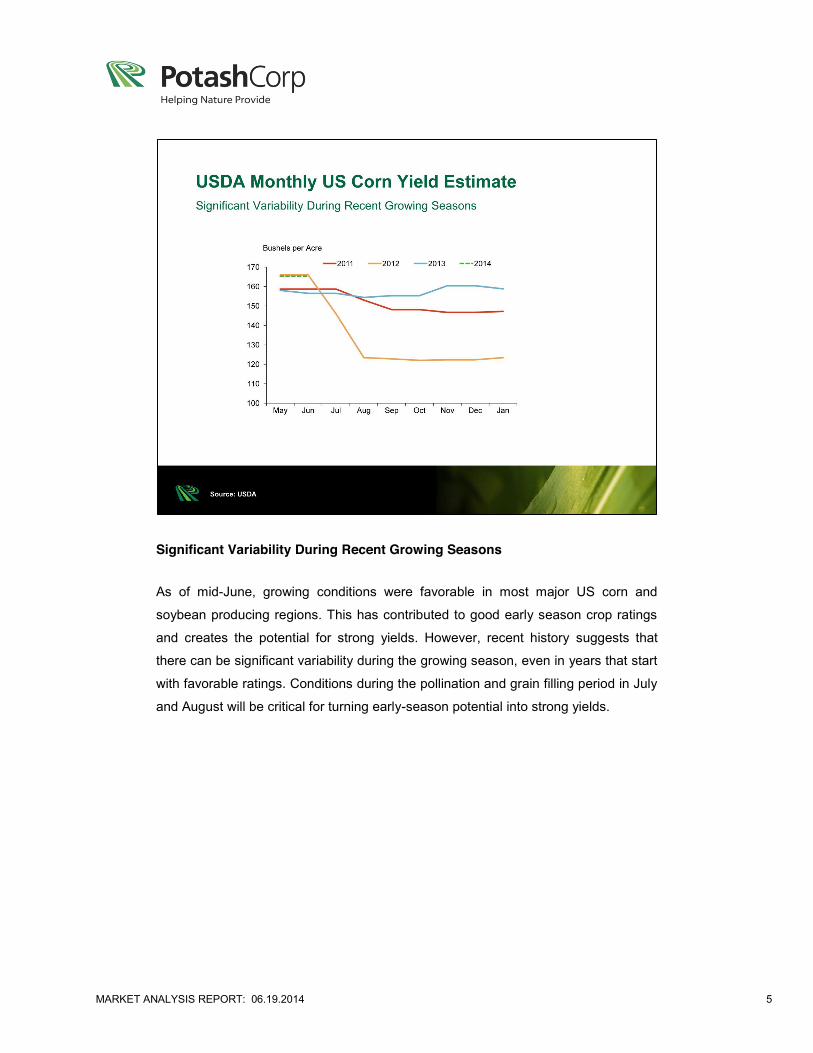
Significant Variability During Recent Growing Seasons
As of mid-June, growing conditions were favorable in most major US corn and
soybean producing regions. This has contributed to good early season crop ratings
and creates the potential for strong yields. However, recent history suggests that
there can be significant variability during the growing season, even in years that start
with favorable ratings. Conditions during the pollination and grain filling period in July
and August will be critical for turning early-season potential into strong yields.
MARKET ANALYSIS REPORT: 06.19.2014 6
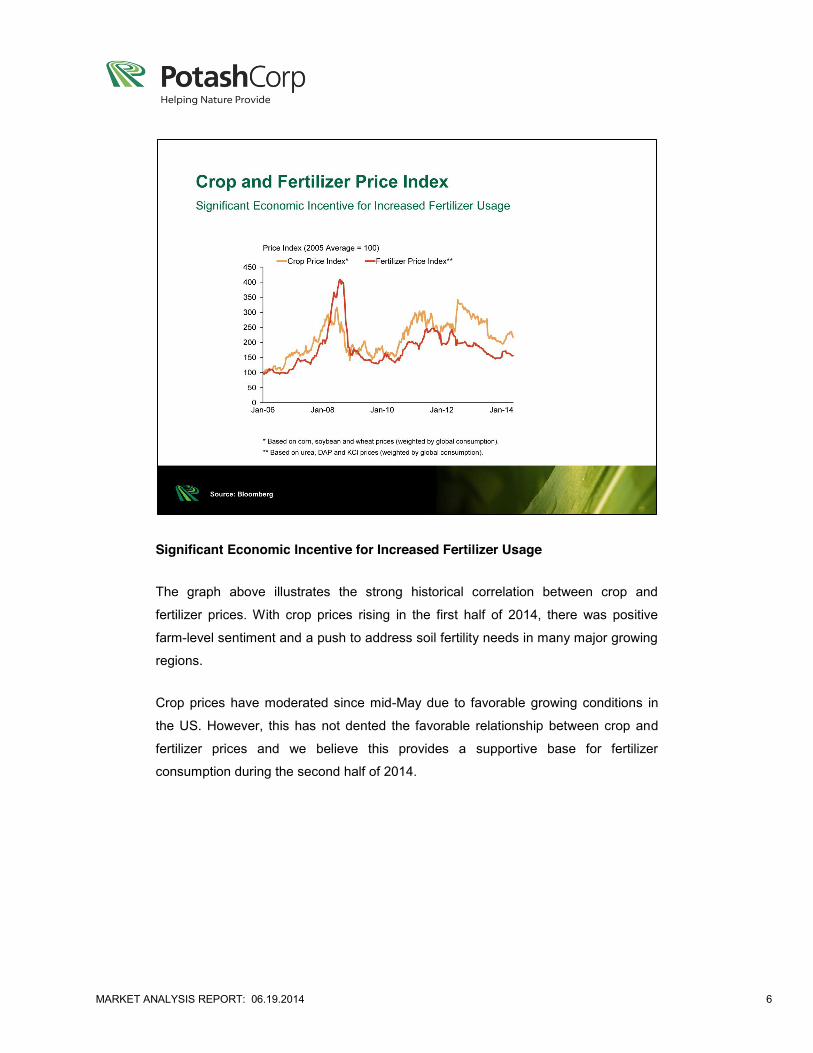
Significant Economic Incentive for Increased Fertilizer Usage
The graph above illustrates the strong historical correlation between crop and
fertilizer prices. With crop prices rising in the first half of 2014, there was positive
farm-level sentiment and a push to address soil fertility needs in many major growing
regions.
Crop prices have moderated since mid-May due to favorable growing conditions in
the US. However, this has not dented the favorable relationship between crop and
fertilizer prices and we believe this provides a supportive base for fertilizer
consumption during the second half of 2014.
MARKET ANALYSIS REPORT: 06.19.2014 7
MARKET ANALYSIS REPORT: 06.19.2014 8
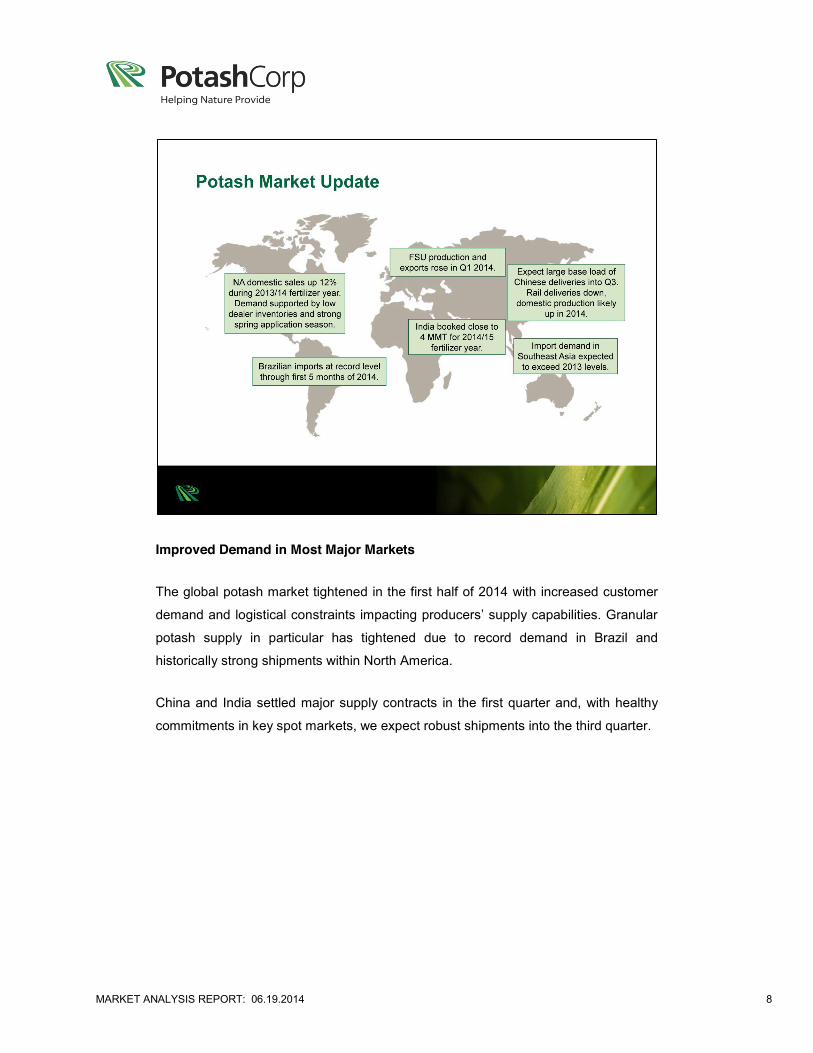
Improved Demand in Most Major Markets
The global potash market tightened in the first half of 2014 with increased customer
demand and logistical constraints impacting producers’ supply capabilities. Granular
potash supply in particular has tightened due to record demand in Brazil and
historically strong shipments within North America.
China and India settled major supply contracts in the first quarter and, with healthy
commitments in key spot markets, we expect robust shipments into the third quarter.

MARKET ANALYSIS REPORT: 06.19.2014 9
Strong Demand for Granular Grade Potash
The majority of potash used as fertilizer in North America and Brazil is granular
grade, which has a larger, more uniform particle size compared to standard grade
product. Production of granular product requires investment in compaction
equipment.
Despite logistical challenges during the winter, shipments to the North American
market were up sharply during the first five months of 2014. This was due to a
depleted wholesale and retail supply channel at the start of the year, followed by a
strong spring application season.
Brazil’s granular potash imports were up 850,000 tonnes through May due to low
beginning inventories and higher domestic demand. Brazilian consumption has
grown at an annual pace of almost 7 percent over the past five years to support
growth in production of the country’s major crops.
MARKET ANALYSIS REPORT: 06.19.2014 10
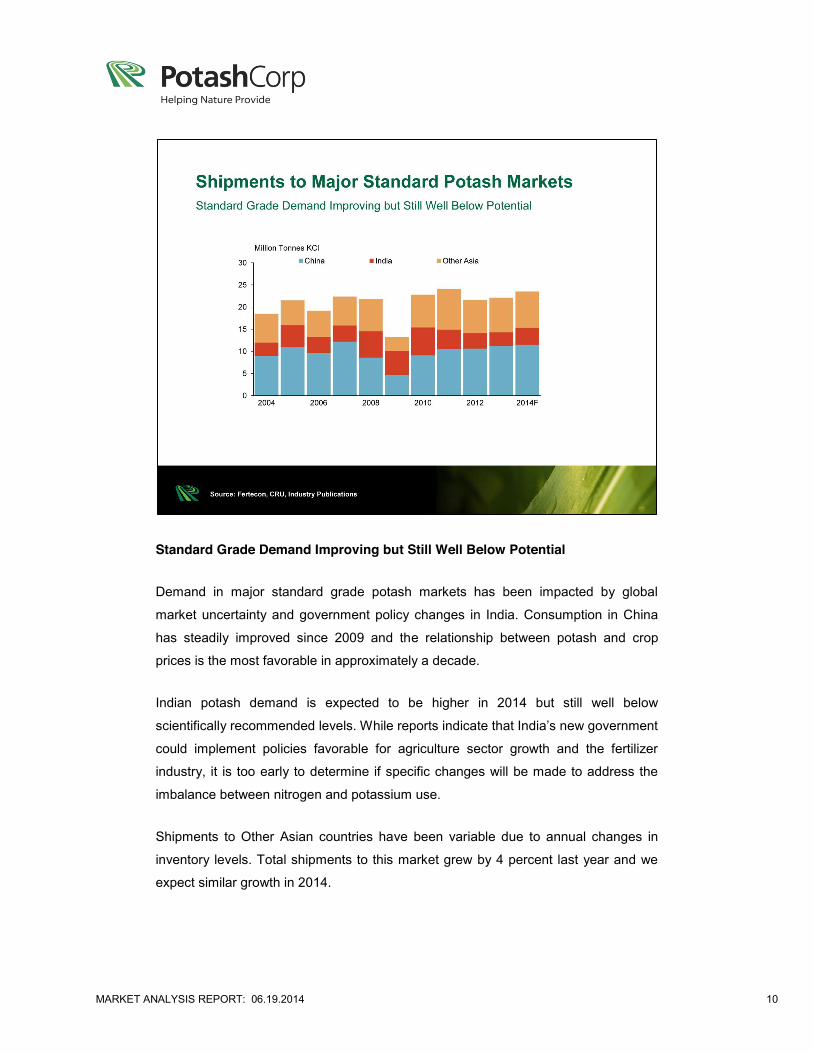
Standard Grade Demand Improving but Still Well Below Potential
Demand in major standard grade potash markets has been impacted by global
market uncertainty and government policy changes in India. Consumption in China
has steadily improved since 2009 and the relationship between potash and crop
prices is the most favorable in approximately a decade.
Indian potash demand is expected to be higher in 2014 but still well below
scientifically recommended levels. While reports indicate that India’s new government
could implement policies favorable for agriculture sector growth and the fertilizer
industry, it is too early to determine if specific changes will be made to address the
imbalance between nitrogen and potassium use.
Shipments to Other Asian countries have been variable due to annual changes in
inventory levels. Total shipments to this market grew by 4 percent last year and we
expect similar growth in 2014.
MARKET ANALYSIS REPORT: 06.19.2014 11
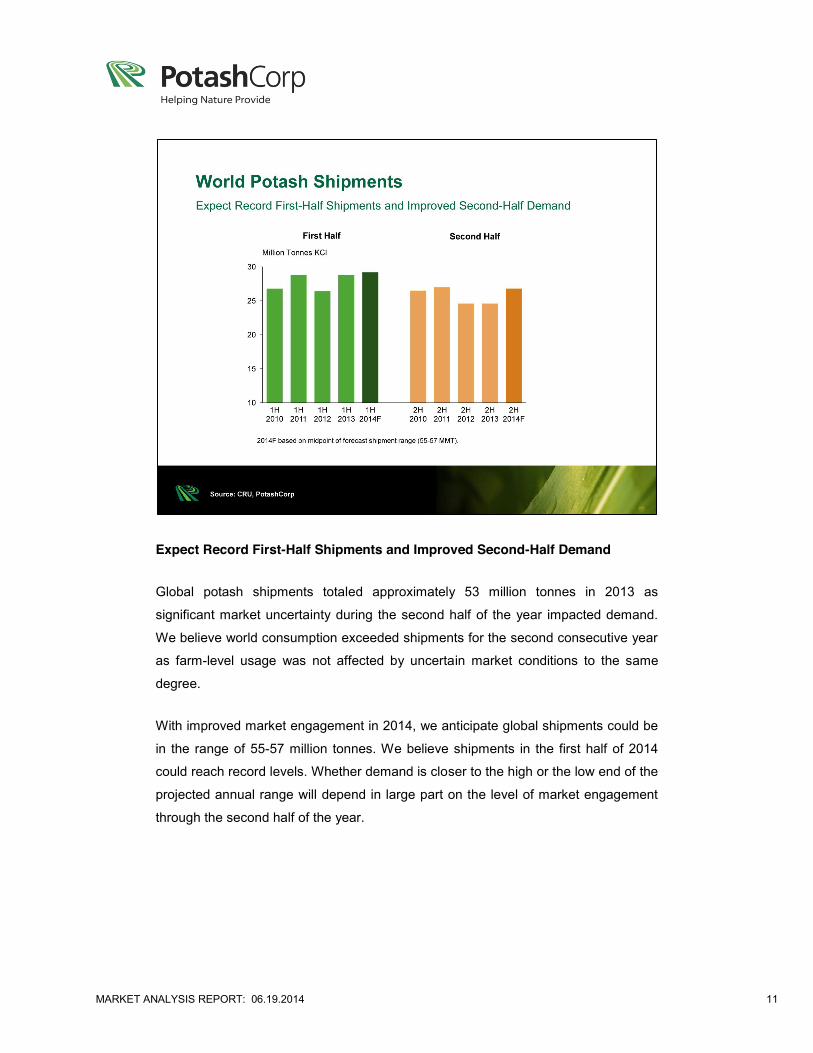
Expect Record First-Half Shipments and Improved Second-Half Demand
Global potash shipments totaled approximately 53 million tonnes in 2013 as
significant market uncertainty during the second half of the year impacted demand.
We believe world consumption exceeded shipments for the second consecutive year
as farm-level usage was not affected by uncertain market conditions to the same
degree.
With improved market engagement in 2014, we anticipate global shipments could be
in the range of 55-57 million tonnes. We believe shipments in the first half of 2014
could reach record levels. Whether demand is closer to the high or the low end of the
projected annual range will depend in large part on the level of market engagement
through the second half of the year.
MARKET ANALYSIS REPORT: 06.19.2014 12
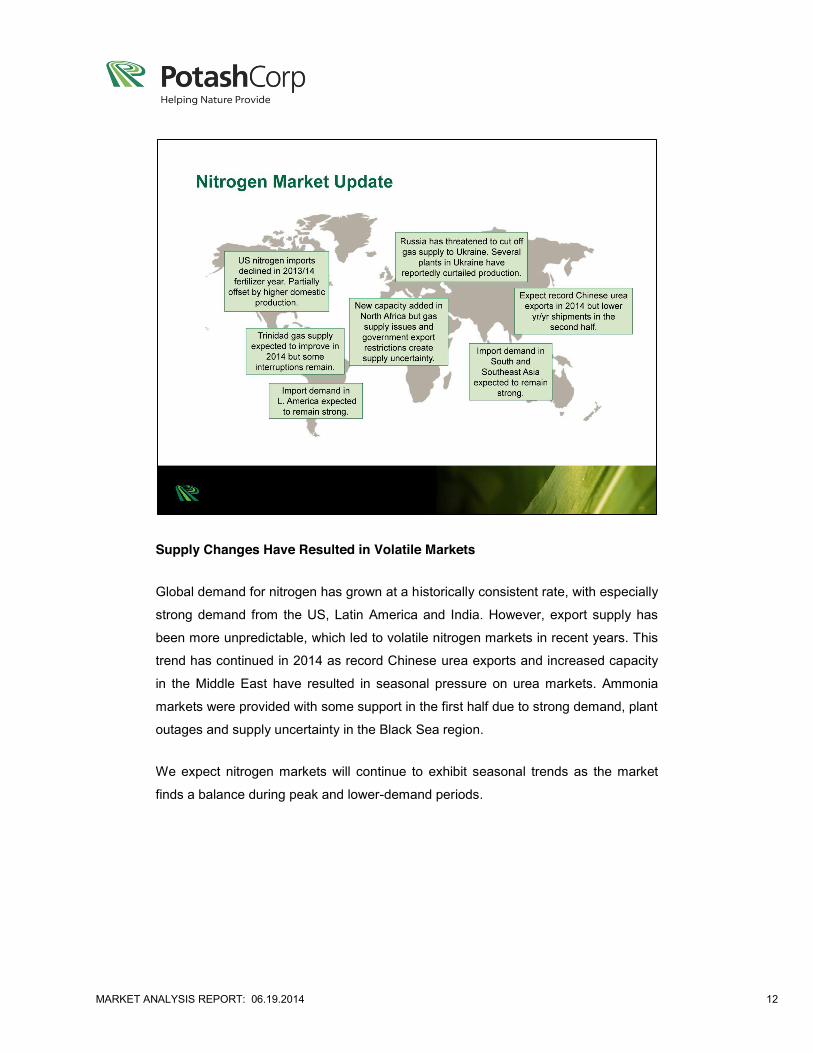
Supply Changes Have Resulted in Volatile Markets
Global demand for nitrogen has grown at a historically consistent rate, with especially
strong demand from the US, Latin America and India. However, export supply has
been more unpredictable, which led to volatile nitrogen markets in recent years. This
trend has continued in 2014 as record Chinese urea exports and increased capacity
in the Middle East have resulted in seasonal pressure on urea markets. Ammonia
markets were provided with some support in the first half due to strong demand, plant
outages and supply uncertainty in the Black Sea region.
We expect nitrogen markets will continue to exhibit seasonal trends as the market
finds a balance during peak and lower-demand periods.
MARKET ANALYSIS REPORT: 06.19.2014 13
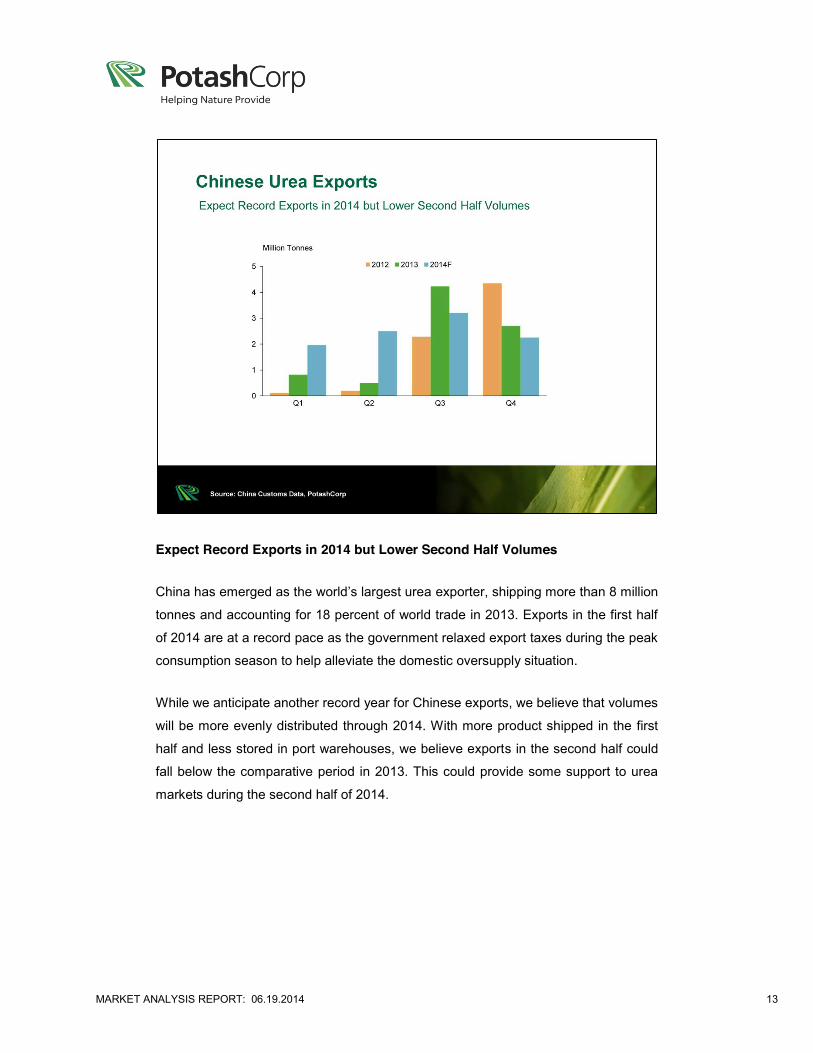
Expect Record Exports in 2014 but Lower Second Half Volumes
China has emerged as the world’s largest urea exporter, shipping more than 8 million
tonnes and accounting for 18 percent of world trade in 2013. Exports in the first half
of 2014 are at a record pace as the government relaxed export taxes during the peak
consumption season to help alleviate the domestic oversupply situation.
While we anticipate another record year for Chinese exports, we believe that volumes
will be more evenly distributed through 2014. With more product shipped in the first
half and less stored in port warehouses, we believe exports in the second half could
fall below the comparative period in 2013. This could provide some support to urea
markets during the second half of 2014.

MARKET ANALYSIS REPORT: 06.19.2014 14
Supply Uncertainty From Major Export Regions
Global ammonia supply in 2013 was characterized by production challenges and
logistical issues. North Africa operated well below capacity as gas availability and
export license delays impacted trade. Some FSU producers curtailed production due
to unfavorable market prices while Trinidad experienced natural gas curtailments.
Many of these constraints have persisted in 2014.
The majority of FSU ammonia exports are delivered through the Ukrainian Black Sea
port of Yuzhnyy. Political unrest in this region creates some uncertainty on
approximately 20 percent of global merchant ammonia supply.
Global ammonia imports are anticipated to grow slightly in 2014 as a result of greater
agricultural consumption and increased demand from the phosphate sector. US
imports are expected to decrease as new ammonia capacity displaces some offshore
volumes.
MARKET ANALYSIS REPORT: 06.19.2014 15
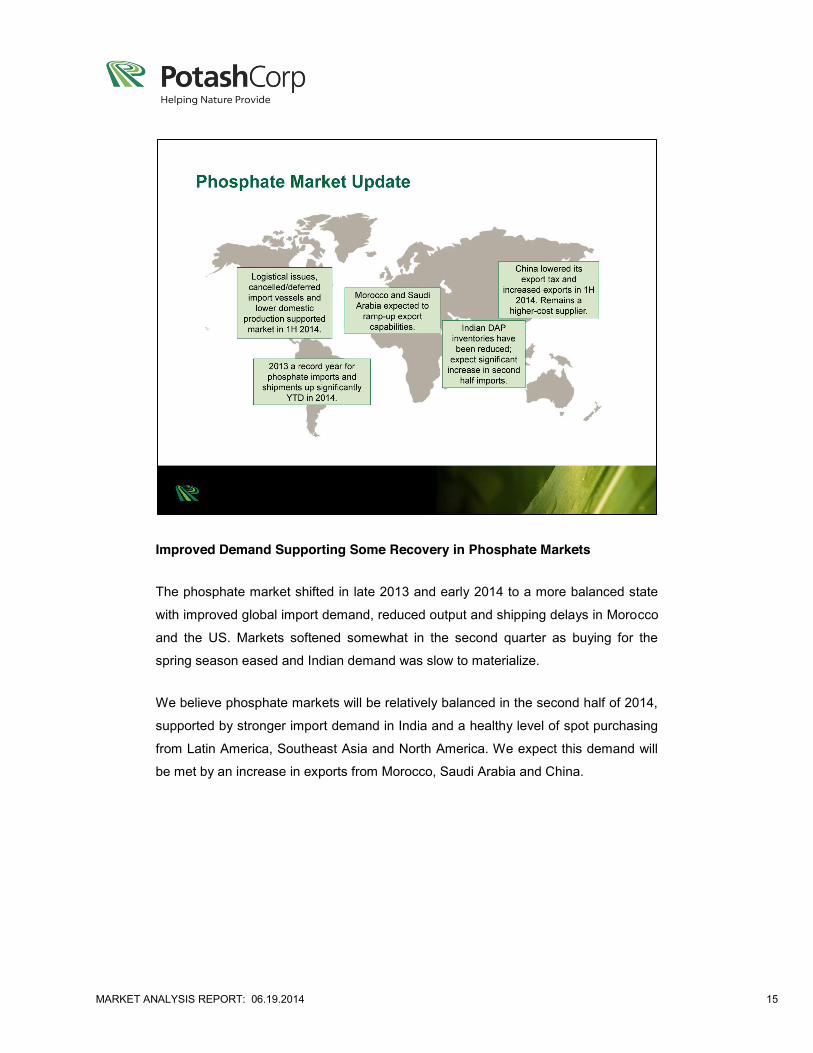
Improved Demand Supporting Some Recovery in Phosphate Markets
The phosphate market shifted in late 2013 and early 2014 to a more balanced state
with improved global import demand, reduced output and shipping delays in Morocco
and the US. Markets softened somewhat in the second quarter as buying for the
spring season eased and Indian demand was slow to materialize.
We believe phosphate markets will be relatively balanced in the second half of 2014,
supported by stronger import demand in India and a healthy level of spot purchasing
from Latin America, Southeast Asia and North America. We expect this demand will
be met by an increase in exports from Morocco, Saudi Arabia and China.
MARKET ANALYSIS REPORT: 06.19.2014 16
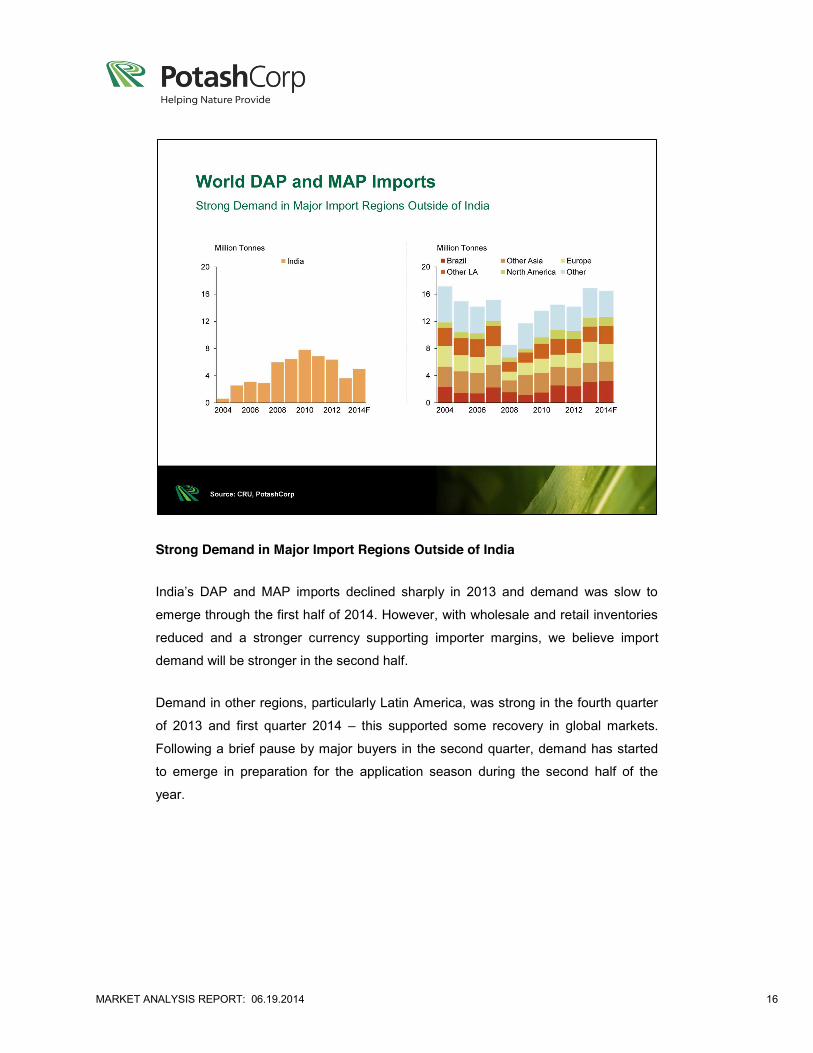
Strong Demand in Major Import Regions Outside of India
India’s DAP and MAP imports declined sharply in 2013 and demand was slow to
emerge through the first half of 2014. However, with wholesale and retail inventories
reduced and a stronger currency supporting importer margins, we believe import
demand will be stronger in the second half.
Demand in other regions, particularly Latin America, was strong in the fourth quarter
of 2013 and first quarter 2014 – this supported some recovery in global markets.
Following a brief pause by major buyers in the second quarter, demand has started
to emerge in preparation for the application season during the second half of the
year.
MARKET ANALYSIS REPORT: 06.19.2014 17
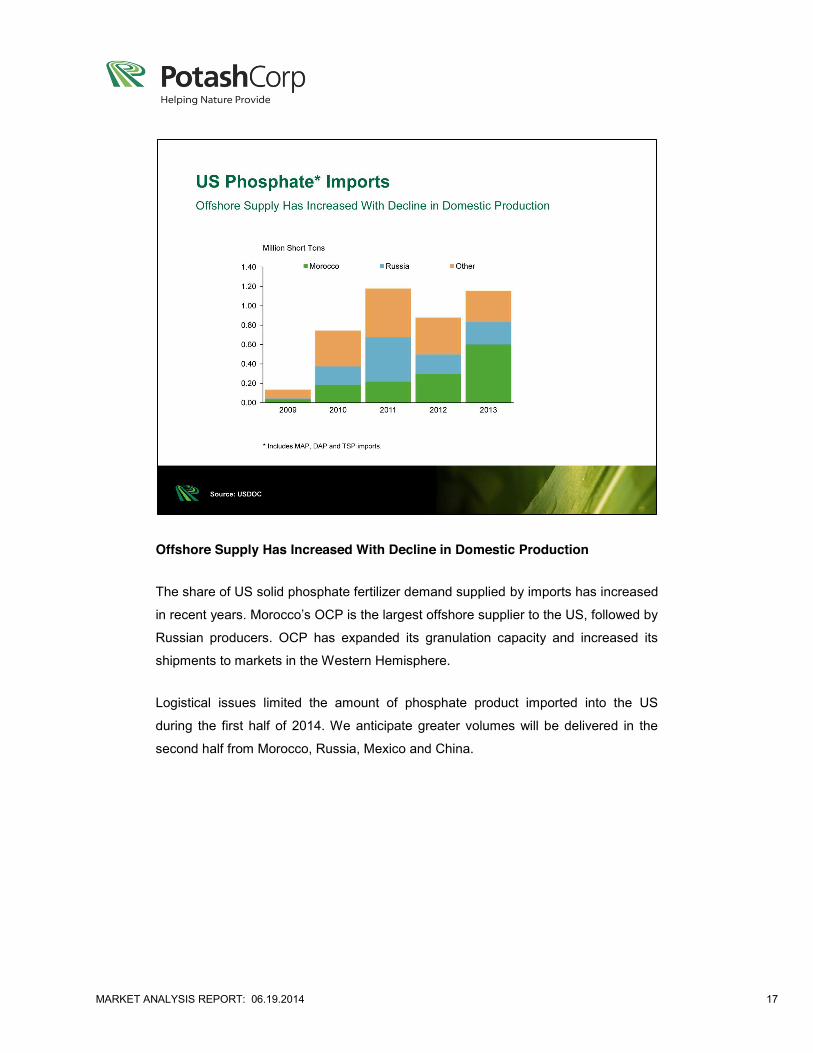
Offshore Supply Has Increased With Decline in Domestic Production
The share of US solid phosphate fertilizer demand supplied by imports has increased
in recent years. Morocco’s OCP is the largest offshore supplier to the US, followed by
Russian producers. OCP has expanded its granulation capacity and increased its
shipments to markets in the Western Hemisphere.
Logistical issues limited the amount of phosphate product imported into the US
during the first half of 2014. We anticipate greater volumes will be delivered in the
second half from Morocco, Russia, Mexico and China.
MARKET ANALYSIS REPORT: 06.19.2014 18
MARKET ANALYSIS REPORT: 06.19.2014 19
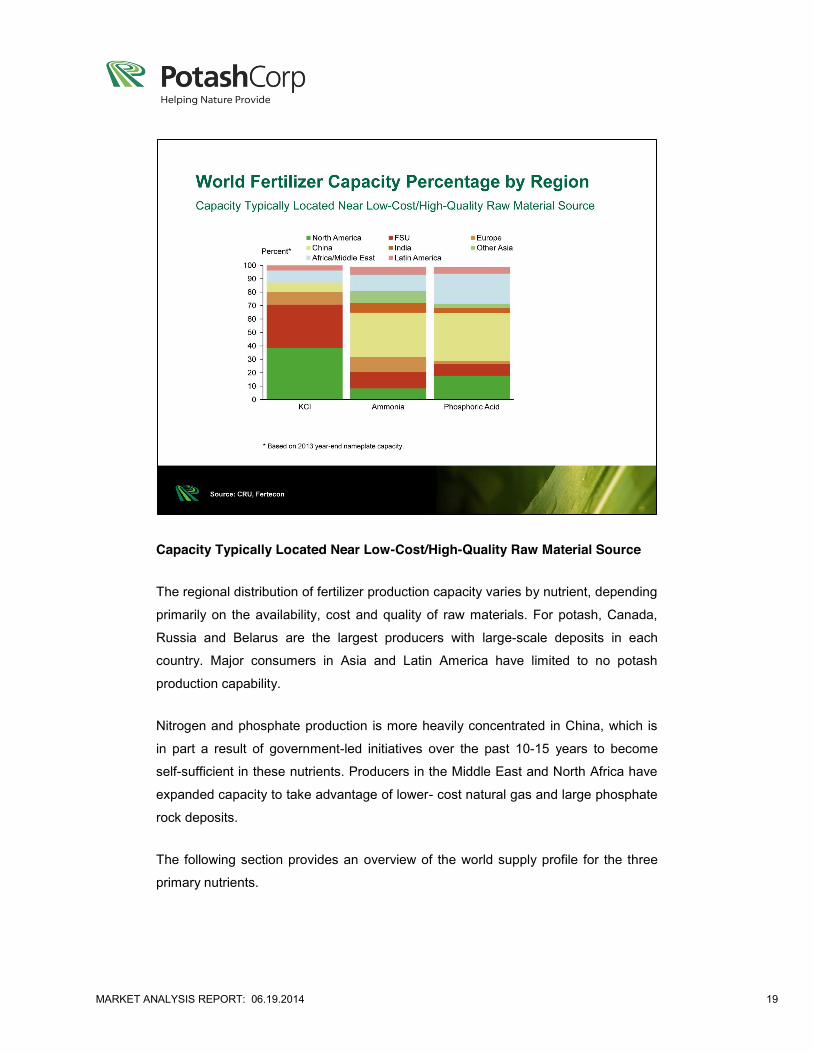
Capacity Typically Located Near Low-Cost/High-Quality Raw Material Source
The regional distribution of fertilizer production capacity varies by nutrient, depending
primarily on the availability, cost and quality of raw materials. For potash, Canada,
Russia and Belarus are the largest producers with large-scale deposits in each
country. Major consumers in Asia and Latin America have limited to no potash
production capability.
Nitrogen and phosphate production is more heavily concentrated in China, which is
in part a result of government-led initiatives over the past 10-15 years to become
self-sufficient in these nutrients. Producers in the Middle East and North Africa have
expanded capacity to take advantage of lower- cost natural gas and large phosphate
rock deposits.
The following section provides an overview of the world supply profile for the three
primary nutrients.
MARKET ANALYSIS REPORT: 06.19.2014 20
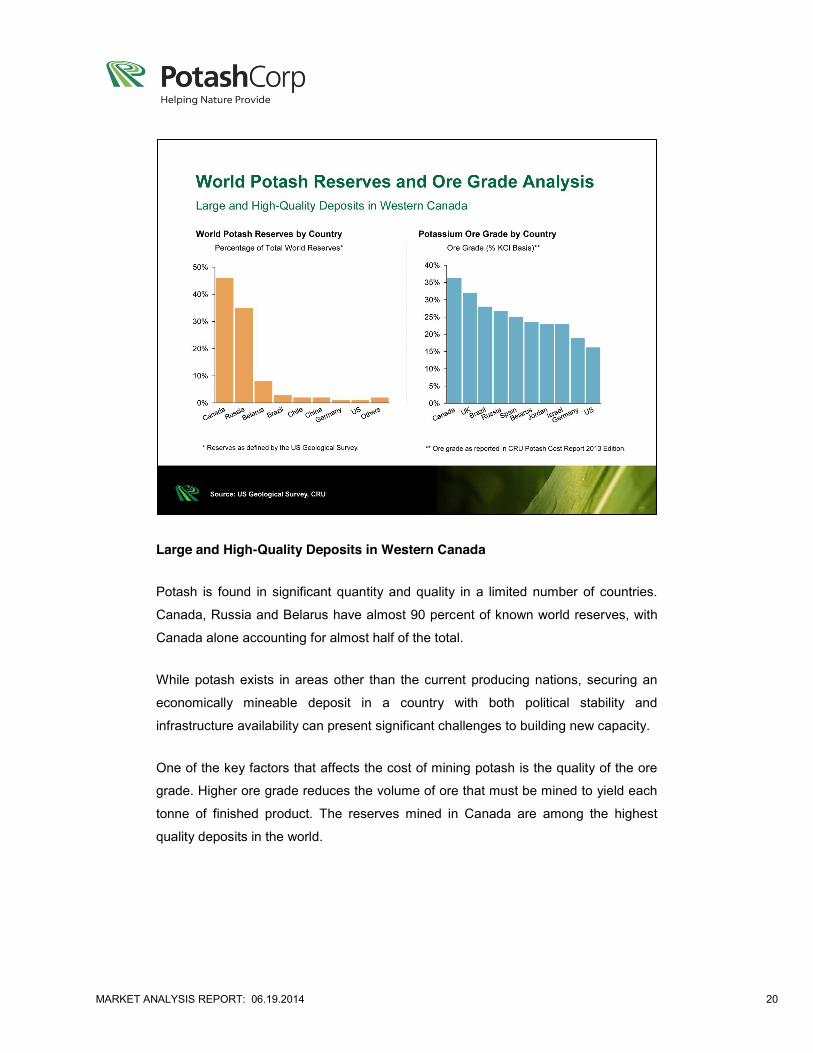
Large and High-Quality Deposits in Western Canada
Potash is found in significant quantity and quality in a limited number of countries.
Canada, Russia and Belarus have almost 90 percent of known world reserves, with
Canada alone accounting for almost half of the total.
While potash exists in areas other than the current producing nations, securing an
economically mineable deposit in a country with both political stability and
infrastructure availability can present significant challenges to building new capacity.
One of the key factors that affects the cost of mining potash is the quality of the ore
grade. Higher ore grade reduces the volume of ore that must be mined to yield each
tonne of finished product. The reserves mined in Canada are among the highest
quality deposits in the world.
MARKET ANALYSIS REPORT: 06.19.2014 21
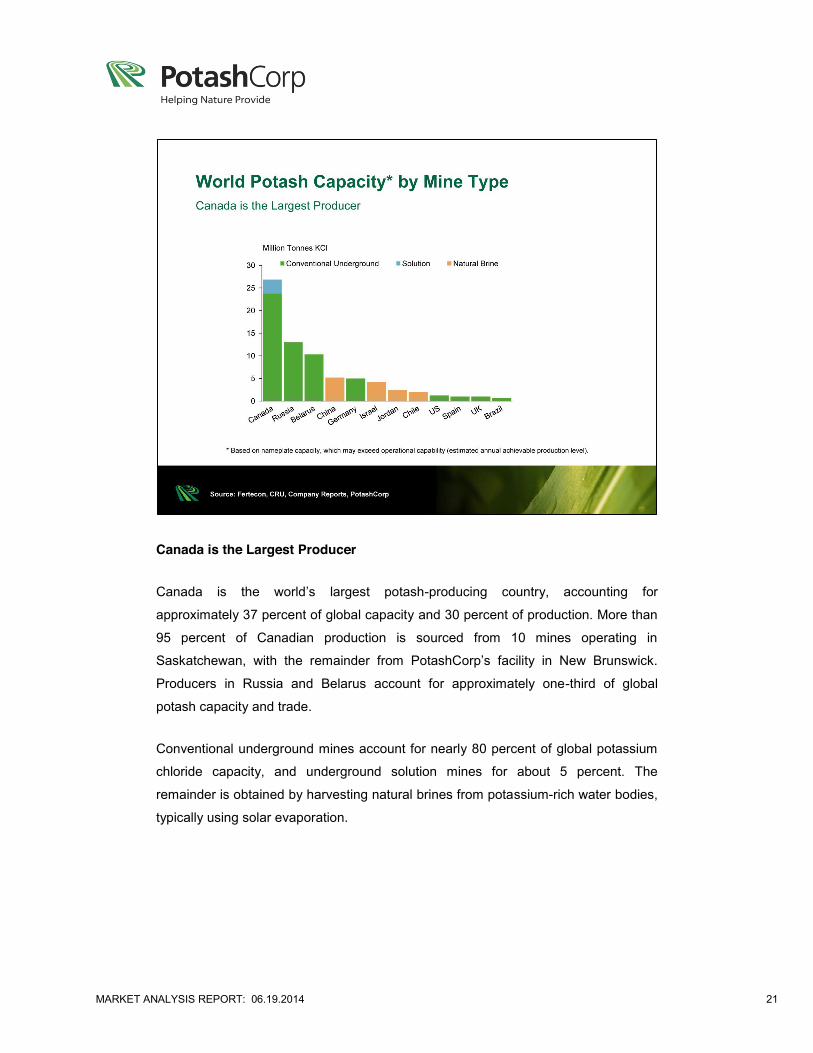
Canada is the Largest Producer
Canada is the world’s largest potash-producing country, accounting for
approximately 37 percent of global capacity and 30 percent of production. More than
95 percent of Canadian production is sourced from 10 mines operating in
Saskatchewan, with the remainder from PotashCorp’s facility in New Brunswick.
Producers in Russia and Belarus account for approximately one-third of global
potash capacity and trade.
Conventional underground mines account for nearly 80 percent of global potassium
chloride capacity, and underground solution mines for about 5 percent. The
remainder is obtained by harvesting natural brines from potassium-rich water bodies,
typically using solar evaporation.
MARKET ANALYSIS REPORT: 06.19.2014 22
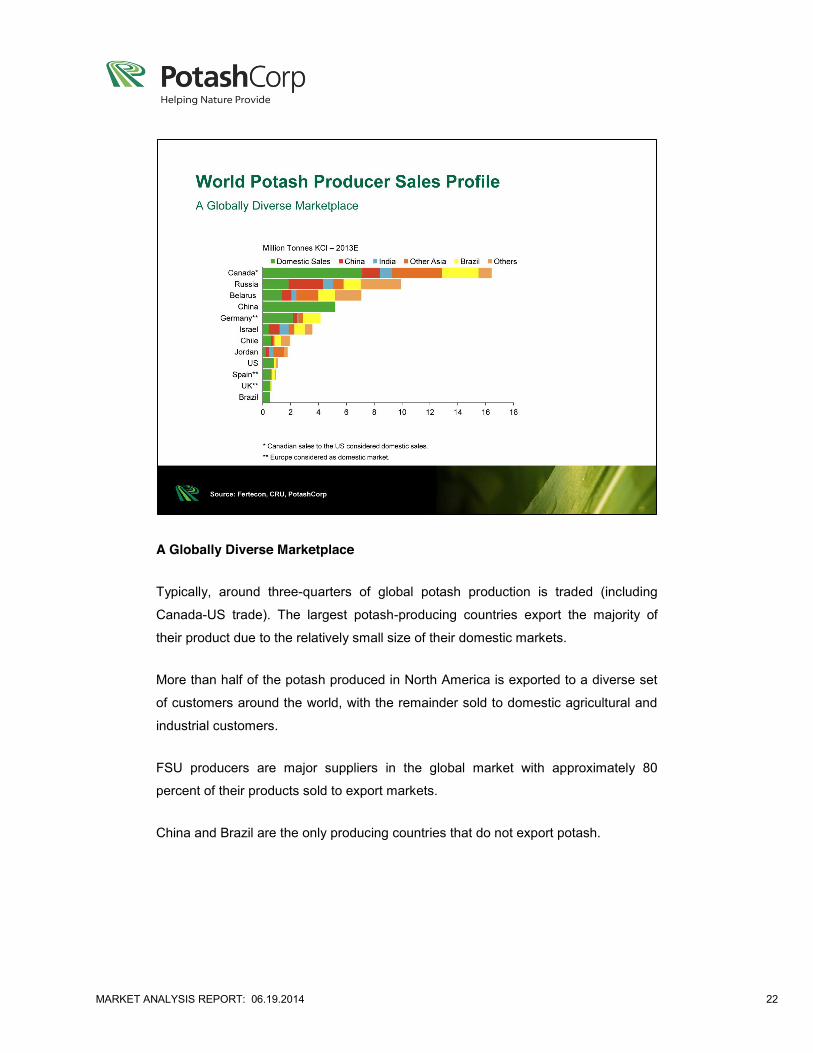
A Globally Diverse Marketplace
Typically, around three-quarters of global potash production is traded (including
Canada-US trade). The largest potash-producing countries export the majority of
their product due to the relatively small size of their domestic markets.
More than half of the potash produced in North America is exported to a diverse set
of customers around the world, with the remainder sold to domestic agricultural and
industrial customers.
FSU producers are major suppliers in the global market with approximately 80
percent of their products sold to export markets.
China and Brazil are the only producing countries that do not export potash.
MARKET ANALYSIS REPORT: 06.19.2014 23
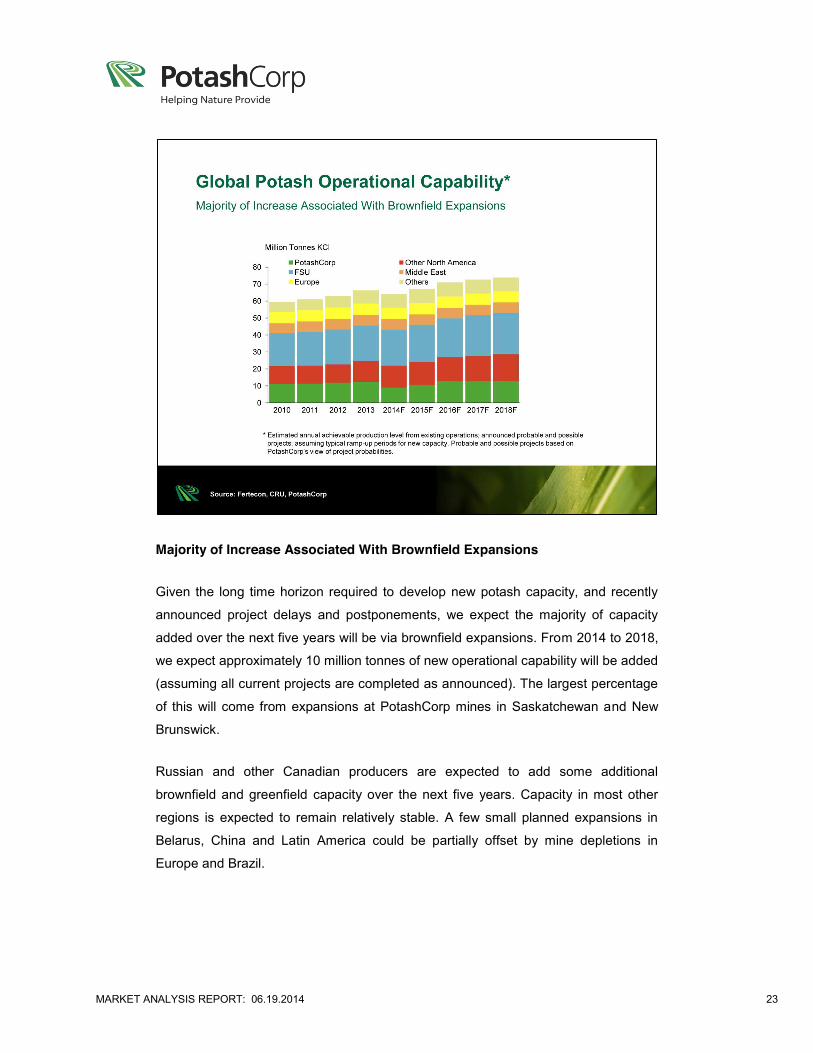
Majority of Increase Associated With Brownfield Expansions
Given the long time horizon required to develop new potash capacity, and recently
announced project delays and postponements, we expect the majority of capacity
added over the next five years will be via brownfield expansions. From 2014 to 2018,
we expect approximately 10 million tonnes of new operational capability will be added
(assuming all current projects are completed as announced). The largest percentage
of this will come from expansions at PotashCorp mines in Saskatchewan and New
Brunswick.
Russian and other Canadian producers are expected to add some additional
brownfield and greenfield capacity over the next five years. Capacity in most other
regions is expected to remain relatively stable. A few small planned expansions in
Belarus, China and Latin America could be partially offset by mine depletions in
Europe and Brazil.
MARKET ANALYSIS REPORT: 06.19.2014 24
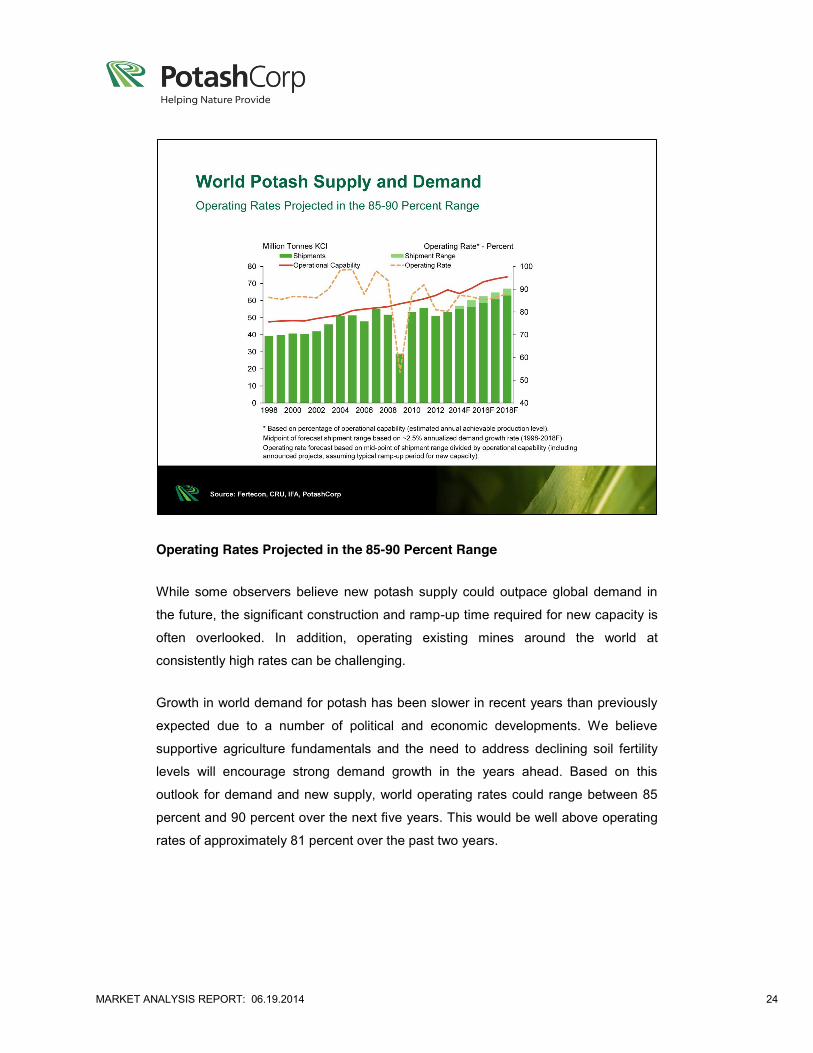
Operating Rates Projected in the 85-90 Percent Range
While some observers believe new potash supply could outpace global demand in
the future, the significant construction and ramp-up time required for new capacity is
often overlooked. In addition, operating existing mines around the world at
consistently high rates can be challenging.
Growth in world demand for potash has been slower in recent years than previously
expected due to a number of political and economic developments. We believe
supportive agriculture fundamentals and the need to address declining soil fertility
levels will encourage strong demand growth in the years ahead. Based on this
outlook for demand and new supply, world operating rates could range between 85
percent and 90 percent over the next five years. This would be well above operating
rates of approximately 81 percent over the past two years.
MARKET ANALYSIS REPORT: 06.19.2014 25
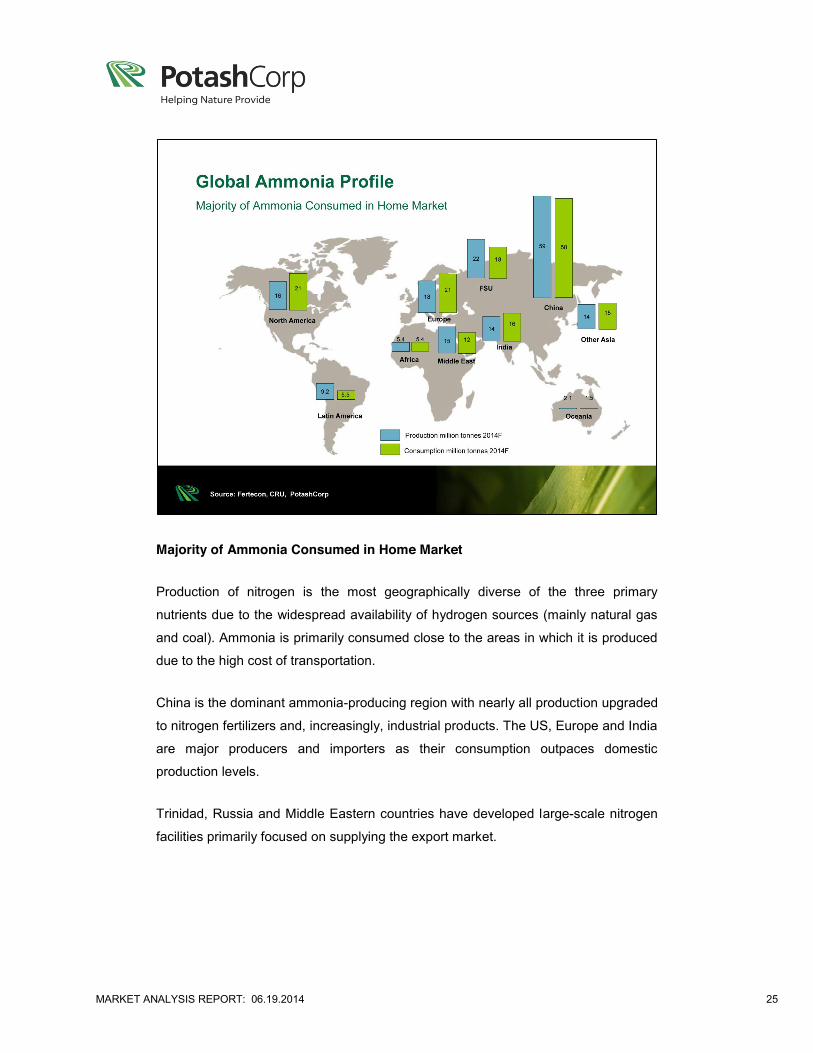
Majority of Ammonia Consumed in Home Market
Production of nitrogen is the most geographically diverse of the three primary
nutrients due to the widespread availability of hydrogen sources (mainly natural gas
and coal). Ammonia is primarily consumed close to the areas in which it is produced
due to the high cost of transportation.
China is the dominant ammonia-producing region with nearly all production upgraded
to nitrogen fertilizers and, increasingly, industrial products. The US, Europe and India
are major producers and importers as their consumption outpaces domestic
production levels.
Trinidad, Russia and Middle Eastern countries have developed large-scale nitrogen
facilities primarily focused on supplying the export market.
MARKET ANALYSIS REPORT: 06.19.2014 26
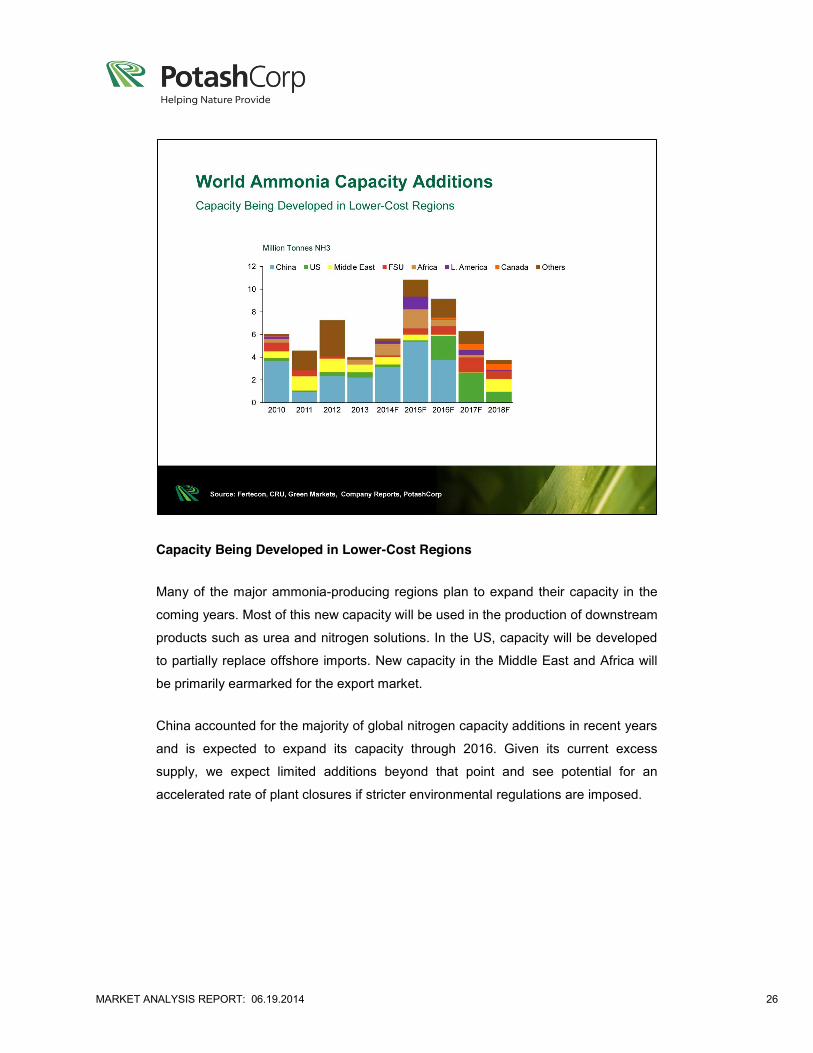
Capacity Being Developed in Lower-Cost Regions
Many of the major ammonia-producing regions plan to expand their capacity in the
coming years. Most of this new capacity will be used in the production of downstream
products such as urea and nitrogen solutions. In the US, capacity will be developed
to partially replace offshore imports. New capacity in the Middle East and Africa will
be primarily earmarked for the export market.
China accounted for the majority of global nitrogen capacity additions in recent years
and is expected to expand its capacity through 2016. Given its current excess
supply, we expect limited additions beyond that point and see potential for an
accelerated rate of plant closures if stricter environmental regulations are imposed.
MARKET ANALYSIS REPORT: 06.19.2014 27
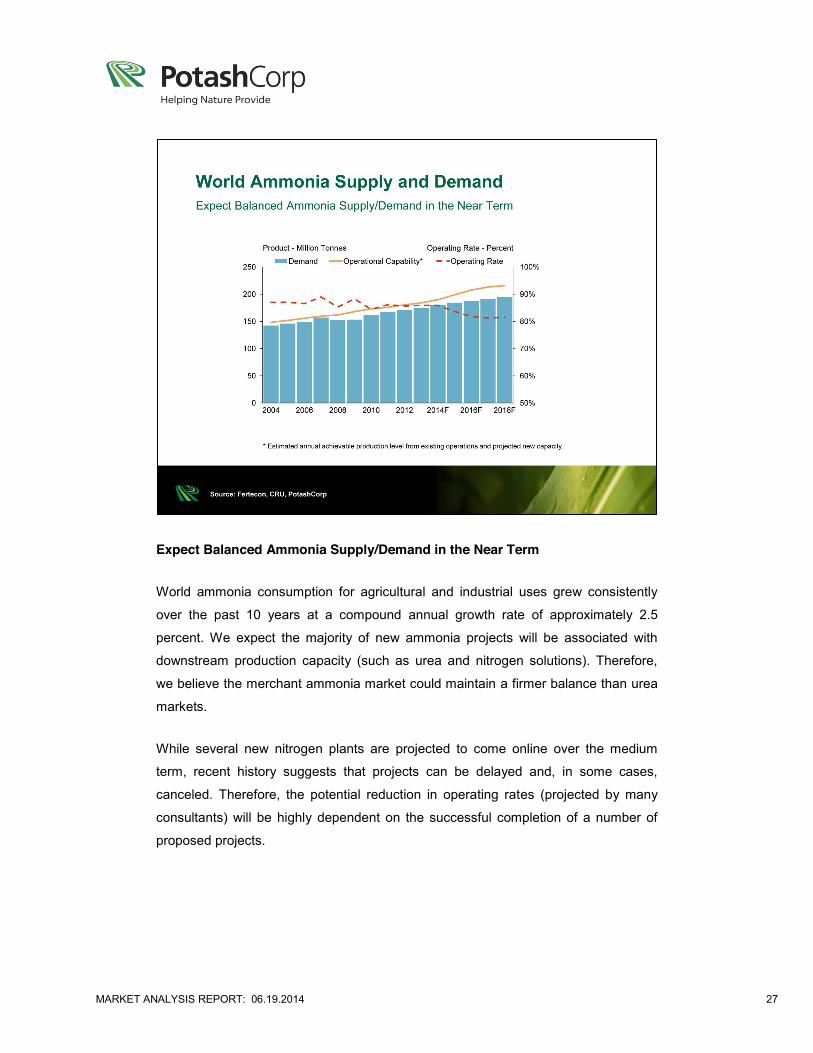
Expect Balanced Ammonia Supply/Demand in the Near Term
World ammonia consumption for agricultural and industrial uses grew consistently
over the past 10 years at a compound annual growth rate of approximately 2.5
percent. We expect the majority of new ammonia projects will be associated with
downstream production capacity (such as urea and nitrogen solutions). Therefore,
we believe the merchant ammonia market could maintain a firmer balance than urea
markets.
While several new nitrogen plants are projected to come online over the medium
term, recent history suggests that projects can be delayed and, in some cases,
canceled. Therefore, the potential reduction in operating rates (projected by many
consultants) will be highly dependent on the successful completion of a number of
proposed projects.
MARKET ANALYSIS REPORT: 06.19.2014 28
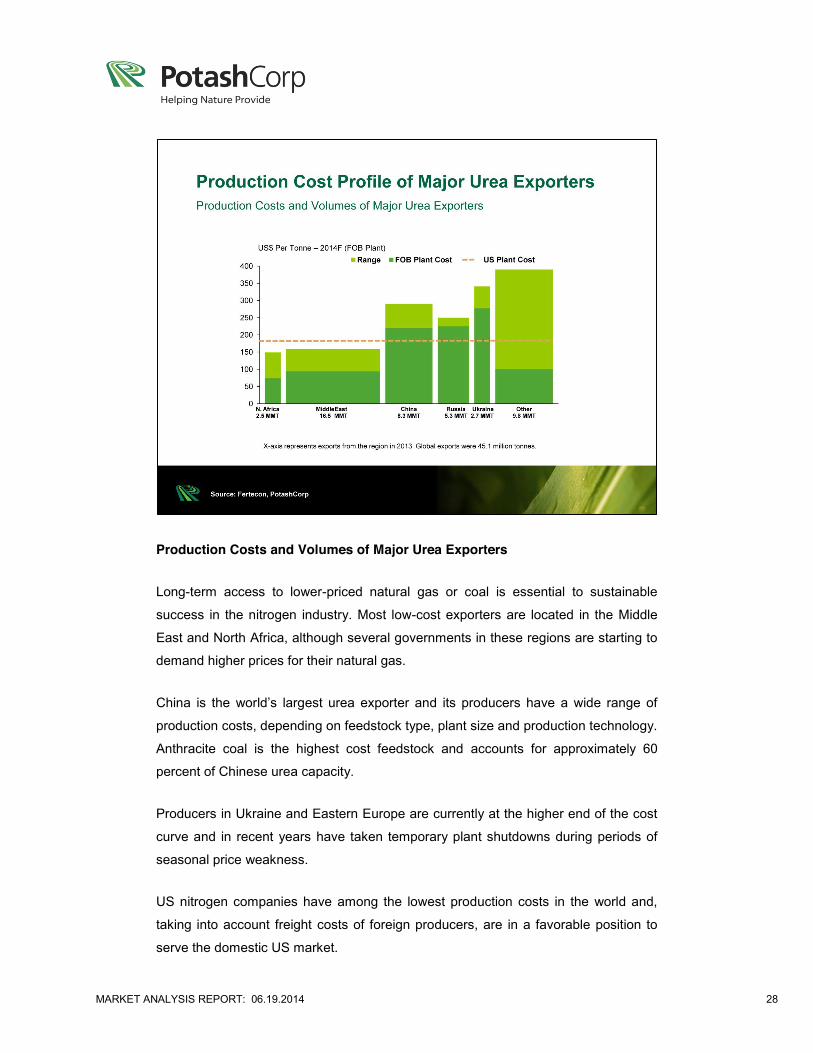
Production Costs and Volumes of Major Urea Exporters
Long-term access to lower-priced natural gas or coal is essential to sustainable
success in the nitrogen industry. Most low-cost exporters are located in the Middle
East and North Africa, although several governments in these regions are starting to
demand higher prices for their natural gas.
China is the world’s largest urea exporter and its producers have a wide range of
production costs, depending on feedstock type, plant size and production technology.
Anthracite coal is the highest cost feedstock and accounts for approximately 60
percent of Chinese urea capacity.
Producers in Ukraine and Eastern Europe are currently at the higher end of the cost
curve and in recent years have taken temporary plant shutdowns during periods of
seasonal price weakness.
US nitrogen companies have among the lowest production costs in the world and,
taking into account freight costs of foreign producers, are in a favorable position to
serve the domestic US market.
MARKET ANALYSIS REPORT: 06.19.2014 29
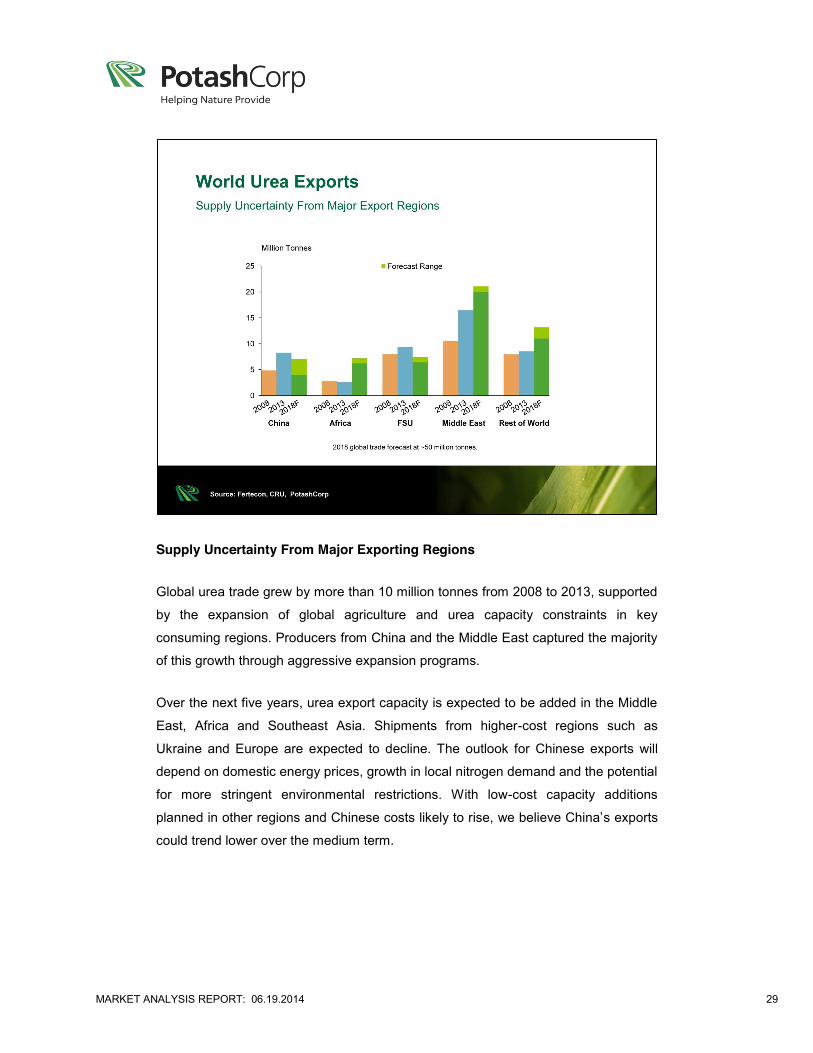
Supply Uncertainty From Major Exporting Regions
Global urea trade grew by more than 10 million tonnes from 2008 to 2013, supported
by the expansion of global agriculture and urea capacity constraints in key
consuming regions. Producers from China and the Middle East captured the majority
of this growth through aggressive expansion programs.
Over the next five years, urea export capacity is expected to be added in the Middle
East, Africa and Southeast Asia. Shipments from higher-cost regions such as
Ukraine and Europe are expected to decline. The outlook for Chinese exports will
depend on domestic energy prices, growth in local nitrogen demand and the potential
for more stringent environmental restrictions. With low-cost capacity additions
planned in other regions and Chinese costs likely to rise, we believe China’s exports
could trend lower over the medium term.
MARKET ANALYSIS REPORT: 06.19.2014 30
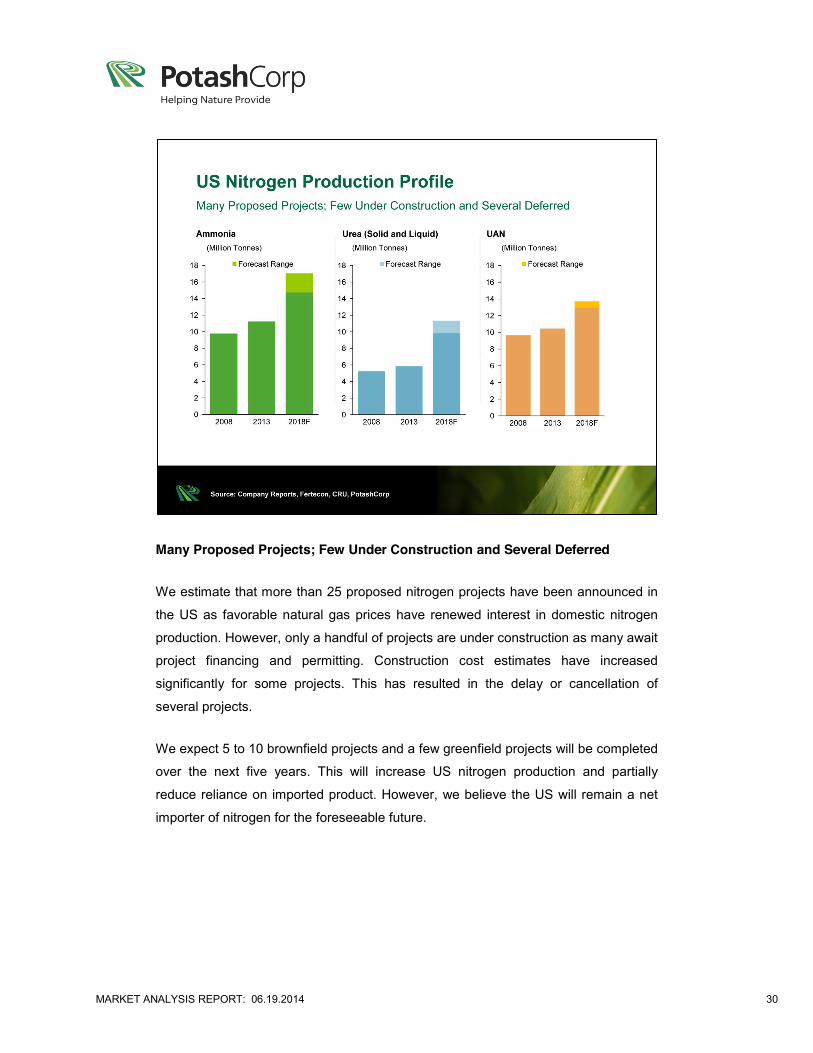
Many Proposed Projects; Few Under Construction and Several Deferred
We estimate that more than 25 proposed nitrogen projects have been announced in
the US as favorable natural gas prices have renewed interest in domestic nitrogen
production. However, only a handful of projects are under construction as many await
project financing and permitting. Construction cost estimates have increased
significantly for some projects. This has resulted in the delay or cancellation of
several projects.
We expect 5 to 10 brownfield projects and a few greenfield projects will be completed
over the next five years. This will increase US nitrogen production and partially
reduce reliance on imported product. However, we believe the US will remain a net
importer of nitrogen for the foreseeable future.
MARKET ANALYSIS REPORT: 06.19.2014 31
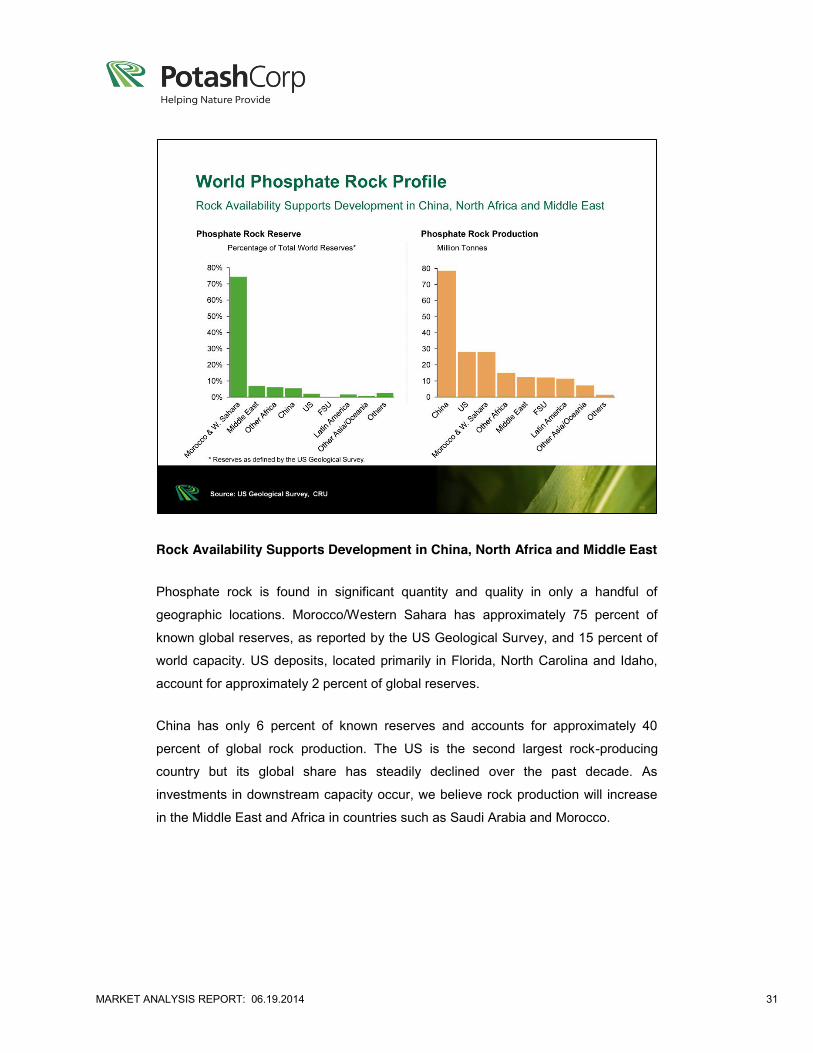
Rock Availability Supports Development in China, North Africa and Middle East
Phosphate rock is found in significant quantity and quality in only a handful of
geographic locations. Morocco/Western Sahara has approximately 75 percent of
known global reserves, as reported by the US Geological Survey, and 15 percent of
world capacity. US deposits, located primarily in Florida, North Carolina and Idaho,
account for approximately 2 percent of global reserves.
China has only 6 percent of known reserves and accounts for approximately 40
percent of global rock production. The US is the second largest rock-producing
country but its global share has steadily declined over the past decade. As
investments in downstream capacity occur, we believe rock production will increase
in the Middle East and Africa in countries such as Saudi Arabia and Morocco.
MARKET ANALYSIS REPORT: 06.19.2014 32
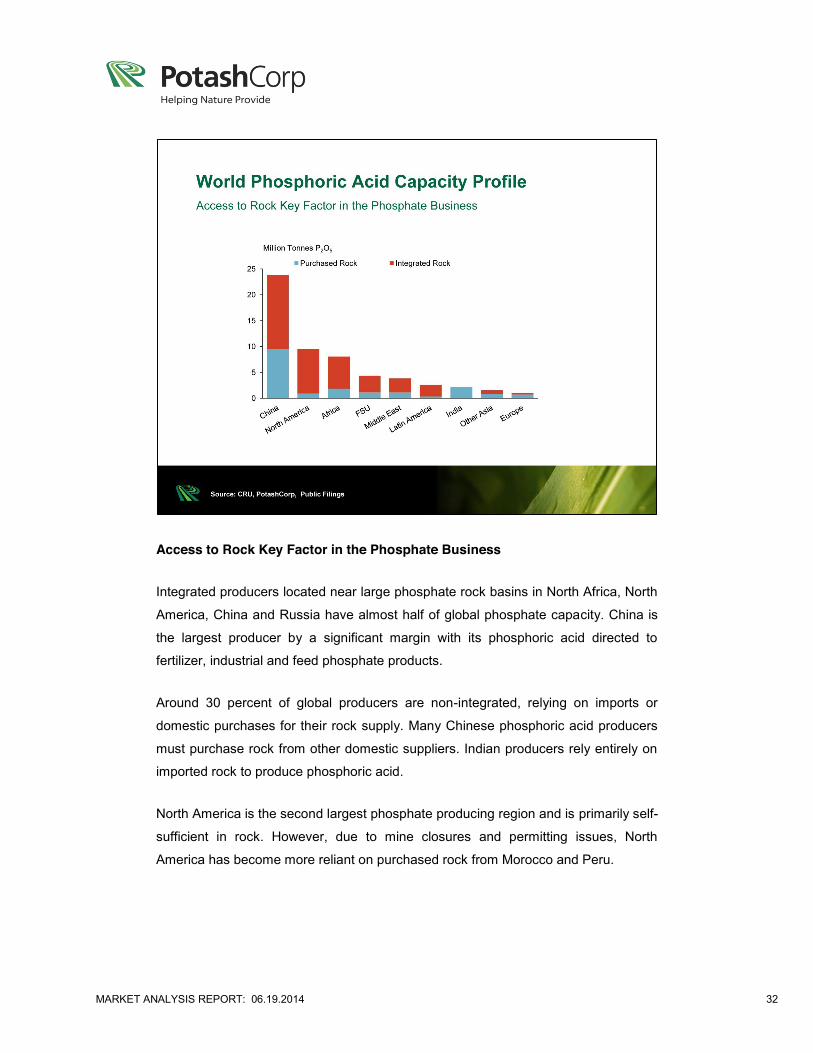
Access to Rock Key Factor in the Phosphate Business
Integrated producers located near large phosphate rock basins in North Africa, North
America, China and Russia have almost half of global phosphate capacity. China is
the largest producer by a significant margin with its phosphoric acid directed to
fertilizer, industrial and feed phosphate products.
Around 30 percent of global producers are non-integrated, relying on imports or
domestic purchases for their rock supply. Many Chinese phosphoric acid producers
must purchase rock from other domestic suppliers. Indian producers rely entirely on
imported rock to produce phosphoric acid.
North America is the second largest phosphate producing region and is primarily self-
sufficient in rock. However, due to mine closures and permitting issues, North
America has become more reliant on purchased rock from Morocco and Peru.
MARKET ANALYSIS REPORT: 06.19.2014 33
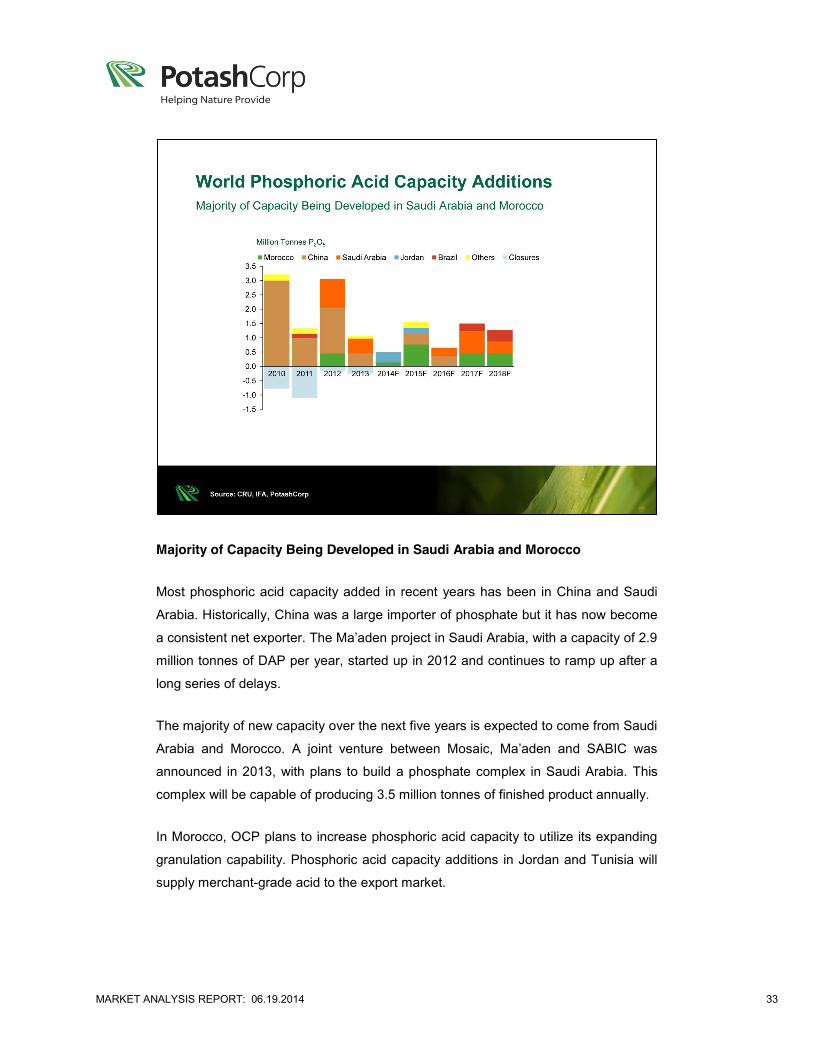
Majority of Capacity Being Developed in Saudi Arabia and Morocco
Most phosphoric acid capacity added in recent years has been in China and Saudi
Arabia. Historically, China was a large importer of phosphate but it has now become
a consistent net exporter. The Ma’aden project in Saudi Arabia, with a capacity of 2.9
million tonnes of DAP per year, started up in 2012 and continues to ramp up after a
long series of delays.
The majority of new capacity over the next five years is expected to come from Saudi
Arabia and Morocco. A joint venture between Mosaic, Ma’aden and SABIC was
announced in 2013, with plans to build a phosphate complex in Saudi Arabia. This
complex will be capable of producing 3.5 million tonnes of finished product annually.
In Morocco, OCP plans to increase phosphoric acid capacity to utilize its expanding
granulation capability. Phosphoric acid capacity additions in Jordan and Tunisia will
supply merchant-grade acid to the export market.
MARKET ANALYSIS REPORT: 06.19.2014 34
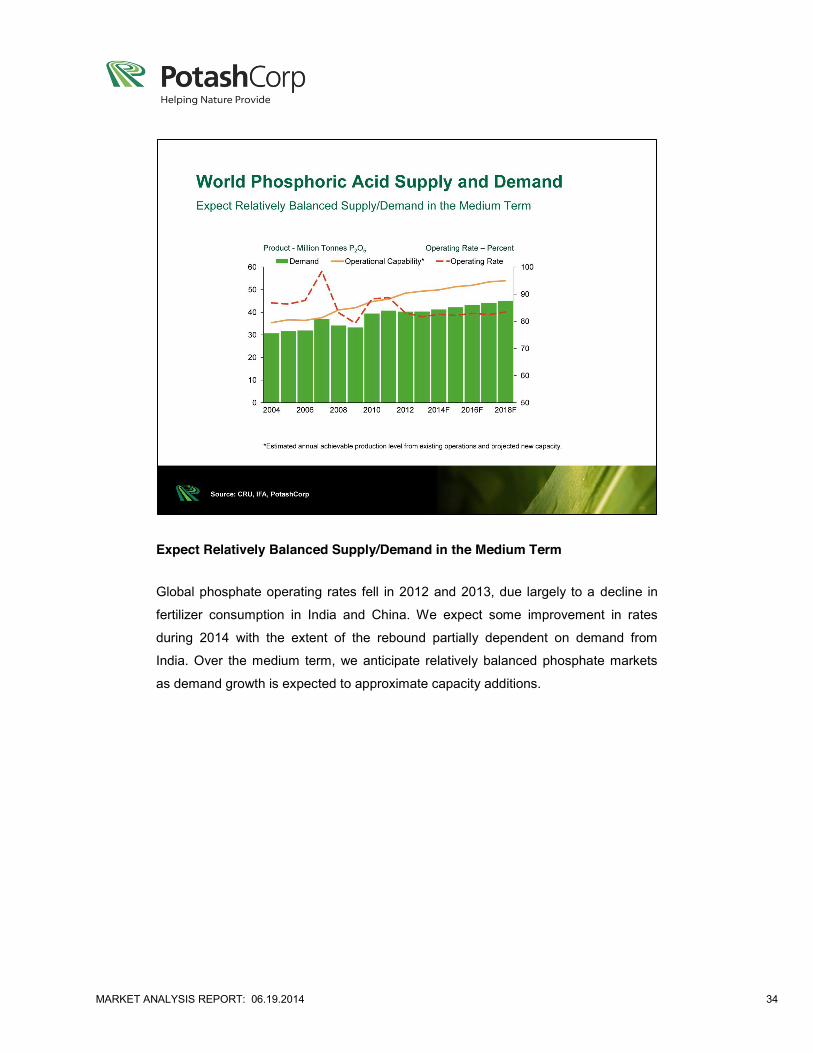
Expect Relatively Balanced Supply/Demand in the Medium Term
Global phosphate operating rates fell in 2012 and 2013, due largely to a decline in
fertilizer consumption in India and China. We expect some improvement in rates
during 2014 with the extent of the rebound partially dependent on demand from
India. Over the medium term, we anticipate relatively balanced phosphate markets
as demand growth is expected to approximate capacity additions.
MARKET ANALYSIS REPORT: 06.19.2014 35
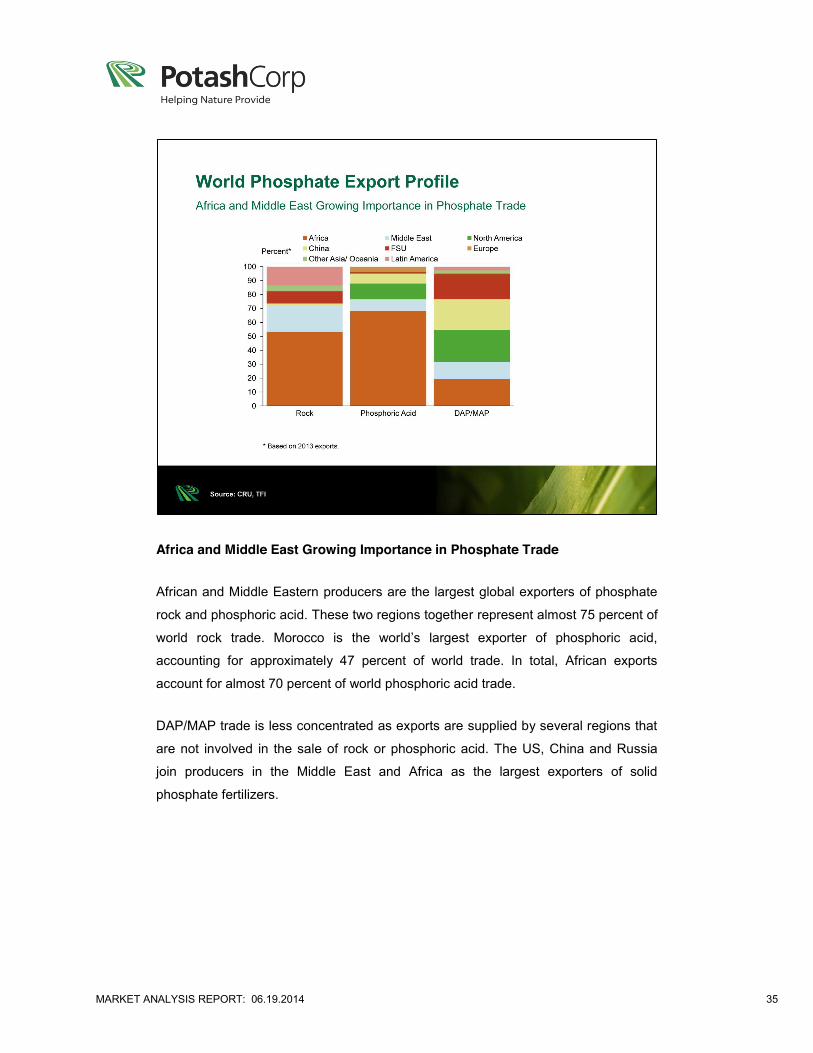
Africa and Middle East Growing Importance in Phosphate Trade
African and Middle Eastern producers are the largest global exporters of phosphate
rock and phosphoric acid. These two regions together represent almost 75 percent of
world rock trade. Morocco is the world’s largest exporter of phosphoric acid,
accounting for approximately 47 percent of world trade. In total, African exports
account for almost 70 percent of world phosphoric acid trade.
DAP/MAP trade is less concentrated as exports are supplied by several regions that
are not involved in the sale of rock or phosphoric acid. The US, China and Russia
join producers in the Middle East and Africa as the largest exporters of solid
phosphate fertilizers.
MARKET ANALYSIS REPORT: 06.19.2014 36
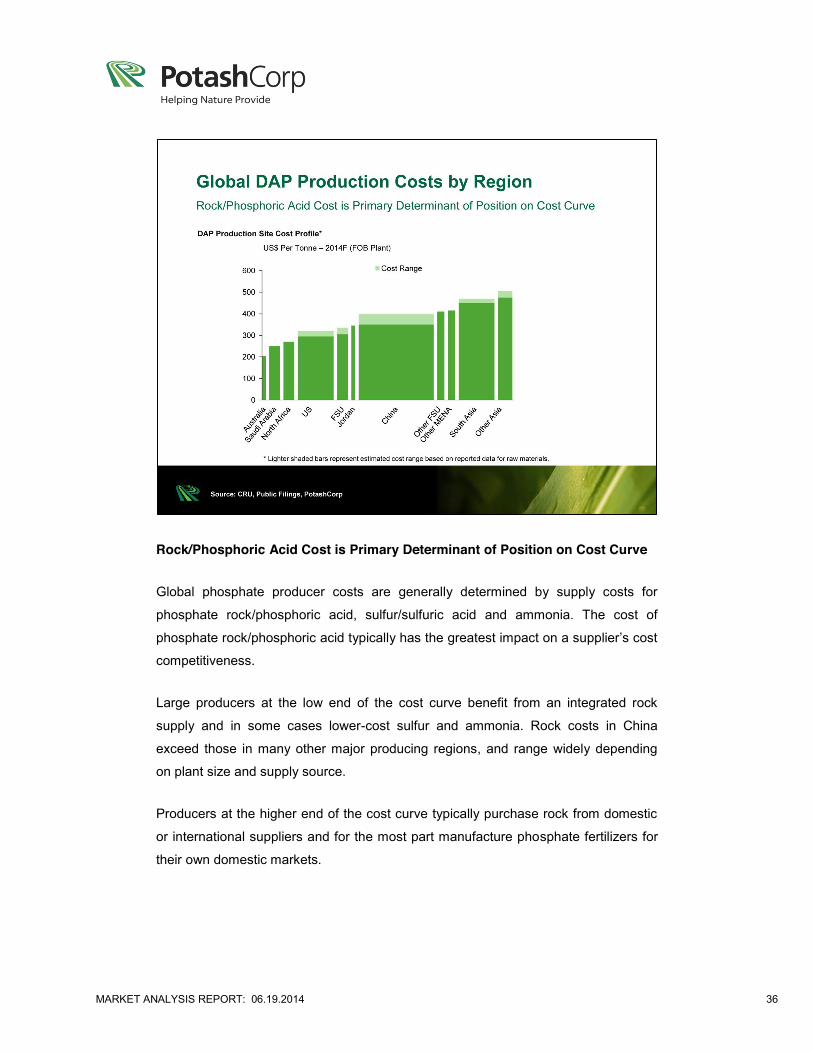
Rock/Phosphoric Acid Cost is Primary Determinant of Position on Cost Curve
Global phosphate producer costs are generally determined by supply costs for
phosphate rock/phosphoric acid, sulfur/sulfuric acid and ammonia. The cost of
phosphate rock/phosphoric acid typically has the greatest impact on a supplier’s cost
competitiveness.
Large producers at the low end of the cost curve benefit from an integrated rock
supply and in some cases lower-cost sulfur and ammonia. Rock costs in China
exceed those in many other major producing regions, and range widely depending
on plant size and supply source.
Producers at the higher end of the cost curve typically purchase rock from domestic
or international suppliers and for the most part manufacture phosphate fertilizers for
their own domestic markets.

MARKET ANALYSIS REPORT: 06.19.2014 37
New Export Capacity Added in North Africa and the Middle East
Capacity additions over the past five years in Morocco, Saudi Arabia and China have
led to increased exports from these regions and lower exports from US producers.
The trend of higher exports from Morocco and Saudi Arabia is expected to continue
over the next five years as new capacity is slated to come on stream. This capacity is
expected to be at the lower end of the cost curve and have logistical advantages into
key markets such as India, Southeast Asia and Latin America.
US phosphate exports are expected to continue their downward trend with a greater
focus on regional exports and enhanced phosphate products. Although China has a
major capacity surplus, low reported domestic producer profitability and the potential
for increased environmental regulation create uncertainty over its level of exports.
MARKET ANALYSIS REPORT: 06.19.2014 38