emerging market multinationals report (emr) 2018
124
EMERGING MARKETS INSTITUTE fi EMERGING MARKET MULTINATIONALS REPORT (EMR) 2018 EMERGING MARKETS RESHAPING GLOBALIZATION Lourdes Casanova, Senior Lecturer, Director Anne Miroux, Visiting Fellow
-
Upload
khangminh22 -
Category
Documents
-
view
0 -
download
0
Transcript of emerging market multinationals report (emr) 2018

EMERGING MARKETS INSTITUTE
fi
EMERGING MARKET MULTINATIONALS REPORT (EMR) 2018 EMERGING MARKETS RESHAPING GLOBALIZATION
Lourdes Casanova, Senior Lecturer, Director Anne Miroux, Visiting Fellow

ii
©Cornell University © Lourdes Casanova © Anne Miroux All rights reserved.
©Cornell University
©Lourdes Casanova
©Anne Miroux 2018.
All rights reserved.
ISBN-13: 978-1-7328042-2-7
No part of this publication may be reproduced or transmitted in any form or by any means, including photocopying and
recording, or by any information storage and retrieval system without prior permission of the copyright owners.

iii
©Cornell University © Lourdes Casanova © Anne Miroux All rights reserved.
Authors Lourdes Casanova is the Senior Lecturer and Director of the Emerging Markets Institute in the S.C. Johnson School of Management, at Cornell University. Formerly at INSEAD, she specializes in international business with a focus on emerging market multinationals. In 2014 and 2015, Esglobal named her one of the 50 most influential Iberoamerican intellectuals, and in 2017 Esglobal named her as one of the 30 most influential Iberoamerican women intellectuals. She has also been a Faculty Fellow at the Atkinson Center for a Sustainable Future and was
a Fulbright Scholar, earning her Master’s degree from the University of Southern California and her PhD from the University of Barcelona. She has been a visiting professor at the Haas School of Business, University of California at Berkeley; Judge Business School, University of Cambridge and Latin American Centre, University of Oxford; University of Zurich and Universidad Autónoma de Barcelona. She was a consultant with the Inter-American Development Bank and she taught and directed executive programs at INSEAD for senior managers including Telefónica, BBVA, Cemex and the Brazilian Confederation of Industries.
Lourdes Casanova’s publications include: Entrepreneurship and the Finance of Innovation in Emerging Markets, Elsevier, 2017, co-authored with P. Cornelius and S. Dutta; the 2017 and 2016 Emerging Market Multinationals Reports, co-authored with A. Miroux; The Political Economy of an Emerging Global Power: In Search of the Brazil Dream, Palgrave Macmillan 2014, co-authored with J. Kassum; and Global Latinas: Latin America’s emerging multinationals, Palgrave Macmillan, 2009. She also co-authored ‘Innovalatino, Fostering Innovation in Latin America’, Ariel 2011, and has contributed articles in journals including Beijing Business Review, International Journal of Human Resource Management, Business and Politics and Foreign Affairs Latinoamérica. She is a member of Latin America Global Agenda Council and the Competitiveness in Latin America taskforce of the World Economic Forum, the B20 Task Force on ICT and Innovation in G20 summit, Los Cabos (2012), and at INSEAD was responsible for the Goldman Sachs 10,000 women initiative. She is a board member of Boyce Thompson Institute, and the start-up Documenta. She is a founding Board Member of the Societé des Amis du Chateau de Fontainebleau and a member of the Advisory Council of the Tompkins Public Library. She is a founding board member of the Emerging Multinationals Research Network and co-founder of the Ithaca Hub of Global Shapers. She is also an op-ed writer at Latin Trade http://latintrade.com/ and a regular contributor to CNN en español http://cnnespanol.cnn.com/.
Anne Miroux is a Faculty Fellow at the Emerging Markets Institute, S.C. Johnson School of Management at Cornell University. She has over 30 years of experience in international trade and finance. She began her career in the United Nations Centre on Transnational Corporations in New York, and later joined the United Nations Conference on Trade and Development (UNCTAD) where she specialized in developing country debt, foreign direct investment and transnational corporations, and technology and innovation policies. For several years she headed the
Investment Analysis Branch in UNCTAD and directed the World Investment Reports (WIR), the United Nations flagship report on FDI and transnational corporations and served as the Editor of the UN Transnational Corporations Journal. She published a number of papers and articles and led research projects and technical assistance activities in developing countries on debt, FDI and development.
Until late 2015, Anne Miroux was the Director of the Division on Technology and Logistics in UNCTAD, and Head of the Secretariat of the UN Commission on Science and Technology for Development (CSTD). She is a member of the Advisory Board of the Technology and Management Center of the Department of International Development at Oxford University. She is also a member of the Board of NetExplo.
Anne Miroux has an MBA from HEC, Ecole des Hautes Etudes Commerciales, and a diploma from IEP (Institut d'Etudes Politiques – Paris). She holds a Ph.D. in Economics from University of Paris I - Sorbonne.

iv
©Cornell University © Lourdes Casanova © Anne Miroux All rights reserved.
Preface
Two years ago, Drs. Lourdes Casanova and Anne Miroux, co-authors of the 2016 edition of the Emerging Market Multinational Report, asked me to write a preface. I offered up my own guiding principles about what distinguishes emerging markets (EMs) from others, which is that they are “underfunded growth opportunities with problems.” They have kindly asked me to write a preface again for this year’s 2018 edition of the report and, based on the current global environment, I have to double-down on the last two words – “with problems.” Indeed, the heightened market and economic turbulence stemming from currency woes starkly highlight some of the biggest problems they can face. The Federal Reserve has raised its key interest rates several times and market pundits see no end to their policy of normalization. Meanwhile, investors around the world are rethinking the proposition of taking active bets by investing in EMs to grab yields. It is what many call a “double whammy” of higher interest rates and a stronger dollar making the burden of debt for EMs (and the risk of default) that much more real.
The good news is that EM Multinationals are not sitting back during this wave of market turbulence. What we learn from Drs. Casanova and Miroux in this year’s report is that these multinational firms are continuing their ascension on the world stage as active global acquirers, as pursuers of further brand and product market differentiation, as those raising the bar on corporate governance practices, and especially how these firms are dealing uniquely with the challenges of digital transformation. The report does not shy away from recognizing what Drs. Casanova and Miroux call the “drastic changes that have taken place in the global economy since early 2018.” But there is a tone of optimism about what these important EM multinationals face in the midst of the uncertainty.
Whether you agree with this optimistic tone or not, I assure you the report will make you think in new ways about how heightened market turbulence in EMs matters for the world at large.
Andrew Karolyi Deputy Dean and College Dean for Academic Affairs Professor of Finance and Harold Bierman Jr. Distinguished Professor of Management Cornell S.C. Johnson College of Business Professor of Economics, Department of Economics Cornell University Ithaca, NY 14853 U.S.A.

v
©Cornell University © Lourdes Casanova © Anne Miroux All rights reserved.
Acknowledgements
The Emerging Market Multinationals Report (EMR) 2018 was authored by Lourdes Casanova, Senior Lecturer, EMI Director, and Anne Miroux, EMI Visiting Fellow, at the Emerging Markets Institute (EMI), Cornell S.C. Johnson College of Business, Cornell University.
The authors are grateful to Abdellah Bouhamidi for his contributions as the leading Research Assistant to the report, and to Fayrouz Hares, Juan Pablo Casadiego Guevara, Samantha Sadday Noguera Beltran and Angelica Soraya Quiroga Camacho for their input and research assistance as well as Eric Bohrer ILR ‘21. Special thanks go to Nicolas Clavijo Carvajal and Thomas Menzalda Martinez who provided significant research input in particular to Chapters 3, 4 and 5 in the report. The help of Gaurav Trivedi, María Luisa Garduño. The authors would also like to thank Jennifer Wholey and Eudes Lopes for editing the draft and Babatunde Ayanfodun for his administrative and organizational support to EMI.
The report benefited from comments and discussions with Andrew Karolyi, Deputy Dean and Dean of Academic Affairs. Cornell S.C. Johnson College of Business and Harold Bierman, Jr. Distinguished Professor of Management; Ravi Ramamurti, Distinguished Professor of International Business and Director of the Center for Emerging Markets, Northeastern University; and Subramanian Rangan, Professor of Strategy and Management, INSEAD.
As last year, members of the Emerging Market Research Network participated in the preparation of the Report: Veneta Andonova, Associate Professor of Business, Juana Catalina García Duque, Associate Professor, and Andrés F. Mejía, all from the School of Management, Universidad de los Andes, Colombia, contributed the chapter on corporate governance in Colombia; Fernanda Cahen, Assistant Professor of Management, and Moacir Miranda de Oliveira Júnior, Professor, Head of the Department of Administration, FEA, Universidad de São Paulo, contributed the chapter on strategies and internationalization of digital firms from Latin America. Prof. Shi Yongchuan and Wang Hongxin, both from Wenzhou University, and Barron Zuo authored the research paper on the development process of entrepreneurship education in Chinese universities. Special thanks are also addressed to Anabella Davila, Professor of Organization Theory and Human Resources Management, EGADE, Tecnológico de Monterrey, Mexico and to Diego Finchelstein, Professor, School of Administration and Business, Universidad de San Andrés, Argentina, for their active participation in the Emerging Market Research Network.
Finally, our special thanks go to the OECD Development Center, a close partner of EMI for several years now, which has contributed to the present report through its Emerging Market Network, with a chapter on the impact of digitalization in emerging markets.

vi
©Cornell University © Lourdes Casanova © Anne Miroux All rights reserved.
Table of Contents Preface ...................................................................................................................................................................... iv
Acknowledgements ..................................................................................................................................................... v
Table of Contents ....................................................................................................................................................... vi
Abbreviations and Acronyms ....................................................................................................................................... ix
Executive Summary .................................................................................................................................................... xi
Chapter 1 The coming of age of emerging market multinationals .................................................................................... 1
Introduction ........................................................................................................................................................................... 2
1.1. Representation of major economies in the Fortune Global 500 ............................................................................. 2
1.2. Greenfield FDI projects and international presence ............................................................................................... 7
1.3. Comparing U.S. and China in revenues, profits, employees and assets .................................................................. 8
1.4. Market capitalization, capital structure and valuation ........................................................................................... 8
1.5. Capital structure analysis ...................................................................................................................................... 11
1.6. Conclusion ............................................................................................................................................................. 12
Chapter 2 Chinese M&As: Facing policy headwinds ...................................................................................................... 15
Introduction ......................................................................................................................................................................... 16
2.1. M&A trends for E20 firms ..................................................................................................................................... 16
2.2. Chinese M&As face policy changes ....................................................................................................................... 17
A. Chinese M&As: geographic and sectoral characteristics .................................................................................... 18
B. Policy changes at home ...................................................................................................................................... 19
C. Increased control and scrutiny in host countries ............................................................................................... 20
2.3. Conclusion ............................................................................................................................................................. 21
Chapter 3 Emerging market multinationals advance along the value chain .................................................................... 23
Introduction ......................................................................................................................................................................... 24
3.1. eMNCs continue to compete on price .................................................................................................................. 24
3.2 Comparing input costs and efficiency of resources used by company .................................................................. 31
3.3. How far are emerging market brands from becoming brand leaders? ................................................................. 35
3.4. Conclusion ............................................................................................................................................................. 38
Chapter 4 Emerging economies progress amidst a changing paradigm .......................................................................... 39
Introduction ......................................................................................................................................................................... 40
4.3. Growth forecasts still positive, but serious risks loom .......................................................................................... 40
4.4. Emerging economies have maintained a key role in a fragile global FDI landscape ............................................. 43
4.5. The protectionist wave .......................................................................................................................................... 46

vii
©Cornell University © Lourdes Casanova © Anne Miroux All rights reserved.
4.6. Conclusion ............................................................................................................................................................. 48
Chapter 5 Emerging Markets and soft power: new development institutions and initiatives............................................ 54
Introduction ......................................................................................................................................................................... 55
5.1. New development institutions redistribute the balance of power ....................................................................... 55
A. New governance structure and power distribution ........................................................................................... 55
B. Lending activity of the new development banks ................................................................................................ 56
C. The AIIB and NDB’s infrastructure focus ............................................................................................................ 57
5.2. The case of OBOR: from economics to geopolitics ............................................................................................... 58
A. The One Belt, One Road Initiative ...................................................................................................................... 58
B. Motivations ........................................................................................................................................................ 59
C. Challenges .......................................................................................................................................................... 60
5.3 Conclusion ............................................................................................................................................................. 61
Special contributions OECD Development Center and Emerging Markets Research Network ....................................... 66
Chapter 6 Impact of digitalization on businesses in emerging markets ........................................................................... 67
Introduction ......................................................................................................................................................................... 68
6.1. Drivers of digitalization ......................................................................................................................................... 68
A. Challenges arising from the development of digitalization ................................................................................ 69
B. Digitalization in Emerging Asia ........................................................................................................................... 70
6.2. Business insights on opportunities and challenges poses by digitalization in emerging markets ........................ 71
A. Digitalization offers access to new markets ....................................................................................................... 71
B. Digital technologies spur productivity growth and innovation .......................................................................... 72
C. Education and formal training on ICT are key prerequisites to benefit from digitalization ............................... 73
D. Digital infrastructure is a key enabler of connectivity ........................................................................................ 73
E. Governments need to improve the regulatory environment to facilitate digital growth .................................. 73
6.3. Conclusion ............................................................................................................................................................. 73
Chapter 7 Digital transformation in emerging markets: strategies and internationalization of digital companies from Latin
America .................................................................................................................................................................... 77
Introduction ......................................................................................................................................................................... 78
7.1. What makes digital companies unique? ............................................................................................................... 78
7.2. Digital globalization as an opportunity for eMNCs ............................................................................................... 79
7.3. Digital transformation in Latin America: Trends and attractiveness in e-commerce and digital business
opportunities ....................................................................................................................................................................... 80
7.4. Digital companies from Latin America: strategies and internationalization of new businesses ........................... 81
7.5. Improving the ecosystems for digital startups in Latin America ........................................................................... 83
7.6. Challenges ............................................................................................................................................................. 84
7.7. Conclusion ............................................................................................................................................................. 85

viii
©Cornell University © Lourdes Casanova © Anne Miroux All rights reserved.
Chapter 8 Corporate governance and corporate citizenship in Colombia: a lever for global competitiveness?.....................91
Introduction ......................................................................................................................................................................... 92
8.1. Corporate governance in Colombia: a brief historical overview ........................................................................... 93
8.2. Comparing Código País and the OECD Corporate Governance Principles ............................................................ 94
8.3. Practicing good corporate governance ................................................................................................................. 95
8.4. Colombian companies with good corporate citizenship: Dow Jones Sustainability Index .................................... 97
8.5. Conclusion ............................................................................................................................................................. 98
Chapter 9 Research on the Development Process of Entrepreneurship Education in Chinese Universities……………………..101
Introduction ....................................................................................................................................................................... 102
9.1. The development of entrepreneurship education in Chinese universities ......................................................... 102
A. Starting period: imitation based on entrepreneurial practice (1998-2002) ....................................................... 102
B. Growth period: based on the introduction and reform of entrepreneurship courses (2002-2008) ................... 103
C. Expansion period: exploration of entrepreneurship models based on talent training (2008-2010) ................... 104
D. Maturity: Breakthrough in the concept of innovation and entrepreneurship education (2010 – present) ....... 104
9.2. Conclusion: The future development direction of college entrepreneurship education ........................................... 106

ix
©Cornell University © Lourdes Casanova © Anne Miroux All rights reserved.
Abbreviations and Acronyms
ADB
AfDB
AIIB
AMEXCAP
ASEAN
BCIMEC
BRI
BRIC
BRICS
CAD
CCMREC
CCWAEC
CFIUS
CICPEC
Cosco
CPEC
CSCEC
CSIS
E20
EBITDA
EEB
EM
EMI
EMR
eMNC
EMnet
EU
FDI
Fintech
FIRRM
Forex
FSB
FSF
GDP
GFC
G-7
IADB
IBRD
ICT
IDI
Asian Development Bank
African Development Bank
Asian Infrastructure Investment Bank
Mexican Association of PE & VC Funds
Association of South East Asian Nations: Brunei, Darussalam, Cambodia, Indonesia, Laos,
Malaysia, Myanmar, Philippines, Singapore, Thailand, and Vietnam
Bangladesh-China-Myanmar Economic Corridor
Belt and Road Initiative
Brazil, Russia, India, China
Brazil, Russia, India, China and South Africa
Andean-Development Corporation — Development Bank of Latin America
China-Mongolia-Russia Economic Corridor
China-Central and West Asia Corridor
Committee on Foreign Investment in the United States
China-Indochina Peninsula Economic Corridor
China Ocean Shipping
China-Pakistan Economic Corridor
China State Construction Engineering
Center for Strategic and International Studies
Emerging Markets 20: Argentina, Brazil, Chile, China, Colombia, Egypt, India, Indonesia, Iran,
Malaysia, Mexico, Nigeria, Philippines, Poland, Republic of Korea, Russia, Saudi Arabia, South
Africa, Thailand and Turkey
Earnings before interest, tax, depreciation and amortization
Empresa de Energia de Bogotá
Emerging Market
Emerging Market Institute
Emerging Market Report
Emerging Market Multinational Corporation
OECD Emerging Markets Network
European Union
Foreign direct investment
Financial technology
Foreign Investment Risk Review Modernization Act
Foreign exchange trading
Financial Stability Board
Financial Stability Forum
Gross Domestic Product
Global Financial Crisis
Group of 7: Canada, France, Germany, Italy, Japan, US & UK
Inter-American Development Bank
International Bank for Reconstruction and Development
Information and communication technology
ICT Development Index
x
©Cornell University © Lourdes Casanova © Anne Miroux All rights reserved.
IEA
IFC
IFDI
IFRS
IMF
ISA
IsDB
LAVC
LITAS
M&A
MDB
MNC
MOM
NDB
NELB
NYSE
OBOR
OECD
OFDI
PPP
R&D
ROA
ROE
ROSC
SME
SOE
TANA
TEV
UN
UNCT
USD
WB
WTO
WIR
International energy Agency
International Finance Corporation
Inward Foreign Direct Investment
International Financial Reporting Standards
International Monetary Fund
International Standards on Auditing
Islamic Development Bank
Latin American Venture Capital
Lukoil International Trading and Supply Company
Mergers and acquisition
Multilateral Development Banks
Multinational Corporation
Mobile Obstetrics Monitoring
New Development Bank
New European Land Bridge
New York Stock Exchange
One Belt One Road
Organization for Economic Cooperation and Development
Outward FDI
Purchasing power parity
Research and development
Return on Assets
Return on Equity
Report on the Observance of Standards and Codes
Small and Medium-sized Enterprise
State Owned Enterprise
Trans Anatolian Natural Gas Pipeline
Total Enterprise Value
United Nations
United Nations Conference on Trade and Development
U.S. Dollar
World Bank
World Trade Organization
World Investment Report

xi
©Cornell University © Lourdes Casanova © Anne Miroux All rights reserved.
Executive Summary The Emerging Market Multinationals Report (EMR) 2018 is the third of a series of reports on emerging market
multinationals (eMNCs) published by the Emerging Market Institute (EMI) at Cornell S.C. Johnson College of Business, Cornell University. Building on the findings of previous years, the 2018 report examines the growing presence of eMNCs on the global stage and compares their performance with other firms from advanced economies (Chapter 1), while Chapter 2 focuses on eMNCs’ role as global acquirers. Chapter 3 explores the extent to which eMNCs are moving beyond cost leadership to focus on branding and product differentiation. While acknowledging the economic performance of emerging economies, Chapter 4 also highlights the serious risks and challenges arising from the changes to the global economy since early 2018. Finally, Chapter 5 pays special attention to the increasing soft power and influence of emerging economies and the extent to which this poses a significant challenge to the international order.
Chapters 6 through 9 are special contributions by the OECD and members of the Emerging Market Research Network. Two of these chapters explore digitalization: the OECD’s contribution (Chapter 6)—a regular feature of this report—examines the impact of digitalization on business in emerging markets, while Chapter 7 delves into the internationalization strategies of digital companies from Latin America. Chapter 8 investigates the case of Colombia as its companies adopt measures to encourage corporate governance and corporate citizenship. Finally, Chapter 9 is a research note on the development process of entrepreneurship education in Chinese universities.
As in last year’s report, this volume examines emerging economies through the experience of the E20—the top 20 Emerging Markets (EMs) selected based on GDP, demographics, and influence in global trade and investment. The E20 includes countries from Africa, Asia, Latin America and Europe (see box).
Chapter 1 - The coming of age of emerging market multinationals
As illustrated in previous EMRs, firms from emerging economies, mainly Chinese, have made substantial headways in global business. E20 firms now account for 30% of the global Fortune 500 compared to only 7% in 2005. They are solidly present on the global stage and rising to the top in many industry sectors. For instance, eMNCs comprise 40% of the largest firms in the world in a number of industries (such as Banking, Engineering and Construction, Petroleum, Mining and Crude Oil Production, and Metals). China has led the charge, and a rising number of its companies have ascended to the top ranks in many sectors. China tripled its presence in the Fortune Global 500 in just eight years to a total of 111 firms, and is quickly approaching the U.S.’ share of 126 firms—a remarkable feat considering that most Chinese companies were founded after 1950. The relative youth of eMNCs overall renders their rapid rise even more extraordinary. These companies formed during one of two waves: 1) the 1950s and 2) post-1982. As a result, half of the emerging market multinationals in the Fortune Global 500 are less than 30 years old.
Despite these gains, eMNCs still differ from their G-7 counterparts. eMNCs’ profit margins are still generally lower than those of their developed market counterparts, and financing structures differ in every country. With a tendency to rely less on capital equity in emerging economies, maximizing profits is generally less of a priority for eMNCs. The difference in profit margins between Chinese and U.S. firms shows this dichotomy. Meanwhile, the average eMNC’s return on assets is closer to that of their G-7 counterparts than observed in 2017.
While Western multinationals have focused on maximizing profits and value for shareholders, eMNCs have easier access to key resources such as cheap labor. Due to cost structure differences, they may not need to optimize profits or productivity per employee as much as U.S. or European companies, (as shown in Chapter 3). To a certain extent, ownership structure can explain some of these differences: 67% Chinese companies in the Fortune Global 500 are partially or totally state-owned versus only 1% of the American companies. As a result, the Chinese government has a key role in company strategy.
E20 countries Argentina, Brazil, Chile, China, Colombia, Egypt, India, Indonesia, Iran, Malaysia, Mexico, Nigeria, Philippines, Poland, Republic of Korea*, Russia, Saudi Arabia, South Africa, Thailand and Turkey. * referred to as Korea or South Korea in this report.

xii
©Cornell University © Lourdes Casanova © Anne Miroux All rights reserved.
Chapter 2 - Chinese M&As: facing policy headwinds
The astonishing rise of eMNCs in the world economy is also evident in their increased participation in global M&As. Chinese multinationals in particular have become significant global acquirers. In 2016, following an almost continuous upward trend, the value of announced outbound M&As by E20 firms—estimated at about $312 billion—was more than 20 times its level in 2000.
In 2017, however, E20 outbound M&As experienced a fall of almost 40% to $195 billion, the largest drop since 2000. This trend mirrored China’s decrease in M&A activity. Following two years of a buying spree, Chinese M&As fell 40% from almost $250 billion in 2016 to $150 billion in 2017, with Chinese acquisitions of U.S. firms alone dropping by about 70%.
The drop in Chinese overseas acquisitions reflects the double blow of internal and external restrictions to which such deals have been subjected. At home, the Chinese government shifted its policy course to stem the massive capital outflows, which posted a threat of potential financial instability. Authorities also feared that speculative rather than economic reasons motivated a number of transactions. Of special concern were cases of acquisitions outside the buyer’s core area of business—in real estate and entertainment, for instance, two industries that had seen a flurry of large deals. In addition to stricter approval requirements, in August 2017 the government issued “guidelines on overseas investment” that classify overseas investments into three main categories: 1) encouraged investments; 2) restricted investments; and 3) prohibited investments. In December 2017, a code of conduct followed for private companies investing abroad, which specified that Chinese firms should avoid high leverage financing and stay within their core area of activities. These policy shifts have not only tempered the acquisition fervor of Chinese investors, but also affected the confidence of their financiers. Since then, a number of firms have entered into a period of significant sell off of overseas assets. Abroad, host governments in a number of developed countries are making efforts to both monitor and control foreign acquisitions, often citing national security concerns.
While the fall in Chinese overseas acquisitions has been significant, it remains to be seen whether the trend will continue in the medium term. All of the factors that led to the fast expansion of Chinese outbound M&As still remain in play. On the one hand, Chinese firms will continue to look for new and innovative ways to expand into global markets. On the other, the Chinese government still encourages outbound acquisitions in line with its overall strategy of transforming the Chinese economy, with a strong focus on innovation and high value-added sectors. Combined, these factors are powerful drivers for continued Chinese M&A, at a possibly lower but more sustainable level.
Chapter 3 – Emerging market multinationals advance along the value chain
In the past, eMNCs have chiefly competed as low-cost alternatives to their G-7 counterparts. To accomplish this, they focused on driving efficiency and productivity across supply chains and building brand recognition in their home countries, at the expense of branding and innovation on a global scale. This trend is now beginning to change. Indeed, building on last year’s exploration of eMNCs as cost leaders, Chapter 3 tracks price changes in a range of E20 products (laptops, cell phones, televisions and air conditioners, among others) as compared to competing products from U.S. companies. As the data show, eMNCs are making clear headway in global branding, becoming serious competitors for their better known and well-established advanced economy counterparts.
eMNCs’ cost leadership has often been seen as the result of lower production costs in emerging economies, especially labor costs. However, lower wages do not explain the whole story. While the ratio of revenues and assets per employee is much higher in the U.S. than China, an overall efficiency analysis plotting ‘revenues per employee’ with ‘return on assets’ in some industries suggest a different picture, with eMNCs appearing as efficient as their U.S. and other G-7 counterparts.
The cheap labor advantage, long considered the bedrock of Chinese manufacturing success in particular, is slowly eroding. Factory managers in China are finding it harder to retain workers, who are becoming increasingly expensive. In turn, this has led to increased interest in automation across Chinese factories. While China initially started with manufacturing components and assembling systems for Western brands, Chinese companies are now building scale and experience on their own.

xiii
©Cornell University © Lourdes Casanova © Anne Miroux All rights reserved.
However, firms from advanced economies still dominate the world of global brands, and there is quite a notable difference in the concentration of E20 versus G-7 companies between the Fortune Global 500 largest firms and the top 500 global brands. Yet, since 2009 eMNCs have continuously increased their presence among leading global brands, (Lenovo, Samsung, Huawei and Havaianas among them), accounting for more than 20% of the top 500 global brands in 2017, compared to 12% only in 2009.
Chapter 4 - Emerging economies progress amidst a changing paradigm
Emerging market and developing economies grew by 4.3% in 2017, compared with 3.7% in 2016. Overall, the growth rates of many E20 countries in 2017 continued to exceed those of advanced economies. Emerging economies also maintained a key role in a relatively fragile global investment landscape. The E20 for instance attracted a larger amount of FDI amidst a drop in global FDI in 2017. The FDI flows to the E20 recovered to their 2015 level ($429 billion, or about a third of global FDI inflows), and, in spite of a decrease, their FDI outflows continue to represent close to 20% of global FDI outflows.
Despite a global growth softening during the first-half of the year, short-term forecasts remained relatively optimistic. As of June 2018, global growth was predicted to remain at around 3% in 2018-2019, with emerging markets’ and developing economies’ growth reaching 4.5% in 2018 and 4.7% in 2019. Yet, serious risks loom. As of September 2018, such risks include:
Global debt. Debt is at a record high, in both advanced and emerging economies. While the former is responsible for most of this debt, the latter has contributed to the recent increase in the global debt-to-GDP ratio (225% in 2016, compared to about 200% in 2013). In emerging markets and middle-income economies, public debt has reached levels close to those of the 1980s debt crises. Since 2010, the ratios of public debt to GDP increased by at least 30% for two-thirds of the E20. In addition, the significant share of foreign currency debt in several emerging economies renders them particularly vulnerable to exchange rate fluctuations.
Financial instability resulting from a less accommodative monetary policy in advanced economies, higher U.S. interest rates and a rising dollar. While rising U.S. interest rates affected the exchange rates of many E20 economies, the impact was particularly acute in countries already faced with economic or political challenges. The fall was dramatic for some currencies such as the Argentinian peso, the Turkish lira, the Brazilian real and the Mexican peso, while in Asia, too, some currencies suffered. The extent of the volatility, and the extreme examples of Turkey and Argentina, had analysts questioning the potential for contagion and wider-spread economic consequences including stock markets volatility.
Finally, particularly damaging is the risk of a major disruption—if not collapse—of the rule-based global trade system resulting from the looming trade war between the largest global economies.
Over the past year, protectionism has become a very visible reality. Since early 2018, trade tensions have markedly escalated, leading to a series of tariff announcements and retaliatory measures among trade partners. For instance, in addition to tariffs applied to all its steel and aluminum imports, the U.S. imposed tariffs on, first, $50 billion and, then, $200 billion of Chinese imports (respectively in April and September 2018), and also considered additional levies. China reacted immediately to each announcement by imposing tariffs first on $50- and then $60 billion of U.S. imports. The trade war has also touched off serious tensions among traditional U.S. partners and allies, such the European Union and Canada, and triggered retaliatory measures from these countries and other U.S. trade partners.
The impact of these U.S.-imposed tariffs on the global economy is likely to be wide-ranging. For instance, indirect impacts may stem from the fact that Chinese shipments destined for the U.S. may be diverted to other markets, such as Europe or Latin America, possibly exposing them to increased trade imbalances. China’s role in global value chains will also be a crucial determining factor for other second order impacts in other countries. The blow to Chinese exports could ripple through emerging economies, especially in Asian countries with a large number of enterprises and industries supplying the Chinese manufacturing sector. Cambodia, Korea, Malaysia, Thailand and Vietnam are especially vulnerable in that respect. A slowdown in China because of the challenging trade environment, could also seriously affect commodity producers, many of them emerging economies. At the same time, the implications may not be wholly negative. If global value chains are disrupted, certain countries may benefit from new market opportunities. Foreign firms (especially U.S. companies) may redesign their supply chains outside China to get around the U.S.-imposed tariffs. In addition, key U.S. trade partners are bound to react to retaliatory tariffs by looking for alternative suppliers outside the U.S.
xiv
©Cornell University © Lourdes Casanova © Anne Miroux All rights reserved.
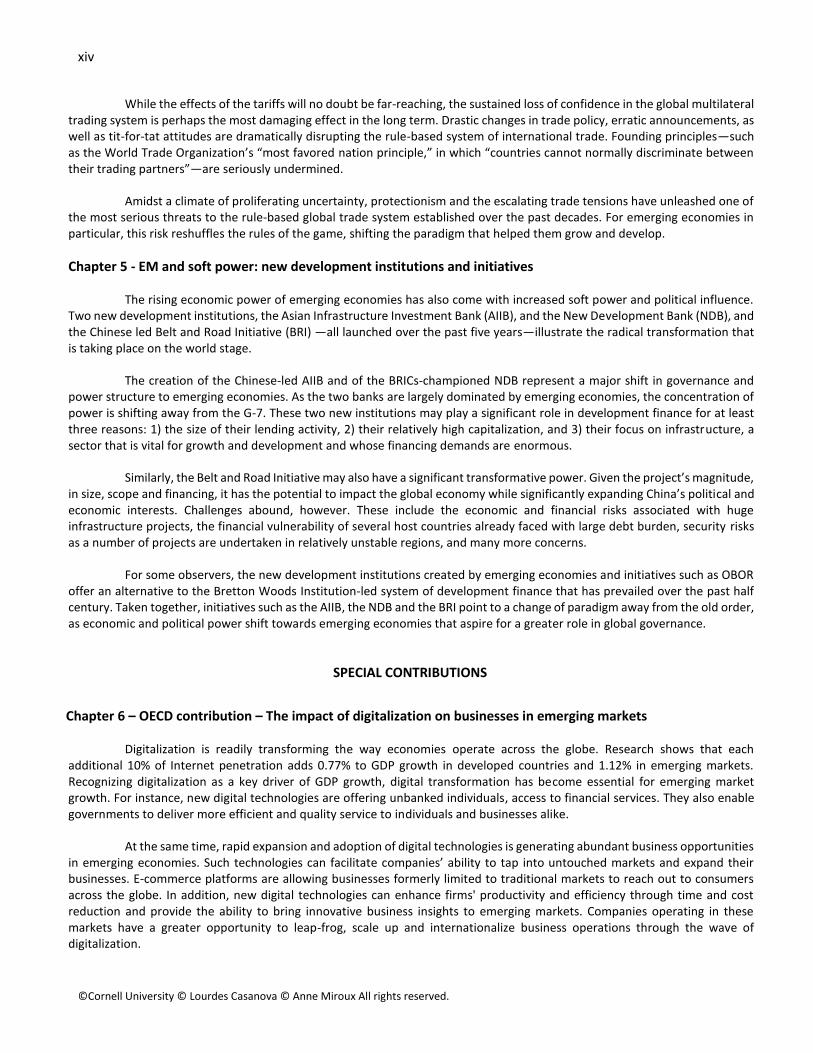
While the effects of the tariffs will no doubt be far-reaching, the sustained loss of confidence in the global multilateral trading system is perhaps the most damaging effect in the long term. Drastic changes in trade policy, erratic announcements, as well as tit-for-tat attitudes are dramatically disrupting the rule-based system of international trade. Founding principles—such as the World Trade Organization’s “most favored nation principle,” in which “countries cannot normally discriminate between their trading partners”—are seriously undermined.
Amidst a climate of proliferating uncertainty, protectionism and the escalating trade tensions have unleashed one of the most serious threats to the rule-based global trade system established over the past decades. For emerging economies in particular, this risk reshuffles the rules of the game, shifting the paradigm that helped them grow and develop.
Chapter 5 - EM and soft power: new development institutions and initiatives
The rising economic power of emerging economies has also come with increased soft power and political influence. Two new development institutions, the Asian Infrastructure Investment Bank (AIIB), and the New Development Bank (NDB), and the Chinese led Belt and Road Initiative (BRI) —all launched over the past five years—illustrate the radical transformation that is taking place on the world stage.
The creation of the Chinese-led AIIB and of the BRICs-championed NDB represent a major shift in governance and power structure to emerging economies. As the two banks are largely dominated by emerging economies, the concentration of power is shifting away from the G-7. These two new institutions may play a significant role in development finance for at least three reasons: 1) the size of their lending activity, 2) their relatively high capitalization, and 3) their focus on infrastructure, a sector that is vital for growth and development and whose financing demands are enormous.
Similarly, the Belt and Road Initiative may also have a significant transformative power. Given the project’s magnitude, in size, scope and financing, it has the potential to impact the global economy while significantly expanding China’s political and economic interests. Challenges abound, however. These include the economic and financial risks associated with huge infrastructure projects, the financial vulnerability of several host countries already faced with large debt burden, security risks as a number of projects are undertaken in relatively unstable regions, and many more concerns.
For some observers, the new development institutions created by emerging economies and initiatives such as OBOR offer an alternative to the Bretton Woods Institution-led system of development finance that has prevailed over the past half century. Taken together, initiatives such as the AIIB, the NDB and the BRI point to a change of paradigm away from the old order, as economic and political power shift towards emerging economies that aspire for a greater role in global governance.
SPECIAL CONTRIBUTIONS
Chapter 6 – OECD contribution – The impact of digitalization on businesses in emerging markets
Digitalization is readily transforming the way economies operate across the globe. Research shows that each additional 10% of Internet penetration adds 0.77% to GDP growth in developed countries and 1.12% in emerging markets. Recognizing digitalization as a key driver of GDP growth, digital transformation has become essential for emerging market growth. For instance, new digital technologies are offering unbanked individuals, access to financial services. They also enable governments to deliver more efficient and quality service to individuals and businesses alike.
At the same time, rapid expansion and adoption of digital technologies is generating abundant business opportunities in emerging economies. Such technologies can facilitate companies’ ability to tap into untouched markets and expand their businesses. E-commerce platforms are allowing businesses formerly limited to traditional markets to reach out to consumers across the globe. In addition, new digital technologies can enhance firms' productivity and efficiency through time and cost reduction and provide the ability to bring innovative business insights to emerging markets. Companies operating in these markets have a greater opportunity to leap-frog, scale up and internationalize business operations through the wave of digitalization.

xv
©Cornell University © Lourdes Casanova © Anne Miroux All rights reserved.
Nevertheless, many emerging markets also face barriers to digitalization. Issues such as a shortage of tech-savvy workers, an underdeveloped infrastructure and regulatory challenges, in particular, need to be addressed with close collaboration between the public and private sector. In this regard, the OECD-EMnet meeting organized in March 2018 on “Accelerating Digitalization in Emerging Markets” recommended that both the private and public sectors incorporate technology training as a major human resource management program. While more active private investment in building and delivering digital infrastructure is required, the meeting also stressed the need for policymakers and regulators to create an enabling business environment to attract further investment in the Information Technology sector, and for governments to keep coherence between the objective of digitalization and regulations on ICT investment.
Chapter 7 - Digital transformation in emerging markets: strategies and internationalization of digital companies from Latin America
This chapter provides an overview of the rise of Internet-based companies in emerging countries, focusing its analysis on digital and e-commerce business from Latin America. Digital Multinational Companies (MNCs) are still heavily concentrated in the U.S., but firms from emerging markets are systematically gaining ground in digital-based sectors and increasing their presence and relevance in international markets. Chinese companies play a prominent role, but in the past 10 years, Latin American digital companies have grown significantly, with Argentina, Brazil and Mexico leading the movement.
The chapter examines the internationalization patterns of digital companies, highlighting that these companies’ engagement in the digital landscape has allowed them to break free from the traditional correlation between foreign assets and foreign sales. Their physical presence through FDI is less necessary, resulting in new ways to access international markets. There is an assumption that digital companies expand globally from inception, through accelerated internationalization, and popular examples, such as Amazon, Google, Facebook, and eBay have reinforced this notion. However, Latin America’s largest digital companies mostly operate within the Latin American region or only in their domestic markets, with a few global companies. Their most common market strategy is to replicate the business model of successful international players to capture regional consumers and users. The chapter also notes that there is an important diversity of sectors and business models among Latin American digital companies, such as Internet platforms, digital games, providers of digital solutions, and producers and distributors of digital content.
Several countries in Latin America have introduced programs to promote digital and high-tech entrepreneurship. However, the development of digital entrepreneurship in the region faces several obstacles. Despite recent progress, Latin American countries remain less connected than developed countries; a number of them face serious challenges related to basic infrastructure access, price and broadband coverage. Institutional fragilities (such as administrative red tape, regulatory hurdles or tax burdens) may also pose a challenge to the startup movement in Latin America. Policy makers in the region could draw inspiration from the experiences of other emerging countries to improve the eco-system for digital start-ups.
Chapter 8 - Corporate governance and corporate citizenship in Colombia: a lever for global competitiveness?
This chapter explores whether good corporate governance and corporate citizenship can lead to global competitiveness. To this end, it examines how corporate governance and internationalization interplay in Colombia, the fourth-largest economy in Latin America. It presents an overview of the corporate governance practices followed by Colombian companies (most of which are family-owned businesses) and compares Colombian compliance with the OECD Corporate Governance principles as imbedded in the Código País.
No matter how important, corporate governance practices reflect only some of the many ways in which companies can enhance their societal value. Therefore, the broader notion of good corporate citizenship is particularly useful to extend the concept of good corporate governance. Good corporate citizens are generating a positive value to society and exceed stakeholder expectations by creating measurable social impact, besides complying with the best corporate governance practices. Based on the Dow Jones Sustainability Index, the chapter designates the best corporate citizens among Colombian multinationals as companies that are also engaged in environmental conservation and social betterment.

xvi
©Cornell University © Lourdes Casanova © Anne Miroux All rights reserved.
In Colombia, the largest publicly traded multinationals stand out in the international rankings of good corporate citizenship and corporate governance. Investor scrutiny may contribute positively to adhering to good corporate governance practices and improved corporate citizenship more generally. In addition, the highest ranked companies, such as Bancolombia, Argos, Sura and Nutresa, are among the most ambitious foreign investors, relentlessly pursuing international growth. Without being certain about the specific channels through which good corporate governance affects internationalization, it is clear in Colombia’s case that international competitiveness and sustainable corporate practices go hand in hand.
Chapter 9 - Research on the development process of entrepreneurship education in Chinese universities
Since Prime Minister Deng Xiaoping started the “Open and Reform Policy” in 1978, China entered a new era of economic development. Since then, entrepreneurship gained greater importance in the Chinese economy and policymakers have come to prioritize entrepreneurship education in the name of economic development. This research examines the development process of entrepreneurship education in China, dividing it in four stages: germination, exploration, expansion and maturity. Delineating needs particular to the Chinese economy, it also highlights the unique challenges entrepreneurship education faces given the characteristics of the traditional Chinese educations system. While recognizing the progress made, this chapter acknowledges that entrepreneurship education is still limited in comparison with other nations in terms of teaching organization, content, methods and evaluation. It gives some suggestions for the future development of entrepreneurship education in China, stressing that, as the country focuses more on innovation, entrepreneurship education will continue to be a key element of national development policy.

1
Chapter 1
The coming of age of emerging market
multinationals
1.1. Representation of major economies in the Fortune Global 500
1.2. Greenfield FDI projects and international presence
1.3. Comparing U.S. and China in revenues, profits, employees and assets
1.4. Market capitalization, capital structure and valuation
1.5. Capital structure analysis
1.6. Conclusion
Executive Summary
This chapter compares the overall performance of Emerging Market Multinational Corporations (eMNCs) with their competitors from developed countries, mainly in the United States. eMNCs are now solidly present on the global stage and comprise about 40% of the largest firms in many industry sectors. Chinese companies in particular have experienced a rapid expansion, tripling their participation in the Fortune Global 500 in just eight years. As of the 2018 rankings, China is quickly approaching the U.S.’ share—a remarkable feat considering that most Chinese companies were founded after 1950. While eMNCs tend to have lower margins than many of their developed market counterparts, they are becoming formidable competitors.

2
Introduction
We define eMNCs as multinational companies headquartered in an emerging market and present in another country in addition to its own1 . This chapter draws on the Fortune Global 500 database to compare the performance of eMNCs with their competitors from developed countries. Since 1995,2 the Fortune Global 500 database has provided data for chronological comparisons of the largest companies in the world ranked by revenue.
Similar to the analysis in last year’s EMR, we focus on the largest firms rather than the most internationalized. Our rationale is as follows: 1) the level of internationalization does not fully reflect the true importance and potential impact of large enterprises in the world economy; 2) eMNCs generally do not perform as well in internationalization rankings relative to their counterparts in the U.S., E.U., and Japan, due to less time in the global market; and 3) smaller companies and economies tend to fare best (and therefore are over-represented) in the international proportioning of total assets/employees/sales.
1.1. Representation of major economies in the Fortune Global 500
In 2018, the Fortune Global 500 was composed of companies from 36 countries,3 (almost half of these countries had only one company listed). Together, the U.S. and China made up half of the total list: the U.S. with 126 and China with 111 companies. In Figure 1.1, we see that U.S. representation continues to drop, from about 180 companies almost 10 years ago to 126 companies today. Meanwhile, China’s presence first surged in 2004, accelerated after the Global Financial Crisis (GFC) of 2008, and now tails the U.S.’ numbers. Subsequently, Chinese companies became avid global acquirers, currently ranking second after the U.S., as we will see in Chapter 2. Since 2005, Korea has retained 16 companies in the ranking. However, other major E20 countries like Brazil, Mexico and India have not grown similarly during this period.
Figure 1.1. Growth in representation on Fortune Global 500 (2005-18)
Source: Authors based on Fortune Global 500 data 2005- 2018, accessed by August 2018.
Figure 1.2 provides a more comprehensive picture of the 36 countries included in the ranking. G-7
economies continue to lead relative to E20 countries, with the significant exception of China (2nd) and, to a lesser extent, Korea (7th with 16 companies). Nearly a third (155 firms) of the Fortune Global 500 are E20 firms, and about 20% are Chinese. More than half of the E20 are home to companies in the Fortune Global 500 although most of them (Turkey, Thailand, Saudi Arabia, Poland, Malaysia and Indonesia) have just one company. As Figure 1.1. and 1.2 show, China continues its growth. Indeed, China (see box on China National Petroleum, the second biggest company in the world in its industry) is the only E20 country that increased its number of companies in the Global 500: from 98 in 2015, to 103 in 2016, 108 in 2017 and 111 in 2018. Relative to the size of their Gross Domestic Product (GDP), China and Korea both have more than the average number of companies in the Fortune Global 500 that would correspond to the size of their economies.
In spite of economic and political turbulences, Brazil has maintained seven companies in the ranking, and so has India. Three out of the Brazilian seven are banks, which have some of the highest margins in the banking
16
China: 111Korea: 16
Brazil, India: 7
México: 4
175
U.S.: 126
0
50
100
150
200
2005 2006 2007 2008 2009 2010 2011 2012 2013 2014 2015 2016 2017 2018
China South Korea India Brazil, India México U.S.

3
industry, as we will see in Chapter 3. India’s seven companies (see box on State Bank of India) are a demonstration of the country’s dynamic growth and Mexico with four (see box on América Móvil).
Figure 1.2. Countries represented in the Fortune Global 500 (2018)
Source: Authors based on Fortune Global 500 data 2018, accessed by August 2018.
China National Petroleum http://www.cnpc.com.cn China National Petroleum produces and supplies both oil and gas. It combines production, transportation, and marketing of domestic and international gas and oil. China National Petroleum engages in refining chemicals and oil and gas, pipeline transportation, , engineering and technical services, equipment manufacturing, energy financial services, and new energy development. As the largest natural gas producer and supplier in China, China National Petroleum uses a pipeline network of over 85,000 kilometers to distribute oil. The company also offers over 20,000 service stations that serve over 20 million clients a day throughout China, on average. These stations provide gasoline, diesel, kerosene and lubricants in urban and rural areas at a rate of approximately 310,000 tons per day.
Although headquartered in Beijing, China National Petroleum operates in over 30 countries throughout Central Asia-Russia, Africa, The Middle East, Americas, and Asia-Pacific. China National Petroleum is a SOE that operates through the subsidiary PetroChina. China National Petroleum is the sole sponsor of PetroChina.
Fortune Global 500 2017: #4
Ownership: State-Owned
Founded: 1955
Chairman: Wang Yilin
Industry: Energy
Employees: 1,470,193
Revenue ($bn): $326
Assets ($bn): $629.40
Source: Authors based on data from Capital IQ and 2018 Fortune Global 500 accessed by September 2018.
Compared to last year, of the 16 Chinese companies in the Annex Table 1.1, six have risen in the rankings, six have dropped and four retained their positions. Two Russian companies, Gazprom and Lukoil (see box on the
111111111111111222
444
6777
9101111
1416
2228
3152
111126
0 20 40 60 80 100 120 140
BelgiumBermudaDenmark
IndonesiaLiechtensteinLuxembourg
MalaysiaMalta
Netherlands AntillesNorwayPoland
Saudi ArabiaThailand
TurkeyUnited Arab Emirates
FinlandSingapore
SwedenIrelandMexicoRussia
ItalyAustralia
BrazilIndia
TaiwanSpain
CanadaNetherlandsSwitzerlandSouth Korea
United KingdomFrance
GermanyJapanChina
United States

4
company), and Brazil’s Petrobras have all improved their rankings—despite both countries suffering currency devaluation with respect to the dollar. While Korea’s Samsung ranking moved up in rank this year, in general, we see a drop from countries other than China.
State Bank of India https://www.sbi.co.in/ The State Bank of India offers banking products and financial services to individuals, commercial enterprises, corporations, public entities, and institutional customers in India and abroad. Founded over 200 years ago, the company is headquartered in Mumbai. The State Bank of India offers retail asset and liability products, corporate lending, loan syndication, merchant banking, short term financing, and trade finance. The company has segments in Treasury Management, Wholesale Banking, as well as Retail Banking. The Treasury Management segment offers a variety of treasury and hedging products. These include asset liability management products, investments, foreign exchange trading (forex), derivatives and trading options in various asset classes. The Wholesale Banking segment focuses on commercial loans, merchant banking, and capital market funding. The Retail Banking segment offers a wide network of branches in 22 countries, providing savings and checking accounts, loans, and remittances. The State Bank of India also possesses 190 foreign offices in over 36 countries that primarily focus on India-related business. In total, the State Bank of India offers 22,414 branches and 59,541 ATMs to their 273 million customers.
Fortune Global 500 2017:
#217
Ownership: Public/State-
Owned
Founded: 1806
Chairman: Rajnish Kumar
Industry: Financials
Employees: 264,041
Revenue ($bn): $47.5
Assets ($bn): $554.5
Ticker: SBIN (NSEI)
Source: Authors based on data from Capital IQ and 2018 Fortune Global 500 accessed by September 2018.
América Móvil www.americamovil.com América Móvil, a multinational telecommunications company headquartered in Mexico City, offers wireless and fixed voice services, including airtime, local, domestic, and international long-distance services; and network interconnection services. Additionally, América Móvil provides data services, such as Internet access, messaging, and other wireless entertainment and corporate services. Furthermore, the company supplies both cable and satellite pay television, and provides IT solutions for small businesses and larger corporations. América Móvil primarily sells these products and services through a network of retailers and service centers to retail customers and utilizes a sales force to distribute to corporate customers. América Móvil is the leading provider of integrated telecommunications in Latin America and outside of China and it is the fourth largest company in regard to the number of wireless subscribers. The company has 362 million access lines in use throughout 25 countries. These access lines include 279 million wireless subscribers, 33 million landlines, 28.6 million broadband accesses and 21.5 million PayTV units. América Móvil controls a number of subsidiaries that operate in different regions. Telcel is the largest mobile operator in Mexico, while Claro primarily operates in Central and South America, as well as the U.S. América Móvil uses both Claro and another subsidiary, Tracfone, to provide their services to U.S. customers.
Fortune Global500 2017:
#176
Ownership: Public
Founded: 2000
Chairman: Carlos Slim Domit
Industry:
Telecommunications
Employees: 189,975
Revenue ($bn): $54.1
Assets ($bn): $75.97
Ticker: BMV: AMX L
Source: Authors based on data from Capital IQ and 2018 Fortune Global 500 accessed by September 2018.

5
Lukoil www.lukoil.com Lukoil, with its subsidiaries, engages in exploration, production, refining, marketing, and distribution of oil and gas. Although headquartered in Moscow, Lukoil has a strong global presence, operating 5,556 filling stations in 35 countries, as well as distributing its own crude oil and refined products through wholesale and retail channels both domestically and internationally. Lukoil is one of the largest vertically integrated oil and gas companies in the world, producing over 2% of the world’s oil and possessing around 1% of the proved hydrocarbon reserves. The company’s Exploration and Production segment explores for, develops, and produces crude oil. Its Refining, Marketing and Distribution segment processes crude oil into refined products; purchases, sells, and transports crude oil and refined petroleum products; refines and sells chemical products; and produces and distributes steam and electricity. The company depends on the efficient execution of their vertically integrated business model, which includes keeping production costs of oil low, situating refineries in favorable locations, and developing premium distribution channels. LITASCO (Lukoil International Trading and Supply Company) has managed all of the company’s international trade since 2000. The LITASCO group currently incorporates subsidiaries in the U.S., the Netherlands, Sweden, Germany, the Middle East, Kazakhstan, Singapore, Northwestern Europe, and representative offices in Russia and China. The countries of the Black Sea Basin, Mediterranean region, and Northwestern Europe have traditionally been key markets for the LITASCO group. In addition to implementing projects in Central America and Colombia, the company is also extending its global reach to the oil-producing regions of Africa.
Fortune Global500 2017:
#102
Ownership: Public
Founded: 1993
Chairman: Valery Grayfer
Industry: Energy
Employees: 103,600
Revenue ($bn): $93.9
Assets ($bn): $90.8
Ticker: LKOH (MISX)
Source: Authors based on data from Capital IQ and 2018 Fortune Global 500 accessed by September 2018.
China State Construction Engineering http://www.cscec.com China State Construction Engineering (CSCEC) operates as an integrated construction and real estate company; it provides general contracting for building, municipal public, and highway works. CSCEC is the largest construction and real estate conglomerate in China and in Construction and Engineering sector is the largest in the world in revenues (see Figure 1.3). A Chinese state-owned company, CSCEC’s major projects include public works, offices, hotels, education works, sports facilities, housing, medical works, embassies, industrial works, and national defense and military works. CSCEC is involved in constructing a new proposed capital city in Egypt. CSCEC is present in both the domestic and international spheres. The company operates in over 20 countries and regions around the world, offering building construction, international contracting, real estate development and investment, infrastructure construction and investment, prospecting and design. China State Engineering utilizes one of its subsidiaries, China Overseas Property, to stay active internationally through investing and developing real estate property.
Fortune Global 500 2017: #24
Ownership: State-Owned
Founded: 1982
Chairman: Qing Guan
Industry: Engineering and
Construction
Employees: 270,467
Revenue ($bn): $156.07
Assets ($bn): $239.68
Source: Authors based on data from Capital IQ and 2018 Fortune Global 500 accessed by September 2018.
Building on the 2016 and 2017 EMR, Figure 1.3 considers the top five companies in eight major industries, confirming the global leadership position attained by emerging market firms. In 2016, three E20 firms joined this group. In 2017 and 2018, however, more than half are from emerging economies, and the Chinese lead with 18 firms represented. Chinese engineering and construction companies (see box on China State Construction Engineering, CSCEC) are particularly prominent, occupying all five top positions. China also dominates banking with four of the top five positions by assets; the country also has top positions in all industries except for Automobile, which is firmly dominated by G-7 companies.

6
Figure 1.3. Top five companies and country of origin across different industries in the Fortune Global 500 in 2004, 2015 and 2018
Source: Authors based on Fortune Global 500 data 2004-2018, accessed by August 2018.
The relative youth of eMNCs renders their rapid rise even more remarkable. These companies formed during one of two waves: 1) the 1950s and 2) post-1982. As such, half are less than 30 years old. The average founding year of Chinese, Korean, German, Japanese and American companies. Figure 1.4 illustrates this difference: while the average American company in the Global ranking is almost 100 years old, their Chinese counterparts are the youngest, founded less than 50 years ago.
Figure 1.4. Companies’ founding years: average foundation year for companies in selected countries (from Fortune Global 2018)
Source: Authors based on Fortune Global 500 data 2018, accessed by August 2018.
1903
1964
1926 1925
1943
1926
1981
1945
1860
1880
1900
1920
1940
1960
1980
2000
Germany South Korea U.S. Japan Mexico Brazil China India
Avg = 1939

7
1.2. Greenfield FDI projects and international presence
Announced greenfield FDI projects illustrate the E20 firms’ expanding international presence. Using data from January 2003 to July 2017 published by fDi Markets, we compared the average number of countries in which E20, U.S. and Japanese companies have announced projects over the period (see Figure 1.5). The results suggest that E20 firms have a sizable international presence; though these firms announced projects in fewer countries than did Japanese or U.S. firms, the gap is not very large. Among the E20, Korea has the highest average number of targeted countries, followed by the “Other E20” group, with China lagging behind.
In the 2016 Emerging Market Report (Casanova, L.; Miroux, A. 2016), we discovered similar data from S&P Capital IQ. While the fDi Markets database covers only greenfield FDI, S&P Capital IQ covers other forms of FDI entry in addition to greenfield. In addition, fDi Markets’ data refer to announced projects, while those in S&P capital IQ relate to actual activities include Mergers and Acquisitions (M&A). Despite these differences, both results converge (see Table 1.1), suggesting that the global footprint of eMNCs is larger than expected (see further work on Emerging Multinationals in Casanova (2009), Cuervo-Cazurra (2012), Dunning (2005), Fleury and Fleury (2012), and Guillén and García-Canal (2012)).
Figure 1.5. Geographical footprint: number of countries with greenfield projects from companies in selected countries (from fDiMarkets 2017 and First-Half 2018).
Source: Authors based on data from fDI Markets, accessed by August 2018.
Table 1.1. Firms’ international presence by average number of stock markets in which firms are listed and countries where firms are present (Greenfield or M&A 2016 to June 2018)
Group or country Average number of stock
markets in which firms are listed (Q2-2018)
Average number of countries in which firms are present (Capital IQ, 2016 EMR)
Average number of countries in which firms are present (fDI Markets, 2017
EMR )
Average number of countries in which firms are present (fDi
Markets) Q2-2018
Other E20 3.6 19 15 13
China 2 10 11 12.4
Japan 3.2 26 22 21.7
South Korea 2.3 17 23 24.4
United States 5.4 28 18 19.4
Source: Authors based on data from fDI markets and Capital IQ, accessed by August 2018.
Another measure of internationalization is the number of stock exchanges on which companies are listed. In this regard, U.S. companies lead with an average of 5.4 stock markets, followed by other E20 countries and Japan (see Figure 1.1). On average, Chinese firms go public in two stock markets, usually the Shanghai and Hong Kong stock exchanges. Although the average international presence of all E20 has been reduced (see Figure 1.5), compared to 2017, China and Korea continue to expand their geographical footprint.
11.2
14.95
18.4
21.7
23
12.4
13
19.4
23.1
24.4
0 5 10 15 20 25 30
0
0
0
0
0
International Subsidiaries (Average) Q2-2018 International Subsidiaries (Average) 2017

8
1.3. Comparing U.S. and China in revenues, profits, employees and assets
While the top-ranked companies from China in the 2018 Fortune Global 500 have more assets and labor on the payroll than the U.S., Chinese companies continue to generate less revenue and approximately half the profit of their U.S. counterparts (more on this subject in Chapter 3). As shown in Figure 1.6, the profit margins of Chinese companies are lower than that of U.S. firms. In Figure 1.7 we can see that their return on assets (profit to asset ratio) is lower than that of U.S. firms (1% v. 2.1%). More importantly, the same gap exists in return on employment (1.7% for Chinese firms versus 1.9% for U.S. firms). This is not surprising given that Asian enterprises from emerging and developing economies have traditionally been more labor-intensive than their developed-country counterparts. Figure 1.7 delineates how American companies outperform Chinese companies in these two dimensions.
In comparison with 2017 data, we observe that (excluding the outliers), U.S. companies demonstrated a profit increase, while Chinese companies are still compromising on profits. This may be a result of Chinese companies competing more on price, a usual trait of eMNCs. While growth was steady in all areas for both countries, China takes the lead in investments as a result of supporting their own international expansion.
Figure 1.6. Profit margin distribution between U.S. and Chinese companies
Source: Authors based on Fortune Global 500 data 2018, accessed by August 2018.
1.4. Market capitalization, capital structure and valuation
To study market capitalization, we use Total Enterprise Value (TEV) to compare companies with varying levels of debt. TEV is equal to Market Capitalization plus Interest Bearing Debt plus Preferred Stock minus Excess Cash. This metric is useful to compare companies with different capital structures (for instance with different levels of debt) since the value of a firm is unaffected by its choice of capital structure. We surveyed all available companies in S&P’s Capital IQ database (excluding financial service companies).
China is the second-largest country by market capitalization. According to Capital IQ in August 2018, Chinese market capitalization was around 21% of the U.S.’ value at $14.6 trillion. In 2018 Fortune Global 500, there were only 47 publicly listed companies versus 111 from the U.S. This reflects the reliance of U.S. companies in capital markets. As we will see later, Chinese companies are often state-owned, and do not trade on any stock exchange.
10.8%
63.1%
11.7%3.6%
4.5%
6.3%7.9%
40.5%26.2%
6.3% 7.1% 11.9%
0.0%
10.0%
20.0%
30.0%
40.0%
50.0%
60.0%
70.0%
<0% <5% <10% <15% <20% 20%+
China United States

9
Figure 1.7. Comparison of Chinese* and U.S. companies along four variables: aggregated revenues, profits, labor and assets (2017 and 2018 Fortune Global 500)
* including Hong Kong – Each year, we compare the same number of companies from The U.S. & China Source: Authors based on Fortune Global 500 data 2018 accessed, by August 2018.
Figure 1.8 displays the average total market capitalization for the public companies featured in the Fortune Global 500. Apart from the U.S., only Switzerland presents a comparatively high average market capitalization per company: $89 billion versus $131.7 billion for U.S. companies. The yellow line represents the total number of public companies included in the Fortune ranking.
Figure 1.8. Total market capitalization by country for publicly traded companies in Fortune Global 500.
Source: Author’s analysis based on data from S&P Capital IQ—Fortune Global 500 Financials, accessed in August 2018.
The average market capitalization for a Chinese company in the Fortune Global 500 is around $65.6 billion—about 50% and 74% of the average market capitalization of American and Swiss companies, respectively. As of August 2018, using Capital IQ data, the largest Chinese company by market capitalization was Alibaba, with a market capitalization of $462.7 billion. As of September 2018, the top 15 companies by market capitalization are overwhelmingly American, with 11 U.S. companies, three Chinese companies and Royal Dutch Shell from the Netherlands. Overall, in 2017 and 2018, emerging markets have improved their ranking in the top 100 firms by market capitalization. Meanwhile, China now has 12 companies within the top 100.
0
20
40
60
80
100
120
$-
$2,000,000
$4,000,000
$6,000,000
$8,000,000
$10,000,000
$12,000,000
$14,000,000
$16,000,000
Nu
mb
er o
f P
ub
licly
tra
ded
Co
mp
anie
s
US$
Mill
ion
s
Total Market Capitalization Publicly Traded Companies

10
Figure 1.9. Total value of top 10 stock exchange markets for 2018
Note: Excludes London Stock Exchange because it is not part of the World Federation of Exchanges. Source: Author’s analysis based on data from World Federation of Exchanges, 2018. WFE Annual Statistics Guide 2017. Available at: https://www.world-exchanges.org/home/index.php/statistics/annual-statistics.
Observing the total value of the top 10 world stock exchange markets, we note that three stock exchanges in China and Hong Kong (the Shanghai Stock Exchange, Shenzhen Stock Exchange and Hong Kong Exchange) are among the largest in the world, (see Figure 1.9). All the other featured stock exchanges are from developed countries and may influence Chinese firms to shift their financing structures towards greater reliance on stock markets.
Figure 1.10. Average total enterprise value4 and market capitalization by country according to companies in Fortune Global 500 in 2018
Source: Author’s analysis based in data from S&P Capital IQ—Fortune Global 500 2018 Financials.
Figure 1.10 reveals that the average TEV of the U.S. and Swiss firms are, the highest of all countries represented in the Fortune Global 500. The difference between the average TEV and market capitalization is particularly high in the cases of Brazil, Mexico, Germany and Russia (companies from those countries rely heavily on debt and less on excess cash). The TEV valuations of E20 companies are closer to those of companies in developed economies than in the case of market capitalizations.
China is the only country that has an average TEV that is close to market capitalization. Chinese companies typically hold excess cash, largely for precautionary motives. This excess cash represents a cost, but it is indicative of how Chinese companies avoid financial default. Since the 2017 EMR, we observe that average TEV and average market capitalization grew consistently across countries, except for China.
12.8%
29.1%
20.9%
16.4%11.2%
37.3%
5.7%
15.8%
15.2%
7.9%
$-
$5,000,000
$10,000,000
$15,000,000
$20,000,000
$25,000,000
US$
Mill
ion
s
End 2017 %Growth 2017/2016
$-
$20,000
$40,000
$60,000
$80,000
$100,000
$120,000
$140,000
$160,000
US$
Mill
ion
s
Average TEV Average Market Cap

11
1.5. Capital structure analysis
In Figure 1.10, we observe that, on average, companies from emerging economies rely heavily on debt compared to equity. This discrepancy partly explains the differences in market capitalization observed above. For India and China, the average debt to equity ratio is very high, though U.S., French and U.K. companies also rely on debt for several reasons including low interest rates, lower perception of risk and a wider availability of financing options.
Figure 1.10. Capital structure analysis by country for non-financial companies in the 2018 Fortune Global 500
Note: Excludes financial services companies Source: Author’s analysis based on data from S&P Capital IQ—Fortune Global 500 Financials 2017, accessed by August 2018.
Higher interest rates in emerging economies cannot fully explain the above results. China is a notable exception, where low interest rates support high debt-to-equity ratios. In addition, many of China’s largest firms are SOEs, which do not rely on stock market financing. Despite high lending rates, Brazil’s debt to equity ratio is comparatively high. In both Brazil and India, stock exchanges are underdeveloped and there is little alternative to borrowing, no matter the interest rate. Brazilian MNCs have borrowed heavily through their subsidiaries abroad to circumvent high interest rates at home.
Compared to data from EMR 2017, China’s debt/equity ratio decreased substantially. The U.S. experienced a significant increase in its debt/equity ratio, while its debt/capital ratio was somewhat consistent. Brazil improved its debt/equity ratio while Russia tracked a substantial increase in both metrics.
Figure 1.11. Commercial bank prime lending interest rate* (%) from selected economies, estimated data 2017
The lending rate is the bank rate that usually meets the short- and medium-term financing needs of the private sector. This rate typically differentiates according to the borrower’s creditworthiness and financing objectives. The terms and conditions attached to these rates differ by country, however, limiting their comparability.
Source: Author’s analysis based on data from CIA World Factbook’s estimates for December 2017. Available at: https://www.cia.gov/library/publications/the-world-factbook/fields/2208.html, accessed by August 2018.
188%
115%108%
48%
84%
118%
137%
47%
82%
46%
127%
72%
51% 47% 45%32%
39%47%
55%
29%
44%
28%
131%
36%
0%
20%
40%
60%
80%
100%
120%
140%
160%
180%
200%
%Debt/Equity %Debt/Capital
63.30%
10.30% 9.45% 7.45% 4.30% 4.30% 3.40% 2.60% 1.80% 1.40%
Brazil Russia India Mexico China UnitedStates
Korea Switzerland Germany France

12
In the Fortune Global 500 ranking, regarding ownership, 79% of U.S. companies are public versus only 21% in China, while 47% of the Chinese companies are state-owned versus only 1% of the U.S. companies. If we add the 20% of Chinese companies that are public and also state-owned, we reach a total of 67% totally or partially state-owned. This type of ownership indicates the state’s important role in the capital structure, and partly explains the Chinese companies greater focus on revenues rather than profits.
Figure 1.12. Different types of ownership of U.S. and Chinese companies from 2018 Fortune Global 500
Source: Author’s analysis based on data from Capital IQ and companies’ websites, accessed by October 2018.
1.6. Conclusion
In the last year, eMNCs have continued to resonate across the global stage. Since 2008, China has led the charge as a rising number of its companies have ascended to the top ranks (by size) in many sectors.
Despite these gains, eMNCs differ from their G-7 counterparts. eMNCs’ profit margins are still generally lower than those of their developed market counterparts, and financing structures differ in every country, which makes, so far, maximizing profits less of a priority for eMNCs. Profit margins differences between Chinese and U.S. firms support this. Meanwhile, the average eMNC’s ROA is closer to that of their G-7 counterparts than in 2017.
While Western multinationals have focused on maximizing profits and value for shareholders, eMNCs have easier access to key resources such as cheap labor, and due to cost structure differences may not need to optimize profits or productivity per employee as much as U.S. or European companies, as we examine in Chapter 3.

13
REFERENCES Casanova, L.; Miroux, A. (2017). Emerging Market Multinationals Report: Emerging Multinationals in a Changing World. Emerging
Markets Institute. S.C. Johnson School of Management. Cornell University. http://bit.ly/eMNCreport
Casanova, L.; Miroux, A. (2016). Emerging Market Multinationals Report: The China Surge. Emerging Markets Institute. S.C. Johnson School of Management. Cornell University. http://bit.ly/eMNCreport
Cuervo-Cazurra, A. (2012), “Extending theory by analyzing developing country multinational companies: Solving the Goldilocks debate”, Global Strategy Journal, Vol. 2/3, Strategic Management Society, Chicago, pp. 153-167.
NOTES
1 EMI follows the UNCTAD definition of a multinational enterprise (MNC or transnational corporation, TNC, the term used by
UNCTAD) stating that a TNC is an enterprise which comprises entities located in two or more countries. 2 Fortune began ranking international companies prior to 1995, when the list took its current form. 3 This list includes 36 countries rather than the Fortune Global 500 38 for two reasons: we include Hong Kong companies as Chinese, and we list companies incorporated in Bermuda and the Dutch Antilles in their original company’s headquarters rather than Caribbean tax havens.

14
Annex 1.1. Top 20 E20 companies in 2018 Fortune Global 500
Rank Company Industry Revenues
($M) Profit
Margin HQ* Short Business Description Year**
2 State Grid Utilities $348,903 2.73% China State Grid China Co., Ltd. constructs and operates power grids in China.
2002
3 Sinopec Group Petroleum Refining $326,953 0.47% China China Petrochemical Corporation is a petroleum and petrochemical company operating in China and abroad.
1998
4 China National Petroleum Petroleum Refining $326,008 -0.21% China China National Petroleum Corporation produces and supplies oil and gas.
1955
12 Samsung Electronics Electronics, Electrical Equip.
$211,940 17.26% South Korea
Samsung Electronics Co., Ltd., together with its subsidiaries, engages consumer electronics, information technology and mobile communications, and device solutions businesses worldwide.
1938
23 China State Construction Engineering
Engineering & Construction
$156,071 1.71% China China State Construction Engineering Corporation Ltd. operates as an integrated construction and real estate company in China.
1982
26 Industrial & Commercial Bank of China
Banks: Commercial and Savings
$153,021 27.66% China Industrial and Commercial Bank of China Ltd. provides various banking products and services primarily in China and internationally.
1984
29 Ping An Insurance Insurance: Life, Health (stock)
$144,197 9.14% China
Ping An Insurance (Group) Company of China, Ltd. provides various financial products and services focusing on Insurance, Banking, Asset Management, and Fintech and HealthTech businesses in China.
1988
31 China Construction Bank Banks: Commercial and Savings
$138,594 25.86% China China Construction Bank Corporation provides various banking and related financial services in China.
1954
36 SAIC Motor Motor Vehicles & Parts $128,819 3.95% China SAIC Motor Corporation Ltd. researches, produces, and sells passenger and commercial vehicles in China.
1955
40 Agricultural Bank of China Banks: Commercial and Savings
$122,366 23.33% China Agricultural Bank of China Ltd. provides corporate and retail banking products and services in China and internationally.
1951
42 China Life Insurance Insurance: Life, Health (stock)
$120,224 0.22% China China Life Insurance Company Limited, together with its subsidiaries, operates as a life insurance company in China.
1949
46 Bank of China Banks: Commercial and Savings
$115,423 22.10% China Bank of China Ltd., together with its subsidiaries, provides a range of banking and related financial services in China and abroad.
1912
49 Gazprom Energy $111,983 10.94% Russia
Public Joint Stock Company Gazprom, an energy company, engages in the geological exploration, production, processing, storage, transportation, and sale of gas, gas condensates, and oil in Russia and internationally.
1993
53 China Mobile Communications
Telecommunications $110,159 9.92% China
China Mobile Communications Group Co., Ltd., through its subsidiaries, operates in LTE/fourth generation digital mobile telecommunication and fixed-line telecommunications businesses.
1997
56 China Railway Engineering Group
Engineering & Construction
$102,767 1.14% China China Railway Group Ltd., together with its subsidiaries, operates as an integrated construction company in China.
1950
58 China Railway Construction
Engineering & Construction
$100,855 1.30% China China Railway Construction Corporation Ltd., together with its subsidiaries, engages in the construction of infrastructure projects in China and internationally.
2007
63 Lukoil Petroleum Refining $93,897 7.65% Russia PJSC LUKOIL, together with its subsidiaries, engages in exploration, production, refining, marketing, and distribution of oil and gas.
1993
65 Dongfeng Motor Motor Vehicles & Parts $93,294 1.50% China Dongfeng Motor Group Company Ltd. manufactures and sells commercial vehicles, passenger vehicles, and auto engines and parts in China.
1969
72 Huawei Investment & Holding
Network and Other Communications Equipment
$89,311 7.86% China
Huawei Investment & Holding Co., Ltd., together with its subsidiaries, provides end-to-end information communication and technology (ICT) solutions for telecom carriers, enterprises, and consumers worldwide.
1987
73 Petrobras Petroleum Refining $88,827 -0.10% Brazil Petróleo Brasileiro S.A. — Petrobras operates in the oil, natural gas, and energy industries.
1953
Source: Authors’ analysis based on Fortune Global 500 data 2018, accessed by August 2018. -- *HQ: Headquarter country **: Year of foundation

15
Chapter 2
Chinese M&As: Facing policy headwinds
2.1. M&A trends by E20 firms
2.2. Chinese M&As facing policy changes
A. Chinese M&As: geographical and sectoral characteristics
B. Policy changes at home
C. Increased control and scrutiny in host countries
2.3. Conclusion
Executive Summary
Emerging market multinationals have sharply reduced their number of overseas mergers and acquisitions (M&As)
since 2017, a trend mirroring China’s decrease in M&A activity writ large. The chapter examines how China’s
overseas M&As were hit both by increased control and scrutiny at home and in host economies, and considers
whether Chinese M&As will continue to falter or expand.

16
Introduction
In 2017, E20 outbound M&As1 experienced the largest drop in value since 2000, a fall of almost 40% from an estimated $312 billion to $195 billion (Figure 2.1). In general, M&A transactions were on an upward trend since the turn of the century: in 2016, values were about 22 times their level 16 years earlier. While most of the E20 registered a decrease in the value of their outbound M&As, the sudden decline is largely the result of Chinese overseas acquisitions dropping off. Following two years of a buying spree, Chinese M&As fell by 40 % (from almost $250 billion in 2016 to about $150 billion in 2017) (Figure 2.2), with Chinese acquisitions of U.S. firms alone dropping by about 70%.
Figure 2.1. Total value of outbound M&A deals 2000-2017
Source: Authors’ analysis, based on data from Capital IQ (accessed July 2018). Note: data refer to announced deals.
Figure 2.2. Chinese outbound M&A value by region 2000-2017 (USD millions)
Source: Authors’ analysis, based on data from Capital IQ (accessed July 2018). Note: data refer to announced deals.
2.1. M&A trends for E20 firms
In the wake of the global financial crisis, Chinese firms began to acquire financially distressed firms in developed countries, progressively making China one of the top global acquirers. As of 2017, and in spite of the drop in M&A activity, China remains ranked second in terms of outbound M&As (Figure 2.3), with announced deals estimated at $153 billion. Accounting for about 40% of global acquisitions (in value), the U.S. continues to lead outbound M&A transactions. In 2017, its overseas acquisitions surged by 60%, by far exceeding all other countries. The decline in the Chinese share of the total value of outbound M&As by the top 10 investor countries from 19% to 12% (Figure 2.4) is mostly due to the U.S. surge.
$0
$100,000
$200,000
$300,000
$400,000
$500,000
$600,000
20
00
20
01
20
02
20
03
20
04
20
05
20
06
20
07
20
08
20
09
20
10
20
11
20
12
20
13
20
14
20
15
20
16
20
17
E20 Total
US
$0
$50,000
$100,000
$150,000
$200,000
$250,000
$300,000
20
00
20
01
20
02
20
03
20
04
20
05
20
06
20
07
20
08
20
09
20
10
20
11
20
12
20
13
20
14
20
15
20
16
20
17
Africa / Middle East
Latin American and Caribbean
Asia / Pacific
United Stated and Canada
Europe

17
Figure 2.3. Top 15 economies, other selected E20 by outbound M&A deals in 2017 (USD millions)
Source: Authors’ analysis, based on data from Capital IQ (accessed July 2018). Note: data refer to announced deals.
While the magnitude of their outbound M&A deals is much smaller, Korea and Mexico featured among the top 15 global investors in 2016. They dropped out of the group in 2017. Other major emerging economies like India and Brazil (the seventh and ninth largest economies in the world) have not emerged as significant global acquirers—or as global investors overall—at least relative to their size.
Figure 2.4. Outbound announced M&A deals from China as % of the total value of outbound M&A deals by top 10 investor countries
Source: Authors’ analysis based on data on M&A transactions from S&P Capital IQ (accessed July 2018). Notes: data refer to announced deals. China figures include transactions made by both China- and Hong Kong based-companies.
2.2. Chinese M&As face policy changes
Chinese M&As have faced increasing internal and external policy restrictions. At home, the Chinese government has placed tighter controls on foreign acquisitions; abroad, Chinese firms face widespread scrutiny (and
$1,107.29$1,222.51$2,332.90$4,455.14$8,475.63$9,383.74
$14,024.09$15,244.28$20,535.01$22,543.87
$33,825.06$34,965.77$35,107.84$41,173.65
$67,103.19$76,770.83
$99,053.72$113,682.59
$128,029.88$153,382.97
$511,756.68
$0 $100,000 $200,000 $300,000 $400,000 $500,000 $600,000
BrazilIndiaUAE
MexicoSaudi Arabia
Korea
AustraliaSwedenIreland
LuxemburgNetherlandsSwitzerland
SingaporeJapan
GermanyItaly
CanadaFrance
UKChina
United States
204,761511,757
2,893
153,383
0%
10%
20%
30%
40%
50%
60%
70%
80%
90%
100%
2000 2001 2002 2003 2004 2005 2006 2007 2008 2009 2010 2011 2012 2013 2014 2015 2016 2017
U.S. China U.K. France Canada Italy Germany Japan Singapore Switzerland

18
sometimes outright opposition) from host country governments. Characteristics of China’s unprecedented outbound M&A surge partly explain the cause for concern.
A. Chinese M&As: geographic and sectoral characteristics
Following the 2008 Global Financial Crisis, Chinese M&As have increasingly targeted developed countries, which largely explains the significant increase in the value of Chinese M&As over that period. In 2012, a peak year for such transactions, developed countries accounted for an estimated 80% value of acquisitions and for more than 60% during the 2015-2017 rebound. Among developed countries, Europe was the most important destination, accounting for about 37% of the value of all transactions from 2015-2017. In some ways, China’s outbound M&As mirrored the geographical breakdown of the U.S. outbound acquisitions. Europe accounted for about 78% of all U.S. outbound M&As over the same period (Figure 2.5).
Figure 2.5. U.S. outbound M&A value by region 2014-2017 (USD millions)
Source: Authors’ analysis, based on data from Capital IQ (accessed July 2018). Note: data refer to announced deals.
During the peak Chinese outbound M&A years, acquirers targeted strategically important sectors such as Energy, Industrials Materials and IT. These sectors accounted for about half of the acquisition value from 2014-2016 (Figure 2.6). This sectoral focus not only closely tracks U.S. outbound acquisitions (for which IT and Materials are important sectors (Figure 2.7), but also foreshadowed the sectors that the Made in China 2025 strategy would earmark. Due to such widespread acquisitions, many countries feared that their native technology sectors would fall under foreign control, leading to distrust from several developed nations towards Chinese M&As. At the same time, Real Estate was the largest sector, and would soon face new restrictions from the Chinese government, which was wary that transactions in this sector were for speculative reasons (see later in this chapter).
Figure 2.6. Sector distribution of Chinese M&As (2014-2017)
Source: Authors’ analysis, based on data from Capital IQ (accessed July 2018).
$0
$100,000
$200,000
$300,000
$400,000
$500,000
$600,000
2014 2015 2016 2017
Unespecified
Africa / Middle East
Latin American and Caribbean
Asia / Pacific
United Stated and Canada
Europe
Real Estate20%
Consumer Related 19%
Energy & Utilities 13%
Industrials 12%
Information Technology12%
Materials 11%
Financials 4%
Healthcare3%
Telecommunication Services
1%Unespecified
5%
Other13%

19
Figure 2.7. Sectoral distribution of U.S. M&As (2014-2017)
Source: Authors’ analysis, based on data from Capital IQ (accessed July 2018).
B. Policy changes at home
Chinese government policies have been instrumental in the country’s emergence as a powerhouse global investor. Since the 1990s, policies progressively evolved from restriction, to liberalization and then to outright support and encouragement, as we analyzed in previous EMI reports.2 The “Go Global” strategy, launched in 2000, marked the beginning of a phase of significant proactive support aimed at encouraging Chinese firms’ expansion abroad. In subsequent years, the strategy gained strength as part of China’s 12th Five-Year Plan (2011-15). The Ministry of Commerce, the National Development and Reform Commission, the Export-Import Bank of China, the China Development Bank and China Export and Credit Insurance Corporation all provided a network of administrative, financial and commercial support. The country also engaged in active investment diplomacy, marked by the Chinese President Xi Jinping visiting both Latin America and Africa three times since he took office (Latin America in 2013, 2014 and 2016 and Africa in 2014, 2016 and 2018). Finally, other government-led initiatives, such as the “One Belt and One Road Initiative (OBOR)”3 will likely fuel China’s continued OFDI expansion (see Chapter 1).
A dramatic surge of outbound M&As in 2015-2016 prompted the Chinese government to quickly shift course in order to stem the flow. Authorities were particularly concerned by the potential financial instability created by such massive capital outflows. They also feared that speculative rather than economic reasons motivated a number of transactions. Of special concern were cases of acquisitions outside the buyer’s core area of business—in real estate and entertainment, for instance, two industries that had seen a flurry of large deals. Subsequently, in the fall of 2016 the government announced stricter approval requirements for M&A deals4 and restricted real estate purchases abroad by State-Owned Enterprises (SOEs). In August 2017, they issued “guidelines on overseas investment” that classify overseas investments into three main categories: 1) encouraged investments; 2) restricted investments; and 3) prohibited investments. (See Box on China’s 2017 guidelines on overseas investment).
In December 2017, the National Development and Reform Commission, along with four other agencies, released a code of conduct for private companies investing abroad. Several highly leveraged and risky outbound acquisitions appeared to motivate this code, particularly targeting Chinese firms with a history of mega deals, such as Wanda, Fosun, HNA and Anbang. The new guidelines came after concerns that mega deals gone sour might disrupt the financial stability not only of these companies themselves, but also of the Chinese economy as a whole. As per the guidelines, Chinese firms should avoid high leverage financing and stay within their core area of activities, as well as respect local laws, including social and environmental standards. The new guidelines also require firms to report investment plans to the government and to seek approval for investments in “sensitive” countries or industries.5 While some observers note that the code of conduct does not consist of hard and fast rules,6 the warning to Chinese foreign investors is clear. A code of conduct for SOEs may also be in the works.
Healthcare35%
Consumer Related 18%
Information Technology11%
Materials 11%
Industrials 7%
Real Estate6%
Financials 6%
Energy & Utilities 4%
Telecommunication Services
1%
Unespecified 1%
Other18%

20
These policy shifts have not only tempered the acquisition fervor of Chinese investors, but also affected the confidence of their financiers. Thereafter, financing became harder to obtain, revealing in some cases that firms had overextended themselves. One such example is HNA, which was forced to rid itself of high-prized recent acquisitions. The Chinese airline conglomerate was one of the most prominent Chinese acquirers from 2015-2016, and was obligated to sell off assets in 2017-2018, including major real estate properties in the U.S., Hong Kong, and Australia, and some of its equity stakes in Deutsche Bank and other firms.
This OFDI policy shift is partly responsible for the above-mentioned drop in Chinese outbound M&As in 2017 and early 2018.7 In the medium term, however, the net effect of the new measures is uncertain. While speculative deals will likely face higher hurdles, the underlying economic motivations for increased outbound Chinese M&As remain the same. For companies, these motivations include easier access to resources, and in acquisitions in developed countries, access to markets, international brands, technology and expertise, as well as better ROA. On the government’s side, the overall objective is still that of an economy with high value-added sectors and a strong focus on innovation, as illustrated by the Made in China 2025 Plan. For instance, transactions that are “economically” sound or fall in line with the government policy of “strengthening cooperation” in high tech and manufacturing will likely benefit from the 2017 guidelines on overseas investment adopted.
C. Increased control and scrutiny in host countries
Serious obstacles also lie on the receiving end of Chinese outward investment as a number of countries, wary of Chinese investment, have introduced restrictions of their own on acquisitions by foreign investors.
Many countries instituted mechanisms for screening foreign investments. While such mechanisms have often been motivated by national security concerns, they increasingly reflect other considerations such as the protection of strategic industries, critical infrastructure and key technologies.8 In recent months in particular, developed countries have strengthened their screening mechanisms, partly as a reaction to the wave of Chinese investments in high tech and advanced manufacturing industries and in strategic sectors. For instance:
In Germany, the Chinese firm Midea’s 2016 acquisition of the robotics firm Kuka sparked strong objections from politicians and EU representatives. In response to concerns, Germany introduced changes in its Foreign Trade and Payments Ordinance in 2017, and as a result, the German government can now block certain acquisitions more easily based on security reasons.9 The government is reportedly considering lowering the threshold of participation by a non-E.U. buyer
China’s 2017 guidelines on overseas investment
“In August 2017, the State Council issued ’guidelines on overseas investment’ that formalized the fall 2016 announcements and clarified a number of issues. In line with the national economic and strategic interests of China, the guidelines classified overseas investments into three main categories: 1) encouraged investments; 2) restricted investments and 3) prohibited investments. Restricted investments include, among others, real estate, hotels, entertainment, and sport clubs—industries in which Chinese authorities flagged a number of deals as questionable regarding their true objectives and actual economic rationale. Outdated industries and projects in countries with no diplomatic relations with China or in regions suffering from high degrees of instability have also been restricted. Prohibited investments include, inter alia, investments in gambling and ’lewd industries’ as well as those that provide access to sensitive sectors such as core military. On the other hand, firms are encouraged to actively engage in investments that promote the Belt and Road Initiative (in particular in infrastructure and connectivity projects), as well as in investments that ‘strengthen cooperation with overseas high-tech and advanced manufacturing companies.’ They are especially incentivized to establish R&D centers abroad. For encouraged investments, the Chinese government intends to adopt a number of measures to provide, among others, further tax, exchange rate, insurance, and customs benefits.” Source: Emerging Market Multinationals Report 2017, Chapter 2, p. 41

21
for deals that can be subject to government veto, which would subject more transactions to security reviews.10
In France, the government introduced legislation in June 2018 to tighten screening mechanisms, specifically by extending the scope of sectors under consideration to better cover strategic industries. This legislation was still under review as of early September 2018.11
Following a 2017 Green Paper on National Security and Infrastructure Investment Review, the government of the United Kingdom introduced legislation to Parliament in 2018 that would strengthen the state’s ability to scrutinize foreign investment in innovative technology sectors on national security grounds.12
After France, Germany and Italy called for a debate on control and scrutiny of foreign takeovers in sensitive industries, the European Commission put forward a proposal in September 2017 for a regulation establishing a framework for screening FDI inflows into the EU on the grounds of security or public order. This proposal is currently under discussion.
In August 2018, the United States enacted the Foreign Investment Risk Review Modernization Act (FIRRMA), a legislation that expands the jurisdiction of the Committee on Foreign Investment in the United States (CFIUS) to address growing national security concerns over investment traditionally falling outside of CFIUS jurisdiction. Considered the most significant overhaul of the Committee since 1988, FIRRMA enlarges the scope of transactions reviewable by CFIUS, lengthens its review period, and mandates a separate process to review the export of sensitive U.S. technologies.13
Illustrating the changes currently under way, a number of foreign acquisitions by Chinese firms were either blocked or abandoned over the past 18 months. In 2017, 11 M&A deals worth $100 million or more were withdrawn for regulatory or political reasons, three of which were for explicitly stated national security concerns. Two of those related to the acquisition by Chinese buyers of U.S. companies in semi-conductors and digital mapping and software services (Lattice Semiconductor Corporation and Here International B.V., an IT-related company). During the first half of 2018, the trend accelerated with four mega acquisitions failing in the U.S. for clearly-stated national security reasons.14 Three of these acquisitions directly involved Chinese buyers: the takeover of MoneyGram International (financial services), Cogint Inc. (data services), and Xcerra Corporation (semi-conductor testing equipment). In addition, three deals were prohibited between December 2016 and March 2018 deals by U.S. presidential order—a practice little used in the past15—following recommendations by CFIUS (the deals were takeovers of Aixtron,16 Lattice and Qualcomm). Outside the U.S., the Australian government rejected high-profile transactions in 2016, such as the sale of a majority stake in Ausgrid, an electricity provider, to State Grid Corporation of China on national security grounds, too.17
2.3. Conclusion
The deceleration of Chinese outbound M&As has had echoing effects throughout the E20, as shown by the significant slowdown in emerging markets M&As in 2017. Chinese-led M&A transactions have faced a double blow of internal and external restrictions, likely a reaction to the incredible surge in outbound M&As from China in 2016. At home, the Chinese government shifted towards increased scrutiny. Abroad, host governments in a number of developed countries became increasingly hostile, making efforts to both monitor and control foreign acquisitions, often citing national security concerns.
- While the fall in Chinese overseas acquisitions has been drastic, whether the trend continues remains to be seen. All of the factors that led to the fast expansion of Chinese outbound M&As still remain in play. On the one hand, Chinese firms continue to look for new and innovative ways to expand into global markets. On the other, and despite increasing scrutiny, the Chinese government still encourages outbound acquisitions in line with its overall strategy for the transformation of the Chinese economy. Combined, these factors are powerful drivers for continued Chinese M&A, at a possibly lower but more sustainable level.
-

22
NOTES
1 In this chapter, unless otherwise specified, data refer to announced M&As. 2 For more details see Casanova, L. and A. Miroux, Emerging Market Multinationals Report 2016, Chapter 5; and, Emerging Market Multinationals Report 2017, Chapter 2. 3 The Chinese government launched the Belt and Road Initiative (BRI), formerly known as One Belt, One Road, in 2013. The BRI aims to foster integration and cooperation by building infrastructure, developing cultural exchange, and increasing trade among countries in Asia, the Middle East and North Africa along two axes: the Silk Road Economic Belt (essentially the original Silk Road) and the 21st Century Maritime Silk Road. For more information on the initiative, see D. Dollar, 2015, “China's rise as a regional and global power: The AIIB and the “One Belt, One Road” http://www.brookings.edu/research/papers/2015/07/china-regional-global-power-dollar, and S. Kennedy and D. Parker, “Building China’s 'One Belt, One Road’”, Center for Strategic and International Studies (CSIS), April 2015, https://www.csis.org/analysis/building-china’s-“one-belt-one-road”. 4 In fall 2016, Chinese authorities announced stricter approval requirements for M&A deals worth more than $10 billion (or $1 billion if the acquisition fell outside the investor’s core business area). See Emerging Market Multinationals Report 2017, Chapter 2, p. 41. 5 China Tightens Overseas Investment To Reduce Risks, Forbes, December 22, 2017, https://www.forbes.com/sites/sarahsu/2017/12/22/china-tightens-overseas-investment-to-reduce-risks/#c790bc772cfd. 6 China issues code of conduct for private firms investing overseas. Japan Times, December 10, 2017 https://www.japantimes.co.jp/news/2017/12/19/business/china-issues-code-conduct-private-firms-investing-overseas/#. 7 Using M&A microdata, such as those of the American Enterprise Institute, some observers estimate that 2018 Chinese outbound M&As may have been larger that indicated by official outflow data, and perhaps higher than in 2017. The increasingly important role that overseas subsidiaries of Chinese corporations have played in acquiring assets abroad could explain the divergence between China’s official outward FDI and such microdata. Official data would not capture such activities. Source: Alicia Garcia Herrero and Jianwei Xu, “China’s overseas mergers and acquisitions may not have slowed down in 2017 and will probably boom in 2018”, Natixis Research, July 19, 2018. 8 See UNCTAD, World Investment Report 2016. 9 Source: https://www.bakermckenzie.com/en/insight/publications/2017/10/germany-tightens-rules. 10 As of now, the government can block deals involving the purchase of at least 25 per cent of the equity of a German company by a non-EU entity if it endangers public order or national security. Under the new legislation, the threshold would be reduced to 15 per cent. Source : https://www.ft.com/content/6ff764e8-9a1c-11e8-ab77-f854c65a4465?ftcamp=crm/email/_2018___08___20180807__/emailalerts/Keyword_alert/product and Foreign Investment Control in EU becomes more stringent”, by Y. Makarova,O. Rochman and F. Helmstadter, August 9, 2018 at https://www.mofo.com/resources/publications/180808-foreign-investment-control-eu.html?utm_source=Mondaq&utm_medium=syndication&utm_campaign=View-Original 11 http://lcp.fr/actualites/loi-pacte-vers-un-controle-accru-des-investissements-etrangers-en-france 12 A white paper by the U.K. Department for Business, Energy and Industrial Strategy was presented to Parliament to further protect national security “from hostile actors using ownership of, or influence over, businesses and assets to harm the country. (“National Security and Investment: A consultation on proposed legislative reforms Presented to Parliament by the Secretary of State for Business, Energy and Industrial Strategy by Command of her Majesty”, July 2018, Ref: Cm. 9637P. 9). 13 Source: https://www.treasury.gov/resource-center/international/Documents/Summary-of-FIRRMA.pdf 14 Based on data from UNCTAD, World Investment Report 2018, tables III.2 and III.3. 15 The 2016 presidential order was the third order in about 25 years since 1990. 16 The presidential order blocked the sale of the U.S. portion of Aixtron SE, a German chipmaker. 17 https://www.nytimes.com/2016/08/12/business/dealbook/australia-china-ausgrid-nsw-sydney.html.
REFERENCES
Casanova, L. and A. Miroux, Emerging Market Multinationals Report, 2016 and 2017 Dollar, D. (2015), “China's rise as a regional and global power: The AIIB and the “One Belt, One Road” http://www.brookings.edu/research/papers/2015/07/china-regional-global-power-dollar Garcia Herrero A. and J. Xu, (2018) “China’s overseas mergers and acquisitions may not have slowed down in 2017 and will probably boom in 2018”, Natixis Research, July 19, 2018. Kennedy, S. and D. Parker (2015)“Building China’s 'One Belt, One Road’”, Center for Strategic and International Studies (CSIS), April 2015, https://www.csis.org/analysis/building-china’s-“one-belt-one-road”. National Security and Investment: A consultation on proposed legislative reforms Presented to Parliament by the Secretary of State for Business, Energy and Industrial Strategy by Command of her Majesty”, July 2018, Ref: Cm. 9637P. 9).

23
Chapter 3 Emerging market multinationals advance along the value chain
3.1. EMNCs continue to compete on price 3.2. Input costs by country: minimum wages, gasoline prices, and electricity 3.3. How far are emerging market brands from becoming brand leaders? 3.4. Conclusion
Executive Summary
This chapter builds on the 2017 EMR’s exploration of eMNCs as cost leaders. We survey the extent to which eMNCs are focusing on branding and product differentiation. While these companies retain their cost leader advantage based on low labor cost in their home countries, eMNCs are beginning to differentiate. In particular, Chinese companies are becoming innovation leaders in their own rights, moving beyond mere imitation of G-7 technologies. While we see a visible increase in the prices of some Chinese products compared to competing products from U.S. companies, we note that large Chinese eMNCs are still less efficient than their American counterparts in terms of revenues per employee. However, using the ‘return on Assets’ vs ‘return on employees’ comparison matrix, eMNCs appear equally as efficient as their U.S. and G-7 counterparts, even while the latter continues to outperform the former in brand-building. Analyzing the most valuable brands reveals that eMNCs, especially those from China, have yet to mirror their gains in the Fortune Global 500 list.

24
Introduction
In this chapter, we study the role that low-price points across products and services have played in the rise of eMNCs. eMNCs owe their reputation as cost leaders to several factors: 1) eMNCs typically have lower production costs than their G-7 counterparts; 2) eMNCs famously prioritize revenue and growth optimization over gross margins; 3) purchasing power is generally more limited in emerging economies, and as a result eMNCs are incentivized to design cost-effective products and services.
In the past, eMNC brands were little known outside of the domestic market. However, many eMNCs have sought brand equity to close the price gap with the G-7 multinationals. eMNCs, such as China’s Lenovo, Korea’s Samsung and Brazil’s Havaianas are becoming known as serious competitors in the international market.
3.1. eMNCs continue to compete on price
In this chapter, we update and compare different product and service categories across E20 and G-7 companies. Our analysis focuses on price competition in the world’s largest economy and the customers with the highest purchasing power. We chose a product or service based on:1
1) Comparable characteristics and functionalities; 2) Presence of G-7 and E20 companies that compete in the U.S. market; 3) Availability on e-commerce sites concurrently; 4) Availability to the U.S. consumers at the time of the research.
We analyzed products with high margins, requiring innovation and technological power to manufacture and
sell. This research was carried out in July and August 2018. In the figures that follow, we compare the following four product categories:
- Technology products: laptop and desktop computers, tablets and mobile phones; - White goods: compact refrigerators, microwave ovens, washing machines, air conditioners and televisions; - Apparel: polo shirts, flip flops and wearable devices; - Cars; - Airline tickets.
Figure 3.1.a. Laptop prices across top U.S. and Chinese brands for gaming, work, travel and home use (September 2018)
Source: Amazon U.S., www.amazon.com accessed in September 2018.

25
Figure 3.1.b. Laptop prices across top U.S. and Chinese brands for gaming, work, travel and home use (July 2017)
Source: Amazon U.S., www.amazon.com accessed in July 2017.
Figure 3.1.a lists prices for laptop brands across four different categories, taken from the e-commerce retailer Amazon. We differentiated data according to a set of laptop performance characteristics based on their intended uses: home, work, and gaming. The prices refer to the highest laptop price within the category for each brand.
We observe that Lenovo consistently offers the most expensive options in each category in 2018. In gaming and work product categories, prices comprise a narrow range, excluding Lenovo’s offering. Compared to 2017 in Figure 3.1.b, we see a clear change in price leadership. Due to brand-building, Chinese brands (especially Lenovo and Asus) are now the most expensive in three out of four categories, placing pressure on American companies such as Apple and Dell.
Figure 3.2. Desktop prices for top U.S. and Chinese brands (September 2018)
Source: Amazon U.S., www.amazon.com accessed in September 2018.
For desktop models, the U.S. brands are the most expensive in each category. Yet, we see that 2018 prices for Chinese brands are now on the heels of Apple, posing potential future challenges. Compared to 2017 (refer to Chapter 4, EMR 2017), American brands maintained higher prices, with Dell demonstrating price leadership followed by Apple in most categories.

26
Figure 3.3.a. Prices of cheapest and most expensive cellphones by brand for top U.S., Korean and Chinese brands (July 2018)
Source: Amazon U.S., www.amazon.com accessed in September 2018.
Figure 3.3.b. Prices of cheapest and most expensive cellphones by brand for top U.S., Korean and Chinese brands (July 2017)
Source: Amazon U.S., BestBuy and AT&T, www.amazon.com, www.att.com, and www.bestbuy.com accessed in July 2017 and 2018.
Comparing 2018 to 2017 prices on Amazon, we observe that American brands, especially Apple, held
relatively consistent. Chinese and Korean brands like LG (see box) generally raised prices for both low-end and high-end phones, indicating Chinese and Korean phones developed brand awareness and image.
Figure 3.4. Prices for the cheapest and most expensive tablets for top U.S., Korean and Chinese brands (September 2018)
Source: Amazon U.S., www.amazon.com accessed in September 2018.
$1,799.99 $ 1,649
$1,499.00
$1,298.99 $1,188.88
$749.99 $659.00 $619.00
$134.99 $ 139.99 $141.87 $240.00
$449.00
$ 129.99 $159.99 $193.90
$-
$200.00
$400.00
$600.00
$800.00
$1,000.00
$1,200.00
$1,400.00
$1,600.00
$1,800.00
$2,000.00
Huawei LG Samsung AppleIphone
Oppo Motorola Asus Xiaomi Mi
US$
China
USA
S.Korea
Dark Maximum Price
Light Minimum Price

27
Figures 3.3 and 3.4 track the prices of the latest versions of smartphones and tablets available on Amazon in the U.S. The prices are broken down according to brand, and the different configurations and aesthetic options available. In line with our prior analysis, depending on the distribution channel, we find that the most expensive brand is Apple (through AT&T and BestBuy), with remarkable differences among competitor brands. While Samsung sells the most smartphones worldwide, Apple retains the highest profit margins and valuations in the stock market. As of September 2018, Apple is the most valuable company in the world, surpassing the $1 trillion mark. Huawei has the distinction of selling both the highest priced item in the premium segment and the lowest priced item in the low-end market (on Amazon U.S.). The Huawei phone is the best-selling phone in China, the only market that it currently dominates. This dominance in the domestic market could be the starting point for further innovation and marketing campaigns abroad.
As of September 2018, we observe that smart phones are priced higher than tablets, but that Huawei is on track to close this price differential among the different segments. For smartphones, there are two distinct selling strategies: competition through pricing, such as the Chinese brands Oppo, Xiaomi or Asus, and competition through differentiation and branding, such as Apple, Samsung and Huawei exhibit.
Chinese smartphone brands such as OnePlus, Meizu, and Huawei continue to expand into Europe and the U.S. in addition to other emerging markets. While Huawei products are on Amazon, the U.S. government vetoed the 2017 agreement between AT&T and Huawei that offers Huawei products as part of a package. With the exception of Huawei, which has started to offer high price products, its American and Korean rivals provide similar features at much higher prices. These low-prices are the result of not only the low cost of materials, production and wages, but also by new business models and improved efficiency. All mobile manufacturers including Apple source most of their components from China, Vietnam or Southeast Asia and assemble at least part of their products there (though headquarters and design may be done in-house elsewhere). The higher purchasing power of American customers, as well as brand recognition and loyalty, can explain the willingness to pay higher prices in the U.S. market. But this willingness is not only found in the West: 20% of both Apple’s and Microsoft’s revenue come from China, where part of the population can afford higher prices. The current trade war between the U.S. and China may change this dynamic in unpredictable ways. (See Chapter 4 for more on this subject.).
Looking at 2017 data, we see a clear overall price increase across brands. However, the price of Korean and Chinese brands increased more substantially compared to the increase in the price of Apple’s iPad. This might indicate that eMNCs (especially Samsung) seek to catch up to Apple in terms of price leadership.
Figure 3.5 below demonstrates the average price (orange line) of the white good brands selected. Among Chinese brands, the price for refrigerators is lower than the average price from their American competitors. For televisions and air-conditioners, U.S. companies now compete on price with their Japanese and Chinese counterparts. In the case of televisions Korean companies set the highest prices. This trend is likely to continue as more G-7 companies find themselves obliged to compete on price.
Comparing the current data to 2017 prices (see Chapter 4, EMR 2017), television prices declined. The price of TV hardware may have declined due to the commoditization of TVs, as well as the prevalence of on-demand TV (such as HBO, Netflix, Hulu) and Internet providers that enable usage of computers and tablets instead of TV screens. For refrigerators and air conditioners, on average we observe similar prices as last year since refrigerators and air conditioners do not have comparable substitutes, and their use is generally consistent year-to-year.

28
Figure 3.5. Prices for white goods by Top U.S. and Chinese brands (USD), 2018
Source: Wal-Mart U.S.A, https://www.walmart.com/, accessed July 2018.
Figure 3.6 below offers an analogous price analysis for cars. As shown above, American brands such as
Chevrolet observe similar or even lower prices relative to those of Japanese or Korean brands. The Chinese automotive industry is still minimally present in G-7 markets. As the industry moves towards electric and self-driving vehicles, we anticipate a different competitive landscape. China is showing ambitious plans to expand into the electric car industry with companies like Nio, a company claiming to have cheaper and better cars than comparable U.S.-based Tesla, listed in NYSE in September 2018. In addition, Chinese powerhouse Tencent bought a 5% stake in Tesla in September 2017, posing another hint of Chinese companies’ renewed interest in electric cars. China is now the world sales leader of electric cars, and it may only be a matter of time before it has a sizeable world presence. In addition, Chinese electric buses are expanding into neighboring countries as other emerging markets seek to reduce city pollution. A recent joint venture between the Chinese auto manufacturer BYD and the Brazilian Marcopolo to manufacture electric buses in Brazil also shows promise.
Looking at last year’s data, (see Chapter 4, EMR 2017), we observe that there was a general substantial increase for all sedan brands except for Chevrolet, Infiniti and Genesis, which held their leads. (This indicates that eMNCs seek to compete in areas other than price.) For the coupe category, the prices of Infiniti and Chevrolet held consistent. However, Nissan’s prices jumped substantially, rendering it the market leader in price. Lastly, for basic SUVs and luxury cars, all carmakers raised their prices in the same proportion.

29
Figure 3.6. Prices for various cars by top U.S. and E20 brands in USD (September 2018)
Source: Edmunds.com accessed on September 2018.
Figure 3.7. Comparison of apparel, wearables and sports shoes prices between leading brands in emerging countries and in the G-7, July 2018
Source: www.amazon.com accessed by July 2018.

30
As shown above in Figure 3.7, Chinese multinationals compete mainly on price in the sports merchandise and wearables market. It is clear that Chinese brands are cheaper than those of American competitors in all categories observed. Indeed, American prices are two to seven times higher than Chinese ones. The same discrepancy is visible when one compares Brazilian Havaianas to American flip-flops brands; few brands (e.g., the Argentinian Brand La Martina) make an exception.
Turning to airline price comparisons in Figures 3.8 and 3.9, Chinese airlines charge lower prices relative to American carriers, even as the airline industry becomes increasingly competitive. To date, Middle Eastern airlines such as Etihad, Emirates and Qatar rank among the best airlines in the world. The arrival of young eMNCs in the airline industry in the U.S. and Europe has only occurred within the last five to 10 years. We observe a similar trend with Latin American companies. In this year’s analysis, we added Chilean Latam Airlines to the dataset; looking at Figures 3.10.a and 3.10.b, we note a price difference between Latin American and U.S. carriers. We expect that we have only observed the beginning of competition between G-7 and E20 brands and services; the above exercise should ideally be replicated on a much larger sample.
Figure 3.8. Airfare comparison of roundtrip prices between Chinese airlines and American carriers in economy class, July 2018
Source: Authors’ analysis based on Expedia website for direct roundtrip flights departing on October 6, 2018 and returning October 13, 2018, www.expedia.com, accessed July 2018.
Figure 3.9. Airfare comparison of roundtrip prices between Chinese airlines and American carriers in business class, July 2018
Source: Authors’ analysis based on Expedia website for direct roundtrip flights departing on October 6, 2018 and returning October 13, 2018, www.expedia.com, accessed July 2018.
US
China
US
China

31
Figure 3.10.a. Airfare comparison of roundtrip prices between Latin American and American carriers in economy class, July 2018
Source: Authors’ analysis based on Expedia website for direct roundtrip flights departing on October 6, 2018 and returning October 13, 2018, www.expedia.com, accessed July 2018.
Figure 3.10.b. Airfare comparison of roundtrip prices between Latin American and American carriers in business class, July 2018
Source: Authors’ analysis based on Expedia website for direct roundtrip flights with departing on October 6, 2018 and returning October 13, 2018, www.expedia.com, accessed July 2018.
3.2 Comparing input costs and efficiency of resources used by company
Since wages, gasoline prices and electricity constitute an important part of a product’s cost, it is worth
analyzing their contribution to the prices of products and services from eMNCs and their G-7 counterparts.
Figure 3.11 shows that input prices are a clear advantage for Chinese, Indian and Brazilian companies compared to G-7 counterparts. In these countries, the cost of labor is lower and energy prices are competitive, affording companies more flexibility when pricing their products, and providing them with the conditions to compete on price. On the other hand, minimum wages are substantially higher in Germany, South Korea, the U.S. and Japan, and high electricity costs contribute to higher priced goods and services in those countries.
US
L.A.
US
L.A.
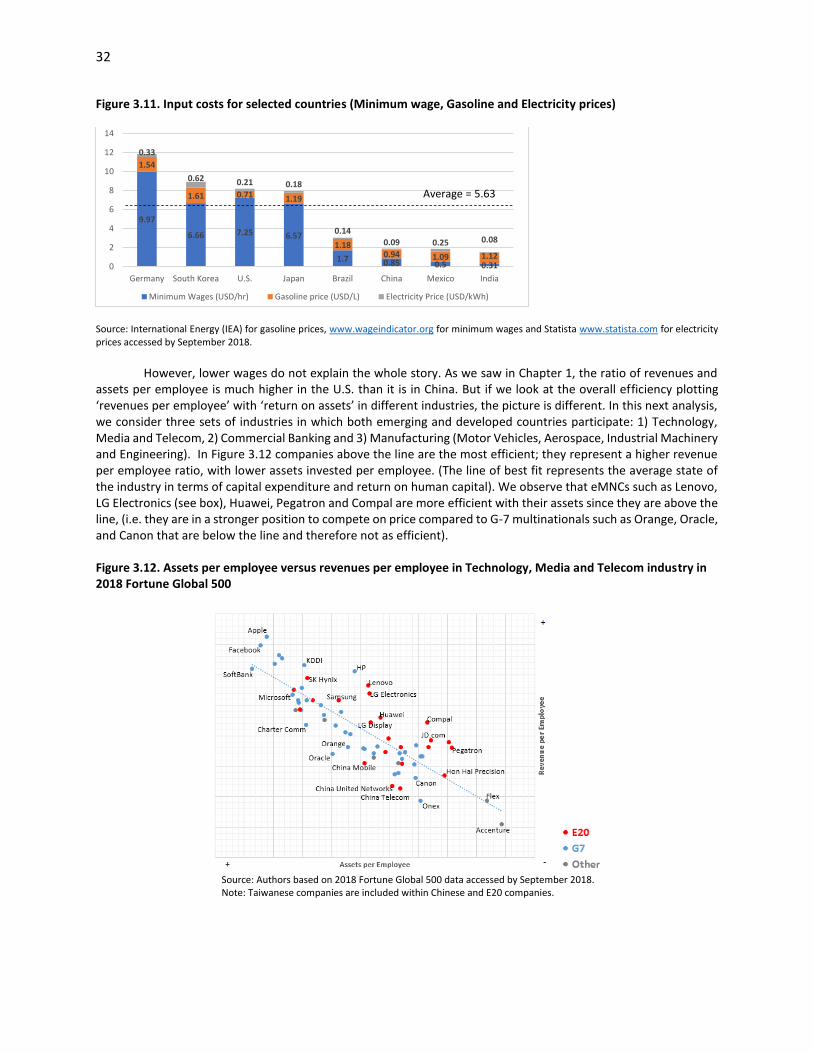
32
Figure 3.11. Input costs for selected countries (Minimum wage, Gasoline and Electricity prices)
Source: International Energy (IEA) for gasoline prices, www.wageindicator.org for minimum wages and Statista www.statista.com for electricity prices accessed by September 2018.
However, lower wages do not explain the whole story. As we saw in Chapter 1, the ratio of revenues and
assets per employee is much higher in the U.S. than it is in China. But if we look at the overall efficiency plotting ‘revenues per employee’ with ‘return on assets’ in different industries, the picture is different. In this next analysis, we consider three sets of industries in which both emerging and developed countries participate: 1) Technology, Media and Telecom, 2) Commercial Banking and 3) Manufacturing (Motor Vehicles, Aerospace, Industrial Machinery and Engineering). In Figure 3.12 companies above the line are the most efficient; they represent a higher revenue per employee ratio, with lower assets invested per employee. (The line of best fit represents the average state of the industry in terms of capital expenditure and return on human capital). We observe that eMNCs such as Lenovo, LG Electronics (see box), Huawei, Pegatron and Compal are more efficient with their assets since they are above the line, (i.e. they are in a stronger position to compete on price compared to G-7 multinationals such as Orange, Oracle, and Canon that are below the line and therefore not as efficient).
Figure 3.12. Assets per employee versus revenues per employee in Technology, Media and Telecom industry in 2018 Fortune Global 500
Source: Authors based on 2018 Fortune Global 500 data accessed by September 2018. Note: Taiwanese companies are included within Chinese and E20 companies.
9.97
6.66 7.25 6.57
1.7 0.85 0.5 0.31
1.54
1.61 0.71 1.19
1.180.94 1.09 1.12
0.33
0.62 0.21 0.18
0.140.09 0.25 0.08
0
2
4
6
8
10
12
14
Germany South Korea U.S. Japan Brazil China Mexico India
Minimum Wages (USD/hr) Gasoline price (USD/L) Electricity Price (USD/kWh)
Average = 5.63

33
As in the previous figures, we can see in Figure 3.13, how emerging multinationals, in this case Brazilian banks (see box on Bank Itau), stand out as the most efficient in Commercial Banking in terms of resource utilization efficiency, followed by German DZ Bank and the Netherlands’ ING Group.
Figure 3.13 Assets per employee versus revenues per employee in Commercial Banking in 2018 in the Fortune Global 500
Source: Authors based on 2018 Fortune Global 500 data accessed by September 2018.
LG Electronics http://www.lg.com LG Electronics Inc. manufactures and sells consumer electronics, mobile communications devices, and home appliances worldwide. Based in Seoul, Korea. It was founded as Goldstar in 1958, but changed its name to LG Electronics Inc. in 1995. The company is divided into four units: Home Appliance and Air Solution, Home Entertainment, Mobile Communications, and Vehicle Components. The Home Appliance and Air Solution segment produces refrigerators, washing machines, dishwashers, cooking appliances, vacuum cleaners, built-in appliances, air conditioners, air purifiers, and dehumidifiers. The Home Entertainment sector manufactures TVs, audio and video, monitors, PCs & accessories, and commercial products. The Mobile Communications division provides phones such as the G Series, V Series, F Series, and L Series II. Its Vehicle Components segment offers in-vehicle infotainment as well as vehicle engineering. LG electronics, operating under the greater LG Corporation, aims to improve the daily lives of their customers through technological innovation. LG electronics has a strong global presence, as it controls more than 100 subsidiaries throughout Asia, Central and South America, the Middle East, Africa, North America, and Europe.
Fortune Global 500 2017: #201 Ownership: Public/Private Founded: 1958 Chairman: Jo Seoung-Jin Industry: Electronics Employees: 85,905 Revenue ($bn): $54.3 Assets ($bn): $38.5 Ticker: A066570 (KOSE)
Source: Capital IQ and company website accessed by September 2018.
In Figure 3.14, we observe that companies like the Chinese Guangzhou Auto industry and Dongfeng Motor or SAICMotor (see box) are well positioned to compete on price, unlike many of their G-7 counterparts such as the

34
German auto manufacturer BMW, American GE or the French Renault. However, G-7 companies are consistently efficient overall in the manufacturing space.
Figure 3.14. Assets per employee versus revenues per employee in Manufacturing (Motor Vehicles, Aerospace, Industrial Machinery and Engineering) industry in the 2018 Fortune Global 500
Source: Authors based on 2018 Fortune Global 500 data accessed by September 2018.
Banco Itaú http://www.itau.com.br
Banco Itaú, a private banking company headquartered in Sao Paulo, provides banking and financial services to individuals, institutions, corporations, and enterprises. It was founded in 1945 and merged with Unibanco in 2008 to form Itaú Unibanco Holding. Itaú Unibanco is the largest private sector bank in Brazil, operating through a network of 4,981 branches. In addition to its strong presence in Brazil, Banco Itaú also operates abroad in 18 countries in the Americas, Europe, and Asia. Its three main segments include: Retail Banking, Wholesale Banking, and Corporate banking. Its Retail Banking segment primarily offers banking products and services to retail clients, high net worth clients, and corporate clients. The Wholesale Banking segment offers products and services to middle-market companies and institutional clients. This segment is also responsible for commercial operations and investment banking services. The company’s Activities with the Market and Corporation segment manages the financial results associated with credits and debts. Banco Itaú offers payroll, mortgage, personal, vehicle, and corporate loans, as well as small, and middle market loans. In addition to loans, it also provides credits cards; investment and private banking services; property, casualty, and life insurance products; reinsurance products; and private pension plans and premium bonds. Banco Itaú has a number of subsidiaries, its most notable being Rede.
Fortune Global 500 2017: # 113 Ownership: Private and Public Founded: 1945 Chairman: Candido Botelho Bracher Industry: Financial Employees: 99,332 Revenue ($bn): $66.3 Assets ($bn): $432.7
Source: Capital IQ and company website accessed by September 2018.

35
SAIC Motor
http://www.saicmotor.com SAIC Motor researches, produces, and sells both passenger and commercial vehicles. The company operates through two segments, Vehicles and Parts, and Financing. The Vehicles and Parts segment focuses on automobile spare parts, including engines, transmissions, power trains, chassis, interior and exterior trim, and electronic appliances. SAIC Motor’s Financing segment is involved in services, trading, and financial investment related to automobiles. The group went public in 2011, and since then has become the largest auto group on China’s A-share market, as its revenue has progressively increased every year since 2005.
SAIC Motor operates through a number of subsidiaries in a variety of countries throughout the world, and is present in Asia, North America, South America, Africa, Europe, and Australia. The company’s notable locations include Sydney, Johannesburg, Hong Kong, Silicon Valley, and Santiago.
Fortune Global 500 2017: 41 Ownership: Public/State-Owned Founded: 1955 Chairman: Hong Chen Industry: Motor Vehicles & Parts Employees: 180,749 Revenue ($bn): $128.82 Assets ($bn): $111.11
Source: Capital IQ and company website accessed by September 2018.
3.3. How far are emerging market brands from becoming brand leaders?
To further understand why eMNCs have long competed on price while American and European firms have competed on differentiation and branding, we investigate the presence of eMNCs in international brand rankings. Specifically, we focus on the Brandirectory of the 500 most valuable brands and BrandZ, which ranks the 100 most valuable brands. The former ranks companies by assigning an economic valuation based on how much a company can charge for a product or a service due to its brand recognition (e.g. Coca-Cola, Google, Facebook and Apple). Creating a valuable brand is part of the primarily G-7 firm strategy to compete by differentiation. Figure 3.15 illustrates this. In what follows, we showcase additional trends that BrandZ reports about the brand presence of eMNCs relative to G-7 firms.
Figure 3.15. Top 500 (Brandirectory) and top 100 (BrandZ) global brands and their distribution by countries
Source: Top 100: BrandZ www.brandZ.com, accessed by July 2018. Global 500 2018: BrandFinance, Brandirectory www.brandirectory.com/league_tables/table/global-500-2017, accessed by July 2018.
G777%
E2018%
Other 5%
Top 100 Global Brands in 2018 According to BrandZ
G768%
E2021%
Other11%
Top 500 Global Brands in 2018 According to Brandirectory
1%22%
1% 3%25%
1%13%
2% 3%
39%
0%15%
1% 1%
55%
0%
50%
100%
Brazil China India S.Korea United States
Number and Percentage of Companies in Fortune Global 500, Brandirectory Top 500 and BrandZ Top 100 Rankings
Fortune 500 Top 500 BrandDir Top 100 BrandZ

36
As shown in above Figure 3.15, the G-7 economies dominate brand recognition, with clear advantages in both rankings. They occupy 68% of the Brandirectory ranking and 77% of the BrandZ. Meanwhile, E20 companies exhibit a poor presence in the ranking. Despite this, we observe that E20 brands are more represented this year in the top brands rankings than in 2017. To understand the relevance of this data, it is important to compare this with the presence of eMNCs in the Fortune Global 500 list.
In Figure 3.16, we find a notable difference in the concentration of E20 versus G-7 companies between the Fortune Global 500 and Brandirectory. The U.S. has 126 companies in the Fortune Global 500 list and 193 companies in Brandirectory. While the number of Chinese companies in the Fortune list is converging with the number of U.S. companies in the same list, Figure 3.16 shows that there is still a long way to go before the Chinese companies catch up with the brand equity and recognition U.S. companies exhibit. They have caught up to American companies in both revenue and size, but do not yet rival American companies in terms of differentiation. Data from 2017 demonstrated a similar relation (see Chapter4, EMR 2017).
Most Chinese companies, however, are much younger than their American counterparts and the playing field of global competition is still a new one to them. Given that fact, it is no small feat that Chinese companies have made great strides in brand value, albeit in smaller numbers. For instance, the Chinese bank ICBC was ranked 10th in brand value for 2018, just 35 years after its foundation. An even more remarkable example is that of China Mobile, which occupied 15th place in 2016 with just 20 years in operation.
Figure 3.16. Number of U.S. and Chinese companies in Fortune Global 500 and Brand Value 500 Rankings, 2018
Source: Authors based on data 2018 Fortune Global 500, Brandirectory’s Global Brand 500 www.brandirectory.com/league_tables/table/global 500-2018 and BrandZ www.brandZ.com accessed on July 2018.
In addition, based on the different brand ranking lists over time, we observe an upward trend of E20 brands and a clear increase in representation from last year’s ranking: as shown in Figure 3.17, the E20 now amounts to 21% of the top 500 brands in the world in Brandirectory, up from 12% in 2009. G-7 brands still account for more than two thirds of the companies, but the percentage of G-7 brands in the ranking has slightly decreased. Further analysis of this progress is likely to uncover more insights into how eMNCs are working to grow their business operations internationally.
11166
15
126193
55
Fortune 500 Top 500 BrandDir Top 100 BrandZ
China United States

37
Figure 3.17. Share of E20, G-7 and rest of the world in top 500 Brands (2018)
Source: Global 500 2018: BrandFinance, Brandirectory www.brandirectory.com/league_tables/table/global-500-2018 accessed by July 2018.
Between 2009 and 2017, the G-7 maintained a stranglehold on the top 10 global brands (Figure 3.18). E20 brands have all improved, but have not been unable yet to challenge the G-7 brands in recognition. However, Samsung, along with the ICBC, China Mobile and China Construction Bank are now among the top 15 best ranked brands in the world and keep improving with respect to last year’s ranking (see EMR 2017). The top Chinese brands in particular have made significant gains (see figure 3.18).
Figure 3.18. Rank of top 10 brands in E20, G-7 and rest of the world 2009-2017
Source: Global 500 2018: BrandFinance, and Brandirectory www.brandirectory.com/league_tables/table/global-500-2018, accessed by July 2018. Note: numbers on the left indicate rankings
China, Korea and India are the E20 countries with the largest number of companies in the rankings with the most recognized brands. All of China’s top 10 brands are in the top 50 positions (see Figure 3.19). Meanwhile, Korea has Samsung ranked among the top 50, and only Hyundai and LG are among the top 100. This data is consistent with last year’s findings and indicates that there is still progress to be made for eMNCs to truly compete on brand.
12% 21%
73% 68%
15% 11%
0%
20%
40%
60%
80%
100%
2009 2018E20 G7 Other Countries

38
Figure 3.19. Top 10 brands for China, Korea and India 2018 China Korea India
2018 Rank Brand 2018 Rank Brand 2018 Rank Brand
10 ICBC 4 Samsung 104 Tata Group
11 China Construction Bank 79 Hyundai 252 Airtel
12 AliBaba 88 LG Group 287 Infosys
13 China Mobile 113 SK Group 292 LIC
18 Bank of China 335 KT 334 State Bank of India
19 State Grid 340 SK Hynix 390 HCL Technologies
21 Tencent 349 Korea Electric Power 427 Indian Oil
25 Huawei 385 Kia Motors 445 Reliance Industries
26 Agricultural Bank of China 387 KB Financial 464 Larsen & Toubro
30 Ping An 409 Lotte Group
Source: Global 500 2018, BrandFinance, Brandirectory www.brandirectory.com/league_tables/table/global-500-2018, accessed by July 2018.
3.4. Conclusion
Following the trend of the previous two years, eMNCs have had greater success positioning their brands on the global stage. In this year’s report, we tracked how eMNCs leveraged their unique strengths to become cost leaders in their industries. In prior years, we watched eMNCs compete as low-cost alternatives to their G-7 counterparts. To accomplish this, they focused on driving efficiency and productivity across supply chains and building brand recognition in their home countries, at the expense of global branding recognition. This trend is now beginning to reverse. The prices of some eMNC consumer market products are rivaling G-7 brand leaders, as seen above, and have already matched them in some product categories. In the case of TV sets for example, the price differential is no longer an emerging economy advantage. As eMNCs transition to the global stage, companies like Lenovo, Samsung, Huawei and Havaianas are leading the way with a greater focus on branding.
The cheap labor advantage that has long been the bedrock of Chinese manufacturing success is slowly eroding. Factory managers in China are finding it harder to retain workers, whose wages are becoming increasingly expensive. In turn, this has led to increased interest in automation across Chinese factories. While China initially began manufacturing components and assembling systems for Western brands, Chinese companies have honed their expertise to build scale and experience.
Previously, E20 companies learned from their Western competitors’ materials engineering and industrial engineering capabilities to enhance the quality of their own products and systems. In the process, the E20 firms have developed their own capacity to innovate. In this atmosphere, Chinese companies in particular have emerged as formidable competitors.
Similar to the findings from last year, we note that large Chinese eMNCs are less efficient than their American counterparts in terms of revenues/employee. This year we also plotted the firms based on return on assets vs. return on employees. On this comparison metric, eMNCs appear equally as efficient as U.S. and G-7 companies. However, MNCs from G-7 nations still outperform their counterparts from emerging markets on building brands. According to our analysis of the world’s most valuable brands, eMNCs, especially those from China, have yet to mirror their gains in brand value.
NOTES
1 To avoid, one-day price distortions, we avoided major online sales. Instead, we examine overall prices and tendencies. However, we may also observe short-term price swings.

39
Chapter 4 Emerging economies progress amidst a changing paradigm
4.1. Growth forecasts still positive, but serious risks loom 4.2. Emerging economies have maintained a key role in a fragile global FDI landscape 4.3. The protectionist wave 4.4. Conclusion
Executive Summary As in previous EMRs, we examine the role of emerging economies in the global FDI landscape and analyze the growth and economic performance of emerging economies. This year, we also pay particular attention to factors progressively disrupting the global trade system: financial instability affecting some regions, and the escalating trade tensions that have developed since early 2018.

40
Introduction
Previous EMRs have highlighted emerging economies’ role in the global economy and the rapid and remarkable changes in the past two decades that have led them to rival the global economic powers (Figure 4.1). In 2000, seven emerging economies were among the 20 largest world economies; today, they make up almost half, with several of them in the top ranks. China is on track to top the list.1
Against this backdrop, we consider recent developments in emerging markets’ performance in the global economy, including as global investors. We also highlight the profound transformation underway in the global trade system as protectionism gains ground.
Figure 4.1. Top 20 economies GDP (USD Billions)
Source: Based on data from World Development Indicators, accessed July 2018. Key: Red indicates E20.
In carrying out our analysis, as in previous reports, we draw on the E20 (Figure 4.2)—a group of top 20 emerging economies selected based on GDP, demography, and weight in their region and the global economy.2
4.1. Growth forecasts still positive, but serious risks loom
Largely led by investment recovery, 2017 was a growth year for the global economy: the growth rate reached 3.1%, a significant acceleration compared to just 2.4% in 2016, and the highest rate since 2011.3 Advanced economies performed better than expected, achieving 2.3% growth, and a 0.6% increase over the previous year.4 This trend also reflects robust growth in Asia overall and signs of recovery among commodity exporters as commodity prices exhibit a partial rebound. Altogether, emerging market and developing economies grew by 4.3% in 2017, compared with 3.7% in 2016. The growth rates of many E20 countries moved into positive territories (such as in Argentina, Brazil, Nigeria, Russia), or registered much higher growth than in 2016 (such as in Turkey, Malaysia and Poland) (see Annex Table
2000 2017 United States 10,285 United States 19,053 Japan 4,888 China 11,972 Germany 1,950 Japan 5,033 United Kingdom 1,648 Germany 3,561 France 1,368 United Kingdom 2,714 China 1,211 France 2,525 Italy 1.142 India 2,415 Canada 742 Italy 1,904
Mexico 684 Brazil 1,814 Brazil 655 Canada 1,571 Spain 595 Korea, Rep. 1,455 Korea, Rep. 562 Russian Federation 1,302 India 462 Spain 1,267 Australia 415 Australia 1,232 Netherlands 413 Mexico 1,068 Argentina 284 Indonesia 980 Turkey 273 Turkey 928 Switzerland 272 Netherlands 796 Sweden 260 Switzerland 685 Russian Federation 260 Saudi Arabia 642
Figure 4.2. The E20 emerging economies ranked by nominal 2017 GDP (in USD millions and GDP/capita)
Source: Based on data from World Development Indicators, accessed July 2018.

41
4.1). Overall, the growth rates of many E20 countries continue to significantly exceed those of advanced economies (Figure 4.3).
In spite of a softening of the global growth during the first half of the year, short-term forecasts as of June 2018 remain relatively optimistic, predicting that global growth will remain at around 3% in 2018-2019.5 A projected growth pickup in emerging market and developing economies, as well as resilient growth in advanced economies, accounts for this trend. Advanced economies are expected to grow at 2.2% in 2018 and 2.0% in 2019 (with a relatively good performance expected for the U.S.,6 but their medium-term growth outlook is more subdued at 1.7%.7 On the other hand, emerging markets’ and developing economies’ growth is projected to rise to 4.5% in 2018 (from 4.3% in 2017) to 4.7% in 2019, and predicted to stabilize at around that level over the medium-term, widening the performance gap between advanced and developing economies. Two-thirds of the E20 are expected to substantially improve their performance relative to the trough they experienced from 2015-2016. China’s growth, however, is forecast to slow to 6.3% by 2019, while India is likely to wrest the title of fastest growing economy (with 6.7% registered in 2017, and 7.3% and 7.5% forecast for 2018-2019) (Table 4.1 in Annex).8
Despite these figures, serious risks loom, which may prove increasingly consequential for emerging economies.
One such risk is that of global debt. Debt is at a record high, in both advanced and emerging economies. While the former is responsible for most of this debt, the latter has contributed to the recent increase in the global debt-to-GDP ratio (225% in 2016, compared to about 200% in 2013).9 In its April 2018 Fiscal Monitor Report, the IMF highlighted the important role public debt plays in global debt. In emerging markets and middle-income economies, public debt (at almost 50% of GDP on average) has reached levels close to those during the 1980s debt crises.10 While these debt-to-GDP ratios are still far below those of advanced economies, their rapid rise is concerning. Since 2010, for instance, the ratios of public debt to GDP increased by at least 30% for two-thirds of the E20.11 In the case of private debt, emerging economies—largely led by China—are behind the significant increase in non-financial private debt over the past decade. In fact, the emerging economy private-debt-to-GDP ratio doubled to 120% since 2010.12 In addition, the significant share of foreign currency debt in several emerging economies renders them particularly vulnerable to
Figure 4.3. E20 and G-7 growth rates: various periods and 2016-2017, and forecast for 2018-2019
Source: Authors’ analysis based on data from Annex Table 4.1.

42
exchange rate fluctuations. In Turkey and Mexico, for instance, the amount of debt denominated in foreign currencies (dollars, euros and yen) reaches 25% and 20% of GDP, respectively, with the dollar accounting for the largest share in Mexico’s case.13
Financial instability resulting from a less accommodative monetary policy in advanced economies, higher U.S. interest rates and a rising dollar is another serious threat. Post-global financial crisis, and up to 2015, the U.S. Federal Fund rates remained low: they never exceeded 0.20%. In December 2015, however, the U.S. Federal Reserve started tightening its monetary policy. Since then, it raised the Fund rate seven times. As of July 2018, the rate is about four times its level two years ago (between 1.75% and 2.00%).14 Further hikes are expected, which could bring the Fund rate to 3-4% by 2019.15 Attracted by higher U.S. interest rates, investors switch to dollar denominated assets, which has the potential to trigger massive capital flights and sharp currency depreciation, as was the case during previous financial crises. This switch significantly increases the external debt burden of those countries that have a large amount of dollar denominated debt. Since January 2018, it is estimated that six major emerging markets (Korea, India, Indonesia, Philippines, Taiwan and Thailand) suffered from one of their larger instances of capital flight since 2008.16
While most E20 economies have seen their exchange rates affected by rising interest rates, the impact has been particularly acute in countries already faced with economic or political challenges. In Brazil and Mexico, for instance, investors have been closely following presidential elections that they feared could bring to power populist candidates.17 Grieved by large fiscal deficits, Argentina is facing serious difficulties implementing its economic reform program and putting public finances on a healthier footing. In spite of a $50 billion rescue package, the country’s currency has been in a downward spiral since early 2018. In Turkey, a combination of economic and political factors pushed the lira further down.18
The fall has been dramatic for some currencies. By September 2018, the Argentinean peso had lost over half its value against the dollar since the beginning of the year, becoming the world’s worst performing currency. The Turkish lira, the second most affected currency, had lost about 40% (Figure 4.4). The Brazilian real—having fallen by 27% against the dollar since early January 2018—was at a two-year low by September 2018. The Mexican peso lost almost 15% in value against the dollar in the three months up to mid-2018, just before the presidential election, a period also marked by significant uncertainty regarding commercial relations with the U.S.19 The South African rand, whose exchange rate to the dollar had risen since the end of 2017, began again to fall in April 2018; as of mid-September its value to the dollar had dropped by 20%. Asian currencies have also suffered, though to a lesser extent: The Indian rupee for instance fell to an all-time low against the U.S. dollar in early September 2018, having lost about 12% since the beginning of the year, but the Indonesian rupiah also dropped to its weakest level since the 1998 Asian financial crisis. The extent of the volatility, and the extreme examples of Turkey and Argentina, have analysts questioning the potential for contagion and wider-spread economic consequences.20 Not all observers agree on a resulting contagion effect, however. Pointing to the diversity of emerging economies and the fact that many of them are in a better shape than twenty years ago,21 a number of analysts suggest that investors should take a more sober attitude. A contagion effect—as during the 1998 Asian financial crisis—is not evident.
Figure 4.4. % Decline in value of selected emerging market currencies against the dollar (Jan-Aug 2018)
Source: Authors based on data from Bloomberg Terminal at Cornell University, accessed by August 2018.
-9.5
-11.8
-19.6
-27
-40.6
-54
Indonesian rupiah
Indian rupee
South African rand
Brazilian real
Turkish lira
Argentinian peso

43
Finally, particularly damaging is the risk of a major disruption—if not collapse—of the global rule-based trade system resulting from the looming trade war between the largest global economies. We explore this dramatically intensified risk later in this chapter.
4.2. Emerging economies have maintained a key role in a fragile global FDI landscape
Amidst a major drop of 23% in 2017 global FDI flows, the largest in the past ten years, FDI flows to emerging economies recovered to their 2015 level of $429 billion (Figure 4.5). Flows to developed countries—which fell by 40% due to a significant decline in M&As—were largely responsible for the drop in global FDI. As a result, the share of emerging economies in global inward FDI rebounded: FDI to the E20, for instance, reached almost a third of such flows, back to their 2013-2014 levels. Indonesia, Thailand, and Argentina in particular recorded substantial increases.22 However, several E20 did not escape the global decline: Chile (-40%), Malaysia (-16%), Nigeria (-21%), Poland (-54%), Russia (-32%), Saudi Arabia (-81%), South Africa (-41%) and Turkey (-16%). China continued its lead: its FDI inflows, registering a slight rebound to $137 billion, accounted for a third of all FDI to the E20. As highlighted in previous EMRs, between three and four E20 countries have featured among the top 15 host countries in the world in 2000-2016. In 2017, they were five: Brazil, India, Indonesia, Korea, Mexico and Russia (Figure 4.6).
Figure 4.5. Inward FDI flows to E20 countries and share in global IFDI flows 2000-2017
Source: Authors’ analysis based on data from UNCTADstats (http://unctadstat.unctad.org); accessed September 2018.
Figure 4.6. Top 15 economies by inward FDI flows 2000-2017 (USD millions)
Note: Excludes financial centers in the Caribbean. Source: Authors’ analysis, based on data from UNCTADstats (http://unctadstat.unctad.org); accessed September 2018.
0%
5%
10%
15%
20%
25%
30%
35%
0
100,000
200,000
300,000
400,000
500,000
600,000
2000 2001 2002 2003 2004 2005 2006 2007 2008 2009 2010 2011 2012 2013 2014 2015 2016 2017
US$
Mill
ion
s
IFDI Flows to E20 Share (%) in Global IFDI Flows

44
In contrast to inflows, FDI outflows from emerging economies declined in 2017. They fell by 11% in the E20. The share of these economies in global FDI outflows, however, remains close to 20% (Figure 4.7). While the decline in FDI outflows affected several emerging economies (such as Argentina, Chile, Colombia, Malaysia, and Saudi Arabia), the fall in Chinese OFDI flows ($71 billion) holds the lion’s share of responsibility for the E20 OFDI trend overall. Such a decline in China’s OFDI, the first one ever since 2002 (Figure 4.8), partly reflects the Chinese government’s newly enacted policies to rein in capital outflows (especially M&As) after massive outflows in 2015-2016s.
Figure 4.7. Outward FDI flows from E20 countries and share in global OFDI flows (2000-2017)
Source: Authors’ analysis, based on data from UNCTADstats (http://unctadstat.unctad.org); accessed September 2018.
Figure 4.8. OFDI flows from China (2000-2017 in USD millions)
Source: Authors’ analysis, based on data from UNCTADstats (http://unctadstat.unctad.org); accessed September 2018.
Among the E20, flows from China dominate, followed at a distance by Russian and Korean OFDI flows (Figure 4.9). As noted in the 2017 EMR, China, Korea and Russia have been among the top 15 global investors nearly every year since 2010, with China progressively entering the very top ranks (Figure 4.10). In 2017, in spite of the above-mentioned decline, China was still the third largest investor in the world while Russia and Korea moved up the ranks to 11 and 12 respectively. Two other E20 countries are worth noting: Thailand, whose OFDI has been on a significant upward trend since 2015, ranked 17 globally, and became the fourth largest investor among the E20 (Figure 4.11); and India ascended to 21st in global ranking and saw its OFDI doubling to $11 billion in 2017, possibly suggesting a recovery in its outward investment (Figure 4.12). On the other end of the spectrum, Brazil continued to register negative OFDI flows.
0%
5%
10%
15%
20%
25%
30%
0
50,000
100,000
150,000
200,000
250,000
300,000
350,000
2000 2001 2002 2003 2004 2005 2006 2007 2008 2009 2010 2011 2012 2013 2014 2015 2016 2017
US$
Mill
ion
s
OFDI Flows from E20 Share (%) in Global OFDI Flows
0
50,000
100,000
150,000
200,000
250,000
2000 2001 2002 2003 2004 2005 2006 2007 2008 2009 2010 2011 2012 2013 2014 2015 2016 2017

45
Figure 4.9. OFDI flows from E20 countries – 2017 (USD millions)
Source: Authors’ analysis, based on data from UNCTADstats. Data for Iran were not available.
Figure 4.10. Top 15 Economies by OFDI flows 2000-2017 (USD millions)
Source: Authors' analysis based on data from UNCTAD, WIR 2018. Annex Table 2, op. cit. Note: Excludes financial centers in the Caribbean.
Figure 4.11. OFDI flows from India (USD millions) Figure 4.12. OFDI flows from Thailand (USD millions)
Source: Authors’ analysis, based on data from UNCTADstats (http://unctadstat.unctad.org); accessed September 2018.
-1,35101991,1681,2861,6142,6302,9123,5913,6905,0835,1355,6255,792
7,36011,304
19,28331,676
36,032124,630
BrazilIran
EgyptArgentina
NigeriaPhilippines
TurkeyIndonesia
PolandColombia
MexicoChile
Saudi ArabiaMalaysia
South AfricaIndia
ThailandKoreaRussiaChina
0
5,000
10,000
15,000
20,000
25,000
200
0
200
1
200
2
200
3
200
4
200
5
200
6
200
7
200
8
200
9
201
0
201
1
201
2
201
3
201
4
201
5
201
6
201
7
-5,000
0
5,000
10,000
15,000
20,000
25,000
200
0
200
1
200
2
200
3
200
4
200
5
200
6
200
7
200
8
200
9
201
0
201
1
201
2
201
3
201
4
201
5
201
6
201
7

46
4.3. The protectionist wave
The global economic environment has radically changed from 2017 to 2018. Since the global financial crisis, some protectionist tendencies surfaced, but only over the past year has protectionism become a very visible reality. A new era is taking shape, sparked by a series of announcements and retaliatory measures since early 2018.
In March 2018, the U.S. announced that it would impose 25% tariffs on steel imports and 10% on aluminum imports. The tariffs initially targeted China while EU countries and several others (such as Canada and Mexico) were exempt pending further decision. These new tariffs were the result of a 2017 study on the impact of steel and aluminum imports on U.S. economic security, military preparedness and national security,23 as well as based on an U.S. Trade Representative examination of China’s intellectual property practices.24 In response, in April 2018, China determined that it would impose retaliatory 25% tariffs on 128 U.S. products, should the U.S. move forward with its proposed tariffs. Following a period of negotiations, the U.S. tariffs on steel and aluminum took effect. They applied to all countries,25 escalating U.S. trade tensions with China and causing a major rift between the U.S. and a number of its traditional allies, such as Canada and major EU countries.
The steel and aluminum tariffs were only the beginning. In April 2018, the U.S. administration published a list of products that could be subject to a new 25% tariff. This new class of taxed items was the result of the U.S. stepping up action against what it considers a deliberate ploy by China to force U.S. companies operating in China to hand over their own intellectual property—a ploy that, it argues, has been instrumental in China’s technological development and industrial take-off. One of the backbones of China’s growth and economic development strategy is its “Made in China 2025” plan, a plan that aims to increase China’s competitiveness in cutting–edge technology and move its industry up the value chain. One of the plan’s core goals is to reduce China’s reliance on foreign technology. Thus, the tariffs focus on $50 billion in annual imports in industries targeted by “Made in China 2025” plan. The list of industries concerned is heavily geared towards the high-tech sector, including aerospace, information and communication technology, robotics machinery, electrical equipment, and medical equipment, among others.26 Meanwhile, the U.S. Congress began working on a legislation that would heighten scrutiny of foreign investment in U.S. firms in technology and other sectors on national security grounds.
In response to these tariffs, China filed a complaint with the WTO and threatened retaliatory 25% tariffs on $50 billion of U.S. imports, including soybeans. This move prompted the U.S. trade representative to consider additional tariffs on another $100 billion of Chinese imports. The Chinese closed ranks and determined that they would not negotiate under threat. Following weeks of exchange and negotiations,27 the U.S. tariffs on $50 billion of Chinese imports eventually took effect in July 2018 (on $34 billion) and August ($16 billion). In each case, China followed with retaliatory measures on equivalent amount of U.S. imports, such as soybeans, beef, whiskey and off-road vehicles, among other products. The trade tensions kept on escalating. In September 2018, the U.S. government announced it would impose new tariffs on an additional $200 billion of products, effective by the end of the month, and additional levies could still be applied to the cover the totality of Chinese imports.28 China reacted by announcing new tariffs on $60 billion of imports from the U.S.
The China-U.S. trade war has also touched off serious tensions among traditional U.S. partners and allies, such the EU and Canada. Indeed, the steel and aluminum tariff exemptions granted to the EU and other countries such as Mexico and Canada were lifted in June 2018. In addition, the U.S. announced in April 2018 it was launching an investigation of its automobile imports on national security grounds. For Canada, the U.S. market accounts for 85% and about 80% of Canadian aluminum and steel exports, respectively, while about 85% of the vehicles and auto parts produced in Canada are shipped to the U.S.29 The U.S. is also the largest export market for EU car production, accounting for about 29% of the EU total car exports.30
Besides China, countries affected by the U.S. tariffs have issued their own responses. For instance, in June 2018, Canada imposed tariffs on about $16 billion in imports from the U.S., including aluminum and steel, as well as consumer goods, and Mexico retaliated with its own tariffs on a wide range of U.S. imports from steel to pork, sausages, and fruit. The EU rolled out 25% tariffs on a diverse list of products (e.g., orange juice, jeans, whiskey,

47
pleasure boats, among others) and, as of September 2018, trade talks between the EU and the U.S. were ongoing. India also announced that it would raise tariffs on $240 million worth of American imports, including on a variety of farm products.31
The impact of the U.S.-imposed tariffs on the global economy is likely to be wide-ranging, as countries will experience their effects both directly and indirectly over time, as seen below:
Figure 4.13. Largest exporters to the U.S. for Raw Aluminum and Steel Raw Aluminum (2016)
Steel (2017)
Sources: Authors based on https://atlas.media.mit.edu/en/
The tariffs will directly impact: - Countries whose exports fall directly under the newly imposed U.S. steel and aluminum tariffs. Canada, Mexico, Korea, Brazil and China are the largest exporters of steel to the U.S., and account for about half of the value of U.S. steel imports in 2017 (see Figure 4.13). In the case of raw aluminum, the main providers are Canada, Russia and the UAE that together account for about 80% the U.S. imports. Countries for which the U.S. is a significant market will be all the more impacted. For instance, the U.S. represents a significant share of steel and aluminum exports for Canada as mentioned above; in the case of Mexico it accounts for around 70% of its steel and about 50 % of its aluminum exports. It is a very important market, too, for Brazilian steel (about 30% of exports), and for Argentinean and Russian aluminum (63% and 30% of their global exports respectively). The U.S. is also an important market for Chinese aluminum; it accounts for about 15% of its aluminum exports32 but for only 1% of its steel exports.33 (See Figure 4.13.)
- Firms (such as General Motors, Ford or Volvo) who export to the U.S. from China as part of their supply chain.
The tariffs may present the following indirect impacts: - Chinese shipments destined for the U.S. may be diverted to other markets, such as Europe or Latin
America, which may in turn find themselves faced with increased trade imbalances. - China’s role in global value chains will be a crucial determining factor for other second order impacts
in other countries. The blow to Chinese exports could ripple through emerging economies, especially in Asian countries with a large number of enterprises and industries supplying the Chinese manufacturing sector. Cambodia, Korea, Malaysia, Thailand and Vietnam34 are especially vulnerable in that respect. China is a significant export market for these countries’ intermediate goods: for instance, in 2016, China accounted for 18% of the exports of intermediate goods in Malaysia, more than 20% in Thailand and Vietnam, almost 30% in the case of Korea and a third in Cambodia. Overall, Asia accounts for about half of Chinese imports (see Table 4.1.)
3.9%
14%
16%
52%
63%
21%
32%
85%
0.0% 20.0% 40.0% 60.0% 80.0% 100.0%
Argentina
UAE
Russia
Canada
Share of US in the country raw aluminum exports.
Share of the country in the US Raw Aluminium Imports
1%
34%
65%
11%
90%
6%
9%
10%
11%
19%
0% 20% 40% 60% 80% 100%
China
Brazil
Mexico
Korea
Canada
share of country in US imports
share of US in the country exports

48
- A slowdown in China as a result of the challenging trade environment could also seriously impact commodity producers. Among the E20, for instance, major commodity producers such as Brazil and Chile export between 45% and 48% of their raw materials to China, Mexico: 30% and Indonesia: 18%.
The implications may not be wholly negative. If global value chains are disrupted, certain countries may benefit. In Asia, low-wage competitors outside of China stand to profit from the U.S.-China trade war. Foreign firms (especially U.S. companies) may redesign their supply chains outside China to get around the U.S.-imposed tariffs. Some countries may also benefit from new market opportunities. For instance, retaliatory tariffs on imports from the U.S. impose a cost on key U.S. trade partners. The latter are bound to look for alternative suppliers. Mexico, for instance, indicated it would intensify trade diversification with other countries.35
The sustained loss of confidence in the global multilateral trading system is perhaps even more damaging in the long term. Drastic changes in trade policy, erratic announcements, as well as tit-for-tat attitudes are dramatically disrupting the rule-based system of international trade that took decades to emerge. Founding principles—such as the WTO’s “most favored nation principle,” in which “countries cannot normally discriminate between their trading partners”36—are being seriously undermined. The return of voluntary export restraints, in exchange for steel tariffs exemptions, for instance,37 transport policy back to the 1980s and destabilize WTO rules. International trade diplomacy is hence being profoundly upended and the tectonic shifts that the global trade system is going through is fueling a climate of proliferating uncertainty. Ultimately, retaliatory measures by the EU, China, Canada, India and Mexico, among others, will only add to the perception that the world economy is on a slippery slope.
Table 4.1. Selected Asian countries—exports of intermediate goods and raw materials to China (2016) Product Type Share (%) Export to China Share (%) of China ($ Thousand) in country exports Malaysia All products of which: 100% $23,753,270 13% Intermediate goods 20% $6,601,177 18% Raw materials 6% $1,904,994 17% Indonesia All products of which: 100% $16,785,585 12% Intermediate goods 26% $5,644,668 15% Raw materials 23% $6,066,050 18% Korea All products of which: 100% $124,432,940 25% Intermediate goods 23% $32,304,055 29% Raw materials 1% $700,856 21% Philippines All products of which: 100% $6,192,432 11% Intermediate goods 10% $426,714 8% Raw materials 7% $1,187,474 31% Thailand* All products of which: 100% $23,311,428 11% Intermediate goods 20% $8,737,759 20% Raw materials 6% $4,952,950 40% Cambodia All products of which: 100% $609,277 6% Intermediate goods 6% $182,374 32% Raw materials 2% $24,726 10% Vietnam* All products of which: 100% $16,567,85 10% Intermediate goods 13% $4,675,984 22% Raw materials 11% $3,913,925 22%
Source: Author’s analysis based on data from WITS, World Bank, accessed by August 2018. *: Data are for 2015
4.4. Conclusion
As shown in preceding EMRs, emerging economies proved resilient in the wake of the global financial crisis as well as during the more recent slowdown. In 2017, E20 economies continued on a trajectory of overall growth, and significant rebounds in some cases. They also attracted a larger amount of FDI amidst a drop in global FDI in 2017 and continued to play an important role as global investor.

49
While short-term forecasts remain optimistic, the medium-term outlook, however, is more uncertain. For emerging economies, a combination of factors makes the global environment less propitious to their growth than was the case in the past few years. One of these factors is heightened financial instability, stemming from a general tightening of external financing conditions in developed economies, as illustrated in particular by the surge in U.S. interest rates. The second is protectionism and the escalating trade tensions that have been mounting since the beginning of 2018, unleashing one of the most serious threats ever to the global rule-based trade system that had been developing over the past several decades. The latter is to some extent more pernicious as it reshuffles the rules of the game, shifting the paradigm that helped a number of emerging economies to grow and develop.

50
ANNEX TABLE 4.1. E20 AND G-7 countries – GDP growth rates
Various periods from 1995 to 2017, and projections for 2018 and 2019
2005-2010 2010-2015 2016 2017 2018** 2019 **
E20
Argentina 5.70% 2.50% -1.80% 2.90% 1.70% 1.80%
Brazil 4.50% 1.00% -3.50% 1.00% 2.40% 2.50%
Chile 3.50% 3.80% 1.30% 1.50% 3.30% 3.40%
China 11.30% 7.80% 6.70% 6.90% 6.50% 6.30%
Colombia 4.50% 4.60% 2.00% 1.80% 2.70% 3.30%
Egypt 6.20% 2.50% 4.30% 4.20% 5.00% 5.50%
India 8.10% 6.70% 7.10% 6.70% 7.30% 7.50%
Indonesia 5.70% 5.50% 5.00% 5.10% 5.20% 5.30%
Iran 4.90% -0.20% 13.40% 4.30% 4.10% 4.10%
Korea 4.10% 3.00% 2.7% 2.80% 2.90% 3.00%
Malaysia 4.50% 4.40% 4.20% 5.90% 5.40% 5.10%
Mexico 1.60% 2.80% 2.90% 2.00% 2.30% 2.50%
Nigeria 7.20% 4.70% -1.60% 0.80% 2.10% 2.20%
Philippines 4.90% 5.90% 6.90% 6.70% 6.70% 6.70%
Poland 4.70% 2.90% 2.90% 4.60% 4.20% 3.70%
Russia 3.50% 1.20% -0.20% 1.50% 1.50% 1.80%
Saudi Arabia 5.30% 5.00% 1.70% -0.70% 1.80% 2.10%
South Africa 3.10% 2.10% 0.60% 1.30% 1.40% 1.80%
Thailand 3.70% 2.90% 3.30% 3.90% 4.10% 3.80%
Turkey 3.20% 4.40% 3.20% 7.40% 4.50% 4.00%
G-7
Canada 1.10% 2.10% 1.5% 2.00% 1.90% 1.90%
France 0.80% 0.90% 1.2% 1.40% 1.40% 1.40%
Germany 1.20% 1.50% 1.9% 1.80% 1.60% 1.40%
Italy -0.30% -0.70% 0.9% 1.00% 1.10% 1.10%
Japan 0.30% 0.60% 1.00% 1.70% 1.00% 0.80%
United Kingdom
3.90% 2.10% 1.8% 1.80% 1.40% 1.50%
United States 0.76% 2.03% 1.50% 2.50% 2.70% 2.50%
Source: Authors' calculation, based on World Development Indicators http://databank.worldbank.org/data/home.aspx and; for 2018-2019 projections: Global Development Prospects, Statistical Appendix athttp://www.worldbank.org/en/publication/global-economic-prospects and World Bank Indicators for countries at https://data.worldbank.org/country (accessed September 2018)

51
NOTES
1 Based on nominal GDP. On a PPP basis, China’s GDP is No. 1. 2 For more on the E20, see the EMR 2016, Chapter 1. 3 World Bank data, Statistical Appendix in “Global Economic Prospects”, June 2018, http://www.worldbank.org/en/publication/global-economic-prospects 4 World Bank data, Statistical Appendix in “Global Economic Prospects”, June 2018, op. cit. 5 World Bank data, Statistical Appendix in “Global Economic Prospects”, June 2018, op. cit. 6 World Bank data, Statistical Appendix in “Global Economic Prospects”, June 2018, op. cit. The U.S. growth forecast is 2.9% in 2018 and 2.7% in 2019. 7 World Bank data, “Global Economic Prospects”, June 2018, statistical Appendix 8 Increased public spending is partly behind India’s faster growth rate in 2017-2018. However, private investment—while improving—has not fully recovered from the previous year. (https://www.ft.com/content/2254a112-64cd-11e8-90c2-9563a0613e56?ftcamp=crm/email/_2018___05___20180531__/emailalerts/Keyword_alert/product 9 IMF Fiscal Monitor, April 2018, Chapter 1 at: http://www.imf.org/en/Publications/FM/Issues/2018/04/06/fiscal-monitor-april-2018. 10 IMF, Fiscal Monitor, April 2018, op. cit. 11 Based on IMF data on General Government Debt, IMF Fiscal Monitor, April 2018, op. cit., table 1.1 and Statistical Appendix 12 IMF, Fiscal Monitor, April 2018, op.cit.2018, p.30. 13 Source: , Figure 1.21, at: https://read.oecd-ilibrary.org/economics/oecd-economic-outlook-volume-2018-issue-1_eco_outlook-v2018-1-en#page34 (accessed June 2018) 14 Based on data from the Federal Reserve: https://www.federalreserve.gov/monetarypolicy/openmarket.htm (accessed June 2018) 15 https://www.ft.com/content/19fe9bc8-6f1b-11e8-852d-d8b934ff5ffa?ftcamp=crm/email/_2018___06___20180613__/emailalerts/Keyword_alert/product 16 It is estimated that since the beginning of the year until July 2018, overseas funds pulled out $19 billion from India, Indonesia, the Philippines, Korea, Taiwan and Thailand. (“Emerging Market Currency Downfall and its Effect on Emerging Economies”, N. Clavijo, Emerging Market Institute, Cornell University, at https://www.johnson.cornell.edu/Emerging-Markets-Institute/Research/EMI-at-Work/Institute-at-Work-Article/ArticleId/47325/Emerging-Market-Currency-Downfall-and-its-Effect-on-Emerging-Economies) 17 In Mexico, leftist candidate Andres Manuel Lopez Obrador (AMLO) was elected on July 1, 2018; at the time, the peso was at its lowest, but has recovered slightly since then. 18 The economic difficulties faced by Turkey largely stem from its twin deficits in both its fiscal and current accounts, and its large foreign debt—which make it particularly vulnerable to external shocks. The lira began declining in August 2017. To many analysts, raising Turkish interest rates would have helped stem the decline. Turkey’s president, however, explicitly said he did not favor it; he also vowed to exert more influence over monetary policy. The policy that followed and the central bank’s apparent lack of independence have not reassured investors. The situation further deteriorated in August 2018 following a political row between the U.S. and Turkey, which resulted in the U.S. doubling its tariffs on imports of Turkish steel and aluminum. (See, for instance, Financial Times, July 24, 2018, https://www.ft.com/content/5f389ec8-8f23-11e8-bb8f-a6a2f7bca546 ; Financial Times, August 31, 2018 https://www.ft.com/content/328d2aa0-ace8-11e8-89a1-e5de165fa619 and New York Times, August 17, 2018, https://www.nytimes.com/2018/08/17/world/europe/erdogan-turkey-economic-crisis-lira-trump.html 19 Between March 15 and June 15, 2018, two weeks before the presidential election, the Mexican peso had lost almost 15% of its value against the dollar (based on data from Reuters). Since then, the Mexican peso has begun recovering. 20 See for instance “The crisis in emerging market currencies isn’t going away” https://qz.com/1375648/the-crisis-in-emerging-market-currencies-isnt-going-away Quartz, September 1, 2018. 21 “Argentina, Turkey, Mexico ... fear of contagion haunts emerging markets” The Guardian, September 9, 2018. https://www.theguardian.com/business/2018/sep/08/emerging-economies-crisis-looms-shadow-america-boom-interest-rates); “Contagion fear: emerging markets’ currency crises spook investors far and wide. How will Asia fare?” SMCP, September 7, 2018. https://www.scmp.com/comment/insight-opinion/asia/article/2163069/contagion-fear-emerging-markets-currency-crises-spook); “Testing times for Asia's emerging markets” at https://asia.nikkei.com/Opinion/Testing-times-for-Asia-s-emerging-markets); “Why Turkey Crisis Won't Cause An Emerging Market Crash”, Forbes, August 27, 2018 at https://www.forbes.com/sites/randybrown/2018/08/27/why-turkeys-crisis-wont-cause-an-emerging-market-crash/#5d1e1ea2118b.

52
22 FDI flows to Argentina and Thailand almost quadrupled while flows to Indonesia sextupled. 23 U.S. Department of Commerce, January 2018, at https://www.commerce.gov/sites/commerce.gov/files/the_effect_of_imports_of_steel_on_the_national_security_-_with_redactions_-_20180111.pdf and US Department of Commerce, January 2018, https://www.commerce.gov/sites/commerce.gov/files/the_effect_of_imports_of_steel_on_the_national_security_-_with_redactions_-_20180111.pdf 24 Source: OFFICE OF THE UNITED STATES TRADE REPRESENTATIVE Docket No. USTR-2018-0005; Notice of Determination and Request for Public Comment Concerning Proposed Determination of Action Pursuant to Section 301: China’s Acts, Policies, and Practices Related to Technology Transfer, Intellectual Property, and Innovation, USTR, April 3, 2018 (at https://ustr.gov/sites/default/files/files/Press/Releases/301FRN.pdf) and https://ustr.gov/about-us/policy-offices/press-office/press-releases/2018/april/under-section-301-action-ustr releases/2018/april/under-section-301-action-ustr). 25 With the exception of Korea (which agreed to voluntary restrictions on its steel exports to the U.S.), in exchange for tariff exemption. 26 OFFICE OF THE UNITED STATES TRADE REPRESENTATIVE Docket No. USTR-2018-0005, ibid. 27 In May 2018, for instance, high-level delegates from China and the U.S. visited each other’s countries and announced an agreement that the trade war was on hold. The countries issued a joint statement that they had reached “a consensus on taking effective measures” to cut the U.S. trade deficit on Chinese goods. Tensions resumed the following week, however, as the U.S. reverted to its 25% tariff on $50 billion worth of imports announced at the beginning of the dispute. 28 The new tariffs, set at 10% effective on September 24, 2018 –would rise to 25% by the end of the year (https://www.wsj.com/articles/trump-to-lay-out-line-on-china-trade-1537213209?mod=article_inline) 29 Source: Automotive News Canada, http://canada.autonews.com/article/20170602/CANADA/170609916/auto-exports-drive-canadas-trade-surplus-with-u.s. 30 Source: Eurostat, https://ec.europa.eu/eurostat/statistics-explained/index.php?title=International_trade_in_cars#Car_exports_peak_in_2017 31 https://www.ft.com/content/901f2bf6-7533-11e8-aa31-31da4279a601?ftcamp=crm/email/_2018___06___20180621__/emailalerts/Keyword_alert/product 32 https://www.reuters.com/article/us-china-economy-trade-aluminium/chinas-aluminum-exports-rise-steel-down-as-trump-prepares-tariffs-idUSKCN1GK0TC 33 Data from Global Steel Trade Monitor, June 2018, US Department of Commerce, at https://www.trade.gov/steel/countries/pdfs/imports-us.pdf 34 Taiwan and Philippines, because of electronics. 35 Source: https://expansion.mx/economia/2018/06/05/quien-gana-con-la-disputa-comercial-entre-mexico-y-eu?utm_source=Matutino&utm_campaign=9c174830f2-EMAIL_CAMPAIGN_2018_06_06_12_59&utm_medium=email&utm_term=0_35f350be4e-9c174830f2-111885593 36 Source: See https://www.wto.org/english/thewto_e/whatis_e/tif_e/fact2_e.htm. As stated on the WTO website: “Most favored Nation: This sounds like a contradiction. It suggests special treatment, but in the WTO it actually means non-discrimination — treating virtually everyone equally. This is what happens. Each member treats all the other members equally as “most-favored” trading partners. If a country improves the benefits that it gives to one trading partner, it has to give the same “best” treatment to all the other WTO members so that they all remain most-favored”. The MFN principle ensures that each country treats its over—140 fellow-members equally.” (See https://www.wto.org/english/thewto_e/whatis_e/tif_e/fact2_e.htm).). 37 Korea received an exemption from the newly imposed U.S. tariffs on steel, in exchange for restraining steel exports to 70% of its current level.

53
REFERENCES IMF (2018), Fiscal Monitor, April 2018. OECD (2018), Economic Outlook 2018. OFFICE OF THE UNITED STATES TRADE REPRESENTATIVE Docket No. USTR-2018-0005; Notice of Determination and Request for
Public Comment Concerning Proposed Determination of Action Pursuant to Section 301: China’s Acts, Policies, and Practices Related to Technology Transfer, Intellectual Property, and Innovation, USTR, April 3, 2018. (at https://ustr.gov/sites/default/files/files/Press/Releases/301FRN.pdf)
U.S. Department of Commerce (2018), Global Steel Trade Monitor, June 2018. World Bank (2018), “Global Economic Prospects”, June 2018.

54
Chapter 5 Emerging Markets and soft power: new development institutions and initiatives
5.1. New development institutions redistribute the balance of power
A. New governance structure and power distribution B. Lending activity of the new development banks C. The AIIB’s and NDB’s infrastructure focus
5.2. The case of OBOR: from economics to geopolitics A. The One Belt, One Road initiative B. Motivation
5.3. Challenges 5.4. Conclusion
Executive Summary
Along with economic clout, emerging markets’ success has come with increased soft power and political influence, challenging the world order established since the 1950s. New development institutions like the AIIB and the NDB, and the launch of initiatives like the Chinese-led Belt and Road Initiative, illustrate the radical transformation that is taking place. This chapter examines how these institutions and initiatives may reshuffle global governance and politics.

55
Introduction
As emerging markets grow in relevance in the global economy, soft power distribution has also shifted for the first time beyond the G-7. Emblematic of this remarkable transformation, emerging economies have created two multilateral financial institutions of consequential size and scope: The Asian Infrastructure Investment Bank (AIIB), a Chinese-led initiative, and the New Development Bank (NDB), an effort championed and owned by the BRICS nations (Brazil, Russia, India, China and South Africa). The other main signifier of change is the advent of the One Belt, One Road Initiative (OBOR, also known as the Belt and Road Initiative, or BRI), an ambitious China-backed plan for infrastructure development. The BRI links China to Europe, Central Asia and Africa along land-based and maritime routes. These two phenomena have solidified the soft power shift, which we examine in the following chapter.
5.1. New development institutions redistribute the balance of power
The AIIB and NDB have radically different governance structures and power distribution than those that govern the post-WWII multilateral institutions, such as the World Bank and the IMF. The new institutional landscape is indicative of a power shift away from the Bretton Woods system—i.e., beyond the G-7. The AIIB and the NDB may play a significant role in development finance for at least three reasons: 1) the size of their lending activity, 2) their relatively high capitalization, and 3) their focus on infrastructure—a sector that is vital for emerging growth and development and whose financing demands are enormous.
A. New governance structure and power distribution
a. The Asian Infrastructure Investment Bank (AIIB)
China played an instrumental role in the creation of AIIB, which was established in 2014 and is headquartered in Beijing. AIIB focuses on developing infrastructure in energy, transportation, telecommunications, rural infrastructure, water supply, sanitation, urban development and logistics.1 The AIIB now comprises 64 member countries. Its Asian regional members hold the primary control, accounting for about 75% of the voting rights. China alone holds 27% of the vote, while India has 8% (see Figure 5.1 and Table 5.1), which far outnumber their shares in the World Bank, (4.4 % and 3% respectively).
Figure 5.1. AIIB voting power by country (2018)
Source: AIIB Website https://www.aiib.org/en/about-aiib/governance/members-of-bank/index.html, accessed May 30, 2018.
The AIIB is becoming a global institution in both membership and operational reach. Beyond Asia, the AIIB has extended its membership to 16 countries from the EU, two from Africa and Canada. Five members are from the G-7.2 In addition to Brazil, which was a prospective3 founding member, six Latin American countries were approved as prospective members in 2017, some of which may be fully inducted by the end of 2018.4
While the AIIB focuses on Asia, it may also invest beyond the region if a project delivers a clear regional benefit. For instance, in early 2018 it signed two partnership agreements with the Inter-American Development Bank (IADB) and the African Development Bank (AfDB), two key regional multilateral lenders. Their cooperation will open
China27%
India8%
Russia6%
Germany4%
Korea4%
Australia3%
Indonesia3%
France3%
United Kingdom3%
Turkey3%
Canada1%
Italy2%
Others33%

56
up investment opportunities and facilitate AIIB expansion into Africa and Latin America. Likewise, the Islamic Development Bank (IsDB) announced it would partner with the AIIB to fund infrastructure development in Africa and other developing regions.
In light of the bank’s origin, some analysts see the AIIB as an instrument for implementing China’s OBOR policy. To date, the bank has been a broad-based multilateral institution with a diverse range of member states. Negotiations at the time of its creation have led to a series of compromises in terms of governance practices. To some observers the Bank today “largely conforms with existing development financing norms and practices,”5 cooperating with peer development institutions such as the World Bank and the Asian Development Bank (ADB) in joint financing operations. One such example of cooperation is the financing of the Trans-Anatolian Natural Gas Pipeline (TANAP) to connect Azerbaijan to Europe, a project involving a $600 million loan from AIIB.
b. The New Development Bank (NDB)
In 2015, BRICS founded the New Development Bank (NDB). Headquartered in Shanghai and with an African Regional Center in Johannesburg, NDB aims to mobilize resources for infrastructure and sustainable development projects across emerging and developing economies.6 Its founding members (Brazil, Russia, India and South Africa) equally share voting power.7 While NDB’s membership may expand over time, the Bank’s charter specifies that emerging economies and developing countries will always maintain at least 80% of the voting rights and BRICS’ share cannot fall below 55%.8 This ensures that the founding members will always govern the institution, and that emerging and developing economies will play a prominent role in its decision-making, irrespective of the participation of advanced economies in the future. Like AIIB, NDB has built alliances with national and regional development banks in the form of partnership agreements, a number of which have been signed since the NDB’s founding.9
Both the AIIB and NDB began operations in 2016. These two new institutions have sizable capital relative to regional development banks such as the African Development Bank, the “Andean Development Corporation – Development Bank of Latin America” also known as CAF, or even the ADB. (See Table in Annex).
B. Lending activity of the new development banks
The two new development banks have quickly expanded their lending activity. The AIIB financed nine projects during its first year of operation,10 amounting to about $1.7 billion. In about two years, the bank’s loan portfolio had more than tripled to 27 projects, reaching $5.4 billion by June 2018 (Figure 5.2). The NDB rapidly grew its portfolio during its first two years to $4.9 billion, which financed a total of 20 projects in BRICS countries (see Figure 5.3). The largest share of AIIB’s loan portfolio is in India, followed by Indonesia, Turkey and Azerbaijan—the latter hosts the AIIB’s largest single project, the above-mentioned Trans-Anatolian Natural Gas Pipeline (Figure 5.2). As well, to date, India is the largest recipient of NDB’s loans (Figure 5.3).
Figure 5.2. AIIB lending commitment by country, approved projects 2016-June 2018 (USD millions)
Source: Authors' analysis based on data from AIIB. Data as of June 30, 2018. (https://www.aiib.org/en/projects/approved/index.html/, accessed June 30, 2018.)
$20.00$87.50
$114.00$150.00
$207.50$210.00
$250.00$285.00
$400.00$504.00
$600.00$600.00
$691.50$1,314.00
$0.00 $200.00 $400.00 $600.00 $800.00 $1,000.00 $1,200.00 $1,400.00
MyanmarTajikistan
GeorgiaAsia Regional
PhillippinesEgyptChina
BangladeshPakistan
OmanAzerbaijan
TurkeyIndonesia
India

57
Figure 5.3. NDB lending commitment by country, approved projects 2016-June 2018 (USD millions)
Source: Author’s analysis and AIIB website, https://www.aiib.org/en/projects/approved/index.html, accessed June 30, 2018.
Nevertheless, NDB and AIIB’s total loan portfolios are much smaller than those of well-established
development banks such as the International Bank for Reconstruction and Development (IBRD) and the ADB (see Table 5.1). The $5.4 and $4.9 billion the AIIB and the NDB lent, respectively, over 2016–June 2018 falls short of the amounts the World Bank lent to Asia ($26 billion)11 during the same period, as well as of those lent by the ADB (about $64 billion for 2016-2017). NDB and AIIB’s lending is also smaller than that of well-established regional development banks such as CAF or the IDB but the differential here is less significant (see table in Annex).
For individual countries, however, the AIIB and NDB’s funding is far from negligible. In the case of Indonesia, for instance, AIIB loan commitments amounted to about 14% of the IBRD’s loans for 2016-2017 (Table 5.1). For Pakistan, the Philippines and India, this ratio reached 19%, 26% and 27% respectively (see Table 5.1). The value of NDB’s loans to Brazil, China and India from 2016-2017 was equivalent to about 38%, 20% and 36% of World Bank’s (IBRD) borrowings during the same period.12
Table 5.1. Comparing loan commitments from AIIB and NDB to those from IBRD and ADB (Selected countries 2016-2017)
Country AIIB/ World Bank* NDB/ World Bank* AIIB / ADB NDB / ADB
Egypt 7.92%
Indonesia 13.84% 5.10%
Pakistan 19.37% 7.59%
The Philippines 26.05% 8.38%
BRICS
Brazil 38.15%
China 5.71% 20.06% 3.96% 13.92%
India 27.16% 35.78% 10.88% 14.33%
* IBRD loans only AIIB/World Bank: ratio of AIIB loans to IBRD loans AIIB/ADB: ratio of AIIB loans to ADB loans NDB/World Bank: ratio of AIIB loans to NDB loans NDB/ADB: ratio of NDB loans to ADB loans
Sources: Authors’ analysis based on data from — AIIB (https://www.aiib.org/en/projects/approved/index.html); NDB (https://www.ndb.int/projects/list-of-all-projects/); World Bank (https://finances.worldbank.org/Loans-and-Credits/IBRD-Statement-of-Loans-Latest-Available-Snapshot/sfv5-tf7p) and ADB (https://www.adb.org/sites/default/files/institutional-document/414776/od-appendix3.pdf13 (accessed by June 5, 2018).
C. The AIIB and NDB’s infrastructure focus
Poor infrastructure is a major bottleneck to economic growth and development for low and middle-income countries. Financing needs are enormous: the OECD, for instance, estimates global infrastructure spending needs at $71 trillion through 2030,14 while the ADB estimates $26 trillion for the Asian and Pacific region alone.15 In this context, due to their focus on infrastructure, the AIIB and NDB can play an important role in developing and emerging economies.
The Energy and Transport sectors receive some of AIIB and NDB’s largest loans, a fact largely explained by Asia’s growing energy demands and poor transport infrastructure. Since its creation, AIIB has granted nearly half of
$380
$421
$1,169
$1,179
$1,765
$0 $200 $400 $600 $800 $1,000 $1,200 $1,400 $1,600 $1,800 $2,000
South Africa
Brazil
Russia
China
India
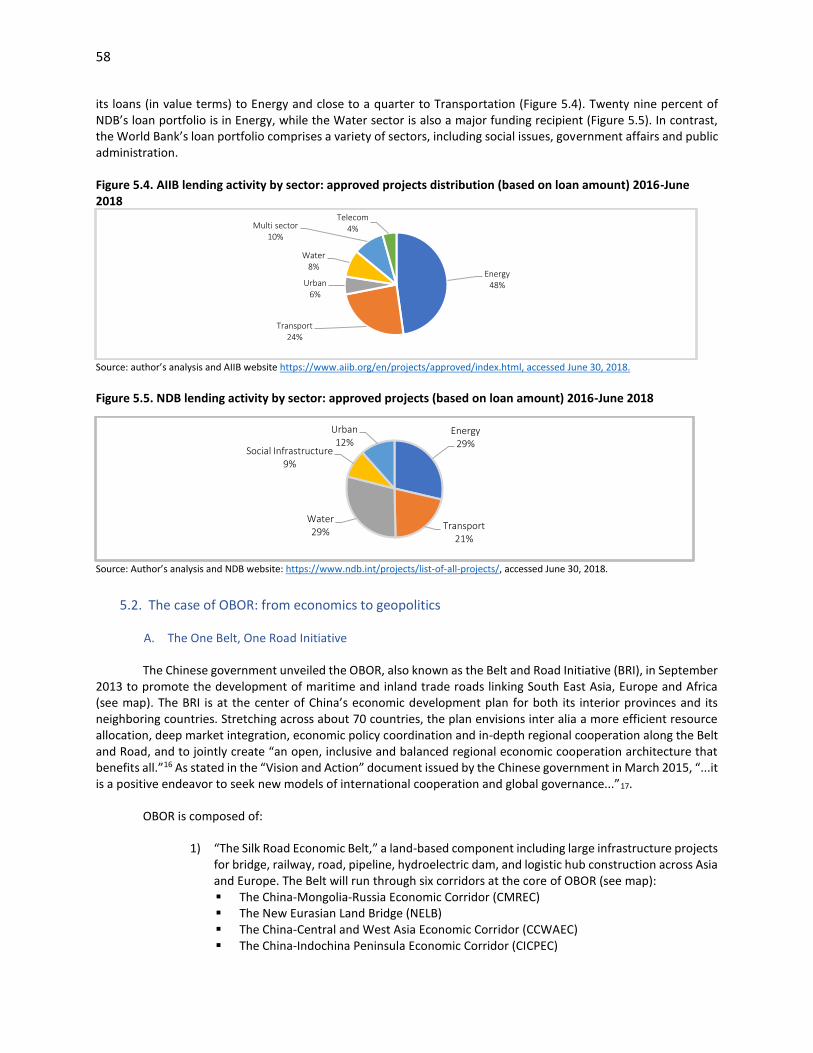
58
its loans (in value terms) to Energy and close to a quarter to Transportation (Figure 5.4). Twenty nine percent of NDB’s loan portfolio is in Energy, while the Water sector is also a major funding recipient (Figure 5.5). In contrast, the World Bank’s loan portfolio comprises a variety of sectors, including social issues, government affairs and public administration.
Figure 5.4. AIIB lending activity by sector: approved projects distribution (based on loan amount) 2016-June 2018
Source: author’s analysis and AIIB website https://www.aiib.org/en/projects/approved/index.html, accessed June 30, 2018.
Figure 5.5. NDB lending activity by sector: approved projects (based on loan amount) 2016-June 2018
Source: Author’s analysis and NDB website: https://www.ndb.int/projects/list-of-all-projects/, accessed June 30, 2018.
5.2. The case of OBOR: from economics to geopolitics
A. The One Belt, One Road Initiative
The Chinese government unveiled the OBOR, also known as the Belt and Road Initiative (BRI), in September 2013 to promote the development of maritime and inland trade roads linking South East Asia, Europe and Africa (see map). The BRI is at the center of China’s economic development plan for both its interior provinces and its neighboring countries. Stretching across about 70 countries, the plan envisions inter alia a more efficient resource allocation, deep market integration, economic policy coordination and in-depth regional cooperation along the Belt and Road, and to jointly create “an open, inclusive and balanced regional economic cooperation architecture that benefits all.”16 As stated in the “Vision and Action” document issued by the Chinese government in March 2015, “...it is a positive endeavor to seek new models of international cooperation and global governance...”17.
OBOR is composed of:
1) “The Silk Road Economic Belt,” a land-based component including large infrastructure projects for bridge, railway, road, pipeline, hydroelectric dam, and logistic hub construction across Asia and Europe. The Belt will run through six corridors at the core of OBOR (see map): The China-Mongolia-Russia Economic Corridor (CMREC) The New Eurasian Land Bridge (NELB) The China-Central and West Asia Economic Corridor (CCWAEC) The China-Indochina Peninsula Economic Corridor (CICPEC)
Energy48%
Transport24%
Urban6%
Water8%
Multi sector10%
Telecom4%
Energy 29%
Transport21%
Water 29%
Social Infrastructure9%
Urban12%

59
The China Pakistan-Economic Corridor (CPEC) The Bangladesh-China-India-Myanmar Economic Corridor (BCIMEC)
Additionally, a new corridor proposed in 2018 will link Nepal to both China and India.
2) The Maritime Silk Road a sea-based component linking China with Europe through the Indian Ocean and the South China Sea, and also with the South Pacific through the South China. This set of projects will include building shipping ports, hydrocarbon refineries, and industrial parks.
The initiative is quite an expensive endeavor. The costs could range into several trillion dollars.18 Estimates indicate that OBOR projects in place amount to $900 billion.19 Financing will come from multiple sources, including the AIIB, the Silk Road Fund (which was set up in 201420 by China’s Central Bank), as well as foreign banks and capital markets. Yet, the largest financial contributors are two Chinese state-owned banks: The China Development Bank and the Export-Import Bank of China. The China Development Bank, for instance, has pledged over $800 billion over the course of several years.21 China’s Sovereign Wealth Fund, created in 2007, may also play a role.
Figure 5.6. Map of OBOR projects
Source: Wikipedia.
B. Motivations
Beyond the above-mentioned overall vision underlying the Belt and Road Initiative, a number of economic and political considerations have also impressed upon the Chinese government:
i. One factor is China’s high dependency on existing maritime routes. OBOR would diversify trade routes between Chinese cities and global markets. Currently, nearly 90% of China’s trade follows sea-lanes beyond Beijing’s control. China’s energy imports are particularly dependent on foreign control: about 80% of China’s crude oil imports pass through one single pathway, the Strait of Malacca between Malaysia and Indonesia.22 Construction projects of ports, railways, roads, and pipelines on the Indian subcontinent, such as those along the CPEC, will enable China to bypass such passageways in the South China Sea. The development project of a deep-water port in Gwadar in Pakistan, for instance, would ensure an alternative to the Strait of Malacca for trade from the Persian Gulf, as would new port infrastructure projects in Sri Lanka. Pipelines to China transporting oil offloaded at terminals in the Indian Ocean would also reduce the country’s vulnerability in energy imports. One such pipeline opened in Myanmar in 2017.23
Black: Silk Road Corridors Blue: Maritime Silk Road

60
ii. Another motivation for OBOR is its potential contribution to the development of West and Central China. The speed of China’s economic growth has created a significant regional disparity, which threatens the country’s long-term stability. This disparity is particularly visible between the rural western interior and the urban eastern coastline. Enhanced access to foreign markets and infrastructure projects along the corridors would strengthen the inland regions’ development prospects. Some interior cities, such as Xi’an, are already establishing economic zones to facilitate trade across China, Central Asia, and the Middle East. The above-mentioned Gwadar deep-water port is among the many projects that would further connect China’s landlocked west to key maritime trade routes.
iii. Chinese multinationals that have become leaders in industries such as Energy, Logistics and Infrastructure will likely benefit from investment opportunities offered along OBOR. State-owned firms, such as China National Petroleum Corporation, China Merchants Group, China Ocean Shipping (Cosco), and China Railway Rolling Stock Corp are particularly well positioned in this respect. OBOR is also expected to herald a new wave of investments into Europe, while Chinese exports are likely to benefit from greater access to EU markets. Eastern European countries are ideally situated to serve as gateways to these markets for Chinese exporters.
iv. Through OBOR, China could expand its sphere of influence beyond economic power. Soft power is becoming an important element of Beijing’s international policy. For instance, China increasingly positions Eurasia as key in its expansion. While China is already a major trade partner for many countries in Europe and Asia, OBOR would strengthen its ties with these regions.
There are also strategic considerations, including in the military realm24 (see later in this chapter). Some argue, for instance, that security issues in certain areas (e.g., in Pakistan in the port of Gwadar or in Sri Lanka in the port of Hambantota) serve as a pretext for China to establish military presence in those areas in the name of the security of the infrastructure facilities.25 Members of the Association of Southeast Nations (ASEAN)—many of which have increasing ties with China—find it increasingly difficult to maintain a unified policy regarding the South China Sea, as was made evident in the evolution of the Philippines with regards to this issue.26
C. Challenges
While OBOR is a strategy of a scale not seen since the reconstruction of Europe after WWII, it faces a number
of challenges, both economic and geopolitical. a) First, with regards to the economic and financial aspects
Infrastructure by essence requires long term and large-scale investment, the returns of which may not meet private investors’ expectations. Serious delays, like those experienced during rail line construction between Indonesia’s Jakarta and Bandung, escalate costs beyond those originally envisioned. Delays have also affected some projects in Kazakhstan and Bangladesh.
Potentially ballooning debt associated with such infrastructure projects is also a cause for concern. Countries such as Pakistan, Sri Lanka and Laos are particularly vulnerable to these effects: since 2010, their ratios of public debt to GDP increased by more than 10% for Pakistan and Sri Lanka, and by about 8% for Laos. (In 2017, their debt ratios were 67%, and almost 80 and 60%, respectively).27 A recent study, while noting that “BRI is unlikely to cause a systemic debt problem in the regions of the initiative’s focus”, determined that OBOR creates the potential for debt sustainability problems in eight countries.28 Warnings have been issued. For instance, while recognizing that BRI could provide much-needed infrastructure financing, the IMF stressed in an April 2018 statement, the “problematic increase in debt” these ventures can also create as a side effect.29 The statement added: “In countries where public debt is already high, careful management of financing terms is critical. This will protect both China and partner governments from entering into agreements that will cause financial difficulties in the future.”30 To help secure benefits from the Initiative, the IMF unveiled its first efforts to support the BRI, announcing the opening of a

61
China-IMF Capacity Development Center to help train officials from China and other countries, including from those associated with the Belt and Road Initiative.31
Sri Lanka, which has a debt to GDP ratio close to 82%, already found itself unable to service the debt contracted for the development of its Hambantota Port, as indicated later in this chapter. In Malaysia, the cost of some major OBOR projects has led the newly elected government to reassess them.32 In July 2018, the government reportedly suspended construction of its East Coast Rail Link, linking Malaysia to Thailand, as well as two pipelines. The projects, which total $22 billion, are pending a renegotiation of the terms of agreements.33
b) Security
A number of OBOR projects are in countries faced with political instability or terrorist risk; security is hence a key issue. This is the case in Pakistan, for instance, whose construction sites along the CPEC corridor have been targeted by extremists. Such circumstances are a deterrent for private investors.
c) Resentment in some nations.
In many OBOR participating countries, projects rely heavily on contractors, as well as employees and equipment from China. In some countries, such as Laos, this situation fuels resentment among locals who feel deprived of opportunities in term of jobs for local workers and contracts for domestic suppliers.34
d) Sovereignty and other geo-political concerns
OBOR’s rapid expansion may face additional obstacles arising from geopolitical issues. Sovereignty concerns have surfaced in countries struggling to fulfill their underlying financial obligations or that had to relinquish control on strategic infrastructure. Sri Lanka, for instance, could not repay the debt contracted for the development of its Hambantota Port and entered in a debt equity swap, giving China a 70% stake in the port and control of strategic land in Colombo Port City.35 Meanwhile, India fears that the Chinese-Pakistan CPEC corridor could undermine its claims in the Kashmir region.
The EU, too, has concerns. As China reaches out to Eastern Europe with initiatives such as the “16+1” Summits36, Europe is concerned about the impact such moves might have on the unity of the EU on issues such as foreign investment screening.
Finally, the U.S. is wary of the consequences of OBOR in terms of China’s influence over U.S. naval leverage and alliances in the region, and of potential military implications.
5.3 Conclusion
As emerging markets have grown more relevant in the global economy, their rising economic power has also come with increasing soft power and influence in global geopolitics. A few developments point to this remarkable transformation, such as the recent creation of the two development banks, the AIIB and the NDB, and the launch of the ambitious China-backed OBOR.
The creation of the AIIB and NDB represent a major shift in governance and power structure to emerging economies. Indeed, as the two banks’ governance and power structure are largely dominated by emerging economies, the concentration of power is shifting away from the G-7. Because of the magnitude of the projects and the large geography involved, China’s OBOR initiative also has the potential to impact the global economy and significantly expands China’s political and economic interests.
The two new development banks and OBOR both focus on infrastructure, a sector that is a major bottleneck to growth and development in many parts of the world. These initiatives are a far-reaching response to the yawning deficit in infrastructure investment in developing and emerging economies that development institutions have not yet been able to meet. For some observers, the new development institutions created by emerging economies and initiatives such as OBOR offer an alternative to the Bretton Woods Institution-led system of development finance

62
that has prevailed over the past half century. They can serve emerging economies, such as China, in the same way that the Bretton Woods system has served the soft power strategy of major developed economies.
OBOR has significant transformative power; however, challenges abound: economic and financial risks associated with huge infrastructure projects; the financial vulnerability of several host countries; security risks in relatively unstable regions; resentment from local populations; loss of political support in some host countries; and the geopolitical implications of some projects. Notwithstanding these challenges, with OBOR China may leverage its remarkable economic might and expand its sphere of influence. The initiative is part of a wider endeavor to gain a position in global political affairs more in line with its rising economic power. China’s efforts in the realm of development finance are accompanied by other initiatives, such as developing Chinese overseas media and cultural projects. These include, for instance, China’s “Confucius centers” that have spread in recent years particularly in Africa; its “Voice of China” broadcast, launched in early 2018; and China Global Television Network, the country’s revamped and rebranded former internal network, CCTV. All of these changes signal a growing trend towards softer tools for global influence.
Taken together, initiatives such as the creation of the AIIB and the NDB and the launch of the Belt and Road Initiative point to a change of paradigm away from the old order, as economic and political power shift towards emerging economies that aspire for a greater role in global governance. NOTES
1 https://www.aiib.org/en/about-aiib/who-we-are/our-work/index.html 2 In early 2018, Canada joined France, Germany, Italy and the U.K. as AIIB members. 3 Prospective members officially join AIIB once they complete the required domestic processes and deposit the first installment of capital with the bank. There are 22 approved prospective member countries. 4 Full membership requires subscription payment, which none of the Latin American countries have completed. 5 “What Does China Want from the Asian Infrastructure Investment Bank?”, Australian Outlook, Australian Institute of International Affairs, July 3, 2017, at http://www.internationalaffairs.org.au/australianoutlook/what-does-china-want-from-the-aiib/ 6 Source: The Bank came formally into existence as a legal entity in 2015. https://www.ndb.int/about-us/essence/history/ 7 Articles of Agreement of the New Development Bank, Article 2 8 Articles of Agreement of the New Development Bank, Article 8 9 As of June 2018, the NDB had signed agreements and a memorandum of understanding with ten multilateral or regional development banks and funds (https://www.ndb.int/partnerships/partnership-approach/, accessed on June 30, 2018). 10 Source: https://www.aiib2017.org/eng/sub/aiib/about.php 11 These data refer to the IBRD loans only. 12 Source: ADB country fact sheets for 2016 (https://www.adb.org/publications/series/fact-sheets) 13 See also : https://www.adb.org/sites/default/files/institutional-document/414776/od-appendix2.pdf; https://www.adb.org/sites/default/files/institutional-document/414776/od-appendix13.pdf ; https://data.adb.org/sites/default/files/ar2017-total-adb-operations-sector-region-2017.pdf and https://www.adb.org/sites/default/files/institutional-document/414776/od-appendix1.pdf. 14 Source: OECD (2015) “Fostering Investment in Infrastructure”, p.5, available at https://www.oecd.org/daf/inv/investment-policy/Fostering-Investment-in-Infrastructure.pdf 15 Infrastructure needs in developing Asia and the Pacific will exceed $22.6 trillion through 2030, or $1.5 trillion per year, if the region is to maintain growth momentum. The estimates rise to over $26 trillion, or $1.7 trillion per year, adding in climate change mitigation and adaptation costs. Source: Asian Development Bank, 20I7, “Meeting Asia’s Infrastructure Needs”, https://www.adb.org/sites/default/files/publication/227496/special-report-infrastructure.pdf 16 See Section on Background in: “VISION AND ACTIONS ON JOINTLY BUILDING SILK ROAD ECONOMIC BELT AND 21ST-CENTURY MARITIME SILK ROAD”, Issued by the National Development and Reform Commission, Ministry of Foreign Affairs, and Ministry of Commerce of the People's Republic of China, with State Council authorization, March 2015, Belt and Road Forum For International Cooperation available at http://www.beltandroadforum.org/english/n100/2017/0410/c22-45.html 17 See Section on Background in: “VISION AND ACTIONS ON JOINTLY BUILDING SILK ROAD ECONOMIC BELT AND 21ST-CENTURY MARITIME SILK ROAD”, op. cit. 18 “How big is China’s Belt and Road”, J. Hillmann, Center for Strategic and International Studies, April 2018, at https://www.csis.org/analysis/how-big-chinas-belt-and-road. 19 Business Insider, January 31, 2018, www.businessinsider.com/what-is-belt-and-road-china-infrastructure-project-2018-1.

63
20 The Fund was initially endowed with $40 billion. The Chinese Premier pledged an additional $15 billion in May 2017. https://www.euromoney.com/article/b14t0s0j4ws7ql/making-sense-of-belt-and-road-the-chinese-driver-the-silk-road-fund. 21 South Asia Journal, April 30, 2018, http://southasiajournal.net/chinas-belt-and-road-initiative-ambition-and-opportunity/. 22 https://www.eastwest.ngo/idea/china%E2%80%99s-security-gambit-indian-ocean. 23 The pipeline allows tankers to offload at a terminal on Made Island in the Bay of Bengal oil that is later on piped across Myanmar to Yunnan province in China. It opened after years of delay. (https://www.reuters.com/article/us-myanmar-china-oil/beset-by-delays-myanmar-china-oil-pipeline-nears-start-up-idUSKBN16S0XF) 24 Source : https://www.axios.com/china-deepens-militarization-of-one-belt-one-road-initiative-889c773b-cd8b-4af4-95e7-ce0142c3a427.html 25 https://www.washingtontimes.com/news/2018/apr/18/china-military-ambitions-seen-one-belt-one-road/ 26 There are a number of overlapping territorial claims on the South China Sea involving littoral states such as China and several ASEAN members (Brunei, Malaysia, the Philippines, Vietnam for instance). Council on Foreign Relations, November 1, 2017, at: https://www.cfr.org/backgrounder/asean-association-southeast-asian-nations; Asia Times, April 2, 2018 http://www.atimes.com/article/china-philippines-seek-share-south-china-sea/; https://www.philstar.com/headlines/2018/05/23/1817927/does-philippines-have-limited-options-south-china-sea-issue; https://www.brookings.edu/opinions/singapore-sounds-an-optimistic-note-but-eyes-tough-year-ahead-as-asean-chair/, https://www.cnbc.com/2018/04/26/asean-what-you-need-to-know-about-the-globally-important-group.html/. 27 Source: Data from the IMF, Fiscal Monitor, April 2018; tables on General Government Gross Debt (% GDP) 28 These include: Djibouti, Kyrgyzstan, Laos, Maldives, Mongolia, Montenegro, Pakistan and Tajikistan. See John Hurley, Scott Morris, and Gailyn Portelance, 2018, “Examining the Debt Implications of the Belt and Road Initiative from a Policy Perspective”, Center for Global Development, CGD Policy Paper 121, Washington D.C, March 2018, at: https://www.cgdev.org/sites/default/files/examining-debt-implications-belt-and-road-initiative-policy-perspective.pdf 29 https://www.imf.org/en/News/Articles/2018/04/11/sp041218-belt-and-road-initiative-strategies-to-deliver-in-the-next-phase 30 https://www.imf.org/en/News/Articles/2018/04/11/sp041218-belt-and-road-initiative-strategies-to-deliver-in-the-next-phase 31 The Center will help train officials from China and other countries, including from those associated with the Belt and Road Initiative, in effective institution building and policymaking. Source: https://www.imf.org/en/News/Articles/2017/05/14/pr17167-imf-and-china-establish-a-new-center-for-modernizing-economic-policies-and-institutions and https://www.imf.org/en/News/Articles/2018/04/11/sp041218-belt-and-road-initiative-strategies-to-deliver-in-the-next-phase 32 Financial Times, 1 July 2018, “Malaysia resets China ties over lopsided deals” at https://www.ft.com/content/91aaf04a-8343-11e8-96dd-fa565ec55929, and Financial Times, July 5, 2018, “Malaysia suspends 22bn China-backed projects”, https://www.ft.com/content/409942a4-7f80-11e8-bc55-50daf11b720d 33 The new government also launched in this connection an investigation into possible links to a Malaysian state fund already involved in financial scandals Financial Times, July 5, 2018, “Malaysia suspends 22bn China-backed projects”, https://www.ft.com/content/409942a4-7f80-11e8-bc55-50daf11b720d 34 https://asia.nikkei.com/Spotlight/Cover-Story/Is-China-s-Belt-and-Road-working-A-progress-report-from-eight-countries 35 https://www.chinausfocus.com/finance-economy/reconsidering-the-belt-and-road-initiative 36 The “16+1 group” includes 11 members of the EU. The first Summit was held in 2012 in Poland. (http://ceec-china-latvia.org/page/about/). Recent Summits were organized between the “16+1” countries and China in Bulgaria in November 2017 and in July 2018.

64
REFERENCES Asian Development Bank (20I7), “Meeting Asia’s Infrastructure Needs”, Manila. Hurley J., S. Morris, and G. Portelance (2018), “Examining the Debt Implications of the Belt and Road Initiative from a Policy
Perspective”, Center for Global Development, CGD Policy Paper 121, Washington D.C, March 2018. IMF (2018), Fiscal Monitor, Washington D.C, April 2018; National Development and Reform Commission (2015) ,“Vision and Actions on Jointly Building Silk road Economic Belt and 21st-
Century Maritime Silk Road”, Issued by the National Development and Reform Commission, Ministry of Foreign Affairs, and Ministry of Commerce of the People's Republic of China, with State Council authorization, March 2015, Belt and Road Forum For International Cooperation available at http://www.beltandroadforum.org/english/n100/2017/0410/c22-45.html
OECD (2015), “Fostering Investment in Infrastructure”, Paris.

65
Annex 5.1. Development Banks: Basic information
Asian Infrastructure
Investment Bank
New Development
Bank World Bank
Asian Development Bank (ADB)
African Development Bank (AfDB) Inter-American Development
Bank (IDB)
Founding year 2014 (Launch year) 2016
(Opening) 2015 1944 1966 1963 1959
Member countries 77 members,
includes four members of the G-7
The BRICS: Brazil, Russia, India, China,
South Africa
188 67 80 countries, including 26 non-African
48 countries, including 24 non-borrowing members
Leading country
(voting power in parenthesis)
China (27.52%) India (7.92%) Russia (6.5%)
Voting power of regional
members: 77%
Voting power of non-regional members: 23%
Power equally shared USA (16.32%) Japan (7.04%) China (4.55%)
Germany (4.12%)
Japan (12.78%) USA (12.78%) China (5.45%) India (5.4%)
Australia (4.89%) Regional members: 65% of
voting power Non-regional members:
35%
Regional members (59.162%) Nigeria (9.271%) Egypt (5.589%)
South Africa (5.027%) Algeria (4.22%) Cote d’Ivoire (3.719%) Morocco (3.59%)
Non-regional (40.838%):
U.S.A. (6.583%), Japan (5.486%) Germany (4.135%), Canada (3.856%)
Borrowing members (50%) Argentina (11.534%) Brazil (11.534%) Mexico (7.299%)
Venezuela (3.403%) Colombia (3.119%) Chile (3.119%)
Non-borrowing (50%)
U.S.A. (30%), Japan (5%) Canada (4%), Spain (1.947%)
Short description
Multilateral financial institution founded to address infrastructure needs across Asia.
Established with the goal of financing infrastructure and sustainable development projects in BRICS and other emerging economies and developing countries.
Provides financial and technical assistance to promote development in the word. Twin goals: end extreme poverty by 2030 and boost shared prosperity.
Financial institution whose purpose is to promote social and economic development in Asia.
Multilateral development finance institution composed of the African Development Bank, the African Development Fund, and the Nigerian Trust Fund whose mission is to promote sustainable economic growth and reduce poverty in Africa.
A multilateral financial institution composed of the Inter-American Development Bank, the Inter-American Investment Corporation, and the Multilateral Investment Fund whose mission is to promote sustainable social and economic growth in Latin America and the Caribbean.
Paid-in capital to date $18.7 billion $10 billion $5.8 billion $17.4 billion $4.9 billion $6.039 billion
Subscribed capital $90 billion $50 billion $263.3 billion $142.6 billion $ 65.49 billion $170.9 billion
Lending commitment
-All in Asia - 2016 - September 2017: $3.1 billion
-All in BRICS (to date) - 2016 –September 2017: $2.5 billion of which $0.2 billion in Asia (India and China)
- Global -2016 - September 2017: $73 billion of which $28 billion in Asia
- Asia - 2016: $31.7 billion
- 2016-end: $10.8 billion - West Africa: 25.8% ($2.786 billion) - North Africa: 25.5% - Improve Quality of Life: 52% ($5.648
billion) - Light-up and Power Africa: %19
($1.05 billion)
- In 2017: $11.4 billion - In 2016: $9.3 billion - 72 projects ($6 billion) - 14 policy-based ($3.3 billion.) - 40% Infrastructure & Environment
($3.69 billion.) - 35% Institutional capacity ($3.239
billion.)
Source: Authors’ analysis based on data on the following all accessed June 2018— AIIB https://www.aiib.org/en/about-aiib/financial-statements/.content/index/pdf/AIIB-Bank-2017-Auditors-report-FS.pdf, NDB https://www.ndb.int/about-us/organisation/members/, WB http://siteresources.worldbank.org/BODINT/Resources/278027-1215524804501/IBRDCountryVotingTable.pdf, ADB https://www.adb.org/sites/default/files/page/30786/ar2017-oi-appendix1.pdf, IDB https://www.iadb.org/en/about-us/capital-stock-and-voting-power%2C3166.html, and AfDB https://www.afdb.org/en/about-us/corporate-information/.

66
Special contributions
OECD Development Center and Emerging Markets Research Network

67
Chapter 6 Impact of digitalization on businesses in emerging markets Contribution of EMnet, OECD Development Center
6.1. Drivers of digitalization
A. Challenges arising from the development of digitalization
B. Digitalization in Emerging Asia
6.2. Business insights on opportunities and challenges posed by digitalization in emerging markets
A. Digitalization offers access to new markets
B. Digital technologies spur productivity growth and innovation
C. Education and formal training on ICT are key prerequisites to benefit from digitalization
D. Digital infrastructure is a key enabler of connectivity
E. Governments need to improve the regulatory environment to facilitate digital growth
6.3. Conclusion
Executive Summary
Digital innovation is expected to transform global economy and business. New digital technologies are transforming business operations and pushing manufacturers toward the next production revolution, which will have a significant impact on productivity, skills, income distribution, well-being and the environment (OECD, 2017a). The Internet of Things, big data analytics, artificial intelligence and blockchain are key components of this transformation (OECD, 2017b). For example, it has been calculated that the adoption of the Internet of Things can reduce production costs by over 25% (OECD, 2017a). In the long term, three-dimensional (3D) printing, machine learning and enhanced connectivity are expected to have an even bigger impact and further elevate business performance across functions (IEA, 2017). Studies show that digitalization in inventory management through 3D printing, deep machine learning and real-time supply chain optimization could decrease the cost of inventory holding by 20-50%, while data analytics could increase forecasting accuracy up to 85% in matching supply with demand (McKinsey, 2016a). Finally, digitalization can enable companies to optimize customer experience toward immediacy, personalization and convenience.

68
Introduction
Digitalization significantly contributes to economic growth in global and emerging markets. Research shows that each additional 10% of Internet penetration adds 0.77% growth to per capita GDP growth in developed countries and 1.12% in emerging markets (World Bank, 2009). Furthermore, each additional 10% of broadband penetration contributes to 1.21% per capita GDP growth in developed countries and 1.38% in emerging markets (World Bank, 2009).
Digitalization is expanding rapidly in emerging markets but with disparities. Emerging markets account for almost 90% of the total growth in mobile broadband subscriptions over the past five years (IEA, 2017). However, the development of the digital economy varies across regions. In Asia, the rate of Internet use is around 80% in Singapore, Malaysia and Brunei Darussalam, while Laos, Myanmar, Indonesia and Cambodia are close to 20% (OECD, 2018a). The size of the e-commerce market in India is only 10% of that of China (ITU, 2017a). Africa, on average, has the world’s lowest mobile penetration at 73%, in comparison of 98% in high-income countries. Furthermore, in Africa a significant gender disparity still exists in regards to access to digital technologies (World Bank, 2016).
6.1. Drivers of digitalization
The rapid development of digital technologies and their impact on economy and society can be explained by a number of different factors. A closer look at the priorities for national digital strategies shows that the development of broadband infrastructure, the availability of qualified skills, the use of digital technologies in various business activities and the enhancement of public sector services, can be identified as key drivers for digitalization (OECD, 2017b).
Development of broadband infrastructure Emerging markets are improving their broadband infrastructure to support digitalization. In Malaysia, the High-Speed Broadband project increased the broadband penetration from 22% to 66% within less than four years (World Economic Forum, 2013). In China, a total of 90,000 kilometers of high-speed fiber-optic trunk cables will be built, expected to expand the broadband network coverage to all urban areas and 90% of the countryside by 2018 (China Daily, 2017). In Africa, the Main One’s cable system was the first submarine cable to connect West Africa with Europe and bring open-access, broadband capacity to multiple African countries (CNN, 2012). Furthermore, the South Atlantic Undersea Cable will connect by the end of 2018 the Brazilian coast with Angola and Africa (Angola Cables, 2018). Brazil furthermore succeeded in bringing affordable broadband access to all municipalities under the National Broadband Plan (TechinBrazil, 2017).
Availability of qualified skills Many emerging markets are putting more efforts in developing information and communication technology (ICT) skills and literacy to support digitalization. Malaysia, for example, has launched the program “My Digital Maker” to teach coding as part of the national school curriculum. The Thailand Digital Government Academy (TDGA) was established to promote development of digital knowledge of government authorities and public officials in Thailand. In Africa, the “Africa Code Week” initiative empowered 1.3 million youths with basic coding skills in 35 countries, such as Mauritius, Ghana and South Africa, in 2017 (Appsafrica, 2017). Latin American countries like Chile, Colombia and Peru have also established programs to connect schools, build digital literacy and improve digital skills (The Boston Consulting Group, 2012).
Use of digital technologies in business In OECD countries, it has been estimated that three-quarters of businesses have an online presence and almost as many engage in e-commerce (OECD, 2017a). However, while 75% of consumers accessed the Internet across the OECD countries, only one out of two made an online purchase (OECD, 2016a). In emerging markets, e-commerce penetration is increasing fast. Around 50% of the online population is expected to engage in e-commerce by 2018 (World Economic Forum, 2014).

69
Particularly relevant for emerging markets is the widespread use of digital finance, including mobile wallets, online payments and digital savings accounts. Studies show that this sector could boost annual GDP of all emerging markets by $3.7 trillion by 2025 (McKinsey, 2016b). In Asia, China leads the sector’s growth with a developed market of third-party payments, deep penetration of digital wealth management products and various innovations in financing methods, such as supply chain financing, consumer financing and peer-to-peer lending (McKinsey, 2016c). In Africa, digital finance is developing rapidly, especially in Kenya through widespread adoption of the mobile money system M-Pesa (World Economic Forum, 2013). Cross-border remittance models have also gained popularity in East and West Africa. For example, Orange operates an international money transfer service that links Côte d’Ivoire, Mali and Senegal (GSMA, 2016a). In Latin America, online lending is transforming Mexico’s credit market (Americas Market Intelligence, 2016). Furthermore, the dLocal platform is enabling cross-border e-commerce transactions across Brazil, Mexico and much of Latin America (dLocal, 2018).
Digital government services The development of digitalization in emerging markets can be encouraged by its application in government services. According to a recent survey on e-government led by the United Nations, many emerging economies, such as China, South Africa and many Latin American countries, show a high level of e-government development (UN, 2016). Meanwhile, more countries are increasing their e-government standards. Thailand, for example, has introduced e-Government Portal to serve as a central information center to facilitate people accessing public services provided by different government agencies (OpenGov, 2018). India also launched many e-governance initiatives, such as e-filing of income tax (Government of India, 2018a) and e-procurement (Government of India, 2018b).
A. Challenges arising from the development of digitalization
Digitalization is transforming the way the private sector conducts business in OECD countries as well as emerging economies. However, a number of challenges exist that can hinder its development and the benefit for businesses and society.
Recent OECD analysis highlighted four key policy challenges related to digitalization of industrial production that concern access to ICT infrastructures, barriers to interoperability, issues of liability, transparency and ownership and digital security and privacy (OECD, 2017a). Many businesses still lag in adopting advanced ICTs such as cloud computing and ERP (Enterprise Resources Planning) because of proprietary issues and data security concerns (OECD, 2017a). In 2016, only 20% of businesses had adopted cloud computing and less than 10% had adopted big data analytics (OECD, 2017b). Lack of interoperability and regulatory barriers in mobile communications markets can impede the development of the Internet of Things (OECD, 2017b). Poor data quality, disruptive factors in the environment, misuse of data and security breaches are major digital issues for the development of digitalization (OECD, 2017b). Digital risk and lack of trust can also prevent businesses and consumers from adopting digital technologies and applications.
Some policy initiatives can help overcome these challenges. Close co-operation between the private and public sectors is recommended to close the digital divide in emerging markets. In Malaysia, the government co-operated with Alibaba to launch the first Digital Free Trade Zone, which promoted digital capabilities and encouraged cross-border e-commerce (Malaysia Digital Economy Corporation, 2017). Emerging markets can also overcome the infrastructure constraints through the adoption of new technologies. Kenya, for example, partnered with Microsoft to bring affordable Internet access to rural areas through a solar-powered wireless broadband network (World Economic Forum, 2013). Furthermore, digital infrastructure can be used to enhance local public services. Under the national strategy “Digital New Silk Road”, by incorporating digital sectors into international trade routes, China has put many efforts in developing “smart cities” through innovative services for citizens, such as barcodes for accessing city information and facial recognition software for bus fare collection (Council on Foreign Relations, 2017).

70
B. Digitalization in Emerging Asia1
Growth in Emerging Asian economies is predicted to remain robust. GDP in Emerging Asia is expected to grow by an average 6.3% annually during 2018-22, according to the 2018 OECD Economic Outlook for Southeast Asia, China, and India. Southeast Asia (the ten ASEAN member states) is estimated to achieve an average economic growth of 5.2% from 2018 to 2022, supported by robust private consumption and infrastructure development projects. China’s growth rate is expected to slow down to an average of 6.2% following structural reform challenges, while India’s growth rate will remain robust at 7.3%, stimulated by private consumption, foreign investment and government spending.
In this positive context, the development of digitalization can further facilitate business activities, promote international trade and boost productivity in the manufacturing and services industries.
Business activities In the manufacturing industry, digital technologies provide new solutions for production, communication, supply chain management and customer relationship management. In services, ICT has made services storable, transportable and tradeable. In Vietnam and China, for example, more than 80% of manufacturing and services firms use email in communication with clients and suppliers.
Trade ICT products have been among the most dynamic components of trade in Emerging Asia. In most of the region, especially India, Brunei Darussalam and Indonesia, there was a noticeable growth in computer and telecommunications services embodied in manufacturing exports between 2000 and 2011. Emerging Asia is relatively important as a source of foreign inputs that feed into countries’ own exports (see Figure 6.1) and higher regional integration could further enhance the potential of trade.
Figure 6.1. Computer and telecommunications services embodied in manufacturing exports as a percentage of gross exports, 2000 and 2011.
Source: OECD-WTO Database on Trade in Value-Added.
Productivity
Digital technologies are a key factor to enhance business productivity, by improving flexibility, transparency, market competition and by reducing the costs of production and inventory management. It has been calculated that firms with ICT use had on average 196.6% the total-factor productivity level of other businesses in Vietnam, 153.0% in Indonesia, 138.8% in Myanmar and 138.8% in China.
Many countries in Emerging Asia have achieved a significant growth of digitalization. China is outpacing
other countries in the region through massive investments in 4G infrastructure, competitive mobile handset marketplaces, numerous popular mobile services (WeChat, Sina Weibo and Taobao) and leading technologies in

71
artificial intelligence (Tufts University, 2017). In Vietnam, IT-enabled services such as software services and business process outsourcing (BPO) are growing. In the Philippines, knowledge process offshoring, a movement from BPO into higher-value-added activities based on research and information gathering, is becoming more common.
However, the level of digitalization varies across the region. In Indonesia, problems such as a lack of quality ICT infrastructure, high Internet prices and a shortage of skilled workers are limiting the benefits of digitalization. In the Philippines, slow Internet broadband speed and challenges in online payments affect the development of the e-commerce sector are having a similar effect. Thailand needs to improve infrastructure and ICT skills to catch up in business competitiveness with its neighbors. In Vietnam, the growth of the e-commerce sector has been slowed down by security concerns. Cambodia, Laos and Myanmar still need to develop their basic ICT and digital infrastructure.
Despite disparities in access to digital technologies, some regional common challenges can be identified.
Policy restrictions on investment and trade pose challenges to digitalization. Restrictions on FDI and trade in goods and services remain relatively high in Emerging Asia. In Malaysia, the Philippines, Vietnam and China, restrictions on FDI in the communications sector are more stringent than the national averages for all sectors generally. In China, India and Indonesia, telecommunications and computer services face greater trade restrictions than the OECD average, according to the OECD Services Trade Restrictiveness Index (OECD, 2018b). Countries also face regulatory challenges on the protection of intellectual property rights on traded digital goods and services. Underdeveloped infrastructure constrains the development of digital economy. Relative to population, India, Indonesia, Cambodia, Laos and Myanmar have fewer secure Internet servers than Singapore and other Emerging Asian countries, less high-speed broadband Internet, with the exception of Indonesia, and relatively high Internet prices, together with the Philippines. High-speed connections are a particular issue for India and the Philippines. Furthermore, the price of fixed broadband exceeds the affordability threshold of 5% of gross net income in several countries, including India, the Philippines, Indonesia, Laos, Cambodia and Myanmar.
Shortage of skilled workers and digital literacy can limit the progress of digitalization. According to a survey from the National Statistical Office of Thailand, a lack of knowledge is the principal reason limiting the use of Internet by the population. In Indonesia, which aims to become the largest digital economy in Southeast Asia, the availability of qualified skills remains a serious issue for the ICT sector, mainly because of low tertiary education enrolment rates.
6.2. Business insights on opportunities and challenges poses by digitalization in emerging markets
Participants in the business meeting on digitalization, organized by the OECD Emerging Markets Network (EMnet) and held in Paris on March 2, 2018, agreed that growing connectivity and rapid expansion of digital technologies such as e-commerce, digital financial services and e-government have generated numerous opportunities for businesses in emerging markets (OECD, 2018h). Firms formerly limited to traditional markets have now the possibility to access e-commerce platforms and reach out to consumers across the globe. Digital payments enable individuals, businesses and governments to make financial transactions cheaply and simply. E-government
facilitates the relationship between public administrations and companies.
A. Digitalization offers access to new markets
Digitalization can substantially lower market entry barriers, enabling companies to tap into markets that would be otherwise inaccessible. Reduced transaction and delivery costs, higher proximity to consumers and greater diffusion of information allow firms to bring new products and services to new and untapped markets. E-commerce was particularly mentioned as a sector with significant opportunities for growth in emerging markets (OECD, 2018h).

72
China has become the world’s largest B2C e-commerce market and the third-largest B2B market and has witnessed the emergence of world leading firms such as the Alibaba Group and JD.com (OECD/WTO, 2017).
Figure 6.2. B2C e-commerce sales worldwide, by region, 2013 and 2018.
Source: OECD/WTO (2017), Aid for Trade at a Glance 2017: Promoting Trade, Inclusiveness and Connectivity for Sustainable Development.
B. Digital technologies spur productivity growth and innovation
Digital technologies can help companies improve efficiency and achieve productivity gains. There is evidence showing that businesses adopting advanced information and communication technologies drive innovation, enhance productivity and increase market shares (OECD, 2016c). National economies benefit from digital technologies too. Digital finance serves as a key driver of productivity growth and competitiveness and has great potential to boost the GDP of emerging economies (McKinsey, 2016d). It is estimated that over two-thirds of the contribution to the predicted GDP growth from digital financial services is due to increased productivity (Figure 6.3).
Figure 6.3. GDP impact of digital financial services by channel (%)
Based on average GDP growth forecast of emerging countries from IHS and Oxford Economics. Note: Numbers may not sum due to rounding. Source: IHS; Oxford Economics; McKinsey Global Institute analysis.
In addition, digital finance can innovate business operations through better data collection and analysis. By tracking customers’ financial transactions via mobile devices, companies are able to collect information on consumers’ behavior and provide better customized services (IFC/The MasterCard Foundation, 2017).
The OECD has calculated that the adoption of the Internet of Things can reduce production costs by over 25% (OECD, 2017b). In the long term, three-dimensional (3D) printing, machine learning and enhanced connectivity are expected to have an even bigger impact (IEA, 2017). It has been estimated that digitalization in inventory
0
500
1,000
1,500
2,000
2,500
2013 2018
US
D b
illi
on
Middle East and Africa
Central and EasternEuropeLatin America
Western Europe
Asia-Pacific
North America

73
management through 3D-printing, deep learning and real-time supply chain optimization could decrease the cost of inventory holding by 20-50%, while data analytics could increase forecasting accuracy up to 85% in matching supply with demand (McKinsey, 2016a).
C. Education and formal training on ICT are key prerequisites to benefit from digitalization
Skill shortages have increasingly been a global issue, as 40% of employers worldwide reported having difficulty in filling job positions in 2016. Furthermore, IT staff jumped to the second position among talents that are hard to find (ManpowerGroup, 2017). Shortages of digital skills are a significant problem for emerging markets to accompany their fast-growing digital economies and, as mentioned by EMnet participants, for firms to be able to make new investments (OECD, 2018c). In China, for example, a shortage of more than 1.5 million of professionals working with big data was estimated in 2015 (APEC, 2017).
D. Digital infrastructure is a key enabler of connectivity
EMnet participants highlighted how infrastructure remains one of the main barriers for the development of the digital economy. Limited accessibility to enhanced mobile and fixed broadband infrastructure, in particular, was highlighted as a primarily constraint, particularly in rural areas (OECD, 2018h). Businesses expressed how this infrastructure gap could limit SMEs in rural regions from participating in e-commerce trade (OECD, 2018c). Weak logistics infrastructure, especially outside urban areas, can be another key barrier to e-commerce in emerging markets (OECD/WTO, 2017).
Inadequate power infrastructure is another common bottleneck to e-commerce (OECD/WTO, 2017). Information and communications technologies, including data centers, data transmission networks and connected devices, have emerged as an important source of energy consumption (IEA, 2017a). In spite of numerous efforts to increase electrification, many areas in Africa are not yet entirely connected to the grid or suffer from frequent outages (OECD 2018e).
E. Governments need to improve the regulatory environment to facilitate digital growth
EMnet participants highlighted that the demand for pro-investment policies and modernized regulatory regimes on digitalization has never been greater. However, the pace of policy reforms in emerging economies have not kept up with the evolving needs of digital ecosystems (OECD, 2018c). For example, stringent financial licensing agreements and restrictions on the ability of foreign e-commerce companies to penetrate local markets have become major regulatory barriers (OECD/WTO, 2017). In India, for example, foreign e-commerce companies are prohibited from selling their own goods (OECD/WTO, 2017).
6.3. Conclusion
The EMnet business meeting highlighted several important aspects of digitalization, including how rapid expansion and adoption of digital technologies such as e-commerce, digital financial services and e-government have the potential to generate abundant opportunities in emerging economies. New digital technologies can enhance firms' productivity and efficiency through time and cost reduction and provide the ability to bring innovation to emerging markets.
In order to accelerate the digital transformation, EMnet participants highlighted how issues such as ICT skill shortages, infrastructure gaps and regulatory barriers need to be addressed with close collaboration between the public and private sector. Policymakers and regulators need to focus on improving the enabling environment to attract further investment and reap the full benefits of digitalization.

74
REFERENCES
Americas Market Intelligence (2016), “Payments in Latin America: Under Digital Transformation”, https://static1.squarespace.com/static/557dd429e4b035c8591b78e0/t/5807dfdfbe6594bf4a4a3769/147691108.
Angola Cables (2018), "SACS Undersea cables makes landfall in Fortaleza, Brazil", https://www.angolacables.co.ao/sacs-undersea-cable-makes-landfall-in-fortaleza-brazil/?lang=en
APEC (2017), Data Science and Analytics Skills Shortage: Equipping the APEC Workforce with the Competencies Demanded by Employers, APEC SOM Steering Committee on Economic and Technical Cooperation(SCE), APEC Human Resource Development Working Group, APEC Publishing, Singapore https://www.apec.org/Publications/2017/11/Data-Science-and-Analytics-Skills-Shortage
Appsafrica (2017), “1.3M Young Africans Learnt Coding During Africa Code Week”, www.appsafrica.com/1-3m-young-africans-learnt-coding-africa-code-week-2017/.
BBVA Research (2018), “Accelerating Digitalization in Emerging Markets”, www.bbvaresearch.com/wp-content/uploads/2018/03/EMnet-Accelerating-Digitalisation_BBVA_AlvaroOrtiz_March2018new.pdf
Business Sweden (2016), “Internationalisation through Digitalization”, Business Sweden, https://www.business-sweden.se/contentassets/027f86ad2aa04af8b57e5011deaad53f/internationalisation-through-digitalisation_final.pdf
China Daily (2017), “China to Invest 1.2 Trillion Yuan in Information Infrastructure”, www.chinadaily.com.cn/business/tech/2017-01/13/content_27945298.htm.
Council on Foreign Relations (2017), “Beijing's Silk Road Goes Digital”, www.cfr.org/blog/beijings-silk-road-goes-digital.
CNN (2012), "Underwater cables bring faster internet to West Africa", https://edition.cnn.com/2012/01/10/business/funke-opeke-cable-internet/index.html.
DLocal (2018), DLocal website, www.dlocal.com/ (accessed October 29, 2018).
EIB/UNCDF (2014), Digital Financial Services in Africa: Beyond the Kenyan Success Story. European Investment Bank/UN Capital Development Fund, http://www.eib.org/attachments/country/study_digital_financial_services_in_africa_en.pdf
Government of India (2018a), Income Tax Department website, https://incometaxindiaefiling.gov.in/main/aboutUs (accessed October 29, 2018).
Government of India (2018b), Ministry of Electronics and Information Technology website, http://meity.gov.in/content/e-procurement (accessed October 29, 2018).
Government of Rwanda (2013), “Rwanda signs joint venture agreement with Korea Telecom for establishment of countrywide 4G network”, http://www.gov.rw/newsdetails2/?tx_ttnews%5Btt_news%5D=168&cHash=0f1a01e22362fd833296c274225bef02
GSMA (2017a), Scaling digital health in developing markets- Opportunities and recommendations for mobile operators and other stakeholders, GSMA Association, https://www.gsmaintelligence.com/research/?file=c581aa43bdb7b7d236bb937698c2d6fd&download
GSMA (2017b), The Mobile Economy Asia Pacific 2017, GSMA Association, https://www.gsmaintelligence.com/research/?file=67a750f6114580b86045a6a0f9587ea0&download.
GSMA (2016a), The Mobile Economy 2016, GSMA Association, www.gsmaintelligence.com/research/?file=97928efe09cdba2864cdcf1ad1a2f58c&download
GSMA (2016b), The State of Mobile Money in Sub-Saharan Africa, GSMA Association www.gsma.com/mobilefordevelopment/wp-content/uploads/2017/07/2016-The-State-of-Mobile-Money-in-Sub-Saharan-Africa.pdf
IEA (2017), Digitalization and Energy, OECD/IEA Publishing, Paris, www.iea.org/publications/freepublications/publication/DigitalizationandEnergy3.pdf
IFC/The MasterCard Foundation (2017), Data Analytics and Digital Financial Services, International Finance Corporation, https://www.ifc.org/wps/wcm/connect/22ca3a7a-4ee6-444a-858e-374d88354d97/IFC+Data+Analytics+and+Digital+Financial+Services+Handbook.pdf?MOD=AJPERES
ITC (2016), Bringing SMEs onto the E-commerce Highway. ITC, Geneva, http://www.intracen.org/uploadedFiles/intracenorg/Content/Publications/Bringing%20SMEs%20onto%20the%20e-Commerce%20Highway_final_250516_Low-res.pdf
ITU (2017a), Measuring the Information Society Report, ITU, Geneva, www.itu.int/en/ITU-D/Statistics/Documents/publications/misr2017/MISR2017_Volume1.pdf
ITU (2017b), ITU Statistics - ICT data for the world by geographic regions and by level of development (2005 - 2017), https://www.itu.int/en/ITU-D/Statistics/Pages/stat/default.aspx (Accessed on September 26, 2018).
ITU (2015), Measuring the Information Society Report 2015, ITU, Geneva, https://www.itu.int/en/ITU-

75
D/Statistics/Documents/publications/misr2015/MISR2015-ES-E.pdf
KT (2018), “KT Rwanda Networks – Enabling Rwanda’s Development through Broadband Internet Access”, KT Rwanda Networks Newsletter, https://www.ktrn.rw/newsletter
Malaysia Digital Economy Corporation (2017), “Malaysia Launches the World’s First Free Trade Zone”, www.mdec.my/news/malaysia-launches-worlds-first-digital-free-trade-zone#.
ManpowerGroup (2017), “2016/2017 Talent Shortage Survey”, www.manpowergroup.com/wps/wcm/connect/389b7a9d-cfe2-4b22-bd61-f0febc709cd6/2016_TSS_Global_Infographic+-+Final.pdf?MOD=AJPERES
McKinsey Global Institute (2016a), “Digital in industry: From buzzword to value creation”, McKinsey & Company, www.mckinsey.com/business-functions/digital-mckinsey/our-insights/digital-in-industry-from-buzzword-to-value-creation.
McKinsey Global Institute (2016b), “How Digital Finance Could Boost Growth in Emerging Economies”, McKinsey & Company, www.mckinsey.com/global-themes/employment-and-growth/how-digital-finance-could-boost-growth-in-emerging-economies
McKinsey Global Institute (2016c), “Disruption and Connection: Cracking the Myths of China Internet Finance Innovation”, McKinsey & Company, https://www.mckinsey.com/~/media/mckinsey/industries/financial%20services/our%20insights/whats%20next%20for%20chinas%20booming%20fintech%20sector/disruption-and-connection-cracking-the-myths-of-china-internet-finance-innovation.ashx.
McKinsey Global Institute (2016d), “Digital Finance for All: Powering Inclusive Growth in Emerging Economies”, McKinsey & Company, https://www.mckinsey.com/featured-insights/employment-and-growth/how-digital-finance-could-boost-growth-in-emerging-economies.
McKinsey Global Institute (2016e), “Digital Globalisation: The New Era of Global Flows”, McKinsey & Company, https://www.mckinsey.com/business-functions/digital-mckinsey/our-insights/digital-globalization-the-new-era-of-global-flows
OECD (2018a), Economic Outlook for Southeast Asia, China and India 2018: Fostering Growth through Digitalization, OECD Publishing, Paris, http://dx.doi.org/10.1787/9789264286184-en.
OECE (2018b), Services Trade Restrictiveness Index (STRI), http://www.oecd.org/tad/services-trade/services-trade-restrictiveness-index.htm (Accessed on October 29, 2018)
OECD (2018c), Business Insights on Emerging Markets 2018, OECD Emerging Markets Network, OECD Development Centre, Paris, http://www.oecd.org/dev/oecdemnet.htm
OECD (2018d), OECD Economic Outlook 2018, Issue 1, May, OECD Publishing, Paris, https://doi.org/10.1787/16097408
OECD (2018e), Industrialisation and Entrepreneurship in Africa, OECD forthcoming publication, http://www.oecd.org/dev/oecdemnet.htm
OECD (2018f), OECD Interim Economic Outlook 2018, OECD Publishing, Paris, http://www.oecd.org/eco/outlook/
OECD (2018g), “Achieving Inclusive Growth in the Face of Digital Transformation and the Future of Work”, OECD report to G-20 Finance Ministers, Paris, https://www.oecd.org/g20/OECD_Achieving%20inclusive%20growth%20in%20the%20face%20of%20FoW.pdf
OECD (2018h), Accelerating Digitalization in Emerging Asia, OECD forthcoming publication, http://www.oecd.org/dev/oecdemnet.htm
OECD (2018i), Industrialisation and Entrepreneurship in Africa, OECD forthcoming publication, http://www.oecd.org/dev/oecdemnet.htm
OECD (2018j), The Digital Economy, Multinational Enterprises and International Investment Policy, OECD Publishing, Paris, http://www.oecd.org/daf/inv/investment-policy/the-digital-economy-multinational-enterprises-and-international-investment-policy.htm
OECD (2017a), The Next Production Revolution: Implications for Governments and Business, OECD Publishing, Paris, http://dx.doi.org/10.1787/9789264271036-en.
OECD (2017b), OECD Digital Economy Outlook 2017, OECD Publishing, Paris, http://dx.doi.org/10.1787/9789264276284-en.
OECD (2017c), “Key Issues for Digital Transformation in the G20”. Report prepared for a joint G20 German Presidency/OECD conference, OECD, Paris, https://www.oecd.org/g20/key-issues-for-digital-transformation-in-the-g20.pdf
OECD (2017d), OECD Telecommunication and Broadcasting Review of Mexico 2017, OECD Publishing, Paris, http://dx.doi.org/10.1787/9789264278011-en
OECD (2017e), “OECD-ASEAN Business Statement”, OECD, Paris, www.oecd.org/southeast-asia/events/regional-forum/SEARF_2017_Business_Statement.pdf

76
OECE (2017f), “Business Insights on Emerging Markets 2017”, OECD Development Centre, Paris, http://www.oecd.org/dev/oecdemnet.htm
OECD (2016a), "Consumer protection laws need updating to improve trust in e-commerce", OECD Newsroom, http://www.oecd.org/newsroom/consumer-protection-laws-need-updating-to-improve-trust-in-e-commerce.htm
OECD (2016b), “Executive Summary on Symposium on Technology, Innovation and Inclusive Growth: Future Perspectives”, OECD Innovation for Inclusive Growth Project, Paris, https://www.innovationpolicyplatform.org/system/files/Symposium%20TechnologyInclusive%20Brochure.pdf
OECD (2016c), “Digital Government Strategies for Transforming Public Services in the Welfare Areas”, OECD Comparative Study, Paris, http://www.oecd.org/gov/digital-government/Digital-Government-Strategies-Welfare-Service.pdf
OECD (2014), Addressing the Tax Challenges of the Digital Economy, OECD/G20 Base Erosion and Profit Shifting Project, OECD Publishing, Paris, http://dx.doi.org/10.1787/9789264218789-en.
OECD/WTO (2017), Aid for Trade at a Glance 2017: Promoting Trade, Inclusiveness and Connectivity for Sustainable Development, World Trade Organisation, Geneva/OECD Publishing, Paris, http://dx.doi.org/10.1787/aid_glance-2017-en.
OpenGov (2018), “Thailand PM Announces Digital Government Plan 2017-2021 to Achieve Integrated, Citizen-centric Digital Government within 5 years”, https://www.opengovasia.com/thailand-pm-announces-digital-government-plan-2017-2021-to-achieve-integrated-citizen-centric-digital-government-within-5-years/
TechinBrazil (2017), “Overview of the Brazil's National IoT Plan”, https://techinbrazil.com/overview-of-the-brazil-s-national-iot-plan.
The Boston Consulting Group (2012), “Adapt and Adopt: Governments’ Role in Internet Policy”, www.bcgperspectives.com/content/articles/digital_economy_public_sector_adapt_adopt_government_role_internet_policy.
Tufts University (2017), Digital Planet 2017, The Fletcher School, Tufts University, https://sites.tufts.edu/digitalplanet/files/2017/05/Digital_Planet_2017_FINAL.pdf.
UN (2018), United Nations E-government Survey 2018, United Nations, New York, https://publicadministration.un.org/egovkb/en-us/Reports/UN-E-Government-Survey-2018
UN (2016), United Nations E-government Survey 2016, United Nations, New York http://workspace.unpan.org/sites/Internet/Documents/UNPAN97453.pdf.
UNCTAD (2014), World Investment Report 2014. Investing in SDGs: An Action Plan, United Nations Conference on Trade and Development, Geneva. https://unctad.org/en/PublicationsLibrary/wir2014_en.pdf
UN-OHRLLS (2017), “Leveraging Investments in Broadband for National Development: The case of Rwanda and Senegal”, UN-OHRLLS, New York, https://unohrlls.org/custom-content/uploads/2017/07/Leveraging-Investments-in-Broadband-for-National-Development-2017.pdf
World Bank (2018), “Performance and Learning Review of the Country Partnership Framework”, World Bank Washington, DC, http://documents.worldbank.org/curated/en/749131523066460918/pdf/FINAL-Uruguay-PLR-FY16-to-FY20-P164203-FOR-SEPCO-FINAL-CLEARED-BY-RVP-March-7-2018-03142018.pdf
World Bank (2016), World Development Report 2016: Digital Dividends, World Bank Washington, DC, https://doi.org/10.1596/978-1-4648-0671-1.
World Bank (2009), Economic Impacts of Broadband in Information and Communications for Development 2009: Extending Reach and Increasing Impact, World Bank Washington, DC, http://siteresources.worldbank.org/EXTIC4D/Resources/IC4D_Broadband_35_50.pdf .
World Economic Forum (2013), “Delivering Digital Infrastructure – Advancing the Internet Economy”, http://reports.weforum.org/delivering-digital-infrastructure/introduction-the-digital-infrastructure-imperative/?doing_wp_cron=1538064554.6309731006622314453125
World Economic Forum (2014), “E-commerce in Emerging Markets”, www.weforum.org/agenda/2014/11/growth-e-commerce-emerging-markets/.
NOTES
1 Countries forming Emerging Asia are the ten ASEAN member states (Indonesia, Malaysia, Philippines, Thailand, Vietnam, Brunei Darussalam, Singapore, Cambodia, Laos and Myanmar), China and India.

77
Chapter 7 Digital transformation in emerging markets: strategies and internationalization of digital companies from Latin America Fernanda Cahen and Moacir Miranda de Oliveira Jr. FEA, Universidad de São Paulo, São Paulo, Brazil
7.1. What makes digital companies unique?
7.2. Digital globalization as an opportunity for eMNCs
7.3. Digital transformation in Latin America: Trends and attractiveness in e-commerce and digital business opportunities
7.4. Digital companies from Latin America: strategies and internationalization of new businesses
7.5. Improving the ecosystems for digital startups in Latin America
7.6. Challenges
7.7. Conclusion
Executive Summary
This chapter examines the rise of Internet-based entrepreneurial business in emerging markets. We overview this phenomenon in various countries and focus the analyses on digital business from Latin America. We examine the strategies of these innovative digital companies and show how some local business environments in Latin America have contributed to high-tech entrepreneurship, especially for digital businesses with an important international footprint.

78
Introduction
Entrepreneurial high-tech ventures from emerging markets are increasingly influencing the international marketplace. Small and nascent companies (startups) are leading this process; of these startups, digital companies (businesses completely based on the Internet), and mixed players (such as e-commerce companies, software development and services, software security, digital medicine, fintechs and agtechs) have had the largest impact.1 Academics and practitioners have often overlooked digital companies from emerging markets, particularly those from Brazil and Mexico, because they have not yet gained worldwide recognition for sophisticated high-tech products and services.
Not only are entrepreneurial small digital companies blooming in various regions of emerging markets, but there are also emerging digital giants. More than half of all unicorns (companies with a valuation of $1 billion or more) in the world are based in the U.S. and other developed countries. However, there are an increasing number appearing in China, India, Argentina, Brazil and other emerging markets.2
International markets are no longer just for large and mature MNCs. Small businesses worldwide are joining the biggest platforms and e-commerce marketplaces to reach new markets and connect with users, customers and suppliers around the world. Emerging countries can derive significant economic benefits from the proliferation of digital companies and from digital development. For example, Amazon now hosts two million third-party sellers, while some 10 million small businesses are merchants on Alibaba. Facebook estimates that more than 50 million small businesses use its platform, up from 25 million in 2013; in addition, some 30% of its users are cross-border (McKinsey, 2016). These digital marketplaces and digital platforms are creating new markets, opening up new business models and opportunities for emerging countries’ startup entrepreneurs.
7.1. What makes digital companies unique?
We classify firms into two groups within the digital economy:3 digital companies characterized by the Internet’s central role in their operating and delivery model and ICT companies that provide infrastructure that make the Internet accessible to individuals and businesses. In this chapter, we focus on the digital MNCs. There are two subsets in this group:
Pure digital companies derive all of their revenue from transactions conducted in virtual marketplaces. Pure digital companies include Internet platforms (such as social networks and digital games, which allow users to interact with each other), providers of digital solutions (cloud players, digital payment operators, Internet-based service providers, and Internet solutions) and producers and distributors of digital content (portals, digital animation, digital media and entertainment).
Mixed players are e-commerce companies and other businesses with high levels of digitalization with mixed business models that combine a prominent digital dimension with the delivery of a physical product or service.
These two subsets comprise companies with intense digital business strategies and high international engagement. Their international engagement, however, does not involve FDI that is comparable to traditional MNCs. These companies’ engagement in the digital landscape has allowed them to break free from the traditional correlation between foreign assets and foreign sales. In turn, their physical presence through FDI is less necessary, resulting in new ways to access international markets. Their digital presence reduces cross-border information asymmetries and allows these companies to re-draw organizational boundaries to access users and virtual consumers worldwide. This business model represents a different pattern of early and accelerated international engagements with less physical presence. Autio and Zander (2016) defined this process as ‘lean internationalization’.
Pure digital companies show the highest gap between (low) foreign assets and (high) foreign sales. Mixed players also exhibit a lighter FDI footprint compared to traditional MNCs, but to manage their physical dimension, they have more FDI and foreign assets than digital companies (UNCTAD, 2017).

79
If we compare the lean internationalization of digital companies to product-based companies (tradional companies), the following distinctions can be drawn (Cahen & Borini, 2018):
- Product-based companies are especially motivated to seek new markets; as a result, they develop capabilities to export or to invest overseas (Knight and Kim, 2009). On the other hand, digital companies’ internationalization does not necessarily involve transferring goods to a foreign market. Digital companies mainly seek to increase digital sales and their user base. As a result, companies must develop special capabilities to capture and manage users over the Internet.
- For digital companies, networking strategies often involve complex and dynamic coordination across multiple companies in global virtual marketplaces—virtual networking—rather than establishing a set of physical connections between companies (Bharadwaj, El Sawy, Pavlou, & Venkatraman, 2013). Virtual networking can take on a variety of forms, such as electronic data interchange, shared virtual sales, pooled virtual-based user support, and other electronic linkages.
- Rather than obtaining financial returns from physical sales, digital companies’ revenue sources are centered on the consumption of virtual services, such as payment for access to virtual experiences, (Clemons, 2009). It is common for digital companies to have multisided revenue models, in which a company gives certain virtual products or services for free to monetize a different product. For example, the use of Facebook is free, and they monetize the platform through advertising. One drawback is that the company must adapt the monetization model for each new market the company intends to reach.
- Finally, the life cycles of virtual products are extremely short. The combination of digitalization, connectivity, and abundance of data demand that digital companies quickly adapt their business models (Amit & Zott, 2001), in both small and substantive ways (Blank, 2013).
In summary, the costs of transferring digital products over the Internet from one country to another are relatively small (Brouthers et al., 2016). Digital companies reach users online and distribute the product in virtual marketplaces. Internet-based delivery and operating models allow for lean internationalization, leading to less of a physical presence overseas. Instead, companies expand internationally through digital sales and by amassing users in foreign markets and multiple countries.
7.2. Digital globalization as an opportunity for eMNCs
By the 1990s, large MNCs from developed countries controlled international markets. Traditionally, companies developed domestically before acquiring the resources needed to export or begin FDI (Dunning, 2011). Though they began the process later, a number of studies indicate that many large Latin American MNCs also began their internationalization process by expanding in their domestic markets (Andonova & Losada-Otalora, 2017).
Digitalization has removed many barriers to enter international markets and considerably reduced the minimum size and scale required for small and nascent companies to do business in new markets. For example, only 10 years ago, most emerging market entrepreneurs had major disadvantages compared to Silicon Valley companies: with limited funding, high startup costs, limited brand recognition, and low Internet penetration in their domestic markets (Tecnolatinas, 2017).
Today, e-books, apps, online games, digital music, software, and cloud computing services are accessible anywhere in the world there is an Internet connection (see box).4 Entrepreneurs from emerging countries have access to the same digital channels and customers as their competitors from developed countries. This higher level of connectivity allows emerging market startups to use and benefit from global digital platforms (McKinsey, 2016).
Digital platforms include e-commerce marketplaces (Amazon, Alibaba), operating systems (Google’s Android and Apple’s iOS), social networks (Facebook, Instagram, Twitter, WeChat), and digital media platforms (YouTube, Uvideos, Spotify, Hulu, and Netflix). Digital platforms became virtual global marketplaces that can match job seekers with employers (LinkedIn), freelancers with assignments (Upwork), creative projects with funders

80
(Kickstarter), travelers with accommodations (Airbnb), and students with education providers (Coursera, Khan Academy). These platforms are creating global markets and user communities on an unprecedented scale. For example, Facebook has around 1,560 billion users; of those, Asian and Latin American countries have the largest share of users, 37% and 19% respectively.
One major advantage of digital platforms is that entrepreneurs and small businesses from emerging countries can directly use them to increase the global reach of their businesses. Platforms such as Amazon, eBay, Alibaba, Flipkart, and Rakuten conduct around 12% of the global goods trade via international e-commerce (McKinsey, 2016).
The widespread use of digital platforms reflects a transformation of consumer behavior that has allowed companies to access millions of consumers. These platforms provide businesses with enormous integrated customer bases and efficient ways to connect with them, enabling startups and small businesses to participate directly in global markets (McKinsey, 2016).
In addition, the use of digital platforms has reduced fixed costs for startups, since entrepreneurs can purchase resources on a marginal basis. For example, a startup can buy incremental server capacity from Amazon Web Services and hire smaller development teams that can build on pre-existing platforms (McKinsey, 2015). Only 10 years ago, digital businesses needed to buy Internet servers and hire large engineering teams to build their systems from scratch. Business-support services such as legal and accounting services can also be outsourced online. Businesses can also outsource design works to freelancers from around the world using platforms such as Freelancer, 99Designs or Workana (Tecnolatinas, 2017).
This plethora of digital resources means that entrepreneurs can start up their businesses and reach a global scale on a shorter timescale and a tighter budget. According to the Tecnolatinas report (2017), starting a digital company in any Latin American country in 2007 needed a minimum investment of $1 million in Internet servers and equipment. According to the same report, today’s Latin American entrepreneurs can create a global digital startup with less than $10,000. The Internet marketplaces give startups visibility, international product exposure and even more access to international capital (Tecnolatinas, 2017).
7.3. Digital transformation in Latin America: Trends and attractiveness in e-commerce and digital business opportunities
There were about 418 million Internet users in Latin America and the Caribbean in 2017. The average Internet user penetration in Latin America was 66.1%, above the world average of 53.1%. Argentina is the most connected amongst Latin American countries, with an Internet penetration of 93.1%, followed by Chile’s 77.5%, Brazil’s 70.7% and Mexico’s 65%.
Internet connectivity and the growing share in digital-related sectors in emerging markets
The cross-border capacity of Internet traffic expanded by 38% annually from 2007 to 2014 as old sub-marine cables were upgraded and new cables connected continents (McKinsey, 2016). Developed countries remain more connected than emerging markets, but emerging market Internet penetration has increased consistently in the last decade. At least 70% of adults in Russia and Argentina are online. The percentage is 57% in Brazil, and 52% in China. Internet use in India increased by 20% between 2013 and 2015. In that same period Chile, Brazil and China all experienced growth of 10-12% (Internet World Stats, 2017; McKinsey Connectedness Index, 2017).
Emerging market companies are consistently gaining ground in digital sectors and Internet-related sectors. Emerging markets companies’ share of global Internet software and service revenue rose from 7% in 2007 to 32% in 2016. According to BCG Global Challengers, other technology intensive industries have similar trends, such as telecommunications equipment, in which these companies’ revenue share increased from 5% to 21% over the same decade. In semiconductors and semiconductor equipment, revenue for emerging companies increased from 23% to 34%, and 32% to 44% in electronic equipment and components (BCG, 2018).

81
E-commerce is growing in emerging markets. In fact, the percentage of consumers who buy online in emerging markets has risen significantly more compared to developed countries in the last decade (BCG, 2018). Despite the recent economic and political turbulence in some Latin American countries, the region remains attractive for business. One big draw is the digital economy, especially the growing consumer demand for e-commerce and digital services (BCG, 2018). In the last five years, Latin America became the third largest regional online market in the world, behind Asia and Europe (Internet World Stats, 2017).
In 2019, projections estimate that 155.5 million people in Latin America will buy goods and services online, a significant increase from 126.8 million in 2016. Compared to the U.S. and Canada, the Latin American e-commerce market is still small. However, e-commerce sales in Latin America are expected to grow from $49.8 billion in 2016 to $79.7 by 2019. Brazil is the market leader, with over $16.55 billion in e-commerce sales in 2016. In Brazil, for example, connected consumers use the Internet in at least one step of 56% of all the purchases they make. Mexico has annual e-commerce sales of $7.19 billion, while Argentina generated $5.1 billion in online product sales revenues in 2016 (Statista, 2018).
MercadoLibre, B2W Digital, Nova Pontocom and Amazon sites are the most used for e-commerce in Latin America, (see Figure 7.1), with regional and local e-commerce in leading positions. For example, MercadoLibre is headquartered in Argentina and is the leading e-marketplace in Latin America, and one of the top 10 global e-commerce companies in the world. MercadoLibre raised $289 million in its 2007 IPO at a valuation of $788.4 million; it now has a $14 billion market cap. Another example is B2W, a Brazilian e-commerce company founded in 2006 as a result of the merger of Submarino.com and Americanas.com. The company went public in 2007, with a valuation of $6.2 billion and now has a valuation of $14 billion.
Figure 7.1. Most popular e-commerce in Latin America as of May 2018, based on number of unique visitors (in millions)
Source: https://www.statista.com/statistics/321543/latin-america-online-retailer-visitors/ accessed by May 2018.
Social media accessed by mobile device is emerging as a more important channel for reaching consumers in Latin America than even direct email marketing depending on the device. For example, the percentage of Facebook subscribers in the Latin America is the second largest, only behind Asian countries.
7.4. Digital companies from Latin America: strategies and internationalization of new businesses
The Tecnolatinas report (2017) identified 123 Latin American digital and e-commerce companies that are already worth over $25 million and that have a collective worth of over $37.7 billion.5 We updated this list in the Annex, Table 7.1.
Annex Table 7.1 shows that digital and e-commerce companies in Latin America are mostly concentrated in Brazil (59), Argentina (22) and Mexico (17). Most of these companies are located in the largest cities of each

82
region: Sao Paulo (51), Buenos Aires (20), and Mexico City (13) represent 68% of these companies and 87% of the ecosystem value creation.6 Other cities such as Santiago, capital of Chile, and various cities in Brazil, such as Campinas, Porto Alegre and Recife, are home to more digital companies as their ecosystems mature. As we see in the table, most of the digital and e-commerce businesses in Latin America are young companies—69% are less than 10 years old, 11% are around 15 years old and only about 11% formed in the late 1990s.
The companies identified in the Tecnolatinas report have their main markets in Latin America. Most Latin American countries have small markets, but the common language (Spanish) and the small size of the domestic markets can be an advantage—by pushing some startups to enter international markets, especially other countries in Latin America and Brazil. Companies from Spanish-speaking countries choose regional (52%) or global expansion (28%) because they face subscale local markets. Brazil is an exception, with a different language (Portuguese) and a large domestic market, which at first seems advantageous. However, it has at times been a limiting factor for Brazilian startups’ international growth; 73% of Brazilian companies focus on their local market. Most of the digital and e-commerce businesses in Latin America operate locally (46%), but a significant and growing segment have either a regional (38%) or a global footprint (19%). Most of the digital and e-commerce companies with a regional scope focus where there are local needs, such as distribution, contracts, and payment solutions. They create value by developing future building blocks for global players, accelerating penetration of powerful solutions in the region.
There is an important diversity of sectors and business models in the digital and e-commerce companies in Latin America, such as Internet platforms, digital games, providers of digital solutions and producers and distributors of digital content. The most common market strategy for these, and similar companies from other emerging economies, is capturing regional consumers and users by replicating the business model of successful international players that lack significant operations in the region. Regional companies with very innovative business models include Nubank (fintech), Etermax (digital games), Satellogic (software), Globant (software development and digital solutions), and Bluesmart (the Internet of Things).
Currently, Latin America has 10 unicorns. Four are located in Argentina, three in Brazil, two in Mexico and one in Chile. Some of these unicorns operate locally in Brazil (Nubank and B2W), two have regional relevance, (Despegar and MercadoLibre), and the rest (Crystal Lagoons, Globant, Kio Networks, OLX, Softtek, and Totvs) have more internationalized operations in countries outside of Latin America. (See a comparison of emerging market unicorns in the box below.)
The rise of unicorns and the role of emerging markets Unlike other MNCs, most digital MNCs have headquarters in only a few countries, with a heavy concentration in the U.S., especially in the Silicon Valley area (OECD, 2017). The east coast of China has also become an important digital hub. Some giants from these regions are competing for leadership in many high tech and digital segments (Candelon, Reeves, Wu, 2017). For example, from 2010 through 2016, the market cap of Alphabet (Google), Facebook, Amazon, Microsoft, and Apple increased by $2.3 trillion. In China, Alibaba and Tencent are among the 10 most valuable companies in the world and, along with Baidu, are together worth $1 trillion.
Similarly, half of all unicorns are U.S. companies, and two-thirds of the 148 U.S. unicorns are based in California. According to BCG (2018) analysis of the new global challengers, around 40% of companies reaching “unicorn” status between 2016 and 2017 are from emerging markets. More than one-third of all unicorns (77 out of 220) are from emerging markets. One-third of the 100 largest unicorns (25 from China and 8 from other emerging countries) account for 41% of these 100 companies’ total value. However, some of the largest unicorns in emerging markets are not truly global. Some unicorns, such as Baidu and NetEase, are highly concentrated in China and have a comparatively small foreign presence (OECD, 2017). Latin American unicorns have a similar internationalization pattern; they are either regional or local.
In terms of sector activities, around 30% of emerging-market unicorns are active in e-commerce, 10% provide on-demand services (addressing some emerging market business hurdles), and more than 20% are focused on Internet software and services, fintech, health care, and cybersecurity (BCG, 2018).
See the Annex Table 7.2 for a list of digital unicorns from emerging markets.

83
Funding options are also growing more diverse in Latin America, with the addition of venture capital funds, angel investor networks, crowdfunding sites and accelerators. In 2017, venture capital investments in Latin America surpassed $1 billion for the first time, increasing 128% from $500 million in 2016 (LAVCA, 2017). Deal volume surged by 26% from 197 deals in 2016 to 249 in 2017. International investment in Latin American startups has more than doubled since 2013, with 25 new investors entering the region in 2017 alone, including SoftBank, Didi Chuxing and TPG’s $1 billion global impact fund, The Rise Fund. Some of Silicon Valley’s biggest investors are now active in Latin America, including Andreessen Horowitz, Accel Partners, Founders Fund, Sequoia Capital, and Y Combinator. This network of investors operating in the region provides new financial support opportunities and improves Latin American entrepreneurs’ access to the international business community.
7.5. Improving the ecosystems for digital startups in Latin America
Many countries around the world have recently adopted digital development strategies, which include developing broadband infrastructure, promoting digital companies, and encouraging large and small companies to adopt digital technologies, as well as promoting general IT skills and competencies. Digital and high-tech entrepreneurship also depends on factors such as supportive ecosystems including universities, investors, governments, service providers, and a financial sector willing to make medium-term investments in high-risk projects.7 Of the 59 digital development initiatives implemented by developing countries, 18 were in Latin America and the Caribbean, compared to 25 in Africa and 16 in Asia.
As a result of these advances, governments are shifting their efforts from promoting infrastructure to developing digital companies, as well as digitalizing the rest of the economy. While almost all of the above-mentioned digital development strategies in Latin America include infrastructure development, 80% also include the promotion of digital business.
Since 2010, several countries in Latin America have introduced programs to support digital and high-tech entrepreneurship, including Argentina, Brazil, Chile, Colombia, Mexico, Panama, Peru and Uruguay (OECD, 2013, 2015, 2016). Here are leading local initiatives helping to improve the ecosystems for Latin American digital startups:
Brazil
Brazil has the most mature innovation ecosystem in the region and as such has one of the most successful high-tech entrepreneurial movements in Latin America.8
The government has played an essential role in creating and supporting innovation habitats, such as incubators and technology parks. According to the National Association of Entities Promoting Innovative Enterprises (ANPROTEC), the number of technology parks and incubators that support high-tech entrepreneurship has risen considerably. In Brazil in 2017, there were 94 technology parks (29 in operation, 32 being built and 32 at the project stage), ANPROTEC reported. Among the operational technology parks, there were approximately 400 incubators for startups and approximately 4,800 companies linked to technology parks and incubators in the country. Non-government and hybrid initiatives are also common. For example, the Federation of Industries for the State of Sao Paulo (FIESP) operates a dozen incubators and the Central Bank of Brazil has created an innovation pool with both state-owned and private banks partnering with technology leaders such as Microsoft to develop fintechs in Brazil (BCG, 2018).
According to UNCTAD (2017), Brazil is an emerging digital market, ranked fourth globally in terms of Internet users. The Brazilian Internet Association, ABRANET (2016), indicates that the Brazilian Internet industry generated $43 billion in revenue, a significant rise from $19 billion in 2000. By 2017, there were 103,639 Internet companies in operation in Brazil, and ABRANET estimates that 80% of these companies grew through international business.
Mexico
According to the OECD (2016), Mexico has made the most progress promoting start-ups between 2012 and

84
2016. Mexico reformed regulations to make it easier to start a business; the Express Companies Act is one such example. In the last decade, Mexican government institutions have invested in entrepreneurship and technology development via grants, loans and even direct investment into start-ups and venture capital funds. In 2010, a quasi-governmental entity named Fondo de Fondos launched Mexico Ventures I, an investment vehicle that invests 20% of its capital directly in startups, and 80% in national VC funds. In 2013 the government created an entity called INADEM (National Institute of the Entrepreneur), which also helps finance startups via national VC funds and has strengthened the institutional framework for startups.
Mexico also has the most even distribution of start-ups across the country: 32% are located in Mexico City, 10% in Guadalajara and 8% in Monterrey (OECD, 2016). According to the Mexican Association of PE & VC Funds (AMEXCAP), Mexico has also improved the financial inclusion of start-ups. According to the Latin America Venture Capital (LAVCA, 2016), Mexican venture capital has increased significantly, making Mexican VC the second most active industry in Latin America, behind Brazil.
Chile
In 2010, Chile’s government introduced the program Start-Up Chile with the goal to attract the best early-stage entrepreneurs to the country. The initiative evolved from an experimental pro-startup program to a more structured policy linked to Chile’s national production transformation strategy (OECD, 2016). Since the program’s inception, Chile has distributed over $40 million to 1,300 nascent businesses from 80 countries. The accelerator offers approximately $45,000 in equity-free funding as well as access to training, mentorship and investors. The programs also offer a one-year working visa (Start-Up Chile, 2018).
Chilean financing still has some weak links: private investment at the expansion stage and angel investors are lacking in Chile.
Argentina
Despite economic difficulties since the 1990s, Argentina has witnessed the emergence of dynamic digital startups and a flourishing startup ecosystem. The largest number of Latin America’s unicorns, (four out of 10), are based Argentina; see Annex Table 7.2.
The local government of Buenos Aires city launched the IncuBAte program in 2017, which aims to attract global entrepreneurs to start their businesses in the city. Winning entrepreneurs from 10 different business categories receive funding of $9,000-$26,000, and a year of incubation, in addition they have mentoring, business advising, and shared workspace access. As a result of this startup ecosystem, well-known Silicon Valley venture capital fund 500 Startups has started investing in tech firms in Buenos Aires.
Colombia
The Colombian entrepreneurial ecosystem has grown quickly in the past five years. In 2012, the Colombian government launched INNpulsa Colombia to promote high-tech entrepreneurship (OECD, 2016). Colombia seeks to encourage financial institutions to invest in startups at all development stages and hopes to strengthen the country’s business culture overall. Bogota and Medellin have seen rapid startup growth in particular. In partnership with INNPulsa, the startup accelerator HubBog has invested in innovative startups in Bogota since its inception in 2010. The Ministry of Technology and Communications’ brainchild Apps.co, an online learning platform that helps turn digital business ideas into fully developed enterprises, is also headquartered in Bogota.
7.6. Challenges
Latin American countries face uncertainties regarding government priorities promoting digital infrastructure, as well as encouraging digital companies and digital adoption in the broader economy. Despite the recent positive progress and moderate levels of Internet penetration, Latin American countries remain less

85
connected than developed countries. According to the BCG e-Friction Index, Latin American countries face serious challenges related to basic infrastructure access in certain regions, the price of accessibility, and Internet speed.9
Institutional fragilities may pose a challenge to the startup movement in Latin America. There can be many obstacles to starting a business in a timely and efficient manner, and punitive Latin American tax and labor laws pose one such hurdle. For example, The World Bank ranks Brazil 156 out of 180 countries in ease of paying taxes by comparison, the U.S. was ranked 69th.
In addition, Latin American digital companies may face economic and political instabilities in their home countries, which is a roadblock for potential investors. Brazil faced its worst corruption scandal and deepest economic slowdown in decades. In Argentina, the new president was elected on a platform of economic reforms, but the country is still struggling economically. In April 2018, Argentina turned to the International Monetary Fund (IMF) for help. Mexico’s most recent instabilities are drug violence and the turbulent election and victory for President Andres Manuel Lopez Obrador.
Studies of digital companies in the region (Cahen & Borini, 2018; Tecnolatinas, 2017) indicate that institutional fragilities and uncertainty in the region are actually associated with digital companies’ internationalization. For example, having an office in the U.S. or in another stable country helps the companies escape from taxes and help them manage their international revenue, because money back home in Latin America can be expensive, especially for a small company.
7.7. Conclusion
Digital technologies are changing the internationalization strategies of companies around the world. The international footprint of digital companies is different from that of product-based ventures: they have significant international engagement by reaching overseas users, and they can enter foreign markets with fewer physical assets. Digital MNCs are heavily concentrated in the U.S., however digital and e-commerce companies from emerging markets are systematically gaining ground in digital-based sectors and increasing their presence and relevance in international markets. Chinese companies have a prominent role competing in digital sectors. Companies from Latin America have followed suit: in the past 10 years, Latin American digital companies have grown significantly, with Argentina, Brazil and Mexico leading the trend. While the region does not operate on the same scale as the largest Chinese digital companies, Latin America has 10 unicorns.
That being said, some of China’s largest digital companies are highly concentrated in China and have a small foreign presence. As shown in this chapter, Latin America’s largest digital companies mostly operate within the region or only in their domestic markets. The most common market strategy for Latin American digital and e-commerce MNCs is to replicate the business model of successful international players to capture regional consumers and users. This is also the most common strategy among digital and e-commerce companies in other emerging markets.
This chapter has demonstrated that the growth of Latin American companies in the digital sphere is the result of a confluence of factors, including decisions made by local governments and policymakers. One example of policy affecting investment decisions is the case of Internet penetration, which requires broadband and Internet infrastructure; likewise, the development of new digital companies requires new or adapted rules and regulations encouraging investment in the digital sector as well as cybersecurity and data protection. Policymakers in Latin America could use other emerging markets’ government policies, such as from China, as a benchmark to compare and improve their own digital sector.

86
ANNEX Table 7.1. Digital and e-commerce companies from Latin America
Company Country Year* Scope** Valuation
Despegar Argentina 1999 Regional Unicorn
Globant Argentina 2006 Global Unicorn
Mercadolibre Argentina 1999 Regional Unicorn
OLX*** Argentina 2006 Global Unicorn
Etermax Argentina 2009 Global >U.S.$500M
Taringa Argentina 2004 Regional >U.S.$500M
IguanaFix Argentina 2013 Regional U.S.$100M - 500M
InvertirOnline Argentina 2000 Local U.S.$100M - 500M
Navent Argentina 2010 Regional U.S.$100M - 500M
Onapsis Argentina 2009 Global U.S.$100M - 500M
Qubit.tv Argentina 2011 Regional U.S.$100M - 500M
Satellogic Argentina 2011 Global U.S.$100M - 500M
Auth0 Argentina 2013 Global U.S.$50M-100M
Bluesmart Argentina 2013 Global U.S.$50M-100M
Infobae Argentina 2002 Regional U.S.$50M-100M
Restorando Argentina 2011 Regional U.S.$50M-100M
Technisys Argentina 1999 Regional U.S.$50M-100M
Afluenta Argentina 2008 Regional U.S.$25M-50M
Agrofy Argentina 2015 Regional U.S.$25M-50M
GoIntegro Argentina 2012 Regional U.S.$25M-50M
Jampp Argentina 2011 Global U.S.$25M-50M
VU Argentina 2006 Regional U.S.$25M-50M
B2W Brazil 1999 Local Unicorn
Nubank Brazil 2013 Local Unicorn
Totvs Brazil 1989 Global Unicorn
HotelUrbano Brazil 2011 Local >U.S.$500M
Linx Brazil 1985 Local >U.S.$500M
Netshoes Brazil 2000 Regional >U.S.$500M
UOL Brazil 1996 Local >U.S.$500M
99Taxis Brazil 2013 Regional U.S.$100M - 500M
Beleza na Web
Brazil 2009 Regional U.S.$100M - 500M
Buscape Brazil 1999 Regional U.S.$100M - 500M
Dafiti Brazil 2010 Regional U.S.$100M - 500M
Dress&Go Brazil 2013 Local U.S.$100M - 500M
Easy Taxi Brazil 2011 Regional U.S.$100M - 500M
GuiaBolso Brazil 2012 Local U.S.$100M - 500M
Icarros Brazil 2008 Local U.S.$100M - 500M
ifood Brazil 2011 Regional U.S.$100M - 500M
Pagar.me Brazil 2013 Local U.S.$100M - 500M
Pitzi Brazil 2012 Local U.S.$100M - 500M
Printi Brazil 2012 Local U.S.$100M - 500M
PSafe Brazil 2010 Regional U.S.$100M - 500M
VivaReal Brazil 2009 Local U.S.$100M - 500M
Webmotors Brazil 1995 Local U.S.$100M - 500M
Zap.com.br Brazil 2000 Local U.S.$100M - 500M
Apontador Brazil 2008 Local U.S.$50M-100M
Bebe Store Brazil 2009 Local U.S.$50M-100M
Beleza.com Brazil 2012 Local U.S.$50M-100M
Bidu Brazil 2012 Local U.S.$50M-100M
Catho Brazil 1996 Local U.S.$50M-100M
Clickbus Brazil 2013 Regional U.S.$50M-100M
ContaAzul Brazil 2011 Local U.S.$50M-100M
Dr Consulta Brazil 2011 Local U.S.$50M-100M
Eduk Brazil 2013 Local U.S.$50M-100M
Elo7 Brazil 2008 Local U.S.$50M-100M
Geofusion Brazil 2015 Regional U.S.$50M-100M
GetNinjas Brazil 2011 Local U.S.$50M-100M
Loggi Brazil 2013 Local U.S.$50M-100M
Lupeon Brazil 2015 Local U.S.$50M-100M
Maplink Brazil 2000 Local U.S.$50M-100M
Mercado Eletronico
Brazil 1994 Local U.S.$50M-100M
NeoWay Brazil 2002 Global U.S.$50M-100M
OQVestir Brazil 2008 Local U.S.$50M-100M
Tripda Brazil 2014 Global U.S.$50M-100M
Trocafone Brazil 2014 Regional U.S.$50M-100M
WebRadar Brazil 2008 Regional U.S.$50M-100M
Avante Brazil 2012 Local U.S.$25M-50M
BankFacil Brazil 2012 Local U.S.$25M-50M
Beauty Date Brazil 2011 Local U.S.$25M-50M
CargoX Brazil 2013 Local U.S.$25M-50M
Descomplica Brazil 2011 Local U.S.$25M-50M
EasyPost Brazil 2014 Regional U.S.$25M-50M
Emprego Ligado Brazil 2012 Local U.S.$25M-50M
Enjoei Brazil 2009 Local U.S.$25M-50M
Ingresse Brazil 2012 Local U.S.$25M-50M
Kekanto Brazil 2010 Local U.S.$25M-50M
Passei Direto Brazil 2012 Local U.S.$25M-50M
PetLove Brazil 1999 Local U.S.$25M-50M
Quinto Andar Brazil 2013 Local U.S.$25M-50M
Resultados Digitais Brazil 2011 Local U.S.$25M-50M
VTEX Brazil 1999 Regional U.S.$25M-50M
Crystal Lagoons Chile 2007 Global Unicorn
Archdaily Chile 2008 Global U.S.$100M - 500M
Comparaonline Chile 2009 Regional U.S.$50M-100M
Alto Chile 2003 Regional U.S.$25M-50M
Gal&Leo Chile 2009 Regional U.S.$25M-50M
Khipu Chile 2011 Local U.S.$25M-50M
Movix Chile 2001 Regional U.S.$25M-50M
Portal Inmobiliario Chile 1996 Local U.S.$25M-50M
SaferTaxi Chile 2013 Regional U.S.$25M-50M
Trabajando.com Chile 1999 Regional U.S.$25M-50M

87
Company Country Year* Scope** Valuation
Intergrupo Colombia 1996 Regional U.S.$100M - 500M
PayULatam Colombia 2002 Global U.S.$50M-100M
Easy Solutions
Colombia 2007 Global U.S.$50M-100M
Domicilios Colombia 2014 Regional U.S.$25M-50M
Enlace Operativo -ARUS
Colombia 1998 Local U.S.$25M-50M
Fluvip Colombia 2013 Regional U.S.$25M-50M
Koombea Colombia 2007 Global U.S.$25M-50M
Ofi Colombia 2014 Local U.S.$25M-50M
PSL Colombia 1986 Global U.S.$25M-50M
LatAmautos Ecuador 2009 Regional U.S.$50M-100M
LocationWorld
Ecuador 2008 Regional U.S.$25M-50M
Kio Networks Mexico 2002 Global Unicorn
Softtek Mexico 1982 Global Unicorn
3D Robotics Mexico 2009 Global U.S.$100M - 500M
ASPEL Mexico 1981 Local U.S.$100M - 500M
BestDay Mexico 1984 Regional U.S.$100M - 500M
Intelisis Mexico 1986 Regional U.S.$100M - 500M
LANIX Mexico 1990 Local U.S.$100M - 500M
Linio Mexico 2012 Regional U.S.$100M - 500M
PriceTravel Mexico 2000 Regional U.S.$100M - 500M
YellowPepper Mexico 2007 Global U.S.$100M - 500M
Kueski Mexico 2012 Local U.S.$50M-100M
Contpaq Mexico 1984 Local U.S.$25M-50M
Empleo Listo Mexico 2008 Local U.S.$25M-50M
Konfio Mexico 2013 Local U.S.$25M-50M
Kubo fnanciero
Mexico 2012 Local U.S.$25M-50M
PayClip,Clip Mexico 2013 Local U.S.$25M-50M
Rappi Mexico 2015 Regional U.S.$25M-50M
PedidosYa Uruguay 2009 Regional U.S.$100M - 500M
Scanntech Uruguay 1992 Regional U.S.$100M - 500M
IronHide Uruguay 2010 Regional U.S.$25M-50M
Open English Venezuela 2008 Regional U.S.$100M - 500M
Source: Authors’ analysis based on Tecnolatinas report (2017), press reports, websites, etc. * Year of foundation ** Scope: Local: operations only in the domestic market; Regional: operations only in Latin America; Global: international operations in other countries in addition to Latin America. ***South African media group Naspers acquired a majority of OLX in 2010 and 95% of the company in 2014.

88
ANNEX Table 7.2. List of digital unicorns from emerging markets
Company Country Valuation
(U.S.$ billion) Valuation
Date
Mercadolibre Argentina 14.0 2017
Globant Argentina 1.8 2016
Despegar Argentina 1.0 2017
OLX Argentina 1.0 2016
B2W Brazil 14.2 2018
Totvs Brazil 4.2 2017
Nubank Brazil 1.0 2018
Crystal Lagoons Chile 1.8 2009
Kio Networks Mexico 1.0 2017
Softtek Mexico 1.0 2017
Ant Financial (Alibaba) China 70.0 2017
Didi Chuxing China 45.0 2017
Xiaomi China 39.0 2015
Ali Cloud China 39.0 2018
Meituan-Dianping China 30.0 2017
CATL China 20.0 2018
Toutiao China 20.0 2017
Cainiao Logistics China 20.0 2018
Lufax China 18.5 2016
Jiedaibao China 10.8 2018
Tencent Music China 10.0 2017
DJI China 10.0 2016
WeBank China 9.2 2018
PingAn Health Insurance Tech China 8.8 2018
Koubei China 8.0 2017
Zhong An China 8.0 2015
JD Finance China 7.3 2016
Homelink China 5.7 2016
WeBank China 5.5 2016
NIO China 5.0 2017
United Imaging Healthcare China 5.0 2017
iQiyi China 4.5 2017
SenseTime China 4.5 2018
BAIC BJEV China 4.2 2017
UBtech Robotics China 4.0 2017
Shouqi Car Rental China 3.6 2016
LeSports China 3.3 2016
Meizu China 3.3 2015
e-Shang Redwood China 3.3 2017
Ali Music China 3.0 2016
Jia.com China 3.0 2015
Kuaishou China 3.0 2017
Company Country Valuation
(U.S.$ billion) Valuation
Date
Meili United Group China 3.0 2015
Wanda E-commerce China 3.0 2015
Ping An Good Doctor China 3.0 2016
Royole Corporation China 3.0 2016
VANCL China 3.0 2014
LY.com China 3.0 2016
Yixia Technology China 3.0 2016
UnionPay Merchant Services China 2.8 2016
KingSoft Cloud China 2.1 2018
Taobao Movie China 2.1 2016
Three Squirrels China 2.1 2015
Taopiaopiao China 2.0 2017
Face++ China 2.0 2017
Huimin.cn China 2.0 2016
Meicai.cn China 2.0 2016
Ofo China 2.0 2017
Sensetime China 2.0 2017
Tubatu.com China 2.0 2015
Maoyan-Weiying China 2.0 2017
Youxinpai China 2.0 2017
Beijing Weiying Tech China 2.0 2016
Firstp2p China 2.0 2016
Trendy International Grp China 2.0 2012
Avant China 1.9 2015
Tujia.com China 1.5 2017
LinkSure Network (WiFi Master Key) China 1.0 2015
GoGoVan Hong Kong 1.0 2017
Flipkart India 15.0 2015
Ola Cabs India 5.0 2015
Paytm India 4.8 2016
Snapdeal India 4.8 2016
ShopClues India 1.1 2016
Quikr India 1.0 2015
InMobi India 1.0 2017
Zomato India 1.0 2017
GO-JEK Indonesia 4.0 2018
Traveloka Indonesia 2.0 2018
Tokopedia Indonesia 1.2 2018
Bukalapak Indonesia 1.2 2018
Garena Malaysia 3.7 2016
Lazada Group Malaysia 2.5 2016
Avito.ru Russia 1.8 2014
Source: Adapted and updated from TechStartaps (2018). Available at: https://techstartups.com/2018/04/08/unicorn-startups-2018-list/

89
REFERENCES
Amit, R., & Zott, C. (2001). Value creation in E-business. Strategic Management Journal, 22(6–7), 493–520. Autio, E., & Zander, I. (2016, January). Lean internationalization. In Academy of Management Proceedings (Vol. 2016, No. 1, p.
17420). Academy of Management. BCG (2018). 2018 BCG Global Challengers Digital Leapfrogs. Available at: https://www.bcg.com/publications/collections/2018-
global-challengers-digital-leapfrogs.aspx Bharadwaj, A., El Sawy, O. A., Pavlou, P. A., & Venkatraman, N. V. (2013). Digital business strategy: toward a next generation of
insights. MIS Quarterly (2013), 37 (2), 471-482. Blank, S. (2013). Why the lean start-up changes everything. Harvard Business Review, 91(5), 63-72. Brouthers, K. D., Geisser, K. D., & Rothlauf, F. (2016). Explaining the internationalization of ibusiness firms. Journal of
International Business Studies, 47(5), 513–534. Candelon, F; Reeves, M. & Wu, D. The New Digital World: Hegemony or Harmony? BCG article, November 2017. Available at:
http://image-src.bcg.com/Images/BCG-The-New-Digital-World-Nov-2017_tcm9-178082.pdf Cahen, F. R.; Borini, F. M. (2018). Explaining Internet Companies' Internationalization: an approach of competences. Academy of
International Business - Latin America Chapter, Buenos Aires. Clemons, E. K. (2009). Business models for monetizing internet applications and web sites: Experience, Theory, and predictions.
Journal of Management Information Systems, 26(2), 15–41. Dunning, J. H. (2001). The eclectic (OLI) paradigm of international production: past, present and future. International journal of
the economics of business, 8(2), 173-190. Evans, M. (2018). 3 Things You Need To Know About Latin American Digital Consumers. Forbes Magazine. Available at: https://www.forbes.com/sites/michelleevans1/2017/08/10/3-things-you-need-to-know-about-latin-american-digital-
consumers/#641f8d1ee5aa Dantus, M. (2017). Why Mexico is ripe for a start-up boom. Financial Times. Available at: https://www.ft.com/content/7fe8f64c-4c74-11e7-a3f4-c742b9791d43 Demil, B., & Lecocq, X. (2010). Business model evolution: In search of dynamic consistency. Long Range Planning, 43(2–3), 227–
246. Knight, G., & Kim, D. (2009). International business competence and the contemporary firm. Journal of International Business Studies, 40(2), 255–273. LAVCA (2016), Latin America Venture Capital: Five Year Trends, Latin American Private Equity & Venture Capital Association.
Available at: http://lavca.org/2016/07/15/new-vc-latin-america- venture-capital-five-year-trends/. McKinsey Global Institute (2016). Digital Globalization: The New Era of Global Flows. New York: MGI. UNCTAD (2017). World Investment Report 2017: Investment and the Digital Economy. New York and Geneva: United Nations. OECD (2016), Start-up Latin America 2016, Building an Innovative Future. OECD Publishing, Paris,
http://www.oecd.org/brazil/startup-latin-america.htm OECD (2015), Entrepreneurship at a Glance 2015, OECD Publishing, Paris, http://dx.doi.org/10.1787/entrepreneur_aag-2015-en. OECD (2013), Startup América Latina: Promoviendo la innovación en la región, Estudios del Centro de Desarrollo, OECD
Publishing, Paris, http://dx.doi.org/10.1787/9789264202320-es. McKinsey Global Institute (2016). Digital Globalization: The New Era of Global Flows. New York: MGI. Statista (2018). E-commerce in Latin America Dossier. Available at: https://www.statista.com/topics/2453/e-commerce-in-latin-
america/ Tecnolatinas Report (2017). Tecnolatinas: Latin America riding the technology tsunami. Available at:
https://publications.iadb.org/handle/11319/8722
NOTES
1 Mixed players have a high level of digitalization and have a partly Internet-based operations and delivery model on Internet. 2 Examples of unicorns from emerging markets India’s Paytm (a fintech company that facilitates cashless digital transactions), and Ola Cabs (an on-demand taxi booking service); Argentina’s MercadoLibre (Latin America's number one e-commerce site by number of visitors), Despegar (an online travel company for searching and booking hotels, flights, and activities); Brazil’s Nubank (a fintech company that launched a series of banking product innovations—it became a unicorn in 2018 with over three million active customers). China has the most unicorns outside the U.S. This includes Internet giants such as Alibaba (an e-commerce platform), Baidu (a services and products, and artificial intelligence company), Didi Chuxing (taxi service company), Tencent (Internet-related services and products, entertainment, artificial intelligence and owner of WeChat, the most popular messaging, social media and mobile payment app in China). 3 World Investment Report - 2017 (UNCTAD, 2017).

90
4 According to a McKinsey report (2016), cross-border capacity of Internet traffic expanded by 38% annually from 2007 to 2014 as new sub-marine cables between continents were built and old ones were upgraded. 5 The list of companies from Tecnolatinas report is based on public information of multiple sources including Crunchbase, LAVCA, Angel List, DealBook about the last known financing round or valuation of each company. The companies were grouped in five broad segments (U.S.$25M-50M, U.S.$50-100M, U.S.$100M-500M, U.S.$500M-U.S.$1B and over U.S.$1B). The value of each company was estimated by the total capital raised in their last equity round made public. Total revenue was used, when available. Here in this chapter, we updated this list of companies, using information collected from online material from the official websites, previous academic cases, marketing material, press releases, press interviews, reports of public talks and speeches made by the heads of the companies, and official reports when available. 6 Based on the list from the 2017 Tecnolatinas report. 7 In 2017, it was identified 102 digital strategies from countries in different regions. The strategies include 30 plans that address broadband infrastructure, 6 that only focus on digital business development and 61 that cover both areas. About 60% of these strategies were adopted in 2012 or later (UNCTAD, 2017) 8 The country counts with organizations such as the government Financing Agency for Projects & Studies (FINEP), which has launched its largest start-up-support project in Latin America, PRIME; SEBRAE (Brazilian Micro-Enterprise and Small Business Support Service – a hybrid agency similar to Small Business Administration in the U.S.); and international organizations such as Endeavor (non-profit organization that mentor and accelerate entrepreneurs that operates in Brazil since 2000). 9 BCG defines e-friction as the factors that can inhibit consumers, businesses, and others from fully participating in the national—and the international—Internet economy. The BCG e-friction Index measures 55 indicators of friction that inhibit Internet use.

91
Chapter 8 Corporate governance and corporate citizenship in Colombia: a lever for global competitiveness? Veneta Andonova, Juana García, Andrés F. Mejía School of Management, Universidad de los Andes, Bogotá, Colombia
8.1. Corporate governance in Colombia: a brief historical overview
8.2. Comparing Código País and the OECD Corporate Governance Principles
8.3. Practicing good corporate governance
8.4. Improving the ecosystems for digital startups in Latin America
8.5. Colombian companies with good corporate citizenship: Down Jones Sustainability Index
8.6. Conclusion
Executive Summary
This chapter presents an overview of the corporate governance practices that Colombian companies follow and identifies the most and least popular practices among them. We discuss the role of corporate governance and corporate citizenship more generally among the most distinguished Colombian multinationals included in the Dow Jones Sustainability Index. We find that there is a strong positive correlation between internationalization and good corporate citizenship along the economic, social and environmental dimensions in the largest Colombian multinationals. In conclusion, we find that the mechanisms behind this correlation are instrumental to improve the international competitiveness of Colombian companies.

92
Introduction
In this chapter we briefly outline the evolution of corporate governance in Colombia. Next, we compare Colombian corporate governance regulations with the OECD corporate governance principles. Then, we describe how Colombian companies adopted these principles between 2007 and 2014, highlighting the most and the least popular practices. Then we review the Dow Jones Sustainability Index as a proxy for good corporate citizenship and discuss the practices of the Colombian companies listed in the index. Finally, we review the role of corporate governance and good corporate citizenship in international competitiveness and internationalization. Our argument aligns with the idea shared by academic researchers and policymakers that “improved profit and performance follow the pursuit of purpose” and that “good corporate governance is a source for competitive advantage” (Chapman and Hutton, 2017). We highlight the benefits that the most sophisticated Colombian multinationals derive from their participation in the Dow Johns Sustainability Index by engaging in a continuous process of improvement in economic, social and environmental domains.
In 2018, Colombia became a member of the OECD following a 23-committee review. The process included the country adapting its domestic legislation regarding a wide range of issues, which involved delineating the corporate governance of state-owned enterprises, effecting some of the largest Colombian multinationals. These steps towards improved corporate government practices are expected to help Colombian companies align with the OECD’s objective of sustainable economic growth and expansion of world trade. However, what is the state of corporate governance practices in Colombia?
Corporate governance is generally expected to affect different aspects of company performance: operating performance understood as return on assets (ROA), return on equity (ROE) or the EBITDA margin (the ratio between EBITDA and sales); market values, measured as the Tobin’s q; and stock returns measured as return on investment or internal financial indicators such as dividend payouts. Changes in operating performance generally cause or correlate with changes in market value and stock returns (Love, 2011). Therefore, good corporate governance is expected to give a strong competitive edge to companies.
More specifically, better corporate governance practices lead to a more productive use of resources and increased firm efficiency that can enhance a company’s international competitiveness. Arguably, the benefits have a considerable economy-wide effect, both in the case of publicly traded and privately held firms (Uhlaner, Wright and Huse, 2007), where the latter category comprises the majority of today’s companies, including some of the world’s largest (La Porta, R., F. Lopez-de-Silanes and A. Shleifer, 1999). Better corporate governance is also associated with the additional cost of implementing stronger corporate governance mechanisms, which may not be justified if imposed through mandatory rules (Chhaochharia and Grinstein, 2007). Therefore, the principle of “comply or explain” is widely accepted in the corporate governance domain. The net effect of improved corporate governance mechanisms, especially when these are voluntarily adopted, is likely to be positive (Chhaochharia and Laeven, 2009).
Colombia is now the fourth largest economy in Latin America, and family-owned privately held companies are responsible for 80% of economic activity (Ferreira, 2014; Ananchotiku & Eichengreen, 2007). The number of publicly traded Colombian companies is remarkably low, and some of the largest multinational companies in the country remain family-owned. At the same time, Colombian publicly traded companies have traditionally benefitted from high private benefits of control (Dyck and Zingales, 2004). Private benefits of control refer to the abnormal economic gains that large shareholders obtain at the expense of smaller (unprotected) shareholders because of the influence large shareholders exercise on the company management.
Table 8.1 illustrates Colombian corporate governance scores against the average score of other emerging market companies in 2013. The table measures seven dimensions: In only two of these dimensions, legal protection of minority shareholders and efficiency of debt enforcement, is where Colombia outperforms its peers. In fact, additional institutional weaknesses such as low accountability and high contractual uncertainty have been reported to produce profound consequences for corporate governance practices in Colombia (Pombo and Gutierrez, 2011). In particular, we see that the assumed premium that comes with early participation in M&A does not materialize

93
into higher performance of the acquirer. On the contrary, there is evidence of a late-mover advantage in waves of domestic M&As. Under conditions of low accountability and high contractual uncertainty, such as in Colombia, companies may make better decisions after some of the uncertainty dissipates (Andonova, Rodriguez and Sanchez, 2013). Moreover, weak domestic institutions create incentives for companies to escape from their home market by engaging in accelerated foreign investments (Cuervo-Cazzura et. al., 2015).
Table 8.1. Corporate governance in Colombia versus average of emerging markets
Legal origin Legal rights
strength index
Creditor rights index
Legal protection of minority
shareholders index
Efficiency of debt
enforcement index
Anti-corruption
index
Disclosure requirement
index
Corporate governance
opacity index
Colombia French 5 0 58 64.8 -26 42 5
Avg. Emerging markets
5.5 2 47.3 47.1 -11 58.9 9.5
Source: Selection by the authors using the data in Table 1B in Claessens and Yurtoglu, 2013 Scale: Legal rights strength (0 = weak; 10 = strong). Creditor rights (0 = weak; 4 = strong). Legal protection of minority shareholders (0 = weak; 100 = strong). Efficiency of debt enforcement (0 = weak; 100 = strong). Anti-corruption index (higher score means less corrupt). Disclosure requirements (0 = weak; 100 = strong)
8.1. Corporate governance in Colombia: a brief historical overview
Since 1999, when the Ministers of Economic Affairs, the G-7 and Central Bank governors created the Financial Stability Forum (FSF), a number of multilateral organizations and many national governments have worked to foster cooperation between national and international supervisors, financial institutions and other local and international bodies to promote stability in the international financial system (FSB, 2018). As part of the process, the Financial Stability Board (FSB) promoted the New International Financial Architecture (NIFA), a complex structure comprising three domains and 15 families of standards and regulations. The domains were as follows: (i) macroeconomic policy and data transparency, (ii) financial regulation and supervision, and (iii) institutional and market infrastructure. The domain of institutional and market infrastructure included standards about accounting and auditing, corporate governance, deposit insurance systems, resolution regimes for financial institutions, financial market infrastructures, money laundering and terrorism, and insolvency and creditor rights.
In 2003, the IMF and the World Bank (WB) prepared the Report on the Observance of Standards and Codes (ROSC) on Colombia, dealing with its system of corporate governance. The criteria used in these reports was taken from the standards included in the NAFI, the International Financial Reporting Standards (IFRS), the International Standards on Auditing (ISA) and the OECD Corporate Governance Principles.
According to the ROSC report, there were eight main aspects of non-compliance related to corporate governance practices in Colombia (see Table 8.2 below).
Table 8.2. Principles or good CG practices not common among Colombian companies (2003)
Source: http://www.worldbank.org/en/programs/rosc. Accessed by Sept. 2018
Principles of good corporate governance practices not common among Colombian companies, ROSC, 2003.
1. Transparency regarding property structure
2. Regulation of shareholders’ dealings that lead to significant concentration of control
3. Application of ‘comply or explain’ principle
4. Existence of rules on insider trading and operations by individuals with privileged information
5. Mandatory disclosure of conflict of interest in the case of directors and managers
6. Participation of minority shareholders in the selection of independent directors to look after their interests
7. Assignment of specific responsibilities to the Board of Directors
8. Requirement of a minimum number of independent directors in the board of directors

94
Table 8.3. The structure of Código País.
Domain Number of provisions or expected good practices
Main topics Number of questions used to
monitor the corresponding CG practices
General meeting 11 Announcement, agenda and organization of the general meeting; approval of relevant transactions; rights and equal treatment of shareholders.
20
Board of Directors 15 Size; composition, organization and decision making; duties and rights of directors.
37
Disclosure of financial and non-financial information
13 Information requests; information disclosed to the market; fiscal inspector.1
19
Dispute resolution 2 Dispute resolution for the company its shareholders and executives.
3
Source: https://www.superfinanciera.gov.co/inicio/industrias-supervisadas/gobierno-corporativo/codigo-pais-61162. Accessed by Sept. 2018
The recommendations of the ROSC report and some additional regulatory efforts gave rise to the Código País, a new body of law that contained a collection of best corporate governance practices. The basic principle behind this regulatory effort was “comply or explain”, which is generally seen as conducive to significant and efficient improvements in disclosure and transparency as well as an increased level of commitment to good corporate governance. (See Table 8.3. for the structure of Código País.) A yearly survey containing 89 questions is used to monitor the level of compliance with each provision.
8.2. Comparing Código País and the OECD Corporate Governance Principles
The following section compares the OECD Corporate Governance Principles with the Código País.
The OECD Corporate Governance Principles include provisions on shareholders’ rights, Board of Directors, equal treatment of shareholders and disclosure among the main recommendations.
First, the principles clearly present the need to guarantee an effective framework for corporate governance. In addition, the principles recommend adequate assignment of responsibilities among a number of decision-makers. In the case of Colombia, a new regulation implemented in 2007 enacted an effective legal framework for corporate governance. This new legislative body helped harmonize preexisting codes and rules.2 Colombia also implemented an independent regulator: the Superintendencia Financiera. The Superintendencia Financiera depends directly on the President and this institutional design guarantees that this entity has “… power, integrity and resources to complain their duties objectively and professionally…” (OECD, 2005, page 17)
The OECD Corporate Governance Principles also deal with the rights of shareholders and include provisions aimed at safeguarding these rights. The Colombian code contains many of the same principles related to approving significant decisions, the agendas of the General Assembly meetings, and the rights of different classes of shareholders. In all these aspects, the national provisions follow the OECD principles. For example, the following are significant decisions that require the approval of the General Assembly of shareholders: changes of business purpose, segregation of assets, renunciation of preference rights, change of business address and dissolution and transactions with related third parties. The General Assembly meeting is conducted in accordance with the company bylaws. Companies are expected to act transparently and diligently in handling the decision and are required to make all information to shareholders.
The national code includes recommendations about the size, composition and operation of Board of Directors, emphasizing the need for specific provisions on aspects such as development of meetings; professional profile of directors; transparency and conflicts of interest; the creation of committees to supervise and make recommendations on issues such as auditing, corporate governance as well as management appointments and remuneration policies, among others. Clear and transparent provisions define shareholder rights and duties,

95
ownership structure, and the need for a specific bylaw regarding General Assembly meetings. However, the Colombian code still has some important omissions, and does not include provisions for electronic voting and other mechanisms for all shareholders to effectively participate in General Assembly meetings.
The OECD Corporate Governance Principles recommend that: “the framework for corporate governance must recognize rights of stakeholders established by law or through mutual agreements…” (Organization for Economic Cooperation and Development, 2005, page 21). In this regard, the Colombian code stipulates that: “the disclosure of financial and non-financial information is the main obligation of issuers with their stakeholders and the market as a whole” (Superintendencia Financiera de Colombia, 2007, page 11). Therefore, the provisions mainly stipulate information disclosure and involve mechanisms that guarantee an equitable, complete and transparent access of stakeholders to information.
The OECD principles pay special attention to transparency and deal with both financial and non-financial information disclosure. The Colombian code includes most of these provisions. However, some essential aspects still need strengthening, in particular, the need for high-quality accounting standards. The requirement for disclosure of financial and non-financial information was reinforced in 2009,3 and new disclosure rules were gradually rolled out between 2009 and 2015. Besides information disclosure, the only other mechanism to protect stakeholders’ rights in Colombia is the presence of an independent fiscal auditor.
Additionally, the OECD principles include recommendations about the Board of Directors’ specific responsibilities. The general idea is that the Board guarantees strategic guidance, controls the executive team and makes it accountable to the company and its shareholders. In the Colombian code, the Board is considered to be the “…link between the company and its shareholders and investors…” (Superintendencia Financiera de Colombia, 2007, page 7). The Board as contemplated in the Colombian code guarantees equal treatment of shareholders, high information disclosure, and compliance with good corporate governance practices. The Colombian code also contains additional dispositions on the size and conformation of the Board; on the specific Board of Directors bylaw; and on Board committees: audit, corporate governance, and appointments and remuneration committees. The audit committee is the only mandatory committee according to Colombian law.
8.3. Practicing good corporate governance
In this section we report on the compliance of Colombian companies with the OECD Corporate Governance principles as imbedded in Código País. Information comes from the survey on the adoption of Código País dispositions, which is administered by Superintendencia Financiera. The available data covers the period from 2007 to 2014. In 2014, there was a change in the code’s structure and provisions, where the associated survey and the new template were applied from 2015 onwards. Presently, this new database contains information for 2015 and 2016 only.
In general, Colombian companies have improved their corporate governance practices. Significant advancements include the organization of the General Assembly meeting, timely disclosure of information and adherence to a previously defined agenda. Colombian companies are now accustomed to maintaining permanent communication channels with investors and shareholders. The use of independent audit firms or individuals that fulfill the role of fiscal auditors has also improved. In Table 8.4, we report the five most widely used practices of good corporate governance between 2007 and 2014.
Table 8.4. Top five most common practices of good corporate governance
Description

96
1 The company facilitates shareholder decision-making during the General Assembly meeting. All required documentation about the issues to be addressed at the meeting is made available on time, within the terms of the call, and at the registered office address.
2 The company does not appoint fiscal auditors that have received income from the company or its associates, comprising 25% or more of their annual income during the previous year.
3 All members in the Board of Directors are individuals who meet the minimum requirements regarding professional career, academic training and experience.
4 The issuer has a contact point with investors and it serves as a communication channel between them and the issuer.
5 Without imposing a prejudice on the right of shareholders to present proposals during the General Assembly meetings (ordinary and extra-ordinary), the agenda for the General Assembly contains in detail the list of issues that will be treated. This is done in a disaggregated manner so that there is no confusion between topics. The points in the agenda are sequential and numbered, except for those points that should be discussed simultaneously because they are related to each other.
Source: Authors based on the results of the Código País survey results
In Table 8.5, we list the corporate governance practices that are least common in Colombia. It is important to distinguish between non-applied and non-applicable provisions. The top three on the list are non-applicable because they refer to specific relevant operations that affect the ownership structure of companies. Those provisions are non-applicable for the most part because these operations are rare. On the other hand, the last two provisions reported in Table 8.5 are largely not observed by the companies.
Table 8.5. Top five least common practices of good corporate governance Description
1 (non-applicable)
Relevant operations carried out with economic associates are approved by the General Assembly. Transactions that comply simultaneously with the following conditions will not require such authorization:
1. If the transactions are carried out at market prices, which are fixed by the suppliers of the goods or services in question.
2. If the transactions are of ordinary course for the issuer and are not material.
2 (non-applicable)
Segregation must be approved by the General Assembly.
3 (non-applicable)
In addition to operations that are legally required, the following issues or decisions are analyzed and determined by the General Assembly of Shareholders only if they have been explicitly included in the announcement:
Change of corporate purpose, renouncement of the right of preference in the subscription, change of registered office, early dissolution and segregation.
4
A Corporate Governance Committee is created to support the Board of Directors regarding the following issues (but is not limited to these functions):
Ensure shareholder and market access to full, truthful and timely information about the company that it is obliged to provide disclosure.
Report on the activities of the audit committee. Periodically review and evaluate if the members of the Board of Directors fulfill their duties. Monitor transactions of shares of the company or companies in the same conglomerate, done by directors. Supervise the compliance of remuneration policies, related to executives. Other functions related to the nature of the committee.
5 Issuers publicly disclose the general policies about remunerations and any benefits granted to directors, executives, CEO, Fiscal Auditor and external advisors.
Source: Authors based on the results of the Código País survey results.
In addition to these practices above, Colombian companies also have high non-compliance scores regarding the use of electronic media by shareholders in General Assembly meetings. This non-compliance is due to the fact that Colombian companies have a high ownership concentration, reducing the need to use massive electronic channels to facilitate shareholder participation. Another unpopular provision relates to the disclosure of remunerations and contracts between companies, executives, directors, fiscal auditors, the CEO and related parties.
The broader notion of good corporate citizenship is particularly useful to extend the concept of good corporate governance. Good corporate citizens are generating positive value to society as a whole and exceed stakeholders’ expectations by creating measurable social impact, besides complying with the best corporate governance practices. In the next section, we use the Dow Jones Sustainability Index to examine the best corporate

97
citizens among Colombian multinationals. These companies excel in corporate governance but are also engaged in environmental conservation and social betterment.4
8.4. Colombian companies with good corporate citizenship: Dow Jones Sustainability Index
The Dow Jones Sustainability Index or DJSI is a set of several sustainability indexes that indicate high performing companies in economic, social and environmental domains. To be included, these companies must be listed on the stock exchange.
This index uses three dimensions to categorize companies: 1. The environmental dimension includes criteria related to environmental conservation or eco-efficiency. 2. The social dimension is divided into two aspects: the internal aspect values, including human capital and
talent development; and the external aspect, which deals with philanthropy and corporate image. 3. The economic dimension takes into account crisis and risk management, codes of conduct and good
corporate governance.
The Dow Jones Sustainability Index is a reference for investors when making decisions. Several studies show that an organization with high sustainability ratings is more profitable in the long-term than organizations with a "normal" sustainability performance (see for example Filatotchev et al., 2005 and Bhagat and Bolton, 2008). Moreover, the companies on the index constantly self-evaluate and generate continuous improvements. Finally, index companies have a good reputation among stakeholders due to their robust social, environmental and economic commitments.
There are several emerging market Colombian multinationals on the index classified across a number of sectors: Bancolombia (Banks), Grupo Argos and its subsidiary Cemargos (Construction Materials), Sura (Diversified Financials), the Empresa de Energia de Bogotá (EEB) (Energy), ISA (Energy), Nutresa (Food, Beverages and Tobacco) and Grupo Éxito (Food & Staples Retail)
In 2018, Nutresa and Sura became ranked for the seventh year in a row. With this achievement, Nutresa solidified its status as one of the eight leading global companies in the Food industry in terms of sustainability. In fact, Nutresa performs at par with Danone, Nestlé and Coca-Cola in the category of Food and Beverage companies. Sura is the only Latin American company in the diverse Financial Services sector within the DJSI.
Historically, Sura was one of the first Colombian multinationals that entered the DJSI in 2011 (together with Ecopetrol) and it has exhibited a very strong positive trend of improvement on every dimension of the index, while following a clear track of international expansion. The investments of Grupo Sura are in both the financial and industrial sectors. Since 2014, the number of international funds that are also shareholders of Grupo Sura have increased by 34%. In 2013, Suramericana (owned by Grupo Sura) acquired Primero Seguros de Vida in Mexico and expanded its reach into Panama, El Salvador and the Dominican Republic. This expansion points to a positive correlation between Sura’s ambitious internationalization strategy and the continuous improvement in its DJSI score.
Grupo Éxito, Argos and Cemargos reached their fifth consecutive year in the index. Grupo Éxito is among the three best performing retail companies in emerging markets, with high scores in the economic and social dimension of the sustainability index. In addition, in 2018 Grupo Argos was recognized as an industry leader while its subsidiary Cementos Argos was second.
As for Bancolombia, this financial and banking institution gained special recognition during the 2017 World Economic Forum summit as the fifth most sustainable bank in the world and the first in the Americas. It outperformed many U.S. and Canadian banks (DJSI, 2017)5 effectively boosting the brand image of Colombia as a whole. Moreover, Bancolombia’s declared philosophy is that economies can, through their companies, show interest in sustainability and thus attract foreign investment and obtain resources to strengthen national competitiveness.

98
Such economies promote public sector improvement, enhance their country’s image in the world and therefore, contribute to the wellbeing of its citizens.
Bancolombia was included in DJSI in 2012. Despite the fact that it has been present in Panama for more than 40 years, the acquisition in 2015 of Banco Agrícola in El Salvador, and the acquisition of 60% of Grupo Argomercantil, of Guatemala gave a strong international push to Bancolombia in recent years.
The energy company EEB also excels in the category of emerging markets, due to its world-class practices in human resources management, biodiversity management and environmental conservation. EEB is the biggest business group in the Colombian Energy sector.
ISA, the most international of all Colombian multinationals, is also the only Colombian company and one of three Latin American companies in the electric public services category in the DJSI. This company obtained the highest rating (100) in the categories of biodiversity, transmission and labor indicators. ISA is the Colombian “multilatina” with the most ambitious internationalization strategy and regional participation in power, road infrastructure and telecommunications sectors.
Table 8.6. The internationalization of the Colombian multinationals in the DJSI
Company Largest Multilatinas
Ranking (2016) Dow Jones Sustainability
Index Distinction Industry
EPM Empresas públicas de Medellín 61 Sustainability Yearbook member Multi and Water Utilities
Grupo Energía Bogotá 52 Industry Mover Gas Utilities
Organización Terpel 58 Sustainability Yearbook member Retailing
Cementos Argos 35 Gold Class Construction Materials
Banco Davivienda NA Sustainability Yearbook member Banks
Grupo de Inversiones Suramericana 29 Sustainability Yearbook member Diversified Financial Services and Capital Markets
Interconexión Eléctrica NA Sustainability Yearbook member Electric Utilities
Bancolombia 63 Silver Class Banks
Colombina 74 Sustainability Yearbook member Food Products
Grupo Nutresa 45 Silver Class Food Products
Celsia NA Sustainability Yearbook member Electric Utilities
Source: Authors based on Dow Jones Sustainability Index and América Economía 2016 Multilatinas ranking.
8.5. Conclusion
In the last decade, the best practices and standards of corporate governance and corporate citizenship have gained increasing importance. Although there is no single recipe for how to improve governance, the incorporation of good practices is a springboard to improve management, profitability and sustainability in the long term. As established in the literature, good corporate governance has allowed companies to use resources more efficiently and make management more transparent and accountable, thus improving their competitiveness both domestically and internationally (see Cumming et al., 2017 for a recent discussion of the role of corporate governance in international business).
A company’s performance is directly related to the business environment in which it operates (Andonova and García, 2017). In Colombia, the government has promoted improved governance in both privatly and publicly managed companies and has sought to strengthen state-owned entities in particular. The largest publicly-traded Colombian multinationals that stand out in the international rankings also displays commendable levels of good corporate citizenship. Arguably, investor scrutiny is one incentive for large companies to maintain good corporate citizenship.

99
The Dow Jones Sustainability Index accounts for, among other things, good corporate governance practices, where a number of Colombian multinationals excel in the DJSI listing. The highest ranked Colombian companies, such as Bancolombia, Argos, Sura and Nutresa, are also among the most ambitious Colombian investors. These companies are also relentlessly pursuing international growth, suggesting that international competitiveness and sustainable corporate practices go hand in hand. One plausible hypothesis is that the best Colombian companies benefit from the right mindset, resources and organizational competences, which in turn make them excel on both the domestic and international arena.
A recent study on the competitiveness of Colombian companies revealed that there are two very different types of companies in the economy: a small number of very productive world-class companies, and large number of small, medium and micro enterprises that lack competitive levers (Andonova et al, 2017). Therefore, one important question concerning Colombian businesses remains unanswered: Do the majority of Colombian companies see the link between responsible corporate citizenship, internationalization and increased competitiveness? If so, the expected positive loop between internationalization and good corporate governance can increase the international competitiveness of many more Colombian companies.
REFERENCES Ananchotiku, S., & Eichengreen, B. (2007). El engranaje de los mercados de capitales latinoamericanos. BIS Papers (36). Andonova, V., & García, J. (2017). Various chapters in Andonova, V. & Losada, M. (Eds.) Multilatinas: Strategies for
internationalization. Cambridge University Press. Andonova, V., García, J. and Rámirez-Vallejo, J. (2017), El embiente de negocios en Colombia: Una interpretación empresarial,
Universidad de los Andes, available at: https://administracion.uniandes.edu.co/phocadownload/2017/eventos/evento-el-ambiente-negocios-colombia.pdf
Andonova, V., Rodriguez, Y., & Sanchez, I. (2013). When waiting is strategic: Evidence from Colombian M&As 1995-2008. Journal of Business Research: 10, 1736-1742.
Bhagat, S. and Bolton, B. (2008). Corporate governance and firm performance. Journal of Corporate Finance Volume 14, Issue 3, June 2008, 257-273.
Chapman, C. and Hutton, W. (2017) “Good corporate governance is a competitive advantage”, Financial Times, accessed on October 6, 2018 at https://www.ft.com/content/b31ecfb0-19dd-11e7-bcac-6d03d067f81f
Chhaochharia, Vidhi and Y. Grinstein, 2007, Corporate governance and firm value: the impact of the 2002 governance rules, Journal of Finance 62: 1789-1825.
Chhaochharia, Vidhi, and Luc A. Laeven. 2009. “Corporate Governance, Norms and Practices.” Journal of Financial Intermediation 18: 405-431.
Claessens, S., & Yurtoglu, B. B. (2013). Corporate Governance in Emerging Markets: A Survey. Emerging Markets Review 15, 1-33.
Cuervo-Cazurra, A., Narula, E., Un, A. (2015) "Internationalization motives: sell more, buy better, upgrade and escape", The Multinational Business Review, Vol. 23 Issue: 1, pp.25-35, https://doi.org/10.1108/MBR-02-2015-0009
Cumming, D., Filatotchev, I., Knill, A. et al. Law, finance, and the international mobility of corporate governance J Int Bus Stud (2017) 48: 123. https://doi.org/10.1057/s41267-016-0063-7
Dow Jones Sustainability Index, 2017 available at: http://suite1.emarsysusercontent.net/custloads/125736536/md_843292.pdf Dyck, Alexander and Luigi Zingales, 2004, Private Benefits of Control: An International Comparison. Journal of Finance 59: 537-
600. Ferreira, A. (2014). Latin America- Family Business Yearbook 2014. http://familybusiness.ey.com/. Filatotchev, I., Lien, YC. & Piesse, J. Corporate Governance and Performance in Publicly Listed, Family-Controlled Firms:
Evidence from TaiwanAsia Pacific J Manage (2005) 22: 257. https://doi.org/10.1007/s10490-005-3569-2 FSB (2017). Available at http://www.fsb.org/about/history La Porta, R., F. Lopez-de-Silanes and A. Shleifer, 1999, Corporate Ownership Around the World, Journal of Finance, 54(2), 471–
517. López, M.V, Garcia, A., Rodriguez, L. (2007). Sustainable Development and Corporate Performance: A Study Based on the Dow
Jones Sustainability Index. J Bus Ethics (2007) Journal of Business Ethics 75: 285. https://doi.org/10.1007/s10551-006-9253-8
Organization for Economic Cooperation and Development. (2005). OECD Corporate Governance Principles. Madrid: Ministerio de Economía y Hacienda de España.
Pombo, Carlos and Luis H. Gutierrez, 2011, Outside directors, board interlocks and firm performance: Empirical evidence from Colombian business groups, Journal of Economics and Business, 63(4): 251-277.

100
Superintendencia Financiera de Colombia. (2007). Código de Mejores Prácticas Corporativas Colombia, Circular Externa 028 de 2007. Bogotá.
Uhlaner, L., M. Wright, and M. Huse (2007), “Private Firms and Corporate Governance: An Integrated Economic and Management Perspective”, Small Business Economics, Vol. 29, pp. 225-241.
NOTES
1 The fiscal inspector (revisor fiscal) holds some of the same functions as financial auditors. She reports to and is accountable directly to the General Assembly of shareholders. 2 This previous regulation was removed in the Code of Commerce; Code 222 of 1995, which modified the Code of Commerce; resolution 275 of 2001 of the Superintendencia de Valores introducing some additional requirements for issuers that receive investments from pension funds; and Code 964 of 2005 that regulated the securities market. 3 In 2009, code 1314 introduced International Financial Reporting Standards (IFRS). 4 The Dow Jones Sustainability Index is the most respected independent sustainability index, created by RobecoSAM, a renowned investment group from Switzerland in partnership with S&P Dow Jones Indices. The objective is to focus on economic, social and environmental factors that are essential for company’s success but are often overlooked in traditional financial analysis. Conceived of as a global benchmark for sustainability, DJSI was launched in 1999; it is the longest-running benchmark series. Academics, companies and investors frequently use it alike. According to Lopez et al. (2007), the requirements regarding sustainability are more comprehensive in DJSI than in other sustainability index such as the FTSE4Good and the Domini Social Index. 5 http://suite1.emarsysusercontent.net/custloads/125736536/md_843292.pdf

101
Chapter 9 Research on the Development Process of Entrepreneurship Education in Chinese Universities Prof. Shi Yongchuan, Barron Zuo, Wang Hongxin Wenzhou University
9.1. The development of entrepreneurship education in Chinese universities A. Starting period: imitation based on entrepreneurial practice (1998-2002)
B. Growth period: Based on introduction and reform of entrepreneurship courses (2002-2008)
C. Expansion period: Exploration of entrepreneurship models based on talent training (2008-2010)
D. Maturity: Breakthrough in the concept of innovation and entrepreneurship (2010-present)
9.2. Conclusion: The future development direction of college entrepreneurship education
Executive Summary
Entrepreneurship education has gone through a 20-year development process in Chinese universities. This development process is divided into four stages: germination, exploration, expansion and maturity. We analyze and summarize this cycle as a roadmap for the future development of entrepreneurship education in universities in China and the world.

102
Introduction
Since Prime Minister Deng Xiaoping started his “Open and Reform Policy” in 1978, China has entered a new era focused on economic development. By 2015, China had increased its GDP to $10 trillion (69,590 billion RMB) in 2015. (see Figure 9.1). And entrepreneurship has been recognized as a key area of development by everyone from top policy makers to small business owners, despite having limited resources than state-owned businesses. After 40 years of economic development, entrepreneurship is beckoning as an important part of the education system. Indeed, policymakers have come to prioritize entrepreneurship education in the name of economic development.
Figure 9.1. China Gross Domestic Product 1978-2015 (Value in Renminbi and growth)
Source: https://zhuanlan.zhihu.com/p/27464057.
In May 1998, Tsinghua University held its first entrepreneurship competition, a key starting point for entrepreneurship education in Chinese universities. By April 2002, the Ministry of Education determined that nine universities, including Tsinghua, would become the first batch of pilot enterprises for entrepreneurship education reform. In August 2012, the Ministry of Education issued the "Basic Requirements for the Teaching of Entrepreneurship Education in General Undergraduate Schools (Trial)." More recently, the General Office of the State Council issued in May 2015 the “Implementation Opinions on Deepening the Reform of Innovation and Entrepreneurship Education in Colleges and Universities”. The latter document has strengthened entrepreneurship education as an effective path for innovation and talent training for industry and solution for unemployment.
As an emerging field, entrepreneurship education has long held a strong vitality in the process of reform and exploration. College students have been the driving force behind innovation and entrepreneurship. In the past three years, China has added an average of 40,000 new companies per year—including more than 3,000 technology business incubators and more than 400 accelerators, which operated under a complete business incubator service chain, serving more than 400,000 startups and cultivating nearly 1,000 listed companies as well as 1.8 million jobs. This systematic approach to support entrepreneurship has fueled China’s economic growth.
In what follows, we summarize the experience of China's 20 years of entrepreneurship education, identifying lessons and providing a roadmap for future development of entrepreneurship education.
9.1. The development of entrepreneurship education in Chinese universities
A. Starting period: imitation based on entrepreneurial practice (1998-2002)
Entrepreneurship education has long been a main internal driving force of the U.S. economic development. For instance, in 1947 Harvard University professors pioneered the world's first entrepreneurship education program.

103
By 1968, Babson Business School was the first to offer entrepreneurship as a business major in undergraduate education. During the 1990s, American universities began to launch doctoral degrees in entrepreneurship. This training was ultimately incorporated into the national education system and gradually formed a complete set of entrepreneurship education disciplines and teaching research systems.1 Today, entrepreneurship has become the fastest growing subject area for American universities, especially in business and engineering schools. Currently, more than 2,200 entrepreneurship courses are offered in more than 1,600 universities, with 277 endowed professorships and 44 related entrepreneurial academic journals, as well as more than 100 entrepreneurial research centers. Entrepreneurship education has become an important part of higher education in the U.S.2
In October 1998, UNESCO hosted the World Conference on Higher Education in Paris, which emphasized that cultivating an entrepreneurial spirit and entrepreneurial skills in students should be taken as the basic goal of higher education as an active response to the knowledge economy. Subsequently, in January 1999 China’s State Council approved the Ministry of Education’s Action Plan for Education Revitalization for the 21st Century. In turn, prominent Chinese universities actively participated in the exchange of international entrepreneurial activities. In May 1998, Tsinghua University students debuted the first Tsinghua University Business Plan Competition modeled after the popular business plan competitions in American universities. By April 2002, the Ministry of Education identified nine universities to conduct pilot reforms of “entrepreneurial education.” The policy encouraged pilot schools to conduct practical explorations of entrepreneurship education. Since then, entrepreneurship education has officially entered the government's policy and ushered in a new stage of diversified development.
Despite this official endorsement, the entrepreneurial education in Chinese universities at the time was of limited depth, primarily imitating the theory and practice of entrepreneurship education in foreign universities. Entrepreneurship education remained limited to a few prominent universities with frequent exchanges with foreign universities. For most Chinese universities, the concept and the implications of entrepreneurship education was quite vague.
B. Growth period: based on the introduction and reform of entrepreneurship courses (2002-2008)
In 2003, the number of undergraduates in China reached 2.12 million, a net increase of 670,000 since 2002 (see Figure 9.2). The employment rate of college students in China has since declined, with undergraduates and college students competing for jobs, even giving rise to the phenomenon of a "zero wage employee."
Figure 9.2. University graduate population increase from 2001-2016
Source: http://www.eol.cn/html/c/2016gxbys/index.shtml
The KAB Entrepreneurship Education (China) Project was an attempt by the Central Committee of the Communist Youth League, the All-China Youth Federation, and the United Nations International Labour Organization to jointly promote entrepreneurship education in China. It aimed at developing an entrepreneurial education with Chinese characteristics. In 2006, six universities, including Tsinghua University, China Youth Politics College and Heilongjiang University became the first KAB entrepreneurship education pilot schools in China. The setting of the

104
"Basic KAB Entrepreneurship Foundation" course sought to improve the “market value” of Chinese college students to meet the needs of the job market and to encourage entrepreneurial and innovative ideas.
Throughout the development of domestic entrepreneurship education, the Central Committee of the Communist Youth League played an important role promoting entrepreneurship education in domestic universities. The attention paid to entrepreneurial education also shifted in favor of quality.3 However, challenges remained such as an over-emphasis on traditional processing and manufacturing industries.
C. Expansion period: exploration of entrepreneurship models based on talent training (2008-2010)
In 2008, the Ministry of Education and the Ministry of Finance set up 30 national-level talent training model innovation experimental areas throughout the country. These talent training areas were built to assess entrepreneurship education’s ability to adapt to local conditions and regional characteristics. Among the universities involved, Tsinghua University and Heilongjiang University took the lead in entrepreneurship education reform and made bold investments in entrepreneurship education.
In May 2010, the government established the Ministry of Education's Higher Education Entrepreneurship Education Steering Committee, which is dedicated to implementing innovation and entrepreneurship education to all college students and deepening the curriculum. Its goals are to support entrepreneurship in both teaching content and methods, as well as integrate college entrepreneurship education into the whole process of talent cultivation. The intent is to encourage colleges and universities to explore the formation of diversified innovation and entrepreneurship education mode based on the type, level, characteristics and timeliness of the school.
Despite this education push, according to a survey conducted by local government, the proportion of self-employed college graduates in 2009 was only 1.2% of the total number of graduates. There were even fewer examples of successful entrepreneurship, even in Zhejiang Province, where national college students’ entrepreneurial activities were most active. Student self-employment was only about 5%, and the effectiveness of entrepreneurship education was not yet evident.
Previously, entrepreneurship education in colleges and universities in China only benefited a small number of students. Business plan competitions across the country played a role in promoting college students' entrepreneurship, but there were very few business plans that were actually feasible. While innovation is the premise of entrepreneurship education, the traditional education system hindered creativity.4
Exploring the talent training model of entrepreneurship education entails discovering a new path to cultivate entrepreneurial talents and expand the benefits of entrepreneurship education. The methods put forward new and higher requirements but the drawbacks of traditional education restricted the effective implementation of entrepreneurship.
D. Maturity: Breakthrough in the concept of innovation and entrepreneurship education (2010 – present)
In 2010, the Ministry of Education issued the "Opinions on Promoting Innovation and Entrepreneurship Education in Colleges and Universities and Self-employment of College Students." The statement introduced innovation as an important part of entrepreneurship education, and as a tool to encourage student employment post-graduation.
In April 2012, the “Opinions of the Ministry of Education on Improving the Quality of Higher Education in All Aspects” made it clear that innovation and entrepreneurship were key aspects of a well-rounded education. Specific requirements such as “strengthening the training of innovative and entrepreneurial teachers” and

105
“supporting students to carry out innovation and entrepreneurship training” have been some of the most important reforms intended to comprehensively improve China's higher education.
For the first time, the "Basic Requirements for Teaching" systematically proposes teaching objectives, teaching principles, teaching contents, teaching methods and teaching organizations to promote entrepreneurship education in Chinese universities. Institutionalization standards have led China's college entrepreneurship education to advance. The "Basic Requirements for Teaching" does not specify curriculum requirements but renews the concept of innovation and entrepreneurship education in the university.
In what follows, we examine some of the features of entrepreneurship education in China following its 20 years of development process:
i. Government’s role
The government plays a vital role in promoting entrepreneurship education in colleges and universities and also provides robust policy support. Government departments at all levels attach great importance to the role of entrepreneurship education, and support and encourage university students to start their own businesses through various means such as entrepreneurial policies, tax incentives, entrepreneurial funds and venue support.
The Ministry of Education established a Steering Committee for Entrepreneurship Education in Colleges and Universities to coordinate National Entrepreneurship Education in Colleges and Universities, which granted entrepreneurship education legal status in Chinese universities. The Instructive Committee for Entrepreneurship Education of Colleges and Universities established a platform for cooperation and exchanges among colleges and universities, providing advice and guidance for entrepreneurship education.
Different government departments can also work together to carry out entrepreneurship education. Meanwhile, non-governmental entities have also been actively involved in promoting the entrepreneurial education of college students. The assistance has become a useful supplement to college entrepreneurship education.5
ii. Construction of an ecosystem of entrepreneurship education
The ecosystem of entrepreneurship education requires participation from all sectors of society, including relevant government departments, educational institutions at all levels, entrepreneurial innovation incubators, scientific research personnel, academia, students, venture capital funds, angel investment funds and cooperative networks among entrepreneurs.
The KAB entrepreneurial education project systematically examined entrepreneurship education and built an interdependent ecosystem. In this ecosystem, external resources, organizations, faculty, curriculum, teaching and practice are all closely linked. For example, the KAB Entrepreneurship Education Program has both a basic entrepreneurship course and a KAB entrepreneurial club that focuses on entrepreneurial practice.
iii. Forming a new model of entrepreneurship education with distinctive characteristics
There are four new prominent models of entrepreneurial education in China:
1. Tsinghua University was the first university engaged in entrepreneurship education in China. It is also the leader of entrepreneurship education across the Chinese university system. It uses an entrepreneurial education model integrated into the vocational guidance system.
2. The Central University of Finance and Economics carries out pilot classes for entrepreneurship education reform. Its entrepreneurial education model is based on the reform of the entrepreneurial pioneer program. As a university specializing in the study of finance and economics, the Central University of Finance and Economics has set an example for national universities on how to develop their own disciplines.

106
3. Heilongjiang University uses an “integrated” entrepreneurial education model. Its entrepreneurial education system is “oriented to all, based on professional, classified guidance and intensified practice,” and actively explores the new model of cultivating “professional + industry + entrepreneurship” talent.
4. Wenzhou University has created a new entrepreneurial education system based on post entrepreneurship,6 and exerted regional advantages to provide new ideas for colleges and universities to train entrepreneurial talents.
9.2. Conclusion: The future development direction of college entrepreneurship education
In order to promote entrepreneurship education, we advise the following:
1. Enable all students to access entrepreneurship education. After 20 years of promoting entrepreneurial education in Chinese universities, researchers have agreed on some common-sense concepts. The focus of the discussion is on “How to start a business” and on “How to expand the benefits of entrepreneurship education." Entrepreneurship education does not necessarily render every student an independent entrepreneur but gives them an understanding of entrepreneurship and innovation. The "Basic Requirements for Teaching" clearly states that entrepreneurship education should be integrated into the talent training system.
2. Clarify the discipline orientation of entrepreneurship education. Entrepreneurship education is multidisciplinary and has not yet become common in China. At present, only a few universities such as Zhejiang University and Nankai University have recruited doctoral students in entrepreneurship. As China's entrepreneurship education research is still in its infancy, there are challenges in constructing new curricula.
3. Integrate entrepreneurship education with professional education. The real challenge of entrepreneurship education in Chinese universities is how to combine entrepreneurship courses with existing higher education courses, since the traditional education teaching methods cannot meet the needs of entrepreneurship education. The traditional course evaluation system conflicts with the characteristics of entrepreneurship education courses. The education department is aware of this problem and has clearly stated the need to establish and improve a diversified teaching system that closely integrates entrepreneurship education with professional education. It is equally necessary to construct relevant professional courses and to encourage more professional teachers.
4. Strengthen the practice of entrepreneurship education. Most of the lectures given by teachers in the classroom are theoretical in nature. On the one hand, colleges and universities should intensify efforts to train the trainers who combine theory and practice. On the other hand, they should cultivate "scholar-type entrepreneurs" or "entrepreneur-type scholars" who have both theoretical knowledge and rich experience in entrepreneurial practice. Colleges and universities should: 1) open more practical entrepreneurship education courses in accordance with local conditions; 2) increase the proportion of practical teaching of entrepreneurship education; 3) enhance interaction with enterprises; and 4) extend the service platform of entrepreneurial practice to improve the quality of entrepreneurship education.
Over the past 20 years, many entrepreneurship educators were trained in China. Despite this progress, entrepreneurship education lags behind in teaching organization, content, methods and evaluation. As China’s industry focuses more on innovation, entrepreneurship education will continue to be an important aspect of national policy development.

107
NOTES
1 Mei Weihui. Entrepreneurship Education in American Universities. Hangzhou: Zhejiang Publishing House. 2010: 229. 2 Katz. J. The chronology and intellectual trajectory of American entrepreneurship education. Journal of Business Venturing, 2003 (18). 3 Shi Yongchuan, Huang Zhaoxin, Li Yuanxi. The Difficulties and Countermeasures of College Students' Entrepreneurship Education. Educational Development Research, 2010 (21). 4 Lei Jiazhen. The Status Quo of College Entrepreneurship Education in China and Its Adjustments. Youth Exploration, 2011(1). 5 Chen Gaosheng, Sun Guohui. The National Competitive Sharpness in the New Century—Educational Education in Colleges and Universities. Beijing: Economic Daily Press, 2012:151-155. 6 Huang Zhaoxin, Zeng Erlei, Shi Yongchuan. Orientation of Post Entrepreneurship: Strategic Choice of Transformation and Development of Entrepreneurship Education in Universities. Educational Research, 2012(12).

108
In collaboration with:
www.johnson.cornell.edu/Emerging-Markets-Institute
ISBN-13: 978-1-7328042-2-7
facebook.com/CornellEMI/ @lourdescasanova