The Presence of Non..;Ec Multinationals in European Industry
36
ONDERZOEKSRAPPORT NR 9328 The Presence of Non..;Ec Multinationals in European Industry by Reinhilde VEUGELERS D/1993/2376/28
-
Upload
khangminh22 -
Category
Documents
-
view
5 -
download
0
Transcript of The Presence of Non..;Ec Multinationals in European Industry

ONDERZOEKSRAPPORT NR 9328
The Presence of Non..;Ec Multinationals in
European Industry
by
Reinhilde VEUGELERS
D/1993/2376/28
THE PRESENCE OF NON-EC MULTINATIONALS IN EUROPEAN INDUSTRY
BY
REINHILDE VEUGELERS 0
September 1993
Abstract After a sketch of FDI flows in general and towards the EC in specific, the implications of foreign presence in the EC industries are analyzed through a study of non-EC affiliates . After a first overview of the size of this foreign presence in terms of sales and entries, according to the various home countries and within various industries, the different characteristics of foreign affiliates relative to EC companies are studied. Diversification, average size, size distribution and concentration are sketched for the non-EC versus the EC sample. Next, the industry distribution of (sales by) non-EC divisions is explained by relating this distribution to industry characteristics capable of generating the MNE phenomenon such as the presence of intangible assets, strategic motives, requirement of local presence and availability of other modes of serving foreign markets. The existence of comparative advantages of the various home markets are then related to the foreign penetration of these nationalities within EC industries. By including the comparative advantages of EC industries into the analysis, the impact of foreign presence by nationality and by industry on the EC's economy is considered.
o This work is part of the SPES project on "The Europeanisation of Industry" (SPES-0028-UK). The author would like to thank Rita Sepelie and Kris Frooninckx for the computational assistance as well as Leo Sleuwaegen for the interesting discussions. Financial support from the FKFO (2.0052.92) and the DPWB (SS/Dl/007) is gratefully acknowledged.
1

1. THE EC POSITION IN FDI FLOWS
Investments by foreign companies into the European Market has
traditionally attracted a lot of academic and professional attention
if only because of the ambiguous consequences of such investment for
the EC's economic, political and social objectives. The lifecycle of
papers dealing with this critical issue have correlated intensively
with the various stages of integration within the EC. In the fifties
and sixties, US companies rushed into Europe. Although econometric
tests of American FDI in Europe yielded inconclusive results
pertaining to the effects of integration on inward investment flows
and the impact of such investment on economic growth, a fear of
economic and political dependence was created on the continent.
Nowadays, a different structure of FDI flows creates a more subtle
athmosphere. The following table details the position of EC, Japan
and the US as host as well as home country to FDI in 1987 .
Table 1
Share in 1987 flows Average yearly growth 84-87
EC (12) us JAPAN
OUT
54.7% 15.3 % 30.0 %
Source: Eurostat, 1990
14.5% 5.7%
18.4%
IN
23.8 % 74.3 % 1. 9 %
17.0% 9.2%
Whereas the US has clearly lost its position as major home country of
foreign investment flows -most of the US outward FDI flows are
reinvested earning into the EC- and despite the fast growing
2

investment flows originating from Japan, the main geographical source
of outward investment are the 12 EC countries. Most of these
investment flows end in the US, which has become a major host
country. All this leaves for 1987 the EC to be the major net
exporter of FDI and the US the major net importer. But as the growth
figures shows, the expansion of inward FDI in the US which was one of
the hallmarks of the eighties has given way to substantial growth in
inward investment from the US as well as from Japan in a EC
rejunenated by the the 1992 integration project.
The following table details the position of the EC in in- and
outward FDI in terms of the individual member states as well as the
industries in which these flows occur (Year=l987). The UK emerges as
the most important source as well as destination of investment flows.
The German economy displays an important outward FDI activity, but
its capital market structure generates negligeable inward FDI flows.
The industry distribution clearly awaits more detailed breakdowns,
but apparent are the European MNEs in refining and chemicals, whereas
most incoming FDI flows originate in the finance and banking sector.
OUTWARD FDI INWARD FDI OUTWARD FDI INWARD FDI --------------------- --- --------- ---- --------------------------------
BY MEMBER STATES BY INDUSTRY ---------------------------------------------------------------------UK 54% UK 40% ENERGY 18% CHEMICALS 13% GER 17% FRA 16% CHEMICALS 10% AGRI&FOOD 10% NETH 12% ITA 14% ELECT 9% ELECT
5% FRA 11% SPA 11% AGRI&FOOD 8% FIN &BANK 39% ITA 2% NETH 7% TRADE&HOTEL 16% REAL ESTATE 12% BLEU 2% BLEU 6%
Source: Eurostat, European Communities Direct Investment, 1984-1989, 1992.
3

When focusing on the EC as destination of FDI flows, about half of
these flows are intra-EC leaving half of the flows to be "foreign".
As a% of total non-EC inflows, the EFTA countries account for 30%,
whereas the US and Japan account for resp 15% and 12% (Year=l987).
The intense economic linkages between the neighbouring EFTA and
EC blocks is reflected in the strong position of the latter among the
non-EC investors. The EFTA countries, led by Sweden and Switzerland
have been traditionally very outward oriented, especially into the EC
and in manufacturing. Recent FDI patterns strengthen this
orientation towards the EC and in manufacturing.
US MNEs have traditionally been the most active investors in the
EC, with a preference for the UK. Although manufacturing takes up
the majority of US flows, banking, finance and insurance are also
important sectors.
Japanese direct investment into the Community is increasing
rapidly but still remains at negligible levels compared to the US.
Again the UK is the main beneficiary of the Japanse inflows. Total
flows are dominated by finance and insurance representing almost one
half of the total. In manufacturing, the electronics sector is the
most important, followed by chemicals, machinery and transport
equipment. (Source: Panorama of EC Industry, 1991)
The statistical picture of foreign involvement on the basis of FDI
flow statistics clearly shows some global trends at play such as the
strong position of the EC as home country, Japanese FDI into the US
and the EC and the pull exerted by the EC single market. Within this
setting, foreign investment flows into the European industry are
evaluated more on the grounds of their competitive results, then in
terms of economic and political dependency, as in the fifties and
4

sixties. However, in order to asses the impact of foreign companies
on the competitiveness and long-term performance of the EC, a more
indepth study of the geographical and industry origin of this foreign
presence, in all of its aspects, is required. (Cumulated) flow data
on foreign direct investment, although they give a clear picture of
the recent trends in multinational operations are a poor indication
of the relative importance of various home countries certainly at a
more disaggregated industry level. The distribution of foreign
affiliates across industries, supplemented with information on trade
flows and alliances as alternative forms of foreign involvement can
serve as a more useful proxy to measure the impact of a foreign
presence on the structure of EC industries. This paper is an attempt
to tackle this study.
2. THE PRESENCE OF NON-EC COMPANIES IN THE EC MATRIX
The analysis of foreign penetration through affiliates draws on an
elaborate micro database, the EC market share matrix, constructed
specifically for the SPES project on "The Europeanisation of
Industry". Appendix 1 contains a short description of the
methodology of the data collection. Within this EC matrix the
leading firms that have foreign, i.e. non-EC, parentage are singled
out and analyzed along country of origin and industry distribution.
2.1. The share of non-EC companies in the EC matrix
In contrast to data on FDI flows, focusing on the share in numbers of
and sales by subsidiaries as a measure of market penetration will
give more weight to the US as home country, given its long
5

established presence and despite the recent declines in FDI flow
shares.
/1 CIES
Table 2
SALES (MIO ECU)
AVERAGE SIZE
________ ... __ __________________________________________________________
TOTAL 407 797639.24 1959.8
EC 362 89% 681056.29 85% 1881.37
NON-EC 45 11% 116582.95 15% 2590.73 CAN 3 7% 4360.06 4% 1453.35 JAP 2 4% 730.32 1% 365.16 EFTA (SWE/SUI) 8 18% 25976.15 22% 3247.02 us 32 71% 85516.42 73% 2758.59
About 11% of all matrix companies originate from outside the EC, with
the overwhelming majority indeed from the US with the EFTA, i.e.
Sweden and Switzerland, coming in second. The recent nature of
Japanese investment is reflected in the low share of this country in
terms of number of companies in the matrix. These 11 % of foreign
companies account for 15% of the matrix sales, which already
indicates that the average size of foreign companies is higher than
their EC counterparts. The last column reveals that this larger
average size prevails especially for the Swiss, Swedish and US
companies, whereas the freshly established Japanese are clearly
smaller in size.
In order to check whether this larger size is due to the
concentration of foreign companies in large-scale industries or
whether they are indeed larger than EC companies within industries, a
closer look at the industry distribution of foreign involvement is
called for.
6

2.2. The industry distribution of non-EC firms
Given the limited number of foreign observations, an industry
classification, more aggregated than the NACE 3 digit is used, unless
otherwise stated. Figure 1 shows the foreign penetration in terms of
sales and numbers for each of these industries. The operations of
firms within industries are used as unit of analysis.
Insert Figure 1 here
The industry in which the non-EC presence is particularly pervasive
is computer and office equipment where they take up 54% of total
matrix sales. With only 16% of total matrix entries, non-EC
activities are substantially larger than the EC activities within
this industry.
Other industries in which non-EC companies hold an above average
share in industry sales are tobacco (34%), soap & cosmetics (31%),
scientific and photographic equipment (28%), toys and sporting goods
(27%), food (20%), motor vehicles (19%) and industrial & farm
equipment (18%). In all these industries, non-EC operations are
larger in size than the EC operations active in these industries, as
a comparison with their share in entries reveals. With the exeption
of the tobacco, motor vehicles and soap & cosmetics industry, all of
these industries are characterized by a below average average size
Industries in which non-EC companies hold a negligible share are
iron & steel (5%) non-metallic mineral products (3%), metal products
(7%), other transportation equipment (2%), aerospace (1%), textiles
(4.5%), apparel (1%) and wood (0.5%). Also in electrics and
electronics, non-EC firms hold a modest 8%, in telecommunications
7

this is only 4%. With the exeption of iron & steel and aerospace,
these are again all industries that are smaller in average size than
on average.
Before relating the industry distribution of non-EC presence to
industry characteristics as well as host and horne countries
competitive advantages, a profile of non-EC companies relative to
their EC counterparts across all industries is sketched .
2 .3. Differential characteristics of non-EC firms
If only because of different strategic avenues out of different
competitive capabilities, foreign companies are often characterized
as constituting a different strategic group within an industry. This
section will study to which extent foreign companies differ in terms
of diversification, scale, size distribution and concentration. The
implications of any differences for European industry are indicated.
(i) Diversification
On the basis of their sales realized in different industries (as
defined on the NACE 3 digit level), non-EC companies are less
diversified than their EC counterparts . The reciprocal of the Berry
index for non-EC companies, RNEC• is higher than the equivalent for
the EC companies .
8

Table 3
+
.503 .480 .85
with RNEc= ~ Ri * Si/SNEC i€NEC
REc= ~ Ri * Si/SEc i€EC
.636 .15
with Ri = ~sij 2;si2 j
However, a more crude measure of diversification, i.e. the average
number of matrix entries per company for which the non-EC and the EC
firms account for, reveals the opposite tendency. Non-Ec companies
have more activities in various NACE3 sectors than their EC
companies.
Table 4
+
4.69 4.67 .85 4.82 .15
AE=average number of matrix entries
The intangible assets given rise to multinational operations nurture
at the same time diversification strategies. The drive for economies
of scope can be organised along geographical as well product avenues,
where both alternatives are not necessarily exclusive . As such ,
multinationals firms are more likely to be diversified. The
diversification strategy of a subsidiary however is determined by the
parent company which considers each subsidiary within its global
sourcing system. When these activities are mere screw drivers for
products imported from within the company, the diversified activities
of affiliates within a global network can be of smaller size,
reconciling tables 3 and 4.
The columnwise information provided by the matrix allows to
assess the influence of differences in diversification strategies on
9

the share of foreign involvement within industries. Whereas
traditional information on foreign involvement ignores
diversification strategies, the matrix allows to establish the true
share of foreign involvement, taking into account diversification.
To check to which extent this diversification influences the pattern
of foreign involvement, the traditional approach was performed for
the non-EC and EC companies, classifying their total sales in the
industry in which their largest sales are based. Before comparing
the "classical" penetration figures·with the matrix approach, the
diversification strategies of non-EC companies are discussed.
Figure 2a details the comparison between this traditional and
the matrix approach, plotting the ratio of non-EC industry sales when
total firm sales are classified to the major industry to non-EC
industry sales on the basis of the matrix. A value larger (smaller)
than 1 implies that ignoring diversification under(over-)estimates
the size of non-EC sales within this industry, reflecting an industry
where inward (outward) diversification is most pervasive.
Insert figure 2a here
In industries like chemicals (1.10), metal products (1.27),
industrial equipment (1.17), beverages (1.19), publishing and
printing (1.32), rubber & plastics (1.10) and toys and sporting goods
(1.12) taking into account diversification strategies substantially
increases non-EC sales in these industries, reflecting that there is
considerable inward diversification from non-EC companies based in
other industries. On the other side of the spectrum, iron & steel
(.83), pharmaceuticals (.62), electronics (.84), scientific &
photographic equipment (.74) are industries where taking into account
10

diversification lowers non-EC sales. All these industries can hence
be characterized by important outward diversification flows by non-EC
companies.
For a number of industries, foreign sales in Europe are only
composed of sales by MNES that have their major activity in other
industries. The list includes aerospace, jewelry and watches,
textiles, apparel, wood and furniture.
The impact of diversification on foreign involvement involves a
comparison of diversification strategies of EC versus non-EC
companies. Figure 2b presents the foreign share in total matrix
sales when diversification is ignored. For easy comparison, the
matrix penetration figure is plotted as well.
Insert figure 2b here
The "classical" approach, ignoring diversification overestimates the
foreign presence in industries like pharmaceuticals, metal products,
industrial and farm equipment, computers and scientific equipment.
In pharmaceuticals, scientific equipment and to a lesser extent
computer, this overestimation is due to the more intense outward
diversifying activities of non-EC companies relative to their EC
partners. As figure 2a revealed, non-EC companies display an inward
diversification policy in metal products and equipment, but this
inward diversification is less intensive than the EC inward
diversification, resulting in the overestimation of non-EC presence
despite inward diversification.
In industries like drink, tobacco, textiles and jewelry &
watches, and to a lesser extent in chemicals, food and motor
vehicles, the classical approach underestimates the "true" foreign
11

presence. A more intense inward diversification pattern from non-EC
companies explains this underestimation in drink, food, chemicals,
jewelry & watches and textiles. In tobacco and motor vehicles, this
underestimation is due to the less intense outward diversifying
activities of non-EC companies as compared to their EC counterparts.
In a number of industries the diversification patterns are not
pervasiness or different enough to yield a significant impact on the
non-EC penetration. In soaps & cosmetics, EC and non-EC companies
display modest inward diversification activities, whereas electrics &
electronics witnesses an equally intensive outward diversification
for EC and non-EC companies.
(ii) Average divisional size
As already indicated supra, non-EC firms and operations are on
average larger in size than EC firms and operations. The following
table details the average division size. With their 15% share in
sales, non-EC multinationals contribute 19% to total average size,
which indeed reflects their larger average division size.
AS TOT
417.9
Table 5
401.5 . 85 81%
549.2 .15 19%
The following decomposition exercise allows to trace the difference
in average division size between EC and non-EC companies into a
proportional effect - the difference in average size due to sector
composition- and a differential effect -the difference in average
size within industries.
12

13
i i
lh S NEG S EC
(ASiNEC - ASEci) ASNEC - ASEC 2:: (---- - + -----) i SNEC SEC
differential effect
+
i i
lh S NEG S EC
(ASiNEC ASEci) 2:: (--- - - ------) + i SNEC SEC
proportional effect
AS= average size (sales/entries) S= sales i= industry
The following results were obtained:
Table 6
Diff + Prop
549.2 401.5 147.7 61.8 85 . 9
Non-EC operations are on average larger than EC operations both
because they are more present in large scale sectors (prop>O) as well
as because they are within sectors larger than their EC counterparts
(diff>O). All this is not surprising. The intangible asset
advantage on which MNEs are building their international expansion,
makes them less sensitive to the classical barriers to entry that
characterize large scale sectors, explaining the proportional effect.
The differential effect can be explained by the fact that, given the
alternatives of exports when MOS plants are not (yet) feasible, MNEs
do not have to operate with below MOS plants when targetting the EC
market. In addition, foreign companies may easier decide to
disinvest when sales no l onger guarentee MOS operations and may be
more able to expand production capacity out of their advantages.

The decomposition reveals that the proportional effect is more
important in explaining the differences in scale than the
differential effect, which implies that after correcting for sectoral
distribution, EC companies are less at a disadvantage in terms of
scale relative to non-EC companies.
(iii) Size distribution and Concentration
A much debated issue is the relation between foreign companies and
concentration in the host economy. The often empirically documented
positive correlation between the two phenomena is not surprising.
Again the intangible assets given rise to multinational operations,
are at the same time typical barriers to entry establishing high
concentration within the industry. However, this positive
correlation does not help to disentangle the causal relationship in a
dynamic setting: does high concentration attract foreign companies
(see strategic incentives to become MNE) or do multinationals, out of
their specific advantages, increase concentration. This causal
issue, which is clearly important to asses the impact of foreign
presence on the EC industry structure, cannot be pursued here given a
lack of dynamic data. Having to restrict the focus on a static
setting, and in order to avoid the simultaneity issue that typically
creeps up in static analysis, a direct way to measure the
contribution of affiliates of non-EC companies to industrial
concentration in the EC is attempted. Three concentration measures
are studied: the entropy, the relative entropy and the Herfindahl
index, to capture various aspect of the concentration phenomenon,
i.e. inequality in size, number of firms and market shares.
14

All of these measure will be disaggregated into a non-EC and EC
component . Again the unit of analysis is the division.
E
5 . 104
Table 7: The Entropy Decomposition
ENEC * MNEC + EEC * MEG Ew
3 . 19 . 15 4.94 .85 4.678
+ logl/MNEC*MNEC + logl/MEc*MEc EB
. 285 . 138 . 422
Table 8 : The Relative Entropy Decomposition
15
R R R R E = E NEG * MNEc*logNNEc/logN + E EC * MEc*logNEc/logN + E B * log2/logN ERw ERB
.85 . 84 .095 . 84 .83 . 61 . 115 . 777 .07
Non-EC firms have a lower entropy measure than EC firms . This could
be due to more inequality of sizes or simply becuase there are fewer
non- EC firms in the matrix. The relative entropy figures reveal that
it is indeed the latter case that prevails . The equal relative
entropy figures for both groups indicates that there is no
distinction in size distribution within both groups.
The low between-entropy figure might reflect an important
inequality in size between both groups, as also suggested by the
previous analysis. After correcting for the number of groups , the
relative between-entropy indeed remains lower than the within- group-
entropy. The high relative entropy, indicating low inequalities in
size in European industry, reflects mainly the low inequalities
within the non-EC and EC companies and prevails despite the larger
inequality in size between both groups .
A second measure of concentration is the Herfindahl index that
can similarly be decomposed in different subsegments. The
contribution of non-EC firms to the total concentration within the EC

is considerable, despite their small share in sales. This large
contribution is due to the higher level of the H-index within the
non-EC groups as compared to the EC group. But nevertheless the low
index numbers in all categories reveal low concentration.
Table 9: The Herfindahl decomposition
H
.021 .013 .85 53%
. 065 .15 47%
Whereas this exercise gives an overall picture of the contribution on
non-EC firms to total EC concentration, such an analysis should
clearly be supplemented with a similar exercise at the industry
level. Given the limited number of non-EC companies in the sample,
such an attempt is not pursued here.
2.3. A characterization of non-EC intensive industries
The foreign presence and penetration within European industries can
be typified through characteristics of these industries that favor
multinational production. Whereas this section concentrates on
industry characteristics in general and within the EC, the next
section will include industry specific horne market characteristics to
explain the industry distribution.
Although industry characteristics that can explain the intensity
of multinational operations should be considered simultaneously in
explaining the industry distribution of non-EC sales in the matrix,
such an attempt will not be made here given the limited size of the
16

sample. Attention is restricted to a one-by-one analysis of these
characteristics.
As already frequently pointed out, intangible assets, such as
(technological) know-how and/or brandname give rise to the MNE
phenomenon. Hence, MNEs are often characterised by high R&D,
advertising or phyical capital in which these assets are embodied.
As such industries, intensive in these intangible assets are
projected to have more multinational companies. As table 10 points
out, R&D and ADV intensive industries witness a deeper penetration of
foreign companies, in sales as well as in number of companies.
Physical capital that gives rise to scale economies exploitable
through other means of foreign operations does not create more
intensive foreign presence.
Besides of exploiting advantages on the basis of intangible
assets, strategic motives may equally drive the international
expansion of MNEs. Follow-.the-leader, preemption, footholds in
rivals'home markets are all examples of strategic incentives for
multinational operations. Mutual forbearance on the other hand is a
strategic motive that restricts international operations. These
strategic incentives are more likely to prevail in industries where
concentration on a global scale is high. Table 10 confirms that
indeed in these industries, non-EC presence is higher in sales. The
presence of important EC rivals on whose ownership specific
advantanges foreign firms may want to tap or in whose home markets
foreign firms may want to establish a foothold, seems to restrict
foreign penetration, which might reflect a.o . mutual forbearance.
'1992', as measured by the vulnerability index, is too recent a
phenomenon to explain the presence of non-EC companies in the matrix .
17

Irrespective of intangible assets or strategic considerations, a
physical presence in the market may be necessary to serve this
market. Government intervention may be one such reason . Industries
in which procurement , regulation or other non-tariff barriers prevail
are indeed more intensively penetrated by non-EC affiliates .
Transportation costs need to be considered in conjunction with other
industry characteristics before its positive impact on foreign
penetration will prevail.
Companies wanting to serve foreign markets may have other
alternatives available besides direct investment . Simple exports
allow foreign sales without considerable investment in the host
economy. Alliances with local companies may be another mode of
foreign operations that allows to tap on the specific advantages of
local partners and generates access to local distribution networks.
Industries in which exports are a viable foreign sales strategy as
reflected by the total trade flows that occur within these
industries, are less penetrated by foreign affiliates. More
specifically, industries in which there is an intense trade flow
between EC and non-EC countries are less characterized by the
presence of non-EC companies . Alliance intensive industries are
typically more inhabited by multinat i onal companies , a difference
that is even significant in terms of number of companies, indicating
that alliances complement rather than substitute multinational
operations. When concentrating on industries characterized by
important a l liances between EC and non- EC companies as a direct
alternative for non- EC affiliates , non- EC companies have a larger
share in terms of entries but not in terms of sales, in which a
substitute character seems to prevail.
18

Table 10
Non-Ec share in sales numbers
in HIGH/LOW in HIGH/LOW /1 HIGH sectors sectors
INTANGIBLE ASSET INTENSIVE
R&D 11 15.0 11 . 9 13.6 10.0 Advertising 13 17.8 8.4 13 . 6 9.0 Physical capital 12 10.4 15 . 8 10.9 11.9
STRATEGIC
Global concentration 22 14.1 6.4 11.5 10.7 Strong EC Rivals 8 11.6 14.0 11.2 11.5 1992 12 12.8 13.6 10.8 11.9
LOCAL PRESENCE REQUIRED
Procurement/regulation 7 16.9 11.8 12.7 10.9 Non-tariff barriers 16 14.5 11.0 12.2 10.0 Transportation costs 12 11.4 14.9 10.8 11.9
ALTERNATIVES FOR FOREIGN OPERATIONS
Trade General 16 12.7 14.2 11 . 0 12.1 EC-nonEc 13 12.6 13 . 9 10.2 12.7
Alliances General 21 14.6 6 . 0 12.4 6.0 EC-nonEc 13 12.8 15 . 6 13.3 10.5
Note: All of the industry characteristics are represented by dummies for either high (above average) or low(below average). Source: Lyons & Davies (1992) except Global Concentration, Strong EC Rivals and Alliances (Veugelers (1992)) Note: In bold are the signficantly different means (a=.05). The limited number of sectors in the sample (25), prohibits in most cases the reaching of adequate levels of statistical significant differences.
The following figure details for each industry in which foreign
companies are intensively engaged in (i.e. non-EC share above
average) which of the aforementioned industry characteristics prevail
in explaining this foreign penetration.
Insert figure 3 here
19

All of the non-EC intensive industries are characterized by high or
medium R&D intensive technologies, with the exeption of soap &
cosmetics, food, tobacco and toys & sporting goods. The MNEs present
in these industries build more on brandname as intangible asset as
reflected by their high advertising intensity.
Given that for all of these industries (exept chemicals) the
concentration on a world scale is medium to high (i.e. C4>.3)
strategic incentives cannot be ignored. Strategic considerations
vis-A-vis EC rivals are more likely in chemicals, machinery,
automobiles, food and rubber & plastics in which the EC global
companies hold a comparative advantage, cf. infra.
Only in pharmaceuticals, computers, electrical and electronic
equipment, exogeneous factors like government regulation, procurement
and other tariff barriers are pervasive enough to contribute to
explaining the non-EC affiliative presence.
Trade is no viable alternative for non-EC companies looking
towards the EC market in industries like pharmacuticals, soap &
cosmetics, food, tobacco and rubber & plastics. Only in
pharmaceuticals government intervention can be pinpointed as cause
for this low export orientedness. In all other industries, local
presence is more driven by the need for customer responsiveness.
The lack of alliances with EC companies as alternative to get
access to European markets may explain why in industries like soap &
cosmetics, computers, food and toys & sporting goods more affiliative
presence can be indicated.
For the industries in which non-EC penetration is negligeable, i.e.
below average, the same exercise can be performed to analyse the
reasons for this non-presence.
20

Insert figure 4 here
With the exeption of transportation equipment, aerospace and watches,
all of these industries score low in R&D intensity. Brandnarne as
possible source of intangible asset is only pervasive in watches and
drink and medium in apparel, furniture and printing & publishing.
The reason why there is so little non-EC presence in these industries
despite the presence of intangible assets can be related to presence
of trade as a viable substitute for transportation equipment,
aeropsace, watches, and (to a lesser degree) apparel . Alliances
between EC and non-EC companies are actively being used, possibly as
alternative to local production, in drink, furniture and printing &
publishing. Also a lack of comparative advantage from large EC
companies prevails in all of these industries, except in printing &
publishing.
2.4. Foreign presence and host and home market comparative advantages
Countries that on the basis of entrepreneurial advantages related to
technological knowhow or brandnarne, have build a strong competitive
position in an industry, are more likely to be a home country to
multinational corporations. Likewise, does the competitive position
of the host market have an influence on multinational activities.
When the horne market's competitive position originates from
locational advantages, this attracts foreign companies.
Entrepreneurial advantages may stimulate, through expected
spillovers, or distract, through mutual forbearance, foreign
penetration.
21

A profile of comparative advantages of the major home markets as
well as the EC host market is therefore needed to further explain the
industry distribution on non-EC multinationals. Such a profile is
also important when assessing the positive or negative impact of non-
EC firms on the EC economy. The EC economy stands to gain more when
foreign companies originate from strong countries, whereas if strong
EC companies prevail within an industry, foreign presence tapping on
this advantage may endager the EC's competitive position, unless such
competitive position is built through the presence of non-EC
companies .
The following tables relate the foreign penetration per industry
(on the basis of sales) to the comparative advantages of the various
home markets as well as the host market. The comparative advantage
of the home market is on the basis of share of sales by its companies
in total world sales (source: Fortune). The comparative advantage of
the European industry is on the basis of share in global sales as
well as share in exports, to disentangle resp entrepreneurial versus
locational advantages. The US which is the main home market to non-
EC companies is tackled first.
Gji/Gi GRCAj i= - - - - - -
Gj/G
Ej·/E· . ~ ~
ERCAJi= --:---EJ/E
sj i/Si FPji=
sj ;s
j=country (USA, EFTA, EC) i=industry G=Global sales (Source:Fortune) E=Exports (Source: OECD), 1991 S=Matrix sales, 1987
22

LOW MNE PRESENCE DESPITE COMPETITIVE ADVANTAGE
PHARMACEUTICALS Aerospace Wood
FOOD DRINK Apparel Furniture
FPUS·<l l.
Table 11
GRCAUS·>l l.
STRONG MNE PRESENCE ON BASIS COMPETITIVE ADVANTAGE
SOAP & COSMETICS Computers Scientific & Photograp Equipment Tobacco
FPUS·>l l.
~----------------------------------·--------------------------------~
LOW MNE PRESENCE BECAUSE NO COMPETITIVE ADVANTAGE
CHEMICALS MACHINERY Electrics & Electronics Jewelry & Watches
IRON & STEEL MINERALS METALS TEXTILES LEATHER Wood RUBBER & PLASTICS
STRONG MNE PRESENCE DESPITE NO COMPETITIVE ADVANTAGE
AUTOMOBILES
GRCAUS ·<l l.
Note: Industries are indicated in bold when GRCAEC>l and in capital when ERCAEC>l .
US companies hold a strong position in EC-industries like soap &
cosmetics, computers, scientific & photographic equipment and tobacco,
built on their strong competitive position . In all of these industries,
the EC has no global entrepreneurial advantage and only in soap &
23
cosmetics has the EC a revealed comparative advantage in exports,
reflecting locational advantages.
24
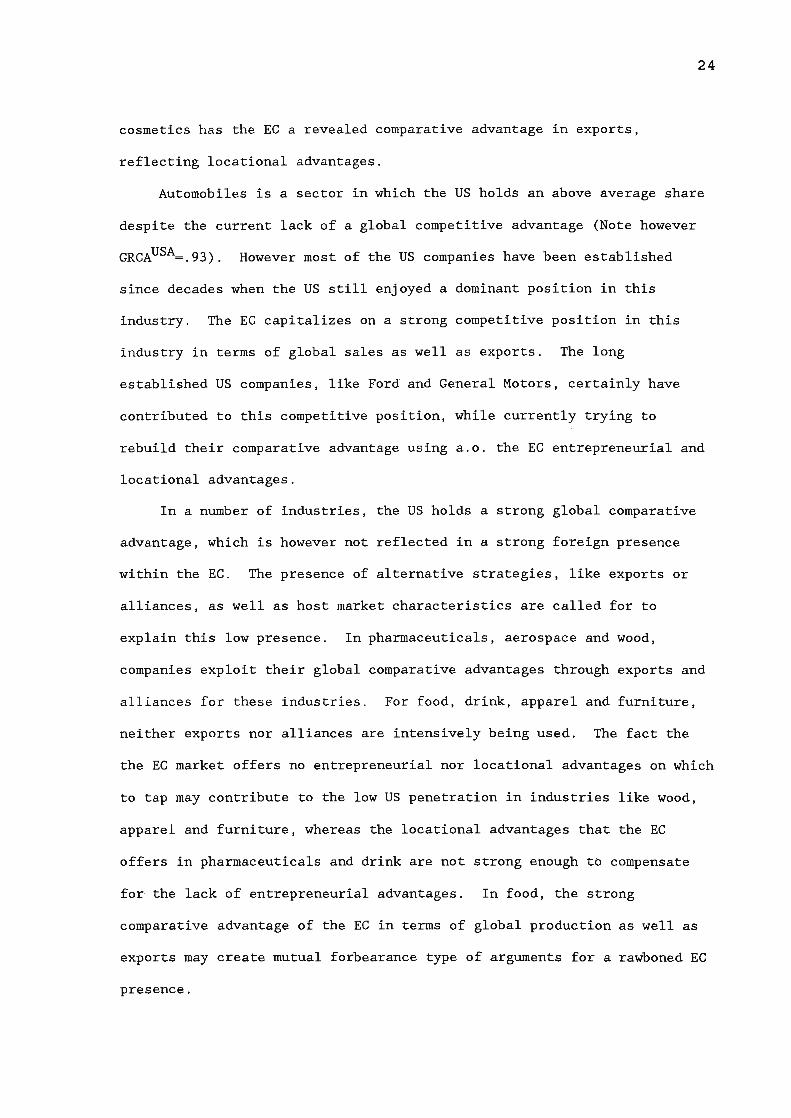
Automobiles is a sector in which the US holds an above average share
despite the current lack of a global competitive advantage (Note however
GRCAUSA=.93). However most of the US companies have been established
since decades when the US still enjoyed a dominant position in this
industry. The EC capitalizes on a strong competitive position in this
industry in terms of global sales as well as exports. The long
established US companies, like Ford and General Motors, certainly have
contributed to this competitive position, while currently trying to
rebuild their comparative advantage using a.o. the EC entrepreneurial and
locational advantages.
In a number of industries, the US holds a strong global comparative
advantage, which is however not reflected in a strong foreign presence
within the EC. The presence of alternative strategies, like exports or
alliances, as well as host market characteristics are called for to
explain this low presence. In pharmaceuticals, aerospace and wood,
companies exploit their global comparative advantages through exports and
alliances for these industries. For food, drink, apparel and furniture,
neither exports nor alliances are intensively being used. The fact the
the EC market offers no entrepreneurial nor locational advantages on which
to tap may contribute to the low US penetration in industries like wood,
apparel and furniture, whereas the locational advantages that the EC
offers in pharmaceuticals and drink are not strong enough to compensate
for the lack of entrepreneurial advantages. In food, the strong
comparative advantage of the EC in terms of global production as well as
exports may create mutual forbearance type of arguments for a rawboned EC
presence.

The second most important home economy is the EFTA (i.e. Sweden
and Switzerland). Whereas the analysis should ideally be on the
level of each country separately, both countries are grouped together
in a rest category, which may contaminate the results once in a
while.
LOW MNE PRESENCE DESPITE COMPETITIVE ADVANTAGE
MINERALS METAL PRODUCTS Wood
Other transport
FPEFTA·<l ~
Table 12
GRCAEFTA·>l ~
STRONG MNE PRESENCE ON BASIS COMPETITIVE ADVANTAGE
PHARMACEUTICALS MACHINERY
Elec&Electronics Food
FPEFTA·>l ~
~----------------------------------·--------------------------------~
LOW MNE PRESENCE BECAUSE NO COMPETITIVE ADVANTAGE
IRON & STEEL CHEMICALS SOAP & COSMETICS Scientif & Photographic Equip Jewelry & Watches FURNITURE
Computers AUTOMOBILES Aerospace Tobacco LEATHER Apparel RUBBER & PLASTICS
STRONG MNE PRESENCE DESPITE NO COMPETITIVE ADVANTAGE
GRCAEFTA;<l
Note: Industries are indicated in bold when GRCAEC>l and in capital when ERCAEC>l.
25

Building on a strong competitive position, EFTA companies are
overrepresented in industries like pharmaceuticals, machinery,
electrical & electronic equipment and food. The EFTA presence in
pharmaceuticals may explain the superior export performance of this
industry in Europe despite the lack of global comparative advantage
from EC companies .
The industries in which the EFTA holds a competitive advantage
but lacks sales by affiliates within the EC are minerals, metal
products, wood and other transportation equipment . The low
locational advantages of the EC within wood and other transportation
equipment may contribute to this low presence. In minerals, EFTA
companies may be refrained from establishing within the EC to tap on
locational advantages by the presence of strong EC rivals. In metal
products, EFTA companies are more intensily engaged in exports and
alliances as alternative modes to tap locational advantages.
The Japanese presence in the EC matrix is too small to be
subject to thorough analysis. A quick overview of the sectors in
which Japanese companies are present, mineral products (glass),
machinery, automobiles and other transportation equipment, reveals
that only in machinery and automobiles the Japanese have a
comparative advantage -on the basis of share in global production as
well as exports- but that more importantly in all of these
industries, the EC has a comparative advantage on the basis of share
in global production as well as exports, indicating that an apparent
motive for Japanese foreign presence is to tap on specific advantages
of the host market, locational - as well as entrepreneurial
advantages.
26

CONCLUSIONS
The presence of leading non-EC companies within the EC is a
phenomenon that is restricted in numbers and size, although these
companies, mostly from US origin, are larger in terms of average
company and divisional size, mostly due to their presence in large
scale sectors. These non-EC companies display more activities, but
this diversification is of smaller average size. In industries like
pharmaceuticals, industrial equipment , computers, scientific
equipment, a differential diversification strategy of non-EC
companies versus their EC counterpart, results in a upwardly biased
presentation of the foreign penetration if diversification would be
ignored.
Despite their limited presence on average within the EC, non-EC
companies can be pervasive within specific industries, notably in
computer & office equipment, food & tobacco, soap & cosmetics,
scientific & photographic equipment, toys and sporting goods . All of
these industries display an intangible asset intensity but also
global competitive considerations and in a few instances government
intervention may drive this foreign penetration . Where non-EC
presence is pervasive in industries where the home country enjoys a
comparative advantage but where the EC scores mostly low on
entrepreneurial as well as locational advantages, the EC is likely to
win from this foreign presence. In a number of other instances, this
beneficial impact may be less obvious. The presence of strong EC
rivals may attract their non- EC rivals, establishing footholds in
industries like machinery, food and automobiles. But a full
assessment of the impact of foreign affiliates on the comparative
27

advantage profiles of the EC awaits a longitudinal study of both
variables .
28

APPENDIX: METHODOLOGY OF DATA COLLECTION
This appendix provides a methodological explanation of a unique new
micro data source, the EC market share matrix. For each NACE
industry (the EC industry classification scheme) at the 3 digit level
of aggregation, the 5 leaders are identified from information on
company reports, business and trade directories, industry case
studies and other sources. The data collection exercise is confined
to manufacturing industries only (NACE 2-4) where 1987 is the only
chosen year. The first figure located is the company's worldwide
sales by origin (production in ECU million) in 1987. Wherever
possible, sales by both destination and sales by origin were
collected. Intra-company sales are noted but not netted out.
Secondly, the geographical breakdown of the production of each firm
is recorded from the company reports. Thirdly, the company reports
are again used to assess the product breakdown, i.e. the range of
products manufactured by each firm on the basis of which production
figures are allocated to NACE codes. Forthly, ownership is checked
in each case in the company report. If the parentage remained
unclear "Who owns whom" is consulted. In those cases where a firm
has foreign parentage, the country of origin is recorded.
Subsidiaries are consolidated where there are consolidated accounts
or where the firm holds 50% or more of equity. Associate companies
with less then 50% held, are also consolidated if there is evidence
of control by a minority shareholding. The end result is a market
share matrix, where the rows represents firms, in total 315, and the
columns are all Nace 3 digit industries (NACE 2-4). Each entry ij in
the matrix represents firm i's production in industry j ..
29

The market share matrix is a unique database in the following
respects:
1. The matrix is confined to the 'leading' firms where 'leading'
means that the firms should be one of the 5 largest producers within
a NACE 3-digit manufacturing industry.
2. Since many market leaders are diversified across industries, we
collected information on their market shares in all the industries in
which they operate, not just in those where they are leading.
3 . At the aggregate level, virtually all EC firms of any significiant
size will have been included because the vast majority of the big
firms will be in a leading position in at least one of the industries
in which they operate. The matrix also includes a number of quite
small firms who have qualified as either a 'leader' of a small
industry or as one of the smallest 'leaders'. A weakness of the
market share matrix is that it will have excluded numerous middle
sized firms, who although they may be diversified, do not quite
attain a leading position in any industry. It may also have excluded
the occasional large firm who comes 6th or 7th in a large scale
industry.
30

Figure 1 : Sectorial Distribution of Non-EC Companies
IRON-STEEL MINERAL PROD.
CHEMICALS~~ PHARMACEUTICALS~~ SOAP-COSMETICS~~~~ METAL PRODUCTS~
EQUIPMENT~~~ COMPUTER~~~~~~~~
ELECT.-ELECTRONICS ~...........,. MOTOR VEHICLES~~,........ TRANSPORTATION
AEROSPACE~ SCIENTIFIC-PHOTO~~~~·
JEWELRY-WATCHES FOOD~~~
8 EVERAGE S ;;;;;;c:_::~~~ TOBACCO ~~~~..>......>.J TEXTILES LEATHER~~·
APPAREL WOOD
FURNITURE PUBLISHING-PRINTING~···
RUBBER-PLASTICS ~::7'--, TOYS-SPORTS~~~~·
AVERAGE SHARE~~ ~~~~~~~~~
0 1 0 20 30 40 50 60
~SHARE IN SALES EJ SHARE IN ENTRIES "' ~~--------------------------~~

Figure 2 : With or Without Diversification
IRON-STEEL ·
MINERAL PROD. ·
CHEMICALS ~~~~~
PHARMACEUTICALS .~~~~
SOAP-COSMETICS
METAL PRODUCTS
EQUIPMENT
COMPUTER
ELECT.-ELECTRONICS
MOTOR VEHICLES
TRANSPORTATION
SCIENTIFIC-PHOTO •·•
FOOD
BEVERAGES .·
TOBACCO
LEATHER ··••
PUBLISHING-PRINTING
RUBBER-PLASTICS
TOYS-SPORTS
~ 1 - RATIO ~ RATIO
~~--------------~~
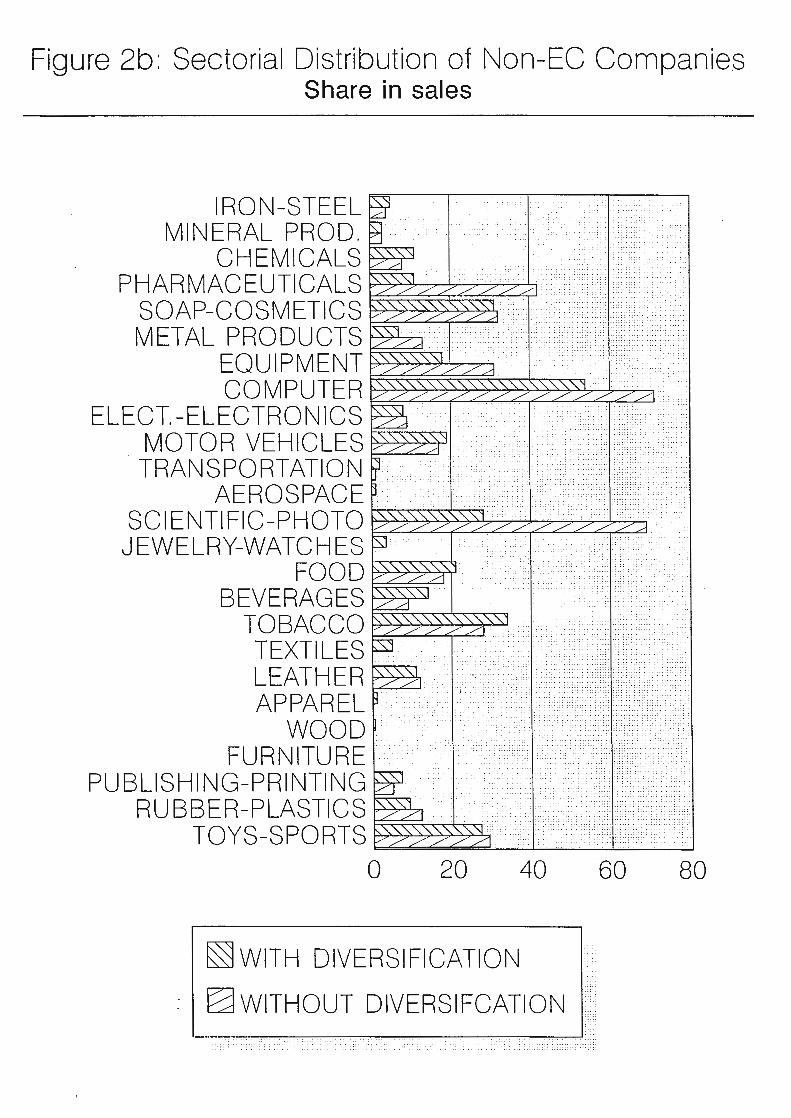
Figure 2b: Sectorial Distribution of Non-EC Companies Share in sales
IRON-STEEL MINERAL PROD.
CHEMICALS~ PHARMACEUTICALS~~~~
SOAP-COSMETICS ·'" '''''''"'""''' METAL PRODUCTS~
EQUIPMENT~~~· COMPUTER~~~~~~~~
ELECT.-ELECTRONICS MOTOR VEHICLES~~ TRANSPORTATION
AEROSPACE SCIENTIFIC-PHOTO~~~~~~~~~~ JEWELRY-WATCHES
FOOD~~
BEVERAGES~~ TOBACCO ~~~"" TEXTILES LEATHER~ APPAREL
wooD .·• FURNITURE ·.
PUBLISHING-PRINTING RUBBER-PLASTICS~*~~
TOYS-SPORTS ~~;:::;::;::;::~·~~~~....;,;;.J 0 20 40 60 80
~WITH DIVERSIFICATION
~WITHOUT DIVERSIFCATION

INTANGIBLE ASSET INTENSIVE
R&D
ADV
STRATEGIC
GLOBAL CONCENTRATION
STRONG EC RIVALS
Figure 3
CHEMICALS ' 1\
PHARMACEUTICALS
SOAP & COSMETICS
MACHINERY
COMPUTERS
ELEC. & ELECTRONICS
AUTOMOBILES
SCIENT. PHOTO EQUIP.
FOOD
TOBACCO
RUBBER & PLASTICS I
TOYS & SPORT GOODS e
LOCAL PRESENCE REQUIRED
PROCUREMENT REGULATIONS
NON TARIFF BARRIERS
TRADEABILITY EC-NON EC
ALLIANCES EC-NON EC

INTANGIBLE ASSET INTENSIVE
Figure 4
IRON- STEEL
LOCAL PRESENCE REQUIRED
MINERALS R&D
"~' ' ...... ...... ' ......
' I
It• METAL PRODUCTS
' I
' ~~ -e TRANSPORTATION EQ. ",I? '
AEROSPACE . .\ t"JL \ """"" '
ADV JEWELRY & WATCHES~ ,, \ //1 I
Ill DRINK \ ' II I
STRATEGIC \\ ' 111 /
\\ /1.1 / • TEXTILES \\Ill . '
WI
'J ' . LEATHER GLOBAL .///', ' -/~rv~~· ' CONCENTRATION , '' • APPAREL
~- !_ \ \/
\ \ \
\ \
\ \ \ . WOOD \ \
\ \ \ FURNITURE \\ .
STRONG EC RIVALS e ,, ~\' ,, -
- PRINT & PUBLISHING • - -j--
PROCUREMENT REGULATIONS
NON TARIFF BARRIERS
TRADEABILITY EC-NON EC
ALLIANCES
EC-NON EC