Emerging Company Research - Ascension Publishing
43
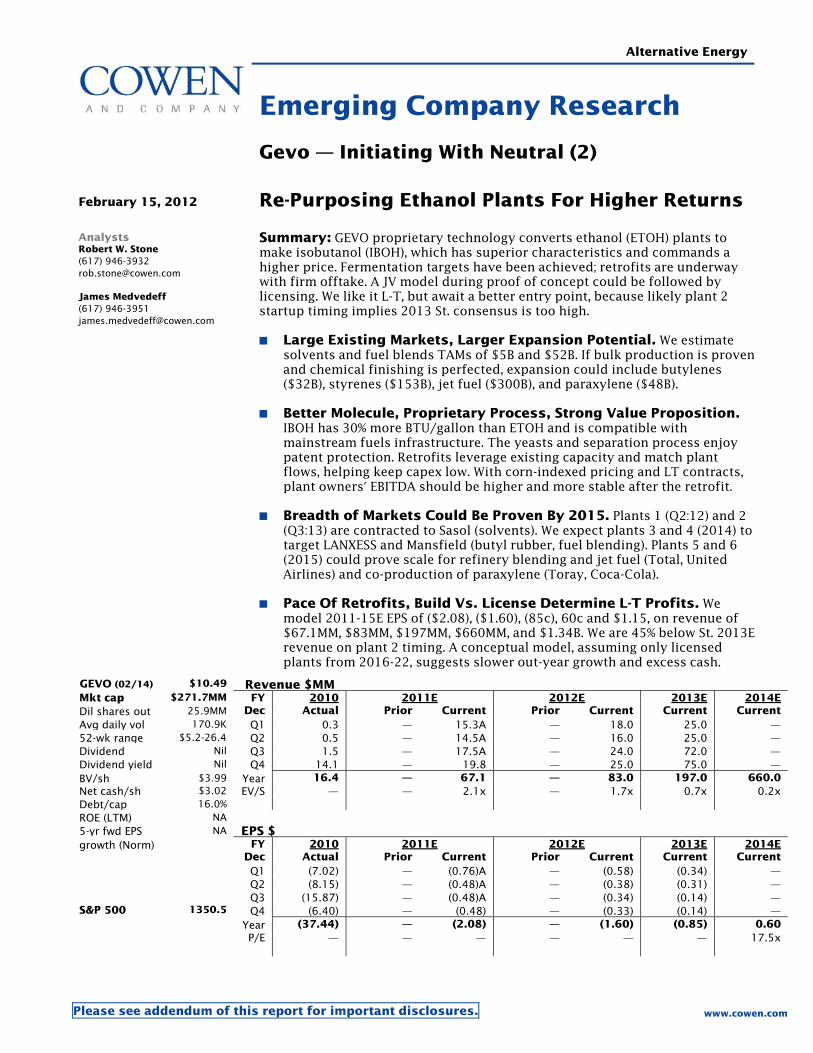
Alternative Energy Emerging Company Research Gevo — Initiating With Neutral (2) February 15, 2012 Re-Purposing Ethanol Plants For Higher Returns Analysts Robert W. Stone (617) 946-3932 [email protected] James Medvedeff (617) 946-3951 [email protected] Summary: GEVO proprietary technology converts ethanol (ETOH) plants to make isobutanol (IBOH), which has superior characteristics and commands a higher price. Fermentation targets have been achieved; retrofits are underway with firm offtake. A JV model during proof of concept could be followed by licensing. We like it L-T, but await a better entry point, because likely plant 2 startup timing implies 2013 St. consensus is too high. Large Existing Markets, Larger Expansion Potential. We estimate solvents and fuel blends TAMs of $5B and $52B. If bulk production is proven and chemical finishing is perfected, expansion could include butylenes ($32B), styrenes ($153B), jet fuel ($300B), and paraxylene ($48B). Better Molecule, Proprietary Process, Strong Value Proposition. IBOH has 30% more BTU/gallon than ETOH and is compatible with mainstream fuels infrastructure. The yeasts and separation process enjoy patent protection. Retrofits leverage existing capacity and match plant flows, helping keep capex low. With corn-indexed pricing and LT contracts, plant owners' EBITDA should be higher and more stable after the retrofit. Breadth of Markets Could Be Proven By 2015. Plants 1 (Q2:12) and 2 (Q3:13) are contracted to Sasol (solvents). We expect plants 3 and 4 (2014) to target LANXESS and Mansfield (butyl rubber, fuel blending). Plants 5 and 6 (2015) could prove scale for refinery blending and jet fuel (Total, United Airlines) and co-production of paraxylene (Toray, Coca-Cola). Pace Of Retrofits, Build Vs. License Determine L-T Profits. We model 2011-15E EPS of ($2.08), ($1.60), (85c), 60c and $1.15, on revenue of $67.1MM, $83MM, $197MM, $660MM, and $1.34B. We are 45% below St. 2013E revenue on plant 2 timing. A conceptual model, assuming only licensed plants from 2016-22, suggests slower out-year growth and excess cash. GEVO (02/14) $10.49 Revenue $MM Mkt cap $271.7MM FY 2010 2011E 2012E 2013E 2014E Dil shares out 25.9MM Dec Actual Prior Current Prior Current Current Current Avg daily vol 170.9K Q1 0.3 — 15.3A — 18.0 25.0 — 52-wk range $5.2-26.4 Q2 0.5 — 14.5A — 16.0 25.0 — Dividend Nil Q3 1.5 — 17.5A — 24.0 72.0 — Dividend yield Nil Q4 14.1 — 19.8 — 25.0 75.0 — BV/sh $3.99 Year 16.4 — 67.1 — 83.0 197.0 660.0 Net cash/sh $3.02 EV/S — — 2.1x — 1.7x 0.7x 0.2x Debt/cap 16.0% ROE (LTM) NA 5-yr fwd EPS NA EPS $ FY 2010 2011E 2012E 2013E 2014E growth (Norm) Dec Actual Prior Current Prior Current Current Current Q1 (7.02) — (0.76)A — (0.58) (0.34) — Q2 (8.15) — (0.48)A — (0.38) (0.31) — Q3 (15.87) — (0.48)A — (0.34) (0.14) — S&P 500 1350.5 Q4 (6.40) — (0.48) — (0.33) (0.14) — Year (37.44) — (2.08) — (1.60) (0.85) 0.60 P/E — — — — — — 17.5x Please see addendum of this report for important disclosures. www.cowen.com
-
Upload
khangminh22 -
Category
Documents
-
view
0 -
download
0
Transcript of Emerging Company Research - Ascension Publishing
Alternative Energy
Emerging Company Research
Gevo — Initiating With Neutral (2)
February 15, 2012 Re-Purposing Ethanol Plants For Higher Returns
Analysts Robert W. Stone (617) 946-3932 [email protected] James Medvedeff (617) 946-3951 [email protected]
Summary: GEVO proprietary technology converts ethanol (ETOH) plants to make isobutanol (IBOH), which has superior characteristics and commands a higher price. Fermentation targets have been achieved; retrofits are underway with firm offtake. A JV model during proof of concept could be followed by licensing. We like it L-T, but await a better entry point, because likely plant 2 startup timing implies 2013 St. consensus is too high.
Large Existing Markets, Larger Expansion Potential. We estimate solvents and fuel blends TAMs of $5B and $52B. If bulk production is proven and chemical finishing is perfected, expansion could include butylenes ($32B), styrenes ($153B), jet fuel ($300B), and paraxylene ($48B).
Better Molecule, Proprietary Process, Strong Value Proposition. IBOH has 30% more BTU/gallon than ETOH and is compatible with mainstream fuels infrastructure. The yeasts and separation process enjoy patent protection. Retrofits leverage existing capacity and match plant flows, helping keep capex low. With corn-indexed pricing and LT contracts, plant owners' EBITDA should be higher and more stable after the retrofit.
Breadth of Markets Could Be Proven By 2015. Plants 1 (Q2:12) and 2 (Q3:13) are contracted to Sasol (solvents). We expect plants 3 and 4 (2014) to target LANXESS and Mansfield (butyl rubber, fuel blending). Plants 5 and 6 (2015) could prove scale for refinery blending and jet fuel (Total, United Airlines) and co-production of paraxylene (Toray, Coca-Cola).
Pace Of Retrofits, Build Vs. License Determine L-T Profits. We model 2011-15E EPS of ($2.08), ($1.60), (85c), 60c and $1.15, on revenue of $67.1MM, $83MM, $197MM, $660MM, and $1.34B. We are 45% below St. 2013Erevenue on plant 2 timing. A conceptual model, assuming only licensed plants from 2016-22, suggests slower out-year growth and excess cash.
GEVO (02/14) $10.49 Revenue $MMMkt cap $271.7MM FY 2010 2011E 2012E 2013E 2014EDil shares out 25.9MM Dec Actual Prior Current Prior Current Current CurrentAvg daily vol 170.9K Q1 0.3 — 15.3A — 18.0 25.0 —52-wk range $5.2-26.4 Q2 0.5 — 14.5A — 16.0 25.0 —Dividend Nil Q3 1.5 — 17.5A — 24.0 72.0 —Dividend yield Nil Q4 14.1 — 19.8 — 25.0 75.0 —BV/sh $3.99 Year 16.4 — 67.1 — 83.0 197.0 660.0Net cash/sh $3.02 EV/S — — 2.1x — 1.7x 0.7x 0.2xDebt/cap 16.0% ROE (LTM) NA 5-yr fwd EPS NA EPS $
FY 2010 2011E 2012E 2013E 2014Egrowth (Norm) Dec Actual Prior Current Prior Current Current Current
Q1 (7.02) — (0.76)A — (0.58) (0.34) — Q2 (8.15) — (0.48)A — (0.38) (0.31) — Q3 (15.87) — (0.48)A — (0.34) (0.14) —S&P 500 1350.5 Q4 (6.40) — (0.48) — (0.33) (0.14) — Year (37.44) — (2.08) — (1.60) (0.85) 0.60 P/E — — — — — — 17.5x
Please see addendum of this report for important disclosures. www.cowen.com
Gevo
February 15, 2012 2
Table Of Contents
Page
Investment Thesis ..................................................................................... 3
Risk Factors .............................................................................................. 4
Value Drivers: Commercialization Milestones ............................................ 5
What Is So Special About Isobutanol? ........................................................ 6
Big Picture View of Current and Future Markets......................................... 7
Large Existing Markets.............................................................................. 8
Potential Expansion Markets ..................................................................... 9
Jet Fuel and Co-Products: $420B TAM ..................................................... 12
IBOH Could Benefit From Renewable Fuel Mandates ................................ 14
Capital Light Strategy Targets Low Risk................................................... 16
Attractive Value Proposition for Plant Owners.......................................... 19
GIFT: Proprietary Fermentation and Separation........................................ 21
Significant Progress on Capacity Execution ............................................. 23
Shift To Licensing Model From 2016?...................................................... 24
Offtake Agreements for First Few Plants.................................................. 25
Expansion Markets Developing Nicely ..................................................... 26
Company History, Management, Ownership ............................................ 28
Retrofit Pacing Determines Path to Profits ............................................... 30
Conceptual All Licensing Model 2016-22E............................................... 38
Positives and Negatives........................................................................... 41
Gevo
February 15, 2012 3
Investment Thesis
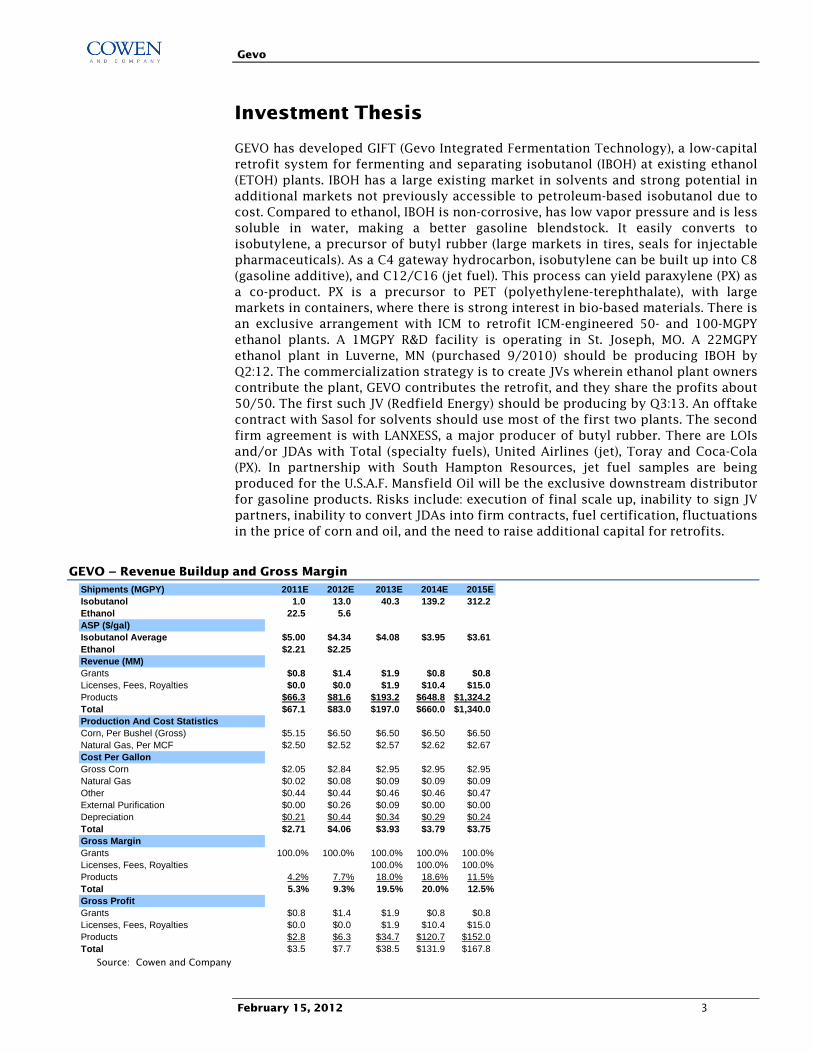
GEVO has developed GIFT (Gevo Integrated Fermentation Technology), a low-capital retrofit system for fermenting and separating isobutanol (IBOH) at existing ethanol (ETOH) plants. IBOH has a large existing market in solvents and strong potential in additional markets not previously accessible to petroleum-based isobutanol due to cost. Compared to ethanol, IBOH is non-corrosive, has low vapor pressure and is less soluble in water, making a better gasoline blendstock. It easily converts to isobutylene, a precursor of butyl rubber (large markets in tires, seals for injectable pharmaceuticals). As a C4 gateway hydrocarbon, isobutylene can be built up into C8 (gasoline additive), and C12/C16 (jet fuel). This process can yield paraxylene (PX) as a co-product. PX is a precursor to PET (polyethylene-terephthalate), with large markets in containers, where there is strong interest in bio-based materials. There is an exclusive arrangement with ICM to retrofit ICM-engineered 50- and 100-MGPY ethanol plants. A 1MGPY R&D facility is operating in St. Joseph, MO. A 22MGPY ethanol plant in Luverne, MN (purchased 9/2010) should be producing IBOH by Q2:12. The commercialization strategy is to create JVs wherein ethanol plant owners contribute the plant, GEVO contributes the retrofit, and they share the profits about 50/50. The first such JV (Redfield Energy) should be producing by Q3:13. An offtake contract with Sasol for solvents should use most of the first two plants. The second firm agreement is with LANXESS, a major producer of butyl rubber. There are LOIs and/or JDAs with Total (specialty fuels), United Airlines (jet), Toray and Coca-Cola (PX). In partnership with South Hampton Resources, jet fuel samples are being produced for the U.S.A.F. Mansfield Oil will be the exclusive downstream distributor for gasoline products. Risks include: execution of final scale up, inability to sign JV partners, inability to convert JDAs into firm contracts, fuel certification, fluctuations in the price of corn and oil, and the need to raise additional capital for retrofits.
GEVO – Revenue Buildup and Gross Margin Shipments (MGPY) 2011E 2012E 2013E 2014E 2015EIsobutanol 1.0 13.0 40.3 139.2 312.2 Ethanol 22.5 5.6 ASP ($/gal)Isobutanol Average $5.00 $4.34 $4.08 $3.95 $3.61Ethanol $2.21 $2.25Revenue (MM)Grants $0.8 $1.4 $1.9 $0.8 $0.8Licenses, Fees, Royalties $0.0 $0.0 $1.9 $10.4 $15.0Products $66.3 $81.6 $193.2 $648.8 $1,324.2Total $67.1 $83.0 $197.0 $660.0 $1,340.0Production And Cost StatisticsCorn, Per Bushel (Gross) $5.15 $6.50 $6.50 $6.50 $6.50Natural Gas, Per MCF $2.50 $2.52 $2.57 $2.62 $2.67Cost Per GallonGross Corn $2.05 $2.84 $2.95 $2.95 $2.95Natural Gas $0.02 $0.08 $0.09 $0.09 $0.09Other $0.44 $0.44 $0.46 $0.46 $0.47External Purification $0.00 $0.26 $0.09 $0.00 $0.00Depreciation $0.21 $0.44 $0.34 $0.29 $0.24Total $2.71 $4.06 $3.93 $3.79 $3.75Gross MarginGrants 100.0% 100.0% 100.0% 100.0% 100.0%Licenses, Fees, Royalties 100.0% 100.0% 100.0%Products 4.2% 7.7% 18.0% 18.6% 11.5%Total 5.3% 9.3% 19.5% 20.0% 12.5%Gross ProfitGrants $0.8 $1.4 $1.9 $0.8 $0.8Licenses, Fees, Royalties $0.0 $0.0 $1.9 $10.4 $15.0Products $2.8 $6.3 $34.7 $120.7 $152.0Total $3.5 $7.7 $38.5 $131.9 $167.8
Source: Cowen and Company
Gevo
February 15, 2012 4
Risk Factors
Timing Delays or Cost Overruns
Retrofits are expected to take about fourteen months, including two months of permitting and engineering, at a cost of $45-50MM for a 100MGPY ethanol plant ($20-25MM for a 50MGPY plant). However, cost is higher in the initial projects. The first (22MGPY) is nearing completion at a cost of $35MM. The second is in process (50MPGY, $40MM). Two per year are expected starting in 2014. Permitting, construction delays, or inability to meet cost projections could impact results.
Need for Additional Financing
Additional cash will be needed to fund retrofits and working capital until the business becomes self-sustaining. We believe cash on hand can cover the first retrofit, but equity raises seem likely in 2012-13 (we model about $170MM total equity and debt, including repayment of $18.9MM of 18% APR debt in Q3:14). The cost of new capital could go down once the first plant is running. However, inability to access capital at favorable cost could limit the business opportunity.
JV Partners May Not Materialize at Expected Pace
We model a total of five JV retrofits through 2015. We believe JVs will be signed if and when the first two projects are proven successful. However, while the pool of potential partners is large and we believe the pipeline is full, there is no guarantee that JVs will result. If they do not, or if they materialize more slowly than the expected rate of two per year, growth expectations could be reduced.
Downstream Contracts May Not Pan Out
The first sales contract is in place and the second one is a firm commitment (pending final details). However, remaining LOIs are yet to be converted. Inability to ink contracts or pass through corn price risk as planned could impact results. Moreover, long term contracts are a key element of the value proposition for ethanol plant owners, who may be reluctant to enter JVs unless firm offtakes are visible.
Bio-Jet Certification Not yet in Hand
Fuels constitute a large part of the TAM. The EPA has already deemed a 12.5% isobutanol blend “substantially similar” to gasoline. However, jet fuel certification from ASTM is not expected until June 2013, and the military is just starting to test. If certifications are not forthcoming, LT growth could be impaired. In addition, if airline GHG reductions mandates are scaled back, bio-jet demand may disappoint.
IP Litigation Could Cause Delays, Consume Cash
To date, only five of the more than 300 patent filings have led to issued patents. If issued, patents could be challenged, invalidated, blocked, or circumvented, as can patents under license. GEVO could be sued for infringing the IP of others. The recent progress in litigation against Butamax and recent patent awards are positives, but the risk category remains. IP litigation could be expensive and stay orders could potentially slow the pace of commercialization.
Cost is higher in the initial projects
We model about $170MM total new equity and debt in 2012-13
We model a total of five JV retrofits through 2015
GEVO plans to pass through corn price risk
Jet fuel certification from ASTM is not expected until June, 2013
Only five of 300+ patent filings have led to issued patents
Gevo
February 15, 2012 5
Value Drivers: Commercialization Milestones
Commercialization Is Already Under Way
Yield should not be an issue as 39% conversion (94% of 41% theoretical max.) and 52 hour fermentation have already been achieved. The wholly owned 22MGPY plant (18MGPY of isobutanol) at Luverne is set to go into production in Q2:12, with Sasol as a contracted 100% off taker. We expect a finalized agreement with LANXESS soon. The first JV retrofit (Redfield) is set to begin construction. South Hampton Resources (a contracted processor) is making jet fuel for the U.S. military for testing.
Luverne Startup Should Raise Confidence, Seal More Deals
Construction is nearly complete and all monthly milestones are on track for the cutover from ethanol to isobutanol in Q2:12. Successful execution should raise the confidence of potential JV partners and offtakers, and could lead to additional partnerships. Financing could become less costly and easier to get. Improved visibility and lower cost of capital could lower investors’ perception of risk.
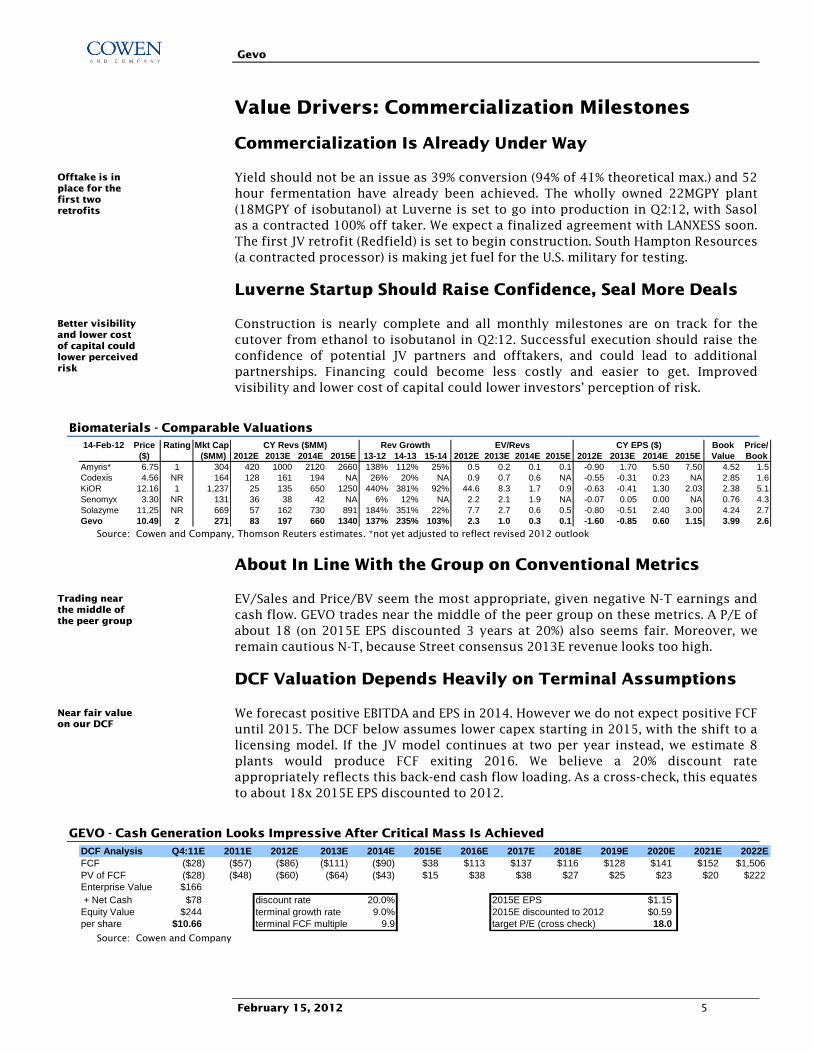
Biomaterials - Comparable Valuations 14-Feb-12 Price Rating Mkt Cap Book Price/
($) ($MM) 2012E 2013E 2014E 2015E 13-12 14-13 15-14 2012E 2013E 2014E 2015E 2012E 2013E 2014E 2015E Value BookAmyris* 6.75 1 304 420 1000 2120 2660 138% 112% 25% 0.5 0.2 0.1 0.1 -0.90 1.70 5.50 7.50 4.52 1.5Codexis 4.56 NR 164 128 161 194 NA 26% 20% NA 0.9 0.7 0.6 NA -0.55 -0.31 0.23 NA 2.85 1.6KiOR 12.16 1 1,237 25 135 650 1250 440% 381% 92% 44.6 8.3 1.7 0.9 -0.63 -0.41 1.30 2.03 2.38 5.1Senomyx 3.30 NR 131 36 38 42 NA 6% 12% NA 2.2 2.1 1.9 NA -0.07 0.05 0.00 NA 0.76 4.3Solazyme 11.25 NR 669 57 162 730 891 184% 351% 22% 7.7 2.7 0.6 0.5 -0.80 -0.51 2.40 3.00 4.24 2.7Gevo 10.49 2 271 83 197 660 1340 137% 235% 103% 2.3 1.0 0.3 0.1 -1.60 -0.85 0.60 1.15 3.99 2.6
CY Revs ($MM) EV/Revs CY EPS ($)Rev Growth
Source: Cowen and Company, Thomson Reuters estimates. *not yet adjusted to reflect revised 2012 outlook
About In Line With the Group on Conventional Metrics
EV/Sales and Price/BV seem the most appropriate, given negative N-T earnings and cash flow. GEVO trades near the middle of the peer group on these metrics. A P/E of about 18 (on 2015E EPS discounted 3 years at 20%) also seems fair. Moreover, we remain cautious N-T, because Street consensus 2013E revenue looks too high.
DCF Valuation Depends Heavily on Terminal Assumptions
We forecast positive EBITDA and EPS in 2014. However we do not expect positive FCF until 2015. The DCF below assumes lower capex starting in 2015, with the shift to a licensing model. If the JV model continues at two per year instead, we estimate 8 plants would produce FCF exiting 2016. We believe a 20% discount rate appropriately reflects this back-end cash flow loading. As a cross-check, this equates to about 18x 2015E EPS discounted to 2012.
GEVO - Cash Generation Looks Impressive After Critical Mass Is Achieved DCF Analysis Q4:11E 2011E 2012E 2013E 2014E 2015E 2016E 2017E 2018E 2019E 2020E 2021E 2022EFCF ($28) ($57) ($86) ($111) ($90) $38 $113 $137 $116 $128 $141 $152 $1,506PV of FCF ($28) ($48) ($60) ($64) ($43) $15 $38 $38 $27 $25 $23 $20 $222Enterprise Value $166 + Net Cash $78 discount rate 20.0% 2015E EPS $1.15Equity Value $244 terminal growth rate 9.0% 2015E discounted to 2012 $0.59per share $10.66 terminal FCF multiple 9.9 target P/E (cross check) 18.0
Source: Cowen and Company
Offtake is in place for the first two retrofits
Better visibility and lower cost of capital could lower perceived risk
Trading near the middle of the peer group
Near fair value on our DCF
Gevo
February 15, 2012 6
What Is So Special About Isobutanol?
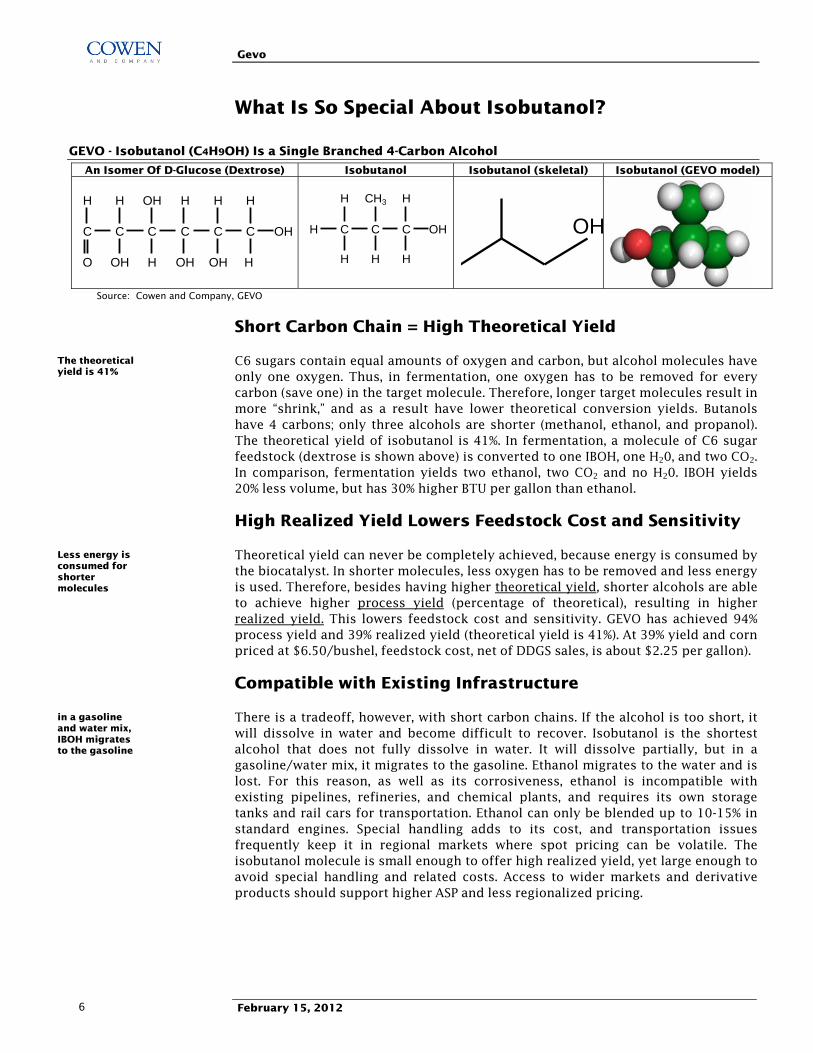
GEVO - Isobutanol (C4H9OH) Is a Single Branched 4-Carbon Alcohol
An Isomer Of D-Glucose (Dextrose) Isobutanol Isobutanol (skeletal) Isobutanol (GEVO model)
H H OH H H H
C C C C C C OH
O OH H OH OH H
H CH3 H
H C C C OH
H H H
OH
Source: Cowen and Company, GEVO
Short Carbon Chain = High Theoretical Yield
C6 sugars contain equal amounts of oxygen and carbon, but alcohol molecules have only one oxygen. Thus, in fermentation, one oxygen has to be removed for every carbon (save one) in the target molecule. Therefore, longer target molecules result in more “shrink,” and as a result have lower theoretical conversion yields. Butanols have 4 carbons; only three alcohols are shorter (methanol, ethanol, and propanol). The theoretical yield of isobutanol is 41%. In fermentation, a molecule of C6 sugar feedstock (dextrose is shown above) is converted to one IBOH, one H20, and two CO2. In comparison, fermentation yields two ethanol, two CO2 and no H20. IBOH yields 20% less volume, but has 30% higher BTU per gallon than ethanol.
High Realized Yield Lowers Feedstock Cost and Sensitivity
Theoretical yield can never be completely achieved, because energy is consumed by the biocatalyst. In shorter molecules, less oxygen has to be removed and less energy is used. Therefore, besides having higher theoretical yield, shorter alcohols are able to achieve higher process yield (percentage of theoretical), resulting in higher realized yield. This lowers feedstock cost and sensitivity. GEVO has achieved 94% process yield and 39% realized yield (theoretical yield is 41%). At 39% yield and corn priced at $6.50/bushel, feedstock cost, net of DDGS sales, is about $2.25 per gallon).
Compatible with Existing Infrastructure
There is a tradeoff, however, with short carbon chains. If the alcohol is too short, it will dissolve in water and become difficult to recover. Isobutanol is the shortest alcohol that does not fully dissolve in water. It will dissolve partially, but in a gasoline/water mix, it migrates to the gasoline. Ethanol migrates to the water and is lost. For this reason, as well as its corrosiveness, ethanol is incompatible with existing pipelines, refineries, and chemical plants, and requires its own storage tanks and rail cars for transportation. Ethanol can only be blended up to 10-15% in standard engines. Special handling adds to its cost, and transportation issues frequently keep it in regional markets where spot pricing can be volatile. The isobutanol molecule is small enough to offer high realized yield, yet large enough to avoid special handling and related costs. Access to wider markets and derivative products should support higher ASP and less regionalized pricing.
The theoretical yield is 41%
Less energy is consumed for shorter molecules
in a gasoline and water mix, IBOH migrates to the gasoline
Gevo
February 15, 2012 7
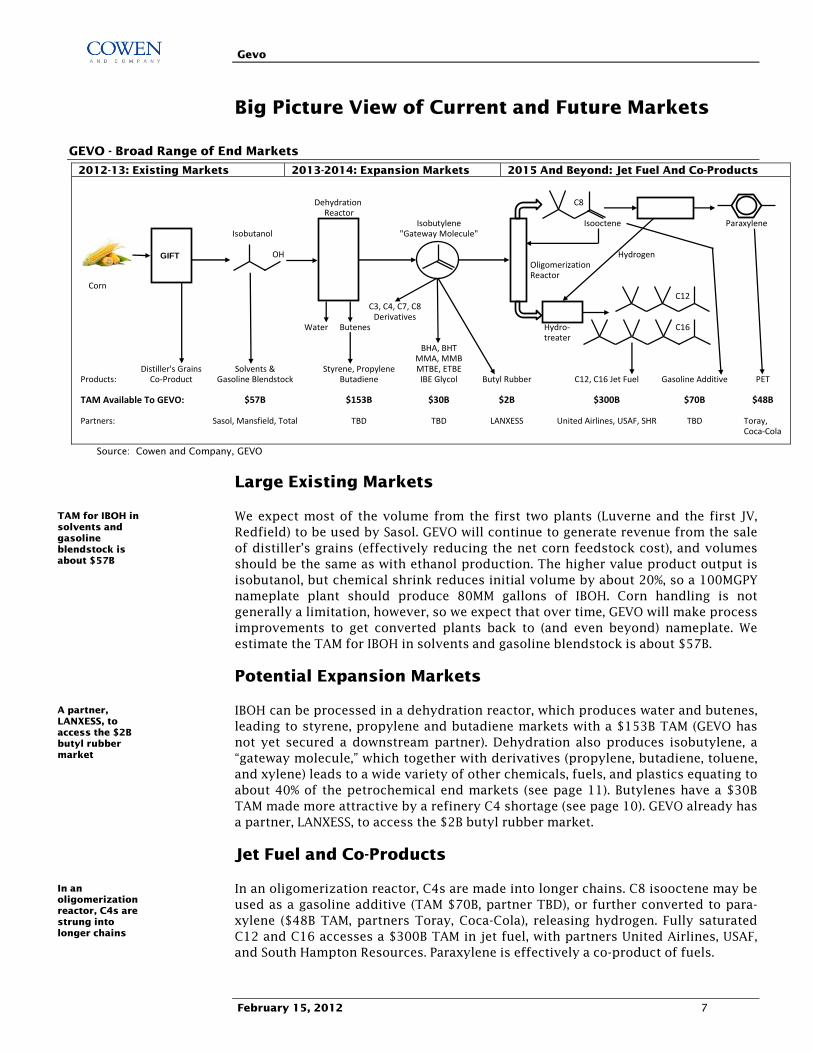
Big Picture View of Current and Future Markets
GEVO - Broad Range of End Markets
2012-13: Existing Markets 2013-2014: Expansion Markets 2015 And Beyond: Jet Fuel And Co-Products
IsoocteneIsobutanol
OH HydrogenOligomerizationReactor
Corn
Water Hydro-treater
Products:
TAM Available To GEVO:
Partners: Toray,Coca-Cola
C12, C16 Jet Fuel
$300B $70B
TBDUnited Airlines, USAF, SHR
IBE Glycol Butyl Rubber
$2B
TBD TBDSasol, Mansfield, Total
$57B $153B $30B
LANXESS
PET
$48B
Gasoline Additive
C16
C12
Paraxylene
Gasoline BlendstockDistiller's Grains
Co-Product
C3, C4, C7, C8Derivatives
MTBE, ETBEStyrene, PropyleneButadiene
BHA, BHT
Solvents &
Dehydration Reactor
Butenes
Isobutylene"Gateway Molecule"
MMA, MMB
C8
GIFT
Source: Cowen and Company, GEVO
Large Existing Markets
We expect most of the volume from the first two plants (Luverne and the first JV, Redfield) to be used by Sasol. GEVO will continue to generate revenue from the sale of distiller’s grains (effectively reducing the net corn feedstock cost), and volumes should be the same as with ethanol production. The higher value product output is isobutanol, but chemical shrink reduces initial volume by about 20%, so a 100MGPY nameplate plant should produce 80MM gallons of IBOH. Corn handling is not generally a limitation, however, so we expect that over time, GEVO will make process improvements to get converted plants back to (and even beyond) nameplate. We estimate the TAM for IBOH in solvents and gasoline blendstock is about $57B.
Potential Expansion Markets
IBOH can be processed in a dehydration reactor, which produces water and butenes, leading to styrene, propylene and butadiene markets with a $153B TAM (GEVO has not yet secured a downstream partner). Dehydration also produces isobutylene, a “gateway molecule,” which together with derivatives (propylene, butadiene, toluene, and xylene) leads to a wide variety of other chemicals, fuels, and plastics equating to about 40% of the petrochemical end markets (see page 11). Butylenes have a $30B TAM made more attractive by a refinery C4 shortage (see page 10). GEVO already has a partner, LANXESS, to access the $2B butyl rubber market.
Jet Fuel and Co-Products
In an oligomerization reactor, C4s are made into longer chains. C8 isooctene may be used as a gasoline additive (TAM $70B, partner TBD), or further converted to para-xylene ($48B TAM, partners Toray, Coca-Cola), releasing hydrogen. Fully saturated C12 and C16 accesses a $300B TAM in jet fuel, with partners United Airlines, USAF, and South Hampton Resources. Paraxylene is effectively a co-product of fuels.
TAM for IBOH in solvents and gasoline blendstock is about $57B
A partner, LANXESS, to access the $2B butyl rubber market
In an oligomerization reactor, C4s are strung into longer chains
Gevo
February 15, 2012 8
Large Existing Markets
Traditional IBOH Applications Have a TAM of $5B
Isobutanol has not been a focus of petroleum refiners, largely because many of its potential uses are not economical at petroleum-sourced cost. Nonetheless, isobutanol has found multiple applications, primarily as an industrial solvent, but also for paint thinner, an additive to lube oil, de-icing compounds, and floor polishes, a feedstock for lacquers and inks, an extractant in the manufacture of organic compounds, a precursor for plasticizers, and a flavoring in the food industry. We estimate a market size of 1.2BGPY and an ASP of $4.25.
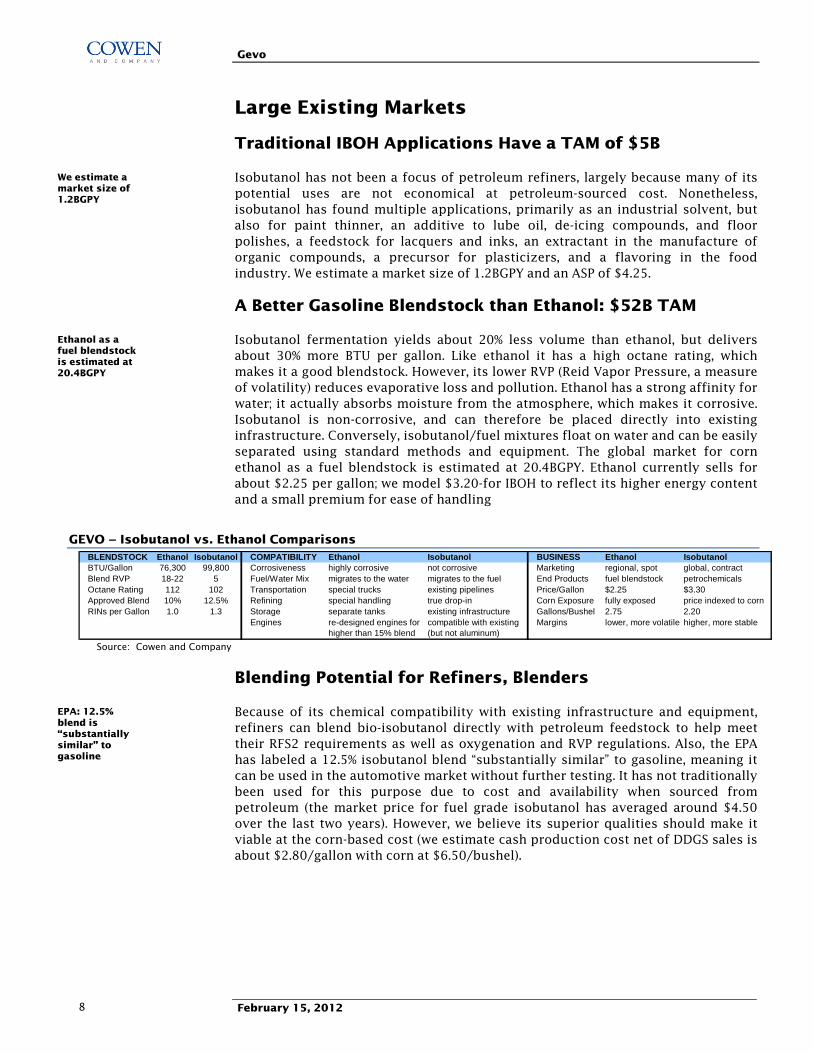
A Better Gasoline Blendstock than Ethanol: $52B TAM
Isobutanol fermentation yields about 20% less volume than ethanol, but delivers about 30% more BTU per gallon. Like ethanol it has a high octane rating, which makes it a good blendstock. However, its lower RVP (Reid Vapor Pressure, a measure of volatility) reduces evaporative loss and pollution. Ethanol has a strong affinity for water; it actually absorbs moisture from the atmosphere, which makes it corrosive. Isobutanol is non-corrosive, and can therefore be placed directly into existing infrastructure. Conversely, isobutanol/fuel mixtures float on water and can be easily separated using standard methods and equipment. The global market for corn ethanol as a fuel blendstock is estimated at 20.4BGPY. Ethanol currently sells for about $2.25 per gallon; we model $3.20-for IBOH to reflect its higher energy content and a small premium for ease of handling
GEVO – Isobutanol vs. Ethanol Comparisons BLENDSTOCK Ethanol Isobutanol COMPATIBILITY Ethanol Isobutanol BUSINESS Ethanol IsobutanolBTU/Gallon 76,300 99,800 Corrosiveness highly corrosive not corrosive Marketing regional, spot global, contractBlend RVP 18-22 5 Fuel/Water Mix migrates to the water migrates to the fuel End Products fuel blendstock petrochemicalsOctane Rating 112 102 Transportation special trucks existing pipelines Price/Gallon $2.25 $3.30Approved Blend 10% 12.5% Refining special handling true drop-in Corn Exposure fully exposed price indexed to cornRINs per Gallon 1.0 1.3 Storage separate tanks existing infrastructure Gallons/Bushel 2.75 2.20
Engines re-designed engines for compatible with existing Margins lower, more volatile higher, more stablehigher than 15% blend (but not aluminum)
Source: Cowen and Company
Blending Potential for Refiners, Blenders
Because of its chemical compatibility with existing infrastructure and equipment, refiners can blend bio-isobutanol directly with petroleum feedstock to help meet their RFS2 requirements as well as oxygenation and RVP regulations. Also, the EPA has labeled a 12.5% isobutanol blend “substantially similar” to gasoline, meaning it can be used in the automotive market without further testing. It has not traditionally been used for this purpose due to cost and availability when sourced from petroleum (the market price for fuel grade isobutanol has averaged around $4.50 over the last two years). However, we believe its superior qualities should make it viable at the corn-based cost (we estimate cash production cost net of DDGS sales is about $2.80/gallon with corn at $6.50/bushel).
We estimate a market size of 1.2BGPY
Ethanol as a fuel blendstock is estimated at 20.4BGPY
EPA: 12.5% blend is “substantially similar” to gasoline
Gevo
February 15, 2012 9
Value Added Opportunity for NGLs
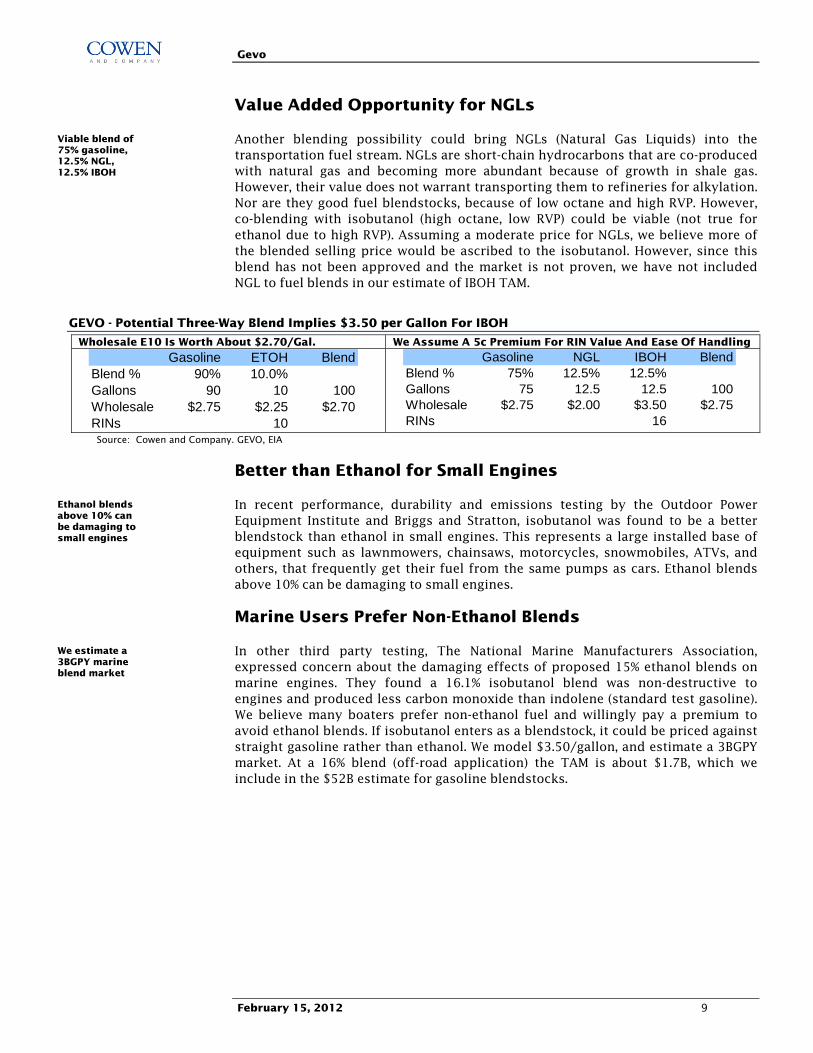
Another blending possibility could bring NGLs (Natural Gas Liquids) into the transportation fuel stream. NGLs are short-chain hydrocarbons that are co-produced with natural gas and becoming more abundant because of growth in shale gas. However, their value does not warrant transporting them to refineries for alkylation. Nor are they good fuel blendstocks, because of low octane and high RVP. However, co-blending with isobutanol (high octane, low RVP) could be viable (not true for ethanol due to high RVP). Assuming a moderate price for NGLs, we believe more of the blended selling price would be ascribed to the isobutanol. However, since this blend has not been approved and the market is not proven, we have not included NGL to fuel blends in our estimate of IBOH TAM.
GEVO - Potential Three-Way Blend Implies $3.50 per Gallon For IBOH
Wholesale E10 Is Worth About $2.70/Gal. We Assume A 5c Premium For RIN Value And Ease Of Handling
Gasoline ETOH BlendBlend % 90% 10.0%Gallons 90 10 100Wholesale $2.75 $2.25 $2.70RINs 10
Gasoline NGL IBOH BlendBlend % 75% 12.5% 12.5%Gallons 75 12.5 12.5 100Wholesale $2.75 $2.00 $3.50 $2.75RINs 16
Source: Cowen and Company. GEVO, EIA
Better than Ethanol for Small Engines
In recent performance, durability and emissions testing by the Outdoor Power Equipment Institute and Briggs and Stratton, isobutanol was found to be a better blendstock than ethanol in small engines. This represents a large installed base of equipment such as lawnmowers, chainsaws, motorcycles, snowmobiles, ATVs, and others, that frequently get their fuel from the same pumps as cars. Ethanol blends above 10% can be damaging to small engines.
Marine Users Prefer Non-Ethanol Blends
In other third party testing, The National Marine Manufacturers Association, expressed concern about the damaging effects of proposed 15% ethanol blends on marine engines. They found a 16.1% isobutanol blend was non-destructive to engines and produced less carbon monoxide than indolene (standard test gasoline). We believe many boaters prefer non-ethanol fuel and willingly pay a premium to avoid ethanol blends. If isobutanol enters as a blendstock, it could be priced against straight gasoline rather than ethanol. We model $3.50/gallon, and estimate a 3BGPY market. At a 16% blend (off-road application) the TAM is about $1.7B, which we include in the $52B estimate for gasoline blendstocks.
Viable blend of 75% gasoline, 12.5% NGL, 12.5% IBOH
Ethanol blends above 10% can be damaging to small engines
We estimate a 3BGPY marine blend market
Gevo
February 15, 2012 10
Potential Expansion Markets
IBOH is easily dehydrated into isobutylene (IBE), a gaseous gateway hydrocarbon that can be converted into a broad range of derivative chemicals, fuels, and plastics. These are diverse end markets, some of which are very large, but so far GEVO only has one downstream partner, LANXESS, for butyl rubber. In the commercialization strategy, GEVO plans to sell isobutanol to offtakers to perform the chemical conversion steps for their own end purposes. We model an ASP of $4.25/IBOH gallon.
GEVO – Dehydration of Isobutanol Into Isobutylene
Removal Of One Water Molecule Skeletal Diagram Of Isobutylene
CH3 H CH3 H H
CH3 C C OH CH3 C C O
H H H Hwaterisobutyleneisobutanol
Source: Cowen and Company
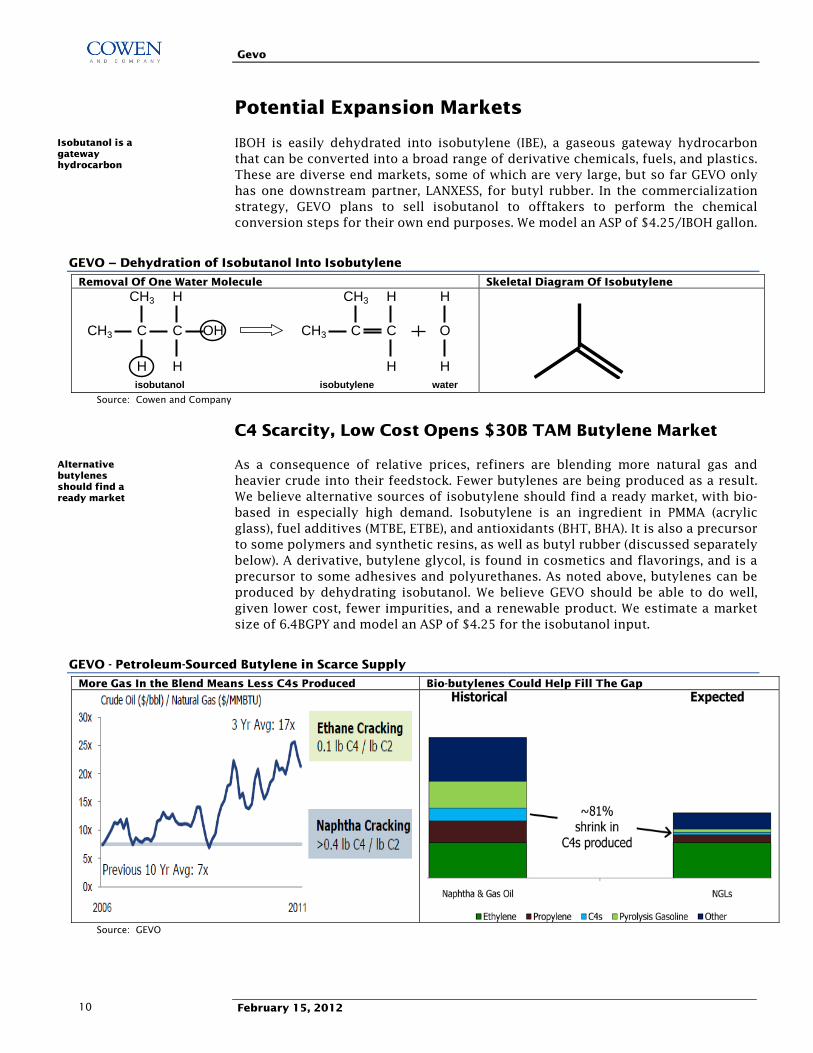
C4 Scarcity, Low Cost Opens $30B TAM Butylene Market
As a consequence of relative prices, refiners are blending more natural gas and heavier crude into their feedstock. Fewer butylenes are being produced as a result. We believe alternative sources of isobutylene should find a ready market, with bio-based in especially high demand. Isobutylene is an ingredient in PMMA (acrylic glass), fuel additives (MTBE, ETBE), and antioxidants (BHT, BHA). It is also a precursor to some polymers and synthetic resins, as well as butyl rubber (discussed separately below). A derivative, butylene glycol, is found in cosmetics and flavorings, and is a precursor to some adhesives and polyurethanes. As noted above, butylenes can be produced by dehydrating isobutanol. We believe GEVO should be able to do well, given lower cost, fewer impurities, and a renewable product. We estimate a market size of 6.4BGPY and model an ASP of $4.25 for the isobutanol input.
GEVO - Petroleum-Sourced Butylene in Scarce Supply
More Gas In the Blend Means Less C4s Produced Bio-butylenes Could Help Fill The Gap
Source: GEVO
Isobutanol is a gateway hydrocarbon
Alternative butylenes should find a ready market
Gevo
February 15, 2012 11
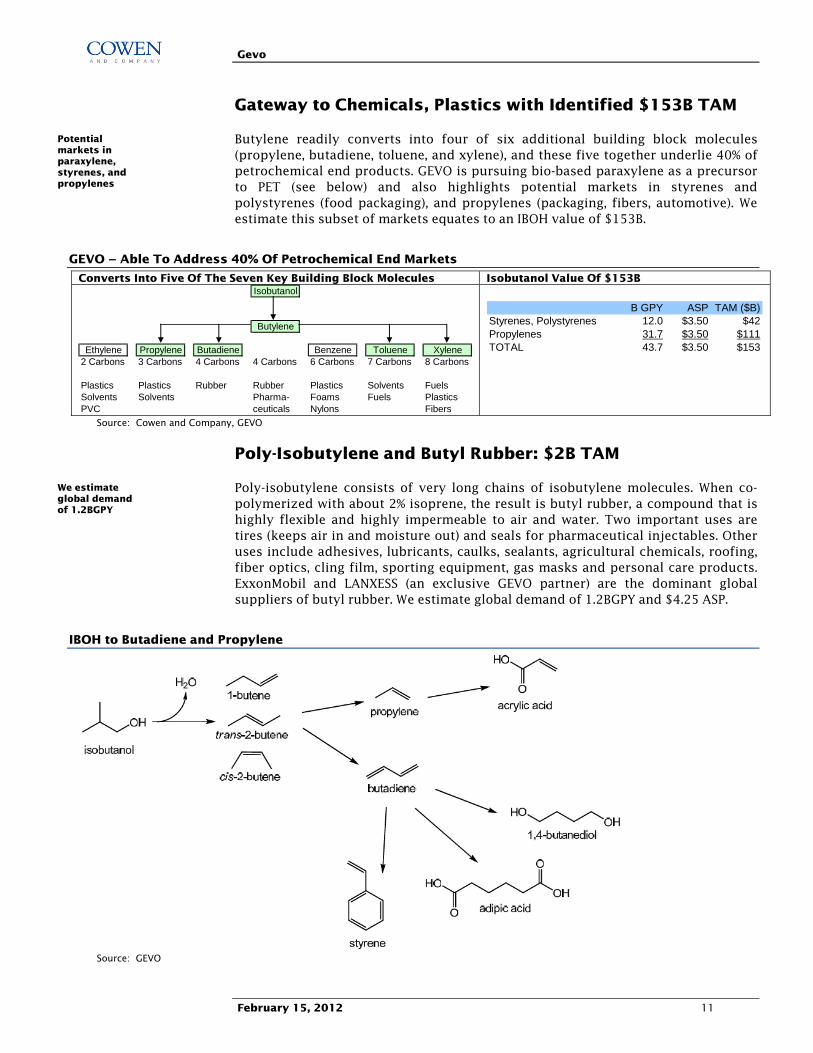
Gateway to Chemicals, Plastics with Identified $153B TAM
Butylene readily converts into four of six additional building block molecules (propylene, butadiene, toluene, and xylene), and these five together underlie 40% of petrochemical end products. GEVO is pursuing bio-based paraxylene as a precursor to PET (see below) and also highlights potential markets in styrenes and polystyrenes (food packaging), and propylenes (packaging, fibers, automotive). We estimate this subset of markets equates to an IBOH value of $153B.
GEVO – Able To Address 40% Of Petrochemical End Markets
Converts Into Five Of The Seven Key Building Block Molecules Isobutanol Value Of $153B Isobutanol
Butylene
Ethylene Propylene Butadiene Benzene Toluene Xylene2 Carbons 3 Carbons 4 Carbons 4 Carbons 6 Carbons 7 Carbons 8 Carbons
Plastics Plastics Rubber Rubber Plastics Solvents FuelsSolvents Solvents Pharma- Foams Fuels PlasticsPVC ceuticals Nylons Fibers
B GPY ASP TAM ($B)Styrenes, Polystyrenes 12.0 $3.50 $42Propylenes 31.7 $3.50 $111TOTAL 43.7 $3.50 $153
Source: Cowen and Company, GEVO
Poly-Isobutylene and Butyl Rubber: $2B TAM
Poly-isobutylene consists of very long chains of isobutylene molecules. When co-polymerized with about 2% isoprene, the result is butyl rubber, a compound that is highly flexible and highly impermeable to air and water. Two important uses are tires (keeps air in and moisture out) and seals for pharmaceutical injectables. Other uses include adhesives, lubricants, caulks, sealants, agricultural chemicals, roofing, fiber optics, cling film, sporting equipment, gas masks and personal care products. ExxonMobil and LANXESS (an exclusive GEVO partner) are the dominant global suppliers of butyl rubber. We estimate global demand of 1.2BGPY and $4.25 ASP.
IBOH to Butadiene and Propylene
Source: GEVO
Potential markets in paraxylene, styrenes, and propylenes
We estimate global demand of 1.2BGPY
Gevo
February 15, 2012 12
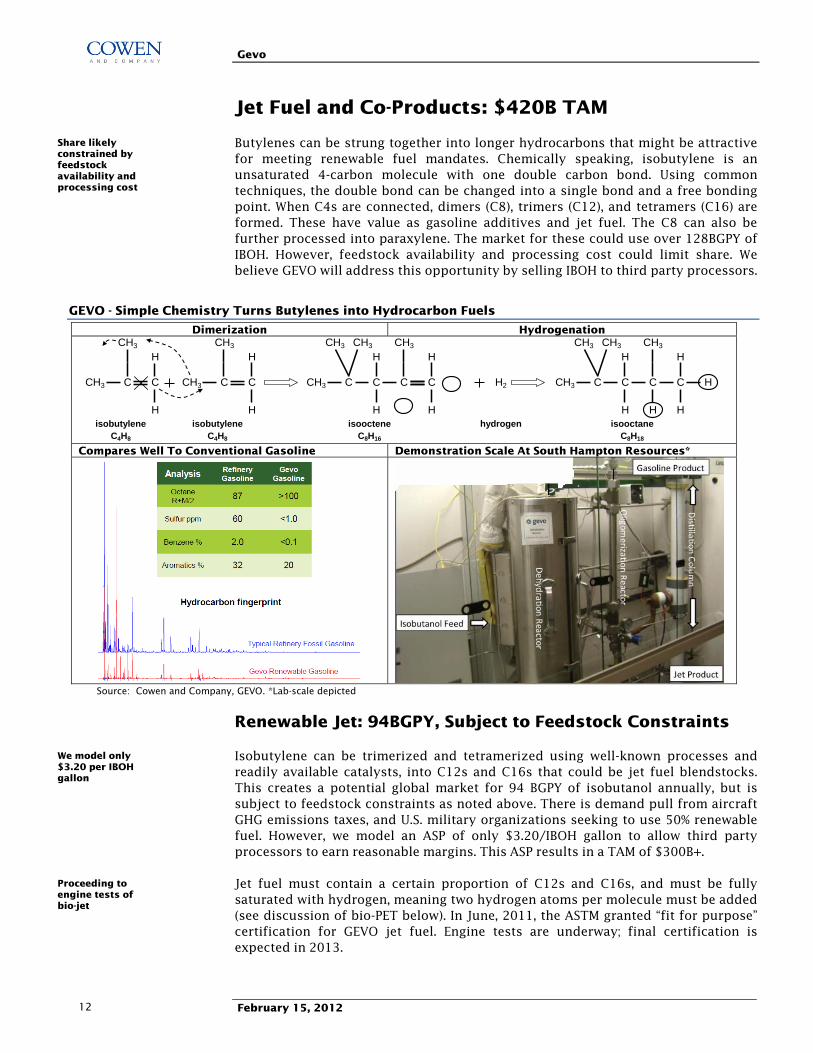
Jet Fuel and Co-Products: $420B TAM
Butylenes can be strung together into longer hydrocarbons that might be attractive for meeting renewable fuel mandates. Chemically speaking, isobutylene is an unsaturated 4-carbon molecule with one double carbon bond. Using common techniques, the double bond can be changed into a single bond and a free bonding point. When C4s are connected, dimers (C8), trimers (C12), and tetramers (C16) are formed. These have value as gasoline additives and jet fuel. The C8 can also be further processed into paraxylene. The market for these could use over 128BGPY of IBOH. However, feedstock availability and processing cost could limit share. We believe GEVO will address this opportunity by selling IBOH to third party processors.
GEVO - Simple Chemistry Turns Butylenes into Hydrocarbon Fuels
Dimerization Hydrogenation CH3 CH3 CH3 CH3 CH3 CH3 CH3 CH3
H H H H H H
CH3 C C CH3 C C CH3 C C C C H2 CH3 C C C C H
H H H H H H Hhydrogenisooctene
C8H16
isooctaneC8H18
isobutyleneC4H8
isobutyleneC4H8
Compares Well To Conventional Gasoline Demonstration Scale At South Hampton Resources*
Source: Cowen and Company, GEVO. *Lab-scale depicted
Renewable Jet: 94BGPY, Subject to Feedstock Constraints
Isobutylene can be trimerized and tetramerized using well-known processes and readily available catalysts, into C12s and C16s that could be jet fuel blendstocks. This creates a potential global market for 94 BGPY of isobutanol annually, but is subject to feedstock constraints as noted above. There is demand pull from aircraft GHG emissions taxes, and U.S. military organizations seeking to use 50% renewable fuel. However, we model an ASP of only $3.20/IBOH gallon to allow third party processors to earn reasonable margins. This ASP results in a TAM of $300B+.
Jet fuel must contain a certain proportion of C12s and C16s, and must be fully saturated with hydrogen, meaning two hydrogen atoms per molecule must be added (see discussion of bio-PET below). In June, 2011, the ASTM granted “fit for purpose” certification for GEVO jet fuel. Engine tests are underway; final certification is expected in 2013.
Share likely constrained by feedstock availability and processing cost
We model only $3.20 per IBOH gallon
Proceeding to engine tests of bio-jet
Gevo
February 15, 2012 13
Potential Share of 20BGPY Gasoline Additives Market
C8 dimers also result from the above reaction. They are currently being recycled into the reactor to make more C12s and C16s. However, this particular C8 isomer (trimethylpentene) may have value as a gasoline additive, replacing isooctane and other alkylates. These are put in gasoline to tweak RVP and octane ratings. The potential global market is about 20BGPY, which is in addition to the 20.4BGPY of ethanol added to gasoline globally as an oxygenate. Our estimated $3.50/IBOH gallon ASP suggests a $70B TAM.
Bio-PET for Renewable Containers: $48B TAM
With an additional conversion step, these C8s can be converted into paraxylene (PX), a precursor of terephthalic acid (TPA), one of two main ingredients in polyethylene terephthalate (PET). This is a well known polyester widely used for food and beverage containers and synthetic fibers. GEVO has successfully demonstrated PET made from corn based PX. In today’s “renewable” PET, only the other main ingredient (ethylene glycol) comes from renewable sources. The market for PET is estimated at 54MM MT per year, valued at $100B. We estimate the market for bio-based PX at $52B with an IBOH value of about $48B. Hurdles remain, however, including cost vs. petroleum-based PX and competing bioplastics in development, such as PEF.
Paraxylene A Co-Product of Jet Fuel
Importantly, this reaction throws off excess hydrogen. GEVO and South Hampton Resources are exploring co-production of PX with jet fuel by using the C8s to produce PX and capturing the excess hydrogen to fully saturate the fuel.
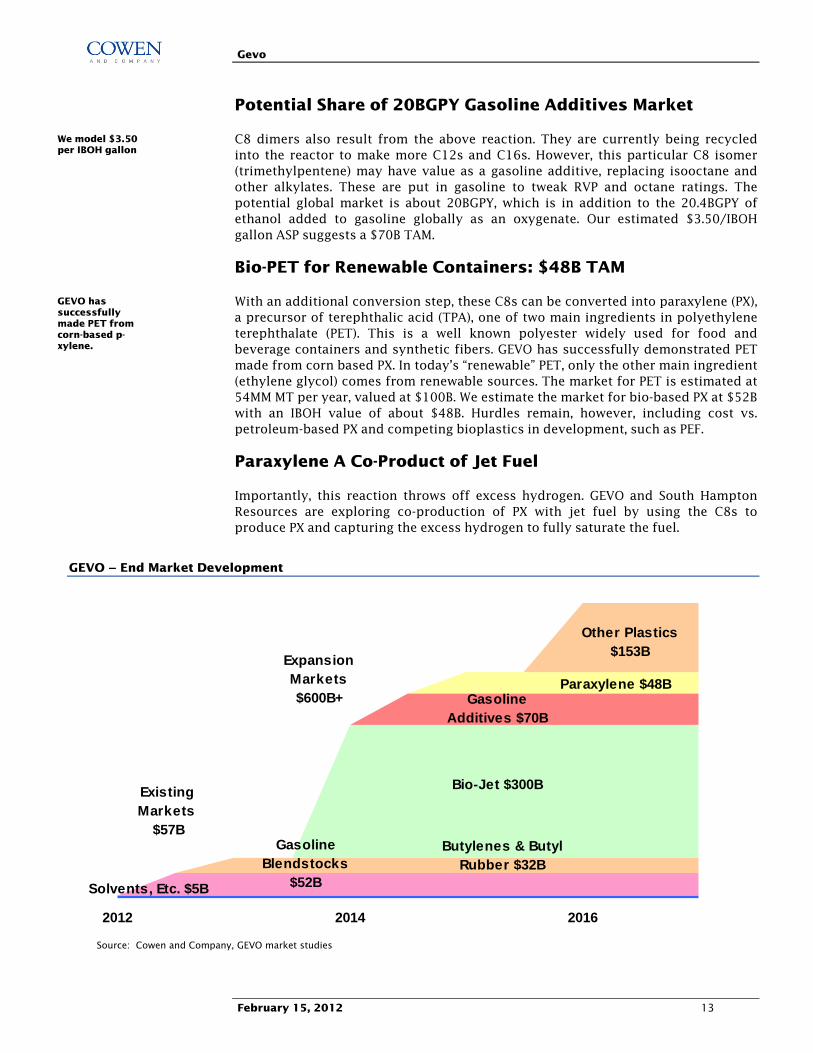
GEVO – End Market Development
Expansion Markets $600B+
Solvents, Etc. $5B
Gasoline Blendstocks
$52B
Butylenes & Butyl Rubber $32B
Bio-Jet $300B
Gasoline Additives $70B
Paraxylene $48B
Other Plastics $153B
2012 2014 2016
Existing Markets
$57B
Source: Cowen and Company, GEVO market studies
We model $3.50 per IBOH gallon
GEVO has successfully made PET from corn-based p-xylene.
Gevo
February 15, 2012 14
IBOH Could Benefit From Renewable Fuel Mandates
GIFT-sourced isobutanol should qualify as conventional biofuel, like ethanol. This means refiners can mix it into feedstock streams to help meet their blending requirements in that renewable fuel category. This represents a potential market of 15B gallons by 2015, which is included in the TAM discussed earlier. However it is unlikely to meet the more stringent definitions of other renewable fuel categories (advanced biofuel, advanced biodiesel, cellulosic biofuel) unless the greenhouse gas (GHG) emissions footprint can be substantially lowered from current levels or cellulosic sugars become available in volume and fermentable at reasonable cost.
Renewable Fuel Standards in Brief
Under the RFS2 rules, Renewable Identification Numbers (RINs) are assigned to every gallon of renewable fuel or blendstock produced. Refiners, blenders and importers are required to turn in a quantity of RINs annually, with the total equal to the volume mandate for that year. They can acquire RINs by producing renewable fuels, buying renewable blendstocks with RINs attached, or buying RINs in the secondary market. In any case, the RIN value accrues to the fuel producer in the form of a higher selling price. Importantly, this is not a government subsidy; it is paid by end users.
There are different RINs for different types of biofuels, depending on the level of (GHG) emission reduction. Corn based ethanol reduces GHG by about 25% and is classified as conventional biofuel. Its RIN value is already captured in the price. Due to higher BTU content, isobutanol is assigned 1.3 RINs per gallon.
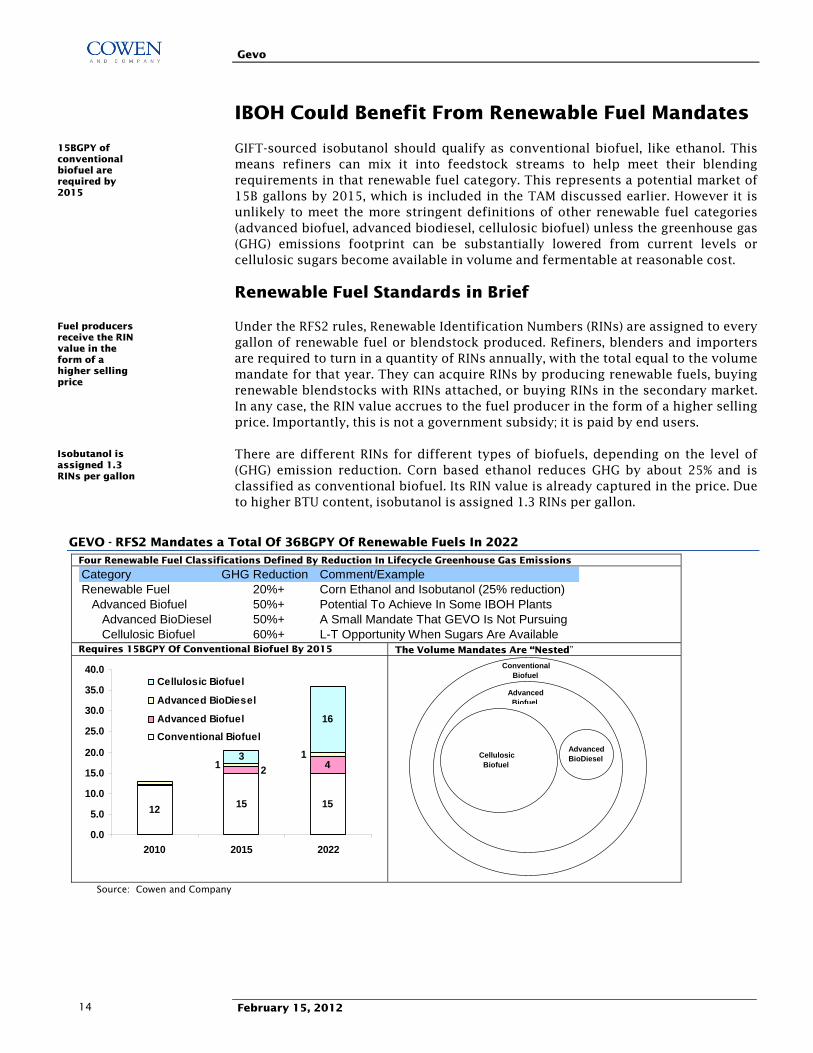
GEVO - RFS2 Mandates a Total Of 36BGPY Of Renewable Fuels In 2022 Four Renewable Fuel Classifications Defined By Reduction In Lifecycle Greenhouse Gas Emissions
Category GHG Reduction Comment/ExampleRenewable Fuel 20%+ Corn Ethanol and Isobutanol (25% reduction) Advanced Biofuel 50%+ Potential To Achieve In Some IBOH Plants Advanced BioDiesel 50%+ A Small Mandate That GEVO Is Not Pursuing Cellulosic Biofuel 60%+ L-T Opportunity When Sugars Are Available
Requires 15BGPY Of Conventional Biofuel By 2015 The Volume Mandates Are “Nested”
12 15 15
43
16
211
0.0
5.0
10.0
15.0
20.0
25.0
30.0
35.0
40.0
2010 2015 2022
Cellulosic Biofuel
Advanced BioDiesel
Advanced Biofuel
Conventional Biofuel
Conventional Biofuel
Advanced Biofuel
Cellulosic Biofuel
AdvancedBioDiesel
Source: Cowen and Company
15BGPY of conventional biofuel are required by 2015
Fuel producers receive the RIN value in the form of a higher selling price
Isobutanol is assigned 1.3 RINs per gallon

Gevo
February 15, 2012 15
GHG Reduction: 50% Target Not Yet Visible
If GHG emission reductions reach 50%, isobutanol could qualify as advanced biofuel, with A-RINs worth an additional 65c per gallon of ethanol equivalent (85c for isobutanol), based on secondary market prices in 2011. By law, cornstarch ethanol is not eligible for the upgrade; therefore plant owners have had no incentive to reduce emissions. The potential to utilize combined heat and power, reuse waste, access landfill methane, add solar power, and capture CO2 is an important factor as GEVO considers upstream partners. If additional GHG reductions become visible and cost effective, there could be upside to our model.
GEVO –Illustrative Lifecycle GHG Emissions Comparison, 50% Goal Not Yet In Hand
50%
Gasoline Ethanol Isobutanol IsobutanolWith Expanded
GreenFootprint
Cellulosic
Source: Cowen and Company, GEVO
GIFT Is Compatible with Cellulosic Sugars
Longer term, the economics of GIFT could be improved by converting cellulosic sugars into isobutanol. GEVO has accomplished this in the lab, is optimizing yeast strains under an exclusive license with Cargill, and has an LOI to license conversion to sugar technology from HCL Cleantech (when available). Interest is high; the USDA recently awarded GEVO a $5MM grant to develop cellulosic jet fuel. However, there is not yet a cost effective volume solution for extracting sugar from appropriate feedstocks. Cellulosic biofuels are awarded the higher valued A-RINs and also receive a cellulosic waiver credit (CWC). Together these were worth about $1.75 per ethanol equivalent gallon ($2.30 for isobutanol) in 2011. In our opinion, potential for this upside is at least a few years away.
European CO2 Tax Could Drive Bio-Jet Adoption
In Jan. 2012, the EU implemented a cap and trade scheme to limit airline CO2 emissions on flights to, from, or within the EU, which constitute about one-third of all global flights. Airlines receive allowances based on historical usage, which can be traded between those who over-emit and those who under-emit. However, emissions that are not covered by allowances are taxed at a rate of 100 euros per MT of CO2. At an exchange rate of $1.30/Euro, this works out to $1.24/gallon of jet fuel. Although some governments and airlines are fighting the tax, we believe demand for bio-jet is strong and it could sell for at least a $1.00 premium over standard jet fuel.
A-RINs could add 85c per gallon
Cellulosic fuels could carry $2.30 higher ASP per gallon
Bio-jet could sell for at least a $1.00/gallon premium
Gevo
February 15, 2012 16
Capital Light Strategy Targets Low Risk
Drawing upon a breadth of engineering and market development experience at Cargill, management designed a simple, risk minimizing plan for GEVO: using proven processes, make a known product with large existing markets and potential growth markets. Make it cheaper, with less capital, and price it low enough to open new markets. They chose isobutanol for its chemical properties and market potential, and started with biocatalysts whose fermenting abilities are well understood. They seek to pass along cost volatility and devised a capital light JV commercialization strategy.
Retrofit Approach Conserves Capital
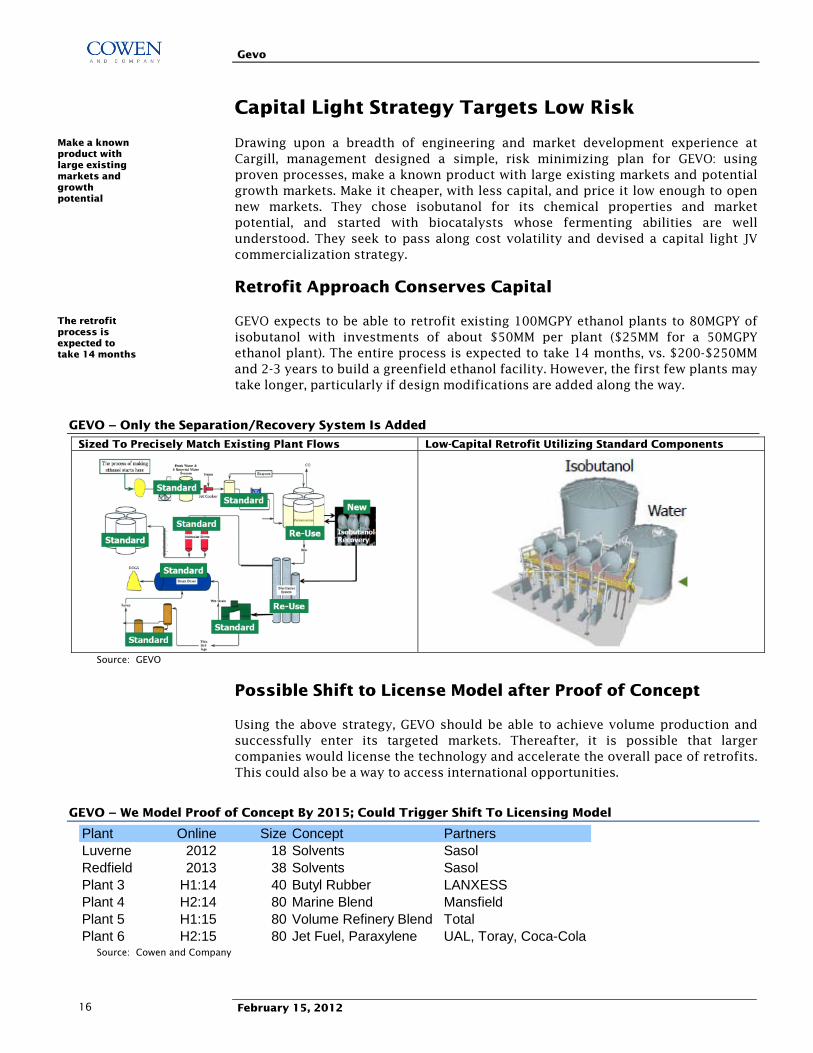
GEVO expects to be able to retrofit existing 100MGPY ethanol plants to 80MGPY of isobutanol with investments of about $50MM per plant ($25MM for a 50MGPY ethanol plant). The entire process is expected to take 14 months, vs. $200-$250MM and 2-3 years to build a greenfield ethanol facility. However, the first few plants may take longer, particularly if design modifications are added along the way.
GEVO – Only the Separation/Recovery System Is Added
Sized To Precisely Match Existing Plant Flows Low-Capital Retrofit Utilizing Standard Components
Source: GEVO
Possible Shift to License Model after Proof of Concept
Using the above strategy, GEVO should be able to achieve volume production and successfully enter its targeted markets. Thereafter, it is possible that larger companies would license the technology and accelerate the overall pace of retrofits. This could also be a way to access international opportunities.
GEVO – We Model Proof of Concept By 2015; Could Trigger Shift To Licensing Model
Plant Online Size Concept PartnersLuverne 2012 18 Solvents SasolRedfield 2013 38 Solvents SasolPlant 3 H1:14 40 Butyl Rubber LANXESSPlant 4 H2:14 80 Marine Blend MansfieldPlant 5 H1:15 80 Volume Refinery Blend TotalPlant 6 H2:15 80 Jet Fuel, Paraxylene UAL, Toray, Coca-Cola
Source: Cowen and Company
Make a known product with large existing markets and growth potential
The retrofit process is expected to take 14 months
Gevo
February 15, 2012 17
Capacity Increases Could Bring Plants Back To Nameplate
Initially, IBOH production is about 20% fewer gallons than ethanol nameplate, but GEVO believes it can eventually recover this capacity. Converting more sugar in the same 52 hour cycle could enable up to 25% more output while still using only the pre-existing equipment. For this reason, GEVO is over-sizing the separation capacity in its retrofits and continuing to improve the performance of the yeast. For a $4MM investment, an additional 10-12MGPY of capacity ($35MM+ of potential revenue, $7MM+ of cash gross profit per year) is being engineered into the Redfield plant.
JV Structures Should Benefit Both Parties
The strategy is to form JVs with existing ethanol plant owners, wherein the owner contributes the plant and GEVO builds the retrofit. For the plant owner, this creates product optionality and better visibility on prices. For GEVO, although absolute profits are lower, returns on capital are much higher, due to lower capex. Ethanol production and revenue generation would continue during construction; downtime for final cutover should be less than one month. GEVO would get license and marketing fees and the partner would own 60% of equity. However, GEVO would have control, and including the fees paid, should earn slightly over half the profits. Therefore, we expect the JVs to be consolidated.
GEVO - JV Model Enhances Returns (Illustrative Example)
CAPITAL J.V. Own OPERATIONS J.V. Own FINANCIAL J.V. OwnAcquire Plant $0.0 $140.0 MM Gallons 80.0 80.0 GEVO EBITDA $27.6 $55.2Retrofit $50.0 $50.0 ASP $3.50 $3.50 Depreciation $5.0 $19.0Capital $50.0 $190.0 Revenue $280.0 $280.0 Interest Expense $1.5 $5.7 % debt 50% 50% Cash COGS $222.4 $222.4 Pretax Income $21.1 $30.5 debt $25.0 $95.0 Plant Opex $2.4 $2.4 Taxes $7.4 $10.7 equity $25.0 $95.0 Plant EBITDA $55.2 $55.2 Net Income $13.7 $19.8
ROIC 27% 10%ROE 55% 21%
Source: Cowen and Company
Selection of Proven Yeast to Reduce Science, Scale-up Risks
In 2009, GEVO achieved its initial fermentation targets with a bio-engineered pathway in a strain of E. coli bacteria (92% of theoretical conversion, 38% realized yield, 48-72 hour fermentation cycle). In 2010, GEVO modified and optimized industrial yeast that had been developed for ethanol production and achieved 94% of theoretical conversion (39% realized yield) and 52 hour fermentation. Importantly, once in operation, the same feedstock will be fermented in the same tanks as before the retrofit. We believe GEVO has minimized three key risks faced by biomaterial companies: organism development, conversion efficiency, and scale up.
GEVO - Commercial Targets Already Achieved
Ethanol Target AchievedYield (% of theoretical max.) 92% 92% 94%Realized Yield 47% 38% 39%Concentration (grams/liter) 105 105 107Rate (grams/liter/hour) 2.0 2.0 2.0
Source: Cowen and Company, GEVO
Could enable up to 25% more output
GEVO would have control and earn slightly over half of the EBITDA
Minimizing key risks faced by other biomaterial companies
Gevo
February 15, 2012 18
Matching Existing Flows To Minimize Cost, Disruption
The retrofits are carefully engineered to match the fermentation capacity of the underlying plant, with modest overcapacity built into the separation units for future productivity improvements. This enables continued use of existing feedstock supply and co-product offtake contracts (important to local communities). In most cases, existing operators would be retained to run the plant. Electricity and natural gas usage are expected to be similar to pre-retrofit. Attaining target conversion metrics was a critical step in matching these flows.
Co-Product Sales Should Also Help Stabilize GM
GEVO converts only the carbohydrate portion of the corn (cornstarch) into isobutanol. Protein and other nutrients are separated and sold into the animal feed market as DDGS (dried distiller grains with solubles). GEVO has entered into a marketing agreement with Land O’Lakes Purina Feed for the DDGS produced at Luverne. Together, they are investigating ways to increase the nutritional content to make it more valuable (due to its high nutritional concentration, it is estimated that 1MT of standard DDGS can already replace 1.22MT of corn/soybean meal feed). It typically sells for 75-80% of the price of corn, and since about 32% of corn (by weight) is involved, almost 25% of the cost of corn is recaptured. This reduces exposure to a sometimes volatile component of cost.
GEVO – Corn Cost Is Partially Offset By Sales of Nutritional Co-Product
Corn DDGS Percent Net Corn PercentPounds Per Bushel 53 17 32% 36 68%Price/Pound $0.123 $0.092 75% $0.137 112%Price/Bushel $6.50 $1.56 24% $4.94 76%
Source: Cowen and Company, GEVO, USDA
Diverse Markets Spread Risk, Create Options
Initial market entry is expected to be in solvents with Sasol. LANXESS, a strategic investor has internal renewable butylene feedstock goals for production of butyl rubber. We believe Total, another strategic investor, is ready to move forward with drop-in blending at its Texas refinery. It also appears that gasoline marketers are interested in replacing ethanol with isobutanol, or blending isobutanol where ethanol blending has been unpopular. GEVO has a distribution deal with Mansfield. Airlines and military organizations face mandates for bio-based jet fuel. The U.S. military and others may be willing to contribute capital as part of a supply agreement (if the jet fuel proves viable). It seems that GEVO has the nice problem of sorting through these and other opportunities to balance high value current sales with development sales for even larger markets, which should enable them to maximize the return on shareholder capital.
Enables use of existing contracts, utilities, and staff
Almost 25% of the gross corn cost is recaptured, lowering cost and volatility
Balancing high value current sales with development sales for large future markets
Gevo
February 15, 2012 19
Attractive Value Proposition for Plant Owners
We estimate that under many conditions, half of the EBITDA from an isobutanol plant is more than all of the EBITDA from an ethanol plant. Margins have historically been higher and more stable for isobutanol; it has broader market potential and is not dependent on subsidies. Isobutanol opens up national and international markets as well as long term offtake contracts, while ethanol is typically sold in regional spot markets where prices can be volatile. Also, the selling price and RIN value are higher for isobutanol (partially offset by fewer gallons of production).
GEVO – Simplified Illustrative P&L Comparison and Sensitivity Analysis
base case corn+10% ASP-10% base case corn+10% ASP-10%MM Gallons 100.0 100.0 100.0 80.0 80.0 80.0ASP $2.40 $2.40 $2.25 $3.40 $3.40 $3.15Revenue ($MM) $240.0 $240.0 $225.0 $272.0 $272.0 $252.0Cash COGS ($MM) $222.4 $240.4 $222.4 $222.4 $240.4 $222.4Opex ($MM) $2.4 $2.4 $2.4 $2.4 $2.4 $2.4Plant EBITDA ($MM) $15.2 -$2.8 $0.2 $47.2 $29.2 $27.2 per gallon $0.15 -$0.03 $0.00 $0.59 $0.37 $0.34 margin 6% -1% 0% 17% 11% 11%
Owner's EBITDA Share $15.2 -$2.8 $0.2 $23.6 $14.6 $13.6 vs. base case -118% -99% -38% -42%
Ethanol Isobutanol
Source: Cowen and Company
Large Pool of Ethanol Plants Enables Selectivity
According to the Renewable Fuels Association, there are 209 ethanol plants in the United States, 155 of which are located in the upper Midwest. About two-thirds of these were built in 2007-2008, and with high leverage and reliance on subsidies, many are now struggling or distressed. At 10.2BGPY, these 155 plants comprise roughly 50% of the world’s corn ethanol capacity. With high corn prices, the demise of subsidies, and a strong value proposition for the GEVO retrofit, we believe there should be no shortage of ethanol plant owners who would be interested in converting to isobutanol production. Nevertheless, we expect GEVO to be selective in its choice of partners and judicious in its pace of expansion.
Selection Criteria Designed to Increase Chance of Success
Not all ethanol plants were created equal, and management has a clearly articulated set of criteria for selecting potential partners. Ideally, GEVO would like to retrofit ethanol plants having five key attributes: leading technology (ICM or upgraded Delta T), secure, low cost corn supply (price at least 20c below CBOT), a strong management team, strong finances (healthy balance sheet and top 1/3 in cost performance), and potential to lift GHG reduction to the 50% level to qualify for advanced biofuel A-RINs. The first partner, Redfield Energy, satisfies most of these criteria and we believe that a full pipeline of potential partners is building.
Margins have historically been higher and more stable for isobutanol
High corn prices, demise of ethanol subsidies, strong value proposition
Seeking to partner with top-tier performers

Gevo
February 15, 2012 20
High Achieving Redfield Energy Is the First JV Partner
Redfield has been averaging 26c/gallon of profit on ethanol over the last 24 months, is producing at 10-15c less cost per gallon than original projections, has low debt and $10MM of net cash. Despite being solidly profitable in a very difficult ethanol market, the Redfield team decided to join with GEVO to produce isobutanol. We believe this speaks to the credibility of the GIFT value proposition and the GEVO joint venture business model. We expect other high performing plants to sign up, especially after Luverne and Redfield become operational.
GEVO – No Shortage of Potential Upstream Partners
Exclusive Partner ICM Built 60% Of U.S. Ethanol Plants 155 Plants, 10.2BGPY Capacity In The Upper Midwest
Source: GEVO presentations
Alliance with Engineering Firm ICM a Key Advantage
A commercialization agreement in place through October 15, 2018 names ICM as the exclusive provider of certain engineering and construction services and names GEVO as its exclusive technology partner for production of butanols, pentanols and propanols from the fermentation of sugars. We believe this constitutes a significant barrier to entry, as ICM built about 60% of the ethanol plants in the U.S (70% of the capacity). Moreover, ICM plants are among the newest and most efficient, and familiarity with the somewhat standardized 50 and 100MGPY designs should simplify and lower the cost of repetitive retrofitting. We believe GEVO should be able to sustain a low cost position relative to others who might try to enter the sugar-to-isobutanol market.
We believe this speaks to the credibility of the GIFT value proposition
We believe the ICM alliance constitutes a significant barrier to entry
Gevo
February 15, 2012 21
GIFT: Proprietary Fermentation and Separation
The GIFT (GEVO Integrated Fermentation Technology) system consists of two main components: bio-catalysts for conversion of sugar into isobutanol, and a low temperature separation process for continuous removal of isobutanol from fermentation broth. Retrofit engineering could be considered a third component.
Bio-Engineering the Right Organism
Relative to algae and other microbes, yeast is a simpler, more robust and operable biocatalyst/fermentation organism. It has well-understood pathways, which eases the bioengineering work. GEVO started with yeasts that have been developed and improved over time for ethanol production. They are capable of converting any sugar, including cellulosic sugars, if and when they become commercially available.
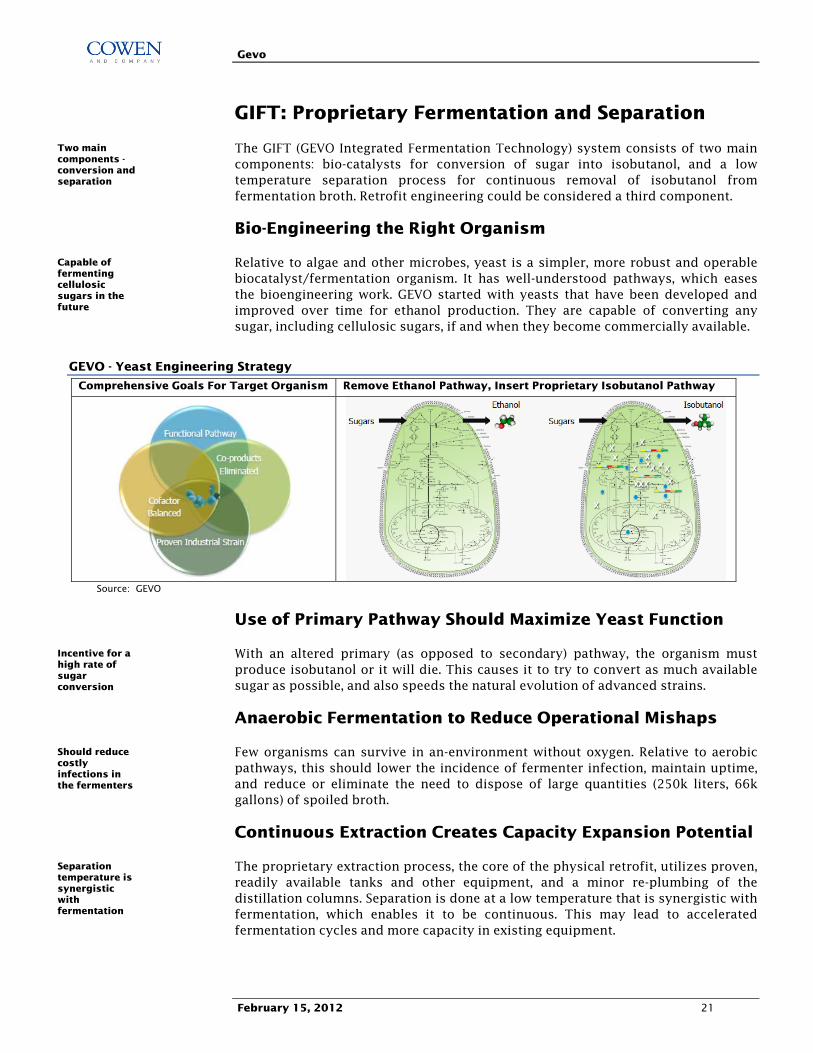
GEVO - Yeast Engineering Strategy
Comprehensive Goals For Target Organism Remove Ethanol Pathway, Insert Proprietary Isobutanol Pathway
Source: GEVO
Use of Primary Pathway Should Maximize Yeast Function
With an altered primary (as opposed to secondary) pathway, the organism must produce isobutanol or it will die. This causes it to try to convert as much available sugar as possible, and also speeds the natural evolution of advanced strains.
Anaerobic Fermentation to Reduce Operational Mishaps
Few organisms can survive in an-environment without oxygen. Relative to aerobic pathways, this should lower the incidence of fermenter infection, maintain uptime, and reduce or eliminate the need to dispose of large quantities (250k liters, 66k gallons) of spoiled broth.
Continuous Extraction Creates Capacity Expansion Potential
The proprietary extraction process, the core of the physical retrofit, utilizes proven, readily available tanks and other equipment, and a minor re-plumbing of the distillation columns. Separation is done at a low temperature that is synergistic with fermentation, which enables it to be continuous. This may lead to accelerated fermentation cycles and more capacity in existing equipment.
Two main components -conversion and separation
Capable of fermenting cellulosic sugars in the future
Incentive for a high rate of sugar conversion
Should reduce costly infections in the fermenters
Separation temperature is synergistic with fermentation

Gevo
February 15, 2012 22
Nearing Full Scale Up
The process has been scaled from two-liter bench reactors to a 1MGPY demonstration facility. The next critical step is the 18MGPY Luverne plant (250k liter tanks). The 38MGPY Redfield retrofit should represent near final scale up (larger facilities will simply have more fermentation tanks and separation equipment). As noted above, the yeast and process have already met and exceeded their performance targets.
IP Protected By Patents and Exclusive Licenses
GEVO is first and foremost a bio-engineering firm. As of April 2011, 267 patents (issued or applied for) covered synthetic biology, GIFT and other processes, chemistry, and products. The list has now grown to more than 300. We estimate about 25% involve exclusive licenses to use the IP of 3rd parties, including Cargill (biological materials and certain biocatalysts, including cellulosic yeasts), the University of California (fermentation pathways for bacterial biocatalysts), and Caltech (directed evolution work of Dr. Frances Arnold, a GEVO founder). However, some of them may relate to technology that GEVO no longer uses. GEVO also relies on trademarks, trade secrets and confidentiality agreements to protect its IP.
GEVO – Issued and Pending Patent Portfolio as-Of April, 2011
Synthetic Biology And Yeast 201GIFT, Other Processes 28Chemistry And Products 38
Source: GEVO
Patent Dispute with Butamax
In January and August 2011, Butamax Advanced Biofuels LLC (a joint venture between BP and DuPont) sued GEVO, claiming infringement of U.S. patent numbers 7,851,188 and 7,993,889, which cover certain microbes and related methods for producing IBOH. GEVO countersued to have the patents invalidated on the basis that the technology and processes were known, published in scientific journals, or invented by others (including GEVO). In October, the counterclaim on the “188” patent (bacteria and process) was denied, but in November, the “889” patent (yeast and process) was opened for re-examination and all claims were invalidated in a non-final action. It appears that this leaves GEVO free to operate GIFT using its proprietary yeast strains.
Recently Issued Patents Firm Up the IP Protection
Meanwhile, in September 2011, GEVO was granted U.S. patent numbers 8,017,375 and 8,017,376, covering bio-technology and a key enzyme step in the engineered pathway. And in January 2012, GEVO was granted U.S. patent number 8,101,808, covering its separation technology for 3-, 4-, 5- and 6-carbon molecules. Thus, both major components of GIFT are now protected. Moreover, GEVO is using these patents to sue Butamax, which cases are pending. Also in January, GEVO was issued a patent on a specific enzyme (NRK) in its 5-step pathway. This should be a deterrent to future challenges of the entire pathway.
The 250k liter fermenters at Luverne represent near final scale up
More than 300 patents issued or applied for
Butamax patent being re-examined
Both components of GIFT are now protected
Gevo
February 15, 2012 23
Significant Progress on Capacity Execution
The team managing the upstream development process previously led a venture capital firm that built and operated three 100MGPY ICM-designed ethanol plants, built and sold three others and evaluated a total of 35 sites. We believe their depth of experience and industry connections should enable them to devise and execute successful upstream strategies, and negotiate attractive deals.
ICM Demonstration Plant Used For New Yeasts, Feedstocks
Under the terms of a development agreement signed in 2008, GEVO uses a 1MGPY plant facility in St. Joseph, Missouri to bring new technologies up to scale and produces sample batches for potential downstream partners. The plant is owned by ICM and was retrofit by GEVO. The agreement, as amended, automatically renews annually unless terminated by GEVO upon 30 days' written notice. We expect the facility will be used from time to time to scale up new yeasts and feedstocks, including cellulosic sugars.
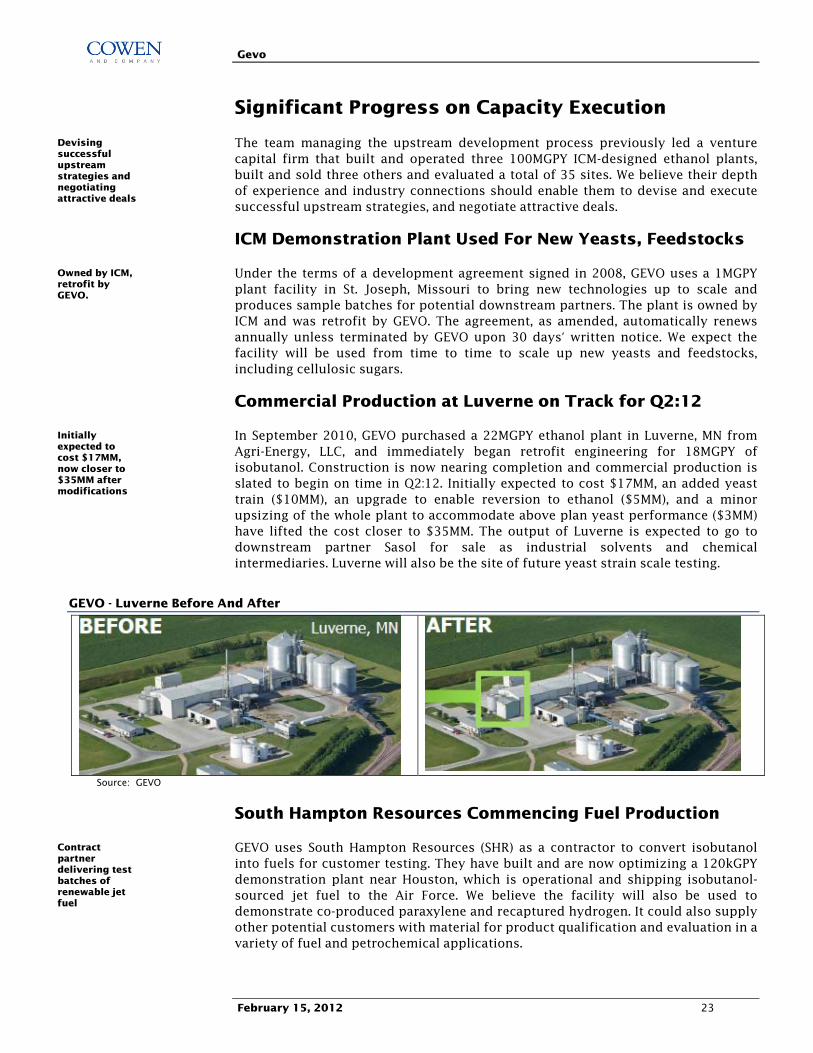
Commercial Production at Luverne on Track for Q2:12
In September 2010, GEVO purchased a 22MGPY ethanol plant in Luverne, MN from Agri-Energy, LLC, and immediately began retrofit engineering for 18MGPY of isobutanol. Construction is now nearing completion and commercial production is slated to begin on time in Q2:12. Initially expected to cost $17MM, an added yeast train ($10MM), an upgrade to enable reversion to ethanol ($5MM), and a minor upsizing of the whole plant to accommodate above plan yeast performance ($3MM) have lifted the cost closer to $35MM. The output of Luverne is expected to go to downstream partner Sasol for sale as industrial solvents and chemical intermediaries. Luverne will also be the site of future yeast strain scale testing.
GEVO - Luverne Before And After
Source: GEVO
South Hampton Resources Commencing Fuel Production
GEVO uses South Hampton Resources (SHR) as a contractor to convert isobutanol into fuels for customer testing. They have built and are now optimizing a 120kGPY demonstration plant near Houston, which is operational and shipping isobutanol-sourced jet fuel to the Air Force. We believe the facility will also be used to demonstrate co-produced paraxylene and recaptured hydrogen. It could also supply other potential customers with material for product qualification and evaluation in a variety of fuel and petrochemical applications.
Devising successful upstream strategies and negotiating attractive deals
Owned by ICM, retrofit by GEVO.
Initially expected to cost $17MM, now closer to $35MM after modifications
Contract partner delivering test batches of renewable jet fuel
Gevo
February 15, 2012 24
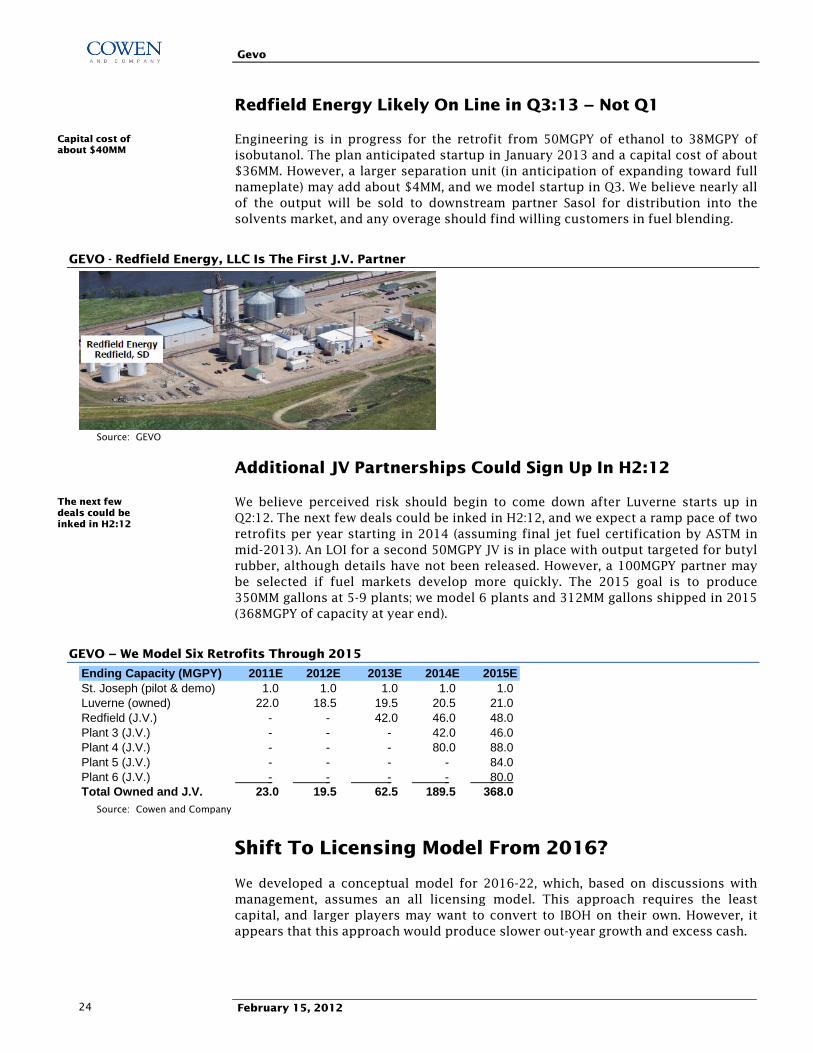
Redfield Energy Likely On Line in Q3:13 – Not Q1
Engineering is in progress for the retrofit from 50MGPY of ethanol to 38MGPY of isobutanol. The plan anticipated startup in January 2013 and a capital cost of about $36MM. However, a larger separation unit (in anticipation of expanding toward full nameplate) may add about $4MM, and we model startup in Q3. We believe nearly all of the output will be sold to downstream partner Sasol for distribution into the solvents market, and any overage should find willing customers in fuel blending.
GEVO - Redfield Energy, LLC Is The First J.V. Partner
Source: GEVO
Additional JV Partnerships Could Sign Up In H2:12
We believe perceived risk should begin to come down after Luverne starts up in Q2:12. The next few deals could be inked in H2:12, and we expect a ramp pace of two retrofits per year starting in 2014 (assuming final jet fuel certification by ASTM in mid-2013). An LOI for a second 50MGPY JV is in place with output targeted for butyl rubber, although details have not been released. However, a 100MGPY partner may be selected if fuel markets develop more quickly. The 2015 goal is to produce 350MM gallons at 5-9 plants; we model 6 plants and 312MM gallons shipped in 2015 (368MGPY of capacity at year end).
GEVO – We Model Six Retrofits Through 2015
Ending Capacity (MGPY) 2011E 2012E 2013E 2014E 2015ESt. Joseph (pilot & demo) 1.0 1.0 1.0 1.0 1.0 Luverne (owned) 22.0 18.5 19.5 20.5 21.0 Redfield (J.V.) - - 42.0 46.0 48.0 Plant 3 (J.V.) - - - 42.0 46.0 Plant 4 (J.V.) - - - 80.0 88.0 Plant 5 (J.V.) - - - - 84.0 Plant 6 (J.V.) - - - - 80.0 Total Owned and J.V. 23.0 19.5 62.5 189.5 368.0
Source: Cowen and Company
Shift To Licensing Model From 2016?
We developed a conceptual model for 2016-22, which, based on discussions with management, assumes an all licensing model. This approach requires the least capital, and larger players may want to convert to IBOH on their own. However, it appears that this approach would produce slower out-year growth and excess cash.
Capital cost of about $40MM
The next few deals could be inked in H2:12

Gevo
February 15, 2012 25
Offtake Agreements for First Few Plants
We anticipate that isobutanol will continue to command a higher price per gallon than ethanol because of its higher BTU and the higher value markets that it can serve. GEVO has been successful negotiating pricing that is indexed to corn, lowering price volatility for the customers (vs. petroleum volatility), and enabling lower risk long term supply agreements for the JV partners. We believe these characteristics, plus the benefits of infrastructure compatibility should provide advantages over typical ethanol marketing agreements.
Luverne and Redfield for Solvents Market with Sasol
A three-year international offtake agreement with Sasol Chemical Industries, Ltd. (South African based, global supplier of solvents and other industrial chemicals) is in place through July 2014. The partnership anticipates utilizing the entire output of the Luverne plant, 80% of Luverne and Redfield combined in 2013, and all of Luverne and Redfield in 2014. Under the terms, Sasol is a non-exclusive distributor of high-purity isobutanol in North and South America and is the exclusive distributor for high-purity isobutanol for solvent and chemical intermediate applications in the rest of the world. Sasol is bound to take or pay and GEVO is bound to supply or pay. The selling price is indexed monthly to CBOT corn, providing EBITDA of 80c+/gallon.
Plant 3 Could Go to Either Butyl Rubber or Fuels
An exclusive ten-year supply agreement (with an option to extend five years) is in place with LANXESS, Inc., one of the world’s top two suppliers of butyl rubber and related products. GEVO has the exclusive first right to supply bio-based isobutanol to LANXESS, and LANXESS has the exclusive first right to buy bio-based isobutanol from GEVO for purposes of conversion into butylenes and related products. Pricing is indexed to corn. Final terms are expected soon.
LANXESS is planning to build a facility to convert isobutanol into butylenes and proposes to purchase at least 20MGPY starting in 2013, which would take about half the output of a 40MGPY plant. However, it has a goal of acquiring 50% of its feedstock for the Sarnia Ontario plant from renewable sources. This would require 75,000 MT of isobutylene per year, which would consume about 28MM gallons of isobutanol. System-wide, LANXESS could use up to 5 times that amount, although feedstock availability could be a constraint. LANXESS owns about 9% of GEVO.
Conversely, if the demand is large enough and the economics are suitable, plant 3 could be an 80MGPY retrofit serving fuels markets. Initial entry would likely be in marine fuel with Mansfield, where blending with standard gasoline (rather than displacing ethanol) could enable more attractive pricing.
U. S. Military Testing IBOH-Jet Fuel
Under a contract with the Defense Logistics Agency (DLA) GEVO is supplying the U.S. Air Force with 7,000 gallons of renewable jet fuel for lab and engine testing. There is a potential 4,000 gallon follow on order for feasibility flight demonstrations, first with an A-10 aircraft and then an F/A 18. The USAF is “committed to positioning itself to integrate cost-competitive alternative aviation fuels up to half its domestic needs by 2016,” the Navy has a similar goal for 2020. The Air Force consumed $7.2B and $6.7B worth of jet fuel in 2010 and 2011 respectively.
Offering advantages vs. typical ethanol marketing agreements
Three-year offtake in place through July 2014
LANXESS terms are expected soon
Hopes to acquire 50% of its feedstock from renewable sources by 2015
7,000 gallons of renewable jet fuel with potential 4,000 gallon follow on.
Gevo
February 15, 2012 26
Expansion Markets Developing Nicely
South Hampton Resources to Make IBOH-Based Fuels
South Hampton Resources (SHR) is an independent specialty petrochemical manufacturer. Under a letter of intent, SHR is developing processes to dehydrate isobutanol into isobutylene, and convert at least a portion of it into kerosene for use as a renewable jet fuel blendstock. The LOI contemplates initial production of 2,000 barrels of kerosene per day (30.7MM gallons/year), requiring about 40MGPY of isobutanol annually, for a two to three year timeframe beginning in 2012. However, we believe this may be delayed until later retrofits are completed.
SHR is making sample batches of fuel for various testing programs, on a contract basis. Initially, this was being done in existing equipment, providing another data point about the compatibility of isobutanol with petrochemical infrastructure. The recently built 120,000 gallon per year demonstration unit is operational and shipping initial volumes to the USAF. The facility will likely be used to demonstrate co-producing paraxylene and re-using released hydrogen.
Mansfield Oil to Distribute Isobutanol and Blended Fuels
Under the terms of an existing agreement, C&N (a Mansfield subsidiary) is marketing the ethanol produced at Luverne prior to cutover to isobutanol, and paying GEVO the gross sales price less expenses and a marketing fee. The agreement dates back to April 1, 2009 and automatically renews for subsequent one-year terms unless either party terminates the agreement 60 days before the end of a term.
On Aug. 12, 2011, the relationship expanded with a separate agreement to distribute isobutanol-based fuels. As noted elsewhere, we believe Mansfield intends to initially target the marine market, perhaps as soon as 2013. The deal allows Mansfield to blend isobutanol for its own use, and to be an isobutanol distributor for a term of five years. In addition, under a three-year services agreement, Mansfield will provide logistics management, customer support, invoicing and billing services.
GEVO – Fuels A Critical Part Of The Business Model
Shipments (MGPY) 2011E 2012E 2013E 2014E 2015E Market Development 1.0 1.0 1.0 1.0 1.0 Sasol (solvents) - 12.0 30.4 64.1 67.0 Lanxess (butylenes) - - - 20.0 20.0 Mansfield (fuel distribution) - - 8.9 19.0 25.0 Total (refinery blending) - - - 35.1 86.0 United Airlines (jet fuel) - - - - 102.6 Toray (Paraxylene) - - - - 0.5 Isobutanol 1.0 13.0 40.3 139.2 312.2
Source: Cowen and Company, company reports
Will convert isobutanol into renewable jet fuel blendstock
Jet fuel production has begun at a 120,000 GPY demonstration unit
Currently markets Luverne ethanol
Relationship expanded to include IBOH-based fuel distribution
Gevo
February 15, 2012 27
Total Petrochemicals to Sell Second Generation Biofuels
A non-binding letter of intent with an affiliate of Total S.A. (a major integrated oil and gas company) anticipates a five year supply agreement. Blending would be at the Texas refinery and Mansfield would be the distributor. Final negotiations are still pending; volume is expected to be between 5 and 10MM gallons the first year, with a mutually agreed ramp schedule thereafter. Startup could be in 2013 with a ramp in 2014 and 2015. Total Petrochemicals is affiliated with Total Energy Ventures International, a GEVO strategic investor.
United Airlines Wants 460MM Gallons of Bio-Jet In 2015
A letter of intent sets forth initial terms of a renewable jet fuel supply agreement to serve the hub at Chicago O’Hare. The initial quantity anticipated is 10,000 barrels per day (153.3MM gallons/year), with a potential ramp to 30,000BPD (460MM GPY) in 2015 and 60,000BPD (920MM GPY) in 2020. Due to shrink during conversion, the 2015 target would require over 600MM gallons of isobutanol. Pricing is expected to be indexed to corn and natural gas.
Toray Industries of Japan to Buy Paraxylene
Toray Industries is a leader in the development of fibers, plastics and chemicals. The parties have agreed to negotiate a five year supply deal for isobutanol-sourced paraxylene, to be used as a precursor to renewable PET. GEVO would deliver IBOH to third party processors, potentially including SHR, who would perform the chemical conversion. Anticipated volumes are 1,000MT (requiring 0.5MM gallons of IBOH) in year one (2014 or 2015), which could grow to as much as 5,000MT (2.3MM gallons) by year five. For perspective, the global paraxylene market is estimated at 15BGPY.
Paraxylene Development Agreement with Coca Cola
Coca-Cola has a goal of using second generation PlantBottle ™ packaging, made from 100% plant-based materials, for all of its PET containers worldwide by 2020. Under terms of the agreement, GEVO will work to develop an integrated system to produce renewable paraxylene and take the technology from the lab to commercial scale. This is not an exclusive arrangement; Coca-Cola is pursuing parallel development for a different type of renewable plastic with at least one other partner. However, if successful, this could lead to another significant offtake opportunity for future plant retrofits, and could bolster the jet fuel opportunity by providing a co-product.
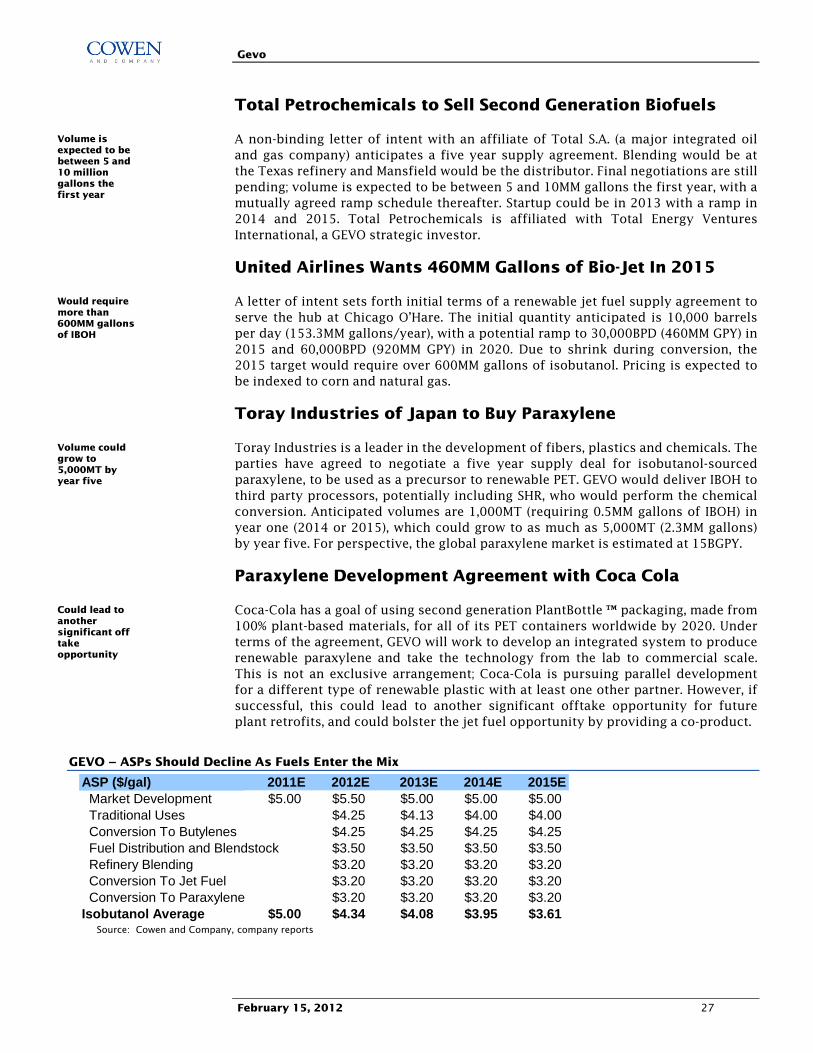
GEVO – ASPs Should Decline As Fuels Enter the Mix
ASP ($/gal) 2011E 2012E 2013E 2014E 2015E Market Development $5.00 $5.50 $5.00 $5.00 $5.00 Traditional Uses $4.25 $4.13 $4.00 $4.00 Conversion To Butylenes $4.25 $4.25 $4.25 $4.25 Fuel Distribution and Blendstock $3.50 $3.50 $3.50 $3.50 Refinery Blending $3.20 $3.20 $3.20 $3.20 Conversion To Jet Fuel $3.20 $3.20 $3.20 $3.20 Conversion To Paraxylene $3.20 $3.20 $3.20 $3.20Isobutanol Average $5.00 $4.34 $4.08 $3.95 $3.61
Source: Cowen and Company, company reports
Volume is expected to be between 5 and 10 million gallons the first year
Would require more than 600MM gallons of IBOH
Volume could grow to 5,000MT by year five
Could lead to another significant off take opportunity
Gevo
February 15, 2012 28
Company History, Management, Ownership
The Technology Is Ready
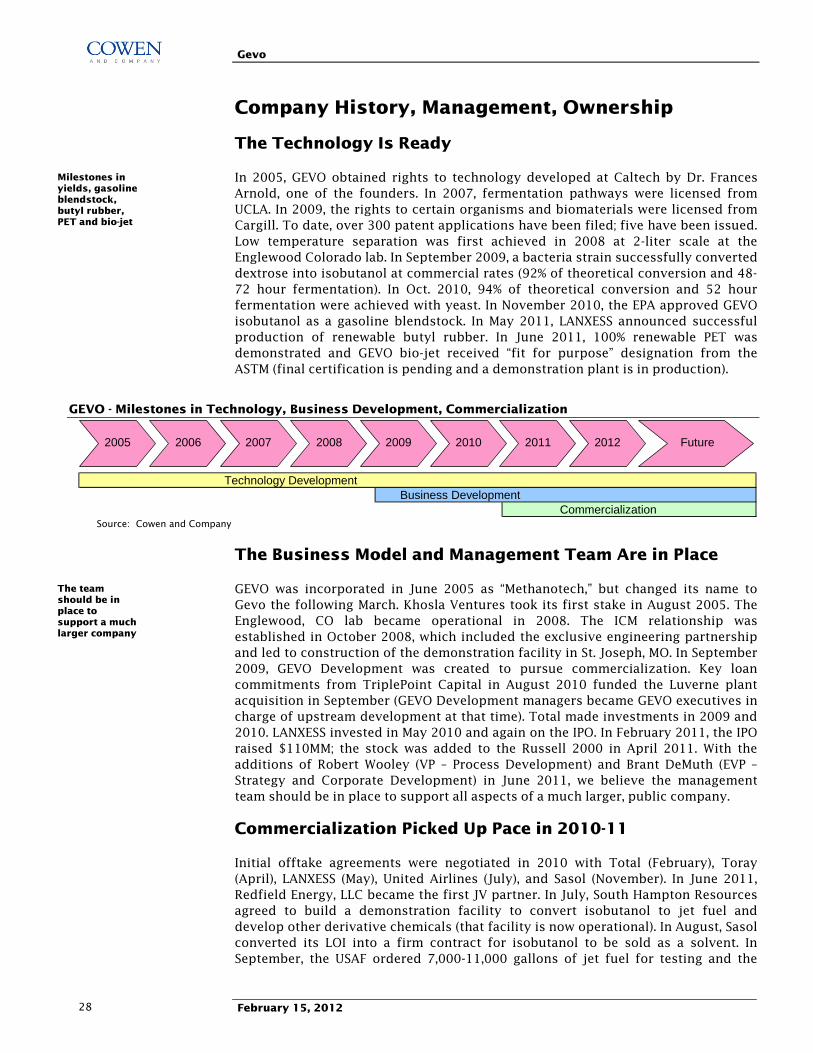
In 2005, GEVO obtained rights to technology developed at Caltech by Dr. Frances Arnold, one of the founders. In 2007, fermentation pathways were licensed from UCLA. In 2009, the rights to certain organisms and biomaterials were licensed from Cargill. To date, over 300 patent applications have been filed; five have been issued. Low temperature separation was first achieved in 2008 at 2-liter scale at the Englewood Colorado lab. In September 2009, a bacteria strain successfully converted dextrose into isobutanol at commercial rates (92% of theoretical conversion and 48-72 hour fermentation). In Oct. 2010, 94% of theoretical conversion and 52 hour fermentation were achieved with yeast. In November 2010, the EPA approved GEVO isobutanol as a gasoline blendstock. In May 2011, LANXESS announced successful production of renewable butyl rubber. In June 2011, 100% renewable PET was demonstrated and GEVO bio-jet received “fit for purpose” designation from the ASTM (final certification is pending and a demonstration plant is in production).
GEVO - Milestones in Technology, Business Development, Commercialization
Commercialization
Technology DevelopmentBusiness Development
2005
2006
2007
2008
2009
2010
2011
2012
Future
Source: Cowen and Company
The Business Model and Management Team Are in Place
GEVO was incorporated in June 2005 as “Methanotech,” but changed its name to Gevo the following March. Khosla Ventures took its first stake in August 2005. The Englewood, CO lab became operational in 2008. The ICM relationship was established in October 2008, which included the exclusive engineering partnership and led to construction of the demonstration facility in St. Joseph, MO. In September 2009, GEVO Development was created to pursue commercialization. Key loan commitments from TriplePoint Capital in August 2010 funded the Luverne plant acquisition in September (GEVO Development managers became GEVO executives in charge of upstream development at that time). Total made investments in 2009 and 2010. LANXESS invested in May 2010 and again on the IPO. In February 2011, the IPO raised $110MM; the stock was added to the Russell 2000 in April 2011. With the additions of Robert Wooley (VP – Process Development) and Brant DeMuth (EVP – Strategy and Corporate Development) in June 2011, we believe the management team should be in place to support all aspects of a much larger, public company.
Commercialization Picked Up Pace in 2010-11
Initial offtake agreements were negotiated in 2010 with Total (February), Toray (April), LANXESS (May), United Airlines (July), and Sasol (November). In June 2011, Redfield Energy, LLC became the first JV partner. In July, South Hampton Resources agreed to build a demonstration facility to convert isobutanol to jet fuel and develop other derivative chemicals (that facility is now operational). In August, Sasol converted its LOI into a firm contract for isobutanol to be sold as a solvent. In September, the USAF ordered 7,000-11,000 gallons of jet fuel for testing and the
Milestones in yields, gasoline blendstock, butyl rubber, PET and bio-jet
The team should be in place to support a much larger company
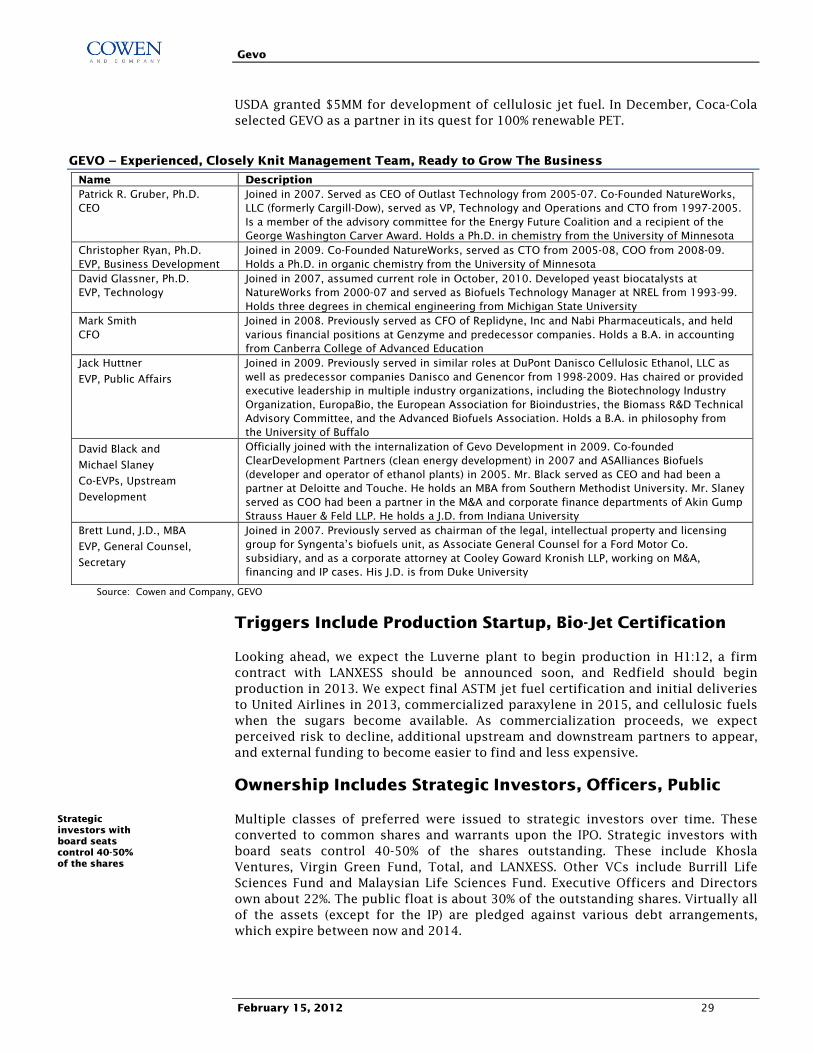
Gevo
February 15, 2012 29
USDA granted $5MM for development of cellulosic jet fuel. In December, Coca-Cola selected GEVO as a partner in its quest for 100% renewable PET.
GEVO – Experienced, Closely Knit Management Team, Ready to Grow The Business
Name Description Patrick R. Gruber, Ph.D. CEO
Joined in 2007. Served as CEO of Outlast Technology from 2005-07. Co-Founded NatureWorks, LLC (formerly Cargill-Dow), served as VP, Technology and Operations and CTO from 1997-2005. Is a member of the advisory committee for the Energy Future Coalition and a recipient of the George Washington Carver Award. Holds a Ph.D. in chemistry from the University of Minnesota
Christopher Ryan, Ph.D. EVP, Business Development
Joined in 2009. Co-Founded NatureWorks, served as CTO from 2005-08, COO from 2008-09. Holds a Ph.D. in organic chemistry from the University of Minnesota
David Glassner, Ph.D. EVP, Technology
Joined in 2007, assumed current role in October, 2010. Developed yeast biocatalysts at NatureWorks from 2000-07 and served as Biofuels Technology Manager at NREL from 1993-99. Holds three degrees in chemical engineering from Michigan State University
Mark Smith CFO
Joined in 2008. Previously served as CFO of Replidyne, Inc and Nabi Pharmaceuticals, and held various financial positions at Genzyme and predecessor companies. Holds a B.A. in accounting from Canberra College of Advanced Education
Jack Huttner
EVP, Public Affairs
Joined in 2009. Previously served in similar roles at DuPont Danisco Cellulosic Ethanol, LLC as well as predecessor companies Danisco and Genencor from 1998-2009. Has chaired or provided executive leadership in multiple industry organizations, including the Biotechnology Industry Organization, EuropaBio, the European Association for Bioindustries, the Biomass R&D Technical Advisory Committee, and the Advanced Biofuels Association. Holds a B.A. in philosophy from the University of Buffalo
David Black and
Michael Slaney
Co-EVPs, Upstream
Development
Officially joined with the internalization of Gevo Development in 2009. Co-founded ClearDevelopment Partners (clean energy development) in 2007 and ASAlliances Biofuels (developer and operator of ethanol plants) in 2005. Mr. Black served as CEO and had been a partner at Deloitte and Touche. He holds an MBA from Southern Methodist University. Mr. Slaney served as COO had been a partner in the M&A and corporate finance departments of Akin Gump Strauss Hauer & Feld LLP. He holds a J.D. from Indiana University
Brett Lund, J.D., MBA
EVP, General Counsel,
Secretary
Joined in 2007. Previously served as chairman of the legal, intellectual property and licensing group for Syngenta’s biofuels unit, as Associate General Counsel for a Ford Motor Co. subsidiary, and as a corporate attorney at Cooley Goward Kronish LLP, working on M&A, financing and IP cases. His J.D. is from Duke University
Source: Cowen and Company, GEVO
Triggers Include Production Startup, Bio-Jet Certification
Looking ahead, we expect the Luverne plant to begin production in H1:12, a firm contract with LANXESS should be announced soon, and Redfield should begin production in 2013. We expect final ASTM jet fuel certification and initial deliveries to United Airlines in 2013, commercialized paraxylene in 2015, and cellulosic fuels when the sugars become available. As commercialization proceeds, we expect perceived risk to decline, additional upstream and downstream partners to appear, and external funding to become easier to find and less expensive.
Ownership Includes Strategic Investors, Officers, Public
Multiple classes of preferred were issued to strategic investors over time. These converted to common shares and warrants upon the IPO. Strategic investors with board seats control 40-50% of the shares outstanding. These include Khosla Ventures, Virgin Green Fund, Total, and LANXESS. Other VCs include Burrill Life Sciences Fund and Malaysian Life Sciences Fund. Executive Officers and Directors own about 22%. The public float is about 30% of the outstanding shares. Virtually all of the assets (except for the IP) are pledged against various debt arrangements, which expire between now and 2014.
Strategic investors with board seats control 40-50% of the shares
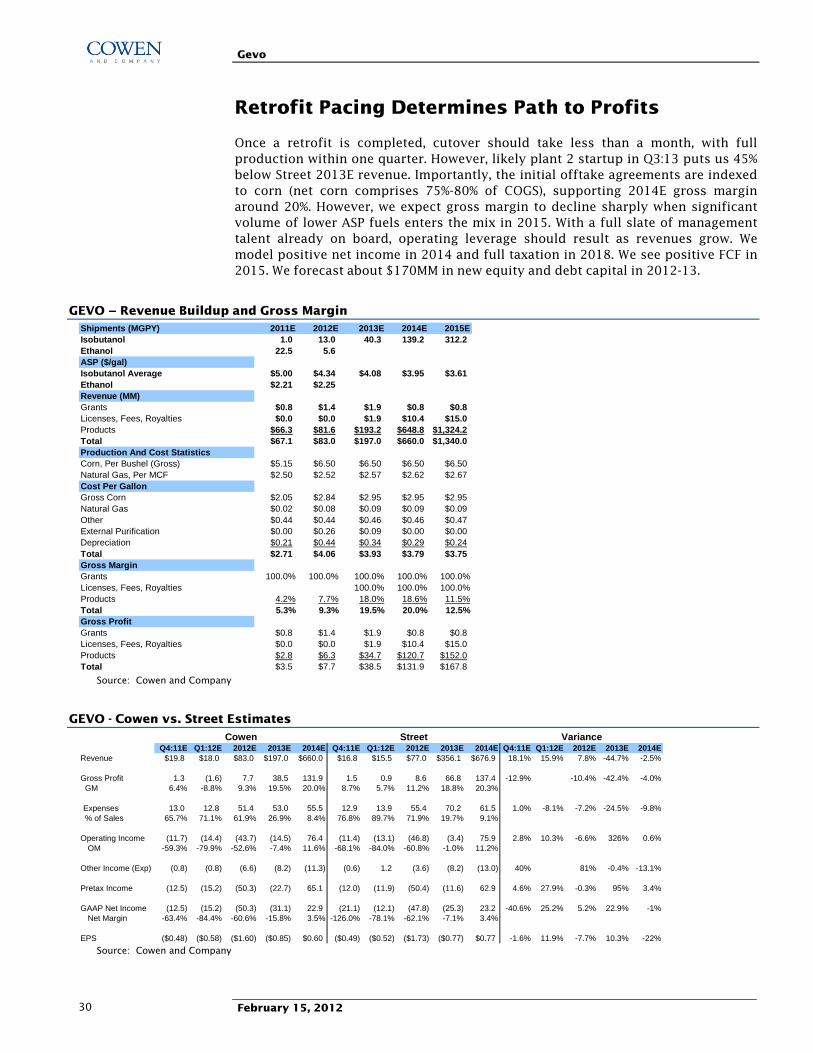
Gevo
February 15, 2012 30
Retrofit Pacing Determines Path to Profits
Once a retrofit is completed, cutover should take less than a month, with full production within one quarter. However, likely plant 2 startup in Q3:13 puts us 45% below Street 2013E revenue. Importantly, the initial offtake agreements are indexed to corn (net corn comprises 75%-80% of COGS), supporting 2014E gross margin around 20%. However, we expect gross margin to decline sharply when significant volume of lower ASP fuels enters the mix in 2015. With a full slate of management talent already on board, operating leverage should result as revenues grow. We model positive net income in 2014 and full taxation in 2018. We see positive FCF in 2015. We forecast about $170MM in new equity and debt capital in 2012-13.
GEVO – Revenue Buildup and Gross Margin
Shipments (MGPY) 2011E 2012E 2013E 2014E 2015EIsobutanol 1.0 13.0 40.3 139.2 312.2 Ethanol 22.5 5.6 ASP ($/gal)Isobutanol Average $5.00 $4.34 $4.08 $3.95 $3.61Ethanol $2.21 $2.25Revenue (MM)Grants $0.8 $1.4 $1.9 $0.8 $0.8Licenses, Fees, Royalties $0.0 $0.0 $1.9 $10.4 $15.0Products $66.3 $81.6 $193.2 $648.8 $1,324.2Total $67.1 $83.0 $197.0 $660.0 $1,340.0Production And Cost StatisticsCorn, Per Bushel (Gross) $5.15 $6.50 $6.50 $6.50 $6.50Natural Gas, Per MCF $2.50 $2.52 $2.57 $2.62 $2.67Cost Per GallonGross Corn $2.05 $2.84 $2.95 $2.95 $2.95Natural Gas $0.02 $0.08 $0.09 $0.09 $0.09Other $0.44 $0.44 $0.46 $0.46 $0.47External Purification $0.00 $0.26 $0.09 $0.00 $0.00Depreciation $0.21 $0.44 $0.34 $0.29 $0.24Total $2.71 $4.06 $3.93 $3.79 $3.75Gross MarginGrants 100.0% 100.0% 100.0% 100.0% 100.0%Licenses, Fees, Royalties 100.0% 100.0% 100.0%Products 4.2% 7.7% 18.0% 18.6% 11.5%Total 5.3% 9.3% 19.5% 20.0% 12.5%Gross ProfitGrants $0.8 $1.4 $1.9 $0.8 $0.8Licenses, Fees, Royalties $0.0 $0.0 $1.9 $10.4 $15.0Products $2.8 $6.3 $34.7 $120.7 $152.0Total $3.5 $7.7 $38.5 $131.9 $167.8
Source: Cowen and Company
GEVO - Cowen vs. Street Estimates
Q4:11E Q1:12E 2012E 2013E 2014E Q4:11E Q1:12E 2012E 2013E 2014E Q4:11E Q1:12E 2012E 2013E 2014ERevenue $19.8 $18.0 $83.0 $197.0 $660.0 $16.8 $15.5 $77.0 $356.1 $676.9 18.1% 15.9% 7.8% -44.7% -2.5%
Gross Profit 1.3 (1.6) 7.7 38.5 131.9 1.5 0.9 8.6 66.8 137.4 -12.9% -10.4% -42.4% -4.0% GM 6.4% -8.8% 9.3% 19.5% 20.0% 8.7% 5.7% 11.2% 18.8% 20.3%
Expenses 13.0 12.8 51.4 53.0 55.5 12.9 13.9 55.4 70.2 61.5 1.0% -8.1% -7.2% -24.5% -9.8% % of Sales 65.7% 71.1% 61.9% 26.9% 8.4% 76.8% 89.7% 71.9% 19.7% 9.1%
Operating Income (11.7) (14.4) (43.7) (14.5) 76.4 (11.4) (13.1) (46.8) (3.4) 75.9 2.8% 10.3% -6.6% 326% 0.6% OM -59.3% -79.9% -52.6% -7.4% 11.6% -68.1% -84.0% -60.8% -1.0% 11.2%
Other Income (Exp) (0.8) (0.8) (6.6) (8.2) (11.3) (0.6) 1.2 (3.6) (8.2) (13.0) 40% 81% -0.4% -13.1%
Pretax Income (12.5) (15.2) (50.3) (22.7) 65.1 (12.0) (11.9) (50.4) (11.6) 62.9 4.6% 27.9% -0.3% 95% 3.4%
GAAP Net Income (12.5) (15.2) (50.3) (31.1) 22.9 (21.1) (12.1) (47.8) (25.3) 23.2 -40.6% 25.2% 5.2% 22.9% -1% Net Margin -63.4% -84.4% -60.6% -15.8% 3.5% -126.0% -78.1% -62.1% -7.1% 3.4%
EPS ($0.48) ($0.58) ($1.60) ($0.85) $0.60 ($0.49) ($0.52) ($1.73) ($0.77) $0.77 -1.6% 11.9% -7.7% 10.3% -22%
Cowen Street Variance
Source: Cowen and Company

Gevo
February 15, 2012 31
GEVO – Growth Accelerates As Market Broadens; Shipments by Segment 2012-15E (MM Gallons)
Shipments (MM Gallons) 2012 2013 2014 2015Market Development 1 1 1 1Solvents 12 30 64 67
Fuel Blending 0 9 19 25Butylenes 0 0 20 20Refinery Blending 0 0 35 86Jet Fuel and Co-Products 0 0 0 113TOTAL 13 40 139 312
SolventsFuel Blending
Butylenes
Refinery Blending
Jet Fuel and Co-Products
0
175
350
2011 2012 2013 2014 2015
Source: Cowen and Company
GEVO – Pursuing Higher ASP Opportunities Earlier
Average ASP Drops, Especially When Fuels Enter The Mix We Model 64% Of 2015 Shipments at $3.20 Percent Of Sales 2012 2013 2014 2015 ASPMarket Development 7% 2% 1% 0% $5.00Solvents 93% 75% 46% 21% $4.25Fuel Blending 0% 22% 14% 8% $3.50Butylenes 0% 0% 14% 6% $4.25Refinery Blending 0% 0% 25% 28% $3.20Jet Fuel and Co-Products 0% 0% 0% 36% $3.20
Average ASP $4.34 $4.08 $3.95 $3.61Gross Margin 9.3% 19.5% 20.0% 12.5%
Solvents22%
Butylenes6%
Refinery Blending
28%
Jet Fuel and Co-
Products36% Fuel
Blending8%
Source: Cowen and Company
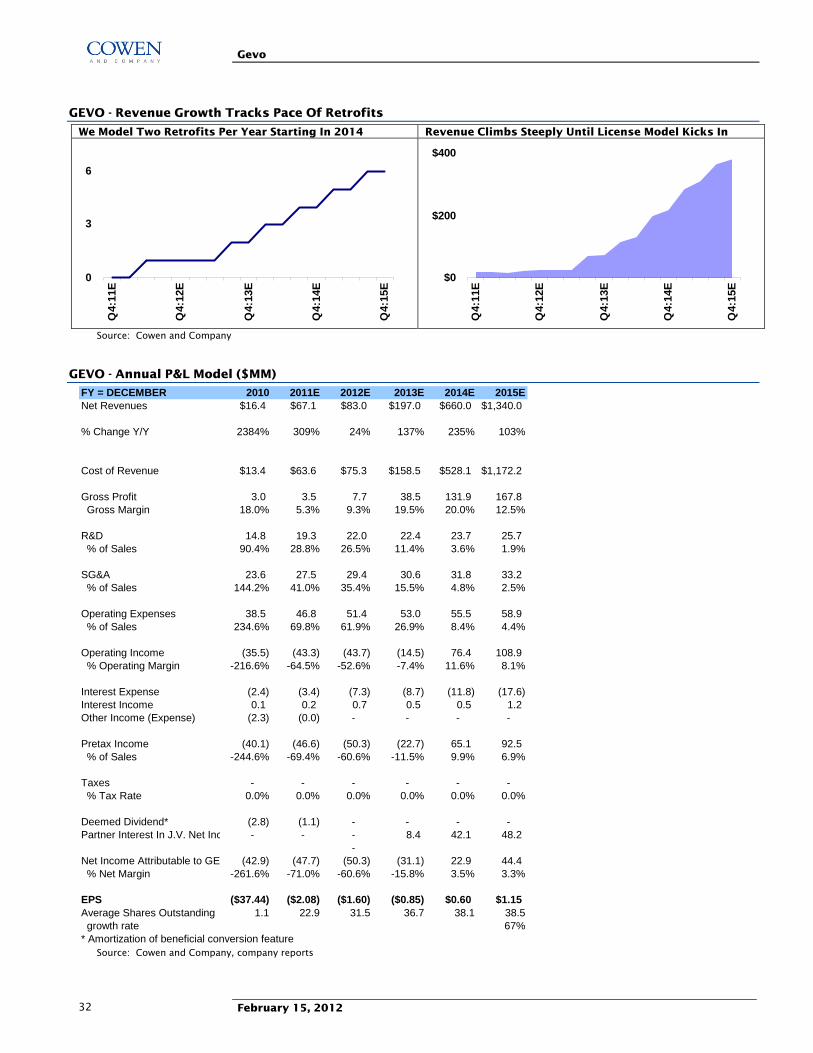
Gevo
February 15, 2012 32
GEVO - Revenue Growth Tracks Pace Of Retrofits
We Model Two Retrofits Per Year Starting In 2014 Revenue Climbs Steeply Until License Model Kicks In
0
3
6
Q4:
11E
Q4:
12E
Q4:
13E
Q4:
14E
Q4:
15E
$0
$200
$400
Q4:
11E
Q4:
12E
Q4:
13E
Q4:
14E
Q4:
15E
Source: Cowen and Company
GEVO - Annual P&L Model ($MM)
FY = DECEMBER 2010 2011E 2012E 2013E 2014E 2015ENet Revenues $16.4 $67.1 $83.0 $197.0 $660.0 $1,340.0
% Change Y/Y 2384% 309% 24% 137% 235% 103%
Cost of Revenue $13.4 $63.6 $75.3 $158.5 $528.1 $1,172.2
Gross Profit 3.0 3.5 7.7 38.5 131.9 167.8 Gross Margin 18.0% 5.3% 9.3% 19.5% 20.0% 12.5%
R&D 14.8 19.3 22.0 22.4 23.7 25.7 % of Sales 90.4% 28.8% 26.5% 11.4% 3.6% 1.9%
SG&A 23.6 27.5 29.4 30.6 31.8 33.2 % of Sales 144.2% 41.0% 35.4% 15.5% 4.8% 2.5%
Operating Expenses 38.5 46.8 51.4 53.0 55.5 58.9 % of Sales 234.6% 69.8% 61.9% 26.9% 8.4% 4.4%
Operating Income (35.5) (43.3) (43.7) (14.5) 76.4 108.9 % Operating Margin -216.6% -64.5% -52.6% -7.4% 11.6% 8.1%
Interest Expense (2.4) (3.4) (7.3) (8.7) (11.8) (17.6) Interest Income 0.1 0.2 0.7 0.5 0.5 1.2 Other Income (Expense) (2.3) (0.0) - - - -
Pretax Income (40.1) (46.6) (50.3) (22.7) 65.1 92.5 % of Sales -244.6% -69.4% -60.6% -11.5% 9.9% 6.9%
Taxes - - - - - - % Tax Rate 0.0% 0.0% 0.0% 0.0% 0.0% 0.0%
Deemed Dividend* (2.8) (1.1) - - - - Partner Interest In J.V. Net Inc - - - 8.4 42.1 48.2
- Net Income Attributable to GEV (42.9) (47.7) (50.3) (31.1) 22.9 44.4 % Net Margin -261.6% -71.0% -60.6% -15.8% 3.5% 3.3%
EPS ($37.44) ($2.08) ($1.60) ($0.85) $0.60 $1.15Average Shares Outstanding 1.1 22.9 31.5 36.7 38.1 38.5 growth rate 67%* Amortization of beneficial conversion feature
Source: Cowen and Company, company reports
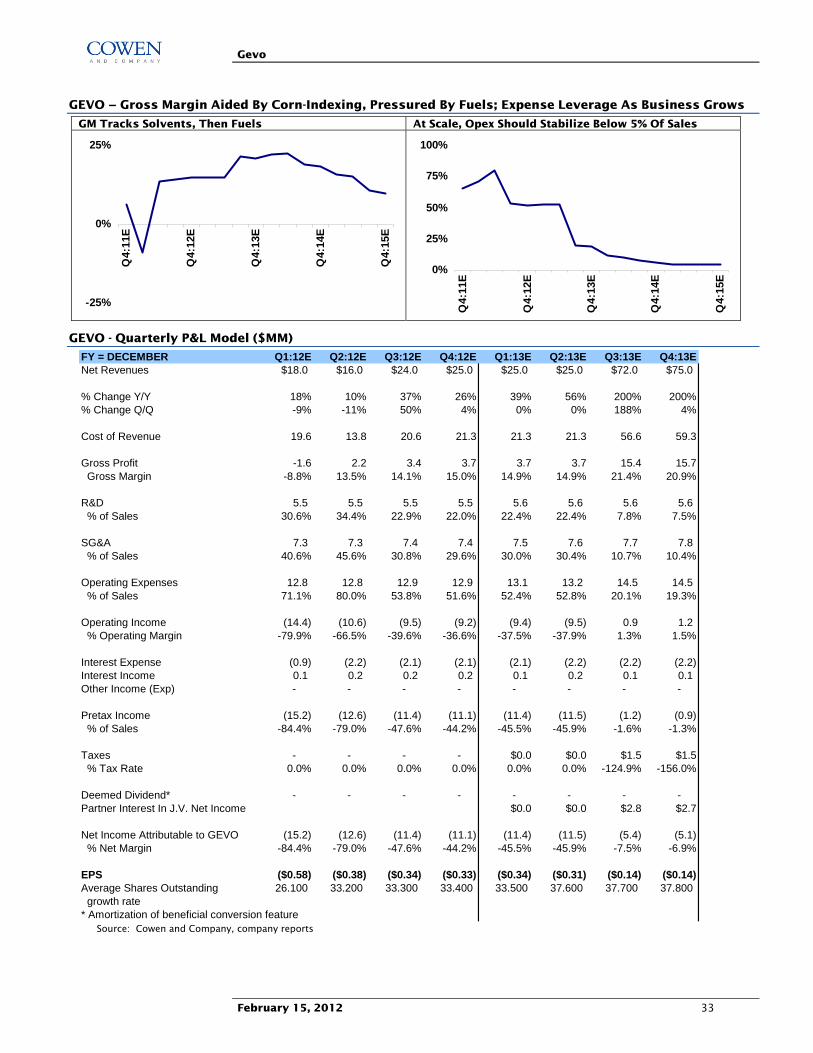
Gevo
February 15, 2012 33
GEVO – Gross Margin Aided By Corn-Indexing, Pressured By Fuels; Expense Leverage As Business Grows
GM Tracks Solvents, Then Fuels At Scale, Opex Should Stabilize Below 5% Of Sales
-25%
0%
25%
Q4:
11E
Q4:
12E
Q4:
13E
Q4:
14E
Q4:
15E
0%
25%
50%
75%
100%
Q4:
11E
Q4:
12E
Q4:
13E
Q4:
14E
Q4:
15E
GEVO - Quarterly P&L Model ($MM)
FY = DECEMBER Q1:12E Q2:12E Q3:12E Q4:12E Q1:13E Q2:13E Q3:13E Q4:13ENet Revenues $18.0 $16.0 $24.0 $25.0 $25.0 $25.0 $72.0 $75.0
% Change Y/Y 18% 10% 37% 26% 39% 56% 200% 200%% Change Q/Q -9% -11% 50% 4% 0% 0% 188% 4%
Cost of Revenue 19.6 13.8 20.6 21.3 21.3 21.3 56.6 59.3
Gross Profit -1.6 2.2 3.4 3.7 3.7 3.7 15.4 15.7 Gross Margin -8.8% 13.5% 14.1% 15.0% 14.9% 14.9% 21.4% 20.9%
R&D 5.5 5.5 5.5 5.5 5.6 5.6 5.6 5.6 % of Sales 30.6% 34.4% 22.9% 22.0% 22.4% 22.4% 7.8% 7.5%
SG&A 7.3 7.3 7.4 7.4 7.5 7.6 7.7 7.8 % of Sales 40.6% 45.6% 30.8% 29.6% 30.0% 30.4% 10.7% 10.4%
Operating Expenses 12.8 12.8 12.9 12.9 13.1 13.2 14.5 14.5 % of Sales 71.1% 80.0% 53.8% 51.6% 52.4% 52.8% 20.1% 19.3%
Operating Income (14.4) (10.6) (9.5) (9.2) (9.4) (9.5) 0.9 1.2 % Operating Margin -79.9% -66.5% -39.6% -36.6% -37.5% -37.9% 1.3% 1.5%
Interest Expense (0.9) (2.2) (2.1) (2.1) (2.1) (2.2) (2.2) (2.2) Interest Income 0.1 0.2 0.2 0.2 0.1 0.2 0.1 0.1 Other Income (Exp) - - - - - - - -
Pretax Income (15.2) (12.6) (11.4) (11.1) (11.4) (11.5) (1.2) (0.9) % of Sales -84.4% -79.0% -47.6% -44.2% -45.5% -45.9% -1.6% -1.3%
Taxes - - - - $0.0 $0.0 $1.5 $1.5 % Tax Rate 0.0% 0.0% 0.0% 0.0% 0.0% 0.0% -124.9% -156.0%
Deemed Dividend* - - - - - - - - Partner Interest In J.V. Net Income $0.0 $0.0 $2.8 $2.7
Net Income Attributable to GEVO (15.2) (12.6) (11.4) (11.1) (11.4) (11.5) (5.4) (5.1) % Net Margin -84.4% -79.0% -47.6% -44.2% -45.5% -45.9% -7.5% -6.9%
EPS ($0.58) ($0.38) ($0.34) ($0.33) ($0.34) ($0.31) ($0.14) ($0.14)Average Shares Outstanding 26.100 33.200 33.300 33.400 33.500 37.600 37.700 37.800 growth rate* Amortization of beneficial conversion feature
Source: Cowen and Company, company reports
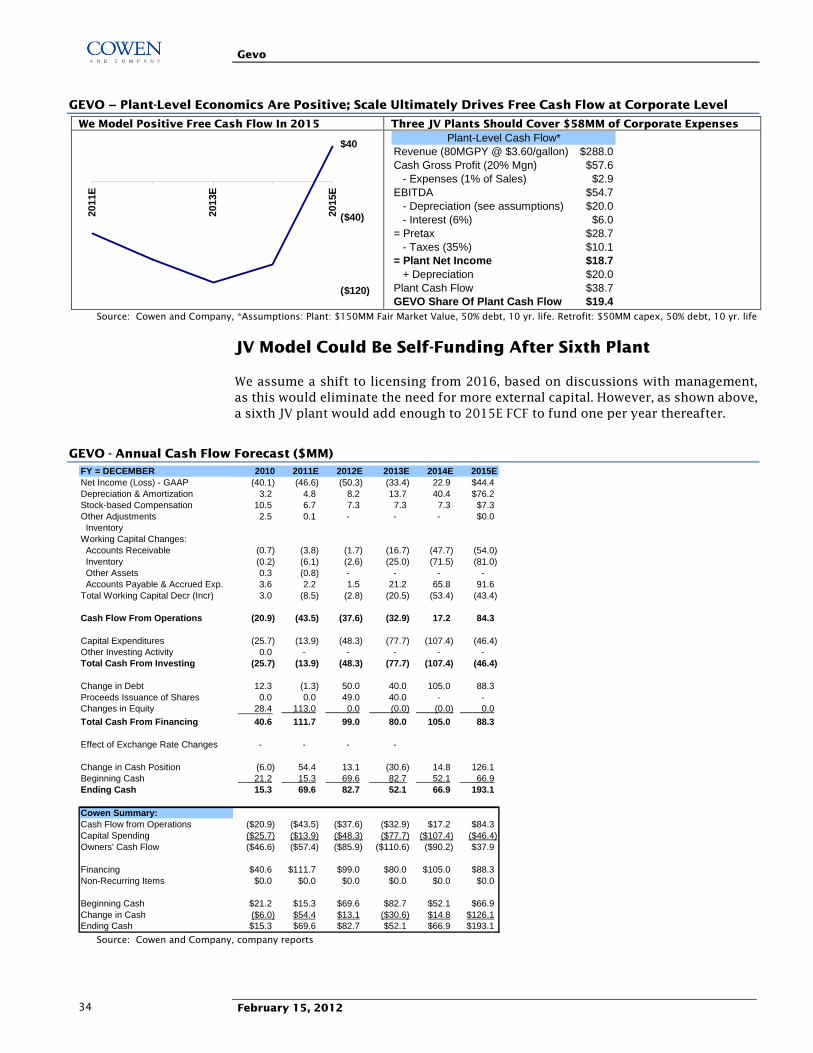
Gevo
February 15, 2012 34
GEVO – Plant-Level Economics Are Positive; Scale Ultimately Drives Free Cash Flow at Corporate Level
We Model Positive Free Cash Flow In 2015 Three JV Plants Should Cover $58MM of Corporate Expenses
($120)
($40)
$40
2011
E
2013
E
2015
E
Revenue (80MGPY @ $3.60/gallon) $288.0Cash Gross Profit (20% Mgn) $57.6 - Expenses (1% of Sales) $2.9EBITDA $54.7 - Depreciation (see assumptions) $20.0 - Interest (6%) $6.0= Pretax $28.7 - Taxes (35%) $10.1= Plant Net Income $18.7 + Depreciation $20.0Plant Cash Flow $38.7GEVO Share Of Plant Cash Flow $19.4
Plant-Level Cash Flow*
Source: Cowen and Company, *Assumptions: Plant: $150MM Fair Market Value, 50% debt, 10 yr. life. Retrofit: $50MM capex, 50% debt, 10 yr. life
JV Model Could Be Self-Funding After Sixth Plant
We assume a shift to licensing from 2016, based on discussions with management, as this would eliminate the need for more external capital. However, as shown above, a sixth JV plant would add enough to 2015E FCF to fund one per year thereafter.
GEVO - Annual Cash Flow Forecast ($MM) FY = DECEMBER 2010 2011E 2012E 2013E 2014E 2015ENet Income (Loss) - GAAP (40.1) (46.6) (50.3) (33.4) 22.9 $44.4Depreciation & Amortization 3.2 4.8 8.2 13.7 40.4 $76.2Stock-based Compensation 10.5 6.7 7.3 7.3 7.3 $7.3Other Adjustments 2.5 0.1 - - - $0.0 InventoryWorking Capital Changes: Accounts Receivable (0.7) (3.8) (1.7) (16.7) (47.7) (54.0) Inventory (0.2) (6.1) (2.6) (25.0) (71.5) (81.0) Other Assets 0.3 (0.8) - - - - Accounts Payable & Accrued Exp. 3.6 2.2 1.5 21.2 65.8 91.6 Total Working Capital Decr (Incr) 3.0 (8.5) (2.8) (20.5) (53.4) (43.4)
Cash Flow From Operations (20.9) (43.5) (37.6) (32.9) 17.2 84.3
Capital Expenditures (25.7) (13.9) (48.3) (77.7) (107.4) (46.4) Other Investing Activity 0.0 - - - - - Total Cash From Investing (25.7) (13.9) (48.3) (77.7) (107.4) (46.4)
Change in Debt 12.3 (1.3) 50.0 40.0 105.0 88.3 Proceeds Issuance of Shares 0.0 0.0 49.0 40.0 - - Changes in Equity 28.4 113.0 0.0 (0.0) (0.0) 0.0
Total Cash From Financing 40.6 111.7 99.0 80.0 105.0 88.3
Effect of Exchange Rate Changes - - - -
Change in Cash Position (6.0) 54.4 13.1 (30.6) 14.8 126.1 Beginning Cash 21.2 15.3 69.6 82.7 52.1 66.9 Ending Cash 15.3 69.6 82.7 52.1 66.9 193.1
Cowen Summary:Cash Flow from Operations ($20.9) ($43.5) ($37.6) ($32.9) $17.2 $84.3Capital Spending ($25.7) ($13.9) ($48.3) ($77.7) ($107.4) ($46.4)Owners' Cash Flow ($46.6) ($57.4) ($85.9) ($110.6) ($90.2) $37.9
Financing $40.6 $111.7 $99.0 $80.0 $105.0 $88.3Non-Recurring Items $0.0 $0.0 $0.0 $0.0 $0.0 $0.0
Beginning Cash $21.2 $15.3 $69.6 $82.7 $52.1 $66.9Change in Cash ($6.0) $54.4 $13.1 ($30.6) $14.8 $126.1Ending Cash $15.3 $69.6 $82.7 $52.1 $66.9 $193.1
Source: Cowen and Company, company reports

Gevo
February 15, 2012 35
GEVO - Annual Balance Sheet Forecast ($MM)
FY = DECEMBER 2010 2011E 2012E 2013E 2014E 2015EAssets:Cash & Cash Equivalents $15.3 $69.6 $82.7 $52.1 $66.9 $193.1Accounts Receivable 2.8 6.6 8.3 25.0 72.7 126.7Inventories 3.8 9.9 12.5 37.5 109.0 190.0Other Current Assets 2.0 2.7 2.7 2.7 2.7 2.7Current Assets $23.9 $88.8 $106.2 $117.3 $251.3 $512.4
PP&E, net 23.5 32.9 53.7 49.2 44.2 38.7PP&E of J.V.s 0.0 0.0 19.3 157.7 439.7 695.5Restricted Cash 0.1 0.0 0.0 0.0 0.0 0.0Other Assets 4.2 0.8 0.8 0.8 0.8 0.8TOTAL ASSETS $51.6 $122.5 $180.0 $325.0 $736.0 $1,247.4Liabilities:Current Portion of LT Debt 1.8 1.7 1.7 1.7 1.7 0.0Accounts Payable and Accrued Exp. 7.9 10.3 11.8 33.0 98.7 190.3Other Current Liabilities 2.4 0.0 0.0 0.0 0.0 0.0 Current Liabilities $12.1 $12.0 $13.6 $34.7 $100.5 $190.3
LT Debt 18.6 17.7 67.7 97.7 97.7 47.7LT Debt of Consolidated Partners 0.0 0.0 10.0 115.0 255.0Other LT Liabilities 0.9 0.2 0.2 0.2 0.2 0.2Total Liabilities $31.7 $29.9 $81.5 $142.6 $313.4 $493.2
Minority Interest 0.0 0.0 0.0 88.6 194.8 264.3GEVO Equity 0.0 0.0 0.0 93.7 227.7 489.9Stockholder's Equity: $19.8 $92.6 $98.6 $182.4 $422.6 $754.2
TOTAL LIABILITIES AND EQUITY $51.6 $122.5 $180.0 $325.0 $736.0 $1,247.4Turnover:Assets 0.3 0.5 0.5 0.6 0.9 1.1Non-Cash Assets 0.5 1.3 0.9 0.7 1.0 1.3Inventory Turns 4.4 6.8 6.6 5.3 6.1 7.1A/R DSO 63 36 37 46 40 35A/P Days Payable 215 59 57 76 68 59Leverage:LT Debt/Equity 94% 19% 69% 54% 23% 6%Total Debt/Capital 51% 17% 41% 35% 19% 6%Debt-Cash/Equity 26% -54% -14% 26% 8% -19%Assets/Equity 260% 132% 183% 178% 174% 165%Cash/Assets 30% 57% 46% 16% 9% 15%Returns:ROA -110% -55% -33% -12% 4% 4%Non-Cash ROA -207% -107% -67% -17% 5% 5%ROE -247% -85% -53% -22% 8% 8%Per ShareOperating Cash Flow ($18.24) ($1.90) ($1.20) ($0.90) $0.45 $2.19Depreciation $2.78 $0.21 $0.26 $0.37 $1.06 $1.98Cash $13.33 $3.05 $2.63 $1.42 $1.76 $5.02Working Capital $10.27 $3.36 $2.94 $2.25 $3.96 $8.38Book Value $17.30 $4.05 $3.13 $4.98 $11.11 $19.61Tangible Book Value $17.30 $4.05 $3.13 $4.98 $11.11 $19.61
Source: Cowen and Company, company reports

Gevo
February 15, 2012 36
GEVO – Capital Light Model Should Generate Reasonable Returns
2011E 2012E 2013E 2014E 2015EEBIT -43.3 -43.7 -14.5 76.4 108.9+ Implied interest from operating leases 0.0 0.0 0.0 0.0 0.0+ increase in LIFO reserve+ Increase in bad debt reserve+ Increase in net capitalized R&D+ Goodwill amortization & stock comp. 6.7 7.3 7.3 7.3 7.3 Adjusted Oper Profit Before Tax -$36.6 -$36.4 -$7.2 $83.6 $116.2
Income tax expense (from P&L) 0.0 0.0 0.0 0.0 0.0+/- Decr/Incr in deferred taxes 0.0 0.0 0.0 0.0 0.0 Statutory tax rate 35.0% 35.0% 35.0% 35.0% 35.0% Interest expense 3.4 7.3 8.7 11.8 17.6 Implied interest from operating leases 0.0 0.0 0.0 0.0 0.0 Other Income 0.0 0.0 0.0 0.0 0.0+ Tax benefit of interest expense 1.2 2.6 3.0 4.1 6.2+ Tax benefit of interest on oper leases 0.0 0.0 0.0 0.0 0.0- Taxes on other income 0.0 0.0 0.0 0.0 0.0 Cash Operating Taxes $1.2 $2.6 $3.0 $4.1 $6.2
NOPAT -$37.8 -$39.0 -$10.3 $79.5 $110.0
Book value of common equity 92.6 98.6 182.4 422.6 754.2+Preferred stock+Minority interest+Deferred taxes (L-A)+LIFO reserve+Accumulated goodwill amortization+Interest-bearing short-term debt 1.7 1.7 1.7 1.7 0.0+Long-term debt 17.7 67.7 97.7 97.7 47.7+Capitalized lease obligations+PV of operating leases 0.0 0.0 0.0 0.0 0.0- Excess cash & equivalent 0 0 0 0 0 Invested Capital 112.0 168.0 281.8 522.0 801.9
ROIC -34% -23% -4% 15% 14% Source: Cowen and Company, company reports

Gevo
February 15, 2012 37
Conceptual All Licensing Model 2016-22E
Revenue Growth Slows Dramatically
Assuming that all plant expansion after 2015 would be via licensed partners (vs. consolidated JVs), we project 20% and 5% revenue growth in 2016-17, due to a full year of production at plant 6 and productivity improvements at all of the JV plants. However, assuming retrofits continue at a pace of two per year and licensees pay a 10c per gallon royalty, top-line growth flattens out to just 1% per year in 2018-22. Even if the royalty rate were higher or licensing were to drive a much faster pace of conversions, say eight per year, revenue growth would likely remain in low single digits. Earnings outgrow revenue due to expense leverage (except for a dip in 2018 on the jump to a full tax rate), but the EPS CAGR is only 10% over the forecast period.
GEVO - Conceptual P&L Model, 2016-22E ($MM)
FY = DECEMBER 2016E 2017E 2018E 2019E 2020E 2021E 2022ENet Revenues $1,609 $1,685 $1,710 $1,730 $1,749 $1,768 $1,787
% Change Y/Y 20% 5% 1% 1% 1% 1% 1%
Cost of Revenue $1,443 $1,504 $1,515 $1,520 $1,525 $1,529 $1,534
Gross Profit 166.3 181.2 194.8 209.6 224.2 238.7 253.2 Gross Margin 10.3% 10.8% 11.4% 12.1% 12.8% 13.5% 14.2%
R&D 27.0 28.2 29.0 30.0 31.0 32.0 33.0 % of Sales 1.7% 1.7% 1.7% 1.7% 1.8% 1.8% 1.8%
SG&A 34.5 34.8 36.0 37.0 38.0 39.0 40.0 % of Sales 2.1% 2.1% 2.1% 2.1% 2.2% 2.2% 2.2%
Operating Expenses 61.5 63.0 65.0 67.0 69.0 71.0 73.0 % of Sales 3.8% 3.7% 3.8% 3.9% 3.9% 4.0% 4.1%
Operating Income 104.8 118.2 129.8 142.6 155.2 167.7 180.2 % Operating Margin 6.5% 7.0% 7.6% 8.2% 8.9% 9.5% 10.1%
Interest Expense (15.9) (15.2) (15.2) (15.2) (15.2) (15.2) (15.2) Interest Income 1.7 2.7 3.7 4.8 5.9 7.2 8.6 Other Income (Expense) - - - - - - -
Pretax Income 90.6 105.7 118.3 132.2 145.9 159.7 173.6 % of Sales 5.6% 6.3% 6.9% 7.6% 8.3% 9.0% 9.7%
Taxes - - 41.4 46.3 51.1 55.9 60.8 % Tax Rate 0.0% 0.0% 35.0% 35.0% 35.0% 35.0% 35.0%
Deemed Dividend* - - - - - - - Partner Interest In J.V. Net Income 39.9 37.9 35.6 33.6 31.5 29.5 27.4
Net Income Attributable to GEVO 50.7 67.7 41.3 52.4 63.3 74.3 85.4 % Net Margin 3.2% 4.0% 2.4% 3.0% 3.6% 4.2% 4.8%
EPS $1.30 $1.73 $1.04 $1.31 $1.56 $1.82 $2.07Average Shares Outstanding 38.9 39.3 39.7 40.1 40.5 40.9 41.3 growth rate 13% 32% -40% 25% 20% 16% 14%* Amortization of beneficial conversion feature
Source: Cowen and Company
EPS CAGR is 10% over the forecast period
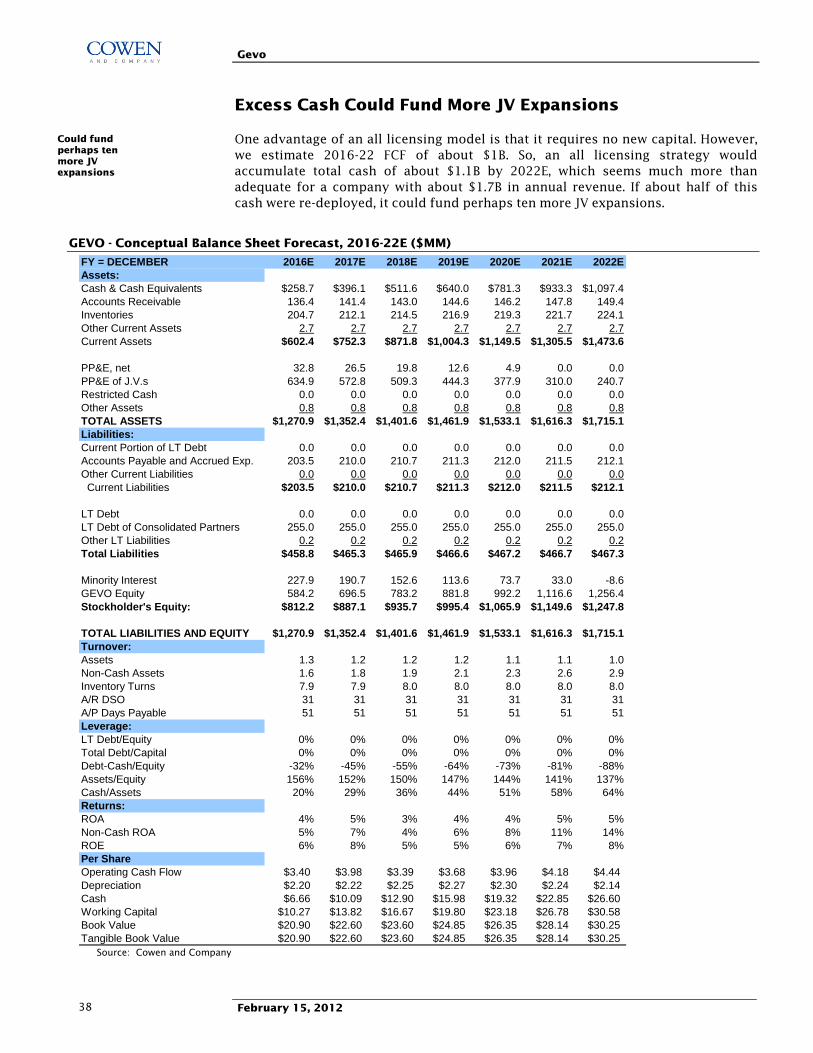
Gevo
February 15, 2012 38
Excess Cash Could Fund More JV Expansions
One advantage of an all licensing model is that it requires no new capital. However, we estimate 2016-22 FCF of about $1B. So, an all licensing strategy would accumulate total cash of about $1.1B by 2022E, which seems much more than adequate for a company with about $1.7B in annual revenue. If about half of this cash were re-deployed, it could fund perhaps ten more JV expansions.
GEVO - Conceptual Balance Sheet Forecast, 2016-22E ($MM)
FY = DECEMBER 2016E 2017E 2018E 2019E 2020E 2021E 2022EAssets:Cash & Cash Equivalents $258.7 $396.1 $511.6 $640.0 $781.3 $933.3 $1,097.4Accounts Receivable 136.4 141.4 143.0 144.6 146.2 147.8 149.4Inventories 204.7 212.1 214.5 216.9 219.3 221.7 224.1Other Current Assets 2.7 2.7 2.7 2.7 2.7 2.7 2.7Current Assets $602.4 $752.3 $871.8 $1,004.3 $1,149.5 $1,305.5 $1,473.6
PP&E, net 32.8 26.5 19.8 12.6 4.9 0.0 0.0PP&E of J.V.s 634.9 572.8 509.3 444.3 377.9 310.0 240.7Restricted Cash 0.0 0.0 0.0 0.0 0.0 0.0 0.0Other Assets 0.8 0.8 0.8 0.8 0.8 0.8 0.8TOTAL ASSETS $1,270.9 $1,352.4 $1,401.6 $1,461.9 $1,533.1 $1,616.3 $1,715.1Liabilities:Current Portion of LT Debt 0.0 0.0 0.0 0.0 0.0 0.0 0.0Accounts Payable and Accrued Exp. 203.5 210.0 210.7 211.3 212.0 211.5 212.1Other Current Liabilities 0.0 0.0 0.0 0.0 0.0 0.0 0.0 Current Liabilities $203.5 $210.0 $210.7 $211.3 $212.0 $211.5 $212.1
LT Debt 0.0 0.0 0.0 0.0 0.0 0.0 0.0LT Debt of Consolidated Partners 255.0 255.0 255.0 255.0 255.0 255.0 255.0Other LT Liabilities 0.2 0.2 0.2 0.2 0.2 0.2 0.2Total Liabilities $458.8 $465.3 $465.9 $466.6 $467.2 $466.7 $467.3
Minority Interest 227.9 190.7 152.6 113.6 73.7 33.0 -8.6GEVO Equity 584.2 696.5 783.2 881.8 992.2 1,116.6 1,256.4Stockholder's Equity: $812.2 $887.1 $935.7 $995.4 $1,065.9 $1,149.6 $1,247.8
TOTAL LIABILITIES AND EQUITY $1,270.9 $1,352.4 $1,401.6 $1,461.9 $1,533.1 $1,616.3 $1,715.1Turnover:Assets 1.3 1.2 1.2 1.2 1.1 1.1 1.0Non-Cash Assets 1.6 1.8 1.9 2.1 2.3 2.6 2.9Inventory Turns 7.9 7.9 8.0 8.0 8.0 8.0 8.0A/R DSO 31 31 31 31 31 31 31A/P Days Payable 51 51 51 51 51 51 51Leverage:LT Debt/Equity 0% 0% 0% 0% 0% 0% 0%Total Debt/Capital 0% 0% 0% 0% 0% 0% 0%Debt-Cash/Equity -32% -45% -55% -64% -73% -81% -88%Assets/Equity 156% 152% 150% 147% 144% 141% 137%Cash/Assets 20% 29% 36% 44% 51% 58% 64%Returns:ROA 4% 5% 3% 4% 4% 5% 5%Non-Cash ROA 5% 7% 4% 6% 8% 11% 14%ROE 6% 8% 5% 5% 6% 7% 8%Per ShareOperating Cash Flow $3.40 $3.98 $3.39 $3.68 $3.96 $4.18 $4.44Depreciation $2.20 $2.22 $2.25 $2.27 $2.30 $2.24 $2.14Cash $6.66 $10.09 $12.90 $15.98 $19.32 $22.85 $26.60Working Capital $10.27 $13.82 $16.67 $19.80 $23.18 $26.78 $30.58Book Value $20.90 $22.60 $23.60 $24.85 $26.35 $28.14 $30.25Tangible Book Value $20.90 $22.60 $23.60 $24.85 $26.35 $28.14 $30.25
Source: Cowen and Company
Could fund perhaps ten more JV expansions
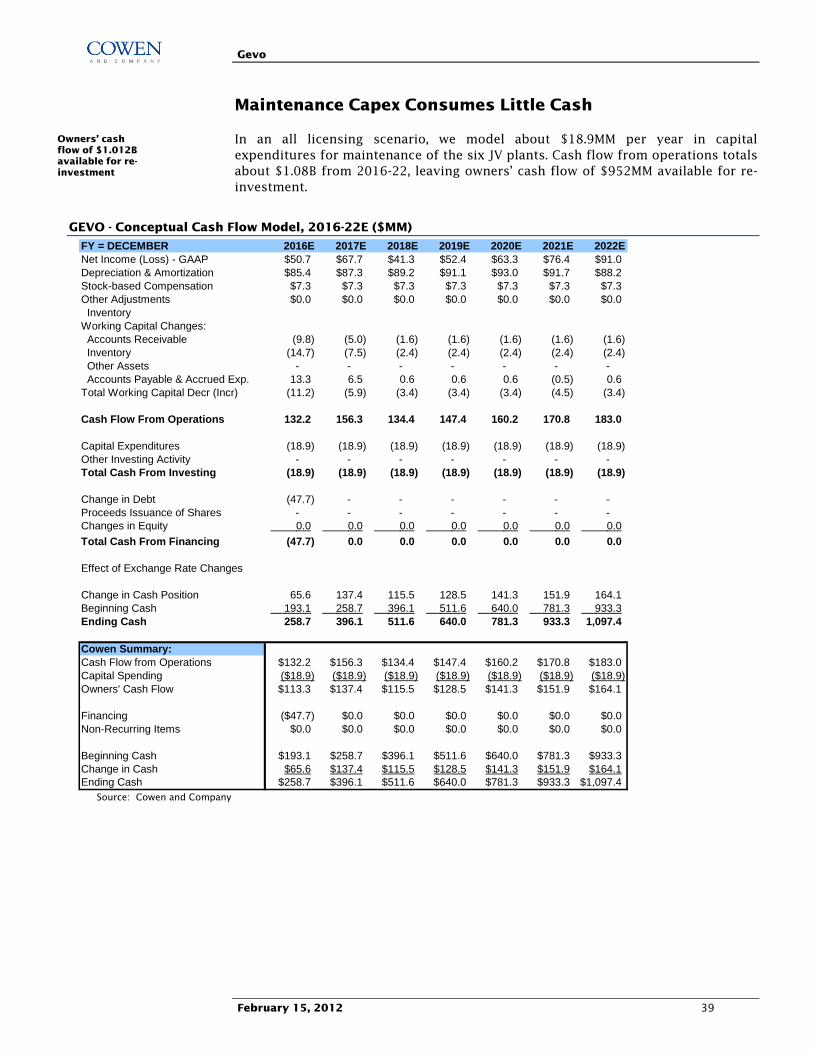
Gevo
February 15, 2012 39
Maintenance Capex Consumes Little Cash
In an all licensing scenario, we model about $18.9MM per year in capital expenditures for maintenance of the six JV plants. Cash flow from operations totals about $1.08B from 2016-22, leaving owners’ cash flow of $952MM available for re-investment.
GEVO - Conceptual Cash Flow Model, 2016-22E ($MM)
FY = DECEMBER 2016E 2017E 2018E 2019E 2020E 2021E 2022ENet Income (Loss) - GAAP $50.7 $67.7 $41.3 $52.4 $63.3 $76.4 $91.0Depreciation & Amortization $85.4 $87.3 $89.2 $91.1 $93.0 $91.7 $88.2Stock-based Compensation $7.3 $7.3 $7.3 $7.3 $7.3 $7.3 $7.3Other Adjustments $0.0 $0.0 $0.0 $0.0 $0.0 $0.0 $0.0 InventoryWorking Capital Changes: Accounts Receivable (9.8) (5.0) (1.6) (1.6) (1.6) (1.6) (1.6) Inventory (14.7) (7.5) (2.4) (2.4) (2.4) (2.4) (2.4) Other Assets - - - - - - - Accounts Payable & Accrued Exp. 13.3 6.5 0.6 0.6 0.6 (0.5) 0.6 Total Working Capital Decr (Incr) (11.2) (5.9) (3.4) (3.4) (3.4) (4.5) (3.4)
Cash Flow From Operations 132.2 156.3 134.4 147.4 160.2 170.8 183.0
Capital Expenditures (18.9) (18.9) (18.9) (18.9) (18.9) (18.9) (18.9) Other Investing Activity - - - - - - - Total Cash From Investing (18.9) (18.9) (18.9) (18.9) (18.9) (18.9) (18.9)
Change in Debt (47.7) - - - - - - Proceeds Issuance of Shares - - - - - - - Changes in Equity 0.0 0.0 0.0 0.0 0.0 0.0 0.0
Total Cash From Financing (47.7) 0.0 0.0 0.0 0.0 0.0 0.0
Effect of Exchange Rate Changes
Change in Cash Position 65.6 137.4 115.5 128.5 141.3 151.9 164.1 Beginning Cash 193.1 258.7 396.1 511.6 640.0 781.3 933.3 Ending Cash 258.7 396.1 511.6 640.0 781.3 933.3 1,097.4
Cowen Summary:Cash Flow from Operations $132.2 $156.3 $134.4 $147.4 $160.2 $170.8 $183.0Capital Spending ($18.9) ($18.9) ($18.9) ($18.9) ($18.9) ($18.9) ($18.9)Owners' Cash Flow $113.3 $137.4 $115.5 $128.5 $141.3 $151.9 $164.1
Financing ($47.7) $0.0 $0.0 $0.0 $0.0 $0.0 $0.0Non-Recurring Items $0.0 $0.0 $0.0 $0.0 $0.0 $0.0 $0.0
Beginning Cash $193.1 $258.7 $396.1 $511.6 $640.0 $781.3 $933.3Change in Cash $65.6 $137.4 $115.5 $128.5 $141.3 $151.9 $164.1Ending Cash $258.7 $396.1 $511.6 $640.0 $781.3 $933.3 $1,097.4
Source: Cowen and Company
Owners’ cash flow of $1.012B available for re-investment

Gevo
February 15, 2012 40
Positives
1. Capital light strategy should yield high returns
2. Large opportunity to upgrade existing ethanol plants to higher value output
3. Established partnerships in several downstream markets
4. Recently issued patents may strengthen competitive barriers
Negatives
1. Low gross margin model appears quite sensitive to ASP changes
2. Need for additional capital
3. Cost profile for fuels market looks tight
4. Ongoing IP disputes may consume cash and management time

Gevo
February 15, 2012 41
Addendum
STOCKS MENTIONED IN IMPORTANT DISCLOSURES Ticker Company Name AMRS Amyris GEVO Gevo KIOR KiOR
ANALYST CERTIFICATION Each author of this research report hereby certifies that (i) the views expressed in the research report accurately reflecthis or her personal views about any and all of the subject securities or issuers, and (ii) no part of his or her compensationwas, is, or will be related, directly or indirectly, to the specific recommendations or views expressed in this report.
IMPORTANT DISCLOSURES Cowen and Company, LLC and or its affiliates make a market in the stock of AMRS, GEVO, KIOR securities. Cowen and Company, LLC compensates research analysts for activities and services intended to benefit the firm's investor clients. Individual compensation determinations for research analysts, including the author(s) of this report, are based on a variety of factors, including the overall profitability of the firm and the total revenue derived from all sources, including revenues from investment banking. Cowen and Company, LLC does not compensate research analysts based on specific investment banking transactions.
DISCLAIMER This research is for our clients only. Our research is disseminated primarily electronically and, in some cases, in printed form. Research distributed electronically is available simultaneously to all Cowen and Company, LLC clients. All published research, including required disclosures, can be obtained on the Firm’s client website, www.cowenresearch.com. Further information on any of the above securities may be obtained from our offices. This report is published solely for information purposes, and is not to be construed as an offer to sell or the solicitation of an offer to buy any security in any state where such an offer or solicitation would be illegal. Other than disclosures relating to Cowen and Company, LLC, the information herein is based on sources we believe to be reliable but is not guaranteed by us and does not purport to be a complete statement or summary of the available data. Any opinions expressed herein are statements of our judgment on this date and are subject to change without notice. Notice to UK Investors: This publication is produced by Cowen and Company, LLC, which is regulated in the United States by FINRA and is disseminated in the United Kingdom by Cowen International Limited ("CIL"). In the United Kingdom, ‘Cowen and Company’ is a Trading Name of CIL. It is communicated only to persons of a kind described in Articles 19 and 49 of the Financial Services and Markets Act 2000 (Financial Promotion) Order 2005. It must not be further transmitted to any other person without the consent of CIL. Copyright, User Agreement and other general information related to this report © 2012 Cowen and Company, LLC. Member NYSE, FINRA and SIPC. All rights reserved. This research report is prepared for the exclusive use of Cowen clients and may not be reproduced, displayed, modified, distributed, transmitted or disclosed, in whole or in part, or in any form or manner, to others outside your organization without the express prior written consent of Cowen. Cowen research reports are distributed simultaneously to all clients eligible to receive such research prior to any public dissemination by Cowen of the research report or information or opinion contained therein. Any unauthorized use or disclosure is prohibited. Receipt and/or review of this research constitutes your agreement not to reproduce, display, modify, distribute, transmit, or disclose to others outside your organization the contents, opinions, conclusion, or information contained in this report (including any investment recommendations, estimates or price targets). All Cowen trademarks displayed in this report are owned by Cowen and may not be used without its prior written consent.
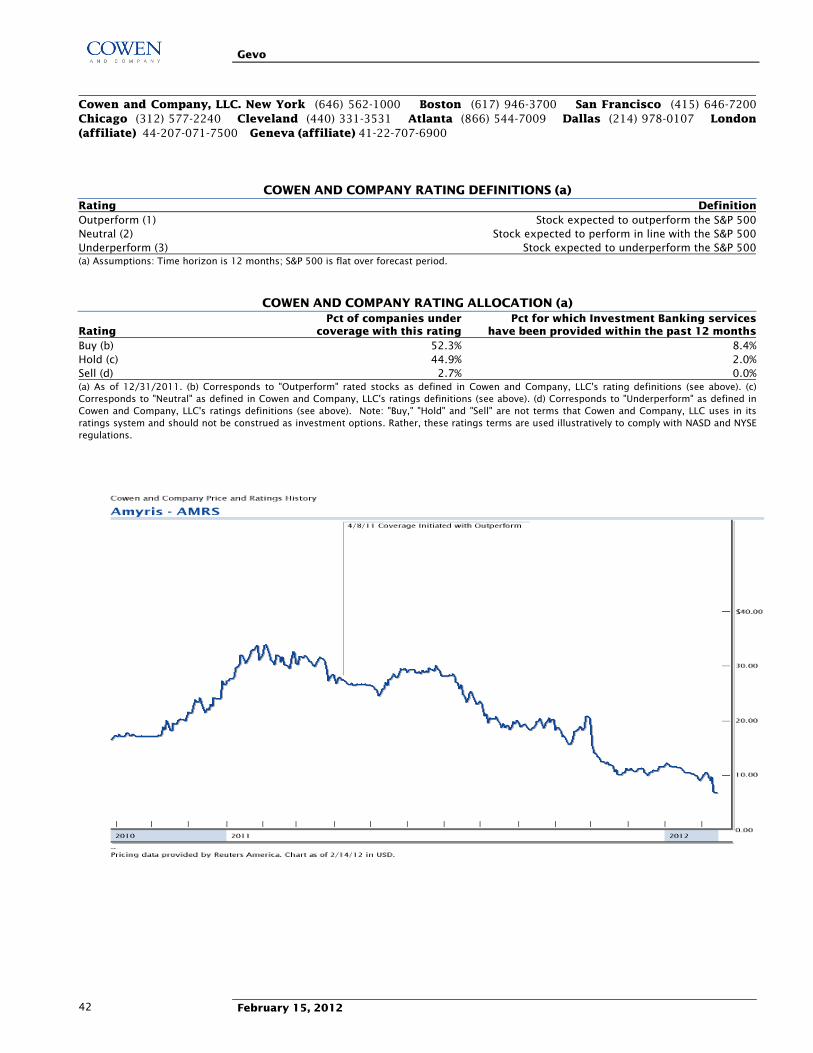
Gevo
February 15, 2012 42
Cowen and Company, LLC. New York (646) 562-1000 Boston (617) 946-3700 San Francisco (415) 646-7200 Chicago (312) 577-2240 Cleveland (440) 331-3531 Atlanta (866) 544-7009 Dallas (214) 978-0107 London (affiliate) 44-207-071-7500 Geneva (affiliate) 41-22-707-6900
COWEN AND COMPANY RATING DEFINITIONS (a) Rating DefinitionOutperform (1) Stock expected to outperform the S&P 500Neutral (2) Stock expected to perform in line with the S&P 500Underperform (3) Stock expected to underperform the S&P 500(a) Assumptions: Time horizon is 12 months; S&P 500 is flat over forecast period.
COWEN AND COMPANY RATING ALLOCATION (a)
Rating Pct of companies under
coverage with this ratingPct for which Investment Banking services
have been provided within the past 12 monthsBuy (b) 52.3% 8.4%Hold (c) 44.9% 2.0%Sell (d) 2.7% 0.0%(a) As of 12/31/2011. (b) Corresponds to "Outperform" rated stocks as defined in Cowen and Company, LLC's rating definitions (see above). (c)Corresponds to "Neutral" as defined in Cowen and Company, LLC's ratings definitions (see above). (d) Corresponds to "Underperform" as defined inCowen and Company, LLC's ratings definitions (see above). Note: "Buy," "Hold" and "Sell" are not terms that Cowen and Company, LLC uses in its ratings system and should not be construed as investment options. Rather, these ratings terms are used illustratively to comply with NASD and NYSEregulations.
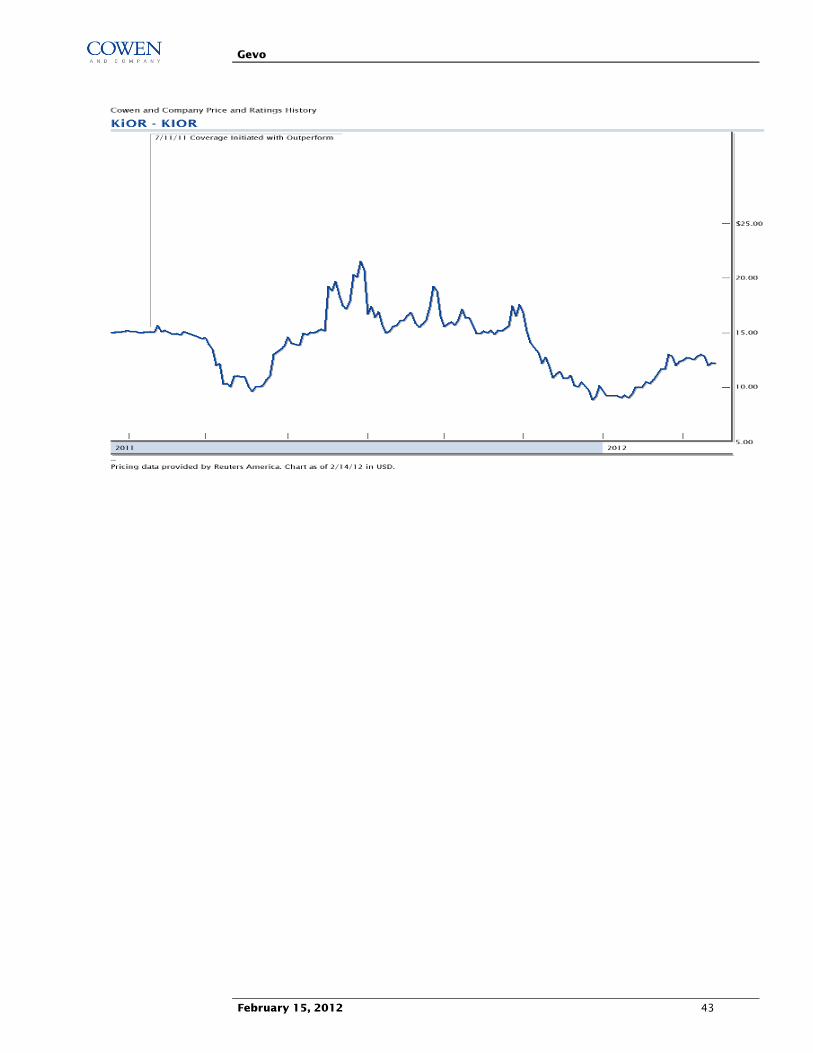
Gevo
February 15, 2012 43