CloudBond 365 Partner Guidelines for Verifying Third-party ...
Upload
khangminh22Category
view
0download
0
Global Third-Party LogisticsMarket Information Report
6 December 2013
Phone: +1-800-525-3915Website: www.3PLogistics.com
Email: [email protected]
APPENDIX VI ARMSTRONG REPORT
– VI-1 –
The facts of this report are believed to be correct at the time of publication but cannot be guaranteed.Please note that the findings, conclusions and recommendations that Armstrong & Associates, Inc. deliverswill be based on information gathered in good faith from both primary and secondary sources, whoseaccuracy we are not always in a position to guarantee. As such, Armstrong & Associates can accept no liabilitywhatsoever for actions taken based on any information that may subsequently prove to be incorrect.
THE GLOBAL LOGISTICS MARKET
Logistics Spend Analysis
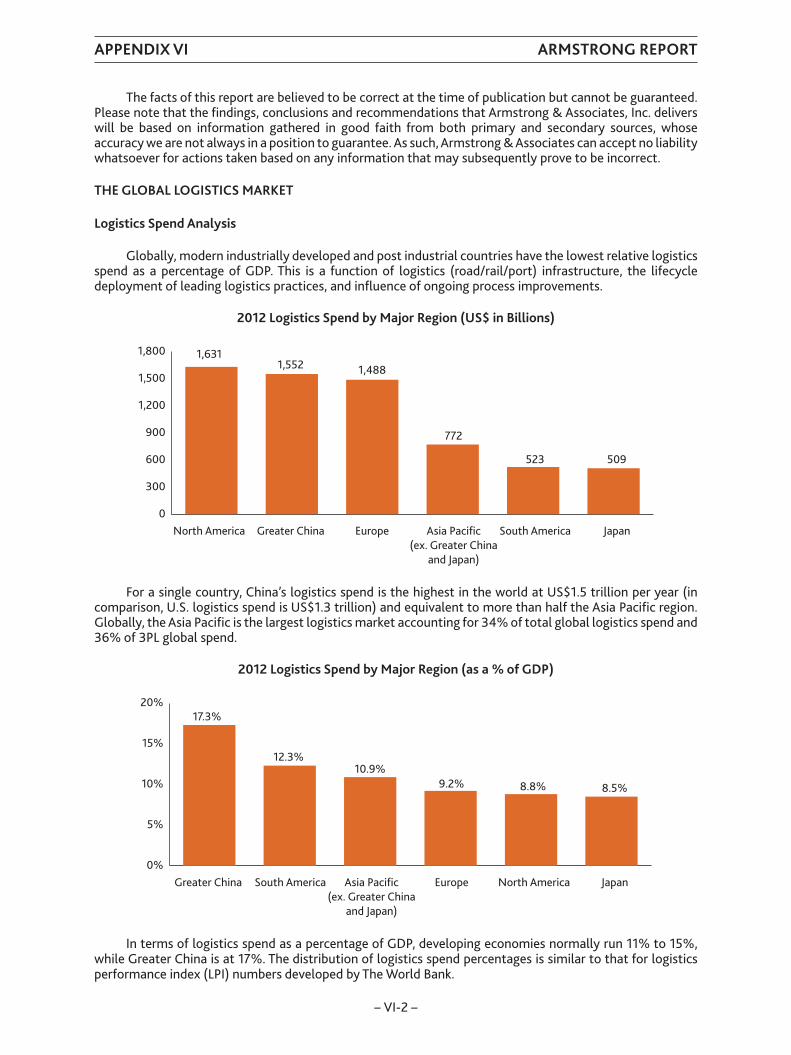
Globally, modern industrially developed and post industrial countries have the lowest relative logisticsspend as a percentage of GDP. This is a function of logistics (road/rail/port) infrastructure, the lifecycledeployment of leading logistics practices, and influence of ongoing process improvements.
2012 Logistics Spend by Major Region (US$ in Billions)
0
300
600
900
1,200
1,500
1,800
North America
1,6311,552 1,488
772
523
Greater China Europe Asia Pacific(ex. Greater China
and Japan)
South America Japan
509
For a single country, China’s logistics spend is the highest in the world at US$1.5 trillion per year (incomparison, U.S. logistics spend is US$1.3 trillion) and equivalent to more than half the Asia Pacific region.Globally, the Asia Pacific is the largest logistics market accounting for 34% of total global logistics spend and36% of 3PL global spend.
2012 Logistics Spend by Major Region (as a % of GDP)
0%
5%
10%
15%
20%17.3%
12.3%10.9%
9.2% 8.8%
Greater China EuropeAsia Pacific(ex. Greater China
and Japan)
South America JapanNorth America
8.5%
In terms of logistics spend as a percentage of GDP, developing economies normally run 11% to 15%,while Greater China is at 17%. The distribution of logistics spend percentages is similar to that for logisticsperformance index (LPI) numbers developed by The World Bank.
APPENDIX VI ARMSTRONG REPORT
– VI-2 –
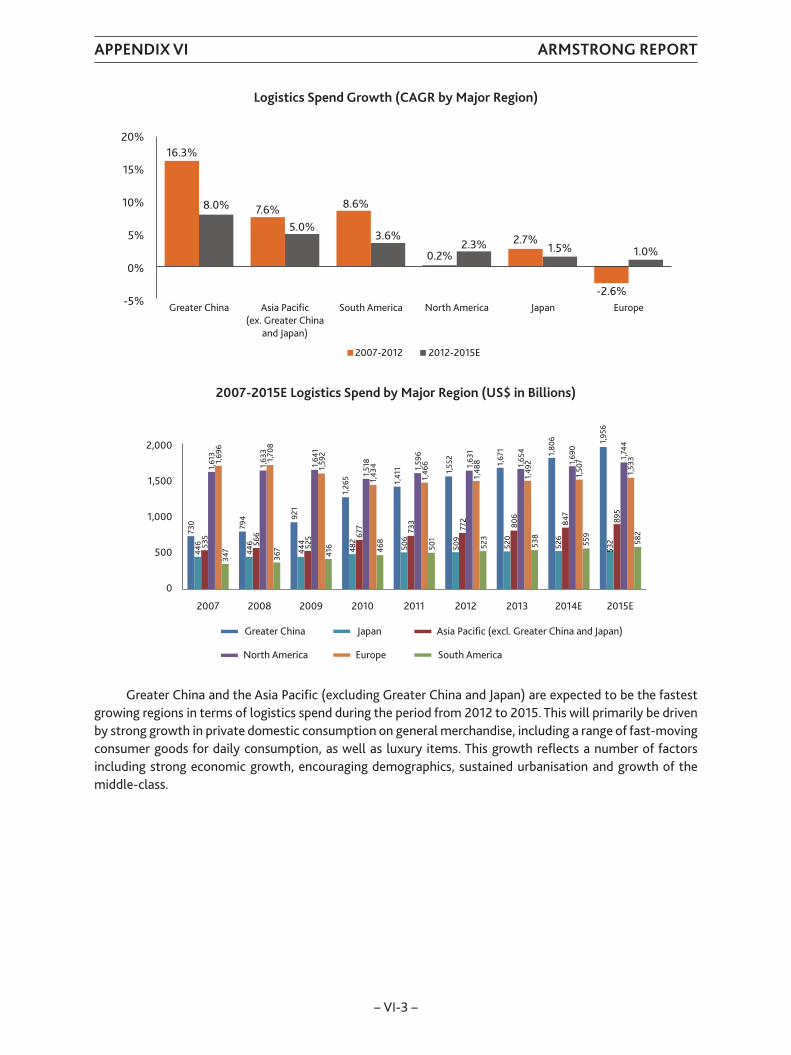
Logistics Spend Growth (CAGR by Major Region)
-5%
0%
5%
10%
20%
15%
Greater China
16.3%
8.0% 7.6%5.0%
8.6%
3.6%
0.2%2.3% 2.7%
1.5%
-2.6%
1.0%
Asia Pacific(ex. Greater China
and Japan)
South America North America Japan Europe
2007-2012 2012-2015E
2007-2015E Logistics Spend by Major Region (US$ in Billions)
Greater China
0
500
730
446 53
51,
613
1,69
634
7
794
446 56
61,
633
1,70
836
7
921
444 52
51,
641
1,59
241
6
1,26
548
267
71,
518
1,43
446
8
1,41
150
673
31,
596
1,46
650
1
1,55
250
977
21,
631
1,48
852
3
1,67
152
080
61,
654
1,49
253
8
1,80
652
684
71,
690
1,50
755
9
1,95
653
289
51,
744
1,53
358
2
2007 2008 2009 2010 2011 2012 2013 2014E 2015E
1,000
1,500
2,000
South America
Japan Asia Pacific (excl. Greater China and Japan)
North America Europe
Greater China and the Asia Pacific (excluding Greater China and Japan) are expected to be the fastestgrowing regions in terms of logistics spend during the period from 2012 to 2015. This will primarily be drivenby strong growth in private domestic consumption on general merchandise, including a range of fast-movingconsumer goods for daily consumption, as well as luxury items. This growth reflects a number of factorsincluding strong economic growth, encouraging demographics, sustained urbanisation and growth of themiddle-class.
APPENDIX VI ARMSTRONG REPORT
– VI-3 –
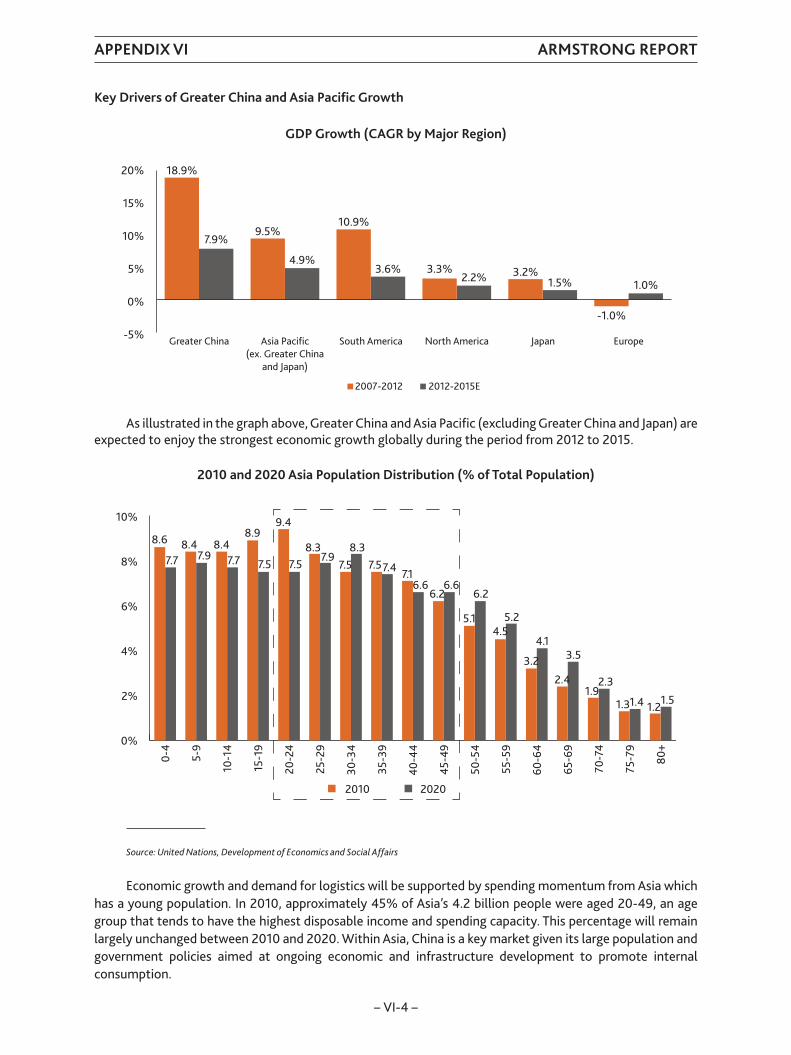
Key Drivers of Greater China and Asia Pacific Growth
GDP Growth (CAGR by Major Region)
18.9%
7.9%9.5%
4.9%
10.9%
3.6% 3.3%2.2% 3.2%
1.5%
-1.0%
-5%
0%
5%
10%
20%
15%
1.0%
2007-2012 2012-2015E
Greater China Asia Pacific(ex. Greater China
and Japan)
South America North America Japan Europe
As illustrated in the graph above, Greater China and Asia Pacific (excluding Greater China and Japan) areexpected to enjoy the strongest economic growth globally during the period from 2012 to 2015.
2010 and 2020 Asia Population Distribution (% of Total Population)
0%
0-4
5-9
10-1
4
15-1
9
20-2
4
25-2
9
30-3
4
35-3
9
40-4
4
45-4
9
50-5
4
55-5
9
60-6
4
65-6
9
70-7
4
75-7
9
80+
2%
4%
6%
8%
10%
2010 2020
7.7
1.51.4
2.3
3.54.1
5.2
6.26.66.6
7.4
8.37.9
7.57.57.77.98.6 8.4
1.21.31.9
2.4
3.2
4.55.1
6.2
7.17.57.5
8.3
9.48.9
8.4
Source: United Nations, Development of Economics and Social Affairs
Economic growth and demand for logistics will be supported by spending momentum from Asia whichhas a young population. In 2010, approximately 45% of Asia’s 4.2 billion people were aged 20-49, an agegroup that tends to have the highest disposable income and spending capacity. This percentage will remainlargely unchanged between 2010 and 2020. Within Asia, China is a key market given its large population andgovernment policies aimed at ongoing economic and infrastructure development to promote internalconsumption.
APPENDIX VI ARMSTRONG REPORT
– VI-4 –
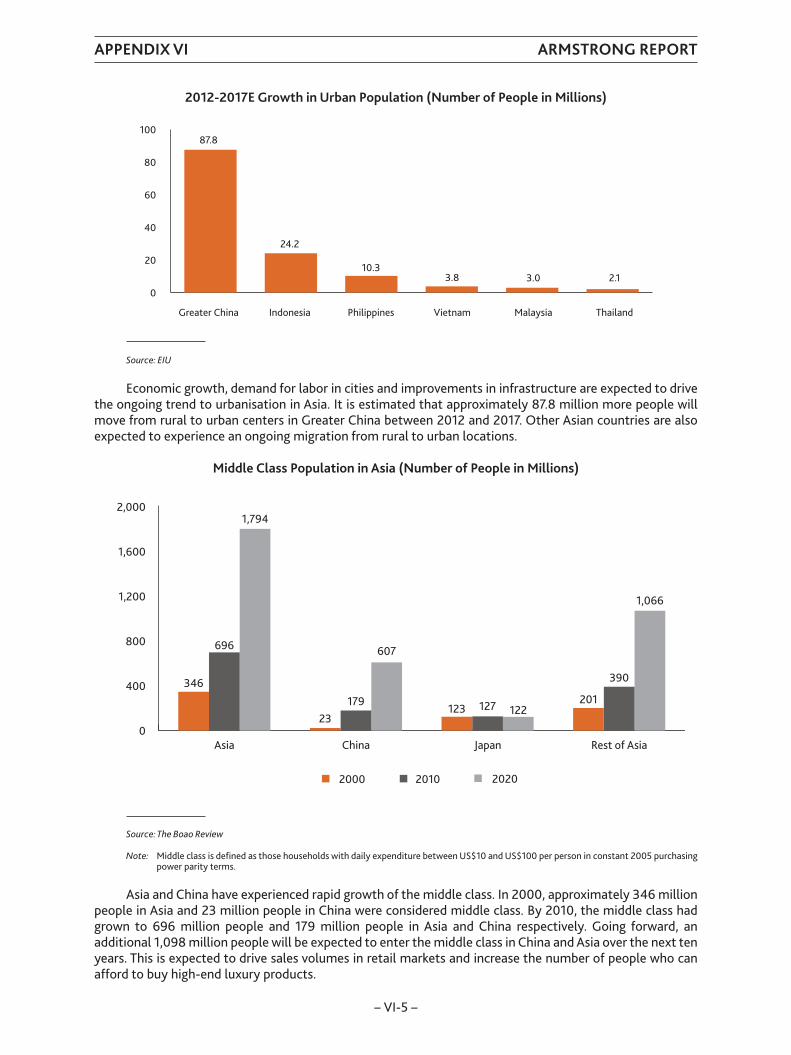
2012-2017E Growth in Urban Population (Number of People in Millions)
0
20
40
60
80
100
2.1
87.8
Greater China Indonesia Philippines Vietnam Malaysia Thailand
24.2
10.33.8 3.0
Source: EIU
Economic growth, demand for labor in cities and improvements in infrastructure are expected to drivethe ongoing trend to urbanisation in Asia. It is estimated that approximately 87.8 million more people willmove from rural to urban centers in Greater China between 2012 and 2017. Other Asian countries are alsoexpected to experience an ongoing migration from rural to urban locations.
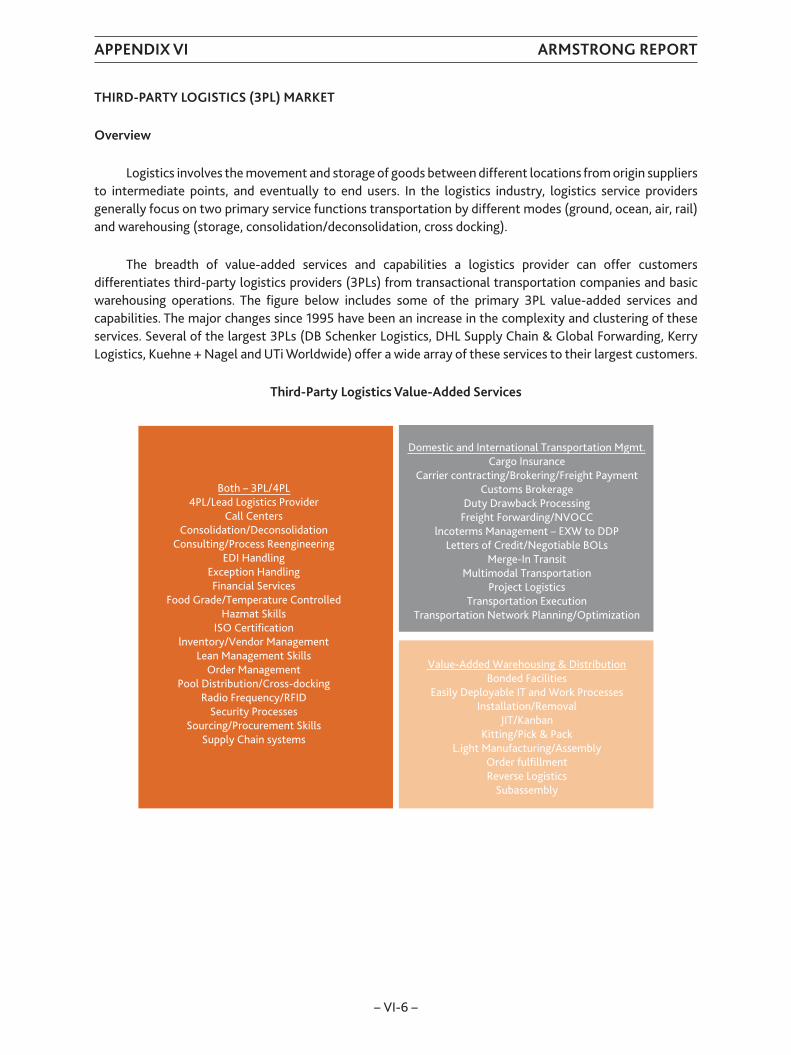
Middle Class Population in Asia (Number of People in Millions)
0
400
800
1,200
1,600
2,000
390
1,066
346
696
1,794
23179
Asia China Japan Rest of Asia
607
123 127 122201
2000 2010 2020
Source: The Boao Review
Note: Middle class is defined as those households with daily expenditure between US$10 and US$100 per person in constant 2005 purchasingpower parity terms.
Asia and China have experienced rapid growth of the middle class. In 2000, approximately 346 millionpeople in Asia and 23 million people in China were considered middle class. By 2010, the middle class hadgrown to 696 million people and 179 million people in Asia and China respectively. Going forward, anadditional 1,098 million people will be expected to enter the middle class in China and Asia over the next tenyears. This is expected to drive sales volumes in retail markets and increase the number of people who canafford to buy high-end luxury products.
APPENDIX VI ARMSTRONG REPORT
– VI-5 –
THIRD-PARTY LOGISTICS (3PL) MARKET
Overview
Logistics involves the movement and storage of goods between different locations from origin suppliersto intermediate points, and eventually to end users. In the logistics industry, logistics service providersgenerally focus on two primary service functions transportation by different modes (ground, ocean, air, rail)and warehousing (storage, consolidation/deconsolidation, cross docking).
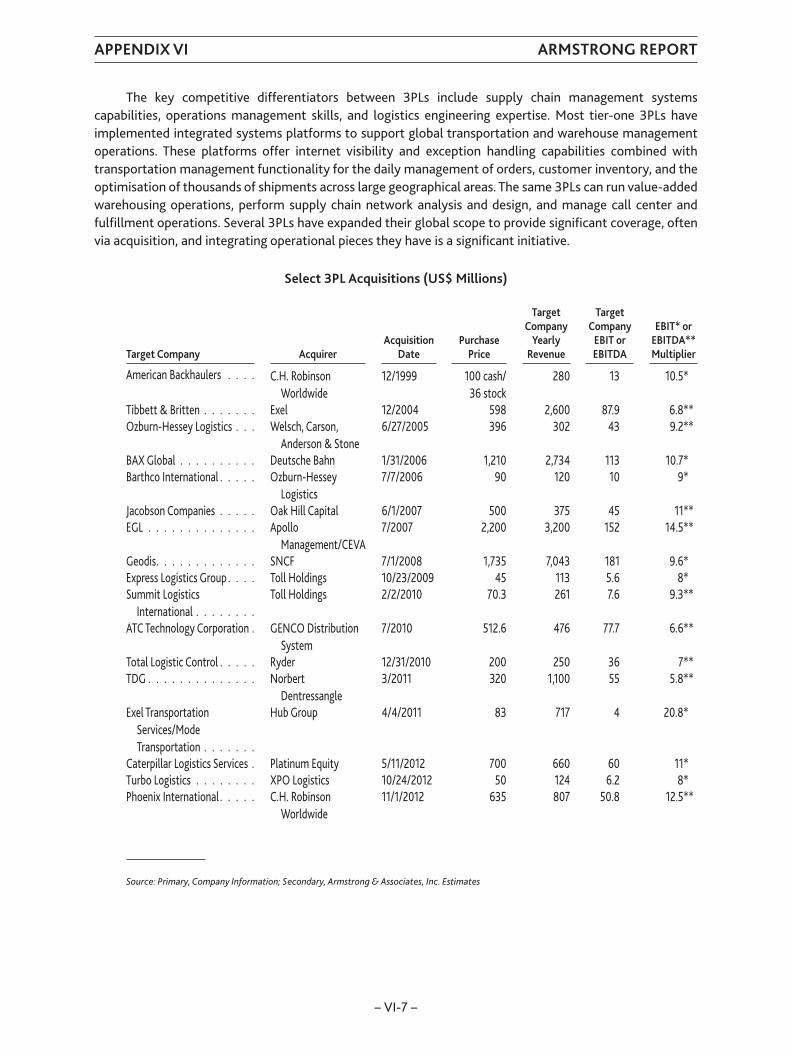
The breadth of value-added services and capabilities a logistics provider can offer customersdifferentiates third-party logistics providers (3PLs) from transactional transportation companies and basicwarehousing operations. The figure below includes some of the primary 3PL value-added services andcapabilities. The major changes since 1995 have been an increase in the complexity and clustering of theseservices. Several of the largest 3PLs (DB Schenker Logistics, DHL Supply Chain & Global Forwarding, KerryLogistics, Kuehne + Nagel and UTi Worldwide) offer a wide array of these services to their largest customers.
Third-Party Logistics Value-Added Services
Both – 3PL/4PL4PL/Lead Logistics Provider
Call CentersConsolidation/Deconsolidation
Consulting/Process ReengineeringEDI Handling
Exception HandlingFinancial Services
Food Grade/Temperature ControlledHazmat Skills
ISO Certificationlnventory/Vendor Management
Lean Management SkillsOrder Management
Pool Distribution/Cross-dockingRadio Frequency/RFID
Security ProcessesSourcing/Procurement Skills
Supply Chain systems
Domestic and International Transportation Mgmt.Cargo Insurance
Carrier contracting/Brokering/Freight PaymentCustoms Brokerage
Duty Drawback ProcessingFreight Forwarding/NVOCC
lncoterms Management – EXW to DDPLetters of Credit/Negotiable BOLs
Merge-In TransitMultimodal Transportation
Project LogisticsTransportation Execution
Transportation Network Planning/Optimization
Value-Added Warehousing & DistributionBonded Facilities
Easily Deployable IT and Work ProcessesInstallation/Removal
JIT/KanbanKitting/Pick & Pack
L.ight Manufacturing/AssemblyOrder fulfillmentReverse Logistics
Subassembly
APPENDIX VI ARMSTRONG REPORT
– VI-6 –
The key competitive differentiators between 3PLs include supply chain management systemscapabilities, operations management skills, and logistics engineering expertise. Most tier-one 3PLs haveimplemented integrated systems platforms to support global transportation and warehouse managementoperations. These platforms offer internet visibility and exception handling capabilities combined withtransportation management functionality for the daily management of orders, customer inventory, and theoptimisation of thousands of shipments across large geographical areas. The same 3PLs can run value-addedwarehousing operations, perform supply chain network analysis and design, and manage call center andfulfillment operations. Several 3PLs have expanded their global scope to provide significant coverage, oftenvia acquisition, and integrating operational pieces they have is a significant initiative.
Select 3PL Acquisitions (US$ Millions)
Target Company AcquirerAcquisition
DatePurchase
Price
TargetCompany
YearlyRevenue
TargetCompany
EBIT orEBITDA
EBIT* orEBITDA**Multiplier
American Backhaulers . . . . C.H. RobinsonWorldwide
12/1999 100 cash/36 stock
280 13 10.5*
Tibbett & Britten . . . . . . . Exel 12/2004 598 2,600 87.9 6.8**Ozburn-Hessey Logistics . . . Welsch, Carson,
Anderson & Stone6/27/2005 396 302 43 9.2**
BAX Global . . . . . . . . . . Deutsche Bahn 1/31/2006 1,210 2,734 113 10.7*Barthco International . . . . . Ozburn-Hessey
Logistics7/7/2006 90 120 10 9*
Jacobson Companies . . . . . Oak Hill Capital 6/1/2007 500 375 45 11**EGL . . . . . . . . . . . . . . Apollo
Management/CEVA7/2007 2,200 3,200 152 14.5**
Geodis. . . . . . . . . . . . . SNCF 7/1/2008 1,735 7,043 181 9.6*Express Logistics Group . . . . Toll Holdings 10/23/2009 45 113 5.6 8*Summit Logistics
International . . . . . . . .Toll Holdings 2/2/2010 70.3 261 7.6 9.3**
ATC Technology Corporation . GENCO DistributionSystem
7/2010 512.6 476 77.7 6.6**
Total Logistic Control . . . . . Ryder 12/31/2010 200 250 36 7**TDG . . . . . . . . . . . . . . Norbert
Dentressangle3/2011 320 1,100 55 5.8**
Exel TransportationServices/ModeTransportation . . . . . . .
Hub Group 4/4/2011 83 717 4 20.8*
Caterpillar Logistics Services . Platinum Equity 5/11/2012 700 660 60 11*Turbo Logistics . . . . . . . . XPO Logistics 10/24/2012 50 124 6.2 8*Phoenix International . . . . . C.H. Robinson
Worldwide11/1/2012 635 807 50.8 12.5**
Source: Primary, Company Information; Secondary, Armstrong & Associates, Inc. Estimates
APPENDIX VI ARMSTRONG REPORT
– VI-7 –
Key to this report is a basic understanding of International Transportation Management (freightforwarding) and Value-Added Warehousing & Distribution 3PLs.
InternationalTransportation Management (ITM) 3PLs have a core competency in freight forwarding andoften offer a host of additional value-added services. They traditionally act as intermediaries arranging forinternational and related domestic transportation between their customers and transportation providers.ITM 3PLs arrange and oversee all aspects of the transportation of products and materials, from origin todestination, by ground, ocean, air and rail. An ITM 3PL will typically arrange to pick up goods from a shipper,consolidate shipments, procure transportation, and provide ancillary value-added services includingpreparation and submission of documentation, customs and other clearance processes, and warehousing andauditing of shipments. In addition, they will have systems for tracking and tracing shipments and automatingprocesses with customs officials. Typically, ITM is non-asset based.
Value-Added Warehousing & Distribution (VAWD) 3PLs manage customers warehousing and relatedtransportation management needs. These services are typically performed under multi-year contracts inwhich the 3PLs systems and staff take over responsibility of critical logistics functions. Responsibilities ofteninclude managing and optimising warehousing operations, transport routes and providers-whether inbound,outbound or dealing with aftermarket returns-kitting and sequencing unassembled parts, providing supportduring manufacturing, picking and packing finished goods, and providing quality control and other value-added services. Our European colleagues tend to lump the VAWD and related outbound transportation into“contract logistics”, and Kerry Logistics refers to it as “integrated logistics”. Traditionally, this 3PL segment isasset-based.
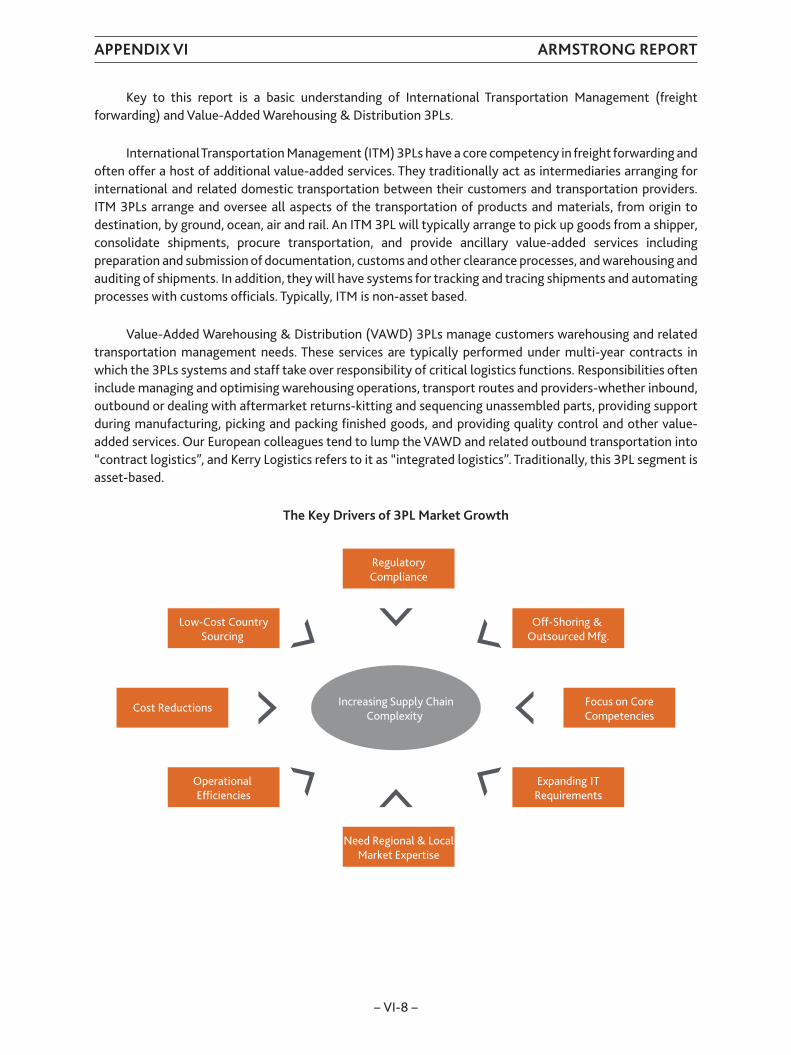
The Key Drivers of 3PL Market Growth
RegulatoryCompliance
Focus on CoreCompetencies
Need Regional & LocalMarket Expertise
Cost Reductions
Off-Shoring & Outsourced Mfg.
Expanding ITRequirements
Low-Cost CountrySourcing
Operational Efficiencies
Increasing Supply ChainComplexity
APPENDIX VI ARMSTRONG REPORT
– VI-8 –
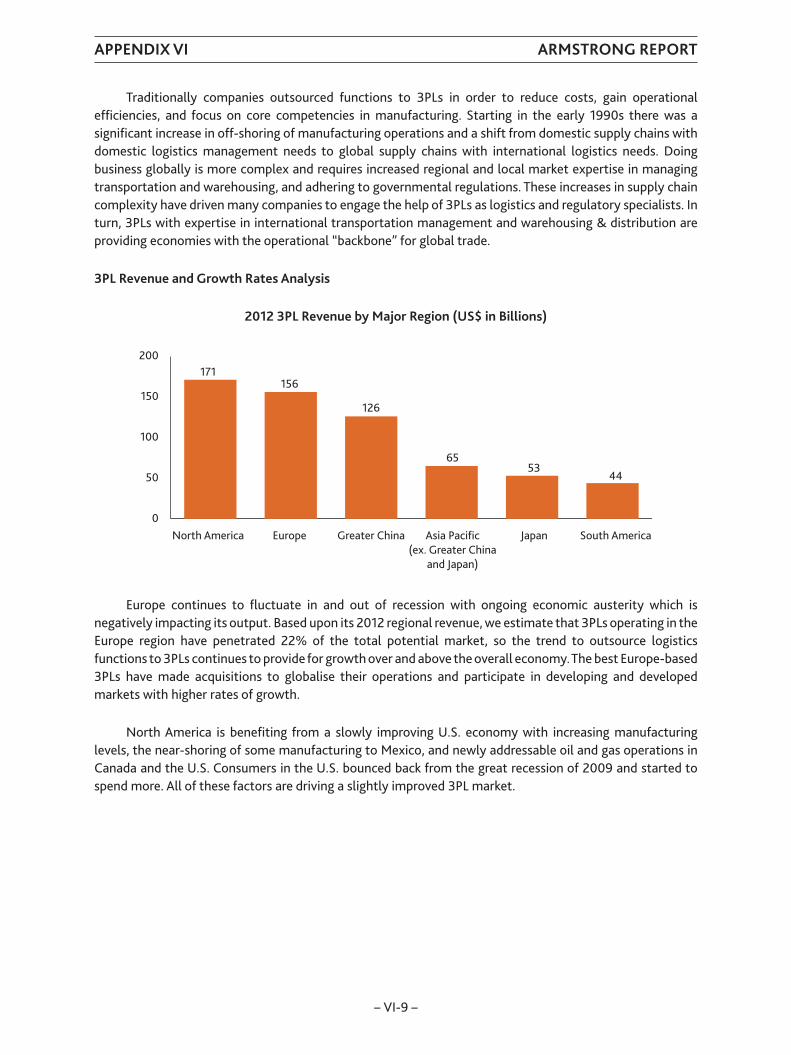
Traditionally companies outsourced functions to 3PLs in order to reduce costs, gain operationalefficiencies, and focus on core competencies in manufacturing. Starting in the early 1990s there was asignificant increase in off-shoring of manufacturing operations and a shift from domestic supply chains withdomestic logistics management needs to global supply chains with international logistics needs. Doingbusiness globally is more complex and requires increased regional and local market expertise in managingtransportation and warehousing, and adhering to governmental regulations. These increases in supply chaincomplexity have driven many companies to engage the help of 3PLs as logistics and regulatory specialists. Inturn, 3PLs with expertise in international transportation management and warehousing & distribution areproviding economies with the operational “backbone” for global trade.
3PL Revenue and Growth Rates Analysis
2012 3PL Revenue by Major Region (US$ in Billions)
0
50
100
150
200
North America
171156
126
6553
Europe Greater China Asia Pacific(ex. Greater China
and Japan)
Japan South America
44
Europe continues to fluctuate in and out of recession with ongoing economic austerity which isnegatively impacting its output. Based upon its 2012 regional revenue, we estimate that 3PLs operating in theEurope region have penetrated 22% of the total potential market, so the trend to outsource logisticsfunctions to 3PLs continues to provide for growth over and above the overall economy.The best Europe-based3PLs have made acquisitions to globalise their operations and participate in developing and developedmarkets with higher rates of growth.
North America is benefiting from a slowly improving U.S. economy with increasing manufacturinglevels, the near-shoring of some manufacturing to Mexico, and newly addressable oil and gas operations inCanada and the U.S. Consumers in the U.S. bounced back from the great recession of 2009 and started tospend more. All of these factors are driving a slightly improved 3PL market.
APPENDIX VI ARMSTRONG REPORT
– VI-9 –
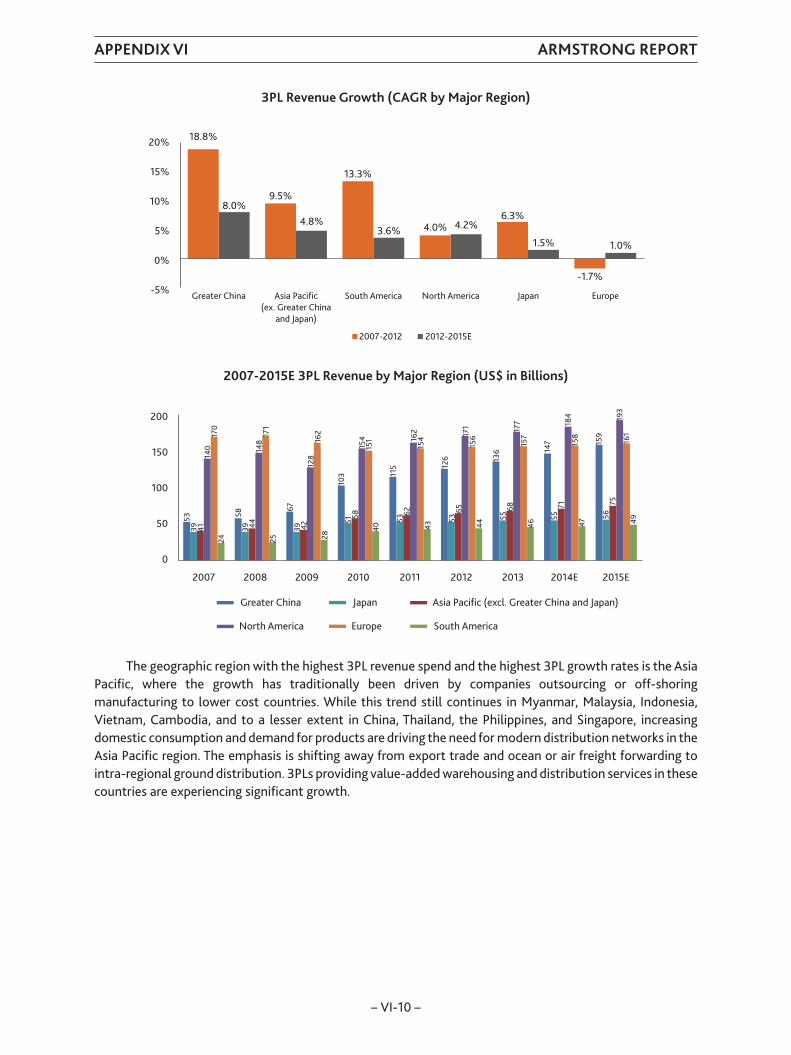
3PL Revenue Growth (CAGR by Major Region)
Greater China
18.8%
8.0%9.5%
4.8%
13.3%
3.6% 4.0% 4.2%6.3%
1.5%
-1.7%
Asia Pacific(ex. Greater China
and Japan)
South America North America Japan Europe-5%
0%
5%
10%
20%
15%
1.0%
2007-2012 2012-2015E
2007-2015E 3PL Revenue by Major Region (US$ in Billions)
Greater China
0
50 5339 41
140
170
24
5839 44
148
171
25
6739 42
128
162
28
103
5158
154
151
40
115
5362
162
154
43
126
5365
171
156
44
136
5568
177
157
46
147
5571
184
158
47
159
5675
193
161
49
2007 2008 2009 2010 2011 2012 2013 2014E 2015E
100
150
200
South America
Japan Asia Pacific (excl. Greater China and Japan)
North America Europe
The geographic region with the highest 3PL revenue spend and the highest 3PL growth rates is the AsiaPacific, where the growth has traditionally been driven by companies outsourcing or off-shoringmanufacturing to lower cost countries. While this trend still continues in Myanmar, Malaysia, Indonesia,Vietnam, Cambodia, and to a lesser extent in China, Thailand, the Philippines, and Singapore, increasingdomestic consumption and demand for products are driving the need for modern distribution networks in theAsia Pacific region. The emphasis is shifting away from export trade and ocean or air freight forwarding tointra-regional ground distribution. 3PLs providing value-added warehousing and distribution services in thesecountries are experiencing significant growth.
APPENDIX VI ARMSTRONG REPORT
– VI-10 –
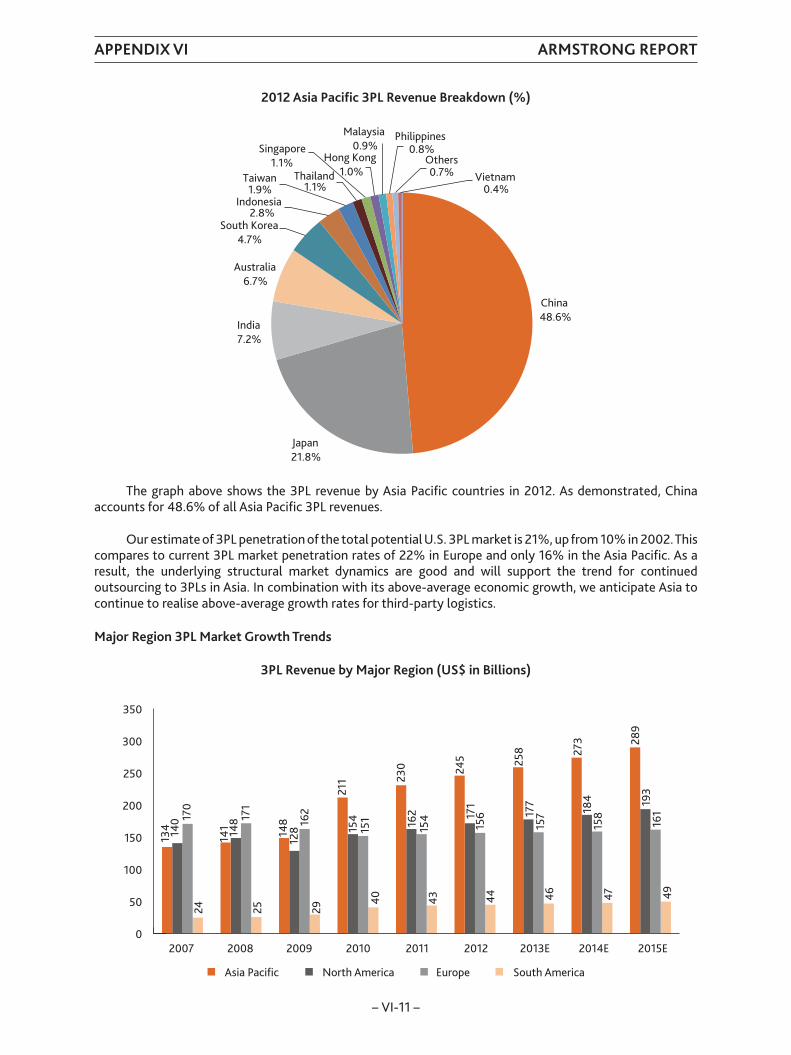
2012 Asia Pacific 3PL Revenue Breakdown (%)
China48.6%
Japan21.8%
India7.2%
Australia6.7%
South Korea4.7%
Indonesia2.8%
Taiwan1.9%
Thailand1.1%
Singapore1.1% Hong Kong
1.0%
Malaysia0.9%
Philippines0.8%
Others0.7% Vietnam
0.4%
The graph above shows the 3PL revenue by Asia Pacific countries in 2012. As demonstrated, Chinaaccounts for 48.6% of all Asia Pacific 3PL revenues.
Our estimate of 3PL penetration of the total potential U.S. 3PL market is 21%, up from 10% in 2002.Thiscompares to current 3PL market penetration rates of 22% in Europe and only 16% in the Asia Pacific. As aresult, the underlying structural market dynamics are good and will support the trend for continuedoutsourcing to 3PLs in Asia. In combination with its above-average economic growth, we anticipate Asia tocontinue to realise above-average growth rates for third-party logistics.
Major Region 3PL Market Growth Trends
3PL Revenue by Major Region (US$ in Billions)
02007 2008 2009 2010 2011
Asia Pacific
134 14
0 170
24
141 14
8 171
25
211
154
151
40
148
128
162
29
230
162
154
43
258
177
157
46
273
184
158
47
289
193
161
49
245
171
156
44
2012 2013E 2014E 2015E
100
50
150
200
250
300
350
North America Europe South America
APPENDIX VI ARMSTRONG REPORT
– VI-11 –
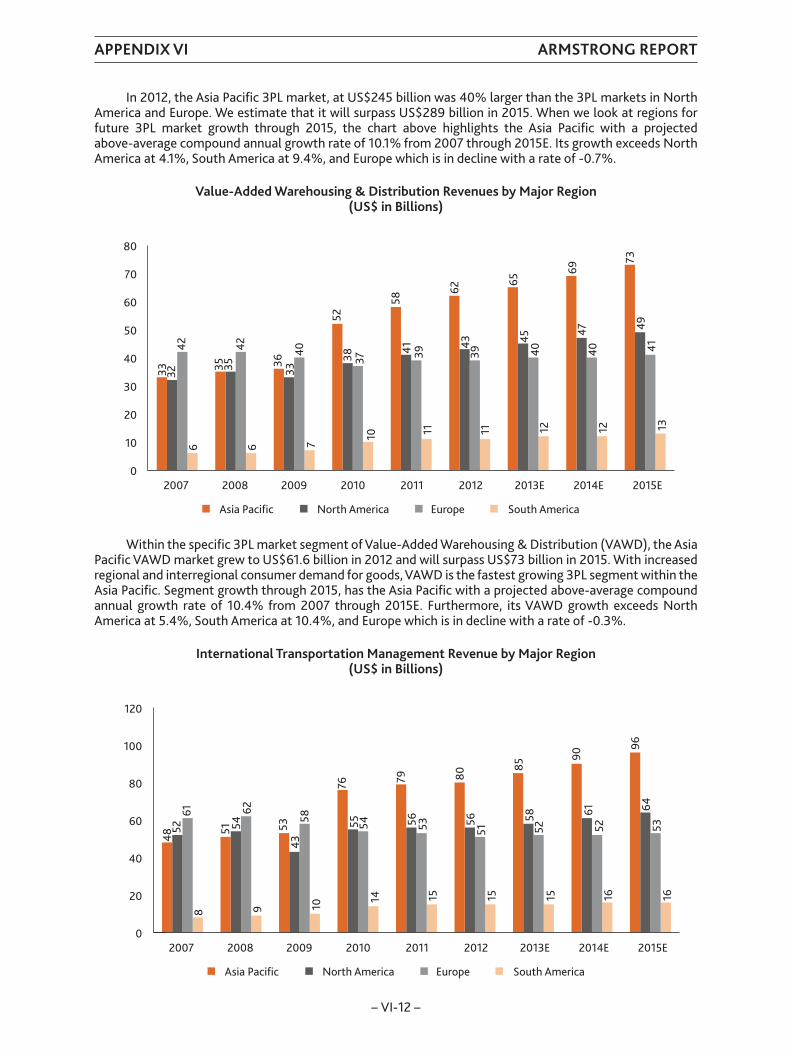
In 2012, the Asia Pacific 3PL market, at US$245 billion was 40% larger than the 3PL markets in NorthAmerica and Europe. We estimate that it will surpass US$289 billion in 2015. When we look at regions forfuture 3PL market growth through 2015, the chart above highlights the Asia Pacific with a projectedabove-average compound annual growth rate of 10.1% from 2007 through 2015E. Its growth exceeds NorthAmerica at 4.1%, South America at 9.4%, and Europe which is in decline with a rate of -0.7%.
Value-Added Warehousing & Distribution Revenues by Major Region(US$ in Billions)
02007 2008 2009 2010 2011
Asia Pacific
33 3242
6
35 3542
6
5238 37
10
3633
407
5841 39
11
6545
4012
6947
4012
7349
4113
6243
3911
2012 2013E 2014E 2015E
20
10
30
40
50
60
80
70
North America Europe South America
Within the specific 3PL market segment of Value-Added Warehousing & Distribution (VAWD), the AsiaPacific VAWD market grew to US$61.6 billion in 2012 and will surpass US$73 billion in 2015. With increasedregional and interregional consumer demand for goods, VAWD is the fastest growing 3PL segment within theAsia Pacific. Segment growth through 2015, has the Asia Pacific with a projected above-average compoundannual growth rate of 10.4% from 2007 through 2015E. Furthermore, its VAWD growth exceeds NorthAmerica at 5.4%, South America at 10.4%, and Europe which is in decline with a rate of -0.3%.
International Transportation Management Revenue by Major Region(US$ in Billions)
02007 2008 2009 2010 2011
Asia Pacific
4852
618
51 5462
9
7655 54
14
5343
5810
7956 53
15
8558
5215
9061
5216
9664
5316
8056
5115
2012 2013E 2014E 2015E
20
40
60
80
120
100
North America Europe South America
APPENDIX VI ARMSTRONG REPORT
– VI-12 –
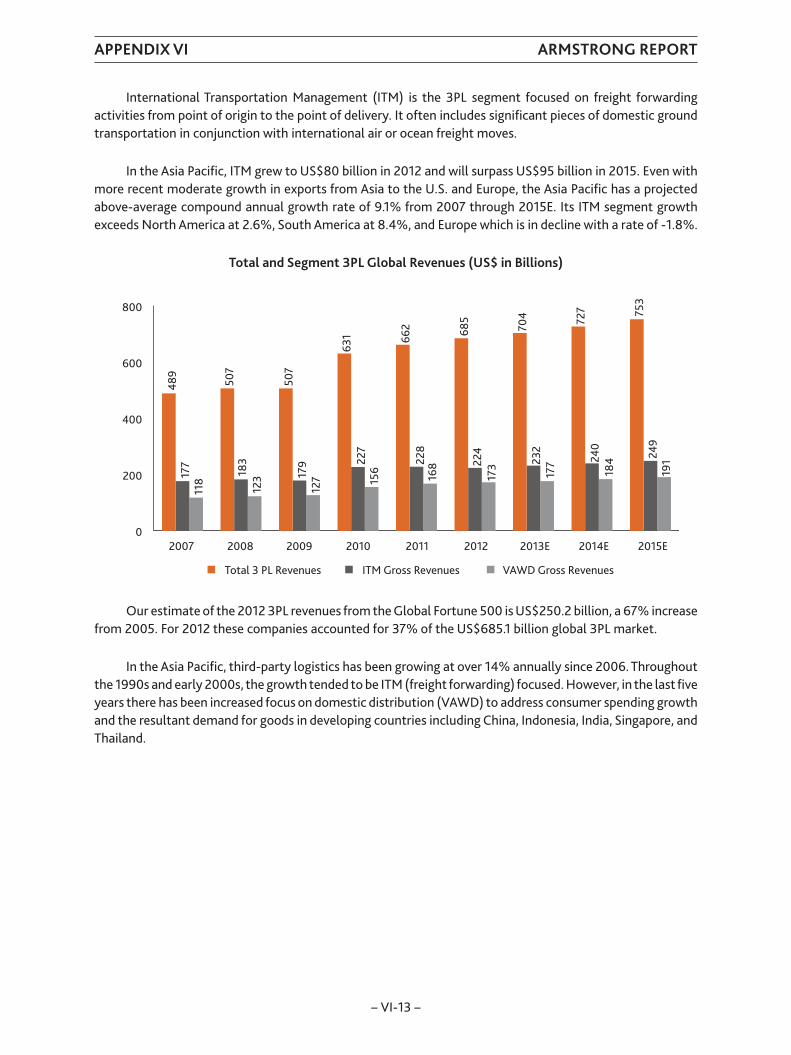
International Transportation Management (ITM) is the 3PL segment focused on freight forwardingactivities from point of origin to the point of delivery. It often includes significant pieces of domestic groundtransportation in conjunction with international air or ocean freight moves.
In the Asia Pacific, ITM grew to US$80 billion in 2012 and will surpass US$95 billion in 2015. Even withmore recent moderate growth in exports from Asia to the U.S. and Europe, the Asia Pacific has a projectedabove-average compound annual growth rate of 9.1% from 2007 through 2015E. Its ITM segment growthexceeds North America at 2.6%, South America at 8.4%, and Europe which is in decline with a rate of -1.8%.
Total and Segment 3PL Global Revenues (US$ in Billions)
02007 2008 2009 2010 2011
Total 3 PL Revenues
489
177
118
507
183
123
631
227
156
507
179
127
662
228
168
704
232
177
727
240
184
753
249
191
685
224
173
2012 2013E 2014E 2015E
200
400
800
600
ITM Gross Revenues VAWD Gross Revenues
Our estimate of the 2012 3PL revenues from the Global Fortune 500 is US$250.2 billion, a 67% increasefrom 2005. For 2012 these companies accounted for 37% of the US$685.1 billion global 3PL market.
In the Asia Pacific, third-party logistics has been growing at over 14% annually since 2006. Throughoutthe 1990s and early 2000s, the growth tended to be ITM (freight forwarding) focused. However, in the last fiveyears there has been increased focus on domestic distribution (VAWD) to address consumer spending growthand the resultant demand for goods in developing countries including China, Indonesia, India, Singapore, andThailand.
APPENDIX VI ARMSTRONG REPORT
– VI-13 –
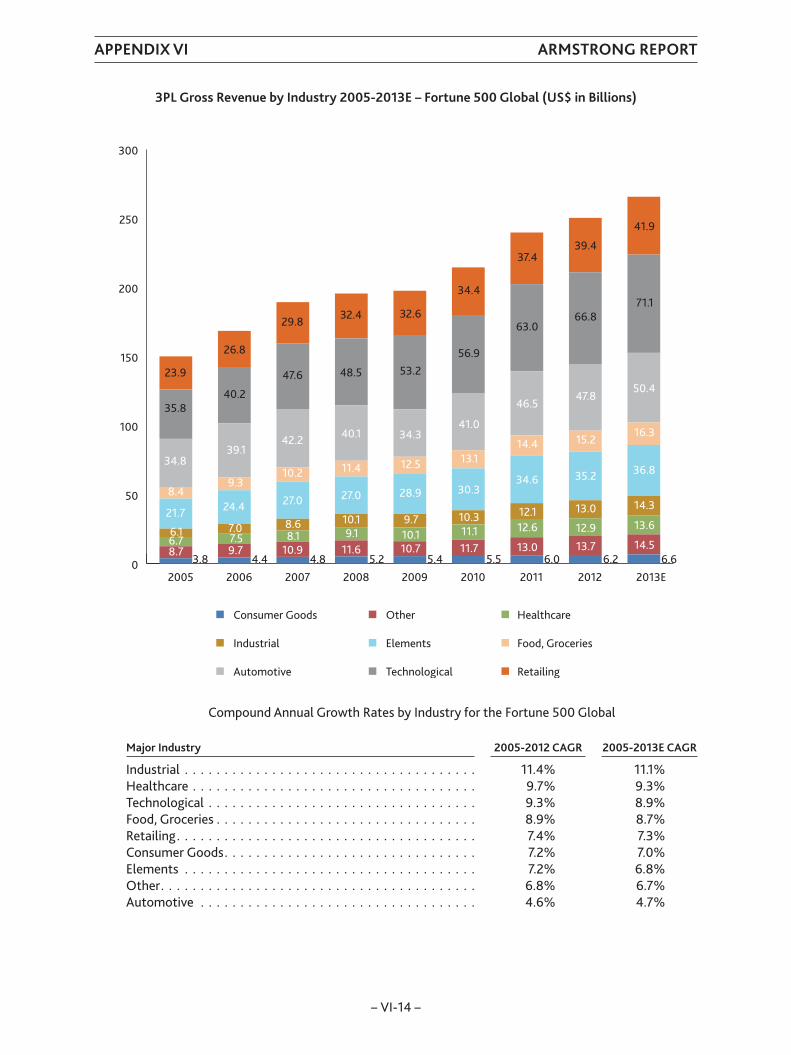
3PL Gross Revenue by Industry 2005-2013E – Fortune 500 Global (US$ in Billions)
0201020092008200720062005 2011 2012 2013E
200
150
100
50
250
300
Consumer Goods
Industrial
Automotive
Other
Elements
Technological
Healthcare
Food, Groceries
Retailing
8.76.76.1
21.7
8.4
34.8
35.8
23.9
3.89.77.57.0
24.4
9.3
39.1
40.2
26.8
4.410.98.18.6
27.0
10.2
42.2
47.6
29.8
4.811.69.1
10.1
27.0
11.4
40.1
48.5
32.4
5.210.710.19.7
28.9
12.5
34.3
53.2
32.6
5.411.711.110.3
30.3
13.1
41.0
56.9
34.4
5.513.0
12.612.1
34.6
14.4
46.5
63.0
37.4
6.013.7
12.9
13.0
35.2
15.2
47.8
66.8
39.4
6.214.5
13.6
14.3
36.8
16.3
50.4
71.1
41.9
6.6
Compound Annual Growth Rates by Industry for the Fortune 500 Global
Major Industry 2005-2012 CAGR 2005-2013E CAGR
Industrial . . . . . . . . . . . . . . . . . . . . . . . . . . . . . . . . . . . . . 11.4% 11.1%Healthcare . . . . . . . . . . . . . . . . . . . . . . . . . . . . . . . . . . . . 9.7% 9.3%Technological . . . . . . . . . . . . . . . . . . . . . . . . . . . . . . . . . . 9.3% 8.9%Food, Groceries . . . . . . . . . . . . . . . . . . . . . . . . . . . . . . . . . 8.9% 8.7%Retailing. . . . . . . . . . . . . . . . . . . . . . . . . . . . . . . . . . . . . . 7.4% 7.3%Consumer Goods. . . . . . . . . . . . . . . . . . . . . . . . . . . . . . . . 7.2% 7.0%Elements . . . . . . . . . . . . . . . . . . . . . . . . . . . . . . . . . . . . . 7.2% 6.8%Other. . . . . . . . . . . . . . . . . . . . . . . . . . . . . . . . . . . . . . . . 6.8% 6.7%Automotive . . . . . . . . . . . . . . . . . . . . . . . . . . . . . . . . . . . 4.6% 4.7%
APPENDIX VI ARMSTRONG REPORT
– VI-14 –
PEOPLE’S REPUBLIC OF CHINA LOGISTICS AND THIRD-PARTY LOGISTICS (3PL) TRENDS
China’s 12th Five-Year plan approved in March, 2011 includes the following objectives which supportthird-party logistics market growth:
• To accelerate the establishment of a social, professional, information-based modern logisticssystem, aggressively develop third-party logistics, prioritise the integration and use of existinglogistics resources, support the construction and linking-up of the logistics infrastructure, improvelogistics efficiency, and reduce logistics costs.
• To promote agricultural products, bulk mineral products, key industrial areas, and other fieldsimportant to the development of logistics.
• To optimise the development of regional distribution systems and support the orderlydevelopment of logistics parks and other cluster areas of logistics.
• To promote the development of modern logistics management and improve the sophisticationand standardisation of logistics.
In developed countries such as the U.S., Hong Kong, Japan, and Singapore transportation infrastructureis relatively homogenous allowing goods to be efficiently transported throughout the country. By contrast,China’s vast disparity in the quality of urban versus rural transportation infrastructure makes managinglogistics more complicated and costly.
Without good transportation infrastructure, transportation costs are higher. In addition, warehousingand inventory carrying costs are higher due to the need to maintain higher levels of inventory closer todemand because of longer delivery cycle times.
In the long-term with governmental support, improved road and rail infrastructure should greatlyreduce China’s overall logistics costs as a percentage of GDP from its current 18% to the 8.5-9% range seenin developed countries. In addition, improved transportation infrastructure will increase asset and laborproductivity within large 3PLs such as Sinotrans and Kerry Logistics who already have significant domesticChinese distribution networks. Less time spent navigating poor roads, or having to utilise alternativetransportation modes (sea, inland waterway, air), will improve transportation routings, reduce operatingcosts, and allow for shorter origin to delivery cycle times. Being able to be quicker to market for retailers,healthcare and other companies will greatly benefit consumers with improved food and grocery productquality, more efficient pharmaceutical and healthcare supply chains, and reduced product shelf times.
By our estimates, there are over 10,000 3PLs operating in China. Many are small and mid-sized providersoperating in only one province. As China’s 3PL market continues to develop, we anticipate increased mergersand acquisition activity and further 3PL market consolidation. As we have seen in the U.S. and Europe, thoselarge 3PLs with established networks will most likely be the acquirers where they can identify a strategic fit.
APPENDIX VI ARMSTRONG REPORT
– VI-15 –

THE GREATER CHINA AND ASEAN LOGISTICS MARKET COMPETITIVE ANALYSIS
Kerry Logistics Greater China and ASEAN Market Distribution Service Capabilities
In the Asia Pacific, the last five years have seen a shift in focus from an export economy to regional andinterregional distribution to address increased consumer spending growth and demand for goods indeveloping countries including China, Indonesia, Malaysia, Thailand, and Vietnam.
In addition, within these countries, buyers of 3PL services tend to trust providers with their own assetsversus contracted warehousing or transportation capacity. This preference has limited the growth of 3PLswho have been unwilling to invest capital in trucking, which accounts for approximately 44% of total logisticsspend in Asia Pacific, and warehouses, which accounts for approximately 9% of total logistic spend in AsiaPacific. By comparison, companies such as Kerry Logistics, CEVA Logistics, and DHL Supply Chain & GlobalForwarding have experienced significant growth via an asset-based model.
With transportation assets of over 6,000 trucks operating in its Greater China and ASEAN market and29.3 million sq.ft. of warehouse space as at 31 December 2012, Kerry Logistics has built a significant leadingwarehousing and distribution footprint. The 29.3 million sq.ft. under management represents the largestwarehouse network in Greater China and ASEAN — the next largest are CEVA Logistics, Sinotrans, DHL SupplyChain & Global Forwarding, and Yusen Logistics with 20.0 million, 18.9 million, 17.1 million and 13.1 millionsq.ft. respectively. Moreover the majority of its warehousing footprint is owned versus leased which plays wellwith customers in Asia who tend to trust providers with assets more than those who rely on contractedcapacity. As such, Kerry Logistics has built a significant competitive advantage being able to effectivelywarehouse and distribute product within the region from China to Hong Kong, Vietnam, Thailand, andSingapore. Most of its major competitors have lesser regional distribution capabilities and are often limited todistributing goods within a country, or subcontracting significant volumes of carrier (trucking) capacity tofacilitate transportation which decreases the amount of control over end-to-end transportationperformance. In terms of gross and net revenues, we estimate that Kerry Logistics ranks as one of the fivelargest.
APPENDIX VI ARMSTRONG REPORT
– VI-16 –
Greater China
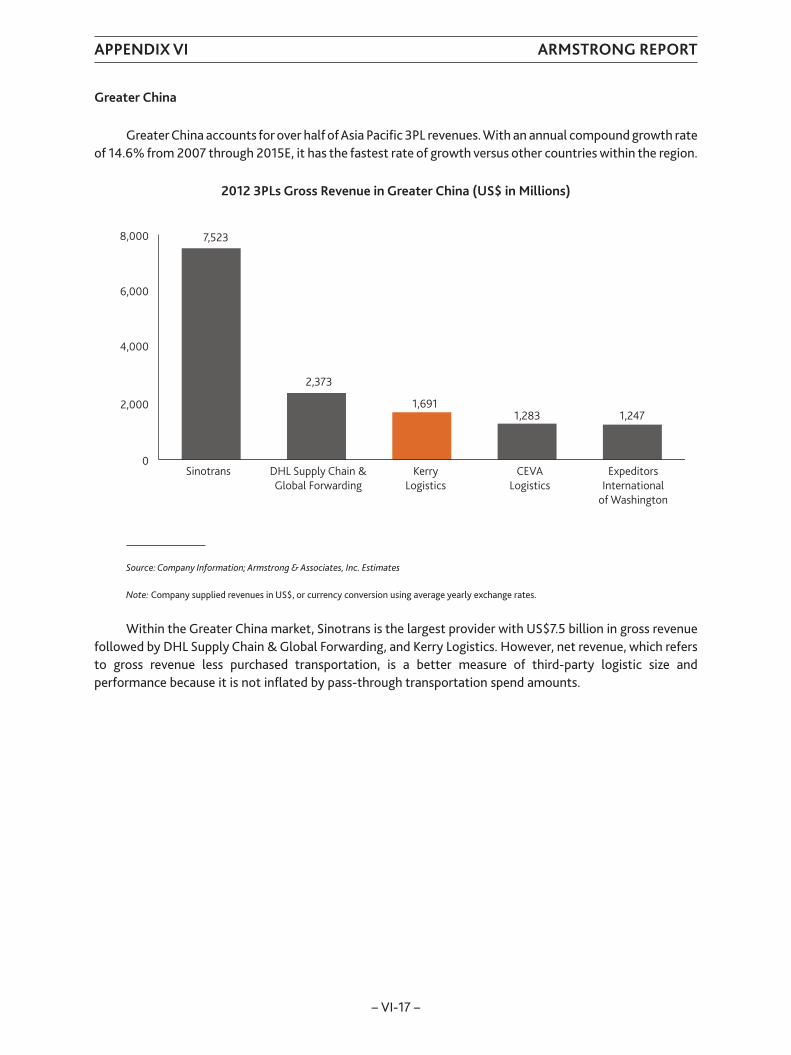
Greater China accounts for over half of Asia Pacific 3PL revenues. With an annual compound growth rateof 14.6% from 2007 through 2015E, it has the fastest rate of growth versus other countries within the region.
2012 3PLs Gross Revenue in Greater China (US$ in Millions)
0Sinotrans DHL Supply Chain &
Global ForwardingKerry
LogisticsCEVA
LogisticsExpeditors
Internationalof Washington
2,000
6,000
4,000
8,000 7,523
2,373
1,6911,283 1,247
Source: Company Information; Armstrong & Associates, Inc. Estimates
Note: Company supplied revenues in US$, or currency conversion using average yearly exchange rates.
Within the Greater China market, Sinotrans is the largest provider with US$7.5 billion in gross revenuefollowed by DHL Supply Chain & Global Forwarding, and Kerry Logistics. However, net revenue, which refersto gross revenue less purchased transportation, is a better measure of third-party logistic size andperformance because it is not inflated by pass-through transportation spend amounts.
APPENDIX VI ARMSTRONG REPORT
– VI-17 –
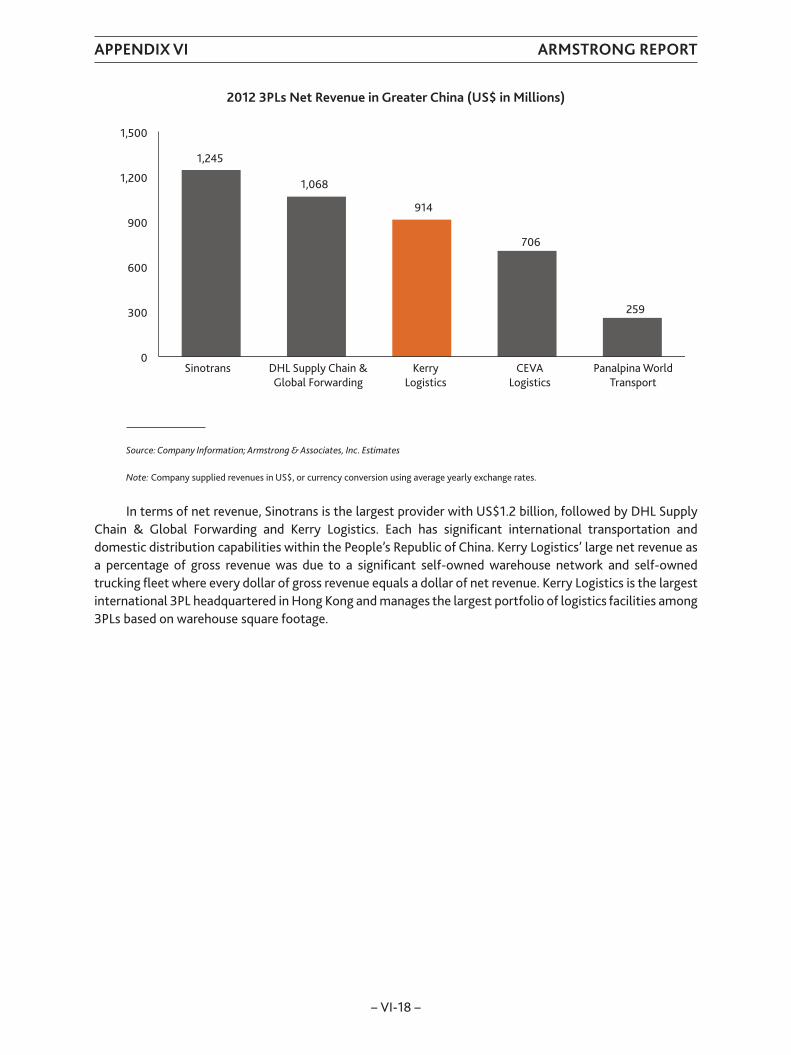
2012 3PLs Net Revenue in Greater China (US$ in Millions)
0Sinotrans DHL Supply Chain &
Global ForwardingKerry
LogisticsCEVA
LogisticsPanalpina World
Transport
300
600
1,200
900
1,500
1,245
1,068
914
706
259
Source: Company Information; Armstrong & Associates, Inc. Estimates
Note: Company supplied revenues in US$, or currency conversion using average yearly exchange rates.
In terms of net revenue, Sinotrans is the largest provider with US$1.2 billion, followed by DHL SupplyChain & Global Forwarding and Kerry Logistics. Each has significant international transportation anddomestic distribution capabilities within the People’s Republic of China. Kerry Logistics’ large net revenue asa percentage of gross revenue was due to a significant self-owned warehouse network and self-ownedtrucking fleet where every dollar of gross revenue equals a dollar of net revenue. Kerry Logistics is the largestinternational 3PL headquartered in Hong Kong and manages the largest portfolio of logistics facilities among3PLs based on warehouse square footage.
APPENDIX VI ARMSTRONG REPORT
– VI-18 –
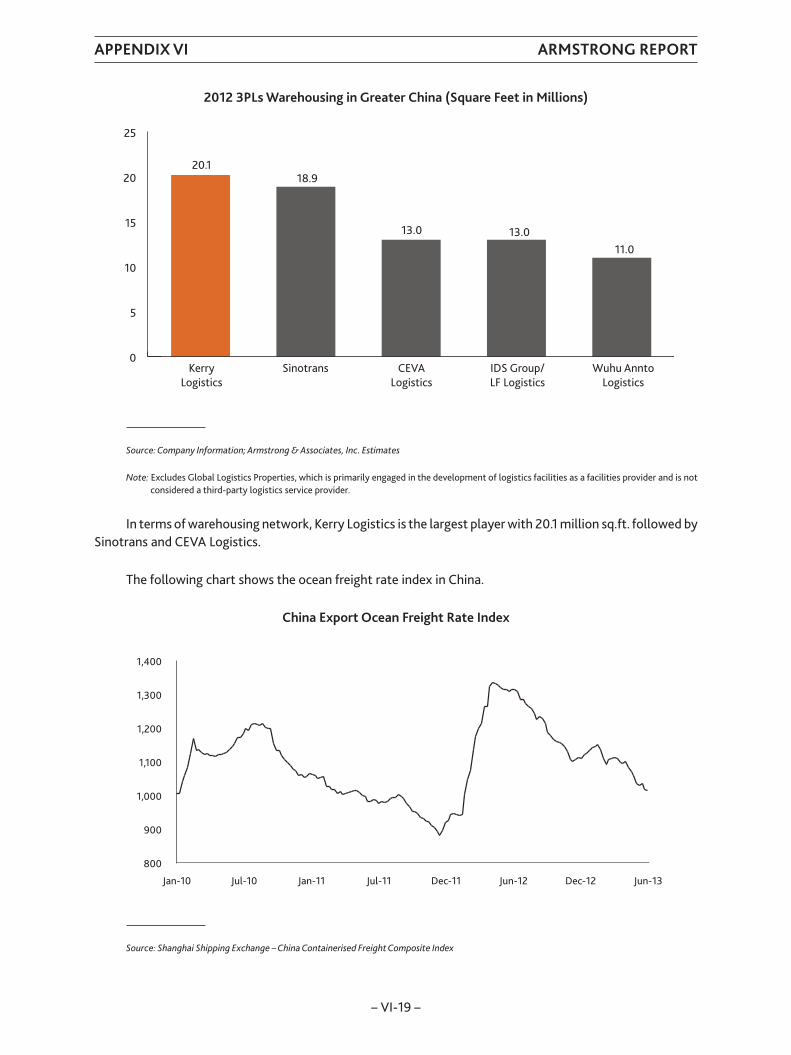
2012 3PLs Warehousing in Greater China (Square Feet in Millions)
0SinotransKerry
LogisticsCEVA
LogisticsIDS Group/LF Logistics
Wuhu AnntoLogistics
5
15
20
10
25
20.118.9
13.0 13.011.0
Source: Company Information; Armstrong & Associates, Inc. Estimates
Note: Excludes Global Logistics Properties, which is primarily engaged in the development of logistics facilities as a facilities provider and is notconsidered a third-party logistics service provider.
In terms of warehousing network, Kerry Logistics is the largest player with 20.1 million sq.ft. followed bySinotrans and CEVA Logistics.
The following chart shows the ocean freight rate index in China.
China Export Ocean Freight Rate Index
1,000
1,100
800
Jan-10 Jul-10 Jan-11 Jul-11 Dec-11 Jun-12 Dec-12 Jun-13
900
1,300
1,200
1,400
Source: Shanghai Shipping Exchange – China Containerised Freight Composite Index
APPENDIX VI ARMSTRONG REPORT
– VI-19 –
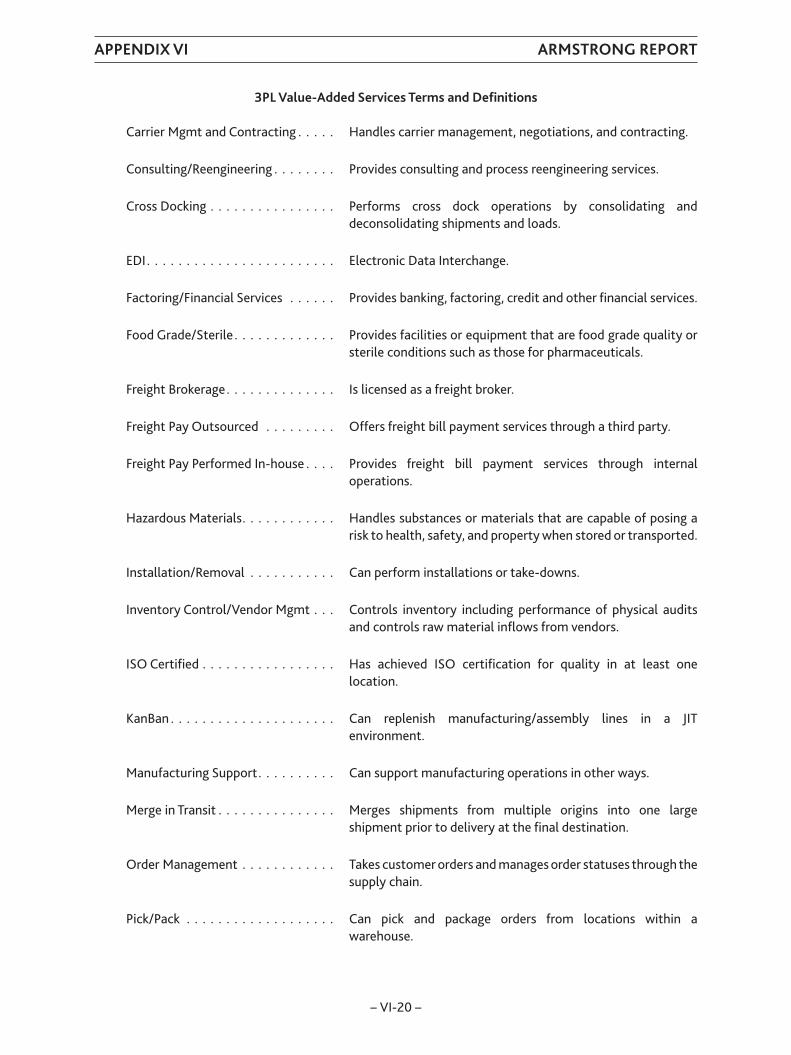
3PL Value-Added Services Terms and Definitions
Carrier Mgmt and Contracting . . . . . Handles carrier management, negotiations, and contracting.
Consulting/Reengineering . . . . . . . . Provides consulting and process reengineering services.
Cross Docking . . . . . . . . . . . . . . . . Performs cross dock operations by consolidating anddeconsolidating shipments and loads.
EDI . . . . . . . . . . . . . . . . . . . . . . . . Electronic Data Interchange.
Factoring/Financial Services . . . . . . Provides banking, factoring, credit and other financial services.
Food Grade/Sterile . . . . . . . . . . . . . Provides facilities or equipment that are food grade quality orsterile conditions such as those for pharmaceuticals.
Freight Brokerage. . . . . . . . . . . . . . Is licensed as a freight broker.
Freight Pay Outsourced . . . . . . . . . Offers freight bill payment services through a third party.
Freight Pay Performed In-house . . . . Provides freight bill payment services through internaloperations.
Hazardous Materials. . . . . . . . . . . . Handles substances or materials that are capable of posing arisk to health, safety, and property when stored or transported.
Installation/Removal . . . . . . . . . . . Can perform installations or take-downs.
Inventory Control/Vendor Mgmt . . . Controls inventory including performance of physical auditsand controls raw material inflows from vendors.
ISO Certified . . . . . . . . . . . . . . . . . Has achieved ISO certification for quality in at least onelocation.
KanBan . . . . . . . . . . . . . . . . . . . . . Can replenish manufacturing/assembly lines in a JITenvironment.
Manufacturing Support. . . . . . . . . . Can support manufacturing operations in other ways.
Merge in Transit . . . . . . . . . . . . . . . Merges shipments from multiple origins into one largeshipment prior to delivery at the final destination.
Order Management . . . . . . . . . . . . Takes customer orders and manages order statuses through thesupply chain.
Pick/Pack . . . . . . . . . . . . . . . . . . . Can pick and package orders from locations within awarehouse.
APPENDIX VI ARMSTRONG REPORT
– VI-20 –
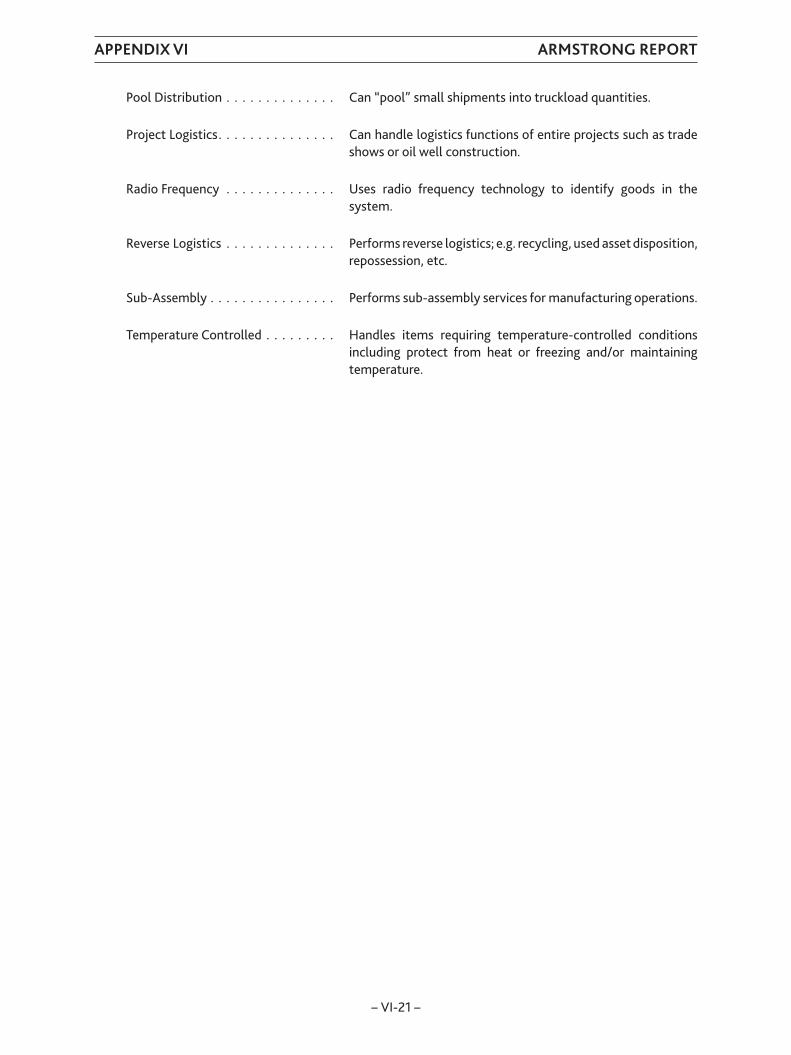
Pool Distribution . . . . . . . . . . . . . . Can “pool” small shipments into truckload quantities.
Project Logistics. . . . . . . . . . . . . . . Can handle logistics functions of entire projects such as tradeshows or oil well construction.
Radio Frequency . . . . . . . . . . . . . . Uses radio frequency technology to identify goods in thesystem.
Reverse Logistics . . . . . . . . . . . . . . Performs reverse logistics; e.g. recycling, used asset disposition,repossession, etc.
Sub-Assembly . . . . . . . . . . . . . . . . Performs sub-assembly services for manufacturing operations.
Temperature Controlled . . . . . . . . . Handles items requiring temperature-controlled conditionsincluding protect from heat or freezing and/or maintainingtemperature.
APPENDIX VI ARMSTRONG REPORT
– VI-21 –
Copyright © 2022 FDOKUMEN