MARKET ANALYSIS FOR TRAIN CONCEPTS BETWEEN ...
35
MARKET ANALYSIS FOR TRAIN CONCEPTS BETWEEN SCANDINAVIA AND TURKEY VIA THE PORT OF ROSTOCK Elaborated by: DB Engineering & Consulting, Hanseatic Transport Consultancy Version 1.0 11 2020
-
Upload
khangminh22 -
Category
Documents
-
view
2 -
download
0
Transcript of MARKET ANALYSIS FOR TRAIN CONCEPTS BETWEEN ...
MARKET ANALYSIS FOR TRAIN CONCEPTS BETWEEN SCANDINAVIA AND TURKEY VIA THE PORT OF ROSTOCK
Elaborated by:
DB Engineering & Consulting,
Hanseatic Transport Consultancy
Version 1.0
11 2020
Page 2
Index
1. Executive Summary .................................................................................. 6
2. Transport and Market Analysis .................................................................... 7
2.1. Methodology of Market Analysis ................................................................ 7
2.2. Current Transport Offers on the Corridor ................................................... 10
2.2.1. Baltic Ferry Connections to Scandinavia / Finland ..................................... 10
2.2.2. Rostock’s intermodal Hinterland Network ............................................... 11
2.3. Cargo Flows on the Corridor ................................................................... 12
2.3.1. Characterisation of Goods Flows on the Corridor ....................................... 13
2.3.2. Imports to Nordic Countries from Turkey ................................................ 13
2.3.3. Exports from Nordic Countries to Turkey ................................................ 15
2.3.4. Economic Outlook for Scandinavia and Turkey .......................................... 18
2.4. Potential for an Intermodal Product on the Corridor ..................................... 20
2.4.1. Intermodal connections from/to Turkey .................................................. 20
2.4.2. Structure of the Intermodal Transport Market .......................................... 20
2.4.3. Intermodal Development Potential and Corridor Assessment ........................ 22
3. Train Concept ........................................................................................ 27
3.1. Recommended Intermodal Terminals ........................................................ 27
3.2. Train Routing and Frequency .................................................................. 30
3.3. Train Composition intermodal Wagons ....................................................... 32
3.4. Cost Estimatation ................................................................................. 33
4. Market Penetration ................................................................................. 34
4.1. Market Requirements for the Intermodal Product along the Corridor ................ 34
4.2. Opportunities and Risks from the Market Perspective ................................... 34
4.3. Suggested steps for Marketing of the Intermodal Product ............................... 34
Page 3
List of Figures
Figure 1: Impression Port of Rostock .......................................................................................7
Figure 2 Interview Process ...................................................................................................7
Figure 3 Interviewed market players .......................................................................................8
Figure 4: Sample questionnaire used for interviews during market analysis .......................................9
Figure 5: Current ferry connections from/to Rostock as of autumn 2020 ......................................... 10
Figure 6: Ferry connection from Eastern Baltic Sea ports ............................................................ 11
Figure 7: Ferry and intermodal connections from/to Rostock ....................................................... 12
Figure 8: Catchment area of the transport analysis covering the Scandinavian countries Sweden, Denmark
and Norway as well as Turkey ............................................................................................. 13
Figure 9: Development of Imports from Turkey to Scandinavia ..................................................... 14
Figure 11: Modal Split for transports from Turkey to Scandinavia .................................................. 15
Figure 12: Trade volumes and structure from Turkey to Scandinavia .............................................. 15
Figure 13: Development of Exports from Scandinavia to Turkey between 2015 and 2019 ..................... 16
Figure 14: Modal Split for transports from Scandinavia to Turkey .................................................. 17
Figure 15: Trade volumes and structure from Sweden, Norway and Denmark to Turkey....................... 18
Figure 16: Development of the GDP growth (constant prices) between 2019 and 2030 in % .................. 18
Figure 17: Development of total population in Turkey, Sweden, Norway and Denmark between 2019 and
2030 ............................................................................................................................ 19
Figure 18: Development of exchange rate Turkish Lira/Euro (2011-2019) ........................................ 19
Figure 19: Intermodal corridors from/to Turkey ....................................................................... 20
Figure 20: Main ferry connections to/from Turkey .................................................................... 21
Figure 21: Rail Cargo Operator train schedule to/from Istanbul/Halkali as of autumn 2020 .................. 21
Figure 22: Hupac train schedule to/from Istanbul/Halkali as of autumn 2020 ................................... 22
Figure 23: Key messages regarding commodity types and transport volume ..................................... 22
Figure 24: Key messages regarding general and transport related obstacles ..................................... 23
Figure 25: Key messages regarding rail transport potential and rail specific obstacles ........................ 23
Figure 26: Key messages regarding minimum requirements and shift to Rostock ............................... 24
Figure 27: Key messages regarding implementation and funding options ......................................... 25
Figure 28: Key messages regarding additional remarks ............................................................... 25
Figure 29: Assessment of multimodal corridor via Trieste ........................................................... 26
Figure 30: Assessment of land corridor .................................................................................. 26
Figure 31: Relevant Intermodal Terminals in Turkey.................................................................. 27
Figure 32: Relevant Rail Terminals in Turkey .......................................................................... 27
Figure 33: Terminal characteristics Halkali ............................................................................. 28
Figure 34: Terminal characteristics Çerkezköy ......................................................................... 28
Page 4
Figure 35: Intermodal terminal network in Scandinavia .............................................................. 29
Figure 36: Terminal characteristics Railport Arad ..................................................................... 30
Figure 37: Terminal characteristics Budapest Bilk ..................................................................... 30
Figure 38: Transport chain with key infrastructure, equipment and estimated duration ...................... 31
Figure 39: Possible routing of the new service ......................................................................... 31
Figure 40: Sample pocket wagon Sdggmrss – T3000 ................................................................... 32
Figure 41: Sample platform wagon Sggmrs(s) 90‘ ...................................................................... 32
Figure 42: Draft of a first product sheet ................................................................................ 35

Page 5
List of Tables
Table 1: Wagon characteristics ........................................................................................... 33
Table 2: Indication of train costs for different routings .............................................................. 33
Page 6
1. Executive Summary
This study analyses the potential for new train products and connection between Scandinavia and Turkey
via the Port of Rostock. Using the ferry link between Sweden particularly the high frequent services to
Trelleborg Finland and the port of Rostock, RoRo units (in the meaning of trailer and other unaccompanied
transport equipment) or conventional rail cars could be either directly carried on by train to an intermodal
terminal in Turkey or and transported via a hub terminal location on the route e.g. Budapest on the so-
called “land route”. As an alternative also the “intermodal route” via an Italian port e.g. Trieste has been
investigated. Based on analysis of different sources and a large number of interviews with representatives
of key market players along the corridor allowed the elaboration of the market potential, the design of a
competitive intermodal product, the assessment opportunities and risks of such an intermodal product as
well as a selection of potential partners for the market penetration and product implementation.
The main findings can be summarised as follows:
Transport and Market Analysis
• Turkish economy faces a historic downturn, weak currency and thus fluctuating demand and
insecurity regarding funding and implementation of big infrastructure projects are considered as
threats.
• Due to the imbalanced flows for relevant commodities, adequate utilization in both directions will
be a challenge and triangular services or hubs as bundling points may be considered.
• Despite Corona it is a challenging period to establish a new service in the market; Covid-19 pandemic
created window of opportunity as rail services are associated with operational stability
• Strong intermodal competition through “neighbouring” Baltic ports such as Swinoujscie,
Gdansk/Gdynia and the Baltic States (“cheap trucking” and German Baltic ports Luebeck (own
intermodal operator for potential risk share) and Kiel (direct connection to Gothenburg)
• Monopolistic structures determine the established intermodal network via Italian ports (“multimodal
route”) especially medium-sized/smaller market players search for alternatives.
• “Land route” is only partly exploited by today main player is Rail Cargo Group with high affinity to
South-Eastern European market; only Hupac as alternative operator provides regular services.
• The market requirement for transit time Turkey (Istanbul)-Rostock are 5-7 days at least 3 departures
per week as well as open train concepts and neutral operator to potentially attract cargo from most
relevant market players are required.
Train Concept
• Train routing to Turkey via Serbia is the cheapest option but corridor via Romania assessed as a
more reliable and safer alternative; Halkali is considered as the best terminal option in Turkey.
• Due to uncertainties in volumes, market requirements and the anticipated cost for a direct train on
the land corridor, a hub concept is recommended at the first stage and can further be developed to
a direct service
Market Penetration
• Potential users and partners: some ferry lines and several forwarders show strong interest and could
act as anchor user that takes (utilization) risk; several Turkish forwarders and global players
addressed their interest. An operator with an established network on the relevant corridor is
considered as the first choice.
Page 7
2. Transport and Market Analysis
2.1. Methodology of Market Analysis
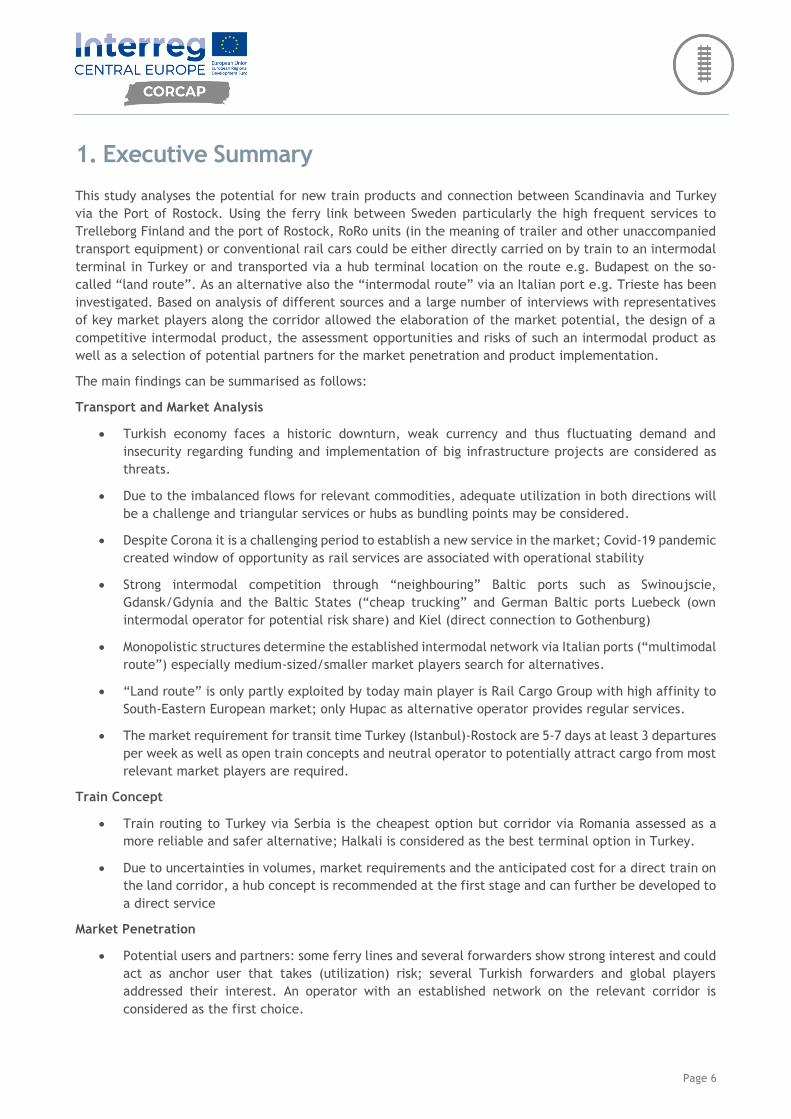
Rostock is a multi-purpose port with a strong focus on ferry and ro-ro traffic. Apart from the ferry
connections, the attractiveness of the port relies strongly on efficient railway connections to the continental
source and to target regions of intermodal traffic flows.
Figure 1: Impression Port of Rostock
In the following market analysis, an overview of the current and future market for intermodal and
conventional transports between Turkey and Scandinavia will be provided. As an outcome, this analysis will
be the base for train concepts between Turkey and the port of Rostock. Both desk research as well as
interviews with key market players and experts form the basis of the market analysis. An evaluation of the
information provided by relevant stakeholders, statistic authorities, the EU, and similar sources allowed the
identification of a relevant potential for conventional rail and intermodal transports on the corridor. More
than 20 interviews with representatives of the below listed companies enabled the assessment of market
interest in an intermodal product, volume potential and market requirements, e.g. quality, transit time,
frequency and pricing.
The interview process followed a standardised procedure presented in the figure below.
Figure 2 Interview Process
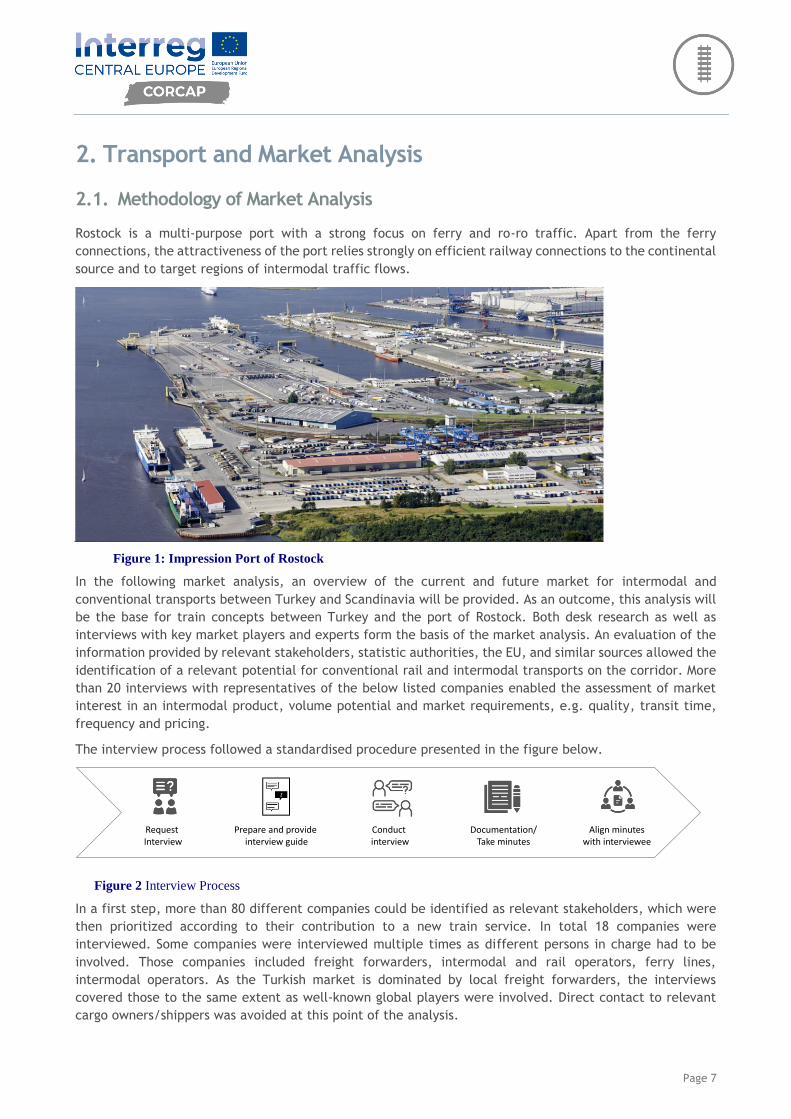
In a first step, more than 80 different companies could be identified as relevant stakeholders, which were
then prioritized according to their contribution to a new train service. In total 18 companies were
interviewed. Some companies were interviewed multiple times as different persons in charge had to be
involved. Those companies included freight forwarders, intermodal and rail operators, ferry lines,
intermodal operators. As the Turkish market is dominated by local freight forwarders, the interviews
covered those to the same extent as well-known global players were involved. Direct contact to relevant
cargo owners/shippers was avoided at this point of the analysis.
Request Interview
Prepare and provide interview guide
Conduct interview
Documentation/Take minutes
Align minutes with interviewee
Page 8
Figure 3 Interviewed market players
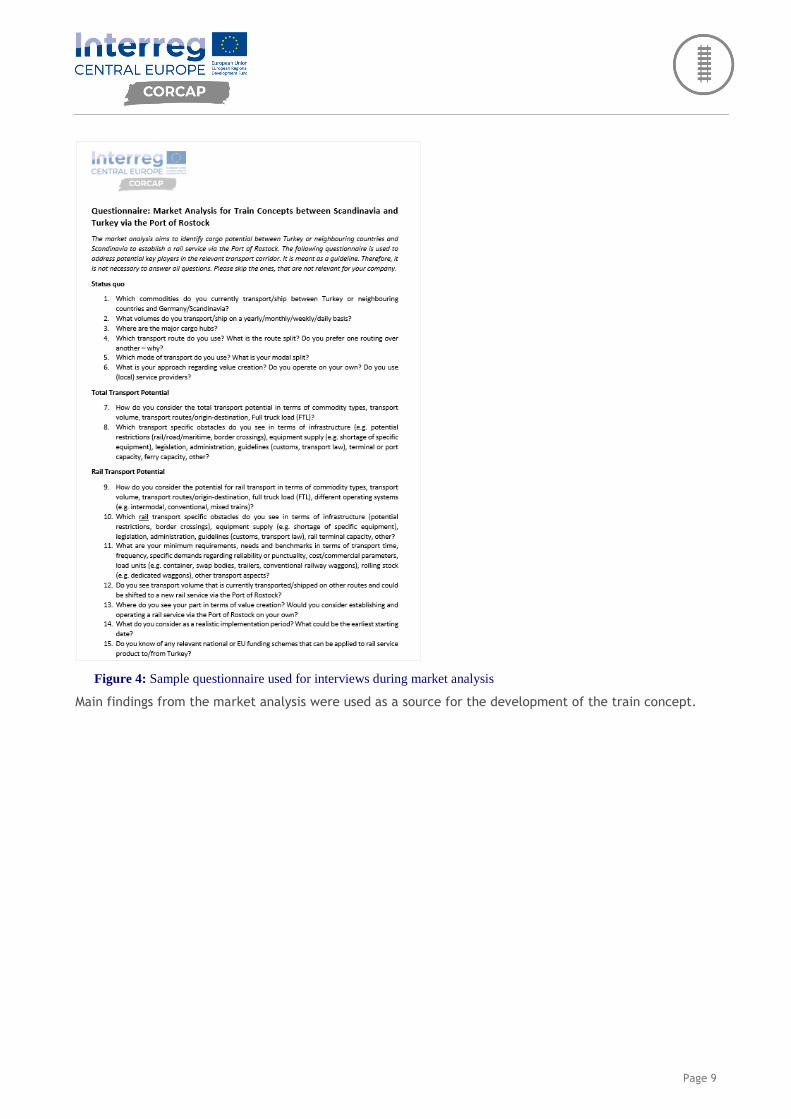
The interview followed a standardized questionnaire which was sent to the potential interviewee prior to
the interview date and used as a guideline in the interview process. The questions covered various aspects
such as status quo (company specific), total transport potential, rail transport potential, commodity mix,
transport volume, major cargo hubs: origin-destination, transport routing, modal split, role in the transport
chain, obstacles, minimum requirements, implementation period/starting date, knowledge on
existing/planned funding schemes etc. Shortly after the interview, a summary was prepared and sent to the
interviewee for confirmation.
Page 9
Figure 4: Sample questionnaire used for interviews during market analysis
Main findings from the market analysis were used as a source for the development of the train concept.
Page 10
2.2. Current Transport Offers on the Corridor
2.2.1. Baltic Ferry Connections to Scandinavia / Finland
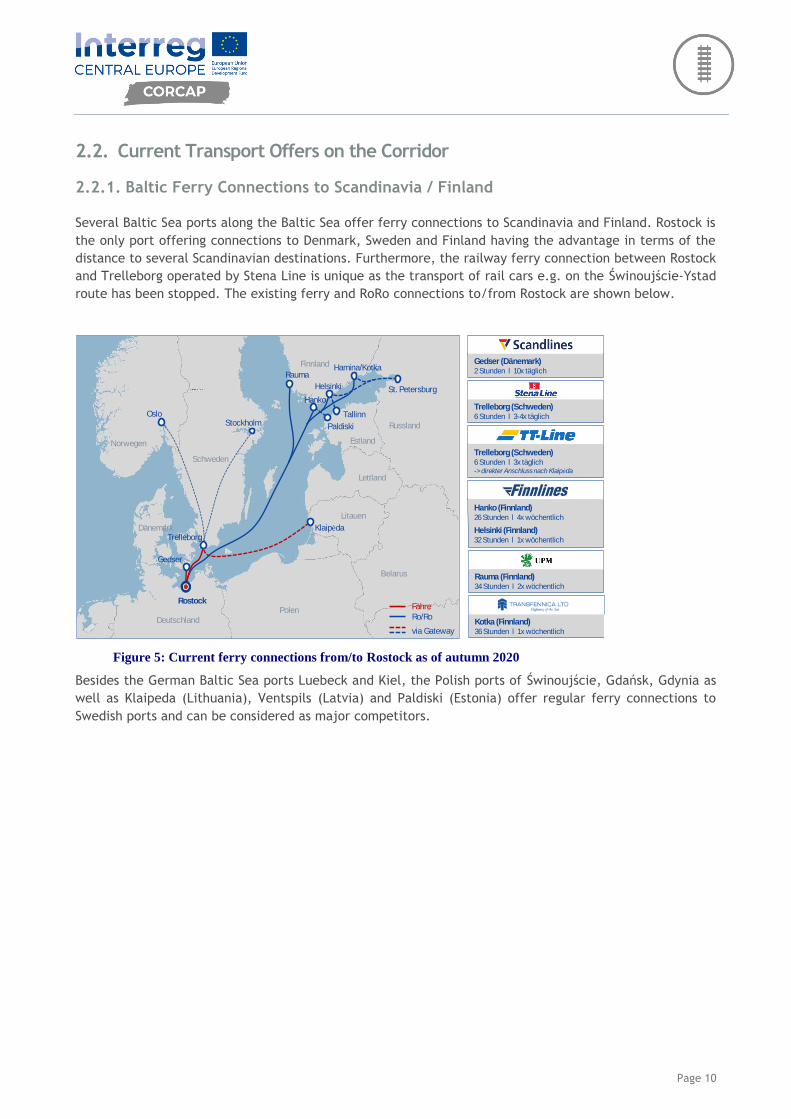
Several Baltic Sea ports along the Baltic Sea offer ferry connections to Scandinavia and Finland. Rostock is
the only port offering connections to Denmark, Sweden and Finland having the advantage in terms of the
distance to several Scandinavian destinations. Furthermore, the railway ferry connection between Rostock
and Trelleborg operated by Stena Line is unique as the transport of rail cars e.g. on the Świnoujście-Ystad
route has been stopped. The existing ferry and RoRo connections to/from Rostock are shown below.
Figure 5: Current ferry connections from/to Rostock as of autumn 2020
Besides the German Baltic Sea ports Luebeck and Kiel, the Polish ports of Świnoujście, Gdańsk, Gdynia as
well as Klaipeda (Lithuania), Ventspils (Latvia) and Paldiski (Estonia) offer regular ferry connections to
Swedish ports and can be considered as major competitors.
Trelleborg (Schweden)6 Stunden l 3-4x täglich
Trelleborg (Schweden)6 Stunden l 3x täglich-> direkter Anschluss nach Klaipėda
Gedser (Dänemark)2 Stunden l 10x täglich
Hanko(Finnland)26 Stunden l 4x wöchentlich
Helsinki (Finnland)32 Stunden l 1x wöchentlich
Kotka (Finnland)36 Stunden l 1x wöchentlich
Rauma (Finnland)34 Stunden l 2x wöchentlich
Dänemark
Norwegen
Schweden
DeutschlandPolen
Litauen
Lettland
Estland
Finnland
Russland
St. Petersburg
Hamina/Kotka
Helsinki
Rauma
Hanko
Oslo
Gedser
Rostock
Klaipėda
Belarus
Tallinn
PaldiskiStockholm
Fähre
Ro/Ro
via Gateway
Trelleborg
Page 11
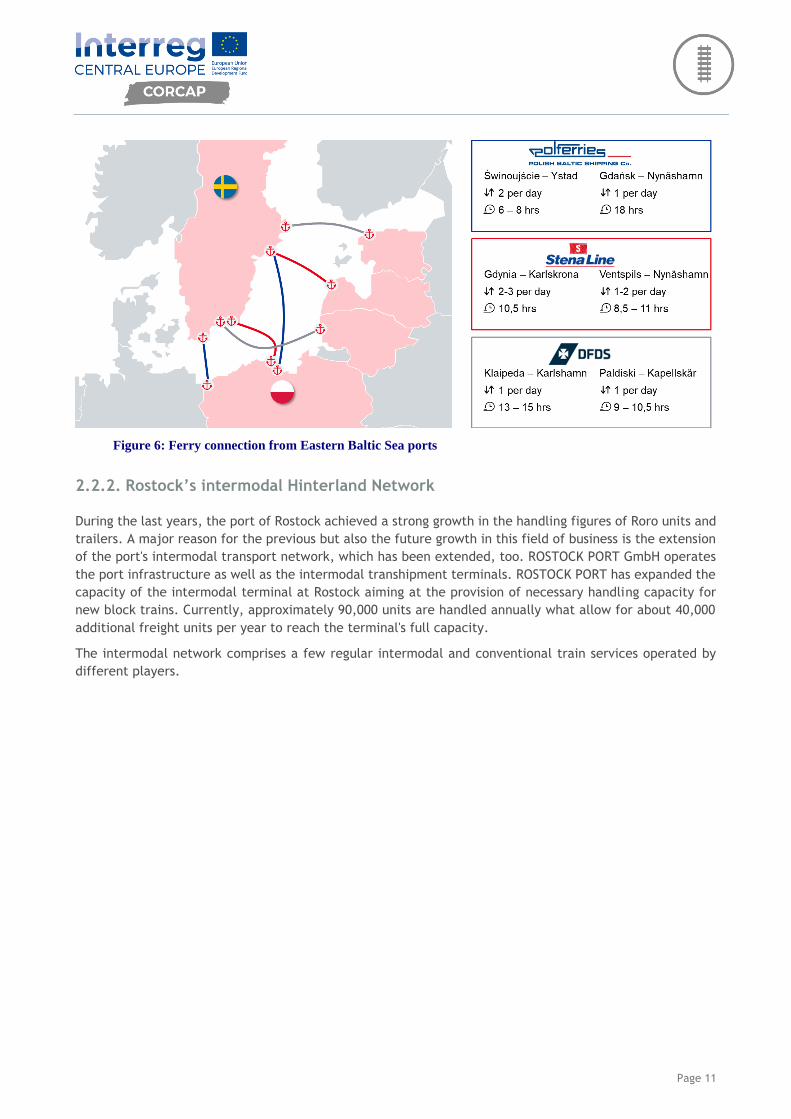
Figure 6: Ferry connection from Eastern Baltic Sea ports
2.2.2. Rostock’s intermodal Hinterland Network
During the last years, the port of Rostock achieved a strong growth in the handling figures of Roro units and
trailers. A major reason for the previous but also the future growth in this field of business is the extension
of the port's intermodal transport network, which has been extended, too. ROSTOCK PORT GmbH operates
the port infrastructure as well as the intermodal transhipment terminals. ROSTOCK PORT has expanded the
capacity of the intermodal terminal at Rostock aiming at the provision of necessary handling capacity for
new block trains. Currently, approximately 90,000 units are handled annually what allow for about 40,000
additional freight units per year to reach the terminal's full capacity.
The intermodal network comprises a few regular intermodal and conventional train services operated by
different players.
Page 12
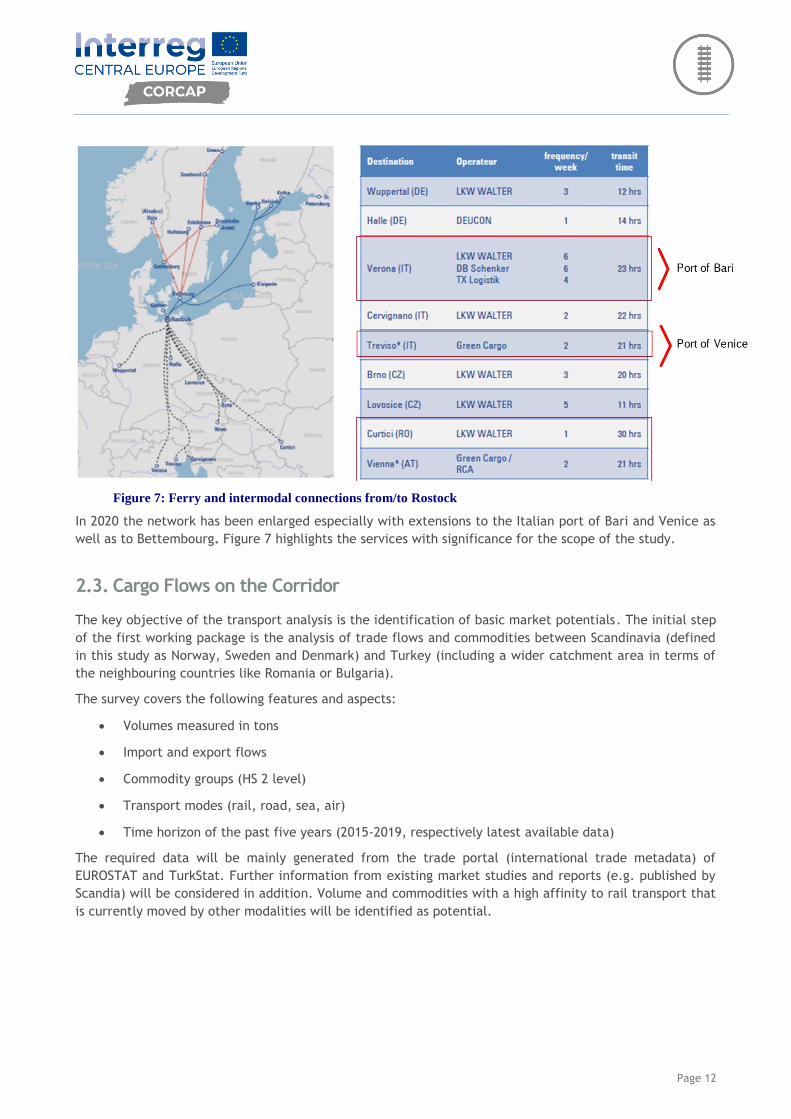
Figure 7: Ferry and intermodal connections from/to Rostock
In 2020 the network has been enlarged especially with extensions to the Italian port of Bari and Venice as
well as to Bettembourg. Figure 7 highlights the services with significance for the scope of the study.
2.3. Cargo Flows on the Corridor
The key objective of the transport analysis is the identification of basic market potentials. The initial step
of the first working package is the analysis of trade flows and commodities between Scandinavia (defined
in this study as Norway, Sweden and Denmark) and Turkey (including a wider catchment area in terms of
the neighbouring countries like Romania or Bulgaria).
The survey covers the following features and aspects:
• Volumes measured in tons
• Import and export flows
• Commodity groups (HS 2 level)
• Transport modes (rail, road, sea, air)
• Time horizon of the past five years (2015-2019, respectively latest available data)
The required data will be mainly generated from the trade portal (international trade metadata) of
EUROSTAT and TurkStat. Further information from existing market studies and reports (e.g. published by
Scandia) will be considered in addition. Volume and commodities with a high affinity to rail transport that
is currently moved by other modalities will be identified as potential.
Page 13
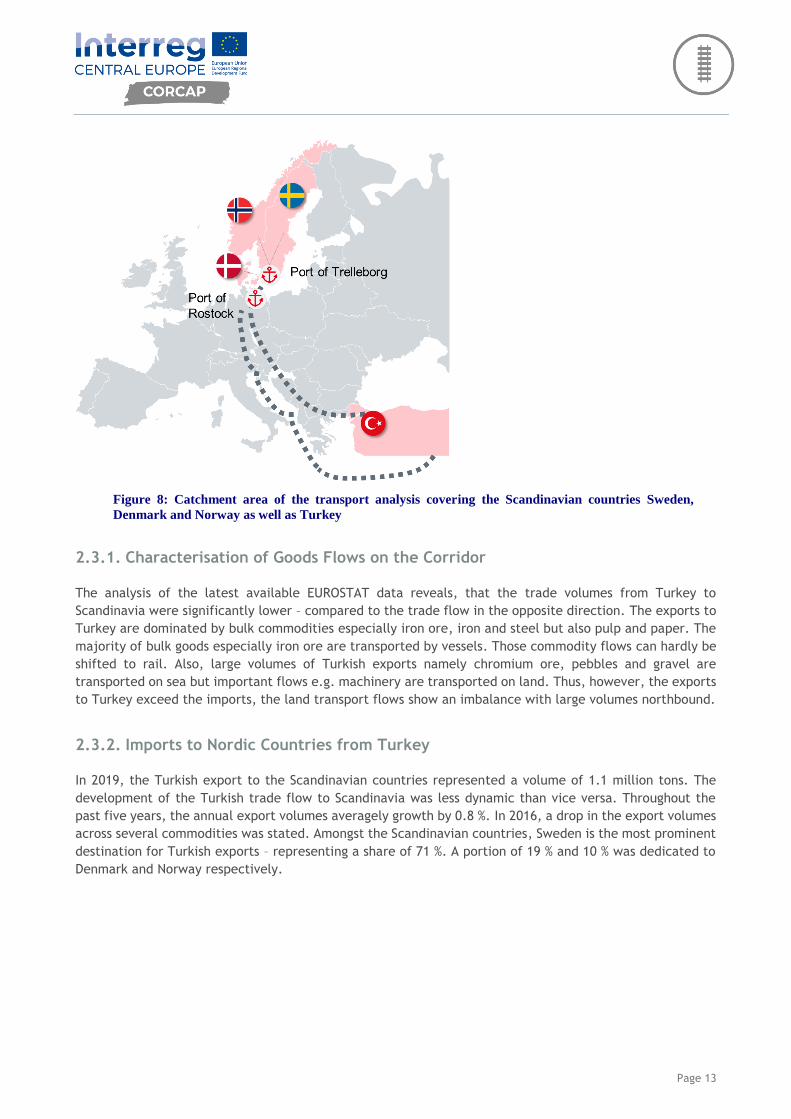
Figure 8: Catchment area of the transport analysis covering the Scandinavian countries Sweden,
Denmark and Norway as well as Turkey
2.3.1. Characterisation of Goods Flows on the Corridor
The analysis of the latest available EUROSTAT data reveals, that the trade volumes from Turkey to
Scandinavia were significantly lower – compared to the trade flow in the opposite direction. The exports to
Turkey are dominated by bulk commodities especially iron ore, iron and steel but also pulp and paper. The
majority of bulk goods especially iron ore are transported by vessels. Those commodity flows can hardly be
shifted to rail. Also, large volumes of Turkish exports namely chromium ore, pebbles and gravel are
transported on sea but important flows e.g. machinery are transported on land. Thus, however, the exports
to Turkey exceed the imports, the land transport flows show an imbalance with large volumes northbound.
2.3.2. Imports to Nordic Countries from Turkey
In 2019, the Turkish export to the Scandinavian countries represented a volume of 1.1 million tons. The
development of the Turkish trade flow to Scandinavia was less dynamic than vice versa. Throughout the
past five years, the annual export volumes averagely growth by 0.8 %. In 2016, a drop in the export volumes
across several commodities was stated. Amongst the Scandinavian countries, Sweden is the most prominent
destination for Turkish exports – representing a share of 71 %. A portion of 19 % and 10 % was dedicated to
Denmark and Norway respectively.
Page 14
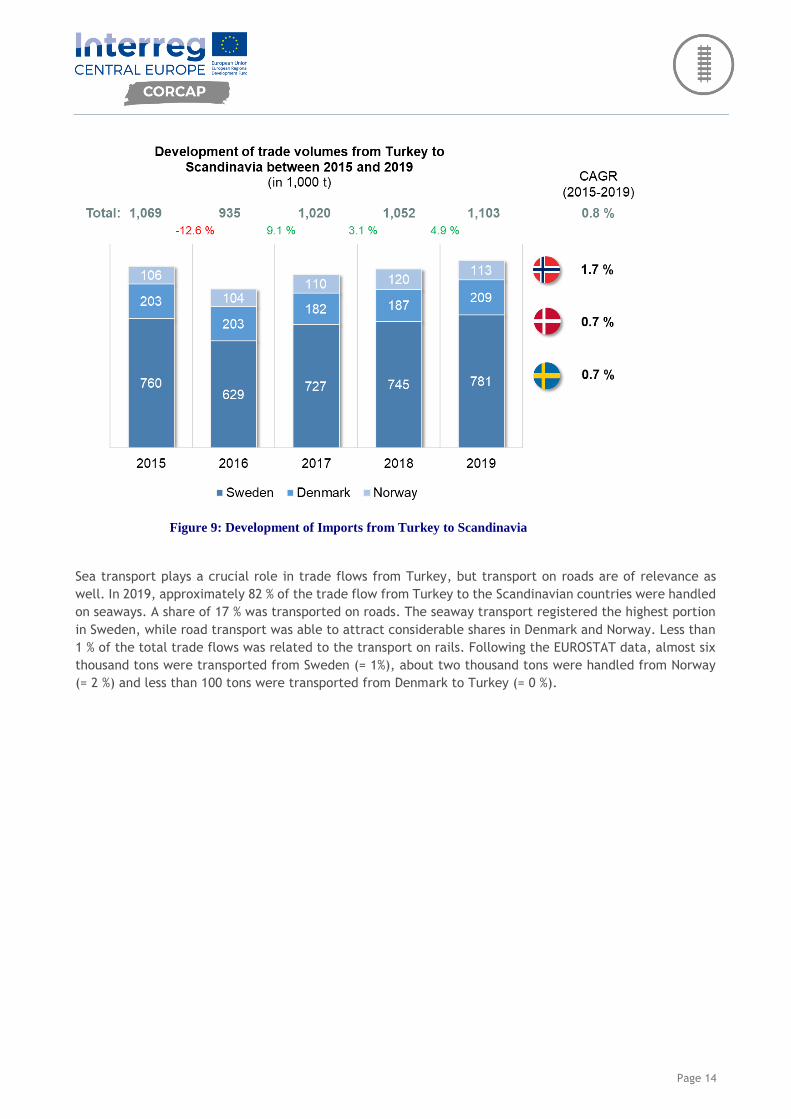
Figure 9: Development of Imports from Turkey to Scandinavia
Sea transport plays a crucial role in trade flows from Turkey, but transport on roads are of relevance as
well. In 2019, approximately 82 % of the trade flow from Turkey to the Scandinavian countries were handled
on seaways. A share of 17 % was transported on roads. The seaway transport registered the highest portion
in Sweden, while road transport was able to attract considerable shares in Denmark and Norway. Less than
1 % of the total trade flows was related to the transport on rails. Following the EUROSTAT data, almost six
thousand tons were transported from Sweden (= 1%), about two thousand tons were handled from Norway
(= 2 %) and less than 100 tons were transported from Denmark to Turkey (= 0 %).
Page 15
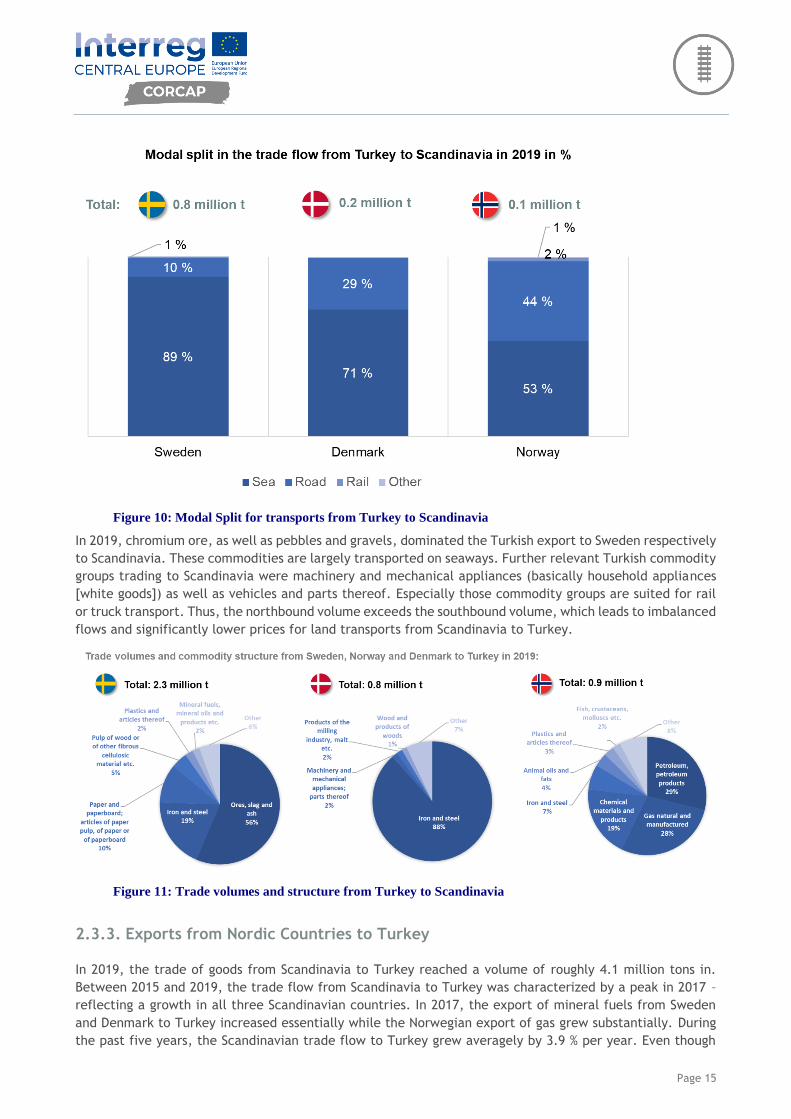
Figure 10: Modal Split for transports from Turkey to Scandinavia
In 2019, chromium ore, as well as pebbles and gravels, dominated the Turkish export to Sweden respectively
to Scandinavia. These commodities are largely transported on seaways. Further relevant Turkish commodity
groups trading to Scandinavia were machinery and mechanical appliances (basically household appliances
[white goods]) as well as vehicles and parts thereof. Especially those commodity groups are suited for rail
or truck transport. Thus, the northbound volume exceeds the southbound volume, which leads to imbalanced
flows and significantly lower prices for land transports from Scandinavia to Turkey.
Figure 11: Trade volumes and structure from Turkey to Scandinavia
2.3.3. Exports from Nordic Countries to Turkey
In 2019, the trade of goods from Scandinavia to Turkey reached a volume of roughly 4.1 million tons in.
Between 2015 and 2019, the trade flow from Scandinavia to Turkey was characterized by a peak in 2017 –
reflecting a growth in all three Scandinavian countries. In 2017, the export of mineral fuels from Sweden
and Denmark to Turkey increased essentially while the Norwegian export of gas grew substantially. During
the past five years, the Scandinavian trade flow to Turkey grew averagely by 3.9 % per year. Even though
Page 16
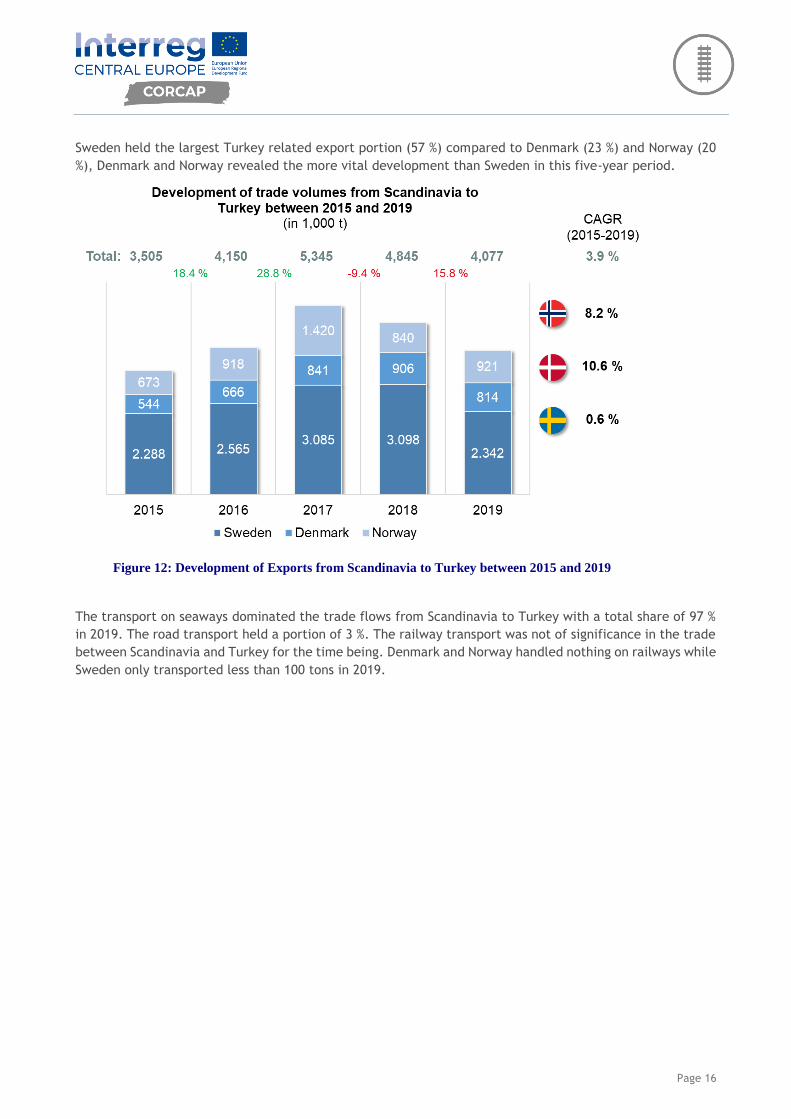
Sweden held the largest Turkey related export portion (57 %) compared to Denmark (23 %) and Norway (20
%), Denmark and Norway revealed the more vital development than Sweden in this five-year period.
Figure 12: Development of Exports from Scandinavia to Turkey between 2015 and 2019
The transport on seaways dominated the trade flows from Scandinavia to Turkey with a total share of 97 %
in 2019. The road transport held a portion of 3 %. The railway transport was not of significance in the trade
between Scandinavia and Turkey for the time being. Denmark and Norway handled nothing on railways while
Sweden only transported less than 100 tons in 2019.
Page 17
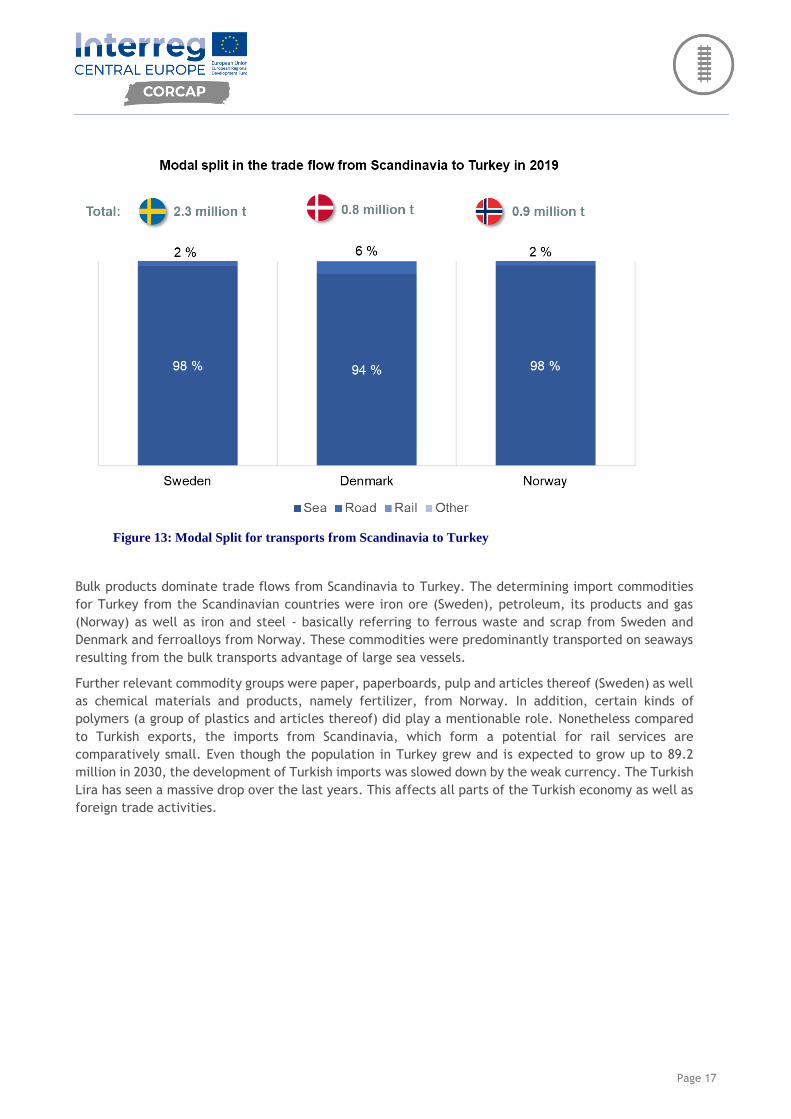
Figure 13: Modal Split for transports from Scandinavia to Turkey
Bulk products dominate trade flows from Scandinavia to Turkey. The determining import commodities
for Turkey from the Scandinavian countries were iron ore (Sweden), petroleum, its products and gas
(Norway) as well as iron and steel - basically referring to ferrous waste and scrap from Sweden and
Denmark and ferroalloys from Norway. These commodities were predominantly transported on seaways
resulting from the bulk transports advantage of large sea vessels.
Further relevant commodity groups were paper, paperboards, pulp and articles thereof (Sweden) as well
as chemical materials and products, namely fertilizer, from Norway. In addition, certain kinds of
polymers (a group of plastics and articles thereof) did play a mentionable role. Nonetheless compared
to Turkish exports, the imports from Scandinavia, which form a potential for rail services are
comparatively small. Even though the population in Turkey grew and is expected to grow up to 89.2
million in 2030, the development of Turkish imports was slowed down by the weak currency. The Turkish
Lira has seen a massive drop over the last years. This affects all parts of the Turkish economy as well as
foreign trade activities.
Page 18
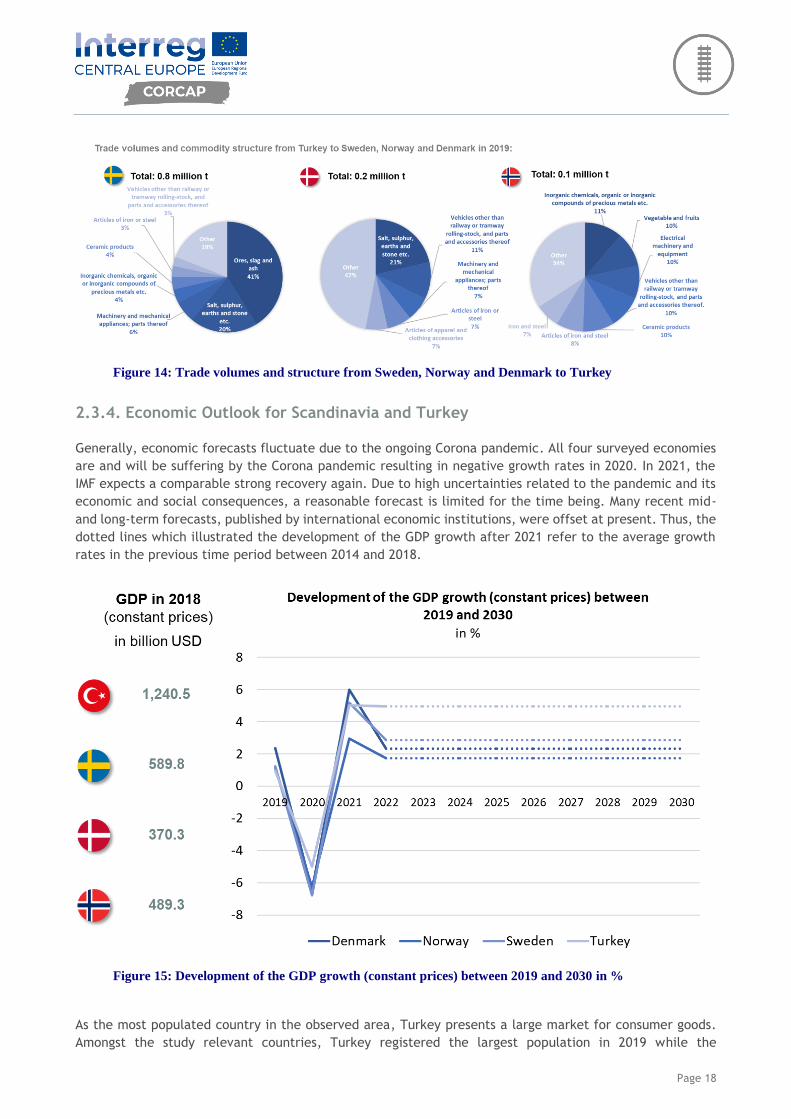
Figure 14: Trade volumes and structure from Sweden, Norway and Denmark to Turkey
2.3.4. Economic Outlook for Scandinavia and Turkey
Generally, economic forecasts fluctuate due to the ongoing Corona pandemic. All four surveyed economies
are and will be suffering by the Corona pandemic resulting in negative growth rates in 2020. In 2021, the
IMF expects a comparable strong recovery again. Due to high uncertainties related to the pandemic and its
economic and social consequences, a reasonable forecast is limited for the time being. Many recent mid-
and long-term forecasts, published by international economic institutions, were offset at present. Thus, the
dotted lines which illustrated the development of the GDP growth after 2021 refer to the average growth
rates in the previous time period between 2014 and 2018.
Figure 15: Development of the GDP growth (constant prices) between 2019 and 2030 in %
As the most populated country in the observed area, Turkey presents a large market for consumer goods.
Amongst the study relevant countries, Turkey registered the largest population in 2019 while the
Page 19
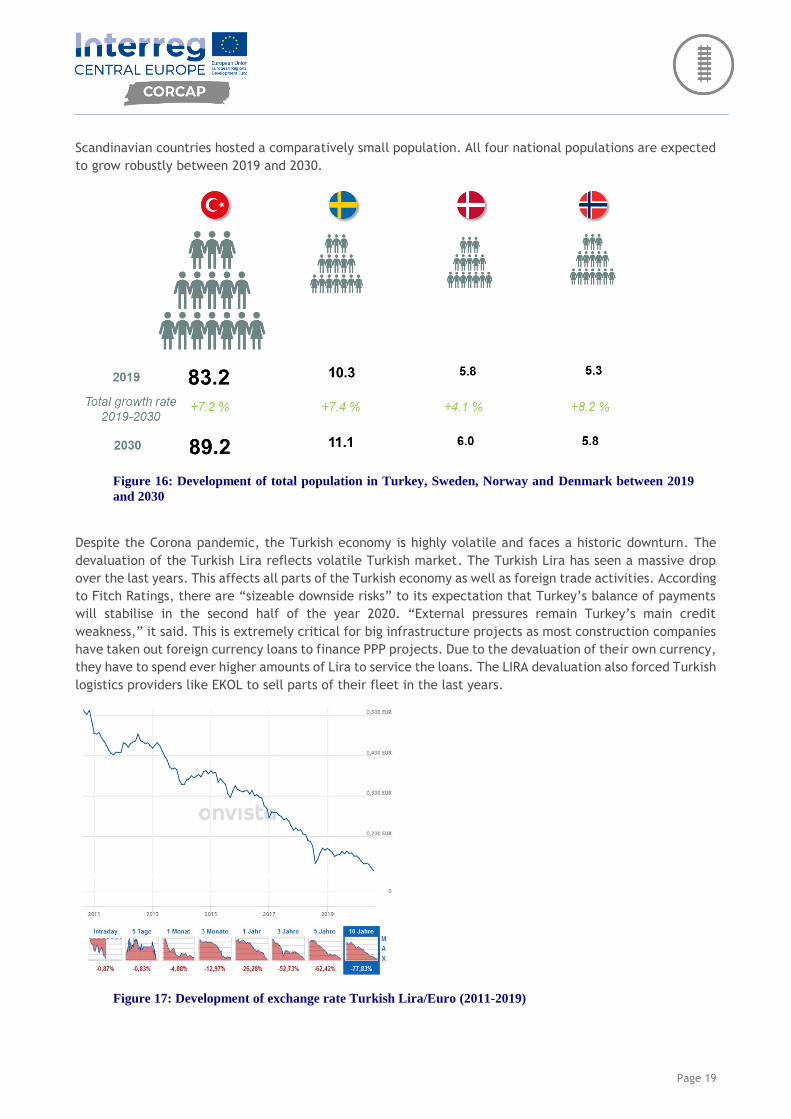
Scandinavian countries hosted a comparatively small population. All four national populations are expected
to grow robustly between 2019 and 2030.
Figure 16: Development of total population in Turkey, Sweden, Norway and Denmark between 2019
and 2030
Despite the Corona pandemic, the Turkish economy is highly volatile and faces a historic downturn. The
devaluation of the Turkish Lira reflects volatile Turkish market. The Turkish Lira has seen a massive drop
over the last years. This affects all parts of the Turkish economy as well as foreign trade activities. According
to Fitch Ratings, there are “sizeable downside risks” to its expectation that Turkey’s balance of payments
will stabilise in the second half of the year 2020. “External pressures remain Turkey’s main credit
weakness,” it said. This is extremely critical for big infrastructure projects as most construction companies
have taken out foreign currency loans to finance PPP projects. Due to the devaluation of their own currency,
they have to spend ever higher amounts of Lira to service the loans. The LIRA devaluation also forced Turkish
logistics providers like EKOL to sell parts of their fleet in the last years.
Figure 17: Development of exchange rate Turkish Lira/Euro (2011-2019)
Page 20
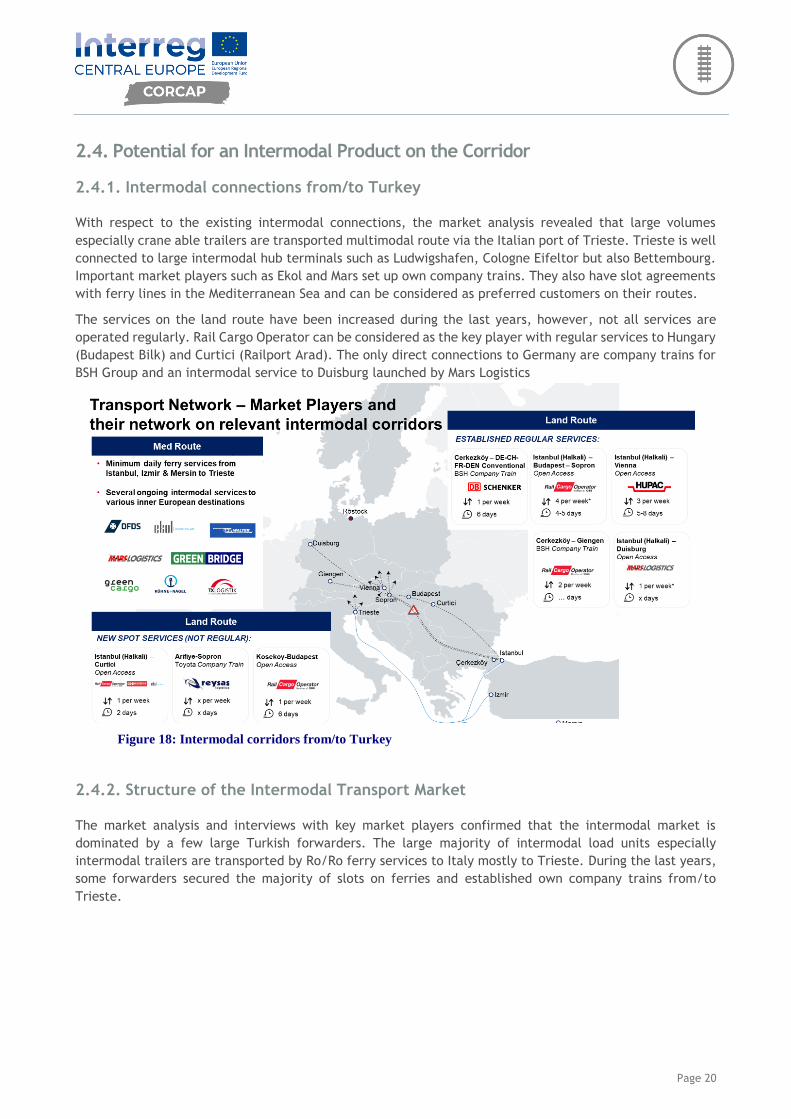
2.4. Potential for an Intermodal Product on the Corridor
2.4.1. Intermodal connections from/to Turkey
With respect to the existing intermodal connections, the market analysis revealed that large volumes
especially crane able trailers are transported multimodal route via the Italian port of Trieste. Trieste is well
connected to large intermodal hub terminals such as Ludwigshafen, Cologne Eifeltor but also Bettembourg.
Important market players such as Ekol and Mars set up own company trains. They also have slot agreements
with ferry lines in the Mediterranean Sea and can be considered as preferred customers on their routes.
The services on the land route have been increased during the last years, however, not all services are
operated regularly. Rail Cargo Operator can be considered as the key player with regular services to Hungary
(Budapest Bilk) and Curtici (Railport Arad). The only direct connections to Germany are company trains for
BSH Group and an intermodal service to Duisburg launched by Mars Logistics
2.4.2. Structure of the Intermodal Transport Market
The market analysis and interviews with key market players confirmed that the intermodal market is
dominated by a few large Turkish forwarders. The large majority of intermodal load units especially
intermodal trailers are transported by Ro/Ro ferry services to Italy mostly to Trieste. During the last years,
some forwarders secured the majority of slots on ferries and established own company trains from/to
Trieste.
Figure 18: Intermodal corridors from/to Turkey
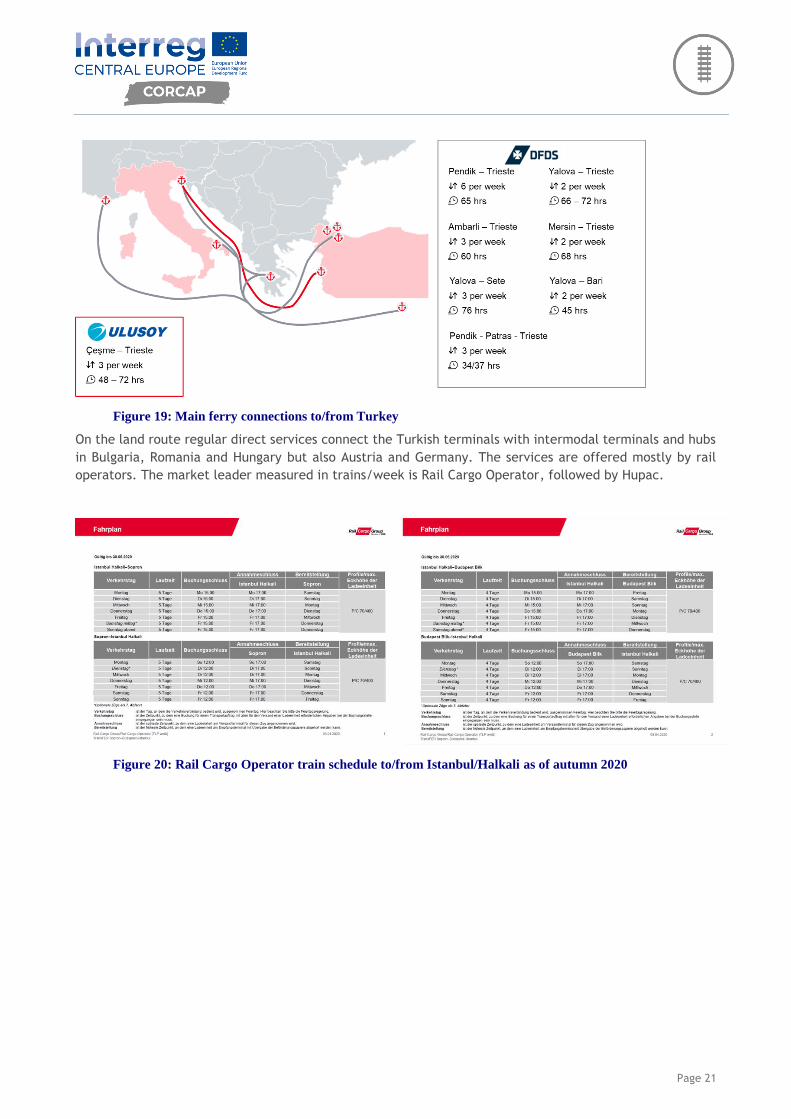
Page 21
Figure 19: Main ferry connections to/from Turkey
On the land route regular direct services connect the Turkish terminals with intermodal terminals and hubs
in Bulgaria, Romania and Hungary but also Austria and Germany. The services are offered mostly by rail
operators. The market leader measured in trains/week is Rail Cargo Operator, followed by Hupac.
Figure 20: Rail Cargo Operator train schedule to/from Istanbul/Halkali as of autumn 2020
Page 22
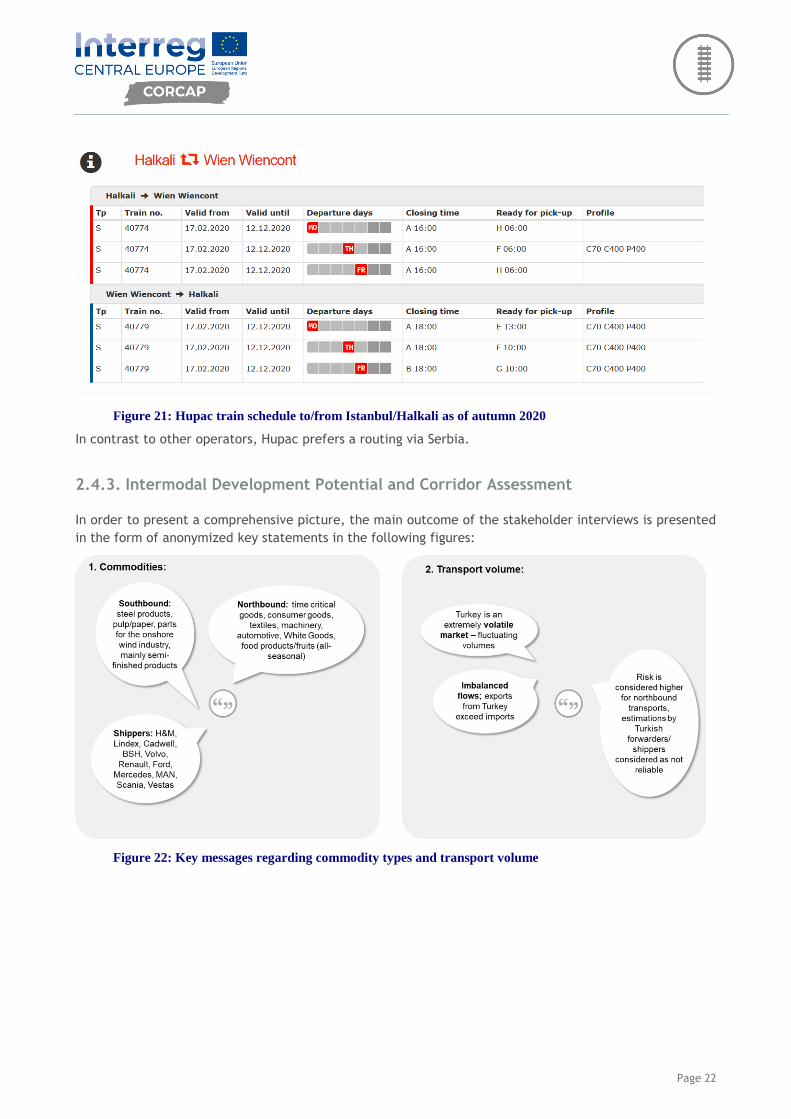
Figure 21: Hupac train schedule to/from Istanbul/Halkali as of autumn 2020
In contrast to other operators, Hupac prefers a routing via Serbia.
2.4.3. Intermodal Development Potential and Corridor Assessment
In order to present a comprehensive picture, the main outcome of the stakeholder interviews is presented
in the form of anonymized key statements in the following figures:
Figure 22: Key messages regarding commodity types and transport volume
Page 23
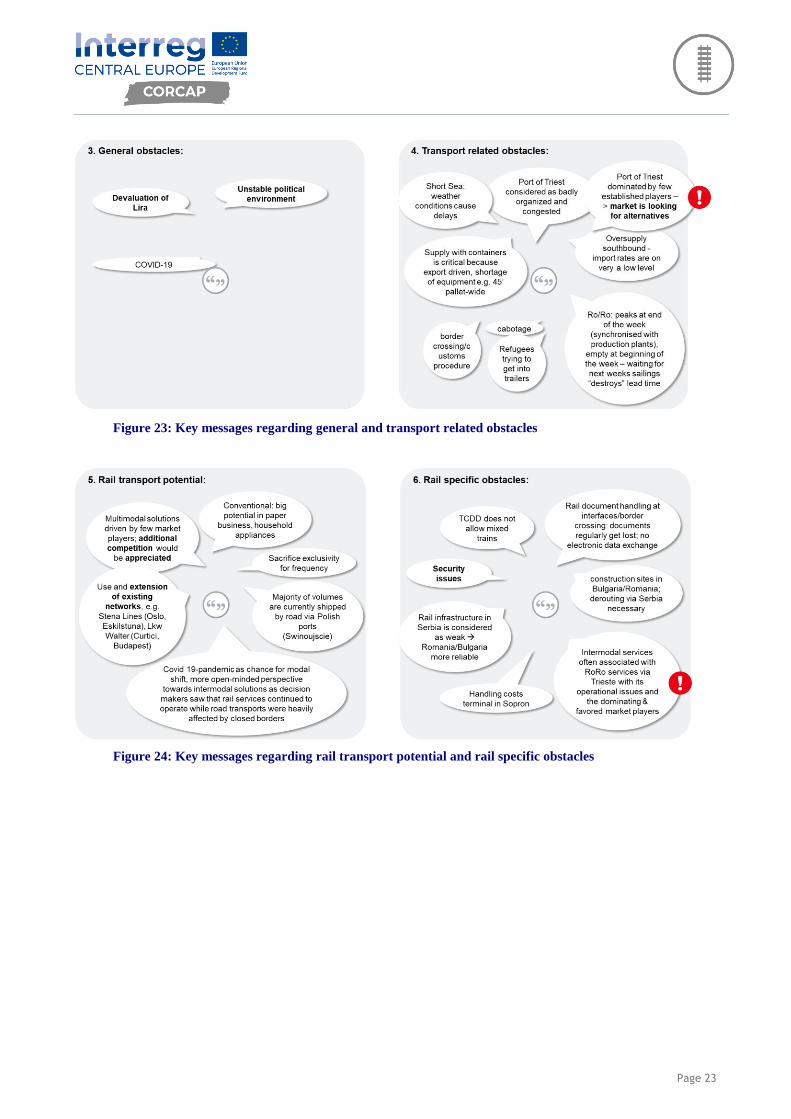
Figure 23: Key messages regarding general and transport related obstacles
Figure 24: Key messages regarding rail transport potential and rail specific obstacles
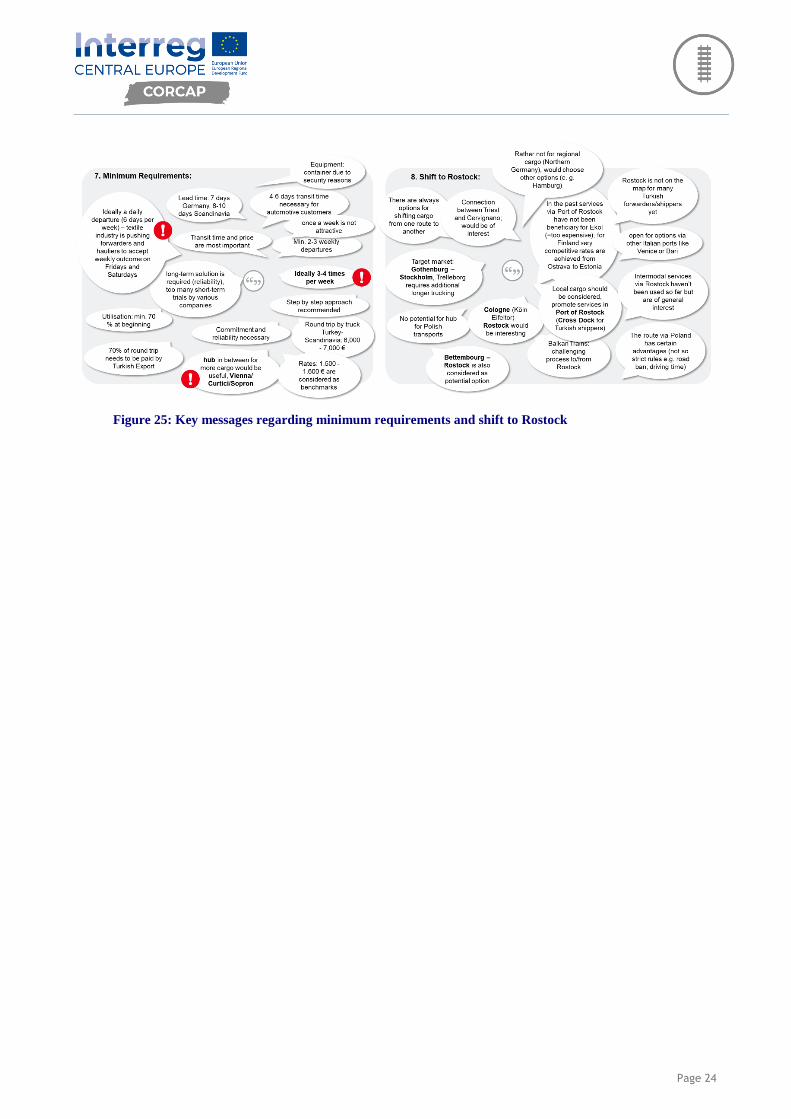
Page 24
Figure 25: Key messages regarding minimum requirements and shift to Rostock
Page 25
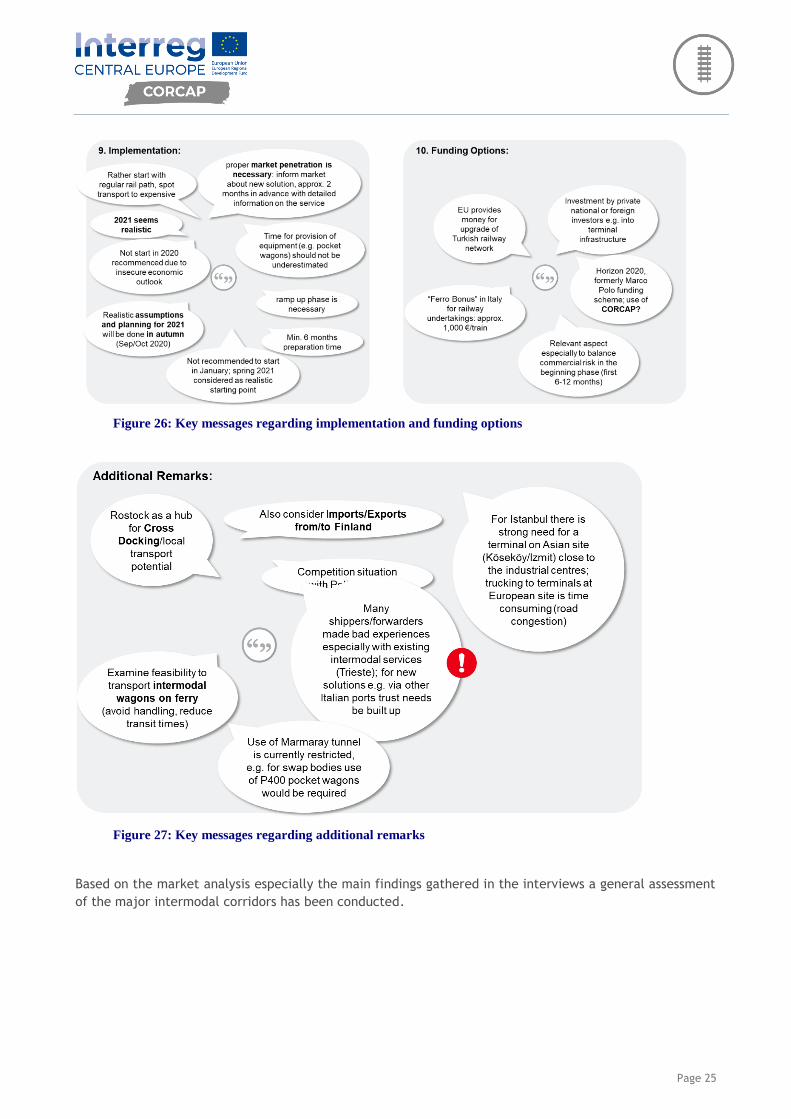
Figure 26: Key messages regarding implementation and funding options
Figure 27: Key messages regarding additional remarks
Based on the market analysis especially the main findings gathered in the interviews a general assessment
of the major intermodal corridors has been conducted.
Page 26
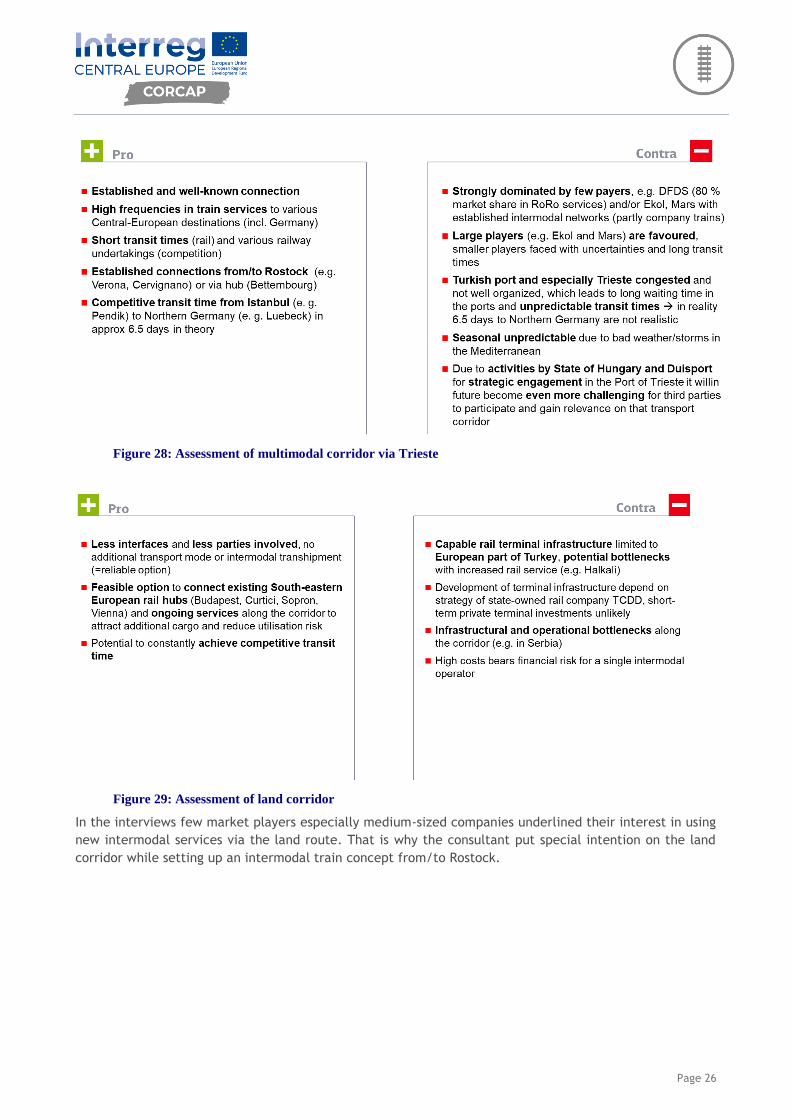
Figure 28: Assessment of multimodal corridor via Trieste
Figure 29: Assessment of land corridor
In the interviews few market players especially medium-sized companies underlined their interest in using
new intermodal services via the land route. That is why the consultant put special intention on the land
corridor while setting up an intermodal train concept from/to Rostock.
Page 27
3. Train Concept
3.1. Recommended Intermodal Terminals
Compared to countries in the European Union, the number of state-of-the-art intermodal terminals in Turkey
is low, however the largest terminal operator the Turkish state-owned railways TCDD announced
investments for the future. Existing conventional and intermodal train services from/to Europe
predominately make use of terminals in the capital region (Istanbul).
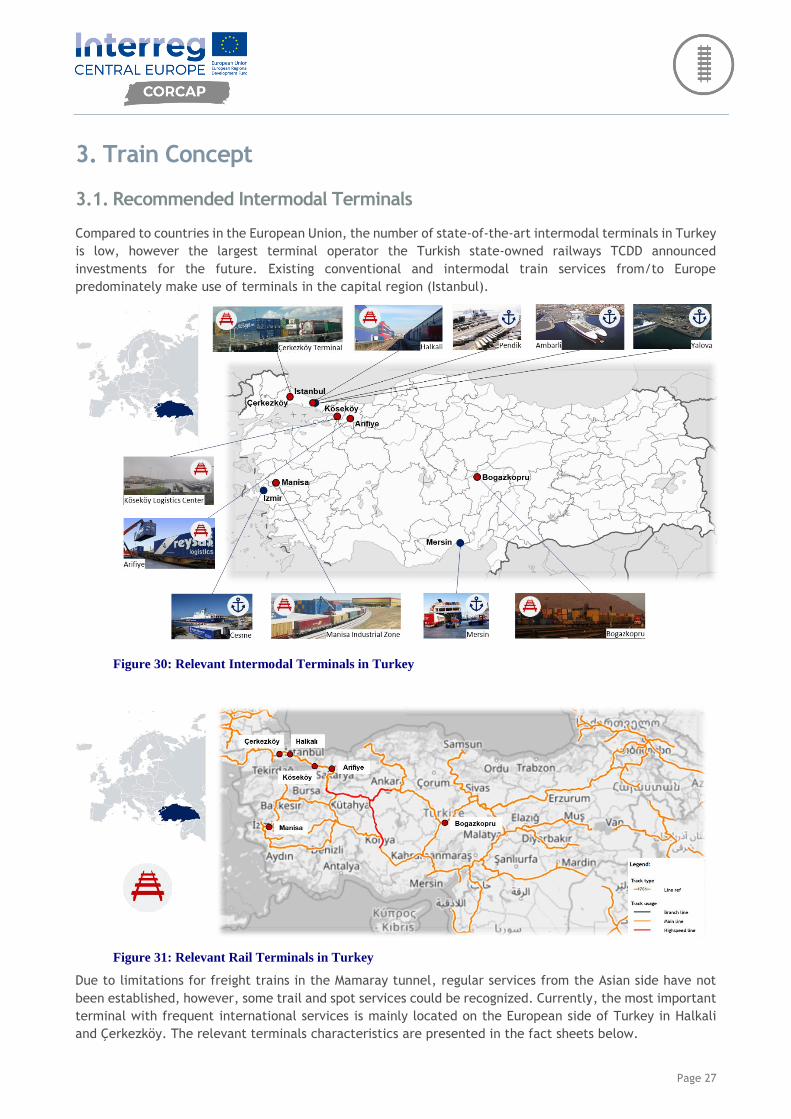
Figure 30: Relevant Intermodal Terminals in Turkey
Figure 31: Relevant Rail Terminals in Turkey
Due to limitations for freight trains in the Mamaray tunnel, regular services from the Asian side have not
been established, however, some trail and spot services could be recognized. Currently, the most important
terminal with frequent international services is mainly located on the European side of Turkey in Halkali
and Çerkezköy. The relevant terminals characteristics are presented in the fact sheets below.
Page 28
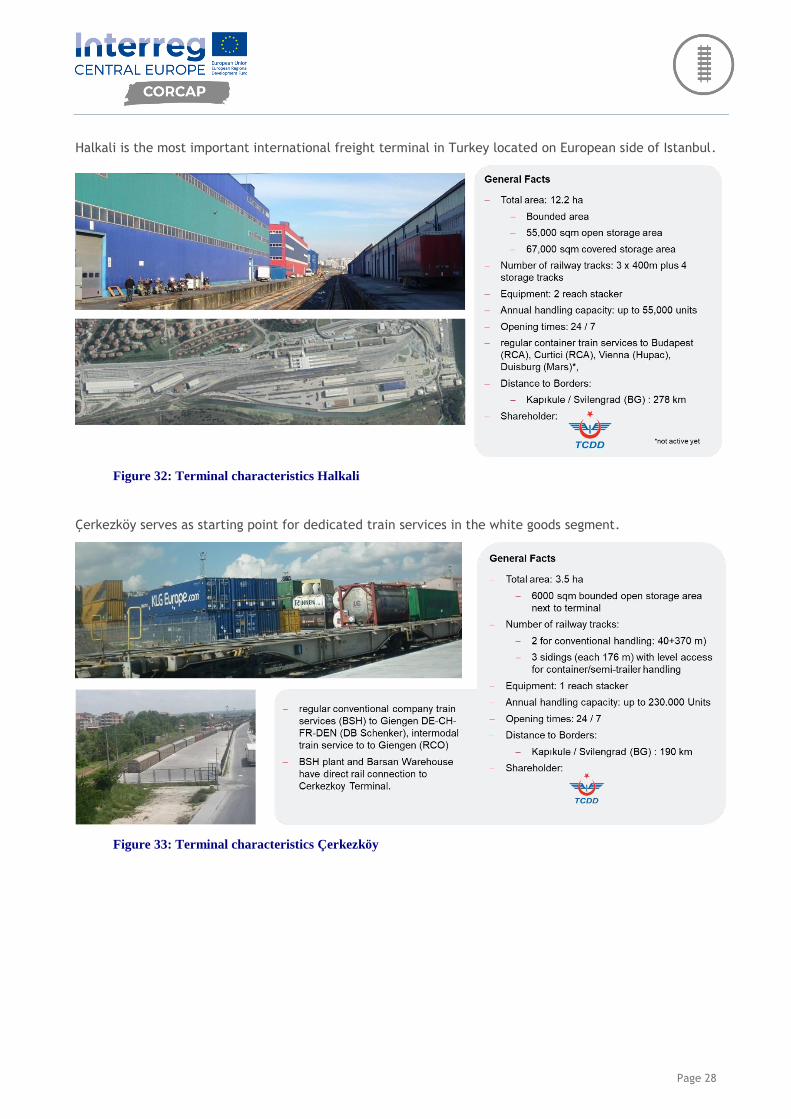
Halkali is the most important international freight terminal in Turkey located on European side of Istanbul.
Figure 32: Terminal characteristics Halkali
Çerkezköy serves as starting point for dedicated train services in the white goods segment.
Figure 33: Terminal characteristics Çerkezköy
Page 29
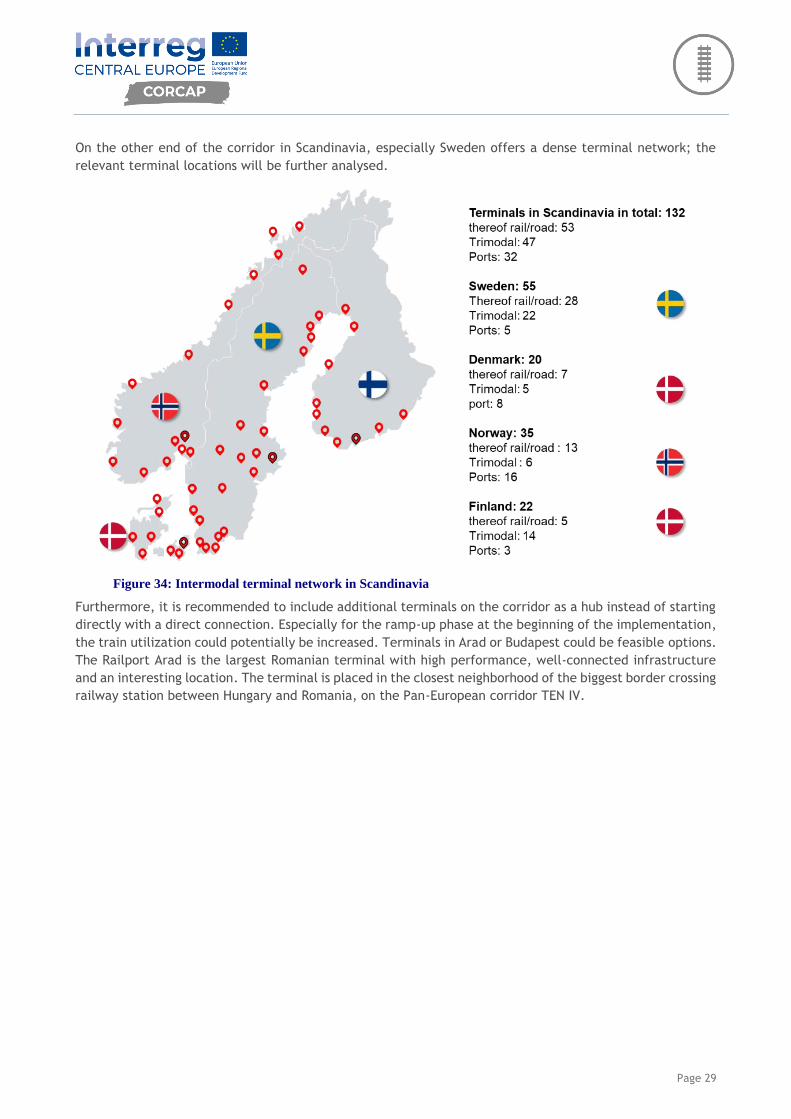
On the other end of the corridor in Scandinavia, especially Sweden offers a dense terminal network; the
relevant terminal locations will be further analysed.
Figure 34: Intermodal terminal network in Scandinavia
Furthermore, it is recommended to include additional terminals on the corridor as a hub instead of starting
directly with a direct connection. Especially for the ramp-up phase at the beginning of the implementation,
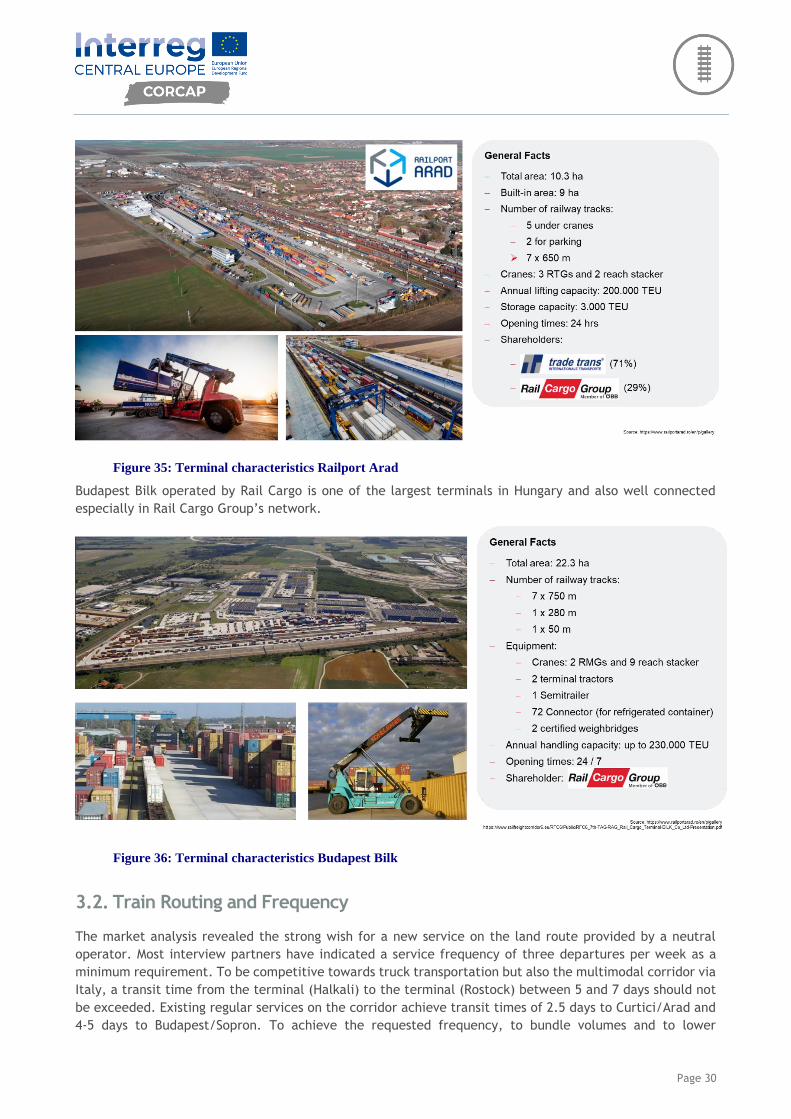
the train utilization could potentially be increased. Terminals in Arad or Budapest could be feasible options.
The Railport Arad is the largest Romanian terminal with high performance, well-connected infrastructure
and an interesting location. The terminal is placed in the closest neighborhood of the biggest border crossing
railway station between Hungary and Romania, on the Pan-European corridor TEN IV.
Page 30
Figure 35: Terminal characteristics Railport Arad
Budapest Bilk operated by Rail Cargo is one of the largest terminals in Hungary and also well connected
especially in Rail Cargo Group’s network.
Figure 36: Terminal characteristics Budapest Bilk
3.2. Train Routing and Frequency
The market analysis revealed the strong wish for a new service on the land route provided by a neutral
operator. Most interview partners have indicated a service frequency of three departures per week as a
minimum requirement. To be competitive towards truck transportation but also the multimodal corridor via
Italy, a transit time from the terminal (Halkali) to the terminal (Rostock) between 5 and 7 days should not
be exceeded. Existing regular services on the corridor achieve transit times of 2.5 days to Curtici/Arad and
4-5 days to Budapest/Sopron. To achieve the requested frequency, to bundle volumes and to lower
Page 31
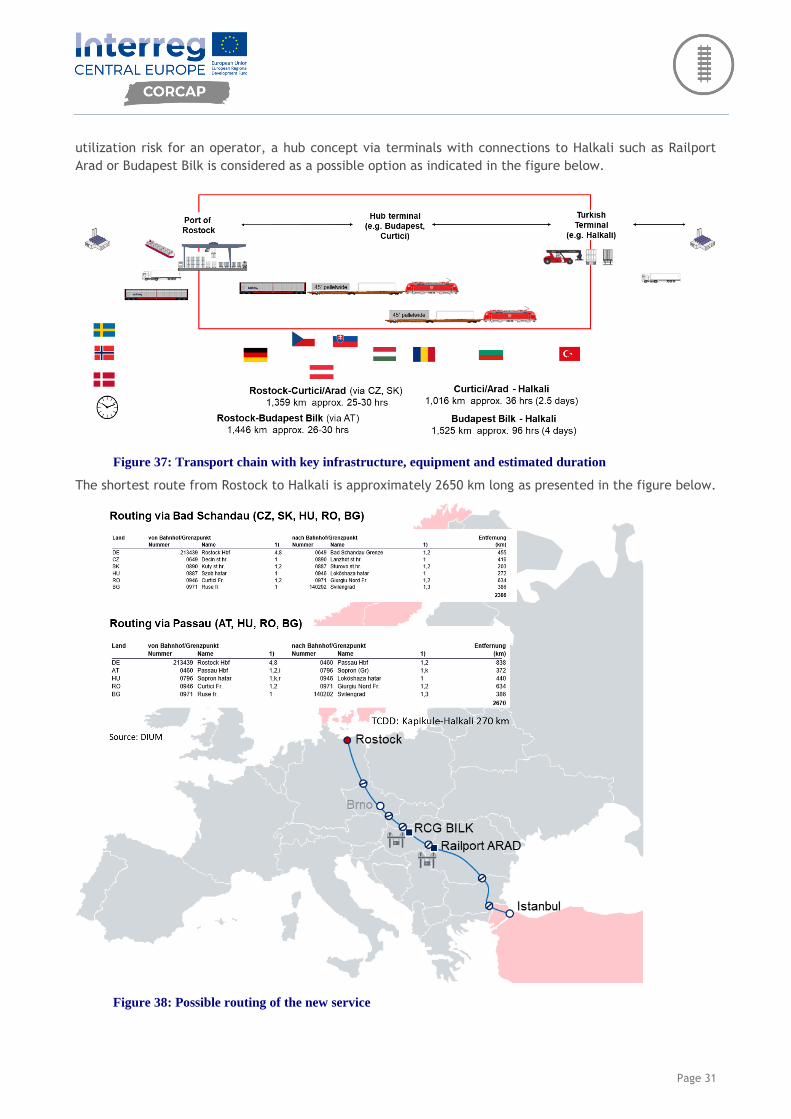
utilization risk for an operator, a hub concept via terminals with connections to Halkali such as Railport
Arad or Budapest Bilk is considered as a possible option as indicated in the figure below.
Figure 37: Transport chain with key infrastructure, equipment and estimated duration
The shortest route from Rostock to Halkali is approximately 2650 km long as presented in the figure below.
Figure 38: Possible routing of the new service
Page 32
On the land corridors, different routing options exist and are in use. Services to Hungary, Austria and
Germany use the corridor via Bulgaria and Romania. Some players prefer the routing via Serbia, which has
been reported as the cheapest option. One of the shortest and based on the expert interviews also reliable
route runs via Slovakia and the Czech Republic and enters Germany in Decin/Bad Schandau.
3.3. Train Composition intermodal Wagons
The market analysis showed a demand for a new intermodal service. For the transport of conventional rail
cars from/to Turkey services like the BSH company train are well established but especially Turkish
forwarders search for options for (un-accompanied) trailer transport. In addition, also a demand for
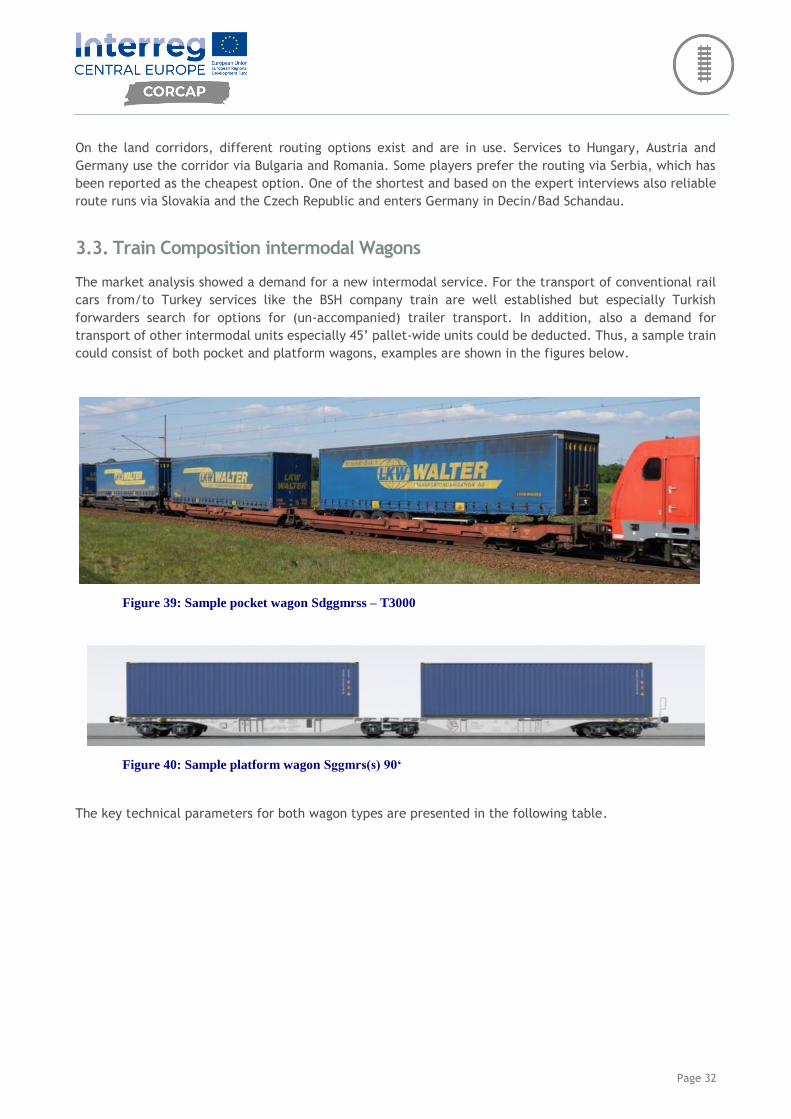
transport of other intermodal units especially 45’ pallet-wide units could be deducted. Thus, a sample train
could consist of both pocket and platform wagons, examples are shown in the figures below.
Figure 39: Sample pocket wagon Sdggmrss – T3000
Figure 40: Sample platform wagon Sggmrs(s) 90‘
The key technical parameters for both wagon types are presented in the following table.
Page 33
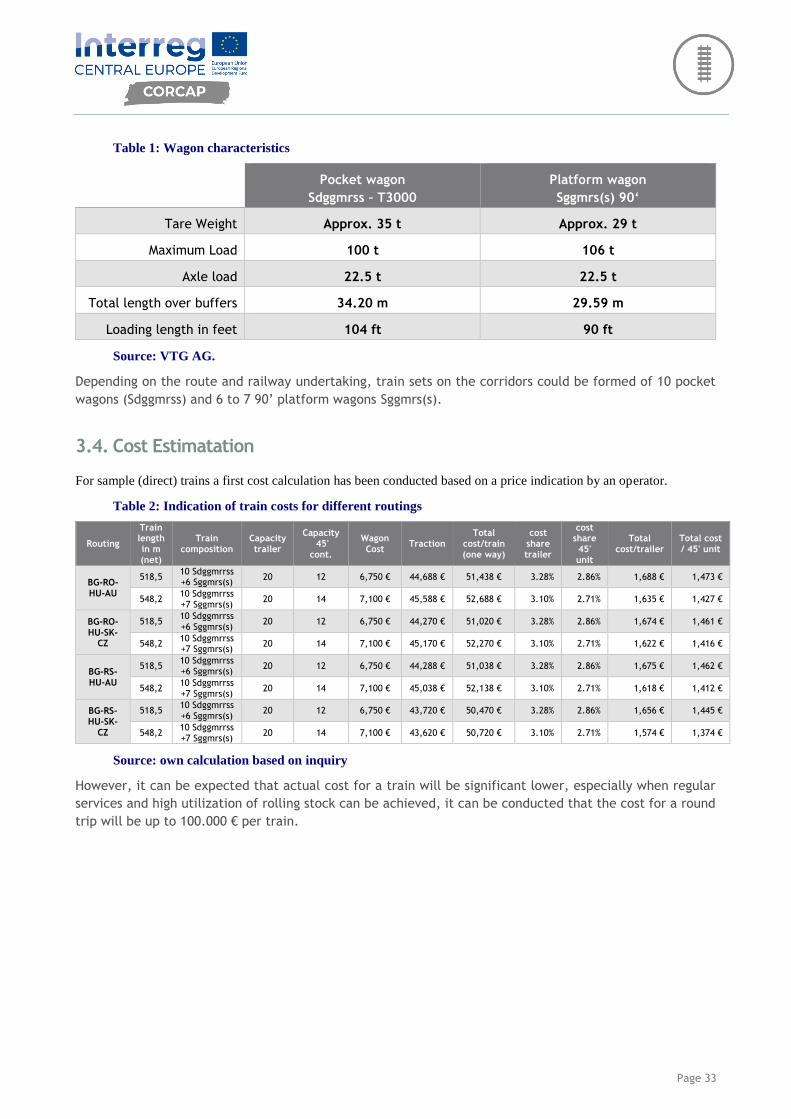
Table 1: Wagon characteristics
Pocket wagon
Sdggmrss – T3000
Platform wagon
Sggmrs(s) 90‘
Tare Weight Approx. 35 t Approx. 29 t
Maximum Load 100 t 106 t
Axle load 22.5 t 22.5 t
Total length over buffers 34.20 m 29.59 m
Loading length in feet 104 ft 90 ft
Source: VTG AG.
Depending on the route and railway undertaking, train sets on the corridors could be formed of 10 pocket
wagons (Sdggmrss) and 6 to 7 90’ platform wagons Sggmrs(s).
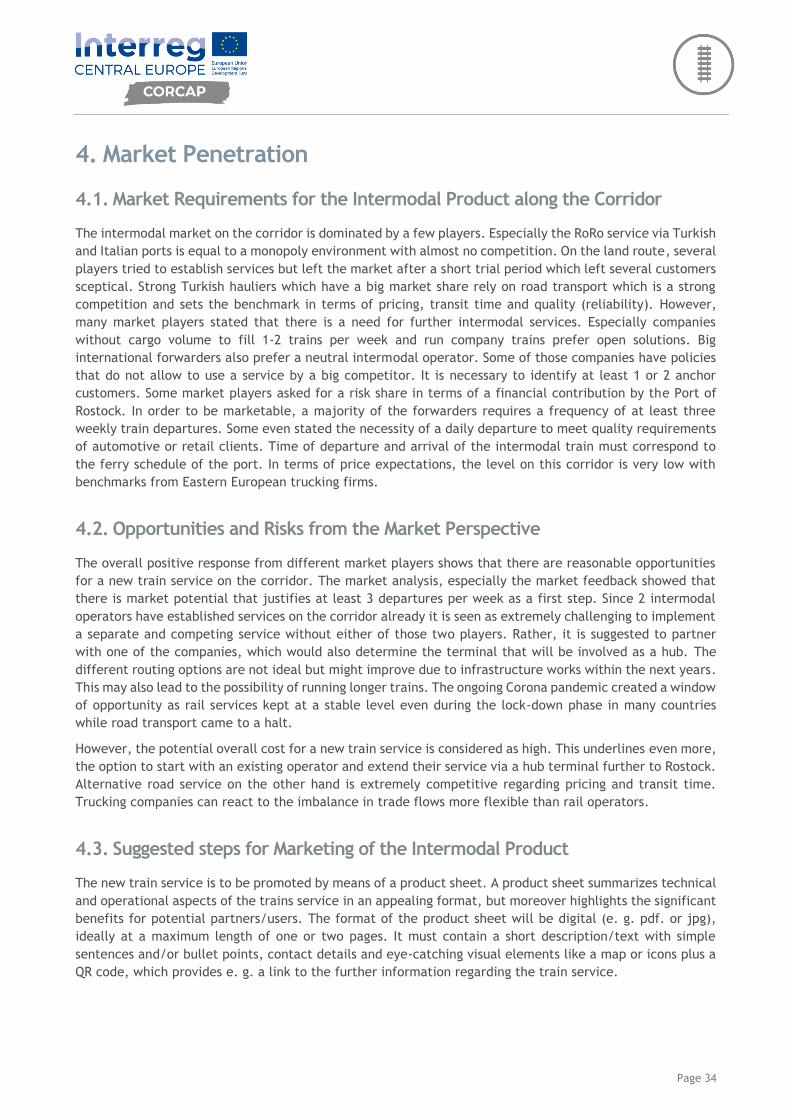
3.4. Cost Estimatation
For sample (direct) trains a first cost calculation has been conducted based on a price indication by an operator.
Table 2: Indication of train costs for different routings
Routing
Train length in m (net)
Train composition
Capacity trailer
Capacity 45'
cont.
Wagon Cost
Traction Total
cost/train (one way)
cost share trailer
cost share 45' unit
Total cost/trailer
Total cost / 45' unit
BG-RO-HU-AU
518,5 10 Sdggmrrss +6 Sggmrs(s)
20 12 6,750 € 44,688 € 51,438 € 3.28% 2.86% 1,688 € 1,473 €
548,2 10 Sdggmrrss +7 Sggmrs(s)
20 14 7,100 € 45,588 € 52,688 € 3.10% 2.71% 1,635 € 1,427 €
BG-RO-HU-SK-
CZ
518,5 10 Sdggmrrss +6 Sggmrs(s)
20 12 6,750 € 44,270 € 51,020 € 3.28% 2.86% 1,674 € 1,461 €
548,2 10 Sdggmrrss +7 Sggmrs(s)
20 14 7,100 € 45,170 € 52,270 € 3.10% 2.71% 1,622 € 1,416 €
BG-RS-HU-AU
518,5 10 Sdggmrrss +6 Sggmrs(s)
20 12 6,750 € 44,288 € 51,038 € 3.28% 2.86% 1,675 € 1,462 €
548,2 10 Sdggmrrss +7 Sggmrs(s)
20 14 7,100 € 45,038 € 52,138 € 3.10% 2.71% 1,618 € 1,412 €
BG-RS-HU-SK-
CZ
518,5 10 Sdggmrrss +6 Sggmrs(s)
20 12 6,750 € 43,720 € 50,470 € 3.28% 2.86% 1,656 € 1,445 €
548,2 10 Sdggmrrss +7 Sggmrs(s)
20 14 7,100 € 43,620 € 50,720 € 3.10% 2.71% 1,574 € 1,374 €
Source: own calculation based on inquiry
However, it can be expected that actual cost for a train will be significant lower, especially when regular
services and high utilization of rolling stock can be achieved, it can be conducted that the cost for a round
trip will be up to 100.000 € per train.
Page 34
4. Market Penetration
4.1. Market Requirements for the Intermodal Product along the Corridor
The intermodal market on the corridor is dominated by a few players. Especially the RoRo service via Turkish
and Italian ports is equal to a monopoly environment with almost no competition. On the land route, several
players tried to establish services but left the market after a short trial period which left several customers
sceptical. Strong Turkish hauliers which have a big market share rely on road transport which is a strong
competition and sets the benchmark in terms of pricing, transit time and quality (reliability). However,
many market players stated that there is a need for further intermodal services. Especially companies
without cargo volume to fill 1-2 trains per week and run company trains prefer open solutions. Big
international forwarders also prefer a neutral intermodal operator. Some of those companies have policies
that do not allow to use a service by a big competitor. It is necessary to identify at least 1 or 2 anchor
customers. Some market players asked for a risk share in terms of a financial contribution by the Port of
Rostock. In order to be marketable, a majority of the forwarders requires a frequency of at least three
weekly train departures. Some even stated the necessity of a daily departure to meet quality requirements
of automotive or retail clients. Time of departure and arrival of the intermodal train must correspond to
the ferry schedule of the port. In terms of price expectations, the level on this corridor is very low with
benchmarks from Eastern European trucking firms.
4.2. Opportunities and Risks from the Market Perspective
The overall positive response from different market players shows that there are reasonable opportunities
for a new train service on the corridor. The market analysis, especially the market feedback showed that
there is market potential that justifies at least 3 departures per week as a first step. Since 2 intermodal
operators have established services on the corridor already it is seen as extremely challenging to implement
a separate and competing service without either of those two players. Rather, it is suggested to partner
with one of the companies, which would also determine the terminal that will be involved as a hub. The
different routing options are not ideal but might improve due to infrastructure works within the next years.
This may also lead to the possibility of running longer trains. The ongoing Corona pandemic created a window
of opportunity as rail services kept at a stable level even during the lock-down phase in many countries
while road transport came to a halt.
However, the potential overall cost for a new train service is considered as high. This underlines even more,
the option to start with an existing operator and extend their service via a hub terminal further to Rostock.
Alternative road service on the other hand is extremely competitive regarding pricing and transit time.
Trucking companies can react to the imbalance in trade flows more flexible than rail operators.
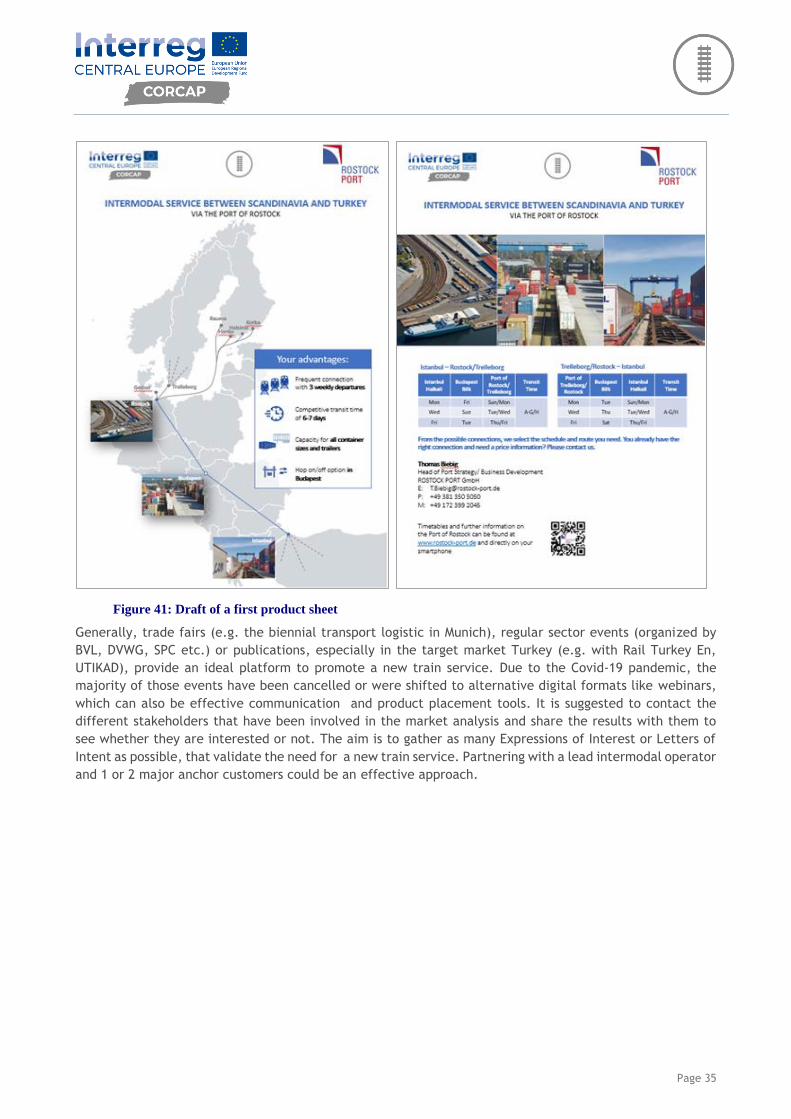
4.3. Suggested steps for Marketing of the Intermodal Product
The new train service is to be promoted by means of a product sheet. A product sheet summarizes technical
and operational aspects of the trains service in an appealing format, but moreover highlights the significant
benefits for potential partners/users. The format of the product sheet will be digital (e. g. pdf. or jpg),
ideally at a maximum length of one or two pages. It must contain a short description/text with simple
sentences and/or bullet points, contact details and eye-catching visual elements like a map or icons plus a
QR code, which provides e. g. a link to the further information regarding the train service.
Page 35
Figure 41: Draft of a first product sheet
Generally, trade fairs (e.g. the biennial transport logistic in Munich), regular sector events (organized by
BVL, DVWG, SPC etc.) or publications, especially in the target market Turkey (e.g. with Rail Turkey En,
UTIKAD), provide an ideal platform to promote a new train service. Due to the Covid-19 pandemic, the
majority of those events have been cancelled or were shifted to alternative digital formats like webinars,
which can also be effective communication and product placement tools. It is suggested to contact the
different stakeholders that have been involved in the market analysis and share the results with them to
see whether they are interested or not. The aim is to gather as many Expressions of Interest or Letters of
Intent as possible, that validate the need for a new train service. Partnering with a lead intermodal operator
and 1 or 2 major anchor customers could be an effective approach.