North Village Market Analysis
25
Wasatch County North Village Market Analysis April 2015
-
Upload
khangminh22 -
Category
Documents
-
view
2 -
download
0
Transcript of North Village Market Analysis
Wasatch County
North Village Market Analysis
April 2015
Zions Bank Public Finance | April 2015
Wasatch County | North Village Market Analysis
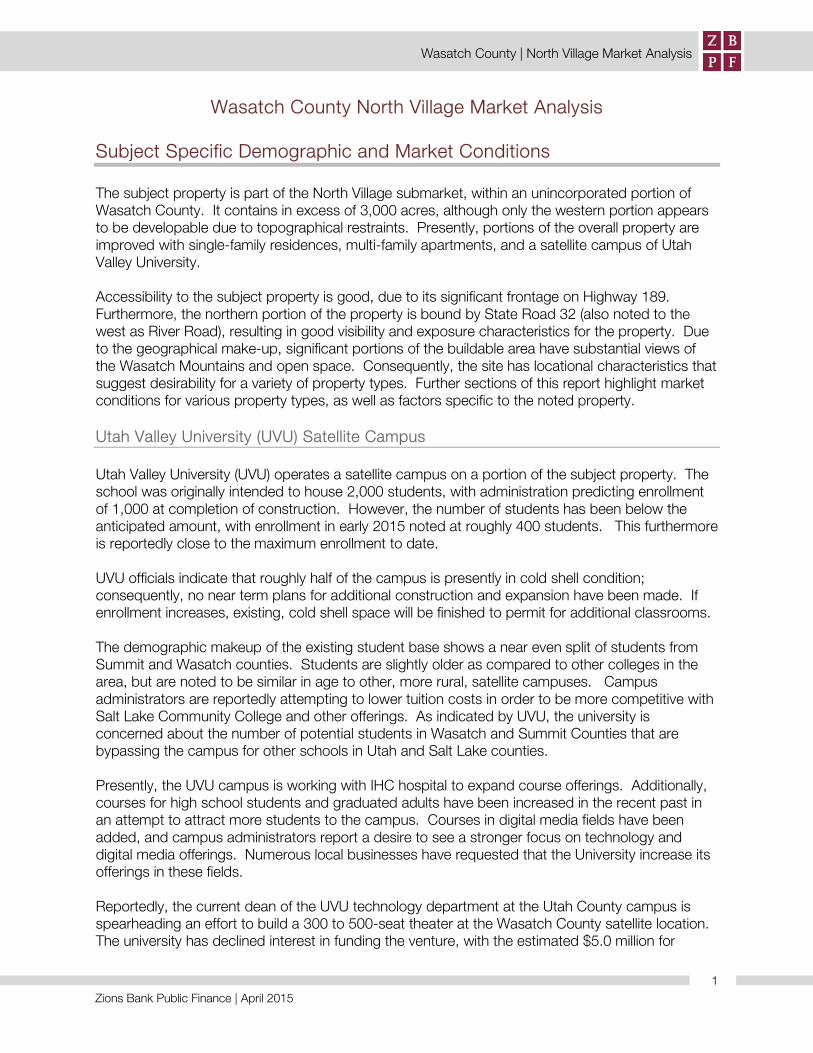
Wasatch County North Village Market Analysis Subject Specific Demographic and Market Conditions The subject property is part of the North Village submarket, within an unincorporated portion of Wasatch County. It contains in excess of 3,000 acres, although only the western portion appears to be developable due to topographical restraints. Presently, portions of the overall property are improved with single-family residences, multi-family apartments, and a satellite campus of Utah Valley University.
Accessibility to the subject property is good, due to its significant frontage on Highway 189. Furthermore, the northern portion of the property is bound by State Road 32 (also noted to the west as River Road), resulting in good visibility and exposure characteristics for the property. Due to the geographical make-up, significant portions of the buildable area have substantial views of the Wasatch Mountains and open space. Consequently, the site has locational characteristics that suggest desirability for a variety of property types. Further sections of this report highlight market conditions for various property types, as well as factors specific to the noted property.
Utah Valley University (UVU) Satellite Campus Utah Valley University (UVU) operates a satellite campus on a portion of the subject property. The school was originally intended to house 2,000 students, with administration predicting enrollment of 1,000 at completion of construction. However, the number of students has been below the anticipated amount, with enrollment in early 2015 noted at roughly 400 students. This furthermore is reportedly close to the maximum enrollment to date. UVU officials indicate that roughly half of the campus is presently in cold shell condition; consequently, no near term plans for additional construction and expansion have been made. If enrollment increases, existing, cold shell space will be finished to permit for additional classrooms. The demographic makeup of the existing student base shows a near even split of students from Summit and Wasatch counties. Students are slightly older as compared to other colleges in the area, but are noted to be similar in age to other, more rural, satellite campuses. Campus administrators are reportedly attempting to lower tuition costs in order to be more competitive with Salt Lake Community College and other offerings. As indicated by UVU, the university is concerned about the number of potential students in Wasatch and Summit Counties that are bypassing the campus for other schools in Utah and Salt Lake counties. Presently, the UVU campus is working with IHC hospital to expand course offerings. Additionally, courses for high school students and graduated adults have been increased in the recent past in an attempt to attract more students to the campus. Courses in digital media fields have been added, and campus administrators report a desire to see a stronger focus on technology and digital media offerings. Numerous local businesses have requested that the University increase its offerings in these fields. Reportedly, the current dean of the UVU technology department at the Utah County campus is spearheading an effort to build a 300 to 500-seat theater at the Wasatch County satellite location. The university has declined interest in funding the venture, with the estimated $5.0 million for
1

Zions Bank Public Finance | April 2015
Wasatch County | North Village Market Analysis
construction to come from private donations. According to the dean, the vision is to enhance the school’s technology offerings and to be connected with the Sundance Film Festival. Residential Market Characteristics Population projections, as highlighted in the associated graphs, suggest a need for 288 housing units per year from 2010 to 2020. This increases to 369 units per year from 2020 to 2030, and 457 units per year from 2030 to 2040. Summit County shows moderate growth as well, albeit with smaller household sizes. Growth projections are based on data from the Governor’s Office of Management and Budget.
Total new housing units (primary homes only) are forecast for the 2010-2040 period at approximately 11,000 for Wasatch County. Summit County is anticipated to require roughly 13,000 units in the same time frame. Consequently, nearly 24,000 new residential units (again, primary homes only) are forecast for Summit and Wasatch Counties from 2010-2040. Second homes are also forecast in Wasatch County for moderate growth over the next 30 years. While previous reporting periods showed annual building of roughly 55 units for this category, more recent indications reflect an increase to approximately 75 units per year. Brokers and developers, however, cautioned of potential saturation of the second home market. This is due primarily to significant planned and current developments located around the Jordanelle Reservoir. As noted on the associated table, the number of residential building permits issued in Wasatch County peaked in 2006, but has most recently shown signs of increases following relatively stagnant years from 2008 through 2012. Overall, 353 residential building permits were issued in 2013, a roughly 83 percent increase from the prior year.
0
100
200
300
400
500
600
2010-2020 2020-2030 2030-2040
Wasatch
Summit
2
Zions Bank Public Finance | April 2015
Wasatch County | North Village Market Analysis
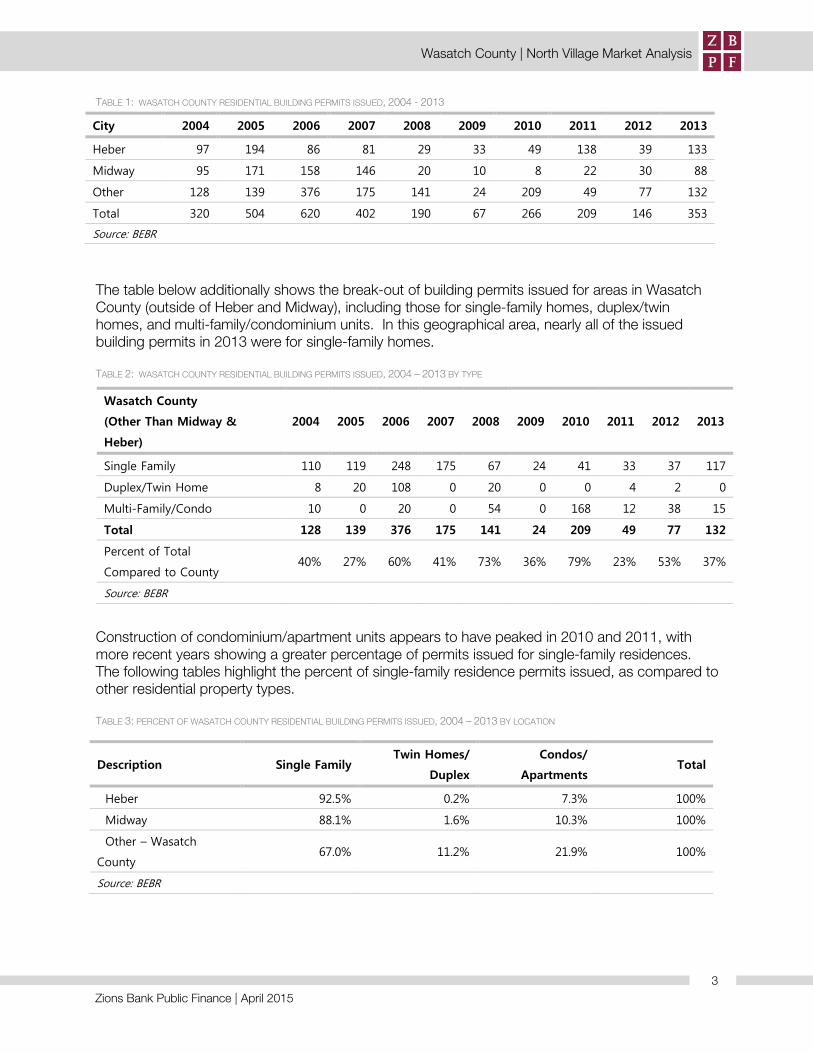
TABLE 1: WASATCH COUNTY RESIDENTIAL BUILDING PERMITS ISSUED, 2004 - 2013
The table below additionally shows the break-out of building permits issued for areas in Wasatch County (outside of Heber and Midway), including those for single-family homes, duplex/twin homes, and multi-family/condominium units. In this geographical area, nearly all of the issued building permits in 2013 were for single-family homes. TABLE 2: WASATCH COUNTY RESIDENTIAL BUILDING PERMITS ISSUED, 2004 – 2013 BY TYPE
Construction of condominium/apartment units appears to have peaked in 2010 and 2011, with more recent years showing a greater percentage of permits issued for single-family residences. The following tables highlight the percent of single-family residence permits issued, as compared to other residential property types. TABLE 3: PERCENT OF WASATCH COUNTY RESIDENTIAL BUILDING PERMITS ISSUED, 2004 – 2013 BY LOCATION
City 2004 2005 2006 2007 2008 2009 2010 2011 2012 2013
Heber 97 194 86 81 29 33 49 138 39 133
Midway 95 171 158 146 20 10 8 22 30 88
Other 128 139 376 175 141 24 209 49 77 132
Total 320 504 620 402 190 67 266 209 146 353
Source: BEBR
Wasatch County
(Other Than Midway &
Heber)
2004 2005 2006 2007 2008 2009 2010 2011 2012 2013
Single Family 110 119 248 175 67 24 41 33 37 117
Duplex/Twin Home 8 20 108 0 20 0 0 4 2 0
Multi-Family/Condo 10 0 20 0 54 0 168 12 38 15
Total 128 139 376 175 141 24 209 49 77 132
Percent of Total
Compared to County 40% 27% 60% 41% 73% 36% 79% 23% 53% 37%
Source: BEBR
Description Single Family Twin Homes/
Duplex
Condos/
Apartments Total
Heber 92.5% 0.2% 7.3% 100%
Midway 88.1% 1.6% 10.3% 100%
Other – Wasatch
County 67.0% 11.2% 21.9% 100%
Source: BEBR
3
Zions Bank Public Finance | April 2015
Wasatch County | North Village Market Analysis
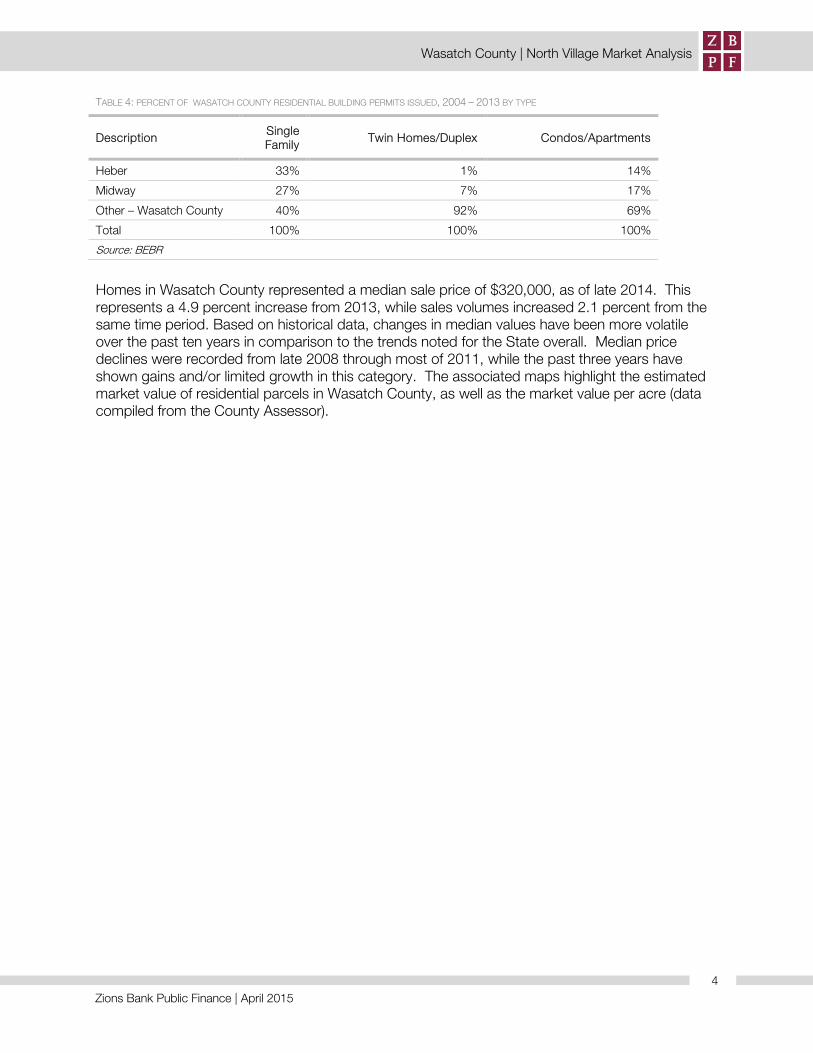
TABLE 4: PERCENT OF WASATCH COUNTY RESIDENTIAL BUILDING PERMITS ISSUED, 2004 – 2013 BY TYPE
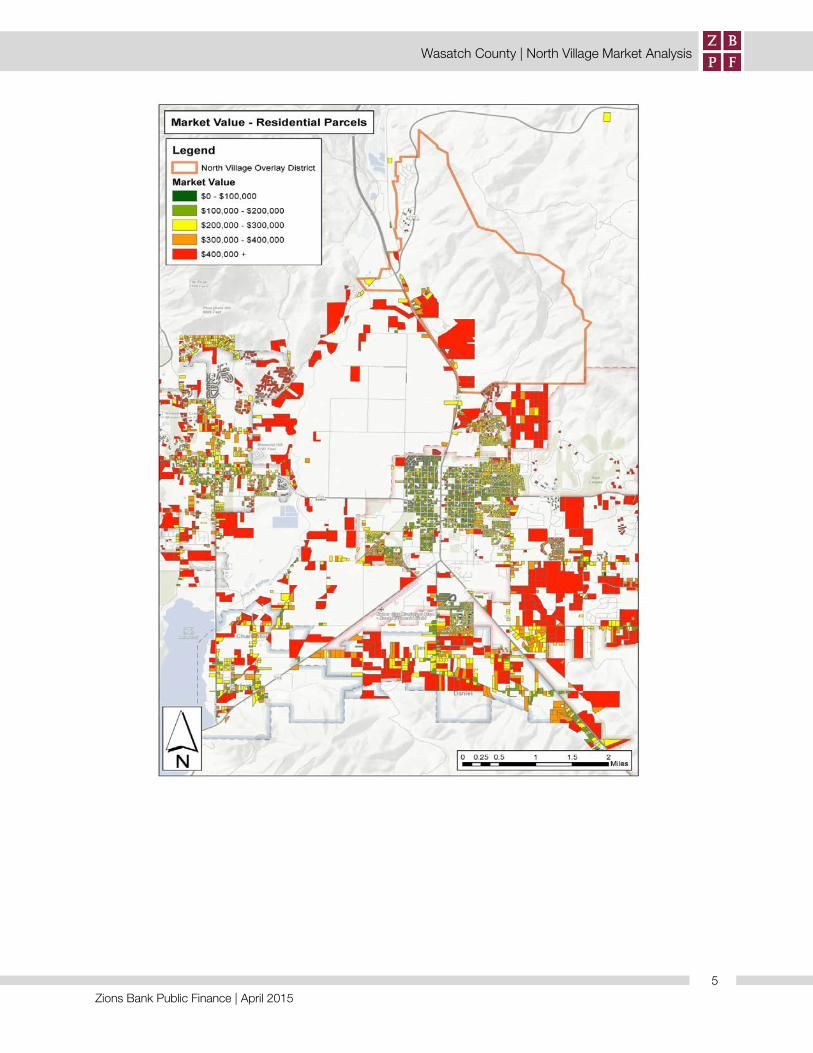
Homes in Wasatch County represented a median sale price of $320,000, as of late 2014. This represents a 4.9 percent increase from 2013, while sales volumes increased 2.1 percent from the same time period. Based on historical data, changes in median values have been more volatile over the past ten years in comparison to the trends noted for the State overall. Median price declines were recorded from late 2008 through most of 2011, while the past three years have shown gains and/or limited growth in this category. The associated maps highlight the estimated market value of residential parcels in Wasatch County, as well as the market value per acre (data compiled from the County Assessor).
Description Single Family Twin Homes/Duplex Condos/Apartments
Heber 33% 1% 14%
Midway 27% 7% 17%
Other – Wasatch County 40% 92% 69%
Total 100% 100% 100%
Source: BEBR
4
Zions Bank Public Finance | April 2015
Wasatch County | North Village Market Analysis
5

Zions Bank Public Finance | April 2015
Wasatch County | North Village Market Analysis
Primary homes in Wasatch County reflected a median size of approximately 1,700 square feet, as of early 2015, and a median value of $250,000. The median lot size was noted at roughly 0.3 acres, with a median year of construction of 1999. Homes of more recent construction dates highlight increased median values. Developers and brokers note that move-up buyers within Wasatch County will typically search for lots near 0.5 acres and larger.
6
Zions Bank Public Finance | April 2015
Wasatch County | North Village Market Analysis
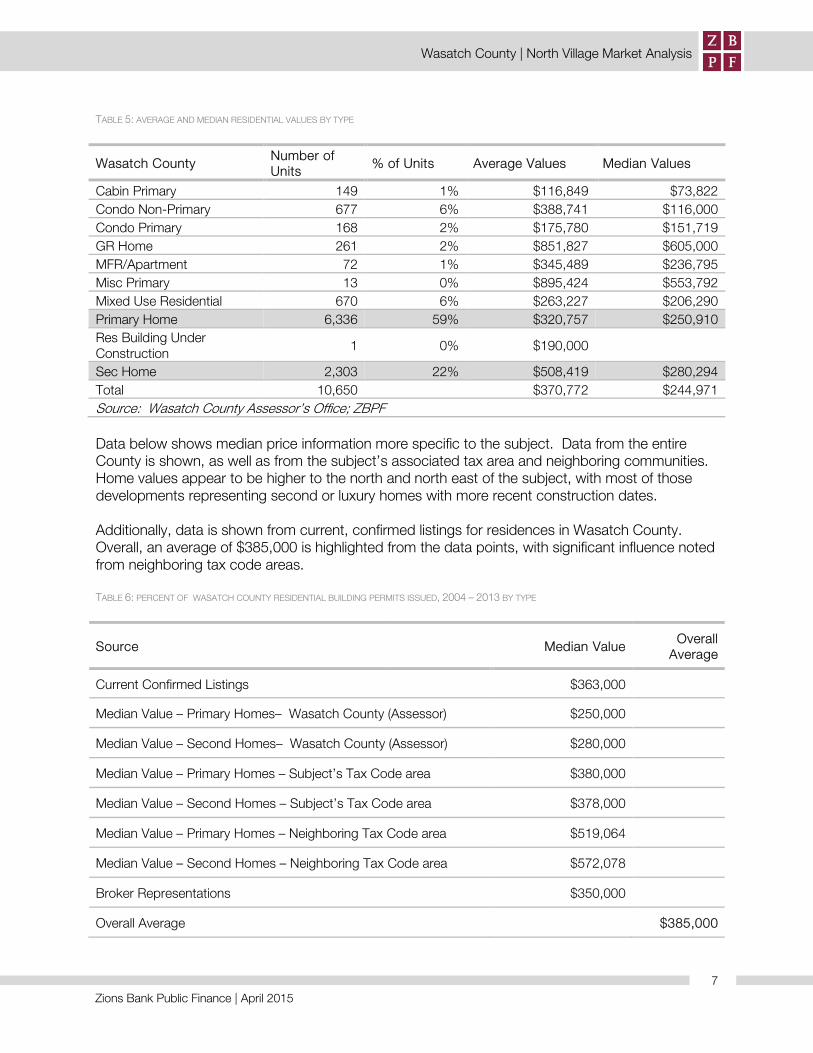
TABLE 5: AVERAGE AND MEDIAN RESIDENTIAL VALUES BY TYPE
Data below shows median price information more specific to the subject. Data from the entire County is shown, as well as from the subject’s associated tax area and neighboring communities. Home values appear to be higher to the north and north east of the subject, with most of those developments representing second or luxury homes with more recent construction dates. Additionally, data is shown from current, confirmed listings for residences in Wasatch County. Overall, an average of $385,000 is highlighted from the data points, with significant influence noted from neighboring tax code areas.
TABLE 6: PERCENT OF WASATCH COUNTY RESIDENTIAL BUILDING PERMITS ISSUED, 2004 – 2013 BY TYPE
Source Median Value Overall Average
Current Confirmed Listings $363,000
Median Value – Primary Homes– Wasatch County (Assessor) $250,000
Median Value – Second Homes– Wasatch County (Assessor) $280,000
Median Value – Primary Homes – Subject’s Tax Code area $380,000
Median Value – Second Homes – Subject’s Tax Code area $378,000
Median Value – Primary Homes – Neighboring Tax Code area $519,064
Median Value – Second Homes – Neighboring Tax Code area $572,078
Broker Representations $350,000
Overall Average $385,000
Wasatch County Number of Units % of Units Average Values Median Values
Cabin Primary 149 1% $116,849 $73,822 Condo Non-Primary 677 6% $388,741 $116,000 Condo Primary 168 2% $175,780 $151,719 GR Home 261 2% $851,827 $605,000 MFR/Apartment 72 1% $345,489 $236,795 Misc Primary 13 0% $895,424 $553,792 Mixed Use Residential 670 6% $263,227 $206,290 Primary Home 6,336 59% $320,757 $250,910 Res Building Under Construction 1 0% $190,000 Sec Home 2,303 22% $508,419 $280,294 Total 10,650 $370,772 $244,971 Source: Wasatch County Assessor’s Office; ZBPF
7
Zions Bank Public Finance | April 2015
Wasatch County | North Village Market Analysis
Second home construction, as noted previously, has increased in the most recent past. Overall, for the entire County, the median year of construction for these residential units was reported at 1996, with a median size of 1,750 square feet. As highlighted on the associated table, a median value for second homes in Wasatch County, as of early 2015, is shown at $280,000. Lot sizes for second homes are larger than those for primary homes, on a median basis. Overall, a median lot size of 0.73 acres is reflected for second homes. With more specificity to the subject’s tax area, a median value of $380,000 is shown, with a median home size of 1,775 square feet, and a median year of construction of 2000. Home values increase significantly to a median of $550,000 in the neighboring tax district (to the north and the east), with larger sizes of 2,200 square feet and more recent construction periods (median year built of 2006). Overall, brokers and developers suggest strong market conditions for residential properties in Wasatch County (as well as nearby Summit County). Median prices appear to be increasing, albeit at sustainable levels, and forecast demand suggests positive growth for the area. Employment and income characteristics (as noted by the preceding demographic information) furthermore suggest desirable conditions for residential construction. With consideration for the subject’s location and geography, the site appears to be supportable of a moderate amount of residential construction. Brokers and developers noted the desirability of the site, with particular notation to associated views and surrounding open space. Absorption highlighted at competitive developments indicates that demand could be anticipated to be moderate. A combination of both primary and second homes would take advantage of both use types, with the primary homes most likely to have appeal to move-up buyers from Heber and Midway. With starting prices in the $350,000 range, absorption could be feasible at upwards of 30 units per year for primary residences. With likely 0.5 acre lots (as noted previously), a total of 150 acres could readily be absorbed over a ten-year period. Construction of second home units on the subject property is also likely supported, based on previous data presented and representations made by numerous developers and brokers. With larger lots likely required for this use type (estimated at near 1.0 acres per lot), up to ten to 20 units per year could be absorbed. Consequently, nearly 100 to 200 acres could be utilized in a ten-year period for second-home residences. Flex Market Characteristics Flex market conditions in Wasatch County suggest that demand for this use type may be moderate to strong at present. Flex properties typically include a variety of warehousing and manufacturing area, with supportable office area. A greater percentage of office area (near 50 percent or more) typically results in an R&D (Research and Development) classification. Both flex and R&D space are historically subsets of the broader industrial market. Brokers report increasing demand for flex space in the Wasatch and Summit County markets. Current business parks in Wasatch County are primarily full, and spaces in Summit County show minimal, if any, vacancy. Additionally, owner/user market conditions have improved for this property sector due to more available financing.
8

Zions Bank Public Finance | April 2015
Wasatch County | North Village Market Analysis
Historically, flex space users have desired property that has close proximity to major transportation corridors and affordable living conditions. Flex space, as noted previously, has a combination of use types, with warehouse/storage and manufacturing areas typically showing clear heights in excess of 14 feet. Additional, specialized improvements include loading doors, increased power, and parking near 2.5 to 3.0 spaces per thousand rentable square feet. R&D buildouts have increased office, and in turn, parking ratios closer to 3.0 to 3.5 spaces per thousand rentable square feet. Existing developments in Summit and Wasatch Counties show a wide range in achievable lease rates, noted from roughly $10.00 to $20.00 per square foot per year, triple net. Typically, flex and R&D space tenants are responsible for nearly all operating costs, with ownership most often only directly covering the costs of management. Current market conditions suggest that tenant improvement allowances are not required, although are often provided with costs recovered through increased rent. Presently, only smaller industrial suites are available, and the supply of those units is severely limited. As noted by demographic data shown in following sections, jobs per capita in Wasatch County are well below statewide averages, and those reflected by Summit County. Additionally, average monthly wages lag in Wasatch County, with both of these indications suggesting that additional job opportunities should be supportable in the area. Roughly 74 percent of employed residents in Wasatch County commute outside of the area for employment. TABLE 7:JOBS PER CAPITA AND AVERAGE MONTHLY WAGES
Jobs per Capita Average Monthly Wage
Utah State 0.44 $3,415
Wasatch County 0.26 $2,721
Heber 0.34 $2,913
Midway 0.26 $2,341
Summit County 0.61 $3,049
Coalville 0.33 $3,231
Kamas 0.46 $2,337
Park City 1.42 $2,900
Source: Workforce Services, Annual Report of Labor Market Information, 2013
In accord with this data, brokers and developers report that numerous companies have inquired about the feasibility of increased flex space in Summit and Wasatch Counties. Developers also indicated that potential users include companies attempting to relocate from nearby states. Developmental restrictions are stringent enough in California that numerous companies have recently relocated to Utah, while others are reportedly searching for space within the State.
9
Zions Bank Public Finance | April 2015
Wasatch County | North Village Market Analysis
Furthermore, Utah’s desirable economic climate for businesses and families is reportedly attractive to out-of-state entities looking to relocate. Potential flex space tenants in Wasatch County reportedly desire reduced utility costs, periods of free rent, and tenant improvement allowances, in order to relocate or expand. Most businesses looking to relocate want to spend minimal up-front costs. Additionally, brokers suggest that tenants looking to move from Summit County to Wasatch County would likely anticipate rental rates moderately below those found in Park City. Considering competitive developments in the nearby area, an achievable rental rate of roughly $13.00 per square foot is likely supportable for flex space. For R&D buildout, which includes more dedicated office area and parking, an achievable rent is potentially feasible at $14.50 per square per year, triple net.
Most industrial/flex users will want a minimum of 2,500 square feet, while technology and R&D focused users will typically desire a minimum of 5,000 square feet and the potential of additional expansion in the immediate area. Developers familiar with the subject property reported that a variety of both flex and R&D uses would be desirable, thereby creating a technology or R&D-type park within the County. These same sources, as well as others, estimated that a new development could attract upwards of 150,000 to 200,000 square feet of leasing over a five to ten year period. If momentum is achieved with the signature of a notable or large tenant, annual leasing could be in excess of 25,000 square feet. With consideration for upwards of 200,000 square feet of flex/R&D space, a total area of roughly 20 acres would likely be required. This supports an attractive floor-to-area ratio (FAR) and allows for significant parking and green space. Highest and Best Use Consideration – Flex/R&D Space Construction of flex/R&D space on the subject property appears to be supportable with consideration for market trends, demographics, and representations made by active participants in the Wasatch County real estate market. Additionally, analysis is presented concerning the estimated financial feasibility of a development similar in scope to that outlined above (200,000 square feet and roughly 20 acres).
Competitive Flex Space Shows:
• Silver Creek Industrial Park - $14.00 NNN, 100% Occupancy
• Park City Business Park - $13.40 NNN, 95% Occupancy
• North East Business Park - $15.00-$16.00 NNN – Planned
• Summit Center - $18.50 NNN – Limited vacancy
10
Zions Bank Public Finance | April 2015
Wasatch County | North Village Market Analysis
As indicated previously, estimated market rent for flex and R&D space could be supported at between $13.00 and $14.50 per square foot per year, triple net. The accompanying exhibits highlight potential gross income based on estimated flex and R&D rents. Additionally, an owner would account for some reimbursements of operating expenses (other expenses are covered directly by the tenants). The exhibits note total estimated potential gross income, as well as a deduction for stabilized vacancy costs of five percent. This is a market standard, and takes into consideration likely periods of vacancy and turnover. At just five percent, the vacancy loss also reflects the currently perceived strength in the flex/R&D market. Deductions for stabilized vacancy from potential gross income result in effective gross income, from which is further deducted reimbursable and non-reimbursable expenses (management and reserves). Consequently, net operating income is shown following these noted costs. To conclude at an estimated market value, net operating income is divided by an appropriate capitalization rate, or, a first-year rate of return. This rate is gleaned from market activity, investor surveys (RERC, KORPACZ, various brokerage firms, etc.), and current rates from alternative investment options. Considering the subjectivity in selecting a capitalization rate (due primarily to the lack of similar, large-scale flex/R&D developments in Wasatch County), a range in rates is applied to net operating income to reflect a variance in estimated market values. Overall, with rates ranging from 8.0 to 9.0 percent, valuation of flex space (at $13.00 per square foot), reveals estimated market values from near $130 to $145 per square foot. For more traditional R&D space, this same range in rates reflects estimated values from approximately $145 to $165 per square foot. Financial feasibility is considered with analysis of the above price per square foot figures, as compared to the estimated cost of construction. Additional exhibits show the per square foot estimates for separate construction of flex and R&D space, as reflected by Marshall & Swift (a national cost estimating firm). Furthermore, consideration is made for all estimated soft (or indirect) costs, as well as the estimated value of land. Total cost of new construction, plus land value, is reflected on the respective exhibits. Finally, an appropriate developer’s profit is shown, which reflects the likely required return for the risk associated with the development. It also considers the size of the development and the amount of capital required for construction and land acquisition, as well as the potential holding period. Ultimately, the exhibits highlight a market value per square foot of roughly $145 to $160 per square foot. This is within the range shown by the valuation scenarios highlighting the capitalization of estimated market rent; however, both the flex and R&D cost projections are at the upper end of the respective variances, suggesting that additional incentives may be necessary for a developer to proceed further at the noted profit level. Consequently, if construction costs could be lowered due to reduced utility costs, favorable tax rates, or secondary investment funds, then financial feasibility could be more certain.
11
Zions Bank Public Finance | April 2015
Wasatch County | North Village Market Analysis
Demographics
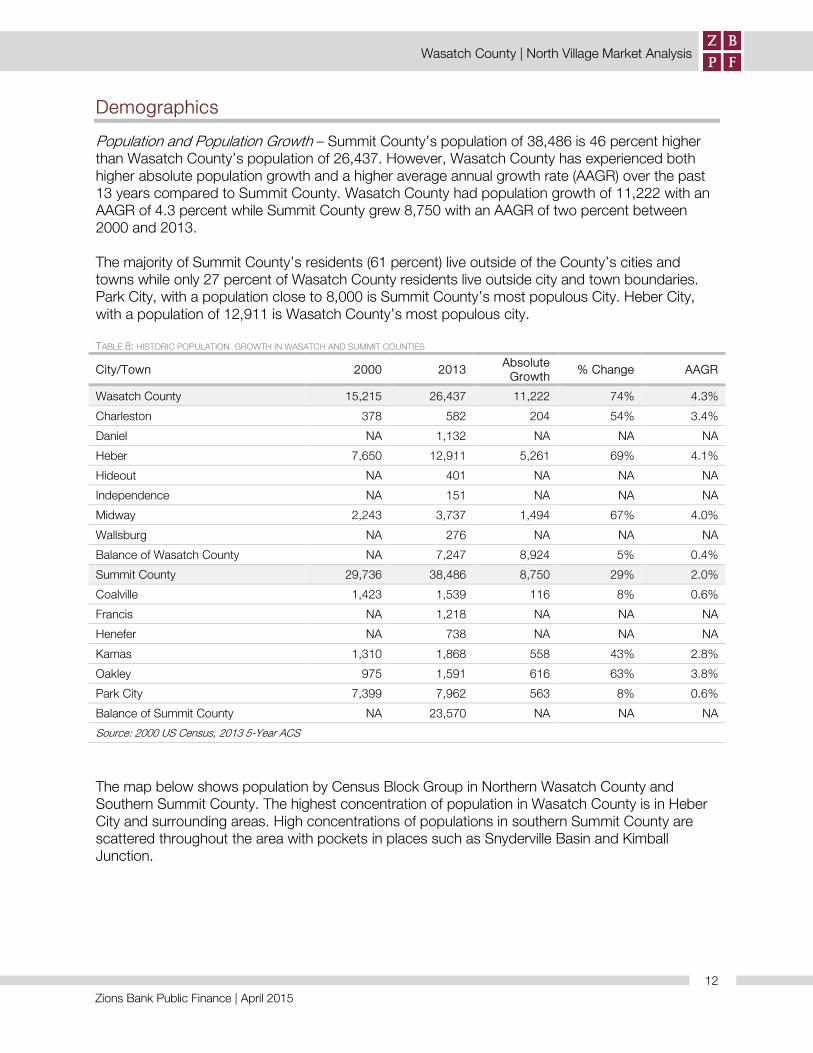
Population and Population Growth – Summit County’s population of 38,486 is 46 percent higher than Wasatch County’s population of 26,437. However, Wasatch County has experienced both higher absolute population growth and a higher average annual growth rate (AAGR) over the past 13 years compared to Summit County. Wasatch County had population growth of 11,222 with an AAGR of 4.3 percent while Summit County grew 8,750 with an AAGR of two percent between 2000 and 2013. The majority of Summit County’s residents (61 percent) live outside of the County’s cities and towns while only 27 percent of Wasatch County residents live outside city and town boundaries. Park City, with a population close to 8,000 is Summit County’s most populous City. Heber City, with a population of 12,911 is Wasatch County’s most populous city. TABLE 8: HISTORIC POPULATION GROWTH IN WASATCH AND SUMMIT COUNTIES
City/Town 2000 2013 Absolute Growth % Change AAGR
Wasatch County 15,215 26,437 11,222 74% 4.3%
Charleston 378 582 204 54% 3.4%
Daniel NA 1,132 NA NA NA
Heber 7,650 12,911 5,261 69% 4.1%
Hideout NA 401 NA NA NA
Independence NA 151 NA NA NA
Midway 2,243 3,737 1,494 67% 4.0%
Wallsburg NA 276 NA NA NA
Balance of Wasatch County NA 7,247 8,924 5% 0.4%
Summit County 29,736 38,486 8,750 29% 2.0%
Coalville 1,423 1,539 116 8% 0.6%
Francis NA 1,218 NA NA NA
Henefer NA 738 NA NA NA
Kamas 1,310 1,868 558 43% 2.8%
Oakley 975 1,591 616 63% 3.8%
Park City 7,399 7,962 563 8% 0.6%
Balance of Summit County NA 23,570 NA NA NA
Source: 2000 US Census, 2013 5-Year ACS
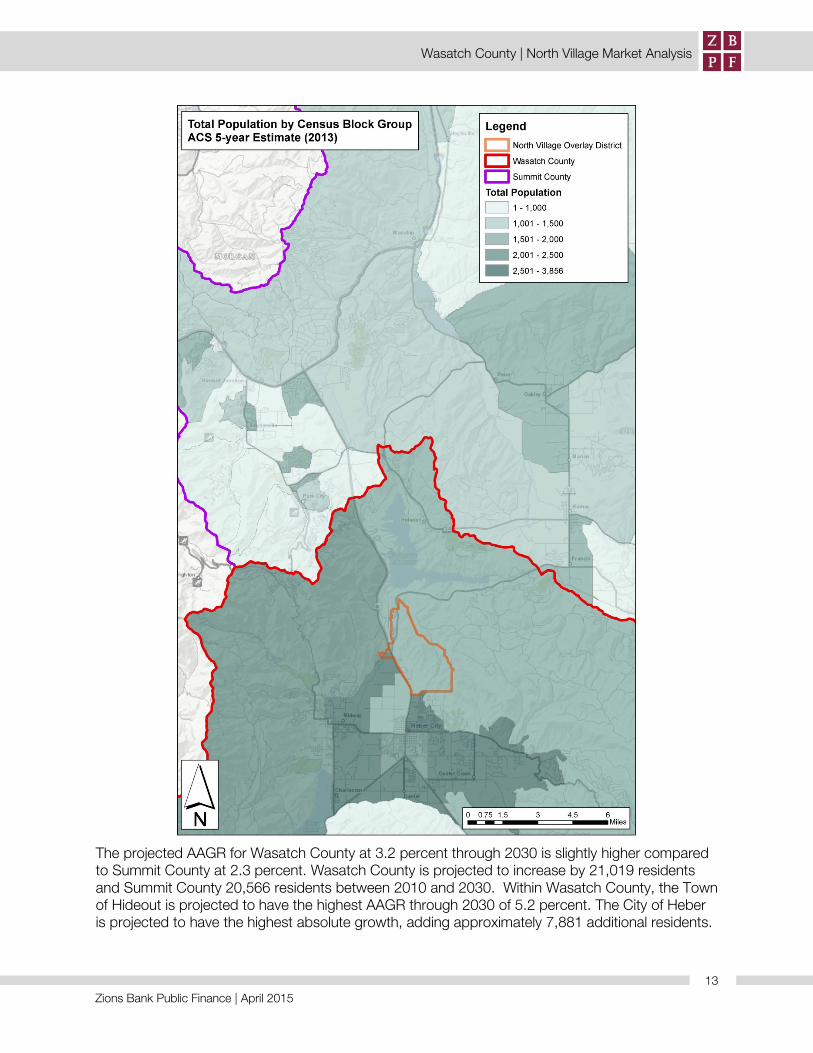
The map below shows population by Census Block Group in Northern Wasatch County and Southern Summit County. The highest concentration of population in Wasatch County is in Heber City and surrounding areas. High concentrations of populations in southern Summit County are scattered throughout the area with pockets in places such as Snyderville Basin and Kimball Junction.
12
Zions Bank Public Finance | April 2015
Wasatch County | North Village Market Analysis
The projected AAGR for Wasatch County at 3.2 percent through 2030 is slightly higher compared to Summit County at 2.3 percent. Wasatch County is projected to increase by 21,019 residents and Summit County 20,566 residents between 2010 and 2030. Within Wasatch County, the Town of Hideout is projected to have the highest AAGR through 2030 of 5.2 percent. The City of Heber is projected to have the highest absolute growth, adding approximately 7,881 additional residents.
13
Zions Bank Public Finance | April 2015
Wasatch County | North Village Market Analysis
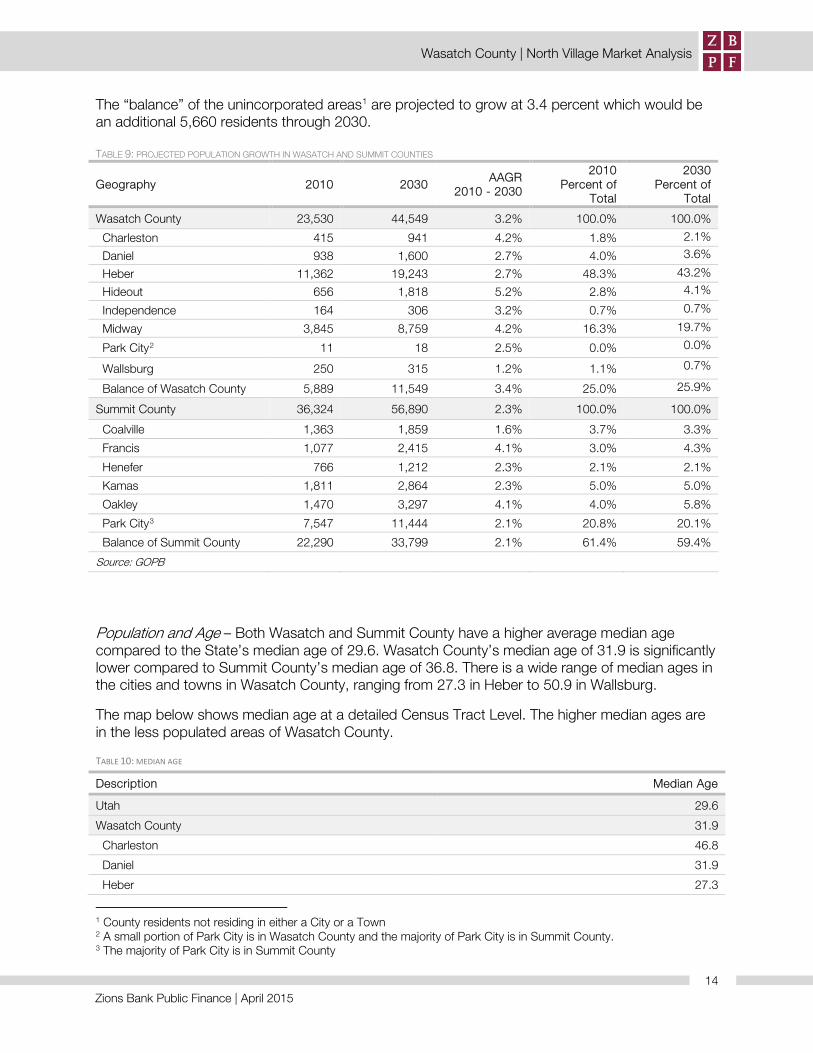
The “balance” of the unincorporated areas1 are projected to grow at 3.4 percent which would be an additional 5,660 residents through 2030. TABLE 9: PROJECTED POPULATION GROWTH IN WASATCH AND SUMMIT COUNTIES
Geography 2010 2030 AAGR 2010 - 2030
2010 Percent of
Total
2030 Percent of
Total
Wasatch County 23,530 44,549 3.2% 100.0% 100.0%
Charleston 415 941 4.2% 1.8% 2.1%
Daniel 938 1,600 2.7% 4.0% 3.6%
Heber 11,362 19,243 2.7% 48.3% 43.2%
Hideout 656 1,818 5.2% 2.8% 4.1%
Independence 164 306 3.2% 0.7% 0.7%
Midway 3,845 8,759 4.2% 16.3% 19.7%
Park City2 11 18 2.5% 0.0% 0.0%
Wallsburg 250 315 1.2% 1.1% 0.7%
Balance of Wasatch County 5,889 11,549 3.4% 25.0% 25.9%
Summit County 36,324 56,890 2.3% 100.0% 100.0%
Coalville 1,363 1,859 1.6% 3.7% 3.3%
Francis 1,077 2,415 4.1% 3.0% 4.3%
Henefer 766 1,212 2.3% 2.1% 2.1%
Kamas 1,811 2,864 2.3% 5.0% 5.0%
Oakley 1,470 3,297 4.1% 4.0% 5.8%
Park City3 7,547 11,444 2.1% 20.8% 20.1%
Balance of Summit County 22,290 33,799 2.1% 61.4% 59.4%
Source: GOPB
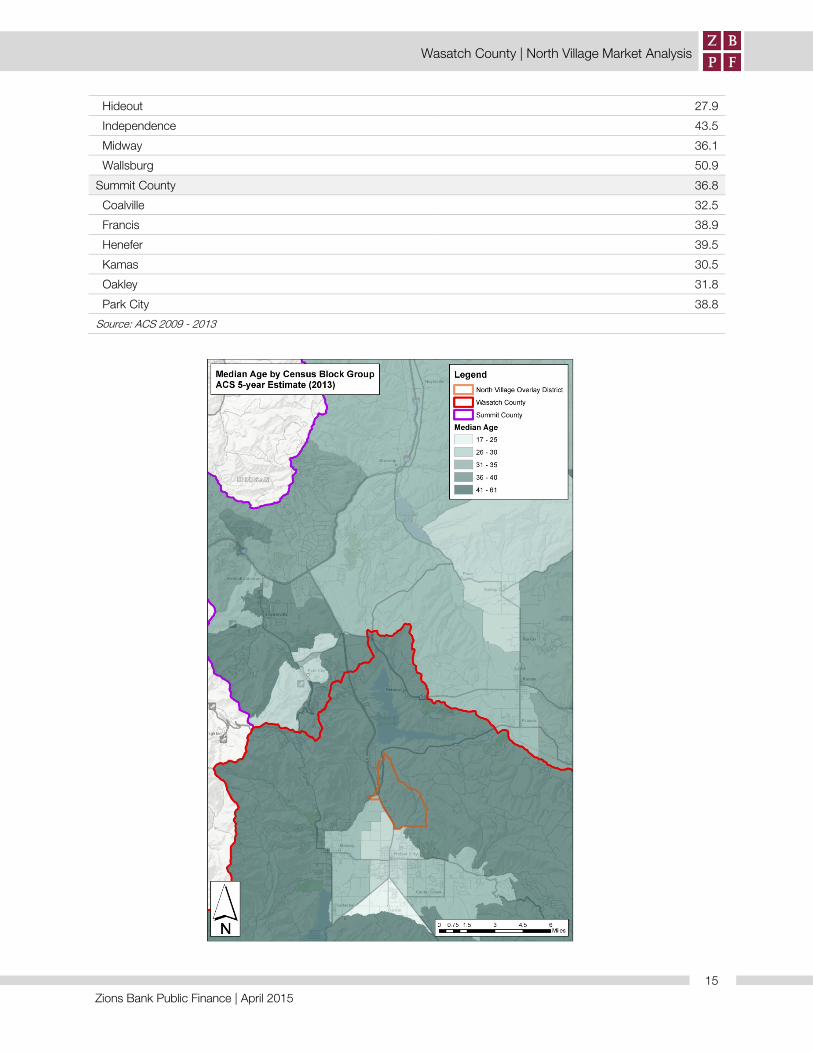
Population and Age – Both Wasatch and Summit County have a higher average median age compared to the State’s median age of 29.6. Wasatch County’s median age of 31.9 is significantly lower compared to Summit County’s median age of 36.8. There is a wide range of median ages in the cities and towns in Wasatch County, ranging from 27.3 in Heber to 50.9 in Wallsburg. The map below shows median age at a detailed Census Tract Level. The higher median ages are in the less populated areas of Wasatch County. TABLE 10: MEDIAN AGE
1 County residents not residing in either a City or a Town 2 A small portion of Park City is in Wasatch County and the majority of Park City is in Summit County. 3 The majority of Park City is in Summit County
Description Median Age
Utah 29.6
Wasatch County 31.9
Charleston 46.8
Daniel 31.9
Heber 27.3
14
Zions Bank Public Finance | April 2015
Wasatch County | North Village Market Analysis
Hideout 27.9
Independence 43.5
Midway 36.1
Wallsburg 50.9
Summit County 36.8
Coalville 32.5
Francis 38.9
Henefer 39.5
Kamas 30.5
Oakley 31.8
Park City 38.8
Source: ACS 2009 - 2013
15

Zions Bank Public Finance | April 2015
Wasatch County | North Village Market Analysis
Compared to the State of Utah, Wasatch County has a similar percent of population for residents under 19 years of age. Wasatch County has approximately half the percent of residents’ ages 20 through 24 years old compared to the State which could be a result of the absence of higher educational institutions in Wasatch County. The percent of population for the remaining age groups is similar between the County and the State. The overall percent of males and females in both the County and the State is similar at 50 percent for each sex.
TABLE 11: HOUSEHOLD SIZE Household Size – The average household size of 3.21 in Wasatch County is higher compared to the State and Summit County. Heber has the highest household size compared to surrounding areas. This is consistent with the lower median age in Heber which generally indicates young families with children living at home.
Description Household
Size
Utah 3.12
Wasatch County 3.21
Charleston 2.37
Heber 3.52
Independence 2.44
Midway 2.01
Wallsburg 3.41
Summit County 2.72
Coalville 2.61
Kamas 2.57
Oakley 2.71
Park City 2.43
Source: ACS 2009 - 2013
16

Zions Bank Public Finance | April 2015
Wasatch County | North Village Market Analysis
The map below shows household sizes throughout northern Wasatch County and southern Summit County at a detailed Census Tract Level. The largest household sizes in Wasatch County are in Heber and areas surrounding Heber.
17
Zions Bank Public Finance | April 2015
Wasatch County | North Village Market Analysis
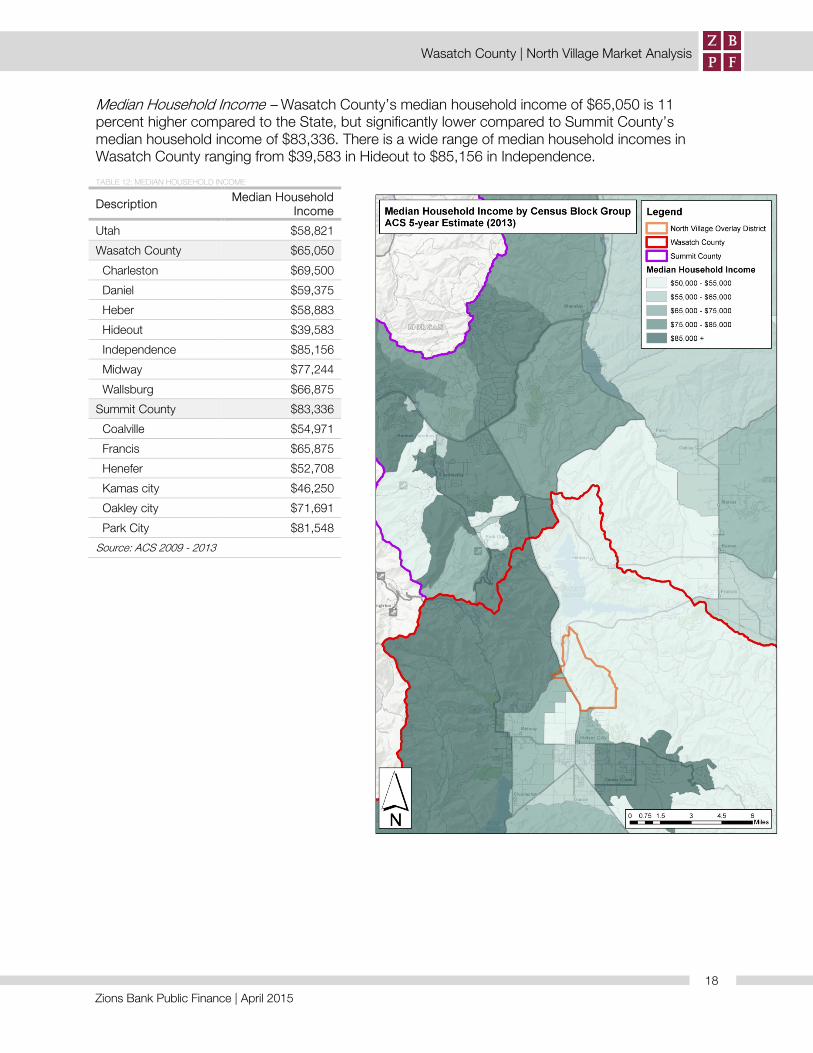
Median Household Income – Wasatch County’s median household income of $65,050 is 11 percent higher compared to the State, but significantly lower compared to Summit County’s median household income of $83,336. There is a wide range of median household incomes in Wasatch County ranging from $39,583 in Hideout to $85,156 in Independence. TABLE 12: MEDIAN HOUSEHOLD INCOME
Description Median Household Income
Utah $58,821
Wasatch County $65,050
Charleston $69,500
Daniel $59,375
Heber $58,883
Hideout $39,583
Independence $85,156
Midway $77,244
Wallsburg $66,875
Summit County $83,336
Coalville $54,971
Francis $65,875
Henefer $52,708
Kamas city $46,250
Oakley city $71,691
Park City $81,548
Source: ACS 2009 - 2013
18

Zions Bank Public Finance | April 2015
Wasatch County | North Village Market Analysis
Household Income – Table 13 shows number of households in each income range for Summit and Wasatch Counties. The income range with the highest percent of households is between $50,000 to $74,999 for Wasatch County (approximately 25 percent) and between $100,000 to $149,999 for Summit County (approximately 17 percent). A little over 11 percent of Wasatch County households earn $100,000 or more compared to nearly 25 percent of households in Summit County. TABLE 13: HOUSEHOLD INCOME IN SUMMIT AND WASATCH COUNTIES
Income Range Summit County Percent of Total Wasatch County Percent of Total
Less than $10,000 444 3.3% 381 5.0%
$10,000 to $14,999 373 2.7% 260 3.4%
$15,000 to $24,999 839 6.2% 570 7.5%
$25,000 to $34,999 703 5.2% 423 5.6%
$35,000 to $49,999 1,451 10.6% 924 12.2%
$50,000 to $74,999 2,211 16.2% 1,878 24.7%
$75,000 to $99,999 1,953 14.3% 1,173 15.4%
$100,000 to $149,999 2,296 16.8% 1,134 14.9%
$150,000 to $199,999 1,390 10.2% 418 5.5%
$200,000 or more 1,967 14.4% 441 5.8%
Per Capita Income - Similar to median household income, Wasatch County’s per capita income of $25,777 is higher compared to the State and significantly lower compared to Summit County’s average per capita income of $42,462. Per capita income in Wasatch County ranges from a low of $16,370 in Hideout to a high of $33,730 in Charleston. Park City has the highest per capita income compared to areas in Wasatch and Summit Counties. TABLE 14: PER CAPITA INCOME
Description Per Capita Income
Utah State $23,873
Wasatch County $25,777
Charleston $33,730
Daniel $24,505
Heber $19,687
Hideout $16,370
Independence $21,868
Midway $30,459
Wallsburg $26,510
Summit County $42,462
Coalville $19,037
Francis $27,482
Henefer $22,855
Kamas $18,918
Oakley $28,301
Park City $50,692
19
Zions Bank Public Finance | April 2015
Wasatch County | North Village Market Analysis
Description Per Capita Income
Source: ACS 2009 - 2013
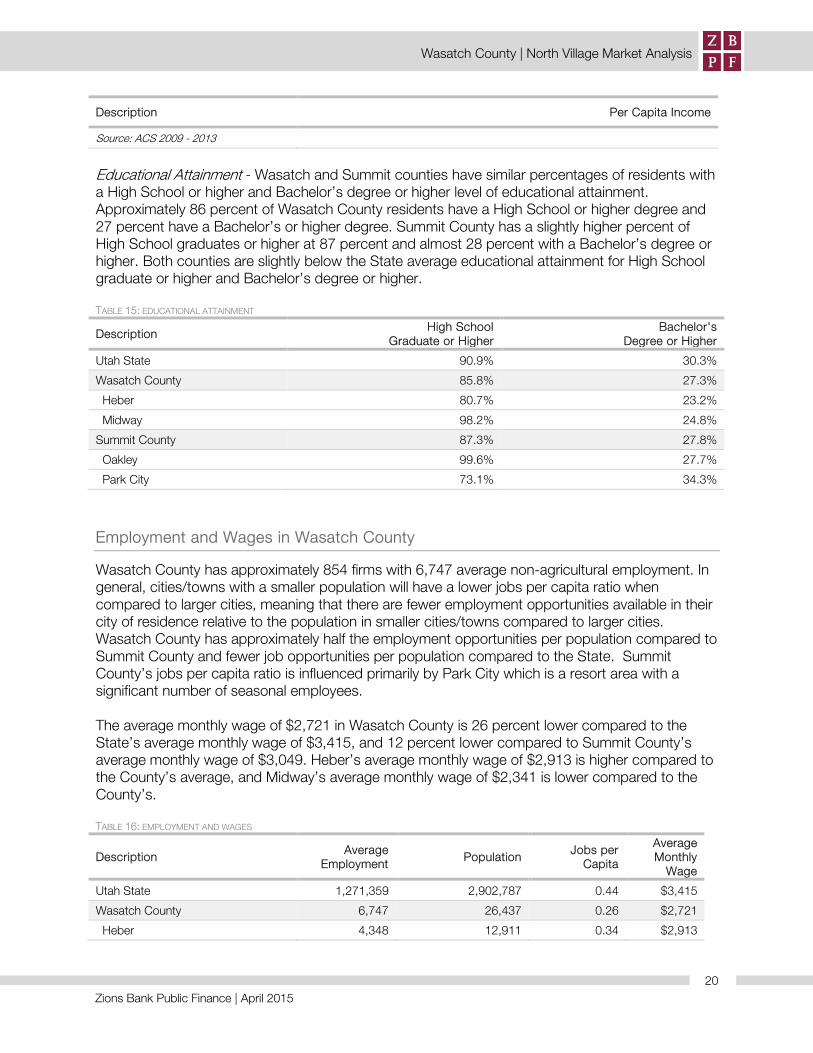
Educational Attainment - Wasatch and Summit counties have similar percentages of residents with a High School or higher and Bachelor’s degree or higher level of educational attainment. Approximately 86 percent of Wasatch County residents have a High School or higher degree and 27 percent have a Bachelor’s or higher degree. Summit County has a slightly higher percent of High School graduates or higher at 87 percent and almost 28 percent with a Bachelor’s degree or higher. Both counties are slightly below the State average educational attainment for High School graduate or higher and Bachelor’s degree or higher. TABLE 15: EDUCATIONAL ATTAINMENT
Description High School
Graduate or Higher Bachelor's
Degree or Higher
Utah State 90.9% 30.3%
Wasatch County 85.8% 27.3%
Heber 80.7% 23.2%
Midway 98.2% 24.8%
Summit County 87.3% 27.8%
Oakley 99.6% 27.7%
Park City 73.1% 34.3%
Employment and Wages in Wasatch County
Wasatch County has approximately 854 firms with 6,747 average non-agricultural employment. In general, cities/towns with a smaller population will have a lower jobs per capita ratio when compared to larger cities, meaning that there are fewer employment opportunities available in their city of residence relative to the population in smaller cities/towns compared to larger cities. Wasatch County has approximately half the employment opportunities per population compared to Summit County and fewer job opportunities per population compared to the State. Summit County’s jobs per capita ratio is influenced primarily by Park City which is a resort area with a significant number of seasonal employees. The average monthly wage of $2,721 in Wasatch County is 26 percent lower compared to the State’s average monthly wage of $3,415, and 12 percent lower compared to Summit County’s average monthly wage of $3,049. Heber’s average monthly wage of $2,913 is higher compared to the County’s average, and Midway’s average monthly wage of $2,341 is lower compared to the County’s. TABLE 16: EMPLOYMENT AND WAGES
Description Average Employment Population Jobs per
Capita
Average Monthly
Wage
Utah State 1,271,359 2,902,787 0.44 $3,415
Wasatch County 6,747 26,437 0.26 $2,721
Heber 4,348 12,911 0.34 $2,913
20
Zions Bank Public Finance | April 2015
Wasatch County | North Village Market Analysis
Description Average Employment
Population Jobs per Capita
Average Monthly
Wage
Midway 965 3,737 0.26 $2,341
Summit County 23,378 38,486 0.61 $3,049
Coalville 506 1,539 0.33 $3,231
Kamas 858 1,868 0.46 $2,337
Park City 11,328 7,962 1.42 $2,900
Source: Annual Report of Labor Market Information, 2013
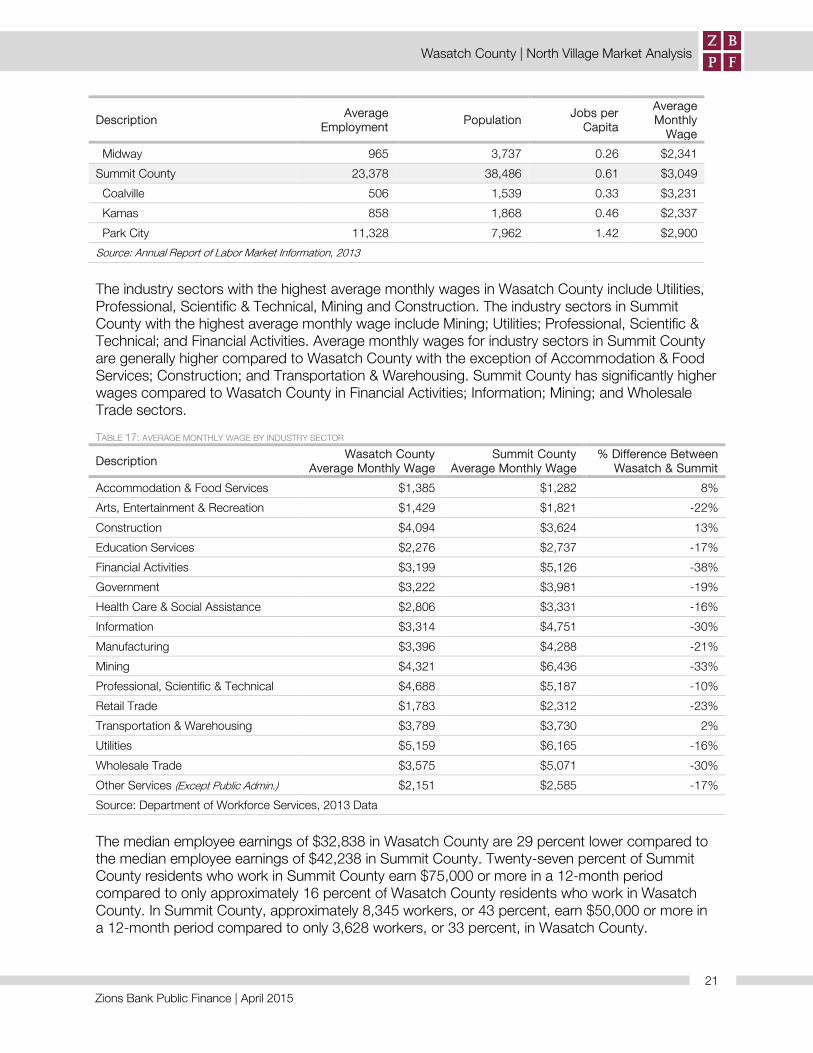
The industry sectors with the highest average monthly wages in Wasatch County include Utilities, Professional, Scientific & Technical, Mining and Construction. The industry sectors in Summit County with the highest average monthly wage include Mining; Utilities; Professional, Scientific & Technical; and Financial Activities. Average monthly wages for industry sectors in Summit County are generally higher compared to Wasatch County with the exception of Accommodation & Food Services; Construction; and Transportation & Warehousing. Summit County has significantly higher wages compared to Wasatch County in Financial Activities; Information; Mining; and Wholesale Trade sectors. TABLE 17: AVERAGE MONTHLY WAGE BY INDUSTRY SECTOR
Description Wasatch County Average Monthly Wage
Summit County Average Monthly Wage
% Difference Between Wasatch & Summit
Accommodation & Food Services $1,385 $1,282 8%
Arts, Entertainment & Recreation $1,429 $1,821 -22%
Construction $4,094 $3,624 13%
Education Services $2,276 $2,737 -17%
Financial Activities $3,199 $5,126 -38%
Government $3,222 $3,981 -19%
Health Care & Social Assistance $2,806 $3,331 -16%
Information $3,314 $4,751 -30%
Manufacturing $3,396 $4,288 -21%
Mining $4,321 $6,436 -33%
Professional, Scientific & Technical $4,688 $5,187 -10%
Retail Trade $1,783 $2,312 -23%
Transportation & Warehousing $3,789 $3,730 2%
Utilities $5,159 $6,165 -16%
Wholesale Trade $3,575 $5,071 -30%
Other Services (Except Public Admin.) $2,151 $2,585 -17%
Source: Department of Workforce Services, 2013 Data
The median employee earnings of $32,838 in Wasatch County are 29 percent lower compared to the median employee earnings of $42,238 in Summit County. Twenty-seven percent of Summit County residents who work in Summit County earn $75,000 or more in a 12-month period compared to only approximately 16 percent of Wasatch County residents who work in Wasatch County. In Summit County, approximately 8,345 workers, or 43 percent, earn $50,000 or more in a 12-month period compared to only 3,628 workers, or 33 percent, in Wasatch County.
21

Zions Bank Public Finance | April 2015
Wasatch County | North Village Market Analysis
TABLE 18: EMPLOYEE EARNINGS IN SUMMIT AND WASATCH COUNTIES
Earnings Summit County
Percent of Total
Wasatch County
Percent of Total
$1 to $9,999 or loss 2,754 14.3% 2,267 20.5%
$10,000 to $14,999 1,136 5.9% 675 6.1%
$15,000 to $24,999 2,252 11.7% 1,371 12.4%
$25,000 to $34,999 2,022 10.5% 1,349 12.2%
$35,000 to $49,999 2,752 14.3% 1,769 16.0%
$50,000 to $64,999 2,386 12.4% 1,548 14.0%
$65,000 to $74,999 693 3.6% 343 3.1%
$75,000 or more 5,266 27.3% 1,737 15.7%
Total 19,261 100% 11,059 100%
Median Earnings (dollars) $42,238 $32,838
Source: ACS 2009 – 2013 (2013 inflation–adjusted dollars)
The majority of employees (55%) in Wasatch County work in the Government, Leisure & Hospitality and the Trade, Transportation & Utilities industries. The highest number of firms are in the Professional & Business Services, Construction, and Trade, Transportation & Utilities sectors. TABLE 19: EMPLOYMENT BY INDUSTRY IN WASATCH COUNTY
Description Average
Employment Percent of Total # of Firms Percent of
Total
Mining 11 0.2% 4 0.5%
Construction 853 12.6% 153 17.9%
Manufacturing 240 3.6% 34 4.0%
Trade, Transportation, & Utilities 1,267 18.8% 147 17.2%
Information 99 1.5% 14 1.6%
Financial Activities 292 4.3% 75 8.8%
Professional & Business Services 682 10.1% 164 19.2%
Education & Health Services 657 9.7% 84 9.8%
Leisure & Hospitality 1,146 17.0% 67 7.8%
Other Services 193 2.9% 50 5.9%
Government 1,307 19.4% 62 7.3%
Total 6,747 100% 854 100.0%
Source: Annual Report of Labor Market Information, 2013
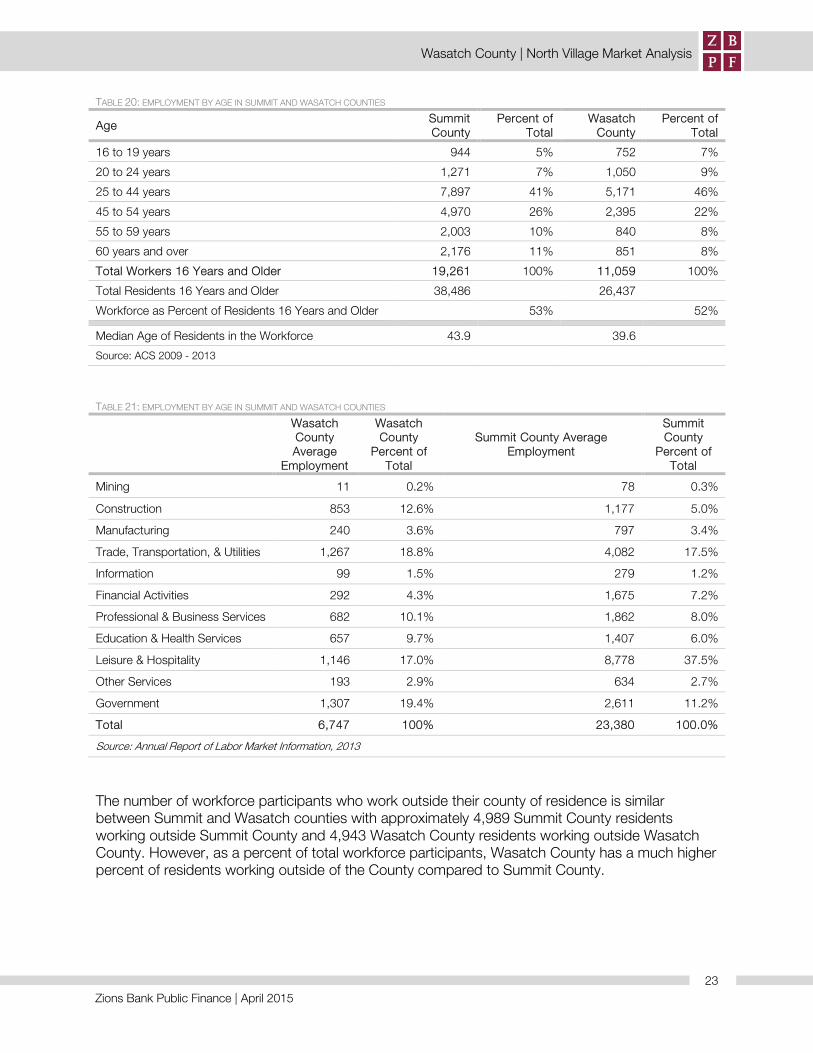
Wasatch County has approximately 11,059 residents over the age of 16 who are currently workforce participants. Summit County has approximately 19,261 residents over the age of 16 who are currently workforce participants. The majority of workers for both counties are between the ages of 25 to 44. Summit County has a slightly higher percent of workers between the ages of 45 to 54 compared to Wasatch County while Wasatch County has a slightly higher percent of workers 20 to 24 years of age compared to Summit County. Summit County has a higher percent of workers age 55 years and older compared to Wasatch County which is consistent with the higher median age of residents in the workforce of 43.9 in Summit County compared to 39.6 in Wasatch County. Workforce participation as a percent of residents 16 years and older is similar between the two counties at 53 percent for Summit County and 52 percent for Wasatch County.
22
Zions Bank Public Finance | April 2015
Wasatch County | North Village Market Analysis
TABLE 20: EMPLOYMENT BY AGE IN SUMMIT AND WASATCH COUNTIES
Age Summit County
Percent of Total
Wasatch County
Percent of Total
16 to 19 years 944 5% 752 7%
20 to 24 years 1,271 7% 1,050 9%
25 to 44 years 7,897 41% 5,171 46%
45 to 54 years 4,970 26% 2,395 22%
55 to 59 years 2,003 10% 840 8%
60 years and over 2,176 11% 851 8%
Total Workers 16 Years and Older 19,261 100% 11,059 100%
Total Residents 16 Years and Older 38,486 26,437
Workforce as Percent of Residents 16 Years and Older 53% 52%
Median Age of Residents in the Workforce 43.9 39.6
Source: ACS 2009 - 2013
TABLE 21: EMPLOYMENT BY AGE IN SUMMIT AND WASATCH COUNTIES
Wasatch County Average
Employment
Wasatch County
Percent of Total
Summit County Average Employment
Summit County
Percent of Total
Mining 11 0.2% 78 0.3%
Construction 853 12.6% 1,177 5.0%
Manufacturing 240 3.6% 797 3.4%
Trade, Transportation, & Utilities 1,267 18.8% 4,082 17.5%
Information 99 1.5% 279 1.2%
Financial Activities 292 4.3% 1,675 7.2%
Professional & Business Services 682 10.1% 1,862 8.0%
Education & Health Services 657 9.7% 1,407 6.0%
Leisure & Hospitality 1,146 17.0% 8,778 37.5%
Other Services 193 2.9% 634 2.7%
Government 1,307 19.4% 2,611 11.2%
Total 6,747 100% 23,380 100.0%
Source: Annual Report of Labor Market Information, 2013
The number of workforce participants who work outside their county of residence is similar between Summit and Wasatch counties with approximately 4,989 Summit County residents working outside Summit County and 4,943 Wasatch County residents working outside Wasatch County. However, as a percent of total workforce participants, Wasatch County has a much higher percent of residents working outside of the County compared to Summit County.
23
Zions Bank Public Finance | April 2015
Wasatch County | North Village Market Analysis
TABLE 22: PLACE OF WORK IN SUMMIT AND WASATCH COUNTIES
Place of Work Summit County
Percent of Total
Wasatch County
Percent of Total
Worked in County of Residence 13,695 73% 5,795 54%
Worked Outside of County of Residence (In-State) 4,989 27% 4,943 46%
Total Worked in State of Residence 18,683 100% 10,738 100%
Worked Outside of State of Residence 578 321
Total 19,261 11,059
Source: ACS 2009 - 2013
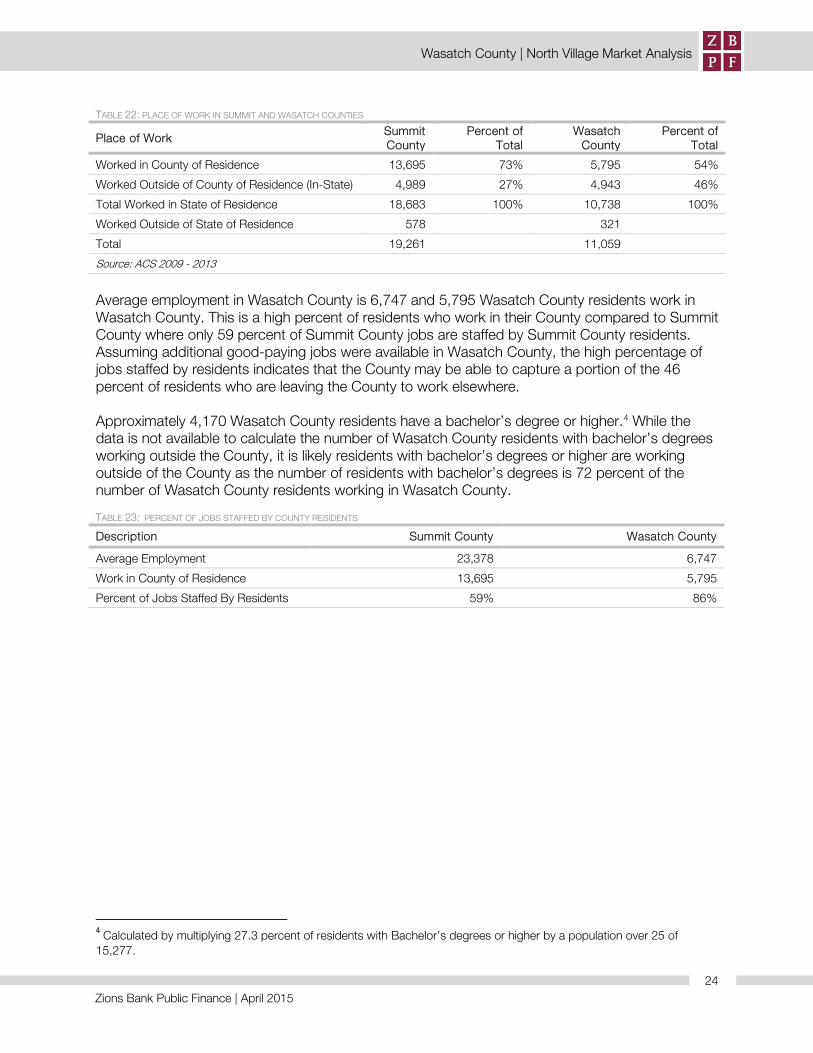
Average employment in Wasatch County is 6,747 and 5,795 Wasatch County residents work in Wasatch County. This is a high percent of residents who work in their County compared to Summit County where only 59 percent of Summit County jobs are staffed by Summit County residents. Assuming additional good-paying jobs were available in Wasatch County, the high percentage of jobs staffed by residents indicates that the County may be able to capture a portion of the 46 percent of residents who are leaving the County to work elsewhere. Approximately 4,170 Wasatch County residents have a bachelor’s degree or higher.4 While the data is not available to calculate the number of Wasatch County residents with bachelor’s degrees working outside the County, it is likely residents with bachelor’s degrees or higher are working outside of the County as the number of residents with bachelor’s degrees is 72 percent of the number of Wasatch County residents working in Wasatch County. TABLE 23: PERCENT OF JOBS STAFFED BY COUNTY RESIDENTS
Description Summit County Wasatch County
Average Employment 23,378 6,747
Work in County of Residence 13,695 5,795
Percent of Jobs Staffed By Residents 59% 86%
4 Calculated by multiplying 27.3 percent of residents with Bachelor’s degrees or higher by a population over 25 of 15,277.
24