BANCOSTA Weekly Market Report
16
Week 13/2022 (26 Mar – 01 Apr) Comment: European Union Coal Imports weekly market report
-
Upload
khangminh22 -
Category
Documents
-
view
0 -
download
0
Transcript of BANCOSTA Weekly Market Report

Week 13/2022 (26 Mar – 01 Apr)
Comment: European Union Coal Imports
weeklymarketreport

MARKET REPORT – WEEK 13/2022COMMENT 2
0.0
2.0
4.0
6.0
8.0
10.0
12.0
14.0
Jan Feb Mar Apr May Jun Jul Aug Sep Oct Nov Dec
mln
to
nn
es
2018 2019 2020 2021 2022
European Union - Monthly Coal Imports - Seasonality(Apr 2022 ; source: refinitiv ; seaborne only ; all bulkers ; in mln tonnes)
7.7
3.22.7
1.7
0.40.2 0.3
1.2
9.3
2.7
3.9
2.3
0.3 0.2 0.2
1.0
9.3
4.4
3.5 3.4
1.2
0.6 0.6
1.7
0.0
1.0
2.0
3.0
4.0
5.0
6.0
7.0
8.0
9.0
10.0
Russia USA Australia Colombia EU27 S Africa Ukraine Others/Unknown
mln
to
nn
es
2020 (1-3) 2021 (1-3) 2022 (1-3)
(Apr 2022 ; source: refinitiv ; seaborne only ; all bulkers ; in mln tonnes)
European Union - Coal Imports by Source in Jan-Mar
EUROPEAN UNION COAL IMPORTSFollowing a disastrous 2020, with theworld hit by lockdowns and recessionpretty much everywhere, globalseaborne coal trade managed torebound to some extent in 2021.
In the full 12 months of 2021, globalseaborne coal exports increased by+4.4% y-o-y to 1149 mln tonnes, from1101 mln tonnes in 2020, according tovessels tracking data from Refinitiv.
This however was still well below thelevels we had in pre-Covid times, being-9.9% down from the 1276 mln tonnesshipped during 2019.
In the first quarter of 2022, however,global coal trade declined again.
In the January to March period of2022, global coal loadings declined by-6.0% y-o-y to 256.3 mln tonnes, from272.7 mln tonnes in the first quarter oflast year.
Most of the decline was in he monthof January, which was particularlydisappointing at just 77.3 mln t, downby -17.2% y-o-y from January 2021.
The European Union is now the fifthlargest seaborne importer of coal inthe world, after China, India, Japanand South Korea.
In 2021, the EU accounted for 7.5% ofglobal seaborne coal shipments.
The EU’s seaborne coal imports in the12 months of 2021 increased by+21.2% y-o-y to 81.1 mln tonnes.
This was mostly a rebound from amassive -32.9% y-o-y decline in 2020caused by Covid lockdowns.
Previous years also saw a negative
trend, with European coal importsdeclining by -18.3% y-o-y in 2019 andby -7.6% y-o-y in 2018, as Europeancountries progressively abandon coalas a source of energy and embracenatural gas and renewables.
In the first 3 months of 2022, coalimports into the EU further increasedby +23.6% y-o-y to 24.5 mln tonnes.
Europe was the only major regionaside from South Korea postingpositive coal import trends this year.
For comparison, in 1Q2022, China’scoal imports declined by -36.0% y-o-y,India’s were down -12.8% y-o-y, whistJapan saw a modest +1.6% y-o-yincrease.
The main coal import terminals in theEuropean Union (27) are:
Rotterdam in the Netherlands (22.2mln tonnes discharged in 2021),Amsterdam Netherlands (6.6 mlntonnes), Hamburg Germany (5.1 mlntonnes), Dunkirk France (4.4), GijonSpain (4.3), Ljmuiden Netherlands(3.3), Gdansk Poland (2.8), VlissingenNetherlands (2.4), Fos France (2.3),Taranto Italy (2.2), EemshavenNetherlands (1.8), Ghent Belgium(1.8), Civitavecchia Italy (1.7),Tarragona Spain (1.6), RostockGermany (1.2), WilhelmshavenGermany (1.2), Ploce Croatia (1.1),Koper Slovenia (1.0).
In terms of sources of the shipments,Europe was and still now remainsheavily dependant on Russia.
In the whole of 2021, as much as 46%of the EU’s seaborne coal imports
were sourced from Russia.
In 2021, imports from Russia increasedby +22.4% y-o-y to 37.5 mln tonnes.
The second most important supplier toEurope is Australia, accounting for 17%of Europe’s imports in 2021.
In 2021, imports from Australiaincreased by +22.9% y-o-y to 13.5 mlntonnes.
The third largest supplier to Europeare the USA, accounting for 15% of theEU’s seaborne imports during 2021.
In 2021, imports from the USAincreased +18.7% y-o-y to 12.5 mln t.
In fourth place was Colombia, with a10% share of Europe’s coal imports.
In 2021, 7.8 mln tonnes wereimported from Colombia to the EU, up+48.4% y-o-y.
In the first 3 months of 2022, Russiawas still accounting for 38% ofEurope’s coal imports.
In Jan-Mar 2022, the EU imported 9.3mln tonnes of coal from Russia by sea,down -0.4% y-o-y.
In the same 3 months, imports fromthe USA increased by +60.2% y-o-y to4.4 mln tonnes, from Colombia by+50.4% y-o-y to 3.4 mln tonnes, whilstfrom Australia imports declined by-10.8% y-o-y to 3.5 mln tonnes.
Do note that imports from Russiacontinued quite steadily also in March2022, after the start of the war.
In March 2022, the EU imported 3.1mln tonnes of coal from Russia, down-13.8% y-o-y, still accounting for 32%of the EU’s total coal imports in March.

MARKET REPORT – WEEK 13/2022
Slightly negative week for Capesizeindexes, which have seen furtherrate drops, still due to theuncertainty of the Black Seasituation, to the ongoing bunker rally,which appears to be nearingcompletion as bunker prices arealigning down to pre-war levels.
The sentiment remains positive, withseveral period deals closed since thebeginning of February, with pricesstill ranging between $25k and $30kfor standard Capes and between$30k and $35k for Newcastlemaxes.
The BCI fell by only 23 points to closeat $1,864, while the 5TC index fell by188 points to close at $15,460/d.
The previous week's trend has beenconfirmed by this one for the C5route from West Australia/China, anddespite a consistent number offixtures and deals in the area, theindex closed negatively at $10.64/mt,indicating a total loss of 1 point,primarily due to the aforementionedfall in bunker rates in Singapore.
The same pattern held true for histranspacific round trip, which set hisbenchmark at $16,275/d with a totalloss of $3,125/d.
Strange week for the C17 route fromSaldanha Bay to Qingdao, which sawthe index fall for almost the entireweek before regaining ground onThursday and Friday, positioning itsbenchmark at $19.21/mt,highlighting a final loss of 0.43 points,with the lowest point reached onWednesday at $18.87/mt.
CHARTERING 3
CAPESIZE MARKETPACIFIC BASIN
Different scenarios in the Atlanticregion, where Brazil appears to besoftening slightly, owing to a cargoshortage as cargo outflow appears tobe struggling.
The standard C3 route from Tubaraoto Qingdao managed to drop to$26.20/mt with a final loss of only0.15 points, with the lowest point onWednesday at $25.29/mt.
Different story for the C8 14Gibraltar/Hamburg transatlanticround voyage and the C9 14 routeContinent/Mediterranean China-Japan (front haul), both of whichmanaged to step up thanks to the fallin bunker rates in the area, with theformer setting the benchmark at$12,200/d with a final gain of $325and the latter at $33,600/d with adaily income gain of $2,700.
ATLANTIC BASIN
Unit 1-Apr 25-Mar W-o-W Y-o-Y
usd/day 15,460 15,648 -1.2% -22.1%
usd/t 14.24 14.67 -3.0% +40.4%
usd/t 26.20 26.35 -0.6% +22.8%
usd/t 10.64 11.64 -8.6% +7.3%
usd/day 12,200 11,875 +2.7% -23.2%
usd/day 13,241 12,795 +3.5% -33.7%
usd/day 16,275 19,400 -16.1% -33.0%
usd/day 35,000 37,000 -5.4% +32.1%
usd/day 30,000 30,500 -1.6% +27.7%
CAPESIZE
BCI TC Average
C2 Tubarao- Rotterdam
C3 Tubarao - Qingdao
C5 W. Aust. - Qingdao
C8 Transatlantic r/v
C14 China-Brazil r/v
C10 Pacific r/v
Newcastlemax 1-Y Period
Capesize 1-Y Period
0
20,000
40,000
60,000
80,000
100,000
Mar-21 Jul-21 Nov-21 Mar-22
BCI TC & CAPESIZE 1-YR TC (USD/DAY)
1-YR TC BCI TC

MARKET REPORT – WEEK 13/2022CHARTERING 4
The week began slowly in the Pacific,as did the entire market. As the weekprogressed, the rates fell, and theP3A 82 fell by approximately $3,000.Long trips eased during the week - asexplained last week, there are twomarkets: grain clean tonnage andmineral only suitable tonnage.
A tct via Nopac redely Singapore-Japan fixed Pmx opening in N Chinafor $24,500/d.
Activity in Australia has beenextremely limited, owing primarily topoor weather conditions, particularlyin the east of the country likeNewcastle and Port Kembla, and thesituation is expected to worsen. AnAustralian RV bss N China fixtureshave mostly been done on PPMXvessels in the low-mid $20,000's/d.
On the other hand, despiteimproving demand for Indonesiatrips, the bid and offer remainedwide, owing to overage vesselsdiscounting to go to China. Indo Rv'son a Pmx bss S China fixed at$20,000/d.
PANAMAX MARKETPACIFIC BASIN
ATLANTIC BASIN
A flat week for the Atlantic market,with the Black Sea still dead and fewowners interested in trading withRussian ports.
Messer cofco fixed on subs Iris Bliss(82,198 2016) opening Hamburg5/10th Apr for tct via USG redelySpain at $27,000/d from the USG,while a similar run has been cleanfixed on yangtze crown 82/18 bss gibat around $28k from the USG.
The CIC Epos (79,528 2014) at Safi6th Apr clean fixed with Oldendorff atrip via Kamsar for redely Stade at$30,000/d; fronthaulwise instead,Olam fixed mv CK venture (82,2692012) at Rttdm 30-31 March for tctvia NFrance opt NCSAm and redelyFeast at around low $37-38,000s/d.
In the South Atlantic, the market hasfallen by about two dollars in the lastweek, with the index closing at$67.50/mt on the Santos/Qingdaoroute on Friday.
Aside from an 81k tonnage fixed at$30,000/d dop WCI for a trip viaECSAm to Singapore-Japan, not manyfixtures have surfaced.
The T/A market, on the other hand,remains quite strong, with ownersasking around $50,000/d aps for tripsto the Skaw/Passero range and an82k dwt scrubber reported done at$50,350/d by Dreyfus, though somerumors seem to suggest that it wasfor Red Sea destination andredelivery area remain unknown.
0
10,000
20,000
30,000
40,000
50,000
Mar-21 Jul-21 Nov-21 Mar-22
BPI 82 TC & KAMSARMAX 1-YR TC (USD/DAY)
1-YR TC BPI 82 TC
Unit 1-Apr 25-Mar W-o-W Y-o-Y
usd/day 27,660 30,713 -9.9% +23.7%
usd/day 27,485 32,250 -14.8% +50.9%
usd/day 35,095 36,445 -3.7% +12.6%
usd/day 25,946 29,587 -12.3% +12.0%
usd/day 25,316 27,393 -7.6% +86.9%
usd/day 15,484 15,477 +0.0% -31.4%
usd/day 27,536 29,565 -6.9% +9.5%
usd/day 30,000 30,500 -1.6% +33.3%
usd/day 24,000 24,500 -2.0% +29.7%
PANAMAX
Kamsarmax 1-Y Period
Panamax 1-Y Period
P2_82 Skaw-Gib Trip F. East
P3_82 Pacific r/v
P4_82 Far East - Skaw-Gib
P5_82 China - Indo rv
P6_82 Spore Atlantic rv
BPI 82 TC Average
P1_82 Transatlantic r/v
MARKET REPORT – WEEK 13/2022
BLACK SEA / MEDITERRANEAN
US GULF / NORTH AMERICA
NORTH EUROPE / CONTINENT
SUPRAMAX & HANDYSIZE MARKET
CHARTERING 5
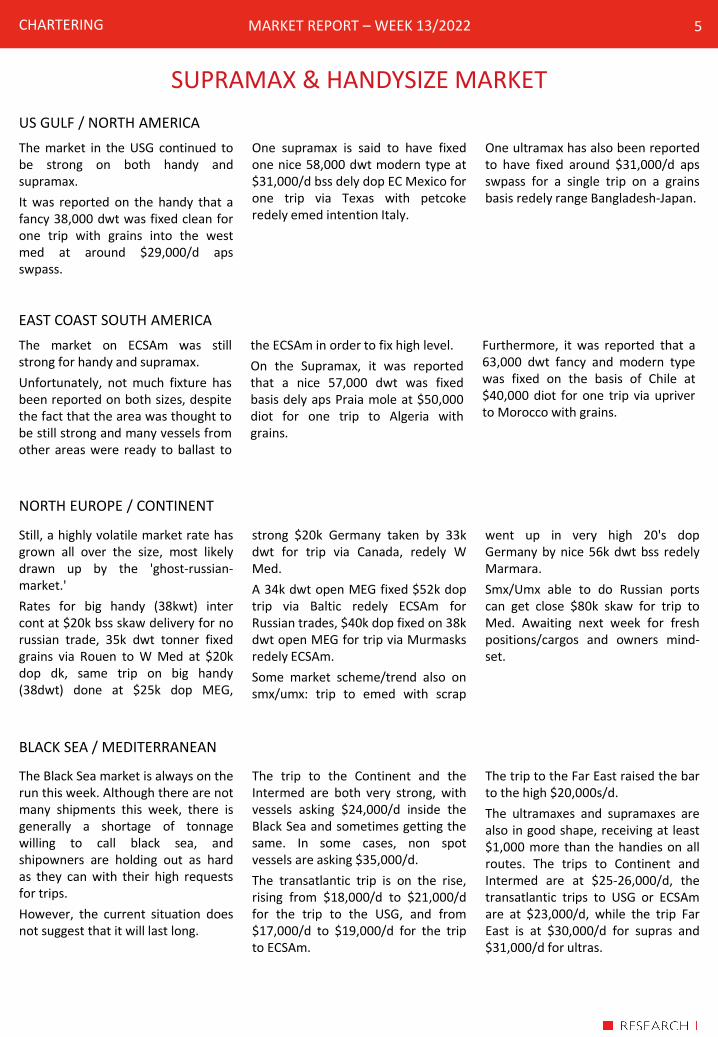
The market in the USG continued tobe strong on both handy andsupramax.
It was reported on the handy that afancy 38,000 dwt was fixed clean forone trip with grains into the westmed at around $29,000/d apsswpass.
One supramax is said to have fixedone nice 58,000 dwt modern type at$31,000/d bss dely dop EC Mexico forone trip via Texas with petcokeredely emed intention Italy.
One ultramax has also been reportedto have fixed around $31,000/d apsswpass for a single trip on a grainsbasis redely range Bangladesh-Japan.
Still, a highly volatile market rate hasgrown all over the size, most likelydrawn up by the 'ghost-russian-market.'
Rates for big handy (38kwt) intercont at $20k bss skaw delivery for norussian trade, 35k dwt tonner fixedgrains via Rouen to W Med at $20kdop dk, same trip on big handy(38dwt) done at $25k dop MEG,
strong $20k Germany taken by 33kdwt for trip via Canada, redely WMed.
A 34k dwt open MEG fixed $52k doptrip via Baltic redely ECSAm forRussian trades, $40k dop fixed on 38kdwt open MEG for trip via Murmasksredely ECSAm.
Some market scheme/trend also onsmx/umx: trip to emed with scrap
went up in very high 20's dopGermany by nice 56k dwt bss redelyMarmara.
Smx/Umx able to do Russian portscan get close $80k skaw for trip toMed. Awaiting next week for freshpositions/cargos and owners mind-set.
The Black Sea market is always on therun this week. Although there are notmany shipments this week, there isgenerally a shortage of tonnagewilling to call black sea, andshipowners are holding out as hardas they can with their high requestsfor trips.
However, the current situation doesnot suggest that it will last long.
The trip to the Continent and theIntermed are both very strong, withvessels asking $24,000/d inside theBlack Sea and sometimes getting thesame. In some cases, non spotvessels are asking $35,000/d.
The transatlantic trip is on the rise,rising from $18,000/d to $21,000/dfor the trip to the USG, and from$17,000/d to $19,000/d for the tripto ECSAm.
The trip to the Far East raised the barto the high $20,000s/d.
The ultramaxes and supramaxes arealso in good shape, receiving at least$1,000 more than the handies on allroutes. The trips to Continent andIntermed are at $25-26,000/d, thetransatlantic trips to USG or ECSAmare at $23,000/d, while the trip FarEast is at $30,000/d for supras and$31,000/d for ultras.
EAST COAST SOUTH AMERICA
The market on ECSAm was stillstrong for handy and supramax.
Unfortunately, not much fixture hasbeen reported on both sizes, despitethe fact that the area was thought tobe still strong and many vessels fromother areas were ready to ballast to
the ECSAm in order to fix high level.
On the Supramax, it was reportedthat a nice 57,000 dwt was fixedbasis dely aps Praia mole at $50,000diot for one trip to Algeria withgrains.
Furthermore, it was reported that a63,000 dwt fancy and modern typewas fixed on the basis of Chile at$40,000 diot for one trip via upriverto Morocco with grains.

MARKET REPORT – WEEK 13/2022
SOUTH AFRICA / INDIAN OCEAN
CHARTERING 6
SUPRAMAX & HANDYSIZE MARKET
Another slow week in the area sawrates continue to fall for popularroutes. Though there wasn't muchgoing on in the PG loading businessto Bangladesh last week, the fewthat did went were done at apslevels.
A 57k tonner was said to have fixeda $27k aps UAE port for suchbusiness to Bangladesh withaggregate. A ballaster 53k dwt fromWCI was heard to have fixed a $26kaps loadport in UAE for going to WCI.
A smaller supra 52k dwt open SriLanka was rumoured to have fixed$18k dop levels for India to China.
Mostly supras were fixed from ECIfor coal to India. A 56k dwt was fixedaround $28k dop ECI for coal viaIndonesia to WCI. For similar route, a57k tonner was heard to havefetched $25k levels.
Very little information came out fromSAfr this week with only a umx beingrumoured to have fixed $26,500/daps SAfr plus 650k for coal toPakistan.
FAR EAST / PACIFIC
After several weeks ofpositive/stable trend, the Far Eastmarket began to show signs ofdecline last week, both onsupramaxes and on handies, on allroutes.
Regarding Far East/Southeast Asiadirection, a 60,000 dwt deliveringIndonesia was reported to be doneat $42,000/d for a trip via Australiato Japan with grains, a 55,000 dwt
delivering mid China was fixed at$26,500/d for a trip via Indonesia toS China, and a 52,000 dwt deliveringBrunei was fixed at $35,000/d for atrip via Indonesia back to Brunei.
Regarding West direction, a 56,000dwt vessel delivering Thailand wasrumoured to be fixed at $31,000/dfor a trip to Pakistan, a similar sizevessel delivering East Coast India wasdone at $27,000/d for the same trip
via Indonesia to Pakistan, and a58,000 dwt vessel delivering northChina was fixed at $46,000/d for atrip via Far East to Atlantic.
On handies, a 33,000 dwt vesseldelivering the Philippines was fixedat $23,000/d for a trip to Taiwan viaVietnam with limestone, and asimilar size vessel delivering Japanwas fixed at $26,000/d for a trip toSouth East Asia with steels.
Unit 1-Apr 25-Mar W-o-W Y-o-Y
usd/day 30,301 33,217 -8.8% +49.7%
usd/day 30,008 32,924 -8.9% +50.4%
usd/day 32,682 35,161 -7.1% +88.9%
usd/day 30,186 30,779 -1.9% +10.7%
usd/day 31,885 31,507 +1.2% +87.8%
usd/day 25,125 22,763 +10.4% -9.4%
usd/day 28,786 33,493 -14.1% +33.4%
usd/day 29,000 36,664 -20.9% +32.0%
usd/day 30,000 30,000 +0.0% +62.2%
usd/day 26,000 26,000 +0.0% +57.6%
Unit 1-Apr 25-Mar W-o-W Y-o-Y
usd/day 30,511 32,082 -4.9% +49.1%
usd/day 21,264 19,336 +10.0% +20.7%
usd/day 48,278 48,944 -1.4% +162.7%
usd/day 29,286 28,714 +2.0% +92.6%
usd/day 32,188 36,375 -11.5% +34.4%
usd/day 31,063 35,094 -11.5% +31.7%
usd/day 26,500 26,500 +0.0% +73.8%
usd/day 22,300 22,300 +0.0% +71.5%
SUPRAMAX
HANDYSIZE
HS4_38 USG-Skaw/Pass
HS5_38 SE Asia-Spore/Jpn
HS6_38 Pacific RV
38k Handy 1-Y Period
30k Handy 1-Y Period
Ultramax 1-Y Period
Supramax 1-Y Period
BHSI 38 TC Average
HS2_38 Skaw/Pass-US
HS3_38 ECSAm-Skaw/Pass
S1C_58 USG-China/S Jpn
S9_58 WAF-ECSA-Med
S1B_58 Canakkale-FEast
S2_58 N China Aus/Pac RV
S10_58 S China-Indo RV
BSI 58 TC Avg.
BSI 52 TC Avg.
S4A_58 USG-Skaw/Pass
0
10,000
20,000
30,000
40,000
50,000
Mar-21 Jul-21 Nov-21 Mar-22
BSI TC & SUPRAMAX 1-YR TC (USD/DAY)
1-YR TC BSI 58 TC
0
10,000
20,000
30,000
40,000
Mar-21 Jul-21 Nov-21 Mar-22
BHSI 38 TC & HANDY 1-YR TC (USD/DAY)
1-YR TC BHSI 38 TC

MARKET REPORT – WEEK 13/2022CHARTERING 7
CRUDE TANKER MARKETVLCC : Increased activity and slowsteaming helped to shorten the list(at least for modern tonnage), andthus rates began to rise significantly.
Rates may close around WS44 for270kt MEG/China and WS46 for260kt WAfr/China due to a healthysuezmax market.
Suezmax: Several ships fixed, evenpart/cargo bss, from the Americas, aswell as a few others employed onRussian business, contributed to abrisk west African market.
Rates for 130kt WAfr/Med-UKC fixed
up to WS140, and rates for 140ktNovo/WCIndia fixed up to $5 mln. Inthe East, rates for 140kt Basrah/Medmoved up to/above WS50, whileMEG/East market moved to WS92.5(on 130kt), but there is room forfurther gains.
Aframax : A large amount of tonnageabsorbed by the lucrative Russianand American markets contributed tohigher rates on other routes as well.
In the Mediterranean, 80kt ex-Libyahas been covered at WS162.5, whilein the North Sea, 80kt to UKC has
been covered at WS152.5, and 100ktex-Baltic has been paid at leastWS475 to UKC and $7.5 mln to WCIndia.
Rates in the Americas rosethroughout the week, with 70ktUSG/UKC-Med reaching WS217.5.
Rates in the East are slightly higher,reaching (80kt at) the WS140 level.
- Congestion in China: still 4 (vs 4)vlcc & 2 (vs 2) suezmax, laden/idle formore than 2 weeks in china atm
Unit 1-Apr 25-Mar W-o-W Y-o-Y
ws 22.3 20.1 +11.1% +15.3%
usd/day -30,325 -37,247 +18.6% -147.2%
ws 44.7 37.6 +18.9% +31.3%
ws 44.0 36.8 +19.5% +32.2%
usd/day -7,194 -19,460 +63.0% -940.4%
ws 45.9 38.0 +20.7% +16.2%
usd/day -18,760 -28,354 +33.8% -228.8%
usd/day 18,300 18,000 +1.7% -35.8%
Unit 1-Apr 25-Mar W-o-W Y-o-Y
ws 183.9 182.8 +0.6% +136.6%
usd/day 69,125 66,461 +4.0% +573.5%
ws 142.3 89.3 +59.3% +126.0%
ws 92.5 90.0 +2.8% +32.1%
ws 54.8 43.0 +27.5% +164.7%
usd/day -12,184 -22,456 +45.7% +27.8%
usd/day 51,660 34,401 +50.2% +457.0%
usd/day 17,600 17,600 +0.0% -10.9%
Unit 1-Apr 25-Mar W-o-W Y-o-Y
ws 152.8 128.1 +19.3% +41.3%
usd/day 24,979 2,183 +1044.3% +134.7%
ws 500.0 341.3 +46.5% +457.5%
usd/day 227,833 133,657 +70.5% +1395.3%
ws 155.0 132.5 +17.0% +32.5%
usd/day 22,311 9,362 +138.3% +32.0%
ws 138.89 136.39 +1.8% +34.4%
usd/day 4,838 1,065 +354.3% -39.1%
ws 240.9 181.6 +32.7% +192.0%
usd/day 40,328 16,869 +139.1% +5057.0%
usd/day 55,301 28,672 +92.9% +453.5%
usd/day 18,500 18,400 +0.5% +0.0%
VLCC
SUEZMAX
AFRAMAX
TD9-TCE Caribs-USG
Aframax TCE Average
Aframax 1-Y Period
TD19 Med-Med
TD19-TCE Med-Med
TD8 Kuwait-China
TD8-TCE Kuwait-China
TD9 Caribs-USG
Suezmax 1-Y Period
TD7 NSea-Cont
TD7-TCE NSea-Cont
TD17 Baltic-UKC
TD17-TCE Baltic-UKC
TD20 WAF-Cont
MEG-EAST
TD23 MEG-Med
TD23-TCE MEG-Med
Suezmax TCE Average
TD15 WAF-China
VLCC TCE Average
VLCC 1-Y Period
TD6 BSea-Med
TD6-TCE BSea-Med
TD1 MEG-USG
TD1-TCE MEG-USG
TD2 MEG-Spore
TD3C MEG-China
TD3C-TCE MEG-China
-20,000
-10,000
0
10,000
20,000
Mar-21 Jul-21 Nov-21 Mar-22
TD3C VLCC MEG-FAR EAST (USD/DAY)
-50,000
0
50,000
100,000
150,000
200,000
Mar-21 Jul-21 Nov-21 Mar-22
TD6 SUEZMAX BSEA-MED (USD/DAY)
-10,000
90,000
190,000
290,000
Mar-21 Jul-21 Nov-21 Mar-22
TD17 AFRAMAX BALTIC-UKC (USD/DAY)
-10,000
10,000
30,000
50,000
70,000
90,000
Mar-21 Jul-21 Nov-21 Mar-22
TD19 AFRAMAX MED-MED (USD/DAY)
10,000
20,000
30,000
40,000
Mar-21 Jul-21 Nov-21 Mar-22
1 YR TC PERIOD (USD/DAY)
VLCC Suezmax Aframax

MARKET REPORT – WEEK 13/2022CHARTERING 8
PRODUCT TANKER MARKETClean:
The market was softer than last weekdue to an increasing tonnage list anda lack of cargoes for both LR1 andLR2.
On Friday cob, TC1 [email protected] / TC5 MEG-Japan55@179WS.
Still 30@200WS for a cross-medbusiness, with a little up and downduring the week but no more thanWS205.
The last one from the Black Sea(Russian side) is particularlyintriguing. Litasco reported30@375WS (should be the maximumpremium with Russian port + Russiancharterers).
In any case, it all depends on theavailability of the owners, and those
who are still going there are askingfor big bucks. Around more thanWS450.
Handies in the north still have goodlevels at 30@350 for Russian (ice)business.
TC2 is still hovering around WS190-195 for UKC-T/A.
Dirty:
Market activity is slow in both ex-med and non-Russian BSea, withowners fixing at bottom levels of30@155 for x-med and WS165 forex-non-risk BSea ports. Vivceversa listis always tight for loading ex russianBSea with owners aiming up toWS400 bss 30.
We can see a similar trend with MRswith x-med at WS140 and WS145 ifex non-Russian BSea, but with levels
jumping at 45@320 if Russianports/cargoes are involved.
Similarly, in the Med, there is littlefresh and mostly slow action for bothhandies and MR in the Cont, withrates at 30@20 for x-cont and +10 ifex baltic/(non russian) and 45@145for x-cont. Same as on the handieswith levels up to 30@420, MRsappears tight when loading ex-Baltic/Russian cargoes with rates upto 45@320 levels.
Stagnation of the market on pannies,with owners only looking for cargoesex north and primarily for theMediterranean, rather than thepreferred T/A run. Levels are at55@137,5 and with the marketfirming in the US, owners could easilydecide to ballast over there and try tosmell some better earnings.
-10,000
0
10,000
20,000
30,000
Mar-21 Jul-21 Nov-21 Mar-22
TC1 LR2 MEG-JAPAN (usd/day)
0
10,000
20,000
30,000
40,000
Mar-21 Jul-21 Nov-21 Mar-22
MR ATLANTIC BASKET (usd/day)
0
10,000
20,000
30,000
Mar-21 Jul-21 Nov-21 Mar-22
MR PACIFIC BASKET (usd/day)
Unit 1-Apr 25-Mar W-o-W Y-o-Y
ws 152.5 167.1 -8.8% +14.2%
usd/day 15,962 17,907 -10.9% -20.1%
usd/mt 44.16 45.11 -2.1% +51.1%
ws 178.9 186.4 -4.0% +29.8%
ws 193.3 201.1 -3.9% +35.4%
ws 229.6 154.6 +48.5% +176.0%
ws 347.1 334.6 +3.7% +129.2%
ws 204.4 201.3 +1.6% +27.7%
usd/day 18,638 16,469 +13.2% +49.2%
ws 206.9 199.9 +3.5% +34.4%
usd/day 6,183 6,176 +0.1% -32.4%
usd/day 501 501 +0.0% -87.6%
usd/day 29,183 15,440 +89.0% +186.9%
usd/day 19,952 17,921 +11.3% +71.3%
usd/day 16,500 16,000 +3.1% -10.8%
usd/day 14,300 14,100 +1.4% +2.1%
usd/day 11,300 11,300 +0.0% -7.8%
Unit 1-Apr 25-Mar W-o-W Y-o-Y
ws 142.5 139.6 +2.1% +37.0%
usd/day 3,178 -822 +486.6% -49.3%
ws 220.0 227.1 -3.1% +21.9%
usd/day 9,524 7,147 +33.3% -7.7%
ws 155.0 160.0 -3.1% -22.5%
ws 400.0 450.0 -11.1% +90.5%
TD12-TCE Cont-USG ( 5 5 k )
TD18 Baltic-UKC ( 3 0 K)
TD18-TCE Baltic-UKC ( 3 0 K)
CLEAN
DIRTY
Med-Med ( 3 0 k )
Black Sea-Med ( 3 0 k )
MR Pacific Basket
LR2 1-Y Period
MR2 1-Y Period
MR1 1-Y Period
TD12 Cont-USG ( 5 5 k )
TC6-TCE Med-Med ( 3 0 k )
TC7 Spore-ECAu ( 3 0 k )
TC7-TCE Spore-ECAu ( 3 0 k )
TC11-TCE SK-Spore ( 4 0 k )
MR Atlantic Basket
TC14 USG-Cont ( 3 8 k )
TC9 Baltic-UKC ( 2 2 k )
TC6 Med-Med ( 3 0 k )
TC8 MEG-UKC ( 6 5 k )
TC5 MEG-Japan ( 5 5 k )
TC2 Cont-USAC ( 3 7 k )
TC1 MEG-Japan ( 7 5 k )
TC1-TCE MEG-Japan ( 7 5 k )
10,000
15,000
20,000
25,000
Mar-21 Jul-21 Nov-21 Mar-22
1 YR TC PERIOD (USD/DAY)
LR2 MR2

MARKET REPORT – WEEK 13/2022
02,0004,0006,0008,000
10,00012,000
Mar-21 Jul-21 Nov-21 Mar-22
FREIGHTOS BALTIC CONTAINER INDEX
FBX
REPORTED CONTAINERSHIP FIXTURES
VHSS CONTAINERSHIP TIMECHARTER(source: Hamburg Shipbrokers’ Association)
FREIGHTOS BALTIC GLOBAL CONTAINER INDEX (source: Baltic Exchange)
CHARTERING 9
CONTAINERSHIP MARKETIn the Container market uncertaintyprevails due to the war in Ukraineand the Covid situation in China nowmainly impacting Shanghai, hencefixture volume was extremely limitedthis week.
Russia’s invasion of the Ukraine hadchanged the pricing landscape forbunkers, VLSFO prices immediatelyrising in Rotterdam the largestbunkering port in Europe so one ofthe traditionally cheapest places totake bunkers has become one of themost expensive, while Singapore,normally one of the most expensivehas become one of the lowest priced.
Prices in Malta suffered an increase,while Panama saw weakness indemand in February after a long aperiod of increasing demand. Higherprices have also seen an increase indemand for HFO as the price spreadhas grown with VLSFO meaning thatits more economical for scrubberfitted vessels to operate on HFO.
So, the global market has flipped onits head in the last month.Commodities traders warned thatwe’re not going back to normalbusiness in a few months and alsothat crude prices could hit $250 laterin the year, considering that Europe
has probably lost Russian supplies“forever”. Bunker costs, of course,correspond closely to crude oil prices.
Following Shanghai’s decision tolockdown, Maersk announced thattransportation prices will continue torise. Consequently, there will belonger delivery time and a possiblerise in transport costs such as detourfee and highway fee. China, who isseeing the highest number of Covidcases since the start of the pandemic,put restrictions on other industrialcities such as Changchun andShenzhen, giving rise to long queuesoutside ports.
Unit 1-Apr 25-Mar W-o-W Y-o-Y
index 3,545 3,577 -0.9% +229.5%
usd/day 110,550 111,225 -0.6% +200.5%
usd/day 95,850 96,450 -0.6% +217.8%
usd/day 84,636 85,318 -0.8% +210.1%
usd/day 78,909 79,668 -1.0% +222.3%
usd/day 65,921 66,467 -0.8% +271.1%
usd/day 39,629 40,333 -1.7% +223.8% 1100 teu (1Y, geared)
VHSS
ConTex
4250 teu (1Y, g’less)
3500 teu (1Y, g’less)
2700 teu (1Y, g’less)
2500 teu (1Y, geared)
1700 teu (1Y, geared)
Unit 1-Apr 25-Mar W-o-W Y-o-Y
index 9,308 9,457 -1.6% +123.3%
usd/feu 15,928 15,811 +0.7% +208.5%
usd/feu 1,008 1,004 +0.4% +31.3%
usd/feu 17,329 17,661 -1.9% +195.3%
usd/feu 977 891 +9.7% +25.7%
usd/feu 12,050 12,232 -1.5% +65.1%
usd/feu 859 914 -6.0% -44.1%
usd/feu 12,748 13,554 -5.9% +74.9%
usd/feu 1,298 1,357 -4.3% -13.5%
usd/feu 626 627 -0.2% +73.6%
FBX
FREIGHTOS
China - WCNA
WCNA - China
China - ECNA
ECNA - China
China - N. Europe
N. Europe - China
China - Med
Med - China
ECNA - Europe
0
30,000
60,000
90,000
120,000
Mar-21 Jul-21 Nov-21 Mar-22
GEARLESS - 1 YR TC PERIOD (USD/DAY)
4250 3500 2700
0
20,000
40,000
60,000
80,000
100,000
Mar-21 Jul-21 Nov-21 Mar-22
GEARED - 1 YR TC PERIOD (USD/DAY)
2500 1700 1100
0
4,000
8,000
12,000
16,000
Mar-21 Jul-21 Nov-21 Mar-22
FREIGHTOS BALTIC CONTAINER INDEX
China - N. Europe N. Europe - China
Vessel's Name Built TEUs TEU@14 Gear Account Period (mos) Rates ($)
Oceana 2013 1714 1250 yes Fixed to Feedertech 36 m $45,000/d
Pacific Qingdao 1998 698 436 no Extended to CCL 24 m $25,000/d
Atlantic East 2008 698 436 no Fixed to Asean Seas Line 24 m $25,000/d

MARKET REPORT – WEEK 13/2022SALE & PURCHASE 10
NEWBUILDING ORDERS Containers
In the Container segment MSCplaced an order for a total of 28Panamax container units abt 8,000teu with value of the investment tobe around $3.4 billion.
All vessels are going to be LNG dualfuel and 14 to be built at New Times,8 at Qingdao Beihai and other 6 atHyundai with deliveries expected tobe in 2024-2025
Furthermore, MPC Containers agreedwith Hanjin to build 2 x 5,500 teu
with delivery during 1st half 2025 at$72.2 mln each. Vessels will bechartered for 7 years to ZIM.
Drybulk
For dry bulk, Bocimar will build 2additional Newcastlemax (abt 210kdwt) at Qingdao Beihai (total of eightvessels) with deliveries during 2024.
Also in China Dalian received anorder for 10 x ultramaxes abt 65kdwt from CITIC Financial Leasing,price to be around $31.5 mln each.
Greek owner Metrostar Managementagreed with Hyundai Vinashin tobuild two plus optional one LR2 (abt115k dwt) per unit price
was $56.8 mln. Delivery during 1sthalf of 2024.
LNG
In the gas business, China MerchantEnergy agreed with Dalian to build2+2 optional LNG carriers abt 175kcbm. Vessels to be delivered during2025.
INDICATIVE NEWBUILDING PRICES (CHINESE SHIPYARDS)
DEMOLITION SALESThis week, the Pakistani and(especially) Indian markets haverebounded to take the lead over alackluster Bangladesh, which hasvirtually dropped out of contention inrecent months.
Steel plate prices in India have beenfirming, and it is probable that the700 USD/ldt mark would beexceeded in these two markets onupcoming sales (as long as thesefundamentals hold).
Bangladeshi steel plate prices havebeen declining in recent weeks, and
despite firming by mid-week, theindustry has seen them slide fromthe top to the bottom of the (sub-continent) rankings, with plate pricesfalling by about the same amount bythe end of the week.
Overall, there has been somehesitancy to enter at some of thesehistorical highs approaching 700USD/ldt. However, given theconsistently impressive andimproving steel prices that appear tobe performing well as a result of theongoing Ukraine crisis, it's unclear
how long these figures will remainstable.
Some reported sales:
MT SCF Ural, 159,315 dwt, 2002,23,313 ldt, Delivered Bangladesh$675 USD/ldt
IMO-2 Bow Flower, 37,221 dwt,1994, 11,277 ldt, Delivered $1,310USD/ldt to India High Stainless Steelcontent. Recycled at NK/HKCCertified Yard
SHIP RECYCLING ASSESSMENTS (BALTIC EXCHANGE)
20
30
40
50
60
70
Mar-21 Jul-21 Nov-21 Mar-22
NEWBUILDING PRICES (USD MLN)
Kamsarmax Suezmax MR
250
350
450
550
650
750
Mar-21 Jul-21 Nov-21 Mar-22
DEMOLITION PRICES (USD/LDT)
Dry Bulk Tanker
Unit Mar-22 Feb-22 M-o-M Y-o-Y
usd mln 59.6 59.4 +0.4% +22.6%
usd mln 34.7 34.5 +0.4% +27.5%
usd mln 32.3 32.1 +0.6% +28.2%
usd mln 28.9 28.7 +0.7% +28.2%
usd mln 103.1 101.7 +1.4% +21.4%
usd mln 66.8 66.5 +0.4% +23.9%
usd mln 58.6 58.4 +0.5% +28.1%
usd mln 37.9 37.5 +0.9% +13.6%
Handysize
VLCC
Suezmax
LR2 Coated
MR2 Coated
Capesize
Kamsarmax
Ultramax
Unit 1-Apr 25-Mar W-o-W Y-o-Y
usd/ldt 672.6 672.9 -0.0% +38.9%
usd/ldt 658.4 653.2 +0.8% +44.4%
usd/ldt 670.1 667.4 +0.4% +40.7%
usd/ldt 683.6 684.2 -0.1% +37.9%
usd/ldt 663.3 658.8 +0.7% +43.4%
usd/ldt 678.9 676.4 +0.4% +39.9%
Dry Bangladesh
Dry India
Dry Pakistan
Tnk Bangladesh
Tnk India
Tnk Pakistan

MARKET REPORT – WEEK 13/2022
Drybulk: Chinese Buyers purchased a fleetof Maran 8 x 114,000 Bulkers blt 4 x 2011, 1x 2012 1 x 2013 2 x 2014 at ShanghaiShipyard for $200 mln enbloc.
Wet: The VLCC Tokyo 306,000 dwt Blt 2005Mitsubishi went to Chinese Buyers for $31mln, while the Eastern Jupiter 305,000 dwtBlt 2007 Daewoo has been reported sold toundisclosed for $38.5 mln.
2 x Suez 17 February 160,000 dwt Blt 2008Samsung and Libya 159,000 dwt Blt 2007Hyundai Heavy reported sold toNorwegians for $46 mln enbloc.
BALTIC SECONDHAND ASSESSMENTS (BALTIC EXCHANGE)
SALE & PURCHASE 11
SECONDHAND SALES
10
20
30
40
50
Mar-21 Jul-21 Nov-21 Mar-22
SECONDHAND VALUES (USD MLN)
Kamsarmax Aframax MR
Unit 1-Apr 25-Mar W-o-W Y-o-Y
usd mln 46.2 46.0 +0.4% +24.2%
usd mln 34.6 34.3 +1.0% +29.1%
usd mln 29.0 28.9 +0.5% +49.5%
usd mln 27.8 27.5 +1.0% +52.7%
usd mln 73.6 73.5 +0.1% +11.4%
usd mln 48.8 48.8 +0.1% +10.4%
usd mln 43.5 43.4 +0.4% +23.4%
usd mln 31.0 30.8 +0.7% +16.3%
Suezmax
Aframax
MR Product
Capesize
Kamsarmax
Supramax
Handysize
VLCC
Bulk Baosteel Evolution 206,000 2007 Imabari Chinese buyers 22.5 ss/dd 7/2022 BWTS-Fitted
Bulk Maran Progress 114,000 2014 Shanghai SY
Bulk Maran Wisdom 114,000 2014 Shanghai SY
Bulk Maran Zenith 114,000 2013 Shanghai SY
Bulk Maran Aspiration 114,000 2012 Shanghai SY
Bulk Maran Dawn 114,000 2011 Shanghai SY
Bulk Maran Sky 114,000 2011 Shanghai SY
Bulk Maran Sun 114,000 2011 Shanghai SY
Bulk Maran Ocean 114,000 2011 Shanghai SY
Bulk CMB Pauillac 95,000 2012 Imabari Undisclosed buyers 25 ss/dd 8/2022
Bulk Xin Yuan 91,000 2002 Oshima Undisclosed buyers 14.8 ss 7/2025 dd 7/2023 BWTS-Fitted
Bulk Sea Neptune 81,000 2013 Xiamen Turkish buyers 23 Tier-II ss/dd 3/2023
Bulk Rosco Litchi 80,000 2011 Tsuneishi Zhoushan Greek buyers 25.8 ss 1/2026 dd 1/2024
Bulk Evershine 75,000 2000 Kanasashi Chinese buyers 12 ss 9/2025 dd 10/2023 BWTS-pending
Bulk Nilos 75,000 2006 Tsuneishi jpn Undisclosed buyers 18 ss 1/2026 dd 2/2024
Bulk Baltia 75,000 2005 Sanoyas Chinese buyers 16.5 ss 12/2022 dd 10/2022
Bulk Rio Tamara 75,000 2014 Taizhou Kouan Undisclosed buyers 22.5 FS Ice Class 1C ss 2/2024 dd 7/2022
Bulk Rio Grita 75,000 2014 Taizhou Kouan Undisclosed buyers 22.5 ss/dd 2/2024 BWTS-Fitted
Bulk 10 x Ultramax 65,000 2024 Shanhaiguan C. of Citic Financial Leasing 31.5 fixed on domestic charters to Cosco
Bulk Peng De 64,000 2014 Guanghou C. of Jinhui Shipping & Trading 25.5
Bulk S Hermes 61,000 2016 I-S Shipyard 32
Bulk S Echo 61,000 2015 Imabari 31
Bulk S Tango 61,000 2015 Imabari 31
Bulk ASL Mercury 56,000 2010 Hantong Undisclosed buyers 16 Cr 4x36t ss 12/2025 dd 11/2023 BWTS-Fitted
Bulk Amoy Action 56,000 2010 Xiamen Undisclosed buyers 18.2 Cr 4x30t Tier-1 ss 11/2025 dd 11/2023 BWTS-Fitted
Bulk Vega Rose 55,700 2007 Kawasaki Chinese buyers 18.2 Cr 4x31ts ss 10/2024 dd 9/2022 BWTS-Fitted
Bulk Neraida 55,500 2005 Oshima Undisclosed buyers 16.25 Cr 4x30t ss 1/2025 dd 4/2023 BWTS-Fitted
Bulk Ever Ample 50,000 1998 Imabari Undisclosed buyers 8.25 Cr 3x14.5t ss 11/2025 dd 11/2023 BWTS-Fitted
Bulk Interlink Equality 39,000 2016 Kouan 26.25
Bulk Interlink Capacity 39,000 2016 Kouan 26.25
Bulk Interlink Quality 39,000 2016 Huatai Heavy 26.25
Bulk Interlink Ability 39,000 2015 Huatai Heavy 25.5
Bulk Nong Lyla 33,000 2004 Oshima Undisclosed buyers 12.3 Cr 4x30t ss/dd 5/2024 BWTS-Fitted
Bulk Eco Dynamic 32,000 2005 Kanda Greek buyers 13.95 Cr 4x30.5t ss 11/2025 dd 11/2023 BWTS-Fitted
Bulk Mount Adams 28,000 2002 Kanda Undisclosed buyers 9.8 SS 5/25 DD 5/23 BWTS fitted
Bulk Nikolaos GS 28,000 2002 Imabari Undisclosed buyers 9.2 Cr 4x30.5t ss 5/025 dd 5/2023
Tank Eastern Jupiter 305,000 2007 Daewoo Undisclosed buyers 36.5 ss 6/2022 dd 6/2022
Tank Tokio 306,000 2005 Mitsubishi Chinese buyers 31 ss 2/2025 dd 2/2023
Tank 17 February 160,000 2008 Samsung
Tank Libya 159,000 2007 Hyundai Heavy
Tank Bari 159,000 2005 HHI Undisclosed buyers 21.5
Tank Da Yuan Hu 159,000 2004 Bohai Undisclosed buyers 16.5 bss dely china - april/may
Tank Nordic Grace 149,900 2002 Samho 15
Tank Nordic Passat 149,900 2002 Samho 15.5
Tank Advantage Anthem 116,000 2011 Samsung
Tank Advantage Avenue 116,000 2010 Samsung
Tank Sti Savile Row 110,000 2015 Sungdong 43
Tank Sti Carnaby 110,000 2015 Sungdong 43
Tank Sti Benicia 50,000 2014 HMD C. of Msea Capital 26.5 scrubber fitted
Tank Challenge Pegasus 47,700 2007 STX Greek buyers 12.35 ss 8/2025 dd 9/2023 BWTS-Fitted
Tank Nord Swan 38,500 2009 Guangzhou Undisclosed buyers 10.8 ss/dd 7/2024
Tank Vs Riesa 34,500 2003 Dalian Undisclosed buyers 5.85 Cap 1 ss/dd 6/2023
Tank Hafnia Sol 25,000 2017 Fukuoka
Tank Hafnia Spica 25,000 2017 Fukuoka
Tank Hafnia Saiph 25,000 2017 Kitanihon
Tank Hafnia Sceptrum 25,000 2017 Kitanihon
Tank Hafnia Sirius 25,000 2016 Kitanihon
Tank Hafnia Sky 25,000 2016 Kitanihon
Tank Hafnia Spark 25,000 2016 Kitanihon
Tank Hafnia Stellar 25,000 2016 Kitanihon
Tank Hoko 8,900 2010 Shin Kurushima Undisclosed buyers 8 16 Stainless Steel Tanks ss 5/2025 dd 8/2023
C. of Ace Tankers Mgmt 252.4 Enbloc
Chinese buyers 200 Enbloc
Norwegian buyers 46 Enbloc
C. of Centrofin enbloc - ECO/SCRUBBER FITTED
C. of Tomini enbloc
C. of Advantage Tankers ENBLOC - scrubber fitted - coated
C. of Synergy Marine 57 Enbloc
EnblocUndisclosed buyers

MARKET REPORT – WEEK 13/2022DERIVATIVES 12
DRY BULK FFA ASSESSMENTS
0
20,000
40,000
60,000
80,000
100,000
Apr-21 Oct-21 Apr-22 Oct-22 Apr-23
CAPESIZE FORWARD CURVE (USD/DAY)
0
10,000
20,000
30,000
40,000
50,000
Apr-21 Oct-21 Apr-22 Oct-22 Apr-23
PANAMAX FORWARD CURVE (USD/DAY)
0
10,000
20,000
30,000
40,000
50,000
Apr-21 Oct-21 Apr-22 Oct-22 Apr-23
SUPRAMAX FORWARD CURVE (USD/DAY)
0
10,000
20,000
30,000
40,000
50,000
Apr-21 Oct-21 Apr-22 Oct-22 Apr-23
HANDYSIZE FORWARD CURVE (USD/DAY)
EXCHANGE RATES
1-Apr 25-Mar W-o-W Y-o-Y
1.11 1.10 +0.7% -6.1%
122.49 122.06 +0.4% +10.8%
1220 1225 -0.4% +8.1%
6.36 6.37 -0.1% -3.1%
CURRENCIES
USD/EUR
JPY/USD
KRW/USD
CNY/USD 100
110
120
130
Mar-21 Jul-21 Nov-21 Mar-22
JPY/USD EXCHANGE RATE
Unit 4-Apr 28-Mar W-o-W Premium
Apr-22 usd/day 18,914 21,036 -10.1% +27.0%
May-22 usd/day 27,036 29,575 -8.6% +81.5%
Jun-22 usd/day 32,479 34,071 -4.7% +118.0%
Jul-22 usd/day 33,750 35,089 -3.8% +126.6%
Q2 22 usd/day 26,143 28,227 -7.4% +75.5%
Q3 22 usd/day 34,982 36,093 -3.1% +134.8%
Q4 22 usd/day 30,607 31,804 -3.8% +105.5%
Q1 23 usd/day 17,143 20,214 -15.2% +15.1%
Unit 4-Apr 28-Mar W-o-W Premium
Apr-22 usd/day 27,190 28,104 -3.3% +0.2%
May-22 usd/day 28,511 29,443 -3.2% +5.1%
Jun-22 usd/day 28,850 29,315 -1.6% +6.3%
Jul-22 usd/day 28,143 28,622 -1.7% +3.7%
Q2 22 usd/day 28,184 28,954 -2.7% +3.9%
Q3 22 usd/day 27,636 27,997 -1.3% +1.8%
Q4 22 usd/day 24,632 25,111 -1.9% -9.2%
Q1 23 usd/day 17,625 17,915 -1.6% -35.0%
Unit 4-Apr 28-Mar W-o-W Premium
Apr-22 usd/day 29,154 30,058 -3.0% -2.5%
May-22 usd/day 30,558 31,438 -2.8% +2.2%
Jun-22 usd/day 30,179 30,933 -2.4% +1.0%
Jul-22 usd/day 28,200 28,608 -1.4% -5.6%
Q2 22 usd/day 29,964 30,810 -2.7% +0.3%
Q3 22 usd/day 26,658 27,150 -1.8% -10.8%
Q4 22 usd/day 22,725 22,992 -1.2% -24.0%
Q1 23 usd/day 16,017 16,267 -1.5% -46.4%
Unit 4-Apr 28-Mar W-o-W Premium
Apr-22 usd/day 29,138 29,438 -1.0% -3.2%
May-22 usd/day 29,063 29,613 -1.9% -3.4%
Jun-22 usd/day 28,125 28,638 -1.8% -6.5%
Jul-22 usd/day 26,563 26,813 -0.9% -11.7%
Q2 22 usd/day 28,775 29,230 -1.6% -4.4%
Q3 22 usd/day 25,100 25,338 -0.9% -16.6%
Q4 22 usd/day 22,025 22,238 -1.0% -26.8%
Q1 23 usd/day 15,525 15,588 -0.4% -48.4%
CAPESIZE
PANAMAX (82k)
SUPRAMAX (58k)
HANDYSIZE (38k)

MARKET REPORT – WEEK 13/2022COMMODITIES 13
COMMODITY PRICES
200400600800
1,0001,2001,400
Mar-21 Jul-21 Nov-21 Mar-22
BUNKER PRICES @ SINGAPORE (USD/T)
IFO380 VLSFO LSMGO
40
60
80
100
120
140
Mar-21 Jul-21 Nov-21 Mar-22
BRENT & WTI OIL PRICE (USD/BBL)
Brent WTI
2.0
3.0
4.0
5.0
6.0
Mar-21 Jul-21 Nov-21 Mar-22
HENRY HUB PRICE (USD/MMBTU)
Hanry Hub Nat Gas
0
100
200
300
400
Mar-21 Jul-21 Nov-21 Mar-22
COAL & IRON ORE PRICE (USD/T)
Steam Coal Iron Ore
4,000
5,000
6,000
7,000
Mar-21 Jul-21 Nov-21 Mar-22
STEEL PRICES IN CHINA (RMB/T)
Rebar Plate
0
400
800
1,200
1,600
Mar-21 Jul-21 Nov-21 Mar-22
WHEAT & CORN PRICES (USD/T)
Corn Wheat
Unit 1-Apr 25-Mar W-o-W Y-o-Y
Rotterdam usd/t 651.0 711.0 -8.4% +77.9%
Fujairah usd/t 687.0 721.0 -4.7% +87.7%
Singapore usd/t 688.0 671.0 +2.5% +78.2%
Rotterdam usd/t 851.0 918.0 -7.3% +84.2%
Fujairah usd/t 865.0 921.0 -6.1% +87.6%
Singapore usd/t 835.0 895.0 -6.7% +77.3%
Rotterdam usd/t 1103.0 1256.0 -12.2% +100.2%
Fujairah usd/t 1191.0 1276.0 -6.7% +144.6%
Singapore usd/t 1065.0 1119.0 -4.8% +101.7%
Rotterdam usd/t 200.0 207.0 -3.4% -63.7%
Fujairah usd/t 178.0 200.0 -11.0% -67.7%
Singapore usd/t 147.0 224.0 -34.4% -73.3%
Unit 1-Apr 25-Mar W-o-W Y-o-Y
usd/bbl 104.4 120.7 -13.5% +61.7%
usd/bbl 99.3 113.9 -12.8% +62.8%
usd/bbl 102.5 116.8 -12.3% +61.6%
rmb/bbl 667.3 754.0 -11.5% +77.6%
usd/t 1091.0 1195.8 -8.8% +113.6%
usd/gal 3.15 3.47 -9.1% +60.1%
usd/t 898.0 981.5 -8.5% +57.3%
usd/bbl 121.3 134.9 -10.1% +88.9%
usd/mmbtu 5.72 5.57 +2.7% +127.0%
usd/mmbtu 36.60 31.86 +14.9% +405.2%
usd/mmbtu 35.00 35.00 +0.0% +360.5%
Unit 1-Apr 25-Mar W-o-W Y-o-Y
usd/t 260.4 261.4 -0.4% +170.4%
usd/t 260.0 273.9 -5.1% +188.7%
usd/t 480.0 595.0 -19.3% +311.4%
Unit 1-Apr 25-Mar W-o-W Y-o-Y
usd/t 160.0 150.2 +6.5% -3.9%
rmb/t 4943.0 4856.0 +1.8% +5.1%
rmb/t 5377.0 5294.0 +1.6% +4.7%
Unit 1-Apr 25-Mar W-o-W Y-o-Y
usc/bu 1582.8 1710.3 -7.5% +13.0%
usc/bu 735.0 754.0 -2.5% +33.0%
usc/bu 984.5 1102.3 -10.7% +60.5%
usc/lb 19.37 19.61 -1.2% +27.5%
usd/t 1511.0 1571.0 -3.8% +55.7%
usd/t 1130.0 1130.0 +0.0% +184.3%
Crude Oil Shanghai
OIL & GAS
Nat Gas Henry Hub
LNG TTF Netherlands
Palm Oil Malaysia
COAL
IRON ORE & STEEL
AGRICULTURAL
Corn CBoT
Wheat CBoT
Sugar ICE N.11
Ferts Urea Middle East
Steam Coal Newcastle
Coking Coal Australia SGX
Iron Ore SGX 62%
Rebar in China CISA
Plate in China CISA
Soybeans CBoT
Crude Oil Murban
BUNKERS
IFO
38
0
(3.5
%)
VLS
FO
(0.5
%)
LSM
GO
(0.1
%)
Crude Oil ICE Brent
Crude Oil Nymex WTI
Gasoil ICE
Gasoline Nymex
Naphtha C&F Japan
Jet Fuel Singapore
LNG North East Asia
Steam Coal Richards Bay
SPR
EAD
(LS/
HS)

MARKET REPORT – WEEK 13/2022COMMODITIES 14
Ukraine's grain exports held up asrailways struggle to cope
Ukraine's railways are strugglingwith a backlog of grain wagons onthe country's western border astraders look for alternative exportroutes after Russia's invasionblocked off the main Black Sea ports,analyst APK-Inform said on Saturday.Ukraine was the world's fourth-largest grain exporter in the 2020/21season, according to InternationalGrains Council data, with most of itscommodities shipped out via theBlack Sea.
Russia faces rising sugar prices,shortages as traders divertshipments
Commodity traders have starteddiverting sugar shipments away fromRussia, according to industry sourcesand shipping data, a move set tofurther boost soaring domesticprices and ratchet up pressure onthe Russian government to cool foodinflation. Russia needed sugarimports this year after twosuccessive shortfalls in the beetcrop, and disruption to shipmentswill result in shortfalls as the countrybattles panic buying of sugar andother staples, industry experts said.
Ukraine in talks to ship farmexports via Romanian Black Seaport Constanta
Ukraine is in talks with Romania onshipping its farming exports via theRomanian Black Sea port ofConstanta, as Russia's invasion hasblocked off Ukrainian ports,Ukraine's agriculture ministry said ina statement on Wednesday.Ukraine, among the world's leadingexporters of grain and vegetable oils,has enough stocks to meet its foodneeds for two years but will lose$1.5 billion a month in farmingexports due to the Russian invasion,the ministry said.
U.S. farmers plan to cut corn, wheatplantings despite strong demand
U.S. farmers plan to cut theirseedings of both corn and wheat in2022 even as domestic wheatsupplies are at their lowest in 14years and demand for both grains isrising following Russia's invasion ofUkraine that disrupted shipmentsfrom those key suppliers. Growerswere planning to plant their largestsoybean acreage ever, the U.S.Agriculture Department said onThursday, as the high input costsassociated with growing corn andwheat made the oilseed a moreattractive crop.
Russia bans sunflower seed exports,imposes quota on sunoil
Russia's agriculture ministry hassimplified procedures for obtainingpermits for white sugar imports aftera jump in domestic demand, it saidin a statement. Many Russians haverushed to buy sugar and otherstaples after Western sanctionsimposed on Russia for what Moscowcalls "a special military operation" inUkraine sent food prices higher inMarch. The authorities haverepeatedly told people there is noneed to stockpile food products.
India cuts coal supply, inventoriesslump as power demand surges
India has cut coal supplies to thenon-power sector and put on holdplans to increase the number of fuelauctions for utilities due to a slumpin inventories at state government-owned utilities even as demand forelectricity surges. The supply cutscome months after India's mostcrippling coal shortage in the recentyears led to power cuts lasting upto14 hours in some states. The onsetof summer has added to worriesabout power supply shortages in thecountry.
Russian wheat exports via Black Seasteady, domestic grain prices rally
Russia kept its wheat exports steadyvia its Black Sea ports last week asAzov Sea routes remain restricted,analysts said on Monday, whiledomestic prices for the graincontinued to rally because of therecent weakening of the rouble.Western sanctions imposed onRussia for what Moscow calls "aspecial military operation" inUkraine have complicated tradelogistics and transactions in foreignbanks for many Russian firms in thelast four weeks.
France to help Egypt secure wheatsupplies in coming months
France will ensure that Egypt getsthe wheat it needs in the comingmonths as the war in Ukrainecreates supply risks for grainimporting countries, French FinanceMinister Bruno Le Maire said onMonday. Egypt, among the world'sbiggest wheat importers, is heavilyreliant on shipments from Ukraineand Russia and its government hasbeen seeking alternative suppliesfrom countries including India andFrance.
Egyptian delegation to visit India todiscuss wheat imports
A delegation from Egypt will visitIndia in the first week of April tofacilitate wheat imports as part ofefforts to secure supplies and tideover shortages at one of the world'sbiggest importers of the staple,Indian government sources said.Egypt, often the world's biggestwheat importer, is reeling from asurge in bread and flour prices afterRussia's invasion of Ukraine closedoff access to lower-priced Black Seawheat.
Source: Reuters
COMMODITY NEWS – DRY BULK

MARKET REPORT – WEEK 13/2022COMMODITIES 15
Putin tells Europe: Pay in roubles orwe'll cut off your gas
Russian President Vladimir Putin isdemanding foreign buyers pay forRussian gas in roubles from Friday orelse have their supplies cut, a moveEuropean capitals rejected andwhich Germany said amounted to"blackmail". Putin's decree leavesEurope facing the prospect of losingmore than a third of its gas supply.Germany, the most heavily reliant onRussia, has already activated anemergency plan that could lead torationing in Europe's biggesteconomy.
Ship fuel suppliers stop servingRussian vessels in the Med
Marine fuel sellers have stoppedserving vessels flying the Russian flagat major European hubs includingSpain and Malta in another blow toMoscow's exports, five industrysources with knowledge of thematter told Reuters. Losing access torefuelling points in theMediterranean Sea poses majorlogistical problems for Russian oiltankers going from Baltic ports toAsia and also creates safetyconcerns over potentially beingstuck at sea with flammable cargoes,shipping sources say.
OPEC+ sticks to modest oil outputrises, ditches IEA data
OPEC and allies including Russiaagreed to another modest monthlyoil output boost, resisting pressureto pump more, and ditched theParis-based International EnergyAgency as a data source in a sign of ahardening standoff with the West.The group has resisted repeatedcalls by the United States and theIEA to pump more crude to coolprices that climbed close to an all-time high after Washington andBrussels imposed sanctions onMoscow following its invasion ofUkraine.
U.S. warns India, others againstsharp rise in Russian oil imports
A significant increase in Russian oilimports by India could expose NewDelhi to a "great risk" as the UnitedStates prepares to step upenforcement of sanctions againstMoscow for its invasion of Ukraine, asenior U.S. administration officialsaid. While the current U.S.sanctions against Russia do notprevent other countries from buyingRussian oil, the warning raisesexpectations that Washington willattempt to restrict other countries'purchases to normal levels.
Germany girds for gas rationing,Europe on edge in Russian standoff
Germany triggered an emergencyplan to manage gas supplies underwhich Europe's largest economycould ration power if a standoff overa Russian demand to pay for fuelwith roubles disrupts or haltssupplies. Moscow's insistence onrouble payments for the Russian gasthat meets a third of Europe'sannual energy needs has galvanisedothers in Europe: Greece called anemergency meeting of suppliers, theDutch government said it wouldurge consumers to use less gas andthe French energy regulator toldconsumers not to panic.
CPC pipeline outage forcesKazakhstan to cut oil output by afifth
Kazakhstan is set to lose at least afifth of its oil production for a monthafter storm damage to exportfacilities, the energy ministry said,adding to concerns about global oilsupplies and boosting crude prices.The former Soviet republic will haveto cut its oil output by 320,000 bpd,or 20%, until repairs are done tofully restore capacity of the CPCBlack Sea terminal, the ministry saidin a statement.
Russian oil firm shuffles Venezuelaassets as sanctions bite
A Russian oil company used toprovide a workaround to U.S. oiltrading sanctions on Venezuela isscrabbling to avoid another set ofsanctions, this time from Europe andthe U.S over Russia's invasion ofUkraine. Russia is one of Venezuela'sfew allies on the international stage.Russian companies have helpedstate-run oil firm PDVSA sustainoutput in recent years despite U.S.sanctions intended to deprivePresident Nicolas Maduro'sgovernment of its main source ofexport income
Biden spurs record emergency oilrelease in 'moment of peril' forworld
President Joe Biden launched thelargest release ever from the U.S.emergency oil reserve andchallenged oil companies to drillmore in an attempt to bring downgasoline prices that have soaredduring Russia's war with Ukraine.The announcement comes as part ofa broad effort by Biden to tackleraging inflation that has hurt U.S.consumers and threatens Biden'sfellow Democrats as they seek tomaintain control of Congress in theNovember elections.
UAE, Saudi say OPEC+ should notplay politics
The energy ministers of Saudi Arabiaand the United Arab Emirates, keymembers of OPEC+, said theproducers' group should not engagein politics as pressure mounted onthem to take action against Russiaover its invasion of Ukraine. Askedby the moderator at an industryevent about whether OPEC+ has amoral responsibility to expel Russia,Saudi Energy Minister PrinceAbdulaziz bin Salman said"everybody leaves his politics at thedoor" when they hold meetings.
Source: Reuters
COMMODITY NEWS – OIL & GAS

Legal notice: The information and data contained in this presentation is derived from a variety of sources, own and third party’s, public and private, and is provided for
information purposes only. Whilst banchero costa has used reasonable efforts to include accurate and up-to-date information in this presentation, banchero costa makes no
warranties or representations as to the accuracy of any information contained herein or accuracy or reasonableness of conclusions drawn there from. Although some
forward-looking statements are made in the report, banchero costa cannot in any way guarantee their accuracy or reasonableness. banchero costa assumes no liabilities or
responsibility for any errors or omissions in the content of this report.
www.bancosta.com
GENOA
banchero costa spa
ITALY
tel +39 01056311
MONACO
bancosta (monaco) sam
MONACO
tel +377 97707497
GENEVA
bancosta s.a.
SWITZERLAND
tel +41 227372626
LUGANO
bc insurance s.a.
SWITZERLAND
tel +41 912251067
LONDON
bancosta (uk) ltd.
UNITED KINGDOM
tel +44 2073981870
THE HAGUE
bancosta (benelux) bv
THE NETHERLANDS
tel +31 612346176
DUBAI
bancosta medioriental dmcc
UNITED ARAB EMIRATES
tel +971 43605598
BEIJING
bancosta (oriente) ltd. beijing
CHINA
tel +86 1084534993
SEOUL
bancosta oriente ltd. korea
SOUTH KOREA
tel +82 269592637
HONG KONG
bancosta (oriente) ltd.
HONG KONG, CHINA
tel +852 28651538
SINGAPORE
bancosta (oriente) pte ltd.
SINGAPORE
tel +65 63276862
TOKYO
bancosta tokyo office
JAPAN
tel +81 362688958