Modeling Dynamics of Oil Prices under Different Regimes of Oil Market Development
Upload
khangminh22Category
view
1download
0
Analysis and Forecasts to 2O23
Together
SecureSustainable
Ma
rk
et
Re
po
rt
Se
rie
s
OIL 2O18

INTERNATIONAL ENERGY AGENCY
The IEA examines the full spectrum of energy issues including oil, gas and coal supply and demand, renewable energy technologies, electricity markets, energy efficiency, access
to energy, demand side management and much more. Through its work, the IEA advocates policies that will enhance the reliability, affordability and sustainability of energy in its 30 member countries, 7 association countries and beyond.
The four main areas of IEA focus are:
n Energy Security: Promoting diversity, efficiency, flexibility and reliability for all fuels and energy sources;
n Economic Development: Supporting free markets to foster economic growth and eliminate energy poverty;
n Environmental Awareness: Analysing policy options to offset the impact of energy production and use on the environment, especially for
tackling climate change and air pollution; and
n Engagement Worldwide: Working closely with association and partner countries, especially major emerging
economies, to find solutions to shared energy and environmental
concerns.
IEA member countries:
Australia Austria
Belgium Canada
Czech RepublicDenmark
EstoniaFinland
FranceGermany
GreeceHungary
Ireland Italy
JapanKoreaLuxembourgMexicoNetherlandsNew Zealand NorwayPolandPortugalSlovak RepublicSpainSwedenSwitzerland
TurkeyUnited Kingdom
United States
The European Commission also participates in
the work of the IEA.
Please note that this publication is subject to specific restrictions that limit its use and distribution.
The terms and conditions are available online at www.iea.org/t&c/
© OECD/IEA, 2018
International Energy Agency Website: www.iea.org
Together
SecureSustainable

Analysis and Forecasts to 2O23
Ma
rk
et
Re
po
rt
Se
rie
s
OIL 2O18
Check out the new and improved Oil Market Report website!The IEA has redesigned and improved its online Oil Market Report (OMR), making it easier for subscribers and non-subscribers to get important information from the site.
The OMR site — https://www.iea.org/oilmarketreport/ — now offers more powerful search options and a fully indexed archive of reports going back to 1990. The improved OMR also features interactive graphics as part of each monthly issue.
First published in 1983, the OMR provides the IEA view of the state of the international oil market, with projections for oil supply and demand 6 to 18 months ahead. For more information on subscribing to the OMR, please visit https://www.iea.org/oilmarketreport/subscription/.

FOREWORD
OIL MARKET REPORT 2018 3
FOREWORD
Conditions in the oil market have changed substantially since we presented our last report a year ago. The most notable difference is the impressive resurgence of production in the United States. The International Energy Agency was among the first to foresee the global impact of the rise of light tight oil (LTO) in the US. This comeback demonstrates a fundamental change in the nature of the global oil markets.
As a result, we revised our supply projections for US output by more than 2 mb/d compared with last year’s report. Our latest analysis shows that LTO will continue to surge, driving up total liquids production to nearly 17 mb/d by 2023, a turn of events that solidifies the United States as the leading oil producer in the world. Combined new production from the US, Brazil, Canada and Norway, all members of the “IEA family,” will more than cover projected growth in global demand over the next three years.
One thing hasn’t changed over the past year, however. Upstream investment shows little sign of recovering from its plunge in 2015-2016, which raises concerns about whether adequate supply will be available to offset natural field declines and meet robust demand growth after 2020.
We see several other noteworthy shifts in the market. A new marine fuel specification is creating challenges for refiners and ship owners. Producers in the Middle East are more and more turning to refining. And global oil trade routes are moving towards Asia as China and India (also members of the IEA family) replace the United States as top oil importers. With seaborne supply lines getting longer, energy security – one of the IEA’s core missions – remains as important as ever.
Finally, this report emphasises a new surge in petrochemicals, which is one of the key drivers of global oil demand growth. Given this increase, the challenge of creating a more sustainable petrochemicals industry, which produces all the plastics and fertilisers that our modern societies depend upon, is an important topic that the IEA will analyse in a major new report later this year.
This report is intended to provide insights on developments in the oil market to inform governments, the energy industry and other stakeholders, and enable the right policies to promote ample, affordable and sustainable energy supplies.
Dr. Fatih Birol
Executive Director
International Energy Agency

ACKNOWLEDGEMENTS
4 OIL MARKET REPORT 2018
ACKNOWLEDGEMENTS
This publication was prepared by the Oil Industry and Markets Division (OIMD) of the International Energy Agency (IEA). Its main authors are, Christophe Barret, Toril Bosoni, Anne Kloss, Olivier Lejeune, Peg Mackey, Yujiao Ma, Alfredo Peral, and Kristine Petrosyan. Nestor Abraham and Pierre Monferrand provided essential research and statistical support. Deven Mooneesawmy provided editorial assistance. Neil Atkinson, head of OIMD, edited the Report. Keisuke Sadamori, director of the IEA’s Directorate of Energy Markets and Security, provided guidance.
Other IEA colleagues provided important contributions including Ali al-Saffar, Alessandro Blasi, Pierpaolo Cazzola, Alejandro Cesar Hernandez, Davide D’Ambrosio, Kate Dourian, Jean-Baptiste Dubreuil, Araceli Fernandez Pales, Timur Guel, Pharoah Le Feuvre, Paul Hughes, Joerg Husar, Tae-Yoon Kim, Christophe McGlade, Renske Schuitmaker, Emily Stromquist and Laszlo Varro.
The IEA Communications and Information Office provided production assistance and launch support. Particular thanks to Rebecca Gaghen and her team; Muriel Custodio, Adrien Chorlet, Astrid Dumond, Christopher Gully, Jad Mouawad, Katie Russell, Bertrand Sadin, Rob Stone and Therese Walsh.
For questions and comments, please contact the Oil Industry and Markets Division.
For contact information, please see https://www.iea.org/oilmarketreport/contacts/

TABLE OF CONTENTS
OIL MARKET REPORT 2018 5
TABLE OF CONTENTS
Executive Summary .................................................................................................................... 11
1. Demand ................................................................................................................................. 15
Highlights ............................................................................................................................................... 15
Global Overview .................................................................................................................................... 16 Macroeconomic environment and prices ......................................................................................... 18 Coming changes in bunker fuel specifications .................................................................................. 19 Booming demand for petrochemicals ............................................................................................... 23
OECD demand ....................................................................................................................................... 28 OECD Americas .................................................................................................................................. 28 OECD Europe ..................................................................................................................................... 30 OECD Asia Oceania ............................................................................................................................ 32
Non-OECD demand ............................................................................................................................... 33 Africa ................................................................................................................................................. 33 China .................................................................................................................................................. 34 Other Asia .......................................................................................................................................... 38 Non-OECD Europe ............................................................................................................................. 39 Former Soviet Union (FSU) ................................................................................................................ 40 Latin America ..................................................................................................................................... 41 Middle East ........................................................................................................................................ 42
2. Supply .................................................................................................................................... 45
Highlights ............................................................................................................................................... 45
Global Overview .................................................................................................................................... 45
Decline rates slow at mature fields ....................................................................................................... 49
Non-OPEC oil supplies ........................................................................................................................... 51 Strong growth lifts US to record highs .............................................................................................. 52 Majors bet big on Brazil..................................................................................................................... 55 Canada poised for strong growth, but export constraints crimp future gains ................................. 57 Mexican growth delayed by reluctant farm-out partners ................................................................ 58 Mixed bag in Latin America ............................................................................................................... 59 North Sea boost ................................................................................................................................. 60 Russian plateau ................................................................................................................................. 62 Modest growth in the Caspian .......................................................................................................... 63 Asian region sees biggest decline ...................................................................................................... 64 Africa falls .......................................................................................................................................... 65 Conflict prevents Middle East rebound ............................................................................................. 66
OPEC ...................................................................................................................................................... 66 Iraq dominates expansion ................................................................................................................. 67 Downward spiral in Venezuela .......................................................................................................... 72 Angola drags on Africa ...................................................................................................................... 73
Iran drives OPEC gas liquids supply ....................................................................................................... 75

TABLE OF CONTENTS
6 OIL MARKET REPORT 2018
Global biofuel supply ............................................................................................................................. 77 Key ethanol market developments ................................................................................................... 78 Key biodiesel and HVO market developments .................................................................................. 79
3. Refining and trade .................................................................................................................. 81
Highlights ............................................................................................................................................... 81
Setting the stage .................................................................................................................................... 81
Refining Outlook .................................................................................................................................... 85 Atlantic Basin ..................................................................................................................................... 87 East of Suez ....................................................................................................................................... 90 The year 2020 problem: Implications of bunker fuel specification change ...................................... 94 Quantity vs quality ............................................................................................................................ 96
Crude Trade ........................................................................................................................................... 99
Product Trade ...................................................................................................................................... 103 Ethane/LPG ...................................................................................................................................... 104 Gasoline/naphtha ............................................................................................................................ 104 Diesel/kerosene ............................................................................................................................... 105 Fuel oil ............................................................................................................................................. 105
4. SPECIAL FEATURE: North american oil looking for a way out ................................................... 107
Highlights ............................................................................................................................................. 107
Overview ............................................................................................................................................. 107
Canada: Oil pipelines stretched to the limit ........................................................................................ 109 Planned investments ....................................................................................................................... 110 Takeaway capacity to rise, but not until 2019-20 ........................................................................... 111
West Texas: Strong investments amid production growth ................................................................. 113 Planned investments ....................................................................................................................... 114 Some capacity constrains in 2018-19 .............................................................................................. 116
US Gulf Coast: Connectivity, storage terminals key to higher exports ............................................... 117 Planned investments ....................................................................................................................... 118 US crude export capacity to reach 4.9 mb/d by 2023 ..................................................................... 121
5. Tables ................................................................................................................................... 123

TABLE OF CONTENTS
OIL MARKET REPORT 2018 7
LIST OF FIGURES Figure 1.1 Global oil demand, y-o-y change ...................................................................................... 15 Figure 1.2 Global oil demand by product and fuel oil breakdown y-o-y change............................... 17 Figure 1.3 Marine fuel demand in OECD and major non-OECD countries and shares ...................... 21 Figure 1.4 Impact of IMO regulation on the global product market y-o-y change ........................... 22 Figure 1.5 US oil demand by product, y-o-y change .......................................................................... 29 Figure 1.6 OECD Europe oil demand, y-o-y change ........................................................................... 31 Figure 1.7 Chinese oil demand, y-o-y change .................................................................................... 35 Figure 1.8 Indian oil demand, y-o-y change....................................................................................... 38 Figure 1.9 Russian oil demand, y-o-y change .................................................................................... 41 Figure 1.10 Brazilian oil demand, y-o-y change ................................................................................... 42 Figure 1.11 Saudi Arabian oil demand, y-o-y change .......................................................................... 44 Figure 1.12 Iranian oil demand, y-o-y change ..................................................................................... 44 Figure 2.1 Global liquids capacity growth .......................................................................................... 46 Figure 2.2 Global capacity growth 2017-23 ....................................................................................... 46 Figure 2.3 Highs and Lows: Change in total oil supply 2017-23 ........................................................ 46 Figure 2.4 Change in crude oil production and gross revenues - 2017 vs 2016 ................................ 47 Figure 2.5 Global oil and gas upstream capital spending 2012-18 .................................................... 47 Figure 2.6 Production volumes by FID year ....................................................................................... 48 Figure 2.7 Investment by sanction year ............................................................................................. 48 Figure 2.8 Global oil discoveries ........................................................................................................ 49 Figure 2.9 Observed global decline rates for post peak conventional oil fields ................................ 50 Figure 2.10 Annual supply loss from post-peak conventional crude oil fields .................................... 50 Figure 2.11 Selected observed decline rates ....................................................................................... 51 Figure 2.12 US total oil supply ............................................................................................................. 53 Figure 2.13 US supply growth .............................................................................................................. 53 Figure 2.14 Wellhead break-even by play ........................................................................................... 54 Figure 2.15 LTO production by play ..................................................................................................... 54 Figure 2.16 Canada total oil supply ..................................................................................................... 57 Figure 2.17 Canada supply growth ...................................................................................................... 57 Figure 2.18 Mexican oil supply ............................................................................................................ 58 Figure 2.19 Other Latin America oil supply ......................................................................................... 60 Figure 2.20 Other Latin America annual change ................................................................................. 60 Figure 2.21 North Sea oil supply .......................................................................................................... 61 Figure 2.22 North Sea annual change .................................................................................................. 61 Figure 2.23 Russia oil supply ................................................................................................................ 63 Figure 2.24 Kazakhstan oil supply ........................................................................................................ 63 Figure 2.25 Azerbaijan oil supply ......................................................................................................... 63 Figure 2.26 Asia oil supply ................................................................................................................... 65 Figure 2.27 Asia supply: Annual change .............................................................................................. 65 Figure 2.28 Non-OPEC Africa oil supply ............................................................................................... 66 Figure 2.29 Africa annual supply growth ............................................................................................. 66 Figure 2.30 Venezuelan collapse blunts Mideast gains ....................................................................... 67 Figure 2.31 Iraq leads gains ................................................................................................................. 69 Figure 2.32 UAE’s growth spurt ........................................................................................................... 69 Figure 2.33 Iran expands ...................................................................................................................... 70

TABLE OF CONTENTS
8 OIL MARKET REPORT 2018
Figure 2.34 Saudi sustains spare capacity ........................................................................................... 70 Figure 2.35 Venezuela’s story of decline ............................................................................................. 73 Figure 2.36 Angola: Past its prime ....................................................................................................... 73 Figure 2.37 Nigeria’s fragile recovery .................................................................................................. 74 Figure 2.38 Libya’s tenuous comeback ................................................................................................ 74 Figure 2.39 Ethanol (left) and biodiesel (right) production 2009-23 ................................................... 77 Figure 3.1 Riding the wave: Oil prices rebound on crude stocks decline .......................................... 82 Figure 3.2 Crossing the mountain: Refined product surplus is largely behind .................................. 82 Figure 3.3 Upstream vs downstream earnings .................................................................................. 83 Figure 3.4 Major drivers of refined product demand substitution ................................................... 83 Figure 3.5 Global liquid fuel supply structure in 2017 (mb/d) .......................................................... 84 Figure 3.6 Global refinery capacity net additions by region .............................................................. 85 Figure 3.7 Growing excess refining capacity ...................................................................................... 85 Figure 3.8 Top 10 refining regions by throughput (mb/d), 2023 vs 2013 ......................................... 86 Figure 3.9 Atlantic Basin vs East of Suez ............................................................................................ 87 Figure 3.10 US refining: The sky is the limit? ....................................................................................... 88 Figure 3.11 Latin American refining woes send imports soaring ........................................................ 88 Figure 3.12 Refining renaissance in Europe ......................................................................................... 89 Figure 3.13 Atlantic Basin refining throughput change by region ....................................................... 90 Figure 3.14 CDU capacity net additions ............................................................................................... 90 Figure 3.15 China’s refining growth more balanced in 2017 ............................................................... 92 Figure 3.16 Growing mismatch ............................................................................................................ 92 Figure 3.17 East of Suez refining throughput change by region .......................................................... 93 Figure 3.18 Refining capacity additions to 2020 for selected units ..................................................... 95 Figure 3.19 Solutions and challenges in the 3.2 mb/d of HSFO bunker switch in 2020 ...................... 96 Figure 3.20 Future crude oil slate perceptions .................................................................................... 98 Figure 3.21 Top five net importers of crude oil ................................................................................. 100 Figure 3.22 Largest changes in net crude exports, 2017-23 .............................................................. 100 Figure 3.23 East of Suez crude oil balance (adjusted for direct flows from Russia/Kazakhstan) ...... 102 Figure 3.24 Seaborne crude oil imports ............................................................................................ 103 Figure 4.1 Global crude pipeline capacity additions ........................................................................ 108 Figure 4.2 West Canadian select Cushing to Hardisty price differential ......................................... 110 Figure 4.3 Planned pipeline capacity and crude production ........................................................... 112 Figure 4.4 Canadian crude oil exports by rail .................................................................................. 113 Figure 4.5 WTI Midland versus Cushing price .................................................................................. 114 Figure 4.6 Planned Permian/Eagle Ford pipeline capacity and LTO production ............................. 117 Figure 4.7 US crude exports ............................................................................................................. 118 Figure 4.8 Forecast crude pipeline capacity buildout by primary delivery port .............................. 121

TABLE OF CONTENTS
OIL MARKET REPORT 2018 9
LIST OF MAPS Map 2.1 Venezuelan Oil Sector ....................................................................................................... 72
Regional crude oil balances in 2017 and 2023 (mb/d) ..................................................... 99 Map 3.1 Major crude trade flows, 2017 (2023), mb/d ................................................................. 101 Map 3.2 Regional LPG/ethane balances in 2017 and 2023 (kb/d) ............................................... 104 Map 3.3 Regional gasoline/naphtha balances in 2017 and 2023 (kb/d) ...................................... 105 Map 3.4 Regional diesel/kerosene balances in 2017 and 2023 (kb/d) ......................................... 106 Map 3.5 Regional fuel oil balances in 2017 and 2023 (kb/d) ........................................................ 106 Map 3.6 Canada’s existing and planned pipelines ........................................................................ 109 Map 4.1 Texas’ existing and planned pipelines ............................................................................ 115 Map 4.2
LIST OF TABLES Table 1.1 Global oil product demand by region (mb/d) ................................................................... 16 Table 1.2 Global oil demand by product (mb/d) .............................................................................. 16 Table 1.3 Macroeconomic assumptions ........................................................................................... 18 Table 1.4 Bunker deliveries in OECD and main Non-OECD countries (kb/d) ................................... 21 Table 1.5 Available steam capacities ................................................................................................ 23 Table 1.6 US ethylene production capacity additions ...................................................................... 25 Table 1.7 Chinese ethylene production capacity additions.............................................................. 26 Table 1.8 Russian ethylene production capacity additions .............................................................. 26 Table 1.9 Iran’s ethylene production capacity additions ................................................................. 27 Table 1.10 Selected ethylene production capacity additions ............................................................ 27 Table 1.11 OECD oil demand by region (kb/d) ................................................................................... 28 Table 1.12 OECD Americas oil demand by product (kb/d) ................................................................. 28 Table 1.13 OECD Americas oil demand by country (kb/d) ................................................................. 29 Table 1.14 OECD Europe oil demand by product (kb/d) .................................................................... 30 Table 1.15 OECD Europe oil demand in selected countries (kb/d) .................................................... 31 Table 1.16 OECD Asia Oceania oil demand by product (kb/d) ........................................................... 32 Table 1.17 OECD Asia Oceania oil demand by country (kb/d) ........................................................... 32 Table 1.18 Non-OECD countries oil demand (kb/d) ........................................................................... 33 Table 1.19 African oil demand by product (kb/d) .............................................................................. 33 Table 1.20 African oil demand in selected countries (kb/d) .............................................................. 34 Table 1.21 Chinese oil demand (kb/d) ................................................................................................ 34 Table 1.22 Chinese electric bus sales ................................................................................................. 36 Table 1.23 Chinese Natural Gas vehicles ............................................................................................ 37 Table 1.24 Chinese LNG trucks ........................................................................................................... 37 Table 1.25 Non-OECD Asia - excluding mainland China: Oil demand by product (kb/d) ................... 38 Table 1.26 Non-OECD Asia - excluding mainland China: oil demand in selected countries (kb/d) .... 39 Table 1.27 Non-OECD Europe oil demand (kb/d) ............................................................................... 39 Table 1.28 Non-OECD Europe oil demand in selected countries (kb/d) ............................................ 40 Table 1.29 FSU oil demand by product (kb/d) .................................................................................... 40 Table 1.30 FSU oil demand in selected countries (kb/d) .................................................................... 40 Table 1.31 Latin America oil demand by product (kb/d) .................................................................... 41 Table 1.32 Latin America oil demand in selected countries (kb/d) .................................................... 42 Table 1.33 Middle East oil demand by product (kb/d) ....................................................................... 43

TABLE OF CONTENTS
10 OIL MARKET REPORT 2018
Table 1.34 Middle East oil demand in selected countries (kb/d) ....................................................... 43 Table 2.1 Non-OPEC supply (mb/d) .................................................................................................. 52 Table 2.2 US oil supply forecast (kb/d) ............................................................................................. 55 Table 2.3 Brazilian oil supply forecast (kb/d) ................................................................................... 56 Table 2.4 Estimated sustainable OPEC crude production capacity (mb/d) ...................................... 67 Table 2.5 Estimated OPEC condensate and NGL production (kb/d) ................................................ 76 Table 3.1 Total oil demand and call on refined products (mb/d)..................................................... 84 Table 3.2 Regional developments in refining capacity and throughput .......................................... 86 Table 4.1 Planned investments in Canadian takeaway capacity .................................................... 111 Table 4.2 Planned investments in Permian/Eagle Ford crude and condensate pipelines ............. 116 Table 4.3 Planned investments in US Gulf Coast crude and condensate pipelines ....................... 119 Table 4.4 Existing and planned US Gulf Coast crude export terminals .......................................... 120

EXECUTIVE SUMMARY
OIL MARKET REPORT 2018 11
EXECUTIVE SUMMARY
The journey to 2023 is starting from a relatively comfortable place. An overhang in global oil stocks has all but disappeared and oil prices have recovered. The oil price rally has rewarded those taking part in output cuts and has also unleashed a new wave of growth from the United States. Coupled with gains from Brazil, Canada, and Norway, oil markets now look adequately supplied through 2020. There is no call for complacency, however, and more investment is needed now to ensure secure supplies to meet robust demand growth.
Oil demand growth in the next five years rests on solid outlook for the global economy
A strong world economy is expected to underpin solid increases in oil demand. The International Monetary Fund sees global economic growth at 3.9% in the early part of our forecast period with all regions expected to perform well. Strong economies will, in turn, use more oil and we expect demand to grow at an average annual rate of 1.2 mb/d. By 2023, oil demand will reach 104.7 mb/d, up 6.9 mb/d from 2017. As has been the case for some years, China and India together will contribute nearly 50% of global oil demand. As China’s economy becomes more consumer-oriented, the rate of growth in oil demand slows down to 2023, compared with the 2010-17 period. In contrast, the pace of oil demand growth will pick up slightly in India.
While there is no peak oil demand in sight, the pace of growth will slow down to 1 mb/d by 2023 after expanding by 1.4 mb/d in 2018. There are signs of substitution of oil by other energy sources in various countries. A prime example is China, which has some of the world’s most-stringent fuel efficiency and emissions regulations. As the country recognises the urgent need to tackle poor air quality in cities, efforts are intensifying. Sales of electric vehicles are rising and there is strong growth in the deployment of natural gas vehicles, particularly into fleets of trucks and buses. Our analysis shows that a rising number of electric buses and LNG-fueled trucks in China will significantly slow gasoil demand growth.
Petrochemicals are a key driver of oil demand growth
The fastest-growing source of global oil demand growth are petrochemicals, particularly in the United States and China. The shale revolution in the United States has opened up a major source of cheap domestic feedstock. About 1.7 mb/d, or 25%, of our total demand growth to 2023 is taken up by ethane and naphtha. Global economic growth is lifting more people into the middle class in developing countries and higher incomes mean sharply rising demand for consumer goods and services. A large group of chemicals derived from oil and natural gas are crucial to the manufacture of many products that satisfy this rising demand. Examples include personal care items, food preservatives, fertilisers, furnishings, paints and lubricants for automotive and industrial purposes.
One of the biggest and most pressing issues is the implementation of major changes to marine fuel specifications mandated by the International Maritime Organisation (IMO). The new rules loom ever closer and the maritime and refining industries face a huge challenge to implement them. From the vantage point of early 2018, it is not clear how successful they will be, especially as demand for non-marine gasoil grades is growing steadily. The new regulations will cause a

EXECUTIVE SUMMARY
12 OIL MARKET REPORT 2018
massive switch out of high sulphur fuel oil demand and into marine gasoil or a new very low sulphur fuel oil. The total demand for oil products will not be dramatically altered, but the impact of the changes on the product mix is a major uncertainty in our forecast.
Investment in the upstream sector shows only modest signs of recovery
With global demand rising steadily, the response from the supply side is crucial. The recovery from the historic drop-off in investments by 25% in both 2015 and 2016 has barely started. Investment was flat in 2017, and early data suggests only a modest rise in 2018. This is potentially storing up trouble for the future. An added concern is that investment is overwhelmingly focused on the light tight oil (LTO) sector in the United States. As a result, upstream investment may be inadequate to avoid a significant squeezing of the global spare capacity cushion by 2023, even as costs have fallen and project efficiency has improved.
Natural production declines are slowing, but more investment will be needed. Each year the world needs to replace 3 mb/d of supply lost from mature fields while also meeting robust demand growth. That is the equivalent of replacing one North Sea each year. Investment in maintaining current production is one challenge, investing in future demand growth is another. Our analysis shows that discoveries of new oil resources fell to another record low in 2017, with less than 4 billion barrels of crude, condensate and NGLs found.
In the past three years we have seen oil production from China, Mexico and Venezuela fall by a combined 1.7 mb/d as a consequence of lower investment. China’s decline has slowed; in Mexico, impressive reform proposals are being developed and production could return to growth by 2023. Meanwhile, Venezuela remains a wild card. In the twenty years since former President Chavez first came to power, oil production has more than halved to below 1.6 mb/d, and capacity will plunge by nearly 700 kb/d more by 2023, a major acceleration of the decline we expected a year ago.
With Venezuela in crisis, the net growth in total OPEC production capacity will be only 750 kb/d, and this number includes an assumption that shut-in production of around 500 kb/d from the Neutral Zone is finally re-started. It also depends on some degree of stability in Iraq, Libya, and Nigeria.
The United States dominates oil supply growth as non-OPEC countries meet all demand growth through 2020
With OPEC capacity growing only modestly, more attention is focussed on the non-OPEC countries, led by the United States, which is becoming ever more dominant in the global oil market. Driven by LTO, by 2023 United States output grows by 3.7 mb/d, more than half of the total global production capacity growth of 6.4 mb/d expected by then. Total liquids production in the United States will reach nearly 17 mb/d, easily making it the top global producer, and nearly matching the level of its domestic products demand. US production could be even higher by 2023 if prices rise above the assumptions made in this report, which is based on the current forward price curve.
Brazil, Canada and Norway will also contribute to supply growth. Along with the United States, they provide nearly all of the non-OPEC increase. Production of conventional crude oil in non-OPEC countries, which excludes US LTO, will actually decline to 2023.
EXECUTIVE SUMMARY
OIL MARKET REPORT 2018 13
Excess global refining capacity grows, but Asian refiners need more crude
The downstream sector will see major change during our forecast period. Excess global refining capacity is set to increase due to the slowdown in refined product demand growth. Global refining capacity additions to 2023 are forecast to amount 7.7 mb/d. At the same time, the rate of growth of refined product demand is slowing to 5 mb/d. The growing excess refining capacity will eventually put pressure on margins. The Middle East sees the biggest growth in capacity and national companies in the region are venturing into international markets, targeting joint ventures, particularly in Asia. Even though Chinese capacity additions slow, the country maintains its recently acquired role as a net product exporter.
With growing refining throughput, Asian import requirements grow by over 3.5 mb/d. The Middle East countries will remain the largest suppliers, but their exports will only grow by 1 mb/d, given their focus on domestic refining. Other sources such as Angola and Nigeria will have lower availabilities as, respectively, their output dwindles and they process more crude locally. This provides opportunities for new suppliers, mainly the US.
The US has a growing role in crude trade and its oil will meet refiners’ needs
The United States is also making its mark in the refining industry. Conventional wisdom has it that rapidly rising LTO production is incompatible with the need of refiners to process heavier, sourer crudes, given earlier investments. This will not, in fact, be the case. With Asian import requirements growing there will be opportunities for new suppliers. As Canadian shipments to the United States grow, this frees up lighter US crude for export, particularly to meet Asian demand for petrochemical feedstocks. Shipments of oil from the United States to China are already significant. US exports will also be ideally placed to meet the need, post-IMO, for more low-sulphur crude, with a low yield of fuel oil.
The United States is well-placed to increase its role in global markets. Since the ban on exporting crude oil was lifted at the end of 2015, volumes have increased sharply, reaching 2 mb/d in some weeks. In 2018 and 2019, there might be bottlenecks in pipeline capacity for moving oil from Canada and the Permian Basin. But a close look at investment in logistics finds that after 2019, on the assumption that new projects being considered are actually commissioned, constraints will ease. This includes major Canadian projects such as Trans Mountain and Keystone XL pipeline, and the TexStar Logistics’ 550 kb/d EPIC pipeline, due to be up and running in 2019 in Texas. Ten crude oil export facilities are either being upgraded or built. As a result, by 2023 capacity is expected to more than double from current levels to about 4.9 mb/d. Corpus Christi will become the main export hub in the Gulf Coast.
Oil market likely to tighten by 2023 with increased risk of price volatility
The upshot of our analysis is that the market could go through two phases during the next six years. Through 2020, record supply from non-OPEC countries more than covers expected demand growth. But by 2023, if investments remain insufficient, the effective global spare capacity cushion falls to only 2.2% of demand, the lowest number since 2007. This raises the possibility of oil prices becoming more volatile until new supplies come on line.
The US shale sector responded quickly to rising prices both in 2010 and in 2017 and it will continue to adjust to price signals in the future. But there will still be a continued reliance on
EXECUTIVE SUMMARY
14 OIL MARKET REPORT 2018
OPEC countries for a major share of global supply. Within OPEC, more than 2 mb/d of spare capacity is held in Saudi Arabia. In turn, this emphasises the crucial role OPEC’s largest producer continues to play in providing stability to global oil markets.

DEMAND
OIL MARKET REPORT 2018 15
1. DEMAND
Highlights • Global oil demand is expected to expand by 1.2 million barrels per day (mb/d) or 1.1% per
year on average. Oil demand rises from 97.8 mb/d in 2017 to 104.7 mb/d in 2023, a total increase of 6.9 mb/d.
• Asia and Pacific will be by far the fastest growing region, contributing 4.2 mb/d of the total. The Middle East increases by 1.1 mb/d during the same period while Africa and the Americas expand by 0.7 mb/d and 0.5 mb/d respectively. European oil demand, meanwhile, is expected to return to its long term trend of decline, posting a 0.2 mb/d decrease.
• The bulk of growth will come from LPG and ethane, as well as naphtha, supported by expansion in the petrochemical sector. Strong gains will also be seen in kerosene consumption as air travel becomes more accessible in non-OECD countries. Gasoline demand growth slows over the period on tighter fuel economy standards, while gasoil growth slows to 0.7% per year on average through to 2023.
• The petrochemical industry will be one of the main drivers of growth, with new steam crackers adding at least 1.4 mb/d to oil consumption over the forecast period.
• In 2020, a change in International Maritime Organisation (IMO) regulations will trigger a switch to new marine fuel specifications, causing a major transformation within product groupings. Low sulphur product availability will be a constraint during the switch.
• Efficiency improvements and rising use of alternative fuels will cap transport demand growth in OECD and non-OECD countries. Environmental policies in the People’s Republic of China (hereafter referred to as “China”), in particular, will have a significant impact on gasoil demand over the forecast period.
Figure 1.1 Global oil demand, y-o-y change
Note: Y-o-y = year on year.
0.00.20.40.60.81.01.21.41.61.8
2017 2018 2019 2020 2021 2022 2023
mb/d
Rest of the world
China
Other non-OECDAsia

DEMAND
16 OIL MARKET REPORT 2018
Global Overview World oil demand is set to increase by 6.9 mb/d to 2023 at an average of 1.2 mb/d a year. Asia Pacific will contribute 4.2 mb/d of the total. Middle East demand should increase by 1.1 mb/d during the same period. Africa and the Americas will see increases of 0.7 mb/d and 0.5 mb/d respectively, while Europe’s demand should see a small decline of 0.2 mb/d. Former Soviet Union (FSU) countries will add 0.5 mb/d.
Table 1.1 Global oil product demand by region (mb/d)
2017 2018 2019 2020 2021 2022 2023 2017 – 23 Growth rate
2017 – 23 Annual growth
Africa 4.3 4.4 4.5 4.6 4.7 4.8 5.0 2.4% 0.1 Americas 31.4 31.6 31.9 31.9 31.9 31.9 31.9 0.3% 0.1 Asia/Pacific 33.9 34.7 35.4 36.0 36.8 37.5 38.1 2.0% 0.7 Europe 15.1 15.2 15.1 15.1 15.0 15.0 14.9 -0.2% 0.0 FSU 4.8 4.9 4.9 5.1 5.2 5.3 5.3 1.8% 0.1 Middle East 8.3 8.5 8.6 8.8 9.0 9.2 9.4 2.1% 0.2 World 97.8 99.2 100.4 101.5 102.6 103.7 104.7 1.1% 1.2
Annual Chg (%) 1.6 1.4 1.3 1.1 1.1 1.1 0.9 Annual Chg (mb/d) 1.6 1.4 1.2 1.1 1.1 1.1 1.0
Oil demand by fuel type largely reflects the major changes due to take place in 2020 in marine bunker fuel demand. Note that the new 0.5% sulphur marine fuel due to replace high sulphur bunker in 2020 is included in our fuel oil numbers, explaining part of the large growth in fuel oil demand after 2020.
Table 1.2 Global oil demand by product (mb/d)
2017 2018 2019 2020 2021 2022 2023 2017 – 23 Growth rate
2017 – 23 Annual growth
LPG & ethane 11.7 12.1 12.5 12.8 13.1 13.4 13.6 2.6% 0.3 Naphtha 6.4 6.4 6.6 6.7 6.9 7.1 7.2 1.9% 0.1 Motor gasoline 25.9 26.2 26.4 26.6 26.7 26.9 27.0 0.7% 0.2 Jet fuel & kerosene 7.5 7.6 7.7 7.8 7.9 7.9 8.0 1.2% 0.1 Gasoil/diesel 28.2 28.5 28.7 29.7 29.4 29.3 29.3 0.7% 0.2 Residual fuel oil 7.2 7.3 7.4 6.6 7.2 7.7 7.9 1.5% 0.1 Other products 11.0 11.1 11.2 11.3 11.5 11.6 11.7 1.0% 0.1 Total products 97.8 99.2 100.4 101.5 102.6 103.7 104.7 1.1% 1.2
Note: Residual fuel oil includes a new very low suphur fuel oil (0.5%) marine fuel.
LPG and ethane, as well as naphtha, post the strongest growth, supported by petrochemical projects coming on stream in 2018-23 (see Booming oil demand for petrochemicals). Gasoline demand growth is very modest as relatively strong growth in non-OECD countries is offset by long-term structural decline in OECD countries. In OECD and non-OECD countries alike, however, improvements in the fuel economy of cars and trucks will contribute to a significant slowdown in transportation fuel demand growth.
Fuel efficiency standards enforced in 10 of the top 15 vehicles markets covering more than 80% of global car sales will impact strongly on future oil demand. The ten zones that have introduced greenhouse gas emissions or fuel economy standards for light duty vehicles include Brazil, Canada,

DEMAND
OIL MARKET REPORT 2018 17
China, the European Union, India, Japan, Korea, Mexico, Saudi Arabia and the United States (US). Efficiency factors based on the International Energy Agency’s (IEA) World Energy Model are used as input in the forecast.
Gasoil demand growth slows to 0.7% per year on average through 2023 and is largely impacted by change in IMO bunker specifications in 2020. After a strong increase in 2020, marine gasoil demand will return to its 2019 levels by the end of the forecast. In addition, the sharp increase expected in the price of gasoil following the 2020 IMO changes penalises demand in other sectors. We analyse the possible impact of the IMO regulations in a separate section (see Coming changes in bunker specifications).
Fuel oil demand, including the new very low sulphur marine fuel oil, will grow by 1.5% per year on average. As demand for high sulphur fuel oil falls away when the new IMO regulations are implemented, lower prices could help high sulphur fuel oil to expand in the power generation sector during the forecast period. The 0.8 mb/d drop in fuel oil demand in 2020 hides much larger moves between high sulphur bunker fuel oil (dropping by close to 2 mb/d) and the new 0.5% very low sulphur marine fuel oil (starting at close to 1 mb/d). In the meantime, inland fuel oil demand should benefit from discounted prices.
Figure 1.2 Global oil demand by product and fuel oil breakdown y-o-y change
Kerosene demand is expected to rise by 1.2% on average as strong growth in non-OECD countries of 2.8% per year offsets a marginal decline in OECD countries. Demand in non-OECD countries is supported by a fast growth in global air travel, reflecting the robust economic environment and lower fares. The International Air Transport Association reported growth of 7.6% for industry-wide revenue passenger kilometers (RPKs) in 2017, well above the 10 year average pace of 5.5%. International passenger traffic growth rose in all regions, with the exception of the Middle East, where growth slowed from 11.5% in 2016 to 6.6% in 2017. Domestic traffic rose very strongly in key emerging markets: in India growth reached 23.3% in 2017, accelerating from 17.5% in 2016. The acceleration of jet kerosene demand in India has, however, been partly offset by a decline in household kerosene demand as cooking fuels are increasingly moving to LPG. Indian total kerosene demand is nevertheless expected to post strong growth: 5.4% per year on average over the forecast period. China’s domestic air traffic growth slowed to 11.3% in 2017 and its kerosene demand is
-1.0
-0.5
0.0
0.5
1.0
1.5
2.0
2.5
2017 2018 2019 2020 2021 2022 2023
mb/dLPG & ethane
Naphtha
Motor gasoline
Jet fuel &kerosene
Gasoil/diesel
Residual fuel oil
Other products
Total products
-2.0-1.5-1.0-0.50.00.51.01.52.02.53.0
2017 2018 2019 2020 2021 2022 2023
mb/dLPG ðane/naphtha/gasolineJet fuel &kerosene/otherproductsGasoil/diesel
Inland FO
New bunkerVLSFO
Bunker HSFO
Total products
DEMAND
18 OIL MARKET REPORT 2018
expected to increase by 3.7% per year on average over the forecast period. Brazil’s domestic air transport growth moved from a contraction of 5.5% in 2016 to growth of 3.5% in 2017. However, the increase in oil prices in late 2017 and early 2018 is likely to slow growth.
Macroeconomic environment and prices The January 2018 World Economic Outlook from the International Monetary Fund (IMF) serves as the background to our forecast. According to the IMF, world economic growth was estimated at 3.7% in 2017, and is expected to accelerate to 3.9% in 2018 and 2019 and to remain between 3.7% and 3.8% for the rest of the forecast period.
Table 1.3 Macroeconomic assumptions
2016 2017 2018 2019 2020 2021 2022 2023 United States 1.5% 2.2% 2.7% 2.5% 1.8% 1.7% 1.7% 1.7% Japan 1.0% 1.8% 1.2% 0.9% 0.2% 0.7% 0.6% 0.5% China 6.7% 6.8% 6.6% 6.4% 6.2% 6.0% 5.8% 5.5% India 7.1% 6.7% 7.4% 7.8% 7.9% 8.1% 8.2% 8.2% Euro area 1.8% 2.4% 2.2% 2.0% 1.6% 1.5% 1.5% 1.4% Russia -0.2% 1.8% 1.7% 1.5% 1.5% 1.5% 1.5% 1.5% South Africa 0.3% 0.9% 0.9% 0.9% 2.2% 2.2% 2.2% 2.2% World 3.2% 3.7% 3.9% 3.9% 3.7% 3.8% 3.8% 3.8%
Source: Based on International Monetary Fund, World Economic Outlook 2017.
OECD countries show strong growth. In the US, recent tax cuts are likely to provide support to investment and economic activity with GDP forecast to grow by 2.7% in 2018 and 2.5% in 2019, before slowing as fiscal adjustment takes place. Mexico is likely to benefit from the improved US performance. In the European Union (EU), growth is also expected to be strong, in line with recent accelerations in Germany, Italy and the Netherlands. Japanese growth is also relatively robust by historical standards: 1.2% in 2018 and 0.9% in 2019.
The leading non-OECD economies will generally perform well during the forecast period. Developing Asia will see growth of 6.5% in 2018-19, with the main impetus from China and India, averaging between 6.3% and 6.5% out to 2023. China “qualitative” model of growth is however expected to be less energy-intensive than in recent years. Non-EU European economies will grow by 5% in 2018-19, lifted by a favorable external environment. Latin American growth is projected at 1.9% in 2018 and 2.6% in 2019 and will remain above 2.6% through the end of the forecast. A notable exception is Venezuela, where the economy will deteriorate markedly for at least the next year or two. Growth in the Middle East and North Africa is expected to improve on the back of higher oil prices seen since the middle of 2017, achieving 3.5% in 2018-19. Nigeria should also benefit from higher oil prices and more stable oil production, pushing Sub-Saharan Africa growth to 3.3% in 2018 and 3.5% in 2019. However, South African growth is likely to remain weak, below 1% in 2018-19. Finally, the Former Soviet Union is expected to continue to expand at more than 2.1%, as the Russian Federation (hereafter referred to as “Russia”) should experience steady growth.
The sudden recovery in trade volumes in 2017 is one of the factors supporting recent strong gasoil demand, as there is a strong correlation between trade and diesel deliveries. The volume of world trade rose by 2.7% in 2015, 2.5% in 2016, but jumped by 4.7% in 2017, well above GDP growth. Trade benefitted from an investment rebound, triggering demand for machinery, electronics and

DEMAND
OIL MARKET REPORT 2018 19
semi-conductors. According to the IMF, solid economic growth in the next few years will see the volume of world trade grow by 4.5% on average in 2018-20, providing support to demand for marine bunkers and diesel.
In this five-year outlook, we use an average of the ICE Brent future curve as taken over mid-December 2017 to mid-January 2018 as a price indicator to guide our forecast. Oil prices are assumed to progressively decline to USD 58 (United States dollar)/bbl in 2023, but the high prices seen early in 2018 could restrain growth this year before lower prices later in the forecast period provide support. An important exception to the generally moderate oil price climate in the next few years is gasoil. In 2020, gasoil prices are expected to jump by more than 20% as a consequence of the implementation of the IMO’s new marine fuel specifications. The switch will have a strong impact on gasoil prices across the board, triggering a temporary slump in demand in other sectors and adjustment on the supply side, possibly helping refiners to find enough compliant fuel for the bunker market.
Coming changes in bunker fuel specifications At the end of 2016, the IMO confirmed that, from January 2020, ships would have to use marine fuel with sulphur content below 0.5% compared to the current 3.5% limit. The average sulphur content in bunker fuels today is close to 2.5% but the change will nevertheless be drastic. Under the new rules, ship owners could decide to use 0.5% very low sulphur bunker fuel (VLSFO), marine gasoil (MGO), or high sulphur fuel oil (HSFO) with exhaust gas cleaning systems that remove sulphur oxides from the ship’s engine and boiler exhaust gases (known as “scrubbers”). Another option could be to switch to an alternative fuel, e.g. liquefied natural gas (LNG), or not to comply with the new rules. More than 3 mb/d of high sulphur bunker fuel is caught up in these changes and oil companies and traders are working to put a new 0.5% bunker fuel on the market.
With two years to go before the regulations are implemented, there is still a lot of uncertainty regarding the strategy of shipping companies, how the new 0.5% fuel will be used, and the availability of marine gasoil to satisfy demand. In this section, we look at one possible scenario for 2020 and its impact on the consumption of gasoil, high sulphur fuel oil and very low sulphur (0.5%) fuel oil, and the possible use of the likely surplus of HSFO.
A possible scenario for 2020
The specification change will trigger a surge in gasoil demand in 2020, used directly as a marine fuel (MGO) or for blending in a new very low sulphur (0.5%) marine fuel (VLSFO). The analysis of world refining (see Refining) shows that gasoil availability will be a major constraint during the switch. The additional gasoil needed in 2020 is likely to trigger a spike in diesel prices. In our forecast, we assume an increase of 20% to 30% in that year, slowing demand for all gasoil uses. Inland users are nevertheless expected to be able to bid a higher price for gasoil than marine users, and are likely to be served first. Even if marine fuel suppliers use all the remaining gasoil available to produce a fuel compliant with the new regulations (MGO or the new 0.5% bunker fuel), a large part of 2019’s HSFO bunker demand will remain after 2020.
For 2020, we assume that, initially, for OECD and the main non-OECD countries:
• 30% of the current HSFO bunker demand will switch to marine gasoil (MGO).
• 30% of the HSFO bunker demand will switch to the new very low 0.5% sulphur fuel (VLSFO).
• 40% of HSFO bunker demand will remain.

DEMAND
20 OIL MARKET REPORT 2018
Some 30% of HSFO bunker fuel is likely to switch initially to MGO, requiring minimal investment, although the lack of gasoil availability will, however, constrain MGO demand in 2020 (see Refining). MGO demand is nevertheless set to jump by 970 thousand barrels per day (kb/d) in 2020, to 1.75 mb/d, but to rapidly decline thereafter as shipping companies switch to the new VLSFO bunker fuel.
Some 30% of 2019 HSFO demand, representing 1 mb/d, will initially be replaced by a new 0.5% sulphur fuel, which is likely to be comprised of existing low sulphur fuels (or segregated components) and gasoil. The quantity of VLSFO produced will, however, be limited by low sulphur product availability (see Refining). In addition, shipping companies will be reluctant to adopt a new bunker fuel immediately, as they will need to have confidence that it will be available in ports and that they can mix several fuel types without compatibility issues. A new 0.5% sulphur bunker fuel resulting from blending operations may not be stable or compatible with other fuels and furthermore shipping companies may decide to wait and see the impact of the new fuel on engines. Therefore, in the beginning of the transition, shipping companies may prefer to use MGO. However, as time goes by, shipping companies are more likely to adopt the new fuel and we should see a rapid decline in MGO’s share over the forecast period.
The 40% share of bunker fuel demand retained by HSFO, or 1.3 mb/d, will include fuel used in vessels equipped with scrubbers and initial non-compliance. There are currently only around 400 vessels with scrubbers installed or on order and their numbers will probably increase by 2020. However, even if shipping companies are suddenly willing to invest heavily in the technology, their installation by 2020 could be limited by a lack of shipyard space. Also, the economics remain uncertain: the return on a scrubber investment will depend on the price difference between HSFO and 0.5% sulphur bunker fuel, but the gap between them could narrow if many shipping companies choose to retrofit their ships with scrubbers. On the other hand, if it is not the case, the availability of HSFO in small ports may decline. In addition, scrubbers may not be seen as a definitive solution to marine pollution concerns and regulation can change in the future. Adding to the uncertainty is the fact that scrubbers have yet to be fully tested on larger engines. For all these reasons, companies may be reluctant to install scrubbers before 2020, even though the investment seems today to have a relatively quick payback. Major shippers, e.g. Maersk Line, have already announced that they favor a switch to 0.5% fuel over investment in scrubbers. Initially, part of the HSFO consumption could also be in vessels not equipped with scrubbers, but this share is expected to decline through the forecast, as more and more companies make the investment.
An option for shipping companies could be a switch to a relatively new shipping fuel such as LNG. There are approximately 100 LNG-fueled vessels globally and the order book stands at around 100 ships over the next years. Using LNG reduces somewhat the emissions of CO2 and NOx compared to other fuels. However, given the cost of retrofitting existing vessels, it will likely be considered only for new ships. In addition, LNG bunkering requires new infrastructure that will take time to build. Therefore, even though the number of vessels running on LNG will progressively increase, it seems to be more a longer-term option.
Impact of IMO regulations on gasoil, HSFO and 0.5% sulphur fuel demand
We modelled the switch in international marine bunker demand for all OECD countries and roughly 80% of non-OECD demand. The remaining demand is small and assumed to remain unchanged. For OECD and the main non-OECD countries, our detailed analysis by fuel type covers roughly 750 kb/d of gasoil bunker demand and 3.13 mb/d of fuel oil demand in 2017.

DEMAND
OIL MARKET REPORT 2018 21
Table 1.4 Bunker deliveries in OECD and main Non-OECD countries (kb/d)
2015 2016 2017 2018 2019 2020 2021 2022 2023 Marine gasoil 773 729 745 756 767 1 736 1 229 905 773 Marine VLSFO 0 0 0 0 0 969 1 496 1 849 2 018 Bunker HS FO 2 883 3 049 3 126 3 180 3 231 1 292 1 292 1 292 1 292 Total 3 656 3 778 3 872 3 937 3 997 3 997 4 017 4 047 4 084 Growth 3.3% 2.5% 1.7% 1.5% 0.0% 0.5% 0.7% 0.9%
Global bunker demand is forecast to increase by 1.6% in 2018 and 2019 on the back of a strong increase in trade. Growth is likely to pause in 2020, as bunker prices rise sharply, and resume at a lower rate (below 1% per year) to 2023. Marine fuel is a sector where efficiency improvements are strong, and demand is particularly responsive to prices as vessels operators can adjust their speed and consumption to fuel cost. The share of various fuels in bunker consumption will be significantly modified. The share of HSF0 will drop from 81% to 32% in 2020 and remain at this level through the end of the forecast period. The share of MGO will initially increase from 19% to 43% in 2020, but will drop back to 19% at the end of the forecast, as MGO is replaced by VLSFO whose share rises from 34% in 2020 to 49% in 2023.
Figure 1.3 Marine fuel demand in OECD and major non-OECD countries and shares
As a result of the IMO’s specification changes, we expect demand for HSFO bunker fuel to collapse from 3.2 mb/d in 2019 to 1.3 mb/d in 2020. We assume that 1.95 mb/d of bunker HSFO will switch to marine gasoil or a new VLSFO in 2020. That would represent additional demand of 970 kb/d for both marine gasoil and the new VLSFO. This initial switch will swiftly reverse, as shipping companies adopt the new 0.5% fuel, becoming more confident about it. High sulphur bunker demand would remain unchanged through the end of the forecast, but is likely to be increasingly used in vessels equipped with scrubbers.
In 2021, marine gasoil demand is expected to decline by 510 kb/d from the 2020 level, and the new 0.5% sulphur fuel will see demand grow by 525 kb/d while HSFO bunker demand will remain unchanged. By 2023, marine gasoil demand will have returned close to its 2019 volumes, while the new 0.5% sulphur fuel will have seen demand increase to 2.02 mb/d, and HSFO bunker demand will be unchanged at 1.3 mb/d.
The new VLSFO and additional MGO requirements will make full use of available gasoil. We assume that the new 0.5% sulphur fuel will initially be comprised of 600 kb/d of existing very low sulphur fuel
0
500
1 000
1 500
2 000
2 500
3 000
3 500
2015 2016 2017 2018 2019 2020 2021 2022 2023
kb/d
Bunker HS FO Marine gasoil Marine VLSFO
0%10%20%30%40%50%60%70%80%90%
2015 2016 2017 2018 2019 2020 2021 2022 2023

DEMAND
22 OIL MARKET REPORT 2018
oil (or its components), and a blend of gasoil and fuel oil (see Refining). Under these assumptions, the total additional gasoil needed for the switch (marine gasoil and gasoil blended in the new 0.5% sulphur fuel) will be close to 1.2 mb/d initially, which is the maximum possible volume of gasoil available for the switch according to our analysis of refining. Between 2021 and 2023, the amount of marine gasoil used will decline sharply but more gasoil is needed for the blending of the new 0.5% sulphur fuel. The total amount of additional gasoil needed remains therefore close to 1.15 mb/d through to the end of our forecast. The impact on the global product market will remain significant through the end of the forecast period.
Figure 1.4 Impact of IMO regulation on the global product market y-o-y change
The surplus HSFO
Part of the HSFO surplus will be eliminated by refinery de-bottlenecking, new projects, and better use of secondary units. Some simple refineries may be forced to close or to upgrade. The refining complex could eliminate a large volume of additional HSFO after planned investments are completed (see Refining). Part of the surplus could also be consumed in the urban heating and power sectors in Russia and the Middle East. In addition, some excess fuel oil-fired power generating capacities are available in Brazil. In Russia, the use of fuel oil-fired capacity could increase and displace some natural gas used for urban heating and in the power sector. Other candidates for an increase in fuel oil-generated electricity are Saudi Arabia, Iraq, Kuwait and Egypt. Saudi Arabia has started to replace gasoil-fired generation by natural gas and to increase the use of fuel oil in new generating capacities to accommodate coming changes in the structure of oil demand. Iraq recently increased its use of fuel oil in the power sector, and Kuwait also has room to accommodate more fuel.
Data from the Arab Union of Electricity shows that there is scope for an increase in fuel oil use in several countries. In the table above, we assume an average efficiency rate of 40% and the current utilisation rate to forecast the additional use if countries were to increase utilisation of their existing fuel oil capacities to 75%. Of course, the greater use of oil-fired capacity may be limited by the quality of fuel oil released and, in practice, these increases may be difficult to obtain.
In theory, these countries could burn an additional 460 kb/d of fuel oil in existing power plants. However, in addition to the fuel quality problem, fuel oil penetration may be limited by the current policy in many countries to promote the use of natural gas in the power sector. The higher use of fuel
-2.0-1.5-1.0-0.50.00.51.01.52.02.53.0
2017 2018 2019 2020 2021 2022 2023
mb/d LPG ðane/naphtha/gasolineJet fuel & kerosene/otherproductsInland gasoil
Marine gasoil
Inland FO
New bunker VLSFO
Bunker HSFO
Total products

DEMAND
OIL MARKET REPORT 2018 23
oil capacities, if undertaken, is likely to be temporary and reversed with a change in relative prices. Other countries with excess capacity either have very strict environmental regulations e.g. Japan and the United States, or undertook a switch to natural gas e.g. the Islamic Republic of Iran (hereafter referred to as “Iran”) and Mexico and are unlikely to reverse the switch out of fuel oil. Nevertheless, one impact of the IMO changes could be to actually increase the use of oil globally.
Table 1.5 Available steam capacities
FO capacity (MW)
Generation (GWh)
Fuel consumption
(Ktoe) Use (%)
Possible increase
(75% use)
Additional potential
fuel oil use (kb/d)
Jordan 787 2 034 345 30% 3 137 12 Saudi Arabia 19 350 84 975 24 465 50% 42 155 167
Sudan 990 4 360 1 083 50% 2 144 8 Syria 3 475 7 102 1 509 23% 15 729 62 Iraq 7 306 28 270 4 152 44% 19 730 78 Kuwait 8 970 39 825 7 815 51% 19 108 76 Lebanon 1 060 2 394 753 26% 4 570 18 Libya 1 689 4 182 781 28% 6 915 27 Morocco 600 1 748 721 33% 2 194 9 Total 44 227 174 890 50 491 45% 115 681 459
Source: Arab Union of Electricity – Statistical Bulletin 2016, IEA calculations.
Booming demand for petrochemicals
The petrochemicals industry has been a large source of growth for oil demand and it will continue to be so during our forecast period. Within the products group, LPG and ethane is the fastest growing category (2.6% per year from 2017 to 2023) and naphtha is the second fastest (1.9% per year). The major impetus for growth comes from new projects using ethane, LPG or naphtha as a feedstock. In this section, we identify and review some major projects set to have a strong impact on demand in the coming years. A large group of chemicals derived from petroleum and natural gas are of great importance and are present in many fields, ranging from personal care products to food preservatives, fertilisers, lubricants for automotive and industrial purposes, and many others. One of the main building blocks of the petrochemical industry is ethylene, which is produced by the steam cracking of a wide range of hydrocarbon feedstocks such as ethane, naphtha, propane or butane.
Countries showing the strongest growth in petrochemical feedstocks are the US and China, with Russia also being a major player. Growth in Iran is rather less certain as political factors complicate the outlook and particularly the role of foreign investors.
United States
Booming shale gas production has been a game changer for the US petrochemical industry. Natural gas fields also yield natural gas liquids: pentane, butane, propane and ethane that are processed and extracted at the gas processing plants. If takeaway capacity or markets are not available for ethane, it is rejected (i.e. left in the natural gas). As it is a valuable feedstock, gas producers and petrochemical companies have invested in facilities to move or process it. Low cost ethane gives US manufacturers

DEMAND
24 OIL MARKET REPORT 2018
a competitive advantage. Ethane crackers are very expensive and take several years to develop, often in parallel with facilities that will process the ethylene produced, which in turn will be used in many sectors and products.
In the period 2018-23, it is estimated that the US will increase ethylene production capacity by nearly 13 million tons per year (mt/y). A big share of these projects will be built on the Gulf Coast, due to its proximity to hydrocarbon producing areas. Ethane production increased from 1 mb/d at the start of 2015 to 1.6 mb/d at the end of 2017, as oil and gas production increased and less ethane was rejected. The US has become a major exporter of ethane, with shipments reaching 250 kb/d in November 2017 (from 135 kb/d in January). Exports went mainly to Europe with smaller quantities to Canada, Brazil and India.
Some of the big-scale ethylene plants in the US are expected to be part of large integrated petrochemical complexes with polyethylene units within them. This wave of new projects will help the US to not only meet growing domestic demand but also supply ethylene export markets.
One key investment in the sector is ExxonMobil’s 1.5 mt/y ethylene cracker in Baytown, Texas, that is expected to be producing material by mid-2018. The cracker is being developed alongside a multi billion dollar expansion project in the Baytown area that will increase the Exxon plant’s polyethylene capacity by 1.3 million ton per year (mt/y). The first of these two new 650 kt/y polyethylene lines started production late in 2017.
The 50-50 joint venture between Chevron and Phillips 66 to build a 1.5 mt/y ethylene cracker, also at Baytown, is also an important project. This is expected to achieve full production in mid-2018. The USD 6 billion (bn) project also includes two new polyethylene units at Old Ocean, Texas. Each of the units, with a nameplate capacity of 500 kt/y, was inaugurated late in 2017. Ethylene feedstock for polyethylene units will be transported from Baytown to Old Ocean through a company-owned pipeline. As part of its Gulf Coast project, the joint venture company is also expanding its storage capacity and rail facilities to ship polyethylene around North America and to export terminals.
Another example of petrochemical integration is Sasol’s Lake Charles, Louisiana, complex, a USD 11 bn project that consists of a 1.5 mt/y ethane cracker and six downstream chemical production facilities. Two new polyethylene facilities, 470 ton per year (t/y) of linear low-density polyethylene (LLPDE) and 450 t/y of low-density polyethylene (LDPE), as well as the ethane cracker, are expected to come online in in the second half of 2018.
Taiwan’s Formosa Plastics Corporation USA is currently building a 1.2 mt/y ethane cracker at Point Comfort, Texas, as well as two LDPE and high-density polyethylene (HDPE) units, each with a capacity of 0.4 mt/y. The project is expected to be operational late in 2018.
While the Gulf Coast hosts the bulk of North America’s petrochemical industry, other areas will also see the construction of new projects. Shell is planning to start up the Pennsylvania petrochemical complex consisting of a 1.6 mt/y ethane cracker with a polyethylene derivatives unit in the early 2020s. The plant will use low-cost ethane from shale gas producers in the Marcellus and Utica basins.

DEMAND
OIL MARKET REPORT 2018 25
Table 1.6 US ethylene production capacity additions
Company Location Capacity
(thousand tons/year)
Feedstock Max capacity
feedstock requirement
(kb/d) Scheduled year
ExxonMobil Baytown, Texas 1 500 Ethane 87 2018
Chevron Phillips Chemical
Baytown, Texas 1 500 Ethane 87 2018
Sasol Lake Charles, Louisiana 1 500 Ethane 87 2018
Formosa Plastics Point Comfort, Texas 1 200 Ethane 69 2018
Indorama Ventures Olefins LLC
Westlake, Louisiana 370 Ethane/Propane 24 2018
Shintech Inc. Plaquemine, Louisiana 500 Ethane 29 2019
Dupont Orange, Texas 100 Ethane 6 2019
Total Petrochemicals and Refining USA
Port Arthur, Texas 1 000 Ethane 58 2020
Shell Chemical Appalachia
Monaca, Pennsylvania 1 600 Ethane 92 2021
Appalachian Shale Cracker Enterprise
Parkersburg, West Virginia 1 000 Ethane 58 Possible 2022
PTTGC America Belmont County, Ohio 1 000 Ethane 58 Possible 2022
Badlands North Dakota 1 500 Ethane 87 Possible 2022
Total 12 770 740 Source: Press reports, company reports.
China
China is one of the largest users of plastic in the world. Not only is it a major producer but for many years it has been an importer of waste material from around the world for recycling into new products.
To meet growing domestic demand and as China becomes a more consumer-focused economy, close to 8 million tons per year of ethylene capacity is likely to come online in the 2018-23 period, but unlike in the US, naphtha will be the dominant feedstock.
Although China’s new crackers will mainly use naphtha as a feedstock, they can switch to gasoil or LPG. The government is developing seven refining and petrochemical facilities, all along the coast from Dalian to Guangdong.
China is also planning to use ethane imported from the US as a feedstock: an example is SP Chemical’s 600 t/y project that could be ready by 2020. New projects expected to come on stream in 2018-23 will increase Chinese naphtha demand by 375 kb/d and LPG and ethane demand by 100 kb/d by the end of the forecast period.

DEMAND
26 OIL MARKET REPORT 2018
Table 1.7 Chinese ethylene production capacity additions
Company Location Capacity
(thousand tons/year)
Feedstock Max capacity
feedstock requirement
(kb/d)
Scheduled year
CNOOC and Shell Petrochemicals Company Limited
Guangdon, Huizhou 1 200 Naphtha 88 2018
Zhejiang Rongsheng Holding Group
Zhejiang 1 400 Naphtha 102 2018
Sinopec Gulei JV, Zhangzhou
Zhangzhou, Fujian 1 200 Naphtha 88 2019
Sinopec-Kuwait Petroleum Corp.
Zhanjiang City, Guangdong 1 000 Naphtha 73 Possible
2020
CNOOC Hainan, Yangpu 1 000 Propane/Butane 74 Possible 2020
SP Chemicals Taixing, Jiangsu 600 Ethane/Propane/Butane 39 Possible 2020
Sinochem Quanzhou Petrochemical
Fujian,Quanzhou 1 000 Naphtha 73 2021
Sinopec-SK Wuhan Petrochemical Wuhan, Hubei 300 Naphtha 22 2021
Total 7 700 560 Source: Press reports, Company reports.
Russia
Russia is considering almost 5 mt/y of new ethylene capacity, which will increase demand mainly for ethane over the forecast period. We assume that LPG and ethane-based projects will increase demand in Russia by 130 kb/d by 2023.
Table 1.8 Russian ethylene production capacity additions
Company Location Capacity
(thousand tons/year)
Feedstock Max capacity
feedstock requirement
(kb/d)
Scheduled year
Gazprom Novy Urengoy 400 Ethane 23 2019
Sibur Tobolsk 1 500 Ethane/Propane/Butane 99 2020 Gazprom neftekhim Salavat Salavat 1 000 Ethane/Naphtha 65 Possible
2022 Nizhnekamskneftekhim Tatarstan 600 Ethane/Naphtha 39 2022
Rosneft and Mitsui & Nakhodka 1 400 Naphtha 102 Possible 2023
Total 4 900 329
Source: Press reports, Company reports.

DEMAND
OIL MARKET REPORT 2018 27
Iran
Iran’s future steam cracker additions could bring on stream maximum of 3.5 mt/y of additional ethane capacity between 2020 and 2023. New ethylene capacity will benefit from the development of the South Pars gas field, the world’s largest which straddles the border with Qatar. In the forecast, we assume that the development of the petrochemical industry would increase Iran’s LPG and ethane demand by 80 kb/d by 2023.
Table 1.9 Iran’s ethylene production capacity additions
Company Location Capacity
(thousand tons/year)
Feedstock Max capacity
feedstock requirement
(kb/d)
Scheduled year
Ilam Petrochemical Company Ilam 450 Ethane 26 2020
Gachsaran Petrochemical Gachsaran 1 000 Ethane 58 2022
Bushehr Petrochemicals Assaluyeh 1 000 Ethane 58 unlikely 2023 Firouzabad Petrochemicals Firouzabad 1 000 Naphtha/Ethane 65 unlikely 2023
Total 3 450 207 Source: Press reports, Company reports.
Other countries
Table 1.10 Selected ethylene production capacity additions
Company Location Capacity
(thousand tons/year)
Feedstock Max capacity
feedstock requirement
(kb/d)
Scheduled year
HPCL-Mittal Energy Ltd.
Bhatinda, Punjab, India 1 200 Naphtha/Kerosene 88 2021
Lotte Chemical Titan Pasir Gudang, Johor, Malaysia 92 Naphtha 7 2018
Petronas Pengerang, Johor, Malaysia 1 200 Naphtha 88 2020
Oman Oil Refineries and Petroleum Industries Co.
Sohar, Liwa, Oman 900 Naphtha 66 2021
Lotte Chemical Corp. Yeosu, South Jeolla, Korea 200 Naphtha 15 2018
LG Chemical Daesan,
Chungcheong, Korea
230 Naphtha 17 2019
Hanwha Total Petrochemicals
Daesan, Chungcheong,
Korea 350 Propane 26 2019
PTT Global Chemical Map Ta Phut,
Rayong, Thailand
500 Naphtha/LPG 37 2022
Total 4 672 342 Source: Press reports, company reports.

DEMAND
28 OIL MARKET REPORT 2018
Several new ethylene projects are on track in other countries during the forecast period. India will add 1.2 mt/y by 2021, which would result in extra demand for naphtha/kerosene of 70 kb/d. In some Southern Asian countries, new projects coming online in the next few years could also increase naphtha demand by roughly 50 kb/d and LPG demand by 40 kb/d. Korea could add up to 30 kb/d of naphtha and 20 kb/d of propane demand through the end of the forecast.
Global ethylene cracker projects identified in this section will likely add 1.4 mb/d to our oil demand forecast by 2023. Ethane would be the main beneficiary (885 kb/d), followed by naphtha (495 kb/d) and LPG (40 kb/d). The IEA will be taking a broader look at the long-term outlook of the global chemical sector in a dedicated report, The Future of Chemicals, later this year.
OECD demand OECD oil demand posted exceptional growth in the past three years, supported by the sharp fall in oil prices that started in mid-2014. After an average annual decline of 430 kb/d between 2005 and 2014, demand jumped by 685 kb/d in 2015, 460 kb/d in 2016, and 375 kb/d in 2017 as oil prices started to recover. Gasoline demand was in long-term decline, falling by an average of 90 kb/d per year in 2005-14 but jumping by 145 kb/d in 2015-17. Gasoil demand has also been strong in recent years, supported by higher industrial activity and robust trade. In our forecast, we expect the long-term decline of OECD oil demand to resume and it will fall by an average of 0.2% per year to 2023.
Table 1.11 OECD oil demand by region (kb/d)
2017 2018 2019 2020 2021 2022 2023 2017 – 23 Growth rate
OECD Americas 24 860 24 988 25 139 25 091 24 998 24 924 24 855 0.0% OECD Europe 14 332 14 408 14 379 14 298 14 237 14 160 14 089 -0.3% OECD Asia Oceania 8 160 8 017 8 033 7 963 7 940 7 913 7 884 -0.6% Total products 47 353 47 413 47 551 47 352 47 175 46 997 46 828 -0.2%
At the start of the period demand will be supported by ethane deliveries, associated with the commissioning of new petrochemical projects in the US. From 2020 onwards, efficiency gains and slower economic growth will see demand falling. OECD oil demand is expected to peak in 2019 and start declining thereafter. Over the forecast period demand will shrink by 525 kb/d.
OECD Americas
Table 1.12 OECD Americas oil demand by product (kb/d)
2017 2018 2019 2020 2021 2022 2023 2017 – 23 Growth rate
LPG & ethane 3 233 3 396 3 565 3 656 3 700 3 805 3 906 3.2% Naphtha 341 309 311 313 315 316 317 -1.2% Motor gasoline 11 077 11 077 11 028 10 928 10 807 10 654 10 506 -0.9% Jet fuel & kerosene 1 979 1 982 1 989 1 986 1 980 1 973 1 965 -0.1% Gasoil/diesel 5 146 5 176 5 172 5 215 5 153 5 081 5 038 -0.4% Residual fuel oil 656 662 671 579 620 664 684 0.7% Other products 2 429 2 386 2 402 2 414 2 424 2 432 2 439 0.1% Total products 24 860 24 988 25 139 25 091 24 998 24 924 24 855 0.0%

DEMAND
OIL MARKET REPORT 2018 29
Oil demand in OECD Americas will be supported by ethane demand growth in the US through 2019 and start to decline thereafter (see Booming demand for petrochemicals). On average, total demand is expected to remain almost unchanged over the forecast period.
Table 1.13 OECD Americas oil demand by country (kb/d)
2017 2018 2019 2020 2021 2022 2023 2017 – 23 Growth rate
OECD Americas 24 860 24 988 25 139 25 091 24 998 24 924 24 855 0.0% Canada 2 422 2 389 2 399 2 401 2 401 2 397 2 392 -0.2% Chile 348 348 352 354 357 361 364 0.7% Mexico 1 925 1 922 1 938 1 949 1 958 1 964 1 971 0.4% US 20 166 20 328 20 450 20 387 20 283 20 202 20 127 0.0% Annual change 118 128 152 -48 -93 -75 -69
Gasoline demand will remain unchanged in 2018, but will start to decline from 2019 as efficiency gains take their toll. The US has very strict fuel efficiency standards and was the first country to adopt a 2025 fuel economy target. The current rules were decided in 2012, and they define fuel efficiency standards from 2017 to 2025. Different rules apply to passenger cars and light trucks, mainly sport utility vehicles (SUV) and pickups. Personal cars are due to achieve a consumption of 4.2 litres (l) per 100 kilometres (km) or 56.7 miles per gallon (mpg), by 2025 (from 6.5 l/100 km in 2016) and light trucks 6 l/100km, or 39 mpg, (from 8.6 l/100 km in 2016). Canada has adopted similar standards. The US Corporate Average Fuel Economy (CAFE) standards correspond to an annual improvement of 3.8% in passenger cars fuel economy between 2013 and 2025. For Canada, it should be 3.3% per year between 2010 and 2025. The global efficiency of the fleet may improve less than originally expected, however, as manufacturers recently favored crossover vehicles, categorised as light trucks, which have lower fuel efficiency constraints than personal cars. In addition, CAFE targets are fixed until 2021 but beyond 2022 they are tentative and are due to be reviewed by the end of 2018. The US administration could announce new standards.
Figure 1.5 US oil demand by product, y-o-y change
-300.0-250.0-200.0-150.0-100.0
-50.00.0
50.0100.0150.0200.0250.0
2017 2018 2019 2020 2021 2022 2023
kb/d
LPG & ethane
Naphtha
Motor gasoline
Jet fuel & kerosene
Gasoil/diesel
Residual fuel oil
Other products
Total products
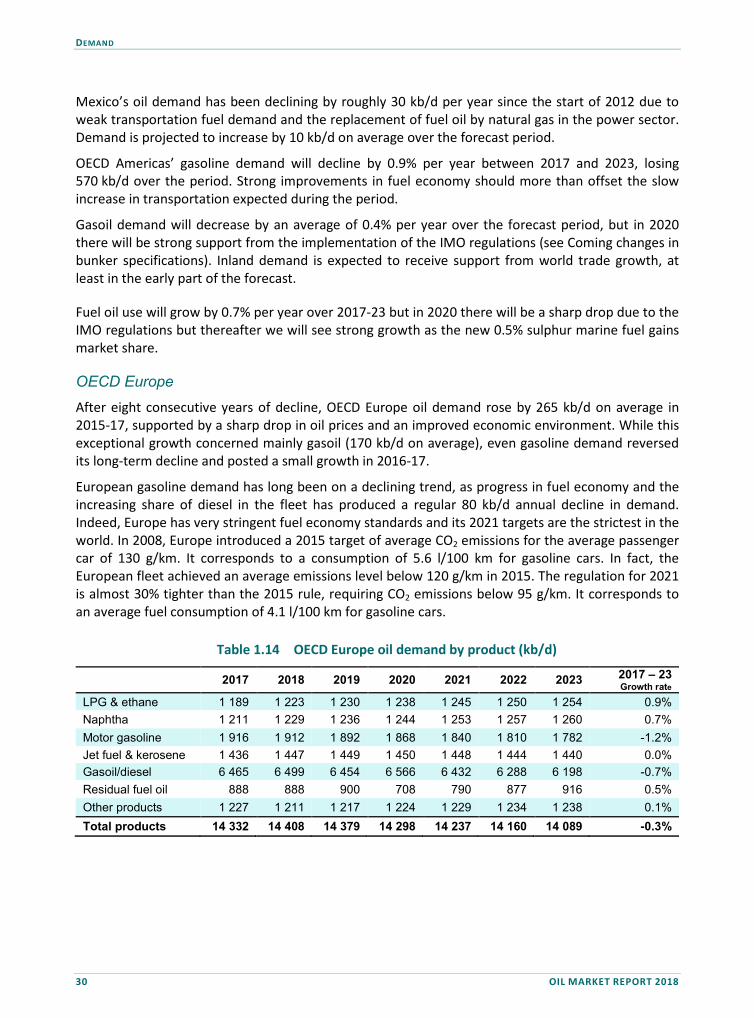
DEMAND
30 OIL MARKET REPORT 2018
Mexico’s oil demand has been declining by roughly 30 kb/d per year since the start of 2012 due to weak transportation fuel demand and the replacement of fuel oil by natural gas in the power sector. Demand is projected to increase by 10 kb/d on average over the forecast period.
OECD Americas’ gasoline demand will decline by 0.9% per year between 2017 and 2023, losing 570 kb/d over the period. Strong improvements in fuel economy should more than offset the slow increase in transportation expected during the period.
Gasoil demand will decrease by an average of 0.4% per year over the forecast period, but in 2020 there will be strong support from the implementation of the IMO regulations (see Coming changes in bunker specifications). Inland demand is expected to receive support from world trade growth, at least in the early part of the forecast.
Fuel oil use will grow by 0.7% per year over 2017-23 but in 2020 there will be a sharp drop due to the IMO regulations but thereafter we will see strong growth as the new 0.5% sulphur marine fuel gains market share.
OECD Europe After eight consecutive years of decline, OECD Europe oil demand rose by 265 kb/d on average in 2015-17, supported by a sharp drop in oil prices and an improved economic environment. While this exceptional growth concerned mainly gasoil (170 kb/d on average), even gasoline demand reversed its long-term decline and posted a small growth in 2016-17.
European gasoline demand has long been on a declining trend, as progress in fuel economy and the increasing share of diesel in the fleet has produced a regular 80 kb/d annual decline in demand. Indeed, Europe has very stringent fuel economy standards and its 2021 targets are the strictest in the world. In 2008, Europe introduced a 2015 target of average CO2 emissions for the average passenger car of 130 g/km. It corresponds to a consumption of 5.6 l/100 km for gasoline cars. In fact, the European fleet achieved an average emissions level below 120 g/km in 2015. The regulation for 2021 is almost 30% tighter than the 2015 rule, requiring CO2 emissions below 95 g/km. It corresponds to an average fuel consumption of 4.1 l/100 km for gasoline cars.
Table 1.14 OECD Europe oil demand by product (kb/d)
2017 2018 2019 2020 2021 2022 2023 2017 – 23 Growth rate
LPG & ethane 1 189 1 223 1 230 1 238 1 245 1 250 1 254 0.9% Naphtha 1 211 1 229 1 236 1 244 1 253 1 257 1 260 0.7% Motor gasoline 1 916 1 912 1 892 1 868 1 840 1 810 1 782 -1.2% Jet fuel & kerosene 1 436 1 447 1 449 1 450 1 448 1 444 1 440 0.0% Gasoil/diesel 6 465 6 499 6 454 6 566 6 432 6 288 6 198 -0.7% Residual fuel oil 888 888 900 708 790 877 916 0.5% Other products 1 227 1 211 1 217 1 224 1 229 1 234 1 238 0.1% Total products 14 332 14 408 14 379 14 298 14 237 14 160 14 089 -0.3%

DEMAND
OIL MARKET REPORT 2018 31
Further support for gasoline deliveries came from the falling share of diesel vehicles in car sales, fueled by concerns about air pollution and their possible ban from big cities. Altogether, diesel car registrations in the largest European markets (France, Germany, Italy, Spain and the United Kingdom [UK]) declined by 8 percentage points since September 2015 when the so-called Volkswagen “dieselgate” scandal became public.
The market share of diesel cars plunged in 2017 in Germany from 45.8% in 2016 to 39% in 2017 and in Spain from 57% to 49%. France has seen a steady decline in diesel car registrations from 73% in 2012 to 47% in 2017. In addition, diesel is becoming less economic as some countries have started to narrow the tax gap between diesel and gasoline prices.
In the forecast, we expect that the changes taking place now in favour of gasoline will continue and we project the average yearly fall in gasoline demand at 20 kb/d, while diesel demand should shrink by 45 kb/d per year.
OECD Europe’s demand growth is forecast to slow to 75 kb/d in 2018, due to higher prices, and, on average over our forecast period, it will decline by 40 kb/d per year. From 2017 to 2023, gasoline demand should shrink by 135 kb/d in total due to improved fuel efficiency. Gasoil demand declines by 265 kb/d on better fuel economy and as the share of diesel cars declines.
Figure 1.6 OECD Europe oil demand, y-o-y change
Table 1.15 OECD Europe oil demand in selected countries (kb/d)
2017 2018 2019 2020 2021 2022 2023 2017 – 23 Growth rate
OECD Europe 14 332 14 408 14 379 14 298 14 237 14 160 14 089 -0.3% Germany 2 488 2 514 2 505 2 487 2 470 2 453 2 438 -0.3% France 1 701 1 704 1 696 1 684 1 675 1 666 1 658 -0.4% Italy 1 277 1 283 1 275 1 264 1 255 1 245 1 236 -0.5% Spain 1 299 1 300 1 300 1 293 1 287 1 279 1 272 -0.4% United Kingdom 1 574 1 565 1 555 1 544 1 534 1 524 1 515 -0.6% Annual change 293 76 -30 -81 -61 -77 -71
-300.0
-200.0
-100.0
0.0
100.0
200.0
300.0
400.0
2017 2018 2019 2020 2021 2022 2023
kb/d
LPG & ethane
Naphtha
Motor gasoline
Jet fuel & kerosene
Gasoil/diesel
Residual fuel oil
Other products
Total products

DEMAND
32 OIL MARKET REPORT 2018
OECD Asia Oceania
The fall in oil prices in 2015 supported OECD Asia demand, which grew in 2015-17. Japan’s demand continued to fall, however, as fuel oil and crude oil use in the power sector fell after the temporary uplift following the 2011 Fukushima nuclear accident. In the region as a whole, demand is projected to decline by 0.6% per year over the forecast period as fuel economy improvements will more than offset rising transportation demand.
Table 1.16 OECD Asia Oceania oil demand by product (kb/d)
2017 2018 2019 2020 2021 2022 2023 2017 – 23 Growth rate
LPG & ethane 798 797 802 806 809 812 814 0.3% Naphtha 2 087 2 064 2 089 2 111 2 119 2 128 2 137 0.4% Motor gasoline 1 546 1 527 1 502 1 476 1 448 1 421 1 396 -1.7%Jet fuel & kerosene 920 924 923 920 917 913 909 -0.2%Gasoil/diesel 1 914 1 853 1 857 1 935 1 898 1 851 1 828 -0.8%Residual fuel oil 559 550 557 412 443 482 495 -2.0%Other products 336 302 303 304 305 305 306 -1.6%Total products 8 160 8 017 8 033 7 963 7 940 7 913 7 884 -0.6%
Japan has a very efficient passenger car fleet partly due to the high penetration of hybrid vehicles. There is a CO2 emissions target for 2020 of 122 g/km for passenger cars, which was actually achieved in 2013. It corresponds to a fuel consumption of 5.3 l/100 km of gasoline equivalent. Japan is also a leader in light commercial vehicles, with a target of 133 g/km of CO2 emissions by 2022. This equates to a gasoline consumption of 5.7 l/100 km for light commercial vehicles. Japan’s oil demand is expected to drop by 45 kb/d per year in 2018-23.
Korea’s fuel efficiency targets are also very strong, calling for an improvement of 5.5% per year from 2013 to 2020. In 2020, the standard for CO2 emissions from personal cars is 97 g/km, corresponding to a fuel economy of 4.2 l/100 km of gasoline. Korea’s oil demand jumped by 100 kb/d per year on lower prices in 2015-17, but it will slow considerably over the forecast period, to only 5 kb/d on average in 2018-23.
Overall, we expect a drop of 45 kb/d per year in OECD Asia oil demand in 2018-23, mainly due to gasoline (25 kb/d) and gasoil (15 kb/d).
Table 1.17 OECD Asia Oceania oil demand by country (kb/d)
2017 2018 2019 2020 2021 2022 2023 2017 – 23 Growth rate
OECD Asia & Oceania 8 160 8 017 8 033 7 963 7 940 7 913 7 884 -0.6%Australia 1 171 1 170 1 172 1 167 1 162 1 150 1 138 -0.5%Japan 3 946 3 801 3 785 3 741 3 716 3 695 3 670 -1.2%Israel* 213 217 217 218 219 219 220 0.5%Korea 2 654 2 648 2 678 2 657 2 666 2 673 2 682 0.2%New Zealand 176 180 180 179 178 176 174 -0.2%Annual change 37 -144 16 -70 -24 -27 -29
* The statistical data for Israel are supplied by and under the responsibility of the relevant Israeli authorities. The use of such data by theOECD is without prejudice to the status of the Golan Heights, East Jerusalem and Israeli settlements in the West Bank under the terms ofinternational law.

DEMAND
OIL MARKET REPORT 2018 33
Non-OECD demand As in OECD countries, non-OECD countries will see their demand growth impacted by efficiency and environmental policies over the forecast period. These will apply particularly to transport fuels with urban air quality a major concern. In addition, several countries, notably in the Middle East, are increasing their use of natural gas in the power and heating/cooling sectors, thus reducing fuel oil and crude oil demand.
Table 1.18 Non-OECD countries oil demand (kb/d)
2017 2018 2019 2020 2021 2022 2023 2017 – 23 Growth rate
LPG & ethane 6 431 6 689 6 882 7 114 7 305 7 497 7 645 2.9% Naphtha 2 747 2 799 2 916 3 036 3 233 3 366 3 442 3.8% Motor gasoline 11 339 11 646 11 977 12 309 12 644 12 984 13 335 2.7% Jet fuel & kerosene 3 124 3 231 3 326 3 422 3 508 3 595 3 683 2.8% Gasoil/diesel 14 663 15 001 15 249 16 010 15 927 16 030 16 242 1.7% Residual fuel oil 5 099 5 233 5 254 4 881 5 333 5 634 5 794 2.2% Other products 7 043 7 180 7 275 7 375 7 495 7 613 7 729 1.6% Total products 50 446 51 777 52 880 54 146 55 446 56 719 57 871 2.3%
Price movements after the 2020 IMO specification change could, at least temporarily, reverse the switch out of fuel oil but not in countries that have undertaken a massive shift to natural gas. Non-OECD countries will add 7.4 mb/d to world oil demand by 2023, more than offsetting the 0.5 mb/d decline in the OECD. Asia and the Middle East will contribute the most, with demand growing by, respectively, 4.2 mb/d and 1.1 mb/d.
Africa
Oil demand growth in Africa is projected at 2.4% per year to 2023 on the back of a relatively robust economic outlook. Economic growth in sub-Saharan Africa is on a strong footing in the early part of our forecast, reaching 3.4% in 2018-19.
Table 1.19 African oil demand by product (kb/d)
2017 2018 2019 2020 2021 2022 2023 2017 – 23 Growth rate
LPG & ethane 397 403 411 422 433 445 456 2.3% Naphtha 23 23 23 24 24 24 25 1.5% Motor gasoline 1 222 1 240 1 267 1 291 1 322 1 355 1 390 2.2% Jet fuel & kerosene 275 283 290 296 305 314 324 2.8% Gasoil/diesel 1 694 1 734 1 786 1 842 1 894 1 953 2 018 3.0% Residual fuel oil 416 403 409 382 411 425 447 1.2% Other products 294 298 306 311 317 324 332 2.1% Total products 4 320 4 384 4 493 4 568 4 707 4 842 4 992 2.4%
Apart from changes in the economic environment and prices, oil demand may be impacted by other energy sources. In Egypt, oil demand is facing competition from natural gas. The development of the supergiant Zohr gas field by Eni, where production started in December 2017, should enable self sufficiency and might even allow a return to exporting gas in the medium term. Three combined cycle gas power plants started operations in 2017
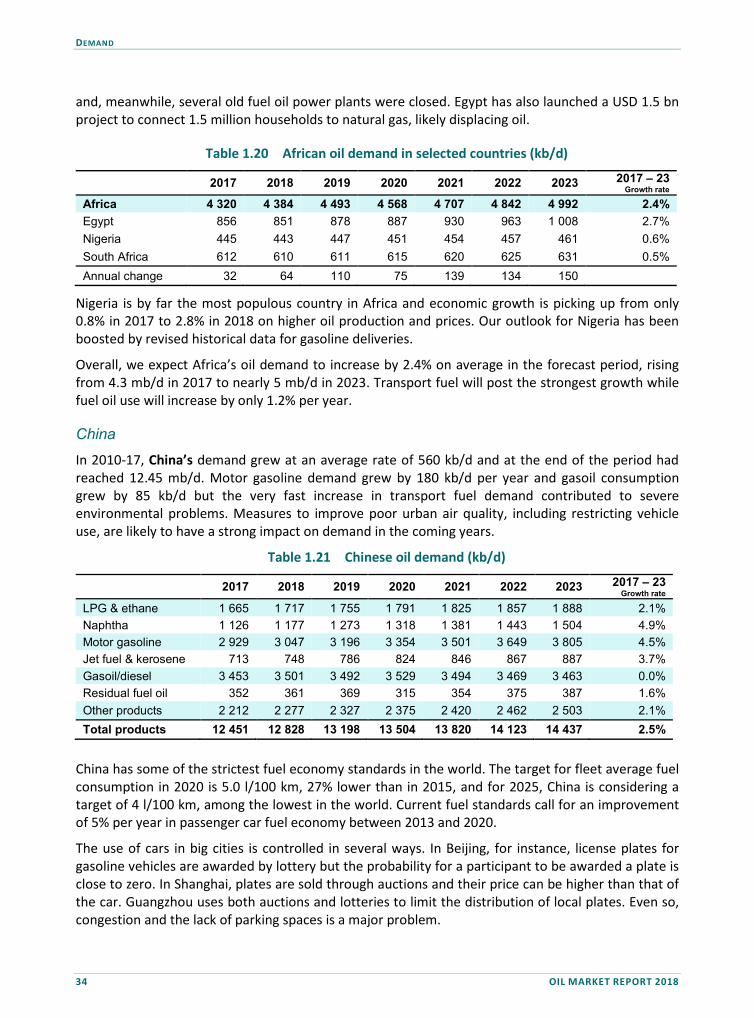
DEMAND
34 OIL MARKET REPORT 2018
and, meanwhile, several old fuel oil power plants were closed. Egypt has also launched a USD 1.5 bn project to connect 1.5 million households to natural gas, likely displacing oil.
Table 1.20 African oil demand in selected countries (kb/d)
2017 2018 2019 2020 2021 2022 2023 2017 – 23 Growth rate
Africa 4 320 4 384 4 493 4 568 4 707 4 842 4 992 2.4% Egypt 856 851 878 887 930 963 1 008 2.7% Nigeria 445 443 447 451 454 457 461 0.6% South Africa 612 610 611 615 620 625 631 0.5% Annual change 32 64 110 75 139 134 150
Nigeria is by far the most populous country in Africa and economic growth is picking up from only 0.8% in 2017 to 2.8% in 2018 on higher oil production and prices. Our outlook for Nigeria has been boosted by revised historical data for gasoline deliveries.
Overall, we expect Africa’s oil demand to increase by 2.4% on average in the forecast period, rising from 4.3 mb/d in 2017 to nearly 5 mb/d in 2023. Transport fuel will post the strongest growth while fuel oil use will increase by only 1.2% per year.
China
In 2010-17, China’s demand grew at an average rate of 560 kb/d and at the end of the period had reached 12.45 mb/d. Motor gasoline demand grew by 180 kb/d per year and gasoil consumption grew by 85 kb/d but the very fast increase in transport fuel demand contributed to severe environmental problems. Measures to improve poor urban air quality, including restricting vehicle use, are likely to have a strong impact on demand in the coming years.
Table 1.21 Chinese oil demand (kb/d)
2017 2018 2019 2020 2021 2022 2023 2017 – 23 Growth rate
LPG & ethane 1 665 1 717 1 755 1 791 1 825 1 857 1 888 2.1% Naphtha 1 126 1 177 1 273 1 318 1 381 1 443 1 504 4.9% Motor gasoline 2 929 3 047 3 196 3 354 3 501 3 649 3 805 4.5% Jet fuel & kerosene 713 748 786 824 846 867 887 3.7% Gasoil/diesel 3 453 3 501 3 492 3 529 3 494 3 469 3 463 0.0% Residual fuel oil 352 361 369 315 354 375 387 1.6% Other products 2 212 2 277 2 327 2 375 2 420 2 462 2 503 2.1% Total products 12 451 12 828 13 198 13 504 13 820 14 123 14 437 2.5%
China has some of the strictest fuel economy standards in the world. The target for fleet average fuel consumption in 2020 is 5.0 l/100 km, 27% lower than in 2015, and for 2025, China is considering a target of 4 l/100 km, among the lowest in the world. Current fuel standards call for an improvement of 5% per year in passenger car fuel economy between 2013 and 2020.
The use of cars in big cities is controlled in several ways. In Beijing, for instance, license plates for gasoline vehicles are awarded by lottery but the probability for a participant to be awarded a plate is close to zero. In Shanghai, plates are sold through auctions and their price can be higher than that of the car. Guangzhou uses both auctions and lotteries to limit the distribution of local plates. Even so, congestion and the lack of parking spaces is a major problem.

DEMAND
OIL MARKET REPORT 2018 35
Figure 1.7 Chinese oil demand, y-o-y change
Support will come from the petrochemical sector, however, as China’s consumers become wealthier and buy more goods. Our analysis of identified projects suggests that petrochemical feedstock demand will increase by 470 kb/d by 2023.
Although oil demand growth will remain robust, we expect to see the strengthening of measures to temper the pace, particularly in the transport sector. This, plus the ongoing switch from heavy industry to a more consumer-led society, will reduce oil demand growth to 330 kb/d per year in 2018-23. Within the total, gasoline growth will slow to 145 kb/d per year and gasoil growth will stagnate, impacted by the penetration of liquefied natural gas-fuelled trucks, electric buses and compressed natural gas-fuelled taxis.
China’s move to alternative fuels
China is making a major effort to reduce air pollution, 30% of which is estimated to come from internal combustion engines. Sales of electric cars are booming and there is strong growth in the deployment of natural gas vehicles. Alternative-fueled vehicles are not only replacing passenger cars; they are also making inroads into the fleets of trucks and buses, with a very significant impact on transport fuel demand.
China is the largest global market for electric vehicles with 777 000 sold in 2017, 50% more than in 2016, according to the China Association of Automobile Manufacturers. Electric vehicles made up 2.7% of total sales. Sales of passenger battery electric vehicles (BEV) cars rose by 82% to 468 000 and sales of plug-in hybrid vehicles (PHEV) rose by 39% to 111 000. Commercial BEV sales increased by 16% to 198 000 while commercial PHEV declined by 27% to 14 000. Electric vehicle sales are particularly strong in cities with tough license plate regulations for conventional vehicles, e.g. Beijing, Shanghai, Shenzhen, Tianjin, Guangzhou and Hangzhou. In Beijing, electric vehicle licenses are allocated through queuing, and in 2016 the quota for electric vehicles was 40% of total new car licenses. Shanghai gives a free auto license to an electric vehicle, while a permit for a conventionally-fuelled private car costs more than CNY 90 000 (Chinese Yuan renminbi or USD 14 400).
At the end of 2017, China’s stock of passenger electric vehicles was close to 1.2 million, but, the share remains small at only 0.7% of a total of 175 million vehicles. The electric vehicle industry is a national priority under the government’s Made in China 2025 industrial policy aimed at promoting
-100.0
0.0
100.0
200.0
300.0
400.0
500.0
600.0
700.0
2017 2018 2019 2020 2021 2022 2023
kb/d
LPG & ethane
Naphtha
Motor gasoline
Jet fuel & kerosene
Gasoil/diesel
Residual fuel oil
Other products
Total products

DEMAND
36 OIL MARKET REPORT 2018
national champions in 10 high tech industries. In order to increase the share of electric vehicles in the total car fleet, the Ministry of Industry and Information Technology introduced a New Energy Vehicle mandate policy in September 2017, putting in place a complex system of credit targets. According to a report by the International Council on Clean Transportation (China new energy vehicle mandate policy – final rule, January 2018), the mandate should push up the share of electric vehicles in total sales to 4% in 2020. Therefore, the goal of deploying 5 million electric vehicles by the end of 2020 could be achieved. By 2020, an additional 3.8 million electric passenger cars should save 50 kb/d of gasoline. Consumers, however, are very sensitive to prices and the reduction in 2017 of subsidies by 20% had a strong impact on sales. The subsidy cut will be partially offset by enabling electric vehicle makers to sell carbon credit quotas. Over the forecast period we assume that electric cars would displace 15 kb/d of gasoline per year.
In a further boost to electric cars, at the end of 2017 China extended the tax exemption on vehicles to the end of 2020. Several foreign car manufacturers are involved in the market. Volkswagen said that it will invest EUR 10 bn (euros) in electric car production by 2025 and it plans to sell 400 000 units in 2020 and 1.6 million in 2025. Renault-Nissan and Ford also have plans to produce electric cars.
As well as cars, sales of electric buses are booming and the fleet reached an estimated 390 000 at the end of 2017 from only 38 400 in 2014. After this growth spurt, electric buses account for roughly 20% of sales. The city of Shenzhen has electrified 100% of its bus fleet and about 7 kb/d of diesel consumption has been replaced. In addition, 62% of the city’s taxi fleet is comprised of electric vehicles and it is hoped to reach 100% by 2020. Other Chinese cities are following the same path.
Table 1.22 Chinese electric bus sales
2011 2012 2013 2014 2015 2016 2017 Total
Fully electric 1 136 1 904 1 672 12 760 94 260 115 700 89 546 316 978
Plug-in hybrid 1 478 313 2 637 16 500 23 051 19 376 9 785 73 140
Total 2 614 2 217 4 309 29 260 117 311 135 076 99 331 390 118
Source: CleanTechnica, press reports.
The increasing number of electric buses could have a bigger impact on China’s oil demand than electric cars. Assuming that a diesel bus covers 56 000 km per year and uses 59 l/100 km, China’s 317 000 fully electric buses could therefore replace 180 kb/d of diesel. The very strong growth of China’s electric bus fleet only started in 2015 and we estimate that it displaced 55 kb/d of diesel in 2015, 65 kb/d in 2016 and 50 kb/d in 2017. In the early years of our forecast period, we assume that the growth in electric buses will continue at around 100 000 units per year, displacing roughly 60 kb/d of diesel demand. Growth may slow thereafter and we assume a displacement of roughly 40 kb/d of diesel demand after 2020.
China is also host to the largest number of compressed natural gas (CNG) cars in the world and this will have an important impact on oil demand. Compared with gasoline, the fuel cost for CNG is 20% to 40% lower, and the cost of retrofitting a gasoline-fuelled vehicle is around CNY 3 000-5 000 (USD 475-790). Roughly 80% of CNG passenger vehicles have been converted from gasoline.

DEMAND
OIL MARKET REPORT 2018 37
Table 1.23 Chinese Natural Gas vehicles
1996 2000 2004 2008 2012 2016 2017
China NGVs 2 000 6 000 69 300 400 000 1 577 000 5 000 000 5 350 000
% World 0.2% 0.5% 1.8% 4.2% 9.4% 21.5% 21.9%
Source: NGV global.
In provinces where gas is easily available and CNG refueling infrastructure developed, a large proportion of cars have switched to CNG. Using the same methodology as for electric vehicles, we assume that the 5 350 000 natural gas vehicles operational in 2017 are saving some 75 kb/d of oil.
While CNG is fine for passenger vehicles, for trucks, LNG is more applicable. The storage capacity and driving range is much higher than CNG, even though the initial cost is higher. China has an estimated fleet of 260 000 LNG trucks, possibly rising to 500 000-600 000 by 2020 according to some forecasters. Sales jumped by 75% in Jan-Aug 2017, following the imposition of a ban on the use of diesel trucks to transport coal in ports in Shandong, Hebei and Tianjin. The restriction placed on thousands of factories in northern China using diesel trucks during the winter also provided a boost to LNG vehicles.
Table 1.24 Chinese LNG trucks
2010 2011 2012 2013 2014 2015 2016 Jan-Sep 2017
2017 estimated
LNG truck output 4 000 22 925 16 091 38 576 50 105 12 721 19 601 66 994 90 000 LNG truck fleet (1000) 7 30 46 86 137 151 170 237 260
Source: Sichuan clean energy vehicle association.
A recent paper (Song H & al)1, shows that the largest number of LNG vehicles in 2015 were in the tractor trucks segment. Their fuel consumption is typically between 39.5 l/100 km and 47.7 l/100 km, travelling between 150 000 and 200 000 km per year. With a slightly more conservative assumption the 260 000 LNG trucks in the fleet at the end of 2017, assuming a mileage of 100 000 km per year and a consumption of 40 l/100 km, would displace roughly 180 kb/d of diesel. Moreover, the addition of 90 000 LNG trucks in 2017 alone is likely to have displaced 60 kb/d of gasoil by the end of the year. Drivers are very responsive to prices and recent sharp increases in natural gas prices in China could slow the penetration of natural gas vehicles. The deployment of CNG passenger cars could slow but LNG trucks should, however, continue to receive government support in a continued bid to improve air quality. In the forecast, it is assumed than LNG trucks will displace roughly 30 kb/d of diesel demand per year and CNG cars 5 kb/d of gasoline demand.
Additional gasoil displacement will also occur as electric high-speed trains replace diesel locomotives. The most recent available data shows that the number of diesel locomotives fell from 11 081 in 2011 to 9 132 in 2015. In the meantime, the number of electric locomotives rose from 9 625 to 12 219 and the network of high-speed lines increased from 6 600 km to 19 838 km. Investment plans for high-speed electric train lines call for USD 515 bn to be spent by 2020.
1 Song H & al., “Energy consumption and greenhouse gas emissions of diesel/LNG heavy duty vehicles fleet in China”, Energy 140, 2017.

DEMAND
38 OIL MARKET REPORT 2018
Moreover, bicycle-sharing schemes in Chinese cities are starting to have an impact on transportation demand. In Shenzhen, the Transport Commission has stated that the city’s 500 000 shared bicycles had replaced 10 % of private car journeys and 3% of taxi journeys.
Taken together, the major shifts underway in China’s transport sector are having a significant impact on oil demand. CNG and electric cars could displace at least 20 kb/d of gasoline demand every year; LNG trucks and electric buses could replace at least 80 kb/d of diesel; and the electrification of railways, bike-sharing schemes and impressive targets for car efficiency standards are expected to further slow the increase in demand significantly.
Other Asia
India is developing fast and in the period 2010-17 average demand growth has been close to 185 kb/d. Gasoline demand grew by 40 kb/d per year while gasoil demand increased by 60 kb/d. As in China, the rapid increase in car usage in India has led to severe air pollution problems, and strong policies are being put in place to try to tackle them.
Indian fuel economy standards require an improvement of 1.6% per year between 2012 and 2022. The passenger car CO2 emissions target for 2022 is set at 113 g/km, which is a gasoline equivalent level of 4.9 l/100 km.
Figure 1.8 Indian oil demand, y-o-y change
Table 1.25 Non-OECD Asia - excluding mainland China: Oil demand by product (kb/d)
2017 2018 2019 2020 2021 2022 2023 2017 – 23 Growth rate
LPG & ethane 1 581 1 717 1 806 1 844 1 883 1 921 1 961 3.7% Naphtha 1 151 1 146 1 163 1 239 1 330 1 351 1 366 2.9% Motor gasoline 2 413 2 501 2 593 2 678 2 765 2 855 2 949 3.4% Jet fuel & kerosene 1 036 1 069 1 102 1 140 1 179 1 218 1 260 3.3% Gasoil/diesel 3 894 4 058 4 200 4 623 4 567 4 617 4 718 3.2% Residual fuel oil 1 675 1 673 1 648 1 320 1 531 1 654 1 718 0.4% Other products 1 580 1 648 1 688 1 728 1 768 1 809 1 851 2.7% Total products 13 328 13 812 14 200 14 573 15 022 15 425 15 822 2.9%
-100.0
-50.0
0.0
50.0
100.0
150.0
200.0
250.0
300.0
350.0
2017 2018 2019 2020 2021 2022 2023
kb/d
LPG & ethane
Naphtha
Motor gasoline
Jet fuel & kerosene
Gasoil/diesel
Residual fuel oil
Other products
Total products

DEMAND
OIL MARKET REPORT 2018 39
In August 2017, India introduced regulations aimed at reducing the fuel consumption of heavy duty vehicles weighing more than 12 tonnes, representing roughly 60% of total fuel use from the haulage fleet. Between 2018 and 2021, rigid trucks must reduce their consumption by 5% to 13%, tractor and trailers by 7% to 10% and buses by 15%. The fleet wide fuel-consumption reduction by 2021 is estimated at 10.4%.
Some countries in the group are increasing their use of natural gas and reducing the role of fuel oil, which will post the lowest growth rate over the forecast (0.4% per year).
Table 1.26 Non-OECD Asia - excluding mainland China: Oil demand in selected countries (kb/d)
2017 2018 2019 2020 2021 2022 2023 2017 – 23 Growth rate
Non-OECD Asia 13 328 13 812 14 200 14 573 15 022 15 425 15 822 2.9% India 4 680 4 976 5 204 5 360 5 589 5 761 5 930 4.0% Indonesia 1 601 1 654 1 707 1 755 1 807 1 863 1 920 3.1% Malaysia 731 756 776 854 884 904 925 4.0% Singapore 1 329 1 358 1 373 1 378 1 388 1 401 1 415 1.1% Thailand 1 413 1 433 1 455 1 471 1 488 1 505 1 522 1.3% Annual change 394 483 388 373 449 403 397
Pakistan is planning to use more gas and coal at the expense of fuel oil. Already, more than 50% of its energy needs are fulfilled by gas. Falling production resulted in the underutilisation of its gas power plants and the import of large volumes of oil products. Then, in 2015, Pakistan built an LNG Floating Storage Regasification Unit (FSRU), initially receiving 1 million tons (mt), rising to 3.4 mt in 2016, and likely to have reached 6 mt in 2017. A second FSRU will start operations soon and a third should start up in 2019. By 2022, seven FSRU’s will allow the import of 30 mt/y of LNG. At the same time, Pakistan is developing 8 giga watts (GW) of coal fired power generation capacity, including 1.3 GW commissioned in 2017.
Indonesia saw a significant drop in gasoil demand in 2014-16, partly as the result of its displacement by natural gas and coal in the power sector. Power sector use dropped by 44 kb/d between 2013 and 2016 while coal and gas use increased. Overall, we expect oil demand in non-OECD Asia (excluding mainland China) to increase by 2.9% per year on average between 2017 and 2023 and the group will add 2.5 mb/d to global oil demand.
Non-OECD Europe
Table 1.27 Non-OECD Europe oil demand (kb/d)
2017 2018 2019 2020 2021 2022 2023 2017 – 23 Growth rate
LPG & ethane 58 59 59 61 62 64 65 1.9% Naphtha 6 7 7 7 7 7 8 3.4% Motor gasoline 96 97 99 100 102 104 106 1.6% Jet fuel & kerosene 24 24 24 25 26 26 27 2.1% Gasoil/diesel 330 341 346 351 358 365 372 2.0% Residual fuel oil 141 146 150 146 149 152 154 1.5% Other products 81 81 83 84 86 88 90 1.8% Total products 736 755 768 773 789 805 821 1.8%

DEMAND
40 OIL MARKET REPORT 2018
Oil demand in non-OECD Europe, the smallest of our regions, is forecast to grow at a much faster pace than in OECD Europe because some countries have yet to introduce fuel economy standards and car sales are increasing fast. In addition, economic growth in the group is higher than in their OECD counterparts. The region’s oil demand is expected to grow by 1.8% per year between 2017 and 2023, adding 85 kb/d to our global demand forecast.
Table 1.28 Non-OECD Europe oil demand in selected countries (kb/d)
2017 2018 2019 2020 2021 2022 2023 2017 – 23 Growth rate
Non-OECD Europe 736 755 768 773 789 805 821 1.8% Bulgaria 97 98 98 101 103 105 108 1.8% Croatia 73 74 75 77 78 80 81 1.7% Romania 208 217 220 221 222 224 226 1.4% Serbia 77 79 80 83 86 89 92 2.9% Annual change 21 19 13 6 16 16 16
Former Soviet Union (FSU)
Russia dominates the FSU accounting for 75% of total oil demand in 2017. Other significant oil consumers include Azerbaijan (95 kb/d), Belarus (135 kb/d), Kazakhstan (310 kb/d), Turkmenistan (165 kb/d), and Ukraine (230 kb/d). Most of these countries will experience economic growth of 4% to 5% per year in the forecast period.
Table 1.29 FSU oil demand by product (kb/d)
2017 2018 2019 2020 2021 2022 2023 2017 – 23 Growth rate
LPG & ethane 612 614 645 739 746 757 764 3.8% Naphtha 146 146 147 141 142 185 181 3.6% Motor gasoline 1 147 1 156 1 161 1 173 1 187 1 199 1 211 0.9% Jet fuel & kerosene 280 284 285 287 289 292 294 0.9% Gasoil/diesel 1 309 1 318 1 324 1 361 1 361 1 372 1 387 1.0% Residual fuel oil 289 321 322 350 391 434 443 7.4% Other products 1 015 1 017 1 025 1 036 1 046 1 056 1 066 0.8% Total products 4 798 4 856 4 910 5 087 5 162 5 294 5 346 1.8%
In Russia, demand will grow by 55 kb/d per year to 2023, supported by a relatively strong economic forecast with growth expected to be close to 1.5% in the next few years. Higher oil prices and macroeconomic stabilization are important factors.
Table 1.30 FSU oil demand in selected countries (kb/d)
2017 2018 2019 2020 2021 2022 2023 2017 – 23 Growth rate
FSU 4 798 4 856 4 910 5 087 5 162 5 294 5 346 1.8% Kazakhstan 312 314 317 326 338 351 365 2.6% Russia 3 618 3 665 3 706 3 843 3 873 3 958 3 959 1.5% Turkmenistan 166 169 172 180 188 198 207 3.8% Ukraine 229 230 232 240 249 258 267 2.6% Uzbekistan 63 63 64 67 71 75 79 3.8% Annual change 87 58 54 176 75 133 51

DEMAND
OIL MARKET REPORT 2018 41
Figure 1.9 Russian oil demand, y-o-y change
Russian demand will be supported by petrochemical projects after 2020, with LPG/ethane growing at an average rate of 3.7% in 2017-2023, plus some additional fuel oil demand in the power sector. We assume that, after the collapse of high sulphur fuel oil prices in 2020, some 50 kb/d to 100 kb/d of fuel oil will find its way to the power sector.
Overall, we expect total FSU oil demand to increase by 1.8% per year on average to 2023, adding 545 kb/d to global demand over the forecast period.
Latin America
Latin America’s oil demand is expected to grow by 1.3% per year between 2017 and 2023, with Argentina and Brazil the largest consumers.
Table 1.31 Latin America oil demand by product (kb/d)
2017 2018 2019 2020 2021 2022 2023 2017 – 23 Growth rate
LPG & ethane 660 664 672 680 688 696 704 1.1% Naphtha 184 185 187 189 190 192 193 0.8% Motor gasoline 1 872 1 907 1 929 1 947 1 966 1 985 2 001 1.1% Jet fuel & kerosene 299 303 308 312 317 322 327 1.5% Gasoil/diesel 2 099 2 136 2 168 2 213 2 225 2 248 2 274 1.3% Residual fuel oil 667 676 686 695 733 753 768 2.4% Other products 779 782 790 795 801 808 814 0.7% Total products 6 559 6 653 6 739 6 830 6 921 7 002 7 082 1.3%
Note: Excludes Chile.
Overall, Latin America will add 520 kb/d to our demand forecast by 2023, with jet fuel and fuel oil showing the fastest growth. Latin America is expected to use additional fuel oil in its power sector after 2020.
-100.0
-50.0
0.0
50.0
100.0
150.0
200.0
2017 2018 2019 2020 2021 2022 2023
kb/d
LPG & ethane
Naphtha
Motor gasoline
Jet fuel & kerosene
Gasoil/diesel
Residual fuel oil
Other products
Total products

DEMAND
42 OIL MARKET REPORT 2018
Table 1.32 Latin America oil demand in selected countries (kb/d)
2017 2018 2019 2020 2021 2022 2023 2017 – 23 Growth rate
Latin America 6 559 6 653 6 739 6 830 6 921 7 002 7 082 1.3% Argentina 760 763 773 784 797 810 824 1.4% Brazil 3 088 3 146 3 175 3 221 3 248 3 265 3 277 1.0% Colombia 367 368 376 383 391 399 408 1.8% Ecuador 269 278 287 291 295 299 304 2.1% Panama 151 156 161 169 177 186 195 4.4% Peru 256 259 265 270 276 281 287 1.9% Venezuela 519 508 501 496 491 487 483 -1.2% Annual change 11 94 86 91 90 81 80
After two years of steady decline, Brazil’s oil demand returned to growth in 2017 as the economy emerged from a deep recession. GDP declined by 3.5% in 2016 but rebounded to grow by 1.1% in 2017, and it is expected to hover around 2% in the next few years. Oil demand fell by 65 kb/d in 2015 and 100 kb/d in 2016 but economic recovery should see demand grow by 30 kb/d per year to 2023. Argentina’s oil demand is expected to increase by 10 kb/d per year in 2018-23. Venezuelan oil demand is very difficult to forecast given the current political and financial instability. As a working assumption, we have it declining slowly from 2019 to 2023, by 5 kb/d per year, after drops of 20 kb/d in 2017 and 10 kb/d in 2018.
Figure 1.10 Brazilian oil demand, y-o-y change
Middle East
The Middle East’s oil demand is expected to grow at an average annual rate of 2.1% over the forecast period, adding 1.1 mb/d to our global forecast by 2023 with fuel oil and LPG and ethane and naphtha being the fastest growing components.
-10.0
0.0
10.0
20.0
30.0
40.0
50.0
60.0
70.0
2017 2018 2019 2020 2021 2022 2023
kb/d
LPG & ethane
Naphtha
Motor gasoline
Jet fuel & kerosene
Gasoil/diesel
Residual fuel oil
Other products
Total products

DEMAND
OIL MARKET REPORT 2018 43
Table 1.33 Middle East oil demand by product (kb/d)
2017 2018 2019 2020 2021 2022 2023 2017 – 23 Growth rate
LPG & ethane 1 457 1 515 1 534 1 577 1 668 1 758 1 808 3.7% Naphtha 111 115 116 118 159 164 166 6.9% Motor gasoline 1 660 1 697 1 731 1 767 1 800 1 837 1 873 2.0% Jet fuel & kerosene 499 520 530 538 547 555 564 2.1% Gasoil/diesel 1 884 1 912 1 934 2 091 2 028 2 008 2 011 1.1% Residual fuel oil 1 559 1 654 1 669 1 674 1 765 1 841 1 876 3.1% Other products 1 084 1 076 1 057 1 047 1 057 1 065 1 074 -0.2% Total products 8 253 8 489 8 572 8 812 9 024 9 228 9 372 2.1%
Note: Excludes Israel.
The rate of growth could slow, however, as several countries are taking measures to restrain consumption, for example by reducing subsidies, raising taxes or by switching from oil to natural gas in power generation. Saudi Arabia and Iran are the largest oil consumers in the Middle East.
Table 1.34 Middle East oil demand in selected countries (kb/d)
2017 2018 2019 2020 2021 2022 2023 2017 – 23 Growth rate
Middle East 8 253 8 489 8 572 8 812 9 024 9 228 9 372 2.1% Iran 1 831 1 886 1 920 1 950 1 998 2 077 2 146 2.7% Iraq 856 860 836 851 858 865 872 0.3% Saudi Arabia 3 209 3 318 3 353 3 478 3 502 3 559 3 585 1.9% Annual change -22 236 83 239 213 204 143
Saudi Arabia’s oil demand showed significant changes in 2016-17, with strong increases in fuel oil demand while gasoil demand posted sharp declines of 80 kb/d and 105 kb/d, respectively. Direct crude oil use also appears to have declined. The weak economy (GDP contracted by 0.7% in 2017), and in particular the slowdown in the construction sector, was largely responsible for the weak gasoil demand. Fuel switching in the power sector could also have played a role. First production from the Wasit gas plant and the Yanbu 3 power station may explain part of the decline in gasoil demand and direct crude use.
With the oil price recovery that got underway in the second half of 2017, the IMF expects a rebound in economic growth in Saudi Arabia to 1.6% in 2018 and 2.2% in 2019. However, oil demand will not necessarily follow in step. In January 2018, the government increased the price of gasoline by 127%, to bring them towards international market levels. The price of 91 octane gasoline rose to USD 0.37/litre (+83%) while the price of 95 octane gasoline rose to USD 0.55/litre (+127%). Diesel and kerosene prices were unchanged. The increased prices also include a new 5% VAT rate.
Saudi Arabia has also announced a vehicle fuel economy target of 17 km/l (5.9 l/100 km) for 2020. We nevertheless expect an increase of 60 kb/d per year in Saudi oil demand from 2018 to 2023, partly supported by the use of discounted heavy sulphur fuel oil (after IMO specification changes) in the power sector after 2020.

DEMAND
44 OIL MARKET REPORT 2018
Figure 1.11 Saudi Arabian oil demand, y-o-y change
Since 2014, Iran has seen a very large decline in gasoil and fuel oil demand. The switch to natural gas in the power sector was responsible for a drop of 60 kb/d in diesel demand in 2014 and an additional 50 kb/d decrease in 2015.
The switch also triggered a drop of 85 kb/d in fuel oil demand in 2014 and 60 kb/d in 2015. The drop in diesel demand can also be explained by increasing natural gas usage in the residential, commercial, and transport sectors. Fuel oil still accounts for 8% of power plant energy use (down dramatically from 45% in 2013) but there are plans to phase it out by the end of the current fiscal year (March 2018). The National Iranian Gas Company wants to increase sales of gas to power plants from 62 bcm in fiscal 2017 to 68 bcm in fiscal 2018. Iran is nevertheless expected to show strong oil demand growth in our forecast, supported by robust gasoline demand and petrochemical projects coming on stream after 2020.
Figure 1.12 Iranian oil demand, y-o-y change
Iraq is another Middle Eastern country that will use more natural gas. Iraq’s direct crude use has been dropping since June 2017, from 210 kb/d in June to 110-130 kb/d in early 2018. Iraq is developing its domestic gas resources and has also commenced imports from Iran to be used in the power sector.
-150.0
-100.0
-50.0
0.0
50.0
100.0
150.0
2017 2018 2019 2020 2021 2022 2023
kb/d
LPG & ethane
Naphtha
Motor gasoline
Jet fuel & kerosene
Gasoil/diesel
Residual fuel oil
Other products
Total products
-80.0
-60.0
-40.0
-20.0
0.0
20.0
40.0
60.0
80.0
100.0
2017 2018 2019 2020 2021 2022 2023
kb/d
LPG & ethane
Naphtha
Motor gasoline
Jet fuel & kerosene
Gasoil/diesel
Residual fuel oil
Other products
Total products

SUPPLY
OIL MARKET REPORT 2018 45
2. SUPPLY
Highlights • Global oil production capacity is forecast to rise by 6.4 million barrel per day (mb/d) to
2023, with growth heavily front-loaded. Early on, a boom in United States (US) output far offsets a collapse in Venezuela, where capacity sinks to levels last seen in the 1940s. Towards the end of the period, US growth slows and gains are limited elsewhere.
• The United States (US), along with Brazil and Canada, dominates global growth. Total non-OPEC oil supply rises by 5.2 mb/d to reach 63.3 mb/d by 2023. Conventional crude production actually falls slightly over the period, with tight oil, oil sands, natural gas liquids (NGLs) and other non-conventional supply providing all the net non-OPEC growth.
• Steep declines in Venezuela outweigh gains in Iraq, which drives capacity expansion in OPEC. Crude oil capacity grows by 750 thousand barrels per day (kb/d) to 36.3 mb/d by 2023. The call on OPEC crude rises to 34.1 mb/d in 2023 from 32.8 mb/d in 2017.
• We assume OPEC/non-OPEC market management remains in place, at least in the early part of the forecast, with officials signalling a willingness to institutionalise their partnership. Cuts that began in January 2017 contributed to a major fall in oil stocks and led to a price rally that saw those party to the deal earn more while pumping less.
• Only a modest increase in upstream investment is expected in 2018. While producers are spending more on short-cycle supply, and US light tight oil (LTO) in particular, little investment is going into exploration and development of conventional resources. Discoveries of new oil resources fell to a record low in 2017, with less than 4 billion barrels of crude, condensate and NGLs confirmed.
• The recovery in oil prices has moved more projects onto the drawing board and may lead to an uptick in future investment. In 2017, 27 significant projects were given the go-ahead, nearly double that of the previous year when approvals hit a 70-year low.
• Decline rates for conventional crude oil fields slowed to an estimated 5.7% in 2017. Even so, roughly 3 mb/d of oil was lost last year, equal to the output from the North Sea. To offset declines, more projects must be approved in short order.
• Global biofuels production is set to reach 2.8 mb/d by 2023, an increase of 0.4 mb/d from 2017, or just under 3% per annum. Growth primarily occurs in non-OECD countries, mainly in Latin America and Asia.
Global Overview Two opposing forces in the Americas dominate our medium term forecast. In the early years, record-smashing US supply far outweighs collapsing Venezuelan capacity, keeping the world adequately supplied. The pace of growth slows markedly after 2019, as the US shale patch stalls under the price assumptions used as input in this report.

SUPPLY
46 OIL MARKET REPORT 2018
Global liquids capacity growth Figure 2.1 Global capacity growth 2017-23 Figure 2.2
Just three non-OPEC countries – the US, along with Brazil and Canada – dominate global oil capacity growth of 6.4 mb/d. Total non-OPEC oil supply rises by 5.2 mb/d to 63.3 mb/d by 2023. Conventional crude production actually falls marginally over the period, with tight oil, oil sands, NGLs and other non-conventional supply contributing all the net growth. For OPEC, Venezuelan capacity tumbles to levels last seen in the 1940s and more than offsets gains in Iraq, which is fuelling expansion in the 14-member group. The Middle East provides virtually all of OPEC’s growth in crude oil capacity, which rises by just 750 kb/d by 2023. OPEC condensates and natural gas liquids increase by 450 kb/d.
Highs and Lows: Change in total oil supply 2017-23 Figure 2.3
We assume some form of OPEC/non-OPEC market management remains in place, at least in the early part of the forecast, as oil officials signal a willingness to institutionalise the partnership. So far, OPEC/non-OPEC cuts that began in January 2017 have led to a major fall in oil stocks and a rally that in 2017 pushed prices 25% above the previous year. That increase saw countries involved in output cuts earn more while producing less. Within OPEC, Saudi Arabia saw the biggest reward, making nearly USD 100 million (mn) (United States dollar) a day in additional revenue. At the other end of the spectrum, a sharp slide in Venezuelan output nearly wiped out the benefits of higher prices. As a whole, OPEC producers netted an extra USD 344 mn a day in 2017. The Russian Federation (hereafter referred to as “Russia”), leading the non-OPEC participants, pocketed an extra USD 117 mn.
0.0
0.5
1.0
1.5
2.0
2.5
2017 2018 2019 2020 2021 2022 2023
mb/d
Non-OPEC OPEC-2
0
2
4
6
8
OPEC Non-OPEC Total
mb/d Biofuels
Proc.gainsNon-conv
NGLs
LTO
Crude
Global
-1.0
0.0
1.0
2.0
3.0
4.0
Unite
d Stat
es
Braz
il
Cana
da
Iraq
Iran
Norw
ay
UAE
Libya
Alge
ria
Egyp
t
Colom
bia
Indon
esia
China
Mexic
o
Ango
la
Vene
zuela
mb/d

SUPPLY
OIL MARKET REPORT 2018 47
Change in crude oil production and gross revenues - 2017 vs 2016 Figure 2.4
The oil price run-up in 2017 also boosted revenue and materially improved the outlook for US production. Crude oil output is expected to expand by 1.3 mb/d in 2018, allowing it to overtake Saudi Arabia and rival Russia as the world’s largest crude producer. With the price of West Texas Intermediate (WTI) above levels not seen since OPEC’s historic “market share” meeting in November 2014, investors are in the mood to spend more and ramp up drilling in the United States. For their part, Middle East producers are not sitting idle. Although limiting their supply for now, they are spending to sustain and boost capacity in anticipation of higher demand. The call on OPEC crude and stock change rises by 1.3 mb/d to 34.1 mb/d in 2023.
Global oil and gas upstream capital spending 2012-18 Figure 2.5
*Preliminary, based on company reports.
Industry sentiment is indeed improving along with rising prices, but major oil companies are reluctant to invest vastly higher sums. Instead, they are retaining their focus on costs, efficiency improvements and return on capital. Global upstream capital expenditure (capex) for oil and gas in 2017 was largely unchanged from the previous year at USD 440 billion (bn) after a 50% increase in spending on US shale was largely offset by declines in investment elsewhere. Only a modest rise in capex is expected this year as a shift towards short cycle projects, especially US shale, accelerates.
The major oil companies, in investor updates for 2018, mostly held capex guidance unchanged from 2017. An increase in spending is nevertheless expected for Exxon, who spent USD 23.1 bn during
99 52 48 28 14
344
117 9
(458)
56 249
435
(273)(454)
(29) (24)
-2000
-1500
-1000
-500
0
500
0
200
400
600
800
1000
Saudi Iraq Iran Libya Venezuela OPEC-14 Russia Oman
kb/dUSD million/day
Change in gross crude oil revenues Change in crude oil production (excl. condensates) (RHS)
0 100 200 300 400 500 600 700 800 900
2012 2013 2014 2015 2016 2017 2018*
USD billion
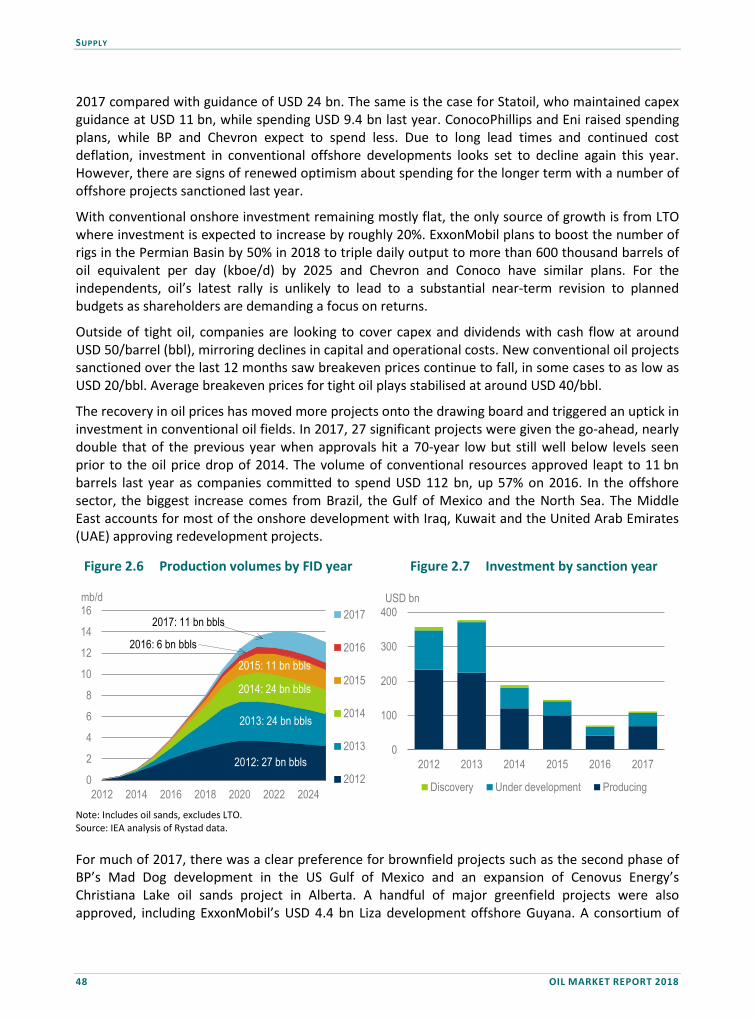
SUPPLY
48 OIL MARKET REPORT 2018
2017 compared with guidance of USD 24 bn. The same is the case for Statoil, who maintained capex guidance at USD 11 bn, while spending USD 9.4 bn last year. ConocoPhillips and Eni raised spending plans, while BP and Chevron expect to spend less. Due to long lead times and continued cost deflation, investment in conventional offshore developments looks set to decline again this year. However, there are signs of renewed optimism about spending for the longer term with a number of offshore projects sanctioned last year.
With conventional onshore investment remaining mostly flat, the only source of growth is from LTO where investment is expected to increase by roughly 20%. ExxonMobil plans to boost the number of rigs in the Permian Basin by 50% in 2018 to triple daily output to more than 600 thousand barrels of oil equivalent per day (kboe/d) by 2025 and Chevron and Conoco have similar plans. For the independents, oil’s latest rally is unlikely to lead to a substantial near-term revision to planned budgets as shareholders are demanding a focus on returns.
Outside of tight oil, companies are looking to cover capex and dividends with cash flow at around USD 50/barrel (bbl), mirroring declines in capital and operational costs. New conventional oil projects sanctioned over the last 12 months saw breakeven prices continue to fall, in some cases to as low as USD 20/bbl. Average breakeven prices for tight oil plays stabilised at around USD 40/bbl.
The recovery in oil prices has moved more projects onto the drawing board and triggered an uptick in investment in conventional oil fields. In 2017, 27 significant projects were given the go-ahead, nearly double that of the previous year when approvals hit a 70-year low but still well below levels seen prior to the oil price drop of 2014. The volume of conventional resources approved leapt to 11 bn barrels last year as companies committed to spend USD 112 bn, up 57% on 2016. In the offshore sector, the biggest increase comes from Brazil, the Gulf of Mexico and the North Sea. The Middle East accounts for most of the onshore development with Iraq, Kuwait and the United Arab Emirates (UAE) approving redevelopment projects.
Note: Includes oil sands, excludes LTO. Source: IEA analysis of Rystad data.
For much of 2017, there was a clear preference for brownfield projects such as the second phase of BP’s Mad Dog development in the US Gulf of Mexico and an expansion of Cenovus Energy’s Christiana Lake oil sands project in Alberta. A handful of major greenfield projects were also approved, including ExxonMobil’s USD 4.4 bn Liza development offshore Guyana. A consortium of
0
2
4
6
8
10
12
14
16
2012 2014 2016 2018 2020 2022 2024
mb/d2017
2016
2015
2014
2013
20122012: 27 bn bbls
2013: 24 bn bbls
2014: 24 bn bbls
2015: 11 bn bbls
2017: 11 bn bbls
2016: 6 bn bbls
0
100
200
300
400
2012 2013 2014 2015 2016 2017
USD bn
Discovery Under development Producing
Production volumes by FID year Figure 2.6 Investment by sanction year Figure 2.7

SUPPLY
OIL MARKET REPORT 2018 49
Petrobras, Total, Shell, China National Offshore Oil Corporation (CNOOC) and China National Petroleum Company (CNPC) announced the launch of the offshore Libra field in Brazil while Statoil sanctioned the Johan Castberg field in the Arctic, the biggest offshore project in 2017.
While total upstream oil investment was largely unchanged last year, exploration expenditure fell for a third straight year to only USD 41.7 bn, its lowest since 2005. Not surprisingly, the amount of oil found dropped to another record low, with less than 4 bn barrels of crude, condensate and NGLs discovered around the world. According to Rystad Energy, not since the 1930s was so little oil found. Moreover, data show that not only did the total volume of discovered resources decrease, so did the resources per discovered field, meaning a larger portion of the oil discovered might not be developed. With exploration spending still subdued, discoveries are likely to remain at low levels.
Global oil discoveries Figure 2.8
Source: Rystad Energy, UCube.
As for already producing assets, companies are spending more on reviving oil fields that are past their prime. Despite their efforts, the equivalent of the North Sea was lost last year. To offset declines, more conventional projects need to be approved in short order.
Decline rates slow at mature fields Oil companies with tighter capex budgets are striving to extract every last drop from mature assets, even as they focus on short cycle projects. Following sharp cutbacks in overall upstream oil investments, it was assumed that lower spending on already producing assets, and in particular those that had already peaked, would lead to an acceleration in decline rates for mature fields. Yet, recent field level data suggest this has not been the case with decline rates of post peak fields2 dropping to a low of 5.7% in 2017 compared with 7.0% over the 2010-14 period.
Small cash injections are in many cases yielding swift returns. Moreover, lower upstream costs have offset some of the impact of spending cuts. Companies are still facing a formidable challenge to maintain and grow production to meet future demand. Conventional crude output from post peak fields averaged 51 mb/d last year, or 53% of global oil supply. Another 16 mb/d came from conventional fields at plateau or ramping up, with the remaining 30 mb/d from non-conventional 2 Decline rates are calculated for conventional crude oil production from all post peak fields, including those that saw production increase in some years. In this analysis we consider a compound annual average decline rate (CADR), rather than a simple decline rate calculation, to strip out the effects of single year. The CADR is produced by calculating the compound annual decline rate since the year in which production entered its current phase of decline (IEA, World Energy Outlook 2013), with each field weighted based on its production in the current year. The simple decline is the sum of output from all the post peak fields in a given year, compared to output from the same set of fields in the previous year.
010 00020 00030 00040 00050 00060 00070 00080 000
2000 2001 2002 2003 2004 2005 2006 2007 2008 2009 2010 2011 2012 2013 2014 2015 2016 2017
Resources Million Barrels
Crude oil
Condensate
NGL

SUPPLY
50 OIL MARKET REPORT 2018
sources including LTO and oil sands as well as NGLs, processing gains and biofuels. As such, more than 3 mb/d of conventional crude production was lost last year due to declines at mature fields.
Excluding output from fields in OPEC Middle East, Libya and Nigeria, distorted by disruptions or intentional supply cuts, average global decline rates were 7.6% last year, compared with 8.9% on average in 2010-14. The Middle East boasts the lowest decline rates in the world due to its large onshore fields.
The compound annual average decline rate for onshore fields dropped to 4.8% in 2017, compared with 5.6% over the 2010-14 period. Production at these fields amounted to 33.9 mb/d of crude oil last year, compared with 35.4 mb/d a year earlier, representing an annual loss of 1.6 mb/d. For the offshore, where the rate dropped to 7.3%, compared with 9.6% over 2010-14, cost reductions and greater efficiency measures have been impressive. Supplies from offshore fields already in decline averaged 17.6 mb/d last year, compared with 19.1 mb/d in 2016.
Observed global decline rates for Figure 2.9post peak conventional oil fields
Annual supply loss from post-peak Figure 2.10conventional crude oil fields
Note: Annual supply loss calculated using a simple decline rate, ie comparing output from all post peak fields in a given year with output from the same fields one year earlier.
A remarkable deceleration in decline rates has taken place in the North Sea and Russia. While in the North Sea the majority of output comes from fields that have already peaked, a number of redevelopment projects and efforts to reduce downtime and maximize output have paid off. During 2017, the weighted average decline rate for Norway was just 9.3%, compared with 18% in the early 2000s. Decline trends in the United Kingdom are similar despite a marked slowdown in drilling rates.
In Russia, brownfield declines have also slowed. More than 80% of crude oil production last year came from post peak fields. With increased drilling efforts and a larger share of horizontal wells drilled, Russian decline rates across post peak fields eased to 5.6%, from 7.9% in 2010-14. Not surprisingly, there was a sharp rise in the simple decline rate in 2017, as many producers chose to slow drilling at mature fields to comply with OPEC/non-OPEC cut agreements.
After peaking near 20% in the late 2000s, when output at the legacy Cantarell field dropped from more than 2 mb/d in 2004 to less than 0.4 mb/d by 2010, Mexican decline rates have slowed to around 12%. Even so, production dropped by 200 kb/d last year, as an increasing share of output came from post-peak fields (82% in 2017 compared with 58% over 2010-14) and virtually no new projects were in the ramping up phase.
0%
2%
4%
6%
8%
10%
12%
2007 2009 2011 2013 2015 2017Simple decline Weighted average
-7.0-6.0-5.0-4.0-3.0-2.0-1.00.01.02.0
2000 2003 2006 2009 2012 2015
mb/d
OPEC Non-OPEC

SUPPLY
OIL MARKET REPORT 2018 51
Declines have also accelerated across a number of countries. In Brazil for instance, where just over half of current crude output comes from fields that are in decline (mostly in the offshore Campos Basin but also onshore fields), a marked acceleration in decline rates can be observed. Last year, the average decline rate for post peak fields was above 12%, meaning that more than 200 kb/d of production from new fields – two-thirds of the total gain - merely offset declines. Following steep spending cuts and a drilling slowdown, declines at Colombia’s mature fields, which make up most of the country’s output, have been running at around 13% in recent years.
As a region, Asia has seen the deepest overall output losses over the past two years. Decline rates, currently running at around 7.6%, have had a particularly steep impact due to an increasing share of output (85%) coming from declining fields as few new major oil fields were commissioned or still ramping up. Exceptions include ExxonMobil’s Banyu Urip field in Indonesia and Shell’s Malikai field in Malaysia. With few new projects in the works, output is expected to see continued sharp falls in coming years.
Selected observed decline rates Figure 2.11
Note: Weighted average compound annual decline rate.
Looking forward, the decline rate of currently producing fields is set to ease, as the aggregate decline rate trends toward that of larger oil fields, with lower declines, while smaller fields drop out of the calculation. As such, the output from the current selection of post peak fields will decline from 51 mb/d, to 38.5 mb/d by 2023, or a loss of roughly 12.5 mb/d. Taking into consideration also fields that are currently in the ramping up phase or yet to start, but that will enter decline phase before 2023, the output loss from decline is expected to be 2 mb/d higher, or roughly 14.5 mb/d.
Non-OPEC oil supplies The outlook for non-OPEC supply growth has materially improved after OPEC/non-OPEC supply cuts largely cleared a global inventory overhang and pushed oil prices up USD 10/bbl during 2017. Higher prices have helped underpin total non-OPEC output gains of 5.2 mb/d by 2023, lifting total liquids supply to 63.3 mb/d. The US is leading the way as a sharp acceleration in upstream spending and drilling activity in light tight oil plays drives growth to 3.7 mb/d and pushes total liquids supply to 16.9 mb/d by 2023.
Substantial increases are also set to come from Brazil and Canada, where the sanctioning of a number of oil projects before oil prices fell, will see oil production rise by 1 mb/d and 790 kb/d,
0%
2%
4%
6%
8%
10%
12%
2000
2002
2004
2006
2008
2010
2012
2014
2016
Global
World Non-OPEC OPEC Offshore Onshore Russia Norway Brazil
0%
5%
10%
15%
2000
2002
2004
2006
2008
2010
2012
2014
2016
Offshore/Onshore
0%
5%
10%
15%
20%
2000
2002
2004
2006
2008
2010
2012
2014
2016
Key countries

SUPPLY
52 OIL MARKET REPORT 2018
respectively. The outlook for Norwegian oil output, set to grow by 450 kb/d by 2023, has also improved after new projects were submitted for approval last year. Continued policy support sees global biofuels production increase by 425 kb/d.
Declines in mature assets in other parts of the world will partly offset the growth. As a region, Asia sees the largest drop, with the People’s Republic of China (hereafter referred to as “China”) the main factor. Asian oil supply (including OECD Asia Oceania) already saw output fall by 585 kb/d from 2015 to 2017, and total supply is expected to decline by another 720 kb/d by 2023. Reductions are also expected in Mexico and Colombia, while Africa’s non-OPEC producers lose nearly 200 kb/d by 2023 despite output starting up in Uganda and Kenya by the end of the forecast period.
The Russian outlook is mired in uncertainty. Assuming production restraint is maintained through 2018 but eased thereafter, output should rebound in 2019 and 2020 as new projects come online. Later, there is a risk of declines if companies are unable to secure technology and financing for next generation oil plays and if more extensive tax breaks to encourage upstream investment are not offered. Production in the countries of the Former Soviet Union (FSU) is expected to hold steady from 2019 onwards, as higher output in Kazakhstan offsets possible declines in Russia.
Non-OPEC supply (mb/d) Table 2.1
2017 2018 2019 2020 2021 2022 2023 2017-23 OECD 24.1 25.8 26.9 27.6 28.2 28.6 28.8 4.7
Americas 20.2 21.9 23.0 23.5 23.9 24.3 24.4 4.2 Europe 3.5 3.5 3.4 3.5 3.7 3.8 3.8 0.3 Asia Oceania 0.4 0.4 0.5 0.6 0.6 0.5 0.5 0.1
Non-OECD 29.3 29.3 29.7 29.6 29.5 29.4 28.6 -0.7 FSU 14.4 14.4 14.6 14.7 14.8 14.7 14.7 0.3 Europe 0.1 0.1 0.1 0.1 0.1 0.1 0.1 0.0 China 3.9 3.8 3.7 3.6 3.6 3.6 3.6 -0.3 Other Asia 3.5 3.3 3.2 3.2 3.1 3.0 2.9 -0.6 Americas 4.5 4.7 5.0 5.1 5.1 5.3 5.4 0.8 Middle East 1.2 1.2 1.2 1.2 1.2 1.2 1.1 -0.1 Africa 1.7 1.7 1.7 1.7 1.6 1.6 1.5 -0.2
Non-OPEC Oil Production 53.4 55.1 56.6 57.2 57.7 58.0 57.4 4.0 Processing Gains 2.3 2.3 2.3 2.4 2.4 2.4 2.5 0.2 Global Biofuels 2.4 2.5 2.6 2.7 2.7 2.8 2.8 0.4 Total-Non-OPEC Supply 58.1 59.9 61.5 62.4 62.8 63.2 63.3 5.2 Annual Change 0.8 1.8 1.6 0.8 0.4 0.4 0.1 0.9
Strong growth lifts US to record highs
Total US oil supply is forecast to expand by 3.7 mb/d to 2023, accounting for more than two-thirds of all non-OPEC gains. Crude oil production rises by 2.7 mb/d to 12.1 mb/d, as growth from LTO more than offsets declines in conventional supply. NGLs add another 1 mb/d, to reach 4.7 mb/d by 2023.
Despite talk of capital discipline and increased focus on returns rather than growth, US producers regrouped quickly when oil prices stabilised and began to rise, adding more than 200 oil rigs in just a year (and more than doubling the number over 18 months). On an annual basis, US oil supplies grew by 670 kb/d in 2017, beating all expectations.
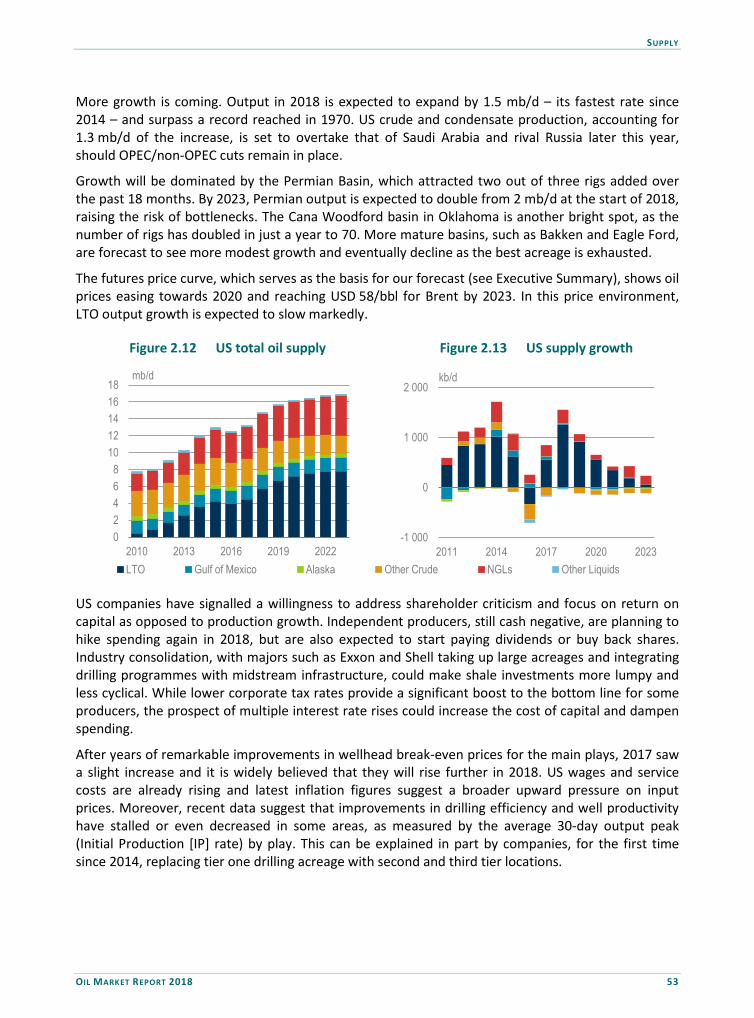
SUPPLY
OIL MARKET REPORT 2018 53
More growth is coming. Output in 2018 is expected to expand by 1.5 mb/d – its fastest rate since 2014 – and surpass a record reached in 1970. US crude and condensate production, accounting for 1.3 mb/d of the increase, is set to overtake that of Saudi Arabia and rival Russia later this year, should OPEC/non-OPEC cuts remain in place.
Growth will be dominated by the Permian Basin, which attracted two out of three rigs added over the past 18 months. By 2023, Permian output is expected to double from 2 mb/d at the start of 2018, raising the risk of bottlenecks. The Cana Woodford basin in Oklahoma is another bright spot, as the number of rigs has doubled in just a year to 70. More mature basins, such as Bakken and Eagle Ford, are forecast to see more modest growth and eventually decline as the best acreage is exhausted.
The futures price curve, which serves as the basis for our forecast (see Executive Summary), shows oil prices easing towards 2020 and reaching USD 58/bbl for Brent by 2023. In this price environment, LTO output growth is expected to slow markedly.
US total oil supply Figure 2.12 US supply growth Figure 2.13
US companies have signalled a willingness to address shareholder criticism and focus on return on capital as opposed to production growth. Independent producers, still cash negative, are planning to hike spending again in 2018, but are also expected to start paying dividends or buy back shares. Industry consolidation, with majors such as Exxon and Shell taking up large acreages and integrating drilling programmes with midstream infrastructure, could make shale investments more lumpy and less cyclical. While lower corporate tax rates provide a significant boost to the bottom line for some producers, the prospect of multiple interest rate rises could increase the cost of capital and dampen spending.
After years of remarkable improvements in wellhead break-even prices for the main plays, 2017 saw a slight increase and it is widely believed that they will rise further in 2018. US wages and service costs are already rising and latest inflation figures suggest a broader upward pressure on input prices. Moreover, recent data suggest that improvements in drilling efficiency and well productivity have stalled or even decreased in some areas, as measured by the average 30-day output peak (Initial Production [IP] rate) by play. This can be explained in part by companies, for the first time since 2014, replacing tier one drilling acreage with second and third tier locations.
02468
1012141618
2010 2013 2016 2019 2022
mb/d
LTO Gulf of Mexico Alaska Other Crude NGLs Other Liquids
-1 000
0
1 000
2 000
2011 2014 2017 2020 2023
kb/d

SUPPLY
54 OIL MARKET REPORT 2018
Wellhead break-even by play Figure 2.14 LTO production by play Figure 2.15
Sources: IEA analysis, Rystad Energy NasWell Cube.
As production continues to rise, operators will increasingly be forced to move outside of the “sweet spots” as they become congested or depleted. Moreover, increased activity levels will require higher levels of investment and more drilling simply to sustain production. Drilling and completing new wells is vital as output falls sharply in the first year of production. As such, in the absence of prices higher than those used in this report, or further significant technological or efficiency improvements, growth in tight oil production is likely to fall away by 2023. Our outlook shows LTO production (excluding NGLs) expanding by 3.3 mb/d, to reach 7.8 mb/d in 2023.
Outside of the tight oil patch, US crude production is expected to decline. Gulf of Mexico output holds broadly steady over the forecast period at around 1.7 mb/d. In the near-term, growth is set to come from the start-up of Hess’ Stampede, Chevron’s Big Foot and Shell’s Kaikias projects, as well as the expansions of Chevron’s Jack St Malo and BP’s Thunder Horse. By the early 2020s, Shell’s Appomattox and BP’s Mad Dog Phase Two will contribute substantial volumes (175 kb/d and 130 kb/d, respectively), but, in the absence of other new projects, declines at existing facilities are likely to offset these additions.
Other conventional supply, from California to Alaska, will fall further. Proposed new legislation that aims to allow offshore oil and gas drilling in nearly all US coastal waters as well as in the Alaskan Natural Wildlife Refuge (ANWR), presented by the Administration in early 2018, is unlikely to impact materially on production within the timeframe of this report. Finalising the new plan will take time and challenges are expected in the courts and in Congress. If adopted in full, the plan would change long-standing US energy policy, opening up acreage on the US Atlantic continental shelf and along the Pacific coast. According to the US Geological Survey, offshore federal waters hold nearly 90 bn barrels of undiscovered technically recoverable oil resources - half of which is in the newly opened areas with the rest in the Gulf of Mexico. Currently, it is unclear if there is industry interest in developing the acreage on offer.
There have been several positive developments in Alaska over the past few years, yet output is projected to decline slightly from 0.5 mb/d in 2017 to 0.4 mb/d in 2023. Over the past year, Repsol and partner Armstrong Energy made a discovery in the Nanushuk play that ranks among the largest US onshore conventional discoveries in the past 30 years, possibly holding around 1.2 bn barrels of recoverable light oil. Initial development plans target 80-120 kb/d of production, with the field brought on stream in 2021. The find follows Caelus Energy and Apollo Global Management’s
0
20
40
60
80
100
2010 2012 2014 2016 2018
USD/bbl
Permian Midland Permian Delaware Niobrara Eagle Ford Bakken Other
0.01.02.03.04.05.06.07.08.09.0
2010 2013 2016 2019 2022
mb/d

SUPPLY
OIL MARKET REPORT 2018 55
discovery in the waters of Smith Bay, which could be the largest ever in Alaska. Caelus estimates it could provide 200 kb/d but has yet to sanction the project. Furthermore, Eni has resumed drilling in the Beaufort Sea after a two-year hiatus. Alaskan oil production peaked in 1988 at 2 mb/d.
Finally, production of NGLs from processing plants will expand by 1 mb/d, roughly the same as total gains from Brazil, the second largest source of non-OPEC supply growth. Natural gas production is forecast to increase by 170 bcm by 2023 to 975 bcm, allowing for increased associated liquids extraction. By 2023, US output of NGLs is expected to reach 4.7 mb/d. Higher ethane production, and to a lesser extent propane, account for most of the gain. Increased domestic demand and infrastructure developments are pushing up ethane frac spreads, reducing the amount of ethane rejected into the natural gas stream. Over the forecast period, US ethane demand is poised to increase by more than 500 kb/d on new petrochemical plant start-ups, while new export terminals could see shipments rise further. The opening up of Enterprise’s new ethane export facility at Morgan Point, Texas, at the end of 2016 already saw ethane shipments reach 250 kb/d by end 2017, compared with less than 100 kb/d on average during 2016. The US currently has ethane export capacity of close to 400 kb/d.
US oil supply forecast (kb/d) Table 2.2
2017 2018 2019 2020 2021 2022 2023 2017-23 LTO 4 486 5 743 6 658 7 212 7 561 7 746 7 809 3 323 Permian 1 565 2 512 3 184 3 584 3 867 4 056 4 183 2 618 Bakken 1 052 1 120 1 179 1 212 1 225 1 211 1 176 124 Eagle Ford 1 022 1 080 1 132 1 174 1 182 1 159 1 107 86 Niobrara 353 484 555 594 615 626 629 275 Other 490 547 609 648 673 695 714 224 Gulf of Mexico 1 661 1 685 1 695 1 666 1 636 1 653 1 651 -10 Alaska 495 487 490 466 442 419 398 -98 Other crude 2 689 2 694 2 578 2 487 2 401 2 313 2 223 -466 Total crude 9 331 10 612 11 423 11 832 12 041 12 133 12 080 2 749 NGLs 3 730 3 998 4 141 4 241 4 313 4 538 4 711 981 Other hydrocarbons 139 110 110 110 110 110 110 -29 Total US 13 201 14 721 15 674 16 183 16 465 16 781 16 901 3 700
Majors bet big on Brazil
After the United States, Brazil will provide the largest contribution to non-OPEC’s expansion. The opening up of the upstream sector, and in particular the coveted pre-salt deposits, to international oil companies (IOCs) will help Petrobras lift supply by more than 1 mb/d by 2023. Given the long lead times for offshore field developments, and few new projects sanctioned since oil prices dropped, growth is heavily front-loaded. Increased participation from IOCs will nevertheless see output grow towards the end of the period, when the large Libra field comes onstream, and beyond if companies follow through with investments on newly awarded acreage.
The government has enacted reforms to make the energy sector more attractive to foreign investment, and for the first time IOCs will be allowed to operate fields in the pre-salt. Bid rounds held in 2017, the first since December 2015, were hugely successful, attracting a number of new players and earning Brazil more than USD 3 bn in signature bonuses.

SUPPLY
56 OIL MARKET REPORT 2018
Brazilian oil supply forecast (kb/d) Table 2.3
2017 2018 2019 2020 2021 2022 2023 2017-23 Onshore 123 112 105 98 91 85 79 -44 Campos basin 1 350 1 279 1 266 1 175 1 066 1 047 1 040 -310 Lula 740 848 1 001 1 037 981 929 888 147 Buzios 0 31 287 488 574 665 739 739 Lara 0 3 95 231 238 246 337 337 Other Santos basin 358 451 392 244 341 505 492 135 Other offshore 50 45 44 45 46 49 53 4 Crude 2 622 2 770 3 190 3 318 3 337 3 526 3 629 1 008 NGLs 111 117 121 121 120 121 125 14 Total Brazil 2 738 2 893 3 317 3 445 3 463 3 653 3 760 1 022
ExxonMobil, among the few majors without a presence in Brazil, was the big winner in the 14th auction for blocks outside the pre-salt area held last October. Exxon won 10 blocks, six in consortia with Petrobras in the offshore Campos basin. It also bought two blocks bordering the pre-salt area that it will operate on its own and a further two in the Sergipe-Alagoas basin that it will develop with Queiroz Galvão Exploração e Produção (QGEP) and Murphy Oil. While the round earned a record USD 1.2 bn in signature bonuses, only 37 of the 287 areas on offer were sold. Other winners included CNOOC and Repsol, which took offshore blocks in the Espírito Santo basin.
In the pre-salt area, Brazil awarded six of eight blocks on offer in its second and third rounds last November and hopes that this will lead to roughly USD 30 bn in investment and USD 40 bn in royalties and other revenues. Royal Dutch Shell, already the largest foreign operator in Brazil’s offshore, was awarded half the blocks in the historic opening. Shell won one area in a consortium with Total, another with Petrobras and Repsol-Sinopec, and a third with Qatar Petroleum International (QPI) and CNOOC. Shell has said it can develop the pre-salt fields at below USD 40/bbl. BP, present in Brazil but not producing, took two blocks. Exxon took just one as part of a consortium with Statoil and Petroleos de Portugal SA, and bought a stake in a nearby block from Statoil for USD 1.3 bn. None of these blocks are expected to start production before 2023.
Petrobras, meanwhile, is following through on its ambitious expansion plans. In its latest five-year business plan, published in December 2017, the company maintained its spending plans, committing USD 74.5 bn by 2022 with exploration and production accounting for 81% of the total. Petrobras also left unchanged its plans to divest USD 21 bn worth of assets in 2017-18. Last year, the company raised USD 4.5 bn with the initial public offering of a stake in the BR Distibuidora fuels distribution unit and the sale of a 25% stake in the Roncador field to Statoil. Currently boasting a break-even Brent oil price of just USD 29/bbl, the business plan foresees a steady increase in domestic crude oil output from 2.1 mb/d in 2018 to 2.88 mb/d in 2022 as 19 new production units are brought online.
The biggest uptick in production is expected in 2019 from several pre-salt fields in the so-called Transfer of Rights area, which the government granted to Petrobras in 2010. Within this area, the Buzios field alone accounts for USD 11.4 bn of planned investment through 2022. Buzios also accounts for five of the 19 units that the company has slated for start-up during the period. The first three floating production, storage and offloading vessels (FPSOs) will be completed 2018, with a fourth set to arrive in 2019 and a fifth in 2021. The combined capacity of all five will be 750 kb/d. Aside from Buzios, three more Transfer of Rights fields are expected to start-up by 2022 — Atapu, Sepia and Itapu. Commercial production is also set to start at Libra, with the arrival of a first FPSO in 2021 and a second in 2022. Development is focusing on the recently defined Mero field in the

SUPPLY
OIL MARKET REPORT 2018 57
northwestern portion of the block, which is estimated to hold 3.3 bn barrels of recoverable oil. Petrobras is also planning to revive output at the Marlim field, adding two new production units toward the end of the forecast period.
Canada poised for strong growth, but export constraints crimp future gains Total oil supply in Canada is expected to rise from 4.8 mb/d in 2017 to 5.6 mb/d in 2023, an increase of 790 kb/d. Oil sands production is set to climb by 700 kb/d over the next six years, reaching 3.4 mb/d in 2023. Other gains will come from tight oil plays in the Duvernay and Montney formations, while conventional crude supplies decline over the period.
Canada total oil supply Figure 2.16 Canada supply growth Figure 2.17
Canadian supply growth is heavily front-loaded, driven by projects with long lead times commissioned before prices collapsed in 2014-16. Oil sands output is seeing unprecedented growth of more than 300 kb/d in both 2017 and 2018, although gains in 2017 were inflated by the rebound effect from wildfire outages in 2016. In 2018 and beyond, the completion of large-scale projects fuels growth. These include Fort Hills (195 kb/d), Horizon Phase 3 (80 kb/d) as well as Christina Lake Phase G (50 kb/d) and Kirby North (40 kb/d). The commissioning of ExxonMobil’s 150 kb/d Hebron heavy oil field offshore Newfoundland at the end of 2017 will lift conventional crude oil supply in the near term, while liquids-rich gas developments in the Montney and Duvernay shale formations boost light tight oil and condensate production. Canadian LTO output is set to rise from an estimated 320 kb/d in 2017 to 430 kb/d in 2023.
As for oil sands, the retreat of international oil companies during 2017 places the onus on local Canadian producers to expand production. Shell, ConocoPhillips and Marahon Oil divested assets last year and others are looking to follow suit. Despite considerable efficiency improvements and cost reductions, few new oil sands developments have been approved. While industry consolidation and capital discipline play a part, delays to pipeline approvals and uncertainty over the provision of more export capacity is undermining the next wave of development as market access costs are set to rise. Capacity limits were already tested by end-2017, causing the discount of Western Canadian Select (WCS) to WTI to balloon to USD 30/bbl, versus only USD 15/bbl a year earlier. Demands on the rail network to move crude oil are set to intensify in 2018 given increasingly tight capacity on export pipelines. Until new pipeline capacity becomes available, sufficient rail capacity will enable these barrels to get to market, albeit at a higher cost (see North American oil looks for a way out).
0
1
2
3
4
5
6
2013 2016 2019 2022
mb/d
Bitumen Synthetics Alberta L&M Alberta Heavy Other NGLs
- 100- 50
0 50
100 150 200 250 300 350 400
2017 2020 2023
kb/d

SUPPLY
58 OIL MARKET REPORT 2018
Mexican growth delayed by reluctant farm-out partners
Mexico’s energy reform process is moving apace with nearly 90 blocks of 123 on offer awarded so far. However, delays in the farm-out process risk postponing a return to production growth. Given the long lead-time to explore and develop new resources, especially in the deepwater, the new blocks awarded over the past 18 months are expected to have a more meaningful impact on supply beyond the time horizon of this report. Output will see continued declines through the early 2020s at which time total production will then stabilise at just below 2 mb/d through 2023, unless additional projects and discoveries are fast-tracked for development.
Mexico’s oil production declined by a precipitous 230 kb/d in 2017, far more than the 100 kb/d reduction agreed to in support of OPEC/non-OPEC supply cuts. Output is set to decline by an additional 180 kb/d in 2018 to 2.1 mb/d. Efforts to reverse the decline before 2020 look increasingly challenging. Pemex’s business plan, released in December 2016, was dependent on an accelerated farm-out schedule to boost crude output to 2.2 mb/d by 2021 from just under 1.9 mb/d at the start of 2018. Failing that, the company said production would continue to fall until around 2020.
To support growth, the Comisión Nacional de Hidrocarburos (CNH) had planned to auction 32 farm-outs by the end of 2017, but approval delays meant that only five projects were auctioned and only three successfully. While an initial farm-out of the Trion discovery, awarded to BHP Billiton in late 2016, was well received, the field is not expected to start up before 2025. Offshore Ayin Batsil and the deep-water Nobilis-Maximino were withdrawn, as there were no offers. Ayin Batsil, which contains proved, probable and possible reserves totalling 350 mb of heavy crude, was regarded as the most attractive. Had licences been awarded, production could have begun in 2020 with output of 80 kb/d attained in later years. Two onshore farm-outs, for the Cardenas-Mora and Ogarrio blocks, had better success. Both are secondary recovery projects and will only marginally lift output.
The outlook is not all bleak, however. Pemex held a series of successful bid rounds last year and major finds were made by Talos Energy, Pemex and Eni. Talos’s shallow water Zama discovery could hold as much as 2 bn barrels of crude, one of the largest discoveries in the world this decade. Talos and its partners, Premier Oil and Sierra Oil and Gas, plan to press ahead with appraisal drilling in 2018 with an eye on starting production by 2020. As the field straddles a neighbouring licence held by Pemex, it will require an unitisation agreement between the licence holders, which risks delays to the project.
Eni also made some successful discoveries in Mexico in 2017 and plans a final investment decision this year on its shallow water Area 1 find. Area 1, which includes Amoca, Miztón and Tecoalli, would be the first offshore hydrocarbon development in Mexico by a private operator since reforms were enacted. Eni is fast tracking the project after initial drilling results bumped up its estimate for hydrocarbons in place to 2 billion barrels of oil equivalent and is targeting an early production phase
Mexican oil supply Figure 2.18
0.0
0.5
1.0
1.5
2.0
2.5
3.0
2015 2017 2019 2021 2023
mb/d

SUPPLY
OIL MARKET REPORT 2018 59
with output of 30-50 kb/d. The company will shortly submit the development plan to the CNH and, when approved, intends to sanction development with output due to come online as early as 2019.
Meanwhile, Mexican president Enrique Peña Nieto announced in November the discovery of an important reservoir with excellent quality light crude oil and gas, the largest onshore discovery made by Pemex in the last 15 years. The field is estimated to hold reserves of approximately 350 million barrels of oil equivalent (boe).
Update on Mexico’s bid rounds
Heading into 2018, eight bid rounds had been concluded and 88 final awards granted out of 122 blocks on offer. The first two rounds for offshore acreage received great interest but only two of 14 blocks were acquired in Round 1.1 and three of five in Round 1.2. In Round 1.3 for marginal onshore fields, all 25 blocks offered were awarded. In the much-anticipated Round 1.4 for deep-water blocks, held in December 2016, eight out of 10 blocks were taken, along with the Trion farm-out.
During Round 2.1, held in 2017, Mexico awarded 10 out of 15 shallow water blocks. Eni, Pemex, Shell, and Total were among the winners of the round, which the upstream regulator, SENER, hopes will bring in investments of up to USD 8.9 bn yielding 170 kboe/d of oil. As for Rounds 2.2 and 2.3, covering onshore mature acreage, regulators awarded seven of 10 blocks in the gas-focused Round 2.2 and all 14 areas included in Round 2.3.
Round 2.4, concluded in early 2018, was seen as the most important since the opening up of the energy sector to foreign firms. It covered deep-water blocks for exploration, and 19 of the 29 blocks were awarded with Shell taking nine of them. It is hoped that the Round 2.4 awards will generate USD 93 bn of investment and add as much as 1.5 mb/d of crude and 4 billion cubic feet per day (bcf/d) of gas production by 2032. The total pledged investments from all blocks so far is USD 154 bn. A further 35 shallow-water blocks will be auctioned in March 2018, as part of Round 3.1. CNH hopes to hold its first shale oil and gas auction by the end of this year, but is waiting for authorization from the energy ministry.
Mixed bag in Latin America
An increase in spending and drilling activity has slowed the pace of decline in Colombia, where output is expected to fall by 230 kb/d to 630 kb/d in 2023. Production fell by nearly 130 kb/d, or 12%, during 2016 and a further 30 kb/d last year. In Argentina, an increase in tight oil output should offset declines in conventional supplies. A number of domestic and international oil companies, including YPF, Shell, Chevron, Total and Schlumberger, are upping their investments in the Vaca Muerta shale play. Tight oil production is forecast to rise to around 110 kb/d by 2023, from 35 kb/d currently.
By the end of the forecast period, oil will also be flowing from Guyana. ExxonMobil, with partners Hess and CNOOC, sanctioned its Liza discovery in the Stabroek block in June last year, and plans to bring the project on stream through a 120 kb/d FPSO by 2020. The consortium aims to add a second, larger FPSO within a few years of the first one. ExxonMobil and its partners announced another Stabroek discovery, the Pacora find, in February 2018. It is the seventh Stabroek discovery made by the consortium following Liza, Liza Deep, Payara,Snoek, Turbot and Ranger. The Pacora resources, which will be integrated into the third phase of development, will eventually lift Guyana production to more than 500 kb/d.

SUPPLY
60 OIL MARKET REPORT 2018
Other Latin America oil supply Figure 2.19 Other Latin America annual Figure 2.20change
North Sea boost After growing for three straight years, a number of outages at the end of 2017 caused supply to fall 35 kb/d below the previous year. This mature region is nevertheless expected to see renewed growth over the medium term, as projects undertaken both before the collapse of oil prices in 2014, and more recently in the case of Norway, slowly come online. In 2017, 16 new oil fields started up including amongst others Gina Krog, Maria, Quad 2014, Kraken, Catcher and Western Isles. In 2018, Statoil’s Mariner and BP’s Clair Ridge projects will come online.
New projects, supplementing those already in development, are expected to provide a significant boost to Norwegian output in the medium term. Total oil output is forecast to grow by 450 kb/d to 2.4 mb/d in 2023, the highest level since 2008. During 2017, the Ministry of Petroleum and Energy received development plans for 11 new offshore projects, with commitments of USD 18 bn of investments, the highest in the world last year ahead of the US and Mozambique. Only in December, seven new project development plans were submitted. First out was Statoil’s Johan Castberg, valued at USD 6.2 bn. AkerBP followed with plans for Aerfugl, Valhall West Flank and Skogul, while Repsol’s Yme new development, VNG’s Fenja, and Statoil’s Snorre Expansion submitted theirs shortly after.
Along with the already-committed Johan Sverdrup project, Johan Castberg will provide the largest contribution to growth in the medium term. Production of up to 190 kb/d, via an FPSO, is expected to start towards the end of 2022. In the case of Johan Sverdrup, Statoil and its partners (Lundin Petroleum, Aker BP, Petoro and Maersk Oil) last year approved plans to go ahead with a second development phase after slashing costs in half, to less than USD 5.6 bn on the second phase. Phase 1 is expected to cost USD 11 bn, a 30% reduction from the initial estimate. The project now has a break-even price of less than USD 20/bbl, and only USD 15/bbl for the first phase alone. Sverdrup will be able to pump 440 kb/d starting in 2019 and 660 kb/d when the second phase comes on stream by 2022.
Companies are also investing to maintain or recover additional resources from already producing or abandoned fields. The Snorre Expansion Project (SEP), which is the biggest improved oil recovery project on the Norwegian shelf, is expected to increase recovery by around 200 mboe and
0.0
0.5
1.0
1.5
2.0
2.5
2015 2017 2019 2021 2023
mb/d
Colombia Argentina Peru Trinidad and Tobago Guyana Others
- 200
- 150
- 100
- 50
0
50
100
2016 2017 2018 2019 2020 2021 2022 2023
kb/d

SUPPLY
OIL MARKET REPORT 2018 61
extend the field’s lifespan by 25 years. Snorre, one of Norway’s biggest fields, started pumping in 1992. Repsol’s project at Yme, now shut in after having produced oil from 1996 to 2001, aims to recover 65 mb of oil when restarted in 2020.
North Sea oil supply Figure 2.21 North Sea annual change Figure 2.22
In the United Kingdom, the short-term outlook is rosy, but there is a risk of sharp decline in the not too distant future due to lack of investment. After rising to 1.1 mb/d in 2018-19, oil production is forecast to drop to 0.9 mb/d by 2023.
Front-loaded developments are expected to raise output by 90 kb/d in 2018. Last year, 12 new fields or redevelopment projects started up, but growth was derailed by technical glitches and the shutdown of the Forties Pipeline System (FPS) in December. The ramp-up gets back on track this year and will be supported by further increases in production from BP’s Quad 204 project at the Schiehallion and Loyal fields, which started up last August. It will add around 130 kb/d of output when fully operational. Dana Petroleum started production from its Western Isles (Barra and Harris) fields in November. EnQuest’s Kraken field will reach 50 kb/d during the first half of 2018 and Premier Oil’s Catcher Area development, which started up in December, is on track to reach 60 kb/d by the second quarter of 2018 (2Q18). Later in the year, Statoil is expected to launch its 80 kb/d Mariner field while BP will commission the 130 kb/d Clair Ridge project.
Further down the line, a lack of new project start-ups is expected to see output falling once again. Over the past three years, only 10 new projects were sanctioned on the UK Continental Shelf and only two of these in 2017. Moreover, in a report published in December 2017, industry body Oil and Gas UK warned that the drilling of offshore development wells in 2017 hit a record low for the second straight year.
The downtrend might be about to turn however, with Shell starting off 2018 with an FID on its Penguin redevelopment project. By 2020, Shell plans to add a 45 kb/d FPSO to the field first developed in 2002. A number of other projects, including Decipher Energy’s Orlando field, Alpha Petroleum’s Cheviot, an extension at CNOOC’s Buzzard and BP’s Clair Ridge could also move towards FID in 2018 or 2019. If approved in a timely manner, these could provide an offset to declines at mature fields, currently running at an average of 10%.
0.0
0.5
1.0
1.5
2.0
2.5
3.0
3.5
4.0
2015 2017 2019 2021 2023
mb/d
Norway UK Offshore Other
- 200- 150- 100
- 50 0
50 100 150 200 250 300
2016 2017 2018 2019 2020 2021 2022 2023
kb/d

SUPPLY
62 OIL MARKET REPORT 2018
Russian plateau
Despite agreeing to cut output from the start of 2017, Russian crude and condensate supply reached a record high last year near 11 mb/d, allowing it to remain the world’s largest crude oil producer. During the period of sub-USD 50/bbl oil, a combination of tax relief and rouble depreciation mitigated the impact of lower prices, allowing producers to focus on improved recovery and new developments. Further upside is expected in the next few years if supply restraints are lifted and new projects ramp up. However, by the early 2020s, production is likely to plateau, and further ahead there is a risk of decline if Russian companies are unable to secure the technology and financing necessary for the next generation of projects and the government fails to offer more extensive tax breaks to encourage investment.
During 2017, companies worked to meet the 300 kb/d agreed production cut by lowering output at mature fields and delaying redevelopment initiatives. In Russia’s case, the implementation of its cut was gradual rather than immediate and, for the year as a whole, the compliance rate was only 80%. Indeed, it can be argued that Russia has benefitted from the fact that the baseline for cuts was the production level in October 2016 when output was at a record high. In fact, it was markedly higher than the average level for the year, so that total oil production in 2017, at 11.36 mb/d, was actually higher than in 2016 while oil prices were approximately 20% higher. We assume that the OPEC/non-OPEC cuts will remain in place through 2018 but gradually unwind during 2019. Under these assumptions, output growth is likely to return for a couple years with Russian producers eager to capitalise on higher oil prices by reactivating and upgrading wells as well as launching new development projects.
Towards the end of the forecast period, declines at mature fields will begin to offset production gains as western sanctions, particularly hitting technology access impacting shale, deep-water, and Arctic projects, act as a drag on new developments. There is little indication that sanctions will be eased during the period covered by this report.
In the meantime, there is potential for new finds and additional field development through joint ventures with western companies, where, in some cases, existing work is still permissible or not prohibited by sanctions. Fresh capital injections for upstream projects could also be provided via more recent foreign partnerships with Asian or Middle Eastern companies. For their part, the Russian majors are expected to press ahead with efficiency gains, improved drilling capabilities and in-house technological advances. Schlumberger’s bid to acquire a 51% stake in Eurasia Drilling Company, if approved, would support these ambitions.
However, these best efforts may not be enough to defend production and market share well into the 2020s, given an emerging trend among Russian companies, led by Rosneft, to pursue overseas acquisitions and in the absence of sizable new discoveries.
Reform of the tax regime is a final factor that could lend support to the long-term production outlook. The structure now provides for the federal budget to reap most of the upside as oil prices track higher, particularly when they moved above USD 50/bbl. A combination of the tax system and a weaker rouble – in the immediate aftermath of the 2014-15 oil price fall the currency lost half its value versus the dollar - offered support for producers; however, higher prices have already led the rouble higher, which cuts into the profitability of many producers by increasing operating and capital costs. This, combined with a higher tax take as oil prices rise, could slow new upstream investments. Following the completion of a 2015-17 tax manoeuvre, policymakers are now experimenting with a profits-based tax system to try to support continued growth and profitability. The pilot programme,

SUPPLY
OIL MARKET REPORT 2018 63
slated to begin in January 2019, is a watered-down version of the original idea. The fact that the programme has been downsized and delayed, and that the federal budget remains heavily reliant on oil revenues, suggests a serious overhaul of the tax system is unlikely at this time.
Russia oil supply Figure 2.23
Modest growth in the Caspian
Kazakhstan’s oil output is set for further gains through the medium term, as Kashagan ramps up towards an initial 370 kb/d production target and as the Tengiz Future Growth Project (FGP) comes on stream towards the end of our forecast period. Chevron and its partners at TengizChevroil announced in July 2016 that it would proceed with the FGP, setting aside USD 36.8 bn to raise capacity by 260 kb/d from 2022. For the time being, it looks unlikely that either the proposed expansion of the Karachaganak condensate field, or a second development phase of the Kashagan field, will come on-stream before 2023. Without these projects, total output is expected to increase only modestly from 1.9 mb/d at the end of 2017 to 2.0 mb/d in 2023.
Kazakhstan oil supply Figure 2.24 Azerbaijan oil supply Figure 2.25
In Azerbaijan, output is expected to fall overall as gains from Shah Deniz fail to offset continued declines at the country’s larger producer, the BP operated Azeri-Chirag-Deepwater Gunashli (ACG) cluster. BP’s Shah Deniz gas project produced around 50 kb/d of condensates during 2017, but when Phase 2 comes online later this year, output is set to rise to 120 kb/d. Production from ACG is
0
2
4
6
8
10
12
2013 2014 2015 2016 2017 2018 2019 2020 2021 2022 2023
mb/d
Brownfields
Greenfields
NGLs
0.0
0.5
1.0
1.5
2.0
2.5
2015 2017 2019 2021 2023
mb/d
0.0
0.2
0.4
0.6
0.8
1.0
2015 2017 2019 2021 2023
mb/d

SUPPLY
64 OIL MARKET REPORT 2018
expected to see continued declines over the period, having fallen to 580 kb/d in 2017 from 620 kb/d a year earlier. In September 2017, the Azeri government and the State Oil Company of the Republic of Azerbaijan (SOCAR), together with BP, Chevron, INPEX, Statoil, ExxonMobil, TP, ITOCHU and ONGC Videsh, signed an amended agreement on the joint development and production sharing agreement for ACG, extending the duration of the contract by 32 years.
Asian region sees biggest decline
Asian oil supply is expected to fall into steep decline, with all producers, except Australia, seeing lower output. Few new discoveries have been made in recent years and output from mature assets is declining rapidly. Supply from the region as a whole, including OECD Asia Oceania, falls by more than 720 kb/d over our forecast period. Excluding growth in non-conventional supply from China, output drops are even sharper, with crude and condensate production falling by 1 mb/d, to 6.1 mb/d.
China posts the steepest decline in the region. After dropping by 290 kb/d in 2016 and 110 kb/d last year, total supplies are set to fall by a further 250 kb/d through 2023, to around 3.6 mb/d. The relatively modest decline rate, compared with recent trends, is partly misleading, however. Crude oil production will see much steeper falls, of more than 580 kb/d – the largest decline in output among non-OPEC producers. Declines are nevertheless expected to slow alongside a rebound in upstream investments. Indeed, decline rates already eased during 2017, as China’s main producers, CNPC, Sinopec and CNOOC hiked upstream capex to USD 37.9 bn, a 17% increase from the previous year. The biggest increase came from Sinopec, who lifted spending by 28.5%, though much of this was spent on gas rather than oil. Due to its mature resource base and a limited number of new projects, crude oil production is expected to continue to fall, to 3.2 mb/d by 2023. Non-conventional supplies, including output from Coal to Liquids (CTL) plants, but excluding methanol3, will partly offset crude oil declines. A number of new CTL plants in construction are set to lift output from 80 kb/d in 2017 to more than 400 kb/d by 2023 when 15 plants will be operational. Chief amongst these are Shenhua’s 80 kb/d Ningxia plant that started up in 2017.
Outside of China and OECD Asia Oceania, Asian oil output is forecast to drop by a combined 595 kb/d as production at mature fields declines rapidly and new developments are increasingly weighted towards gas. Steep declines are expected in Indonesia, Malaysia, Viet Nam and Thailand. Indonesia missed its 2017 target for crude and condensates output, producing just over 800 kb/d, a 3% decline on the previous year. Crude supply is forecast to fall to 575 kb/d by 2023, 225 kb/d lower than in 2017. Malaysian production is expected to decline by 120 kb/d over the period, while Viet Nam will record a 100 kb/d drop. Indian oil output, meanwhile, is seen holding relatively steady. ONGC, India’s largest producer, plans to raise crude production to 540 kb/d by fiscal year 2022, from around 460 kb/d currently. Notably, the company is spending USD 5.1 bn to add 80 kb/d of output from its KG-DWN 98/2 project by 2019-20.
3 These data exclude the supply and demand of methanol, produced from coal, increasingly used in China as a substitute for conventional refined oil products. The US Energy Information Administration estimates that in China methanol consumption in fuel products was more than 500 kb/d in 2016. Roughly 200 kb/d of this was used as direct methanol blending to gasoline; another 200 kb/d was methanol derivatives to gasoline, with the rest as other fuel uses. Chinese oil statistics do not include methanol.

SUPPLY
OIL MARKET REPORT 2018 65
Asia oil supply Figure 2.26 Asia supply: Annual change Figure 2.27
Bucking the trend, Australia’s oil production is set to grow by 145 kb/d over the forecast period to reach 470 kb/d in 2023. Faced by high decline rates across its conventional resource base, growth is entirely driven by condensate and natural gas liquids output from new LNG projects. Most notably, Inpex’s Ichthys project is set to start up by the end of March 2018. It is part of a wave of new gas projects that will lift LNG capacity to 118 bcm by the end of 2018 and make Australia the world’s largest exporter. Ichthys will add an estimated 130 kb/d of liquids once it is fully operational. Additional condensate and NGL volumes will come from the Wheatstone project that started up in October 2017, and from the Prelude LNG project, which will be completed later this year.
Africa falls
African oil output will fall by roughly 185 kb/d to average just over 1.5 mb/d in 2023. The biggest declines are expected to come from Egypt, where investment and output have dropped sharply as the focus shifts to gas projects. The newly commissioned Zohr field contains dry gas, with no associated liquids to be extracted. In Ghana, Tullow’s Jubilee and TEN fields will provide a boost in the near term, as will Eni’s Sankoka field that started up last year. Oil output is expected to rise from 170 kb/d in 2017 to 230 kb/d in 2023. Production in Congo is also set to rise to a peak of 350 kb/d in 2019 as Total’s Moho North development ramps up towards capacity, before falling back to current levels of around 300 kb/d by 2023.
While the timings are still uncertain, we expect both Uganda and Kenya to start up oil production by the end of the forecast period. Total, which recently acquired Tullow’s stake in Uganda’s Albertine Basin, is moving towards taking FID on the project in 2018 with a target to start up production by the early 2020s. Uganda National Oil Company, the Tanzanian Petroleum Development Corporation, CNOOC, Total and Tullow are looking to build the 1 445 kilometre (km) East Africa Crude Oil Pipeline (Eacop) that will run from Hoima in Uganda to the Tanga port in Tanzania. Eacop, which is estimated to cost USD 3.5 bn, will handle just over 200 kb/d of crude sourced from the CNOOC-operated Block 3A and the Total-operated blocks 1 and 2. Uganda’s output is expected to average 60 kb/d by 2023.
0.01.02.03.04.05.06.07.08.09.0
2015 2017 2019 2021 2023
mb/d
China India Indonesia Malaysia Thailand Vietnam Australia Others
- 500
- 400
- 300
- 200
- 100
0
100
200
2016 2017 2018 2019 2020 2021 2022 2023
kb/d
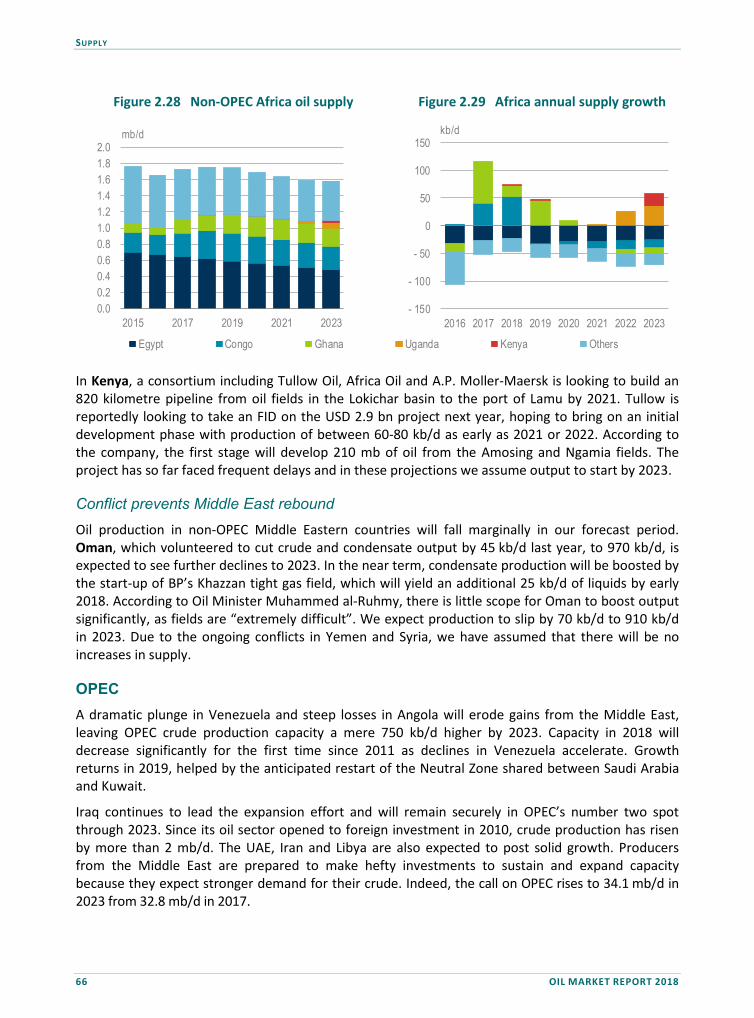
SUPPLY
66 OIL MARKET REPORT 2018
Non-OPEC Africa oil supply Figure 2.28 Africa annual supply growth Figure 2.29
In Kenya, a consortium including Tullow Oil, Africa Oil and A.P. Moller-Maersk is looking to build an 820 kilometre pipeline from oil fields in the Lokichar basin to the port of Lamu by 2021. Tullow is reportedly looking to take an FID on the USD 2.9 bn project next year, hoping to bring on an initial development phase with production of between 60-80 kb/d as early as 2021 or 2022. According to the company, the first stage will develop 210 mb of oil from the Amosing and Ngamia fields. The project has so far faced frequent delays and in these projections we assume output to start by 2023.
Conflict prevents Middle East rebound
Oil production in non-OPEC Middle Eastern countries will fall marginally in our forecast period. Oman, which volunteered to cut crude and condensate output by 45 kb/d last year, to 970 kb/d, is expected to see further declines to 2023. In the near term, condensate production will be boosted by the start-up of BP’s Khazzan tight gas field, which will yield an additional 25 kb/d of liquids by early 2018. According to Oil Minister Muhammed al-Ruhmy, there is little scope for Oman to boost output significantly, as fields are “extremely difficult”. We expect production to slip by 70 kb/d to 910 kb/d in 2023. Due to the ongoing conflicts in Yemen and Syria, we have assumed that there will be no increases in supply.
OPEC A dramatic plunge in Venezuela and steep losses in Angola will erode gains from the Middle East, leaving OPEC crude production capacity a mere 750 kb/d higher by 2023. Capacity in 2018 will decrease significantly for the first time since 2011 as declines in Venezuela accelerate. Growth returns in 2019, helped by the anticipated restart of the Neutral Zone shared between Saudi Arabia and Kuwait.
Iraq continues to lead the expansion effort and will remain securely in OPEC’s number two spot through 2023. Since its oil sector opened to foreign investment in 2010, crude production has risen by more than 2 mb/d. The UAE, Iran and Libya are also expected to post solid growth. Producers from the Middle East are prepared to make hefty investments to sustain and expand capacity because they expect stronger demand for their crude. Indeed, the call on OPEC rises to 34.1 mb/d in 2023 from 32.8 mb/d in 2017.
0.00.20.40.60.81.01.21.41.61.82.0
2015 2017 2019 2021 2023
mb/d
Egypt Congo Ghana Uganda Kenya Others
- 150
- 100
- 50
0
50
100
150
2016 2017 2018 2019 2020 2021 2022 2023
kb/d

SUPPLY
OIL MARKET REPORT 2018 67
Venezuelan collapse blunts Mideast gains Figure 2.30
OPEC’s capacity ranking shifts slightly when condensates and NGLs are taken into account. A substantial increase in condensates output leaves Iran nearly tied with Iraq as the fastest source of total liquids growth within OPEC. Countries outside of the Middle East fare less well. Venezuela loses 710 kb/d of capacity to post the biggest decline anywhere in the world, while Angola sheds 370 kb/d.
Estimated sustainable OPEC crude production capacity (mb/d) Table 2.4
2017 2018 2019 2020 2021 2022 2023 2017-23 Algeria 1.10 1.08 1.07 1.05 1.03 1.02 1.00 -0.10 Angola 1.65 1.65 1.60 1.56 1.47 1.39 1.29 -0.37 Ecuador 0.54 0.54 0.55 0.55 0.55 0.56 0.56 0.02 Equatorial Guinea 0.13 0.12 0.12 0.12 0.11 0.11 0.11 -0.02 Gabon 0.21 0.21 0.20 0.20 0.20 0.20 0.20 -0.01 Iran 3.80 3.85 3.90 3.96 4.01 4.07 4.13 0.33 Iraq 4.77 4.86 4.96 5.07 5.17 5.26 5.36 0.59 Kuwait 2.94 2.95 3.07 3.10 3.11 3.11 3.11 0.17 Libya 1.00 1.02 1.04 1.09 1.14 1.19 1.24 0.24 Nigeria 1.70 1.79 1.82 1.83 1.80 1.78 1.75 0.05 Qatar 0.64 0.64 0.64 0.64 0.64 0.64 0.64 0.00 Saudi Arabia 12.16 12.14 12.31 12.28 12.31 12.30 12.30 0.14 UAE 3.17 3.23 3.29 3.35 3.41 3.48 3.53 0.36 Venezuela 1.75 1.38 1.17 1.06 1.05 1.07 1.10 -0.65 Total OPEC 35.56 35.46 35.76 35.84 36.00 36.17 36.31 0.75
Notes: Capacity levels can be reached within 90 days and sustained for an extended period. Assumes restart to Neutral Zone by end 2019.
Iraq dominates expansion
Within OPEC, Iraq is poised to grow the most and crude oil output capacity is projected to reach 5.36 mb/d in 2023 for an annual average gain of 100 kb/d over the forecast period. There remain big uncertainties: to the upside given Iraq’s huge, low-cost reserves and economic imperative to boost output and to the downside due to security, financial and institutional hurdles.
Growth will be centred around the oil hub of Basra in the south, where international oil companies (IOCs) are leading development projects, with a small increase expected from the northern Kirkuk oil
-0.8-0.6-0.4-0.20.00.20.40.60.8
Vene
zuela
Ango
la
Alge
ria
Eq. G
uinea
Gabo
n
Qatar
Ecua
dor
Nige
ria
Saud
i
Kuwa
it
Libya Iran
UAE
Iraq
mb/d

SUPPLY
68 OIL MARKET REPORT 2018
fields. Additional northern capacity held by the semi-autonomous Kurdistan Regional Government (KRG), in the grip of a financial and political crisis, is expected to hold steady. Iraq’s vast southern oil fields will not come close to pumping at full tilt unless a long-delayed project to supply water gets off the ground. In the meantime, the planned injection scheme has seen its scope reduced from 7.5 mb/d to 5 mb/d. Gains in the south will be provided by Halfaya, Zubair, Majnoon, Rumaila and West Qurna-2 as well as Nassiriya and Bin Umar, so-called national effort fields. Export capacity in the south, now at 4.6 mb/d, is more than enough to handle the anticipated increase in production. Shipments of Basra crude were running at or near record rates above 3.5 mb/d in early 2018.
The IOCs are meanwhile seeking improved commercial terms and re-evaluating their exposure. Shell, striving to shed USD 30 bn in global assets, is leaving West Qurna-1, where it has agreed to sell its 20% stake to Itochu, and Majnoon, where it is the operator. West Qurna-1, run by ExxonMobil, produces roughly 470 kb/d, and Majnoon about 220 kb/d. Petronas, which holds a 30% stake in Majnoon, is following Shell’s lead and heading for the exit. The government will take charge of the field, which straddles the border with the Islamic Republic of Iran (hereafter referred to as “Iran”), later this year and insists it can boost output to 400 kb/d in the coming years and cut costs by 30%. Chevron, Total and CNPC are reportedly considering taking on Shell’s share of Majnoon, albeit under more attractive commercial conditions.
The ministry currently repays contractors a fixed fee for each barrel of oil produced. When oil prices were high, the mechanism worked well, but lower oil prices make it more difficult to pay the fees, especially in light of Iraq’s budgetary pressures. Leaving aside contractual issues, Iraq has managed to lure a new investor, Zhenhua Oil, to boost the East of Baghdad fields from 10 kb/d to 40 kb/d. Baghdad also intends to raise capacity by putting nine exploration and development blocks up for grabs. It will, however, take several years for most of the fields, located in southern and central Iraq, to start pumping.
In the north, Iraqi forces regained control over oil fields in and around Kirkuk from Kurdish forces during the autumn of 2017. Apart from the re-claimed Bai Hassan and Avana operations, which have combined capacity of 280 kb/d, the federal North Oil Co is producing about 150 kb/d from the Baba dome of the Kirkuk field, as well as the smaller fields of Jambour and Khabbaz. BP has meanwhile signed a memorandum of understanding to help develop Kirkuk, which once produced over 1 mb/d, but is now pumping just over 200 kb/d. The Iraqi oil minister has indicated a target output level of 700 kb/d.
As for Kurdistan, its production and export streams are now sourced mostly from the 100 kb/d Khurmala dome of the Kirkuk field as well as Tawke and Taq Taq, which has been in sharp decline. Output is also slipping at the heavy-oil producing Shaikan field. Gulf Keystone Petroleum expects lower output of 27 kb/d to 32 kb/d this year versus 35 kb/d in 2017 due to delayed investments.
On the export front, shipments of northern crude via the KRG’s northern pipeline to Turkey had been running below 300 kb/d, half the rate of September 2017, after the federal government in October halted output at the Bai Hassan oil field and the Avana dome of the giant Kirkuk field. At the time of writing, however, Baghdad said it had reached an agreement with the semi-autonomous northern region to restart Kirkuk pipeline deliveries to Turkey. No further details were given. The federal government has also secured other ways to get oil from Kirkuk to the market. It has a deal in place with Tehran to swap up to 60 kb/d of Kirkuk crude with Iranian oil. In the longer term, Baghdad plans

SUPPLY
OIL MARKET REPORT 2018 69
to build a new oil pipeline linking the fields of Kirkuk to Ceyhan in Turkey and bypassing Kurdistan. Iraq halted use of an older pipeline in 2014 after Islamic State forces swept through the region and badly damaged sections of the line.
Iraq leads gains Figure 2.31 UAE’s growth spurt Figure 2.32
The UAE expansion effort sees it posting the biggest growth after Iraq thanks to its relatively low-cost reserves and stable operating environment. A gain of 360 kb/d is expected over the period, with capacity reaching 3.53 mb/d. More than USD 100 bn of spending is planned over the next five years, split nearly evenly between the upstream and downstream. The offshore Upper Zakum field, one of the world’s largest, but also technically challenging, is vital to boosting supply. Following completion of a USD 10 bn project undertaken by ExxonMobil and Inpex, production is on course to reach 750 kb/d in 2018. The next target level for the field is 1 mb/d by 2024 now that the Abu Dhabi National Oil Co (Adnoc), which holds a 60% share, has given ExxonMobil (28%) and Inpex (12%) a 10-year extension to the Upper Zakum concession.
Abu Dhabi is also in final discussions with companies to manage its restructured, 700 kb/d offshore oil concession, operated by new unit Adnoc Offshore. The existing offshore license, which expires on 8 March, has been split into three separate ventures: one includes the core Lower Zakum field, a second comprises the Umm Shaif and Nasr fields and a third contains the Satah al-Ras Boot (Sarb) and Umm Lulu fields. Adnoc will retain a 60% share in each of them. At the time of writing, it had awarded a 10% share in Lower Zakum to an Indian consortium led by Oil and Natural Gas Corp (ONGC). The 40-year deal, secured by a signing bonus of USD 600 mn, marks India’s entry into the UAE’s upstream. The same fee was paid by Inpex, which also signed up for a 10% share of Lower Zakum. Cepsa meanwhile paid a fee of USD 1.5 bn for a 20% stake in the Sarb and Umm Lulu fields.
For its onshore sector, Abu Dhabi reworked commercial terms to line up foreign partners for a 40% share of the concession that produces flagship Murban crude. Total and BP both hold 10% of Adnoc Onshore, with South Korea's GS, Inpex, CNPC and CEFC China Energy securing minority stakes. Adnoc has meanwhile awarded an engineering, procurement and construction contract to China Petroleum Engineering & Construction Corp to lift capacity at the onshore Bab field to 450 kb/d by 2020 from around 420 kb/d now. Adnoc Onshore currently pumps around 1.6 mb/d and the official target is 1.8 mb/d by 2018.
Iran is also expected to post solid growth, with capacity rising 330 kb/d over the forecast period to 4.13 mb/d. Expanding beyond the 4 mb/d mark, likely to be hit in 2021, will need foreign capital and
0.00.61.21.82.43.03.64.24.85.4
2012 2014 2016 2018 2020 2022
mb/d
Actual production Capacity
0.00.40.81.21.62.02.42.83.23.6
2012 2014 2016 2018 2020 2022
mb/d

SUPPLY
70 OIL MARKET REPORT 2018
technology, which may be hard to drum up given ongoing uncertainty over US-Iran relations. Boosting the West Karun oil fields of Azadegan, Yadavaran and Yaran, which straddle the border with Iraq, is a top priority. Their development, along with the rehabilitation of older fields, is vital to sustaining output of 4 mb/d. Target output for West Karun is 1 mb/d versus current flows of some 300 kb/d.
The investment and political landscape will be critical in determining growth over the medium term. To that end, the National Iranian Oil Co is striving to secure upstream contracts with IOCs in 2018 under its new Iran Petroleum Contract (IPC). Some companies appear willing to sign preliminary deals regardless of concerns over US policy, which also bars US companies from Iran. Total was the first to strike a deal, signing up last July for phase 11 of the South Pars gas field, but has yet to make a final investment decision on the USD 4.8 bn project amid uncertainty over US sanctions policy.
Politics aside, much will depend on commercial terms. Iran’s low-cost reserves are very attractive but corporate belt-tightening means IOCs will be tough negotiators when it comes to the 20-year IPC, an improvement on the unpopular buy-back model, which compensated foreign firms with production. The Azadegan oil field is tipped to be the first off the block. International and Iranian companies are seeking to form consortia to bid for a project to ramp up output at the field to around 650 kb/d.
Iran expands Figure 2.33 Saudi sustains spare capacity Figure 2.34
Saudi Arabia, the world’s only producer with substantial spare capacity (roughly 2.2 mb/d), is spending billions to sustain capacity which hovers around 12.3 mb/d in our forecast. The long-standing goal has been to stabilise, rather than boost, capacity while tapping non-associated and unconventional gas reserves. Over the next 10 years, Saudi Aramco plans to spend USD 130 bn on drilling and well services, nearly USD 80 bn to maintain capacity and USD 20 bn on natural gas.
On the capacity front, it is pressing ahead with plans to raise output from offshore oil fields by more than 1 mb/d by 2023 to compensate for declining onshore production. These projects have to get on the drawing board soon to ensure that capacity is maintained. Deals are in the works to boost production in the Marjan, Zuluf and Berri fields. Marjan output is due to be raised by 300 kb/d and Zuluf by up to 600 kb/d. The two fields, which pump Arab Medium, now have combined capacity of about 1.2 mb/d. The Arab Extra Light-producing Berri field, capable of pumping up to 300 kb/d currently, is to be expanded by 250 kb/d.
Onshore, Saudi Aramco is continuing to fund the USD 3 bn Khurais expansion project, which ramps up in 2018. Some 300 kb/d of additional Arab Light will raise the field’s capacity to 1.5 mb/d. The
0.0
0.6
1.2
1.8
2.4
3.0
3.6
4.2
2012 2014 2016 2018 2020 2022
mb/d
Actual production Capacity
0.0
2.0
4.0
6.0
8.0
10.0
12.0
14.0
2012 2014 2016 2018 2020 2022
mb/d

SUPPLY
OIL MARKET REPORT 2018 71
new capacity, together with a robust drilling programme, will help make up for natural declines, including at Ghawar, the world’s biggest oil field.
Saudi Arabia intends to uphold its long-standing policy of maintaining spare capacity of 1.5-2.0 mb/d to be ready to respond to supply outages even if potential investors in the prospective Saudi Aramco initial public offering (IPO) might doubt its commercial merits. Our outlook for both Saudi Arabia and Kuwait assumes an end-2019 restart of the Neutral Zone oil fields shared between them. The Kingdom unilaterally closed the 300 kb/d, offshore Khafji field in October 2014, ostensibly for environmental reasons. Another joint development, the 150 kb/d onshore Wafra field, has been closed since May 2015 due to an investment dispute.
Kuwait is pressing on with investment in its crude oil capacity expansion despite the prolonged closure of the Neutral Zone. It plans to spend more than USD 100 bn over the next five years, mostly to develop its upstream oil and gas sectors. Growth of 170 kb/d during the forecast period is expected to lift production capacity to 3.11 mb/d and assumes a resolution to the Neutral Zone dispute towards the end of 2019. The northern Ratqa oil field near the border with Iraq is essential to raising capacity.
To tap its geologically complex reserves, Kuwait is seeking out IOCs for their technology and project management skills. Shell secured a deal to help double output at Ratqa from 60 kb/d and then boost it to an eventual target of 270 kb/d. It also won a deal for a water management project at onshore oil fields, which is intended to lift production. BP won a contract to develop the giant Burgan field which may have the potential to produce 2 mb/d from current levels of roughly 1.8 mb/d. For decades, Kuwait has struggled to develop upstream projects because its parliament has been critical of foreign involvement in upstream projects.
Qatar’s production capacity holds steady at 640 kb/d to 2023. Since June 2017, it has been subject to an economic embargo imposed by Saudi Arabia, the UAE, Bahrain and Egypt but there has been no major impact on its upstream industry or exports outside the region. Crude oil output has been in decline since hitting a peak of 860 kb/d in 2008 and sank as low as 580 kb/d in September 2017. To help keep up production, Total plans to invest more than USD 2 bn into the offshore al-Shaheen oil field that currently produces 280 kb/d, roughly half of Qatar’s crude production. The main priority is to arrest natural declines and return output to the previous 300 kb/d level.
Total took over operatorship of the field in July 2017 under a 25-year contract. It has a 30% stake in the new North Oil Co joint-venture, in which Qatar Petroleum holds the remaining 70%. The terms of the new al-Shaheen contract will set the framework for the tender process for the 100 kb/d Idd al-Shargi field, operated by Occidental and due to expire in 2019. Total also operates the 25 kb/d offshore al-Khaleej field. ExxonMobil, ConocoPhillips and Shell are also active in Qatar. Development of Qatari oil fields can be particularly expensive due to their complex geology, yet a multi-billion dollar plan to double the 40 kb/d offshore Bul Hanine field is advancing.

SUPPLY
72 OIL MARKET REPORT 2018
Downward spiral in Venezuela
Venezuela’s escalating crisis is expected to take a heavy toll on capacity, which is forecast to tumble by 650 kb/d to just 1.1 mb/d, the lowest since the 1940s. Political and economic volatility is such that forecasting is extremely difficult and our projected decline could be an under-estimate given the alarming deterioration of the oil sector. On the other hand, it could prove too aggressive should Petroleos de Venezuela (PDVSA) defy expectations and revive output.
Map 2.1 Venezuelan oil sector
Given Venezuela’s staggering debt and the structural damage to its oil network, however, the situation is far more likely to deteriorate. Output losses are thus apt to accelerate from the 270 kb/d fall in 2017. Our forecast shows capacity crashing by the end of this year to 1.38 mb/d, the lowest since 1950, and flirting with 1 mb/d later in the forecast period before, possibly, edging back up. The cash crunch at PDVSA and poor reservoir management have already cut output by 20% over the past two years. US financial sanctions are also making it tougher for PDVSA to operate.

SUPPLY
OIL MARKET REPORT 2018 73
President Nicolas Maduro aims to rescue the oil industry by militarising it and PDVSA’s new chief, Major General Manuel Quevedo, has been tasked with raising output by 1 mb/d. With thousands of skilled workers fleeing PDVSA and oil service companies owed billions, he faces a monumental challenge. The company is over USD 65 bn in debt, excluding oil-backed loans of USD 25 bn owed mostly to China and Russia. That makes it ever more difficult to pay for goods and services to operate, to repay foreign investors and to import diluent to process extra heavy Orinoco oil.
Despite sitting on the world’s biggest reserves, Venezuelan output has in fact been trending lower for more than a decade. Flows peaked at nearly 3.4 mb/d in 1998, just before Hugo Chavez came to power, and today, 20 years later, output is about half this level. Older fields have suffered the most and some Venezuelan officials estimate natural oil field depletion rates to be in excess of 20%. Even in the Orinoco Belt, where foreign investment has played a major role, output has begun to slip due to a lack of light crude for blending and reduced foreign investment. PDVSA still aims to increase Orinoco output, which now accounts for roughly 50% of production, to counter losses elsewhere.
Venezuela’s story of decline Figure 2.35 Angola: Past its prime Figure 2.36
Angola drags on Africa
Angola is expected to post the biggest slide in capacity after Venezuela as ageing oil fields lose steam and foreign investors, faced with relatively uncompetitive prospects, lose enthusiasm. Capacity is expected to fall 370 kb/d to 1.29 mb/d over the six-year period. Angola’s deep-water oil fields require continuous support and since output peaked at nearly 1.9 mb/d in 2008, it has been a struggle to arrest declines as costly projects were delayed or abandoned. Additional barrels from the end-2016 start-up of Chevron’s Mafumeira Sul and Eni’s East Hub project, online in early 2017, have been offset by sliding output at mature fields.
Capacity should, however, get a small bounce in 2018 after the ramp up of Total’s USD 16 bn Kaombo project, the last to be sanctioned before the post-2014 oil price fall. Sonangol adjusted the terms of the production-sharing contract in response to lower oil prices and construction costs. First oil is expected this year and, at its peak, the ultra-deep-water field is expected to pump 230 kb/d. Angola is almost entirely dependent on oil to power its economy and in November 2017 the new president, Joao Lourenco, installed new management at Sonangol as part of a bid to revive foreign investment.
0.0
0.4
0.8
1.2
1.6
2.0
2.4
2012 2014 2016 2018 2020 2022
mb/d
Actual production Capacity
0.0
0.3
0.6
0.9
1.2
1.5
1.8
2012 2014 2016 2018 2020 2022
mb/d

SUPPLY
74 OIL MARKET REPORT 2018
In Nigeria, a lull in deep-water investment projects is expected to see capacity rise by a mere 50 kb/d over the forecast period to 1.75 mb/d. A let-up in militant attacks has at least allowed oil output to rebound from 30-year lows of just over 1 mb/d in 2016. President Muhammadu Buhari has vowed to prevent renewed violence, but that may prove challenging during the volatile campaign period ahead of elections in 2019. The biggest project on the drawing board during the forecast period is the 220 kb/d offshore, deep water Egina, which Total is expected to start up later this year. Long stalled deep water projects such as Shell's Bonga Southwest Aparo and Eni's Zabazaba may finally get the go-ahead in 2018.
Upstream spending has been on the decline in any case due to the long-running deadlock over the Petroleum Governance Bill, which aims to overhaul fiscal terms and lay the foundation for a new national oil company. The National Assembly passed the key legislation in early January and it awaits President Buhari’s signature. The bill divides the Nigerian National Petroleum Corp into National Petroleum, responsible for the state’s majority share in upstream joint ventures with IOCs, and Nigeria Petroleum Assets Management, which looks after offshore production sharing contracts.
Nigeria’s fragile recovery Figure 2.37 Libya’s tenuous comeback Figure 2.38
Libya saw an impressive production rebound in 2017 and there could be further modest gains over the next six years. Capacity is expected to rise gradually from 1 mb/d in 2017 to 1.24 mb/d by the end of 2023. Even this expansion will require a steady flow of capital from the central bank to cover infrastructure repairs as well as an end to the political turmoil that has rocked the country for years.
Situated in the southwest, Libya’s largest oil field, El Sharara, pumping close to capacity at around 300 kb/d, is crucial to sustaining and booting production. However, its flows remain vulnerable to protests by armed groups and security breaches. Also core to Libya’s recovery, is the Waha Oil Co, producing roughly 260 kb/d. Some of Waha's oil network and fields, located in the Sirte basin in the northeast, have suffered extensive damage from militant attacks. A joint venture between Libya's National Oil Corp and Hess, Marathon and ConocoPhillips operates the Waha, Samah, Dahra and Giaolo fields. Its oil is shipped via the Es Sider terminal, which resumed operations in late 2016 after an armed group that was blockading the port was forced out. Most of the terminal’s storage facilities were still out of use in early 2018.
Libya’s sustainable capacity in the medium term is unlikely to come close to the 1.6 mb/d that was achieved prior to the 2011 overthrow of Muammar Gaddafi. The wider threat to the oil sector comes from a simmering feud between competing institutions and rival groups based in the east and west of the country.
0.0
0.4
0.8
1.2
1.6
2.0
2.4
2012 2014 2016 2018 2020 2022
mb/d
Actual production Capacity
0.0
0.2
0.4
0.6
0.8
1.0
1.2
1.4
2012 2014 2016 2018 2020 2022
mb/d

SUPPLY
OIL MARKET REPORT 2018 75
Algeria is striving to put the brakes on oil field declines and manage a sharp fall in revenue. Crude output has been heading downward since peaking at 1.4 mb/d in 2007 and in 2017 capacity was 1.1 mb/d. This is expected to fall further to 1 mb/d during the forecast period, but Sonatrach is working to stem losses at mature fields such as Hassi Messaoud, its largest producer. It has also agreed with Cepsa to spend USD 1.2 bn to boost output from 11 kb/d to 24 kb/d at Rhourde el Krouf, which lies 320 km southeast of Hassi Messaoud.
Algeria has struggled for years to lure investors into its upstream sector, with many foreign executives complaining of contracts that leave skimpy profits and grumbling about crippling bureaucracy. A fourth upstream licensing round in 2014 was a complete dud. Internal issues at Sonatrach have not helped: the company has had five chief executives in five years.
Production capacity in Gabon is expected to slip to 200 kb/d by 2023, continuing a steady decline from a peak of just under 400 kb/d two decades ago. The lower price environment led long-standing investors Shell and Total to sell down their assets in mature oil fields. Having sold off its entire onshore portfolio, Shell, involved in Gabon for more than 50 years, reportedly is considering farming down its offshore position as part of its global divestment drive.
Crude oil output in Equatorial Guinea, OPEC’s most recent recruit in 2017, is on a downward slope from a 2004 peak above 300 kb/d. Capacity is expected to ease to 110 kb/d by the end of 2023, with most of its producing fields in decline. However, additional upstream investment is expected from recently awarded exploration acreage. ExxonMobil, which operates the offshore Zafiro field, the country’s largest, has made a discovery though it is unclear whether it will lead to commercial development. The find is in the EG-6 block, which is where Zafiro is located.
Capacity in Ecuador is set to edge up during the six-year period to 560 kb/d, with the Ishpingo-Tambococha-Tiputini (ITT) block in the Amazon rain forest providing the gains. Output from ITT, which started up in late 2016, is about 60 kb/d. Located in a UNESCO world biosphere reserve, the heavy crude producing block holds about 20% of Ecuador’s total reserves of 8 billion barrels.
The low oil price environment and a crippling earthquake in 2016 have left Ecuador battling a large fiscal deficit and it is seeking to boost output and revenue as swiftly as possible. To that end, the government of President Lenin Moreno, which took office in May 2017, may seek to woo private investors by re-instating production sharing contracts (PSCs) and scheduling licensing rounds. Output has languished since 2010 when former President Rafael Correa ripped up PSCs, pushing some foreign investors to exit and forcing those who remained into service deals that paid a per-barrel fee. Some production support could also be offered from 10-year service contracts that Petroamazonas has awarded for small onshore fields in the northeastern provinces.
Iran drives OPEC gas liquids supply Production of condensate, other natural gas liquids and non-conventional resources is expected to increase by 450 kb/d to 7.3 mb/d by 2023 as Middle East OPEC countries make natural gas development a top priority.
Iran dominates the growth as it develops the giant South Pars gas field to meet rising demand and boost exports. It already has lined up one contract with a foreign investor: an initial deal with Total for phase 11 of the offshore field that is geologically linked to Qatar’s North Field. Iranian condensate and NGL production is expected to reach 1.15 mb/d by 2023, growing by 240 kb/d over

SUPPLY
76 OIL MARKET REPORT 2018
the forecast period. Long-stalled projects at South Pars are being fast-tracked thanks to greater access to cash and technology, though a significant portion of the volume is likely to be dedicated for internal use, including petrochemicals.
The expansion of South Pars, which has 24 phases, had been set back by international sanctions. Iran is striving to catch up with Qatar, the world’s largest LNG exporter, and last year saw the start-up of phases 20-21. Target condensate production from each project is around 75 kb/d, with an additional 30 kb/d of NGLs. Tehran hopes to bring on phases 22-24 in the near term.
Qatari condensate, natural gas liquids and non-conventional output – mostly from the North Field – is due to increase by 70 kb/d to just above 1.3 mb/d by 2023. In a surprise announcement, Qatar Petroleum said in April 2017 that it would lift its 12-year ban on development of the North Field, the world’s largest gas field that it shares with Iran, where it is known as South Pars. Production of some 0.06 billion cubic metres (bcm) per day of LNG will come from a new project in the southern sector. Qatar imposed the moratorium in 2005 to study the impact of a rise in North Field output from nearly zero in the 1990s to more than 0.6 bcm per day. The new project, expected to come online in five to seven years, would boost North Field output by around 10% and add about 400 kboe/d.
Saudi Arabia, OPEC’s largest gas liquids producer, is expected to boost output by 48 kb/d to 1.97 mb/d by 2023, supported by the Shaybah NGL development and Wasit gas project. Iraq plans to boost exports of LPG and condensates as it gathers more of the fuels from its southern fields.
Estimated OPEC condensate and NGL production (kb/d) Table 2.5
2017 2018 2019 2020 2021 2022 2023 2017-23
Algeria 483 481 475 467 459 451 450 -33
Angola 95 96 95 93 94 95 93 -3
Equatorial Guinea 86 86 85 85 85 84 84 -2
Iran 908 975 1 046 1 079 1 119 1 134 1 152 244
Iraq 95 100 105 115 125 135 145 50
Kuwait 307 305 303 310 320 328 328 21
Libya 45 55 65 70 70 75 75 30
Nigeria 458 463 469 475 475 475 480 22
Qatar 1 242 1 252 1 256 1 255 1 256 1 285 1 312 70
Saudi Arabia 1 924 1 925 1 963 1 971 1 970 1 971 1 972 48
UAE 837 836 847 847 852 862 867 30
Venezuela 167 135 122 115 112 110 110 -57
Total NGLs* 6 648 6 707 6 831 6 881 6 938 7 005 7 067 419
Non-Conventional** 224 253 254 253 253 253 256 32
Total OPEC 6 872 6 961 7 085 7 134 7 191 7 258 7 323 452 * Includes ethane ** Includes gas-to-liquids (GTLs).

SUPPLY
OIL MARKET REPORT 2018 77
Global biofuel supply Global conventional biofuels production in 2017 was 2.4 mb/d, representing 2% growth on 2016. The five-year forecast is similar to that published in the IEA’s Oil Market Report 2017, with average annual production growth of just under 3% and output expected to reach 2.8 mb/d by 2023. Growth primarily occurs in non-OECD countries, and mainly in Latin America and Asia. Conventional biofuels output is anticipated to reduce slightly post-2020 in the European Union (EU) due to a less favourable policy landscape, although at the time of writing we await details of the updated renewable energy directive (RED).
Within the forecast, 64% of conventional biofuels growth will come from fuel ethanol and the remainder from biodiesel and hydrotreated vegetable oil (HVO). World fuel ethanol production in 2017 grew by 2.5% to 1.79 mb/d and over the forecast period average annual growth of 2.3% will see production reach just over 2 mb/d. In 2023, Brazil and the US will retain domination of the global fuel ethanol market, accounting for 80% of output. Biodiesel and HVO production was relatively stable in 2017 versus 2016 levels, with 630 kb/d of output. Over the next five years, average annual growth of around 3.5% is anticipated, with production reaching 780 kb/d in 2023. HVO, also known as renewable diesel, is anticipated to play an increasingly prominent role in global biofuel production, and in 2017 already accounted for just under 15% of global combined HVO and biodiesel production.
Ethanol (left) and biodiesel (right) production 2009-23 Figure 2.39
Notes: Biodiesel production includes HVO; RoW = rest of world.
In 2017, international biofuel trade was subject to import tariffs and anti-dumping duties in several markets. These included China’s application of a tariff on fuel ethanol that saw imports from the US fall dramatically, while Brazil introduced a 600 million litres annual import quota for ethanol, above which levies are applied. In relation to biodiesel, the US established anti-dumping duties on imports from Indonesia and Argentina. Conversely, EU anti-dumping duties on Argentinian biodiesel were revised down in September 2017, with exports to Europe swiftly recommencing.
Novel advanced biofuels from non-food crop feedstocks are still in the development phase and output is low. Supply is set to reach an annual level of 30-50 kb/d by 2023 as further development is required to cut investment and production costs. Positive developments for the advanced biofuel sector include 20 member countries of the Biofuture Platform releasing a declaration for a significant rise in the share of sustainable, low carbon biofuels as a percentage of transport fuels.
0 200 400 600 800
1 0001 2001 4001 6001 8002 0002 200
2009 2011 2013 2015 2017 2019 2021 2023
kb/d
United States Brazil OECD Europe China Indonesia Argentina RoW
0
200
400
600
800
1 000
2009 2011 2013 2015 2017 2019 2021 2023

SUPPLY
78 OIL MARKET REPORT 2018
The vast majority of biofuels consumption remains within road transport, mainly in passenger light duty vehicles. Although in excess of 100,000 flights have been undertaken using biofuel blends, a combination of higher biojet fuel production, regional fuel supply chain development, and reduced cost premiums over conventional jet fuels are needed to grow aviation biofuel consumption.
Key ethanol market developments In the US, ethanol output rose by almost 3% to 1 025 kb/d in 2017. Growth was supported by an abundant corn crop and high capacity utilisation at ethanol facilities. Over the next five years, supply is forecast to hold at just over 1 mb/d due to limited investment in new capacity, reaching the allowable limit for corn ethanol in the Renewable Fuel Standard (RFS2) and a stabilisation and then reduction of gasoline demand from increasing fuel efficiency in the vehicle fleet. However, Corporate Average Fuel Economy (CAFE) standards are under review and may be changed in 2018.
Renewable fuel volumes within the RFS2 programme have only been established until 2022, placing uncertainty over forecast biofuel production in 2023. To support industry expansion, further consumption of higher ethanol blends than E104 will be needed. Increased ethanol exports will also be necessary, with India, Japan and the Philippines potential key markets. The increase in the permissible ethanol blend in Mexico to E10 should also open the door to increased US exports, as could the anticipated expiry of anti-dumping duties on US ethanol in the EU during 2018.
Ethanol output in Brazil contracted slightly in 2017 to 475 kb/d, although lower international sugar prices in the second half of 2017 increased the relative profitability of ethanol production compared to the sweetener. Ethanol price competitiveness at the pump was also supported during the year from reduced PIS/COFINS5 taxation on fuel ethanol compared to gasoline. Long term drivers for fuel ethanol in Brazil remain strong and production is anticipated to increase to around 630 kb/d by 2023, representing an annual average growth rate of just under 5%.
To support Brazil’s nationally determined contribution (NDC) objective to increase the share of sustainable biofuels in its energy mix to 18%, the country’s flagship biofuels policy, ‘RenovaBio’, has been signed into law. This provides a framework to establish annual national emissions reduction targets for fuel supply applicable to distributors and a tradable credit system. The issue of credits for biofuels production based on emissions reduction potential verses fossil fuels is anticipated to provide a supportive framework for further capacity investment. This is mainly anticipated from the expansion of existing sugar mills over the first half of the forecast, complemented by greenfield investment post-2020. Ongoing growth in the share of flexible fuel vehicles (FFVs) in the vehicle fleet, which has already surpassed 70%, represents another opportunity for fuel ethanol.
In China, the world’s third largest fuel ethanol producer, output increased by 17% to 53 kb/d in 2017. Production is forecast to reach around 80 kb/d in 2020, broadly in line with the 13th Five-Year Plan target of 4 million tonnes (around 85 kb/d), and then continue to grow to around 115 kb/d by the end of the forecast period. Ethanol has been designated a national strategic emerging industry and plans to roll out E10 blends of fuel ethanol nationwide by 2020 were announced in autumn 2017. If fully implemented, this would result in a significant increase in demand to over 300 kb/d. As a consequence, a number of new large-scale ethanol plants are already in development, with the focus on the northeast of the country. While the production outlook is 4 Gasoline blended with 10% fuel ethanol by volume. 5 Contribution for Intervention in Economic Domain, Contribution to the Social Integration Programme and Contribution for Financing Social Security.

SUPPLY
OIL MARKET REPORT 2018 79
revised up, it is anticipated that domestic output would fall short of levels required to meet fully E10 demand nationwide within the forecast period, especially in the context of average annual growth in gasoline demand of 2%.
Key biodiesel and HVO market developments Biodiesel production increased 3% y-o-y in the US, reaching 105 kb/d in 2017. Output in 2018 is set to rise further, supported by a strong soybean harvest. However, the USD 1/gallon blenders’ tax credit expired at the end of 2017 and has yet to be re-instated, lowering the profitability of biodiesel production. Output is expected to rise to 135 kb/d by 2023, even considering stagnant diesel consumption. Growth is underpinned by demand from biomass-based diesel, advanced biofuel and total renewable fuels categories within the RFS2. However, as previously stated, visibility is only available on renewable fuel volumes until 2022. In addition, the aforementioned anti-dumping duties on biodiesel imports from Indonesia and Argentina should boost domestic biodiesel output, although the potential exists to partly offset these with higher cost imports from other locations.
Biodiesel production in Brazil reached a record 70 kb/d in 2017 – growth of almost 7% y-o-y. An increase in the biodiesel blending mandate to 10% has been brought forward by one year to March 2018. Average annual production growth of around 6% is forecast over 2017-23 with output scaling-up to around 100 kb/d, although growth under the mandate is slightly constrained by low diesel demand growth of 1% per year over the forecast period. Higher output should go some way towards reducing current biodiesel plant overcapacity. The potential exists of an increase to a 15% mandate within the forecast period, but this depends on industry testing and is not included in the forecast.
OECD Europe biodiesel output held steady at just under 240 kb/d in 2017. France and Germany combined accounted for over 40% of output. In 2018, higher biofuel quotas in Finland, Italy, Poland, Spain and the Netherlands should support market prospects for biodiesel and HVO. However, a projected reduction of 6% in diesel consumption over 2017-23 undermines mandated demand growth. The resumption of biodiesel imports from Argentina is anticipated to dampen output of the least competitive European biodiesel. However, tariffs on imports from Indonesia remain in place.
Biodiesel and HVO production is anticipated to rise to around 270 kb/d in 2020, in accordance with the need to satisfy the national targets for 10% of renewable energy in transport under the RED. Post 2020, production is anticipated to scale down to 230 kb/d in 2023 as no support is anticipated for conventional biofuels under European Commission state aid rules. Furthermore, while the details of the revised RED for the 2020-30 period are still in development, a reduced contribution of crop-based biofuels towards EU renewable energy targets is anticipated within the forecast. However, market prospects for waste and residue feedstock biodiesel and HVO are expected to remain robust.
Biodiesel production in Argentina remained stable at 50 kb/d in 2017, with more than half destined for export. The principal market was the US; however, future exports are expected to be relatively low-level while the aforementioned anti-dumping duties remain in place. Conversely, the EU’s reduction of biodiesel import tariffs in September 2017 resulted in an immediate upturn in exports to Europe. Nevertheless, questions remain about conventional biofuel demand in the EU post 2020. Consequently, a combination of US anti-dumping duties and the potential for reduced

SUPPLY
80 OIL MARKET REPORT 2018
export prospects to Europe post-2020 means a contraction in biodiesel production to just under 40 kb/d is anticipated by 2023. Average annual diesel demand growth approaching 2% should support some increased domestic demand as a result of the 10% mandate.
REFINING AND TRADE
OIL MARKET REPORT 2018 81
3. REFINING AND TRADE
Highlights • Most of the refined product stocks surplus accumulated since 2013 has been absorbed in
2016-17, firming up near-term prospects for the refiners. However, over the next six years, they will continue losing market share to non-refined alternatives. Out of 6.9 million barrels a day (mb/d) of total demand growth in 2017-23, refiners will only see 4.8 mb/d of incremental demand. Natural gas liquids fractionation products, such as ethane, liquefied petroleum gases (LPG) and naphtha, pose a bigger threat to the refiners’ market share than electric vehicles and gas-powered transportation combined.
• Nevertheless, global refining capacity is set to grow at a faster rate than refined products demand. The Middle East takes the lead with 2 mb/d of additions to 2023, while Chinese and Indian capacity expansions slow. More countries in South East Asia are building new refineries. The Atlantic Basin refining capacity is in a rare growth spurt with Africa bringing online a variety of projects, expansions in North America and a new refinery in Europe. This supports further throughput growth, despite continued underperformance in Latin America.
• It is East of Suez, though, that leads in incremental intake, processing 4.4 mb/d more in 2023. The People’s Republic of China (hereafter referred to as “China”) and the Middle East see the highest growth. The East of Suez region switched to net crude oil deficit in 2017, which will grow to almost 4 mb/d by 2023 and require more Atlantic Basin barrels.
• The United States (US), Canada, Brazil and Norway are the largest suppliers of extra crude oil during the 2018-23 period. The US will take all of the incremental Canadian barrels, but its refiners will not be able to fully absorb the second wave of light tight oil (LTO) growth. Instead, most of the incremental LTO will be exported: to Europe, replacing lost volumes of African light grades, and to Asia, to feed the demand for petrochemical feedstocks.
• Prospects for US LTO will also see a boost from the International Maritime Organisation’s (IMO) marine bunker specification change in 2020, which will drive refinery appetite for low sulphur crudes. This also leads to higher demand for gasoil-type products, further exacerbating the European middle distillate shortage, which grows by a third to 2 mb/d, while fuel oil inter-regional trade declines. LPG and ethane trade volumes increase further.
Setting the stage The global refining sector embarks on the period to 2023 with a clean slate. The refined product surplus that piled up in 2014-15 was absorbed by the end of 2017. While refinery runs picked up strongly in 2017 – growing by 1 mb/d versus 0.4 mb/d in 2016 – this was not enough to meet demand for refined products. At the same time, refining margins saw strong headwinds from crude prices that rose on an annual basis for the first time since 2012. The overhang of crude stocks, measured against end-2013 levels, reached a peak of 730 million barrels (mb) in early 2017, but fell sharply during the year. Excluding Chinese stock building, which accounted for most of the surplus, end-2017 global crude stocks were just 80 mb higher than end-2013 levels, equivalent to 25 days of cover for incremental refinery throughput.
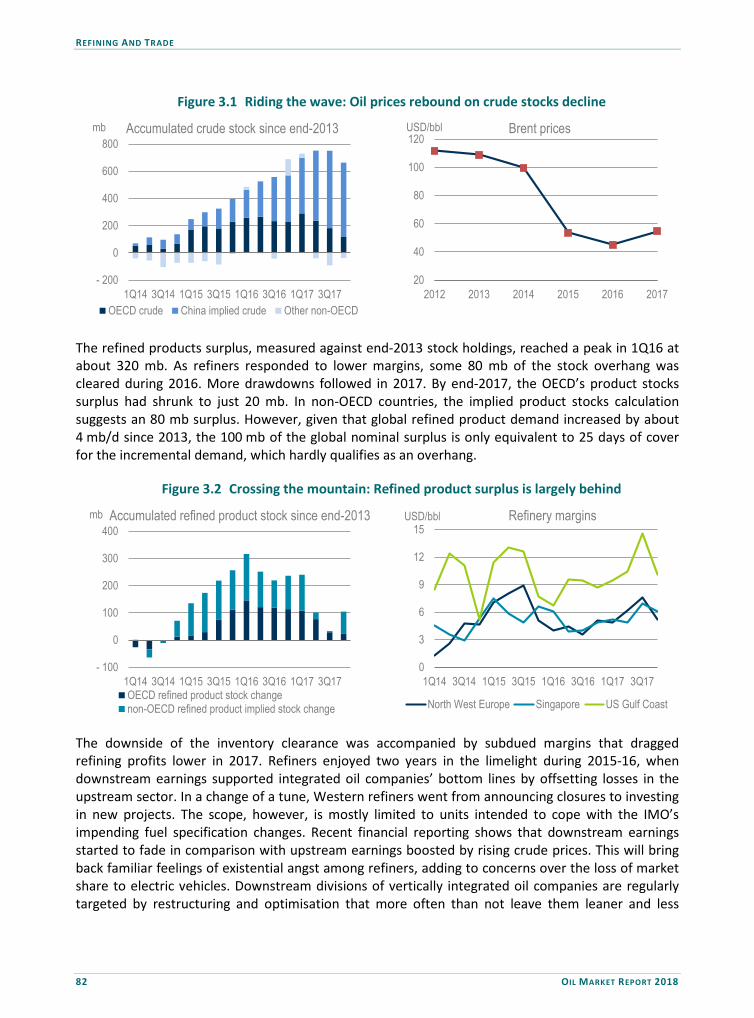
REFINING AND TRADE
82 OIL MARKET REPORT 2018
Figure 3.1 Riding the wave: Oil prices rebound on crude stocks decline
The refined products surplus, measured against end-2013 stock holdings, reached a peak in 1Q16 at about 320 mb. As refiners responded to lower margins, some 80 mb of the stock overhang was cleared during 2016. More drawdowns followed in 2017. By end-2017, the OECD’s product stocks surplus had shrunk to just 20 mb. In non-OECD countries, the implied product stocks calculation suggests an 80 mb surplus. However, given that global refined product demand increased by about 4 mb/d since 2013, the 100 mb of the global nominal surplus is only equivalent to 25 days of cover for the incremental demand, which hardly qualifies as an overhang.
Figure 3.2 Crossing the mountain: Refined product surplus is largely behind
The downside of the inventory clearance was accompanied by subdued margins that dragged refining profits lower in 2017. Refiners enjoyed two years in the limelight during 2015-16, when downstream earnings supported integrated oil companies’ bottom lines by offsetting losses in the upstream sector. In a change of a tune, Western refiners went from announcing closures to investing in new projects. The scope, however, is mostly limited to units intended to cope with the IMO’s impending fuel specification changes. Recent financial reporting shows that downstream earnings started to fade in comparison with upstream earnings boosted by rising crude prices. This will bring back familiar feelings of existential angst among refiners, adding to concerns over the loss of market share to electric vehicles. Downstream divisions of vertically integrated oil companies are regularly targeted by restructuring and optimisation that more often than not leave them leaner and less
- 200
0
200
400
600
800
1Q14 3Q14 1Q15 3Q15 1Q16 3Q16 1Q17 3Q17
mb Accumulated crude stock since end-2013
OECD crude China implied crude Other non-OECD
20
40
60
80
100
120
2012 2013 2014 2015 2016 2017
USD/bbl Brent prices
- 100
0
100
200
300
400
1Q14 3Q14 1Q15 3Q15 1Q16 3Q16 1Q17 3Q17
mb Accumulated refined product stock since end-2013
OECD refined product stock changenon-OECD refined product implied stock change
0
3
6
9
12
15
1Q14 3Q14 1Q15 3Q15 1Q16 3Q16 1Q17 3Q17
USD/bbl Refinery margins
North West Europe Singapore US Gulf Coast

REFINING AND TRADE
OIL MARKET REPORT 2018 83
ambitious. With global refining capacity growth almost double the growth rate of demand for refined products, there will clearly be scope for further rationalisation.
Figure 3.3 Upstream vs downstream earnings
Notes: Combined earnings of BP, ExxonMobil, Shell, Total.
Existential angst
Our demand forecast to 2023 sees the substitution of about 500 thousand barrels a day (kb/d) of gasoline and diesel demand by alternative fuels, about as much as in the recent past. In both historical and forecast numbers it is Chinese developments that dominate. Electric vehicles are only the tip of the iceberg with far more substantial contributions coming from electric buses as well as LNG trucks and natural gas vehicles. Substitution has not been limited to the transport sector. In power generation, an estimated 450 kb/d of diesel and fuel oil demand has been lost to gas in the past few years. The rate of loss is expected to slow down, however, as the target for substitution will be crude oil used in the power sector, as opposed to refined products.
Figure 3.4 Major drivers of refined product demand substitution
- 10
20
50
80
110
140
2011 2012 2013 2014 2015 2016
USD/bln Annual earnings by segment
Upstream Downstream
0
3
6
9
12
15
18
21
1Q17 2Q17 3Q17 4Q17
USD/bln Quartely earnings by segment
Upstream Downstream
19%
17%
20%6%
38%
2011-17Gas and electricity in transport
Gas in powergen
Biofuels
CTL/GTL/additives
Natural gas liquids
53%
11%
14%
7%
15%
2017-23

REFINING AND TRADE
84 OIL MARKET REPORT 2018
Table 3.1 Total oil demand and call on refined products (mb/d)
2017 2018 2019 2020 2021 2022 2023 2017-23
Total liquids demand 97.8 99.2 100.4 101.5 102.6 103.7 104.7 6.9
of which biofuels 2.4 2.5 2.6 2.7 2.7 2.8 2.8 0.4
Total oil demand 95.4 96.7 97.8 98.8 99.9 101.0 101.9 6.5 of which CTL/GTL and additives 0.7 0.8 0.8 0.8 0.9 1.0 1.1 0.3
direct use of crude oil 1.1 1.0 1.0 1.0 1.0 0.9 1.1 0.1
Total oil product demand 93.6 94.9 96.0 97.0 98.1 99.1 99.7 6.2
of which fractionation products 9.7 9.9 10.1 10.3 10.5 10.8 11.1 1.4
Refinery products demand 83.8 85.0 85.9 86.7 87.6 88.3 88.6 4.8
Refinery market share 85.7% 85.7% 85.5% 85.4% 85.4% 85.1% 84.6% -1.1%
Refiners’ worries about their future market share are not exaggerated, but their main rival is not yet electric vehicles. Total demand for liquid fuels grows by 6.9 mb/d to 2023, slower than in the past six years. Of this, biofuels and products from coal-to-liquids and gas-to-liquids technologies account for about 0.7 mb/d, which is comparable to the past six years. Oil products from natural gas fractionation plants (ethane, LPG and naphtha), however, see a much faster growth to 2023 of 1.4 mb/d compared to 1 mb/d in 2011-17. These products go directly to end-users, bypassing refineries. This means that refined product demand slows to 4.8 mb/d, compared to 6.4 mb/d in 2011-17. Refiners collectively will lose 1% point from their market share, which drops to 84.6% in 2023.
Figure 3.5 Global liquid fuel supply structure in 2017 (mb/d)

REFINING AND TRADE
OIL MARKET REPORT 2018 85
Refining Outlook Our outlook for global refinery throughput and capacity additions is driven by our expectations of demand for refined products, not total oil demand growth. More often than not, our forecast for capacity additions exceeds global refined product demand growth for two reasons. First, countries with fast growing demand expand capacity to avoid a rising dependence on product imports. Second, crude exporting countries build capacity to diversify exports and gain exposure to refining margins.
Figure 3.6 Global refinery capacity net additions by region
Between 2018 and 2023 total net refinery capacity additions are expected to reach 7.7 mb/d. The Middle East (2 mb/d) replaces China (1.6 mb/d) at the top of the capacity growth league table, while Indian additions slow to just 0.6 mb/d. The rest of Asia combined adds 1.4 mb/d. Global unused crude distillation capacity is expected to increase by over 2 mb/d to just above 20 mb/d, unless further refinery shutdowns are announced.
Figure 3.7 Growing excess refining capacity
The expected volume of capacity additions not only surpasses total global oil demand growth, but is also 3 mb/d higher than the incremental “call on refineries”, discussed above. In fact, the gap between refinery capacity growth and refined product demand growth has never been so large in
-0.5
0.0
0.5
1.0
1.5
2.0
2017 2018 2019 2020 2021 2022 2023
mb/dNorth AmericaLatin AmericaEuropeFSUAfricaMiddle EastIndiaChinaOther AsiaWorld total
0
2
4
6
8
10
2006-11 2012-17 2018-23
mb/d Oil demand growth
2006-11 2012-17 2018-23
Refined product demand growth
2006-11 2012-17 2018-23
Refining capacity growth

REFINING AND TRADE
86 OIL MARKET REPORT 2018
recent history. In the previous six-year period, from 2012-17, capacity additions lagged behind refined product demand growth. A lull in 2016-17 saw only 0.6 mb/d of new capacity versus product demand growth of 2.3 mb/d.
Table 3.2 Regional developments in refining capacity and throughput
Total capacity (mb/d) Refinery throughput (mb/d) Utilisation rates
2017 2023 Change 2017 2023 Change 2017 2023 North America 22.5 23.1 0.6 19.1 19.6 0.5 85% 85%
Europe 15.1 15.3 0.2 13.2 12.7 -0.6 88% 83% FSU 8.6 9.1 0.5 6.6 6.6 -0.1 77% 72%
China 15.4 17.0 1.6 11.3 13.0 1.7 73% 76% India 4.8 5.4 0.6 5.0 5.4 0.5 103% 100%
Other Asia 13.9 15.3 1.4 12.0 12.5 0.4 87% 82% Middle East 9.0 11.0 2.0 7.4 9.1 1.7 82% 83%
Latin America 6.1 6.1 0.0 4.0 4.5 0.5 66% 74% Africa 3.4 4.1 0.8 1.9 2.7 0.8 57% 65%
World 98.7 106.4 7.7 80.6 86.0 5.4 82% 81%
Atlantic Basin 54.9 57.0 2.0 44.5 45.5 1.0 81% 80%
East of Suez 43.7 49.4 5.7 36.2 40.6 4.4 83% 82%
Towards the end of our forecast, total refining throughput East of Suez will cross the 40 mb/d threshold for the first time, ramping up by 4.4 mb/d from 2017 levels. With this, it will reduce the gap with the Atlantic Basin to 5 mb/d. In the rankings of global refining regions, the Middle East overtakes Northwest Europe to take the third place, and India leaps past Latin America and the Russian Federation (hereafter referred to as “Russia”) to move into the fifth position.
Figure 3.8 Top 10 refining regions by throughput (mb/d), 2023 vs 2013
Notes: NWE = Northwest Europe; LatAm = Latin America; Med = Mediterranean (Southern Europe with Turkey); SE Asia = Southeast Asia. Orange bubbles show the top five regions in 2013.
US15.3
China9.6 NWE
8.2Mid East
6.5LatAm
5.6 Russia India Med SE Asia Japan Korea
US16.9
China13.0
Mid East9.1
NWE 8.0
India5.5 Russia SE Asia LatAm Med Korea Japan

REFINING AND TRADE
OIL MARKET REPORT 2018 87
Atlantic Basin
The Atlantic Basin’s 2 mb/d of capacity additions to 2023 is dwarfed by the 5.7 mb/d expected East of Suez, but this is a striking change from the past. Until very recently, capacity was mostly declining due to closures in Europe and North America, partly offset by growth in other regions of the hemisphere. By the start of 2017, capacity was down to the same level as in 2007, but it is now set to grow with additions in Africa, the Former Soviet Union and North America. Europe will also see the launch of a new refinery in Turkey, possibly the last one to be built in this region.
Figure 3.9 Atlantic Basin vs East of Suez
For more than 40 years, refiners in the Atlantic Basin have routinely processed more than 40 mb/d, but it is not just inertia that will keep runs relatively high and growing by 1 mb/d. Countries in the Atlantic Basin collectively account for 60% of total global demand for premium transport fuels, some 37 mb/d, and are net importers from East of Suez, especially for diesel and kerosene. More than half of the already slowing demand growth to 2023 in the Atlantic Basin is expected to come from ethane use in the US petrochemical sector. Thus demand developments per se are not the main driver of higher throughput. Instead, refiners will strive to gain market share from product importers.
North America: United States drives the growth Refinery intake in the US reached a record high of 16.6 mb/d in 2017, with some months exceeding 17 mb/d and capacity utilisation rates reaching a remarkable 92%. Gulf Coast refiners contributed most to the increase and the region became the world’s largest exporter of refined products, sending out over 4 mb/d of diesel and gasoline to internal markets in the US Northeast and Midwest and to export markets in Latin America, Europe and Asia. Thanks to growing US crude output and increasing inflows of discounted Canadian crude oil, the Gulf Coast region will continue to drive US refining activity to new records and exports of refined products to fresh highs.
In our forecast, North American refinery intake initially grows on higher utilisation rates in the US and as a new refinery enters into operation in Canada in 2018. Later, more capacity is expected to come online in the US, including light crude processing units in Gulf Coast refineries and ExxonMobil’s 350 kb/d addition to its Beaumont refinery in 2023. Mexican throughput rates are expected to recover partly by 2023, but will not return to historical highs.
25
30
35
40
45
50
2007 2011 2015 2019 2023
mb/d
Atlantic Basin East of Suez
Refinery throughput
- 1
2
5
8
11
14
2007 2011 2015 2019 2023
mb/d
Atlantic Basin East of Suez
Cumulative change in refining capacity

REFINING AND TRADE
88 OIL MARKET REPORT 2018
Figure 3.10 US refining: The sky is the limit?
Latin America: The reluctant refiners Record high runs in the US are partly due to the continued under-performance in Latin America. Annual declines in refining activity that started in 2015, accelerated in 2017. Brazil, Mexico and Venezuela have seen combined throughput declines of 1.2 mb/d since 2014. While Venezuela’s extremely low capacity utilisation rate of about 40% is explained by the ongoing turmoil in its petroleum industry, declines in Mexico and Brazil are due to operational decision-making. Pemex revealed early in 2018 that despite refinery runs in 2017 falling to the lowest in decades, downstream financial results turned positive.
Figure 3.11 Latin American refining woes send imports soaring
Shrinking crude output has also been a factor. Combined crude oil output in Mexico and Venezuela declined by almost 1 mb/d from 2014-17 and was only partly offset by growth of 0.4 mb/d in Brazil’s supply. US Gulf Coast refiners were quick to capitalise on problems in this market, with the added benefit of the opening of Mexico’s fuel retail sector. US exports to these three countries more than doubled in two years. With continuing declines in crude oil supply in Mexico and Venezuela, and ongoing under-investment in their refineries, Latin American throughput in the next five years is expected to stay below 2015 levels. Capacity stays essentially flat but for a 35 kb/d expansion in Peru. However, throughput is expected to recover somewhat in Venezuela and Brazil, with higher utilisation rates elsewhere on the continent also contributing to total growth of 0.4 mb/d.
14
15
16
17
2005 2008 2011 2014 2017
mb/d United States refinery runs
0
1
2
3
4
5
2012 2013 2014 2015 2016 2017
mb/d USCG refined product exports
Overseas Domestic markets
-0.6
-0.4
-0.2
0.0
0.2
0.4
0.6
Mexico Venezuela Brazil
mb/d Change from 2014-17
Crude output Refinery intake
0.0
0.5
1.0
1.5
Jan-14 Sep-14 May-15 Jan-16 Sep-16 May-17
mb/d US product exports to Latin America

REFINING AND TRADE
OIL MARKET REPORT 2018 89
Europe: The second pillar of Atlantic refining Europe is another region that benefited from the increased import requirements of Latin America. After runs declined in 2016, European refiners increased throughput in 2017 to 13.2 mb/d, the highest level since 2010. Lower refining rates in North Africa also helped. With about 2 mb/d of capacity closed down since the mid-2000s, European refinery utilisation rates reached 88%, their highest since 2005. Nevertheless, it is difficult to remain optimistic about the future of the region’s refineries as new capacity comes online in the Atlantic Basin and European demand slows. Relatively high European utilisation rates are expected to continue into 2019 before trending lower due to a new 200 kb/d refinery coming online in Turkey and anticipated improvements in Latin American and Mexican throughput. Bunker fuel specification changes might also affect run rates at simple refineries.
Figure 3.12 Refining renaissance in Europe
Former Soviet Union (FSU) Several refineries in Russia and Kazakhstan and a plant in Belarus will expand capacity by a combined 400 kb/d, weighted towards the earlier years of our forecast period. In Azerbaijan, the crude distillation unit (CDU) complex at the country’s only operating refinery will be rebuilt with a small extension of original capacity. We have incorporated one greenfield refinery for this region, the 100 kb/d Jizzakh facility in Uzbekistan, due online in 2023. We do not expect large projects, e.g. Rosneft’s Far East Refinery, or Kazakhstan’s fourth refinery, to materialise in our forecast period. Rosneft has fallen behind the government-mandated schedule for upgrading its existing refineries and would need to intensify investment to catch up. Among the Russian majors, Rosneft’s refineries have the highest yields of fuel oil.
Overall, Russian refineries are expected to add over 600 kb/d of hydrocracker capacity and 300 kb/d of other conversion capacity to increase the yields of high-quality products. Additions are heavily diesel-oriented and concerns have risen recently about the gasoline supply. While Russia is the second-largest diesel exporter in the world, the domestic gasoline market periodically experiences shortages of on-spec product. On the other hand, Russian refiners are nervous about being dragged into the net of international sanctions. Most of the catalysts used in upgrading processes are imported from major western providers. While Russian companies have been investing in catalyst production, it will take many years to fully replace imports.
60%
65%
70%
75%
80%
85%
90%
-2.0
-1.5
-1.0
-0.5
0.0
0.5
2006 2008 2010 2012 2014 2016
mb/d European refinery utilisation rate
OECD Europe capacity change Utilisation rates
42
43
44
45
46
47
2005 2007 2009 2011 2013 2015 2017
mb/d Atlantic Basin refining throughput

REFINING AND TRADE
90 OIL MARKET REPORT 2018
Figure 3.13 Atlantic Basin refining throughput change by region
Africa Algeria’s Sonatrach is expected to bring online a new 100 kb/d refinery in Tiaret in 2023, while two other similar-sized projects will probably materialise later. Angola has reinforced its commitment to the Lobito refinery project that was officially shelved last year, but we have not included it in this forecast. Morocco’s Samir refinery is not expected to come back online in the absence of any positive developments in 2017. We have brought forward the start date of Nigeria’s Lekki project by one year to 2021. This project will be a major game changer for Africa’s refined product balances and will also reduce crude oil exports from Nigeria. Modular mini-refineries are also being discussed in Nigeria, but no project has reached a definitive stage.
East of Suez In the period to 2023, the largest volume of new capacity expected is in the Middle East, where the pace of expansion has accelerated. In contrast, the pace of expansion in China and India is moderating, even if temporarily. Several major refinery projects in both countries are excluded from this forecast due to likely delays from intended start-up dates.
Figure 3.14 CDU capacity net additions
-0.8
-0.4
0.0
0.4
0.8
1.2
2017 2018 2019 2020 2021 2022 2023
mb/d Europe
Former SovietUnion
North America
Latin America
Africa
0.0
0.5
1.0
1.5
2.0
2.5
3.0
2005-11 2011-17 2017-23
mb/d
China
India
Middle East

REFINING AND TRADE
OIL MARKET REPORT 2018 91
Middle East Saudi Arabia will effectively complete its mega-refinery series by bringing online the last one, the 400 kb/d Jazan complex in 2019. Saudi Aramco shut the 80 kb/d Jeddah refinery last year to optimise its domestic downstream business. With this, the company shifts its downstream expansion overseas, primarily targeting growing markets in Asia. Last year it intensified talks on co-investment in refineries in China, Indonesia and Malaysia as well as finalised the consolidation of the 600 kb/d Motiva plant in the US, a former joint-venture with Shell.
In terms of vertical integration, Saudi Aramco is behind the international majors, who typically refine more crude oil than they produce. Saudi Aramco’s crude processing volume is only about 30% of its crude oil production, even if its 3 mb/d throughput does put the company in the third spot in global rankings, on par with China National Petroleum Coroporation (CNPC) and Valero. Still, it has declared ambitions to double its refining capacity and increase crude throughput. If it manages to do so, Saudi Aramco will effectively become the world’s largest refiner, leapfrogging ExxonMobil and Sinopec. On the other hand, the company’s presence in the increasingly important petrochemical sector is currently limited to relatively small-scale specialty products. Having said that, Saudi Aramco and the Sabic petrochemical company signed an agreement to jointly construct a 400 kb/d crude-to-chemicals complex by 2025.
In neighbouring Bahrain, the rebuilding and expansion of the Manama refinery is expected to be completed by 2022. Meanwhile, Kuwait’s largest downstream expansion in recent history involves a 200 kb/d increase at Mina Abdullah, the new 615 kb/d Al-Zour plant and upgrades to increase the production of clean fuels. Kuwait Petroleum Co is also looking for overseas downstream opportunities. It recently received the green light for investment into Oman’s new Duqm project (due online in 2023) and is chasing projects in Asia.
Iran’s plans largely involve a series of condensate splitters with combined capacity of 350 kb/d that will use South Pars output as feedstock and the replacement of an old crude distillation unit at the Abadan refinery. Iraq has several major projects on the table, but we only expect the completion of the 140 kb/d Karbala facility before 2023, along with smaller expansion projects and the potential repair of the Baiji refinery. Plans in the United Arab Emirates (UAE) are less ambitious in terms of capacity expansion, with only a small unit planned for Jebel Ali. However, Adnoc is embarking on a major upgrade project to allow the Ruwais refinery to process sour crudes, freeing up low-sulphur Murban for exports. Overall, the Middle East will see the largest incremental crude throughput, adding some 1.8 mb/d of crude and condensate intake by 2023.
China China’s refining industry is undergoing a period of change as independent refiners are given more scope to expand their activity. As yet, they are not allowed to export refined products, but in the past three years, since they were granted licenses to directly import crude oil, the independents have been the driving force of the Chinese refining industry. In 2017, China accounted for half of the global refining throughput increase, more than any other country. Unlike previous years, when the growth in independent refining activity was partly offset by declines in the operations of the three Chinese majors, the latter returned to growth in 2017, as new capacity was brought online.
Refinery capacity expansion in China slowed abruptly in 2015 and 2016, but picked up in 2017 with CNPC’s Yunnan refinery and China National Offshore Oil Corporation’s (CNOOC) Huizhou unit coming online.
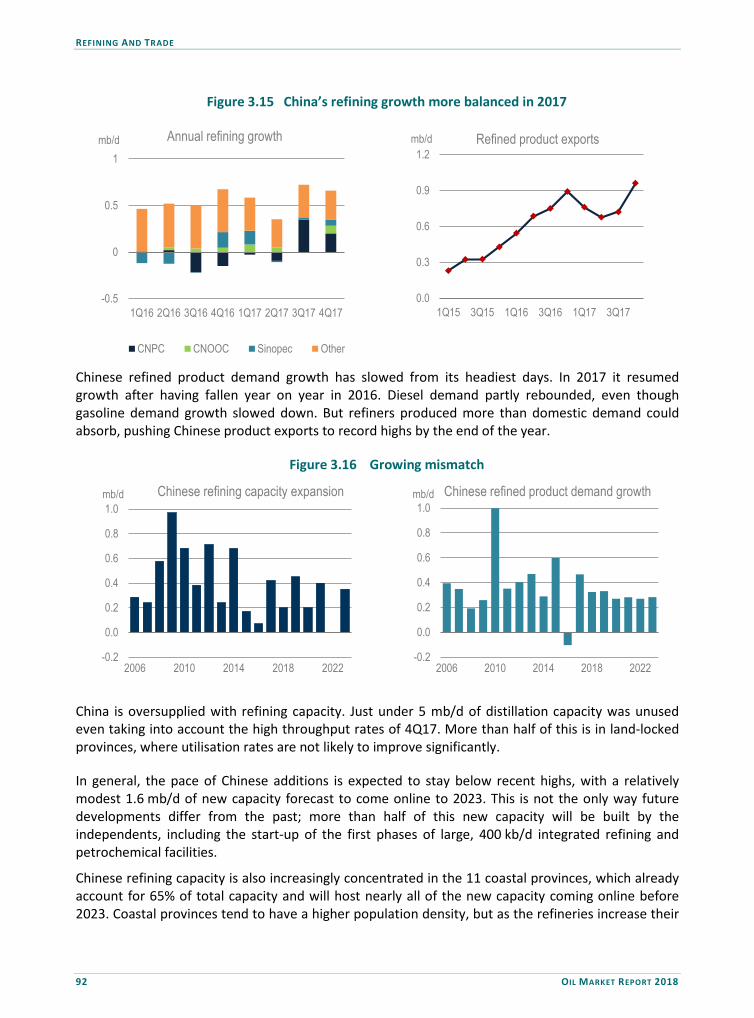
REFINING AND TRADE
92 OIL MARKET REPORT 2018
Figure 3.15 China’s refining growth more balanced in 2017
Chinese refined product demand growth has slowed from its headiest days. In 2017 it resumed growth after having fallen year on year in 2016. Diesel demand partly rebounded, even though gasoline demand growth slowed down. But refiners produced more than domestic demand could absorb, pushing Chinese product exports to record highs by the end of the year.
Figure 3.16 Growing mismatch
China is oversupplied with refining capacity. Just under 5 mb/d of distillation capacity was unused even taking into account the high throughput rates of 4Q17. More than half of this is in land-locked provinces, where utilisation rates are not likely to improve significantly.
In general, the pace of Chinese additions is expected to stay below recent highs, with a relatively modest 1.6 mb/d of new capacity forecast to come online to 2023. This is not the only way future developments differ from the past; more than half of this new capacity will be built by the independents, including the start-up of the first phases of large, 400 kb/d integrated refining and petrochemical facilities.
Chinese refining capacity is also increasingly concentrated in the 11 coastal provinces, which already account for 65% of total capacity and will host nearly all of the new capacity coming online before 2023. Coastal provinces tend to have a higher population density, but as the refineries increase their
-0.5
0
0.5
1
1Q16 2Q16 3Q16 4Q16 1Q17 2Q17 3Q17 4Q17
mb/d
CNPC CNOOC Sinopec Other
Annual refining growth
0.0
0.3
0.6
0.9
1.2
1Q15 3Q15 1Q16 3Q16 1Q17 3Q17
mb/d Refined product exports
-0.2
0.0
0.2
0.4
0.6
0.8
1.0
2006 2010 2014 2018 2022
mb/d Chinese refining capacity expansion
-0.2
0.0
0.2
0.4
0.6
0.8
1.0
2006 2010 2014 2018 2022
mb/d Chinese refined product demand growth

REFINING AND TRADE
OIL MARKET REPORT 2018 93
reliance on crude oil imports, coastal locations become an important factor in refining economics. At the same time, it provides better logistics for product exports.
The interplay between Chinese refiners, collectively, and their Asian competitors will be one of the most interesting developments to watch, particularly as our outlook shows Asia leading the world both in product demand growth and refining capacity growth. The domestic competition between China’s established major companies and the ambitious independent refiners adds yet another dimension to an intriguing picture. Independent refineries are currently allocated crude import quotas of 1.8 mb/d, but the number is likely to increase to accommodate new units.
While we do not know if full liberalisation of the Chinese refining industry and oil trade is possible within our forecast horizon, we see China sustaining higher refinery throughput and increasing product exports. The combination of current regulatory tools for managing the refining sector and trade developments – oil import quotas for the independent refiners and product export quotas for the majors – seems to have largely worked so far. With refining output growing by 1.7 mb/d, net product exports are expected to increase.
Figure 3.17 East of Suez refining throughput change by region
Other Asia Total capacity expansion at Indian refineries is expected to amount to 0.6 mb/d to 2023, but this marks a temporary slowdown compared to the recent past. Several major refineries have recently been proposed, including a 1 mb/d new complex in Rajasthan that might well go ahead after 2023. We have included more projects in Indonesia and Malaysia, following joint-venture agreements with Middle Eastern and Russian national oil companies (NOCs). Malaysia’s RAPID project, Indonesia’s Tuban greenfield project, and the Balikpapan extension, are among those benefitting from NOC interest. Viet Nam’s second refinery, Nghi Son, will come online this year, and the only other project forecast to materialise is an expansion at Dung Quat. Capacity expansion is also expected in Thailand and the Philippines, while construction of Brunei’s new refinery, a project led by Chinese chemicals company Hengyi Petrochemicals, is advancing. The company will use most of the output as feedstock for its Chinese manufacturing bases.
No new capacity is expected to come online in OECD Asia, but, at the same time, no more refinery closures have been announced in Japan or in Australia, the two countries that have seen a big reduction in capacity in the last decade (1.4 mb/d in Japan and 300 kb/d in Australia).
-0.8
-0.4
0.0
0.4
0.8
1.2
1.6
2.0
2017 2018 2019 2020 2021 2022 2023
mb/dChina
India
Southeast Asia
Middle East
Other Asia

REFINING AND TRADE
94 OIL MARKET REPORT 2018
In both hemispheres, the dynamics of refining capacity additions and refining intake growth point at increasing pressures on product cracks. A deterioration of refining margins could start another cycle of capacity closures and optimisation. This will particularly be the case for simple refineries with higher fuel oil yields, in light of the upcoming IMO marine fuel specification change.
The year 2020 problem: Implications of bunker fuel specification change
The impending marine bunker specification change, mandated by the IMO, will cap sulphur emissions from ocean-going vessels to 0.5%, starting from 2020. To comply with the new regulations, vessels will need either to use low-sulphur fuel for bunkers, or treat engine emissions with the help of onboard scrubbers to reduce the sulphur content in the exhaust.
Currently, the heavy oil residue from atmospheric distillation, combined with residual oil from secondary processing, is the main component of global international bunker fuels. Outside the emission control areas in Europe, North America, and China, the average sulphur content of the 3.2 mb/d of marine bunker fuel consumed is about 2.5%.
Effectively, bunker fuel is the last refuge for sulphur, which has been driven out of most other oil products. In OECD countries, the sulphur content of road fuels is capped at 10 parts per million (ppm) (0.001%). Higher sulphur limits for gasoil and gasoline, sometimes up to 0.7%, still persist in some countries in Asia and Africa, but many have announced plans to move to cleaner products for air pollution control reasons. The timeline for such plans largely coincides with the IMO specification change, which increases the demand for desulphurisation processes.
The weighted average sulphur content of global crude oil supply is currently estimated at about 1.3%. This means that almost all road fuels produced, and some other light products, have to be hydrotreated to some extent to meet even relatively relaxed fuel standards. Effectively, about 80% of sulphur contained in crude oil is currently removed from the final products through various processes, starting from atmospheric distillation and finishing by hydrotreatment or deeper conversion processes. To comply with tighter sulphur specifications for both marine bunkers and road fuels, refiners would need to remove more than 90% of the sulphur from final oil products.
Our refinery capacity database identifies a total of 67 mb/d of desulphurisation capacity worldwide. The gap between total refinery throughput (about 81 mb/d) and the desulphurisation capacity is explained not only by the production of high-sulphur fuel oil (HSFO), but also by the volumes of ultra-low sulphur crude oil used by the refineries (less than 0.25%), which yields low-sulphur products, requiring relatively little additional hydrotreatment. Only this type of crude oil can produce atmospheric residue meeting the 0.5% sulphur cap. However, conventional ultra-low sulphur crude production is in decline, having lost some 3 mb/d since 2010, and on course to lose another 0.5 mb/d by 2020. Usually, this type of crude oil is also lighter, with low residue yields. We estimate that only about 0.6 mb/d of straight-run 0.5% sulphur fuel oil will be available, a fraction of the required 3.2 mb/d to allow for a complete switch out of high-sulphur bunkers.
Other solutions will be required to fill the gap. Hydrofining fuel oil is a possibility, but volumes will depend on the amount of desulphurization capacity. Our forecast of refinery unit additions by 2020 shows a balanced desulphurisation-distillation ratio (almost 1:1), whereas a higher ratio would be needed for complete hydrofining of not just the incremental output, but of the existing levels too. While there has been a string of announcements of new secondary unit projects such as hydrocrackers, cokers, hydrotreaters and associated units to increase diesel yields and reduce heavy residues, their realistic start dates are mostly beyond 2020.

REFINING AND TRADE
OIL MARKET REPORT 2018 95
The current capacity of units specifically destined for residue hydrotreatment is estimated at 2.9 mb/d. These are mostly used to remove excess sulphur from the residue that goes into secondary processing units as feedstock. Therefore, to divert their output to bunker fuel would affect the yields for products such as on-spec gasoline and diesel, which we do not think is possible. We expect some 0.4 mb/d of additional residue hydrotreatment capacity to come online by 2020, and we allocate a large part of it, 0.3 mb/d to hydrofining fuel oil for bunker purposes.
The remaining 2.1 mb/d of the required bunker fuels will be essentially looking to the diesel pool – for incremental volumes of marine gasoil or blending material into the new very low sulphur fuel oil product (see Demand). Thanks to an overall slower rate of demand growth for gasoline, diesel and other refined products, this year we forecast higher availability of diesel for bunker use, compared with previous years. By 2020, 1 mb/d of incremental vacuum distillation capacity, combined with hydrocracking unit additions of about 1.1 mb/d, would yield 0.7 mb/d of additional diesel. These units are not linearly additive, because they are part of a process flow. At the same time, some 0.6 mb/d of incremental coking capacity will deal with the increasing volumes of vacuum residue to convert it into fuel oil blending components, naphtha and petroleum coke. An additional 0.3-0.8 mb/d of diesel output is forecast to come from optimising yields with the existing capacity. Diesel output is therefore expected to grow by 1.0-1.5 mb/d to 2020, of which 0.4 mb/d will be used up by non-bunker diesel demand, leaving between 0.6-1.1 mb/d for marine bunkers.
Figure 3.18 Refining capacity additions to 2020 for selected units
The largest volumes of incremental diesel are expected to come from the United States, followed by the Middle East, Russia and China. The United States accounts for a relatively small number of new projects, but the sheer size of the existing capacity, in our view, allows further optimisation of diesel yields, at the expense of gasoline, for which the rate of global demand growth is expected to slow. Russian refiners are expected to progress with their large-scale construction programme, and will be able to increase diesel yields even further by the end of the forecast period. New and more sophisticated refining capacity in the Middle East is also geared to increased diesel and reduced fuel oil output, but the additions are mostly back-loaded. Our forecast of Chinese diesel output is somewhat counter-intuitive in the view of recent developments. Chinese refiners are trying to reduce diesel and increase gasoline yields to adapt to domestic demand changes, but we assume they will also respond to global market drivers and temporarily halt the diesel yield minimisation strategy.

REFINING AND TRADE
96 OIL MARKET REPORT 2018
Figure 3.19 Solutions and challenges in the 3.2 mb/d of HSFO bunker switch in 2020
An important limitation of our forecast is the lack of visibility on hydrogen availability and capacity additions for hydrogen production. A worrying number of refiners, including large integrated oil companies, have publicly stated that one of their options to meet the new sulphur specification would be to use lighter and sweeter crude oil that requires less intensive hydrotreatment. As the two important futures benchmarks, Brent and WTI, are based on light sweet crude oil output, the increased demand for this type of crude oil may fuel a sharp increase in futures prices, with consequences felt across all product markets.
As more upgrading capacity comes online by the end of our forecast period, the deficit of low-sulphur fuel oil will shrink. This will be the last big push for refiners worldwide to reduce heavy product yields to a technical minimum, along with removing most of the sulphur inherent in crude oil. The IMO specification change is in fact a blessing in disguise: the investments that are on the way or yet to be approved will eventually reduce the sulphur premium inherent in crude oil differentials by making refineries less dependent on the sulphur content of the feedstocks.
Quantity vs quality Along with sulphur, crude oil density has been an important factor in crude selection by refiners, effectively acting as a determinant for the price. If the crude oil is too light, a refinery might be constrained by so-called overhead evacuation units, i.e. equipment to take away hydrocarbon gases. On the marketing side, the refinery needs to be able to realise the resulting higher yields of lighter hydrocarbons, either to blend into gasoline or use as petrochemical feedstock. Heavier crudes, on the other hand, yield too much atmospheric residue that cannot be monetised profitably.
For many years prior to the rise of LTO, refiners worldwide were gearing up for a world of heavier crude and investing in deep conversion units. This is less of a challenge nowadays as growth in the heaviest grade, Canadian oil sands, is accompanied by a decline in Venezuelan heavy crude production.
With a second wave of US shale on the way, the world supply barrel is getting lighter in the medium-term. Breaking down heavy molecules into medium and lighter chains of hydrocarbons is a simpler process than building longer chains from lighter molecules. Will there be a mismatch between refiners’ appetites – assumed to be for medium-gravity crude to maximise middle distillates – and growing volumes of LTO? Between 2017 and 2021, LTO output in the US will increase almost as much as it did between 2011 and 2015, 3.1 mb/d vs 3.3 mb/d.

REFINING AND TRADE
OIL MARKET REPORT 2018 97
In a world where oil supply is growing lighter, refiners might increasingly shift to synthesis processes. Polymerisation and alkylation convert low-value, low-octane light hydrocarbon feedstocks, derived not only from atmospheric distillation but also from conversion units, into high-octane gasoline blending components. Such units are growing increasingly popular, especially in China and Russia, where refiners need to increase gasoline yields for domestic consumption.
A similar type of process, called oligomerisation, has been designed to produce diesel from lighter hydrocarbon molecules. This technology was being assessed for commercial application while oil prices were above USD 100/bbl, but given the currently lower range of prices and relatively well-supplied diesel markets, there is yet to be an investment announcement.
Transport fuels are still the most important part of the oil demand barrel, but they are also subject to substitution by competing fuels and to energy efficiency standards. It is true that middle distillates such as diesel and kerosene have a seemingly uncontested monopoly in road freight and aviation, but these two sectors combined account for less than 20% of global oil demand.
In road freight, the penetration of LNG trucks in China shows that cracks are already appearing in diesel’s monopoly, and the mandated biodiesel blend in the US and Europe has quietly eaten into its share over the years. Market share of diesel in total oil demand is expected to be boosted yet again with the IMO bunker specification change forecast to push up demand for marine gasoil, discussed in detail above and in Demand. However, refiners will try to optimise sulphur management and residue yield, not necessarily straight-run gasoil yields.
We forecast a middle distillate deficit as a result of the IMO changes, assuming that, in the absence of readily available low-sulphur fuel oil, shipowners will resort to various diesel blends. But the result will be an excess of high sulphur fuel oil. Any crude that yields higher quantities of diesel than LTO will also yield higher atmospheric residue, and is almost certain to contain more sulphur. So the IMO impact, at least in the initial stages, might well be to boost demand for all types of light and low-sulphur crude oils, including LTO.
However, this is not the only reason why LTO will be able to find its way to the markets. It is important to remember that refineries are profit-driven enterprises used to operating on razor-thin margins. As such they generally avoid falling into the sunk cost fallacy trap that distorts rational decision-making. Past investments into cokers, hydrocrackers and other conversion units are essentially sunk costs. Sunk costs do not drive the day to day linear programming models that refiners run to determine optimal crude supply/product output combinations.
In the US Gulf Coast (PADD 3), coker capacity has not been fully utilised for at least a decade and a half. There is currently about 250 kb/d of unused coking capacity in PADD 3 and about as much in the rest of the United States. There are economic limits to fully utilising heavy conversion capacity. The US refining system was able to absorb LTO during the first wave of shale development when crude exports were not allowed (except shipments to Canada). Between 2014 and 2017 some 500 kb/d of distillation or condensate splitting capacity was built to allow refineries to process the lower-priced LTO. Better-priced domestic oil was preferred even if it resulted in a hypothetical sub-optimal utilisation of the existing capacity set-up.

REFINING AND TRADE
98 OIL MARKET REPORT 2018
Figure 3.20 Future crude oil slate perceptions
The challenge for LTO is in breaking down the perception, nurtured for decades, about the future feedstock slate. It is effectively changing from being pear-shaped, where heavy barrels account for an increasing share, to an hour-glass, where the proportion of light and heavy barrels relative to conventional medium-heavy grades increases. The return of OPEC’s market management also contributes to the perception of an increasing scarcity of medium-grade barrels as OPEC and Russia – its largest non-OPEC collaborator – account for three quarters of the world’s medium-grade crude production. While in the past, opportunity crudes (i.e. attractively priced, but difficult to process feedstocks) used to be heavy, high sulphur grades, increasingly, they include crude oils at the other end of the spectrum.
At the same time, developments on the supply-side are matched with developments on the demand side. Growth in oil products demand for petrochemical use is the fastest in our forecast (see Demand). Refiners are becoming increasingly aware of this, too, and are looking to integrate more petrochemical operations to maintain profitability. LTO, along with condensates, is a feedstock that is best suited for refineries integrated with petrochemical operations.
One of the largest buyers of US crude oil is China, where refineries are trying to maximise both gasoline and petrochemical feedstock yields. An average refinery in Shandong province, China’s refining and petrochemical hub, manages to squeeze out up to 16% LPG yields, three times the global average, which suggests a pent-up demand for lighter crudes.
The more interesting question arising from the extraordinary growth of US LTO is not whether, but how it will find its way to the markets and change established trade flows. We expect most of the incremental barrels to be exported to refiners in Asia, where the booming chemicals sector requires more feedstocks, and to Europe, where the product crack differentials resulting from the IMO specification change drive refinery appetite for low-sulphur, low-residue yield crude oil.

REFINING AND TRADE
OIL MARKET REPORT 2018 99
Crude Trade Crude oil trade volumes are expected to grow over the next six years as most of the refining activity growth takes place where domestic crude output is either stagnant or declining. Asia’s growing need for oil imports will boost trade flows over the next six years, but traditional suppliers from the Middle East, FSU, Africa and Latin America will actually see exports decline by a combined 0.7 mb/d. So where will Asia find the crude to cover a 3.7 mb/d increase in its import requirement? Counterintuitively, it is the traditional crude importing regions that fill the gap. Europe will see net crude imports decline by 0.9 mb/d due to lower refinery runs and production growth in the North Sea. But it is North America that will deliver most of the additional crude oil to global markets.
Despite a 0.5 mb/d rise in refinery runs between 2017 and 2023, the North American crude oil balance narrows from 3.4 mb/d of net imports to just 0.5 mb/d. Even though US refiners are expected to ramp up refinery throughput from already high levels, their intake of conventional crude oil will not change much, as most of the increment will come from Canadian diluted bitumen, together with domestic LTO. At the same time, most of the additional US LTO output is expected to be exported. Therefore, gross imports into the United States will decline only slightly, but its crude balance will see a dramatic narrowing of the deficit – from more than 7 mb/d in 2017 down to under 5 mb/d in 2023.
Regional crude oil balances in 2017 and 2023 (mb/d) Map 3.1
With that, the US import dependence falls to levels almost matching India’s import demand at the end of the forecast period, while China’s net import requirement will be double that of the US, reaching 10 mb/d in 2023. The third largest increase in net imports is in Indonesia, where declining output and higher refining capacity send net crude imports soaring from 50 kb/d to over 700 kb/d. Malaysia, Viet Nam and Brunei turn into net importers of crude oil with new refining capacity coming online. By the early 2020s, there will be no net crude exporting country in Asia.

REFINING AND TRADE
100 OIL MARKET REPORT 2018
US LTO flows are set to dominate the incremental export table, followed by several other non-OPEC countries. Canada and Brazil each add almost 1 mb/d of extra supplies, even though in Canada’s case almost all of the increase goes to the US. In the light of difficulties in the approval process of pipeline projects (see North American Oil Looking For Way Out), we do not see Canadian oil reaching seaborne export outlets in meaningful quantities, but going instead to the US refining system. Canadian oil – both upgraded bitumen (syncrude) and diluted bitumen – is already a mainstay of US Midwest refiners, but most of the incremental 0.7 mb/d of the diluted bitumen is expected to make its way to Gulf Coast refineries, pushing out even more seaborne imports of heavy grades.
Figure 3.21 Top five net importers of crude oil
The next largest addition to international markets, just above 500 kb/d, comes from Norway. This is larger than incremental exports from any OPEC country. Iraq and the UAE are the only countries in the Middle East increasing their crude exports by visible amounts, 500 kb/d and 400 kb/d, respectively, while Saudi Arabia and Iran see exports growing by less than 100 kb/d. These increases are mostly offset by lower exports from Kuwait and Oman (down by 360 kb/d and 320 kb/d, respectively), so that overall Middle East net export availability increases by only 300 kb/d.
Figure 3.22 Largest changes in net crude exports, 2017-23
Russia and the Caspian region are the distant second regional exporter of crude oil. Russian exports increase by 300 kb/d on declining refinery throughput, while higher Kazakh crude oil supply adds another 120 kb/d. These volumes are partly offset by declining exports from other central Asian
2017
2017
2017
2017
2017
2023
2023
2023
2023
2023
0 1 2 3 4 5 6 7 8 9 10
China
UnitedStates
India
SouthKorea
Japan
mb/d
AlgeriaAngola
Oman Saudi
Nigeria
Kuwait
Venezuela
Kazakh
Mexico
Egypt
UAE
Colombia
Russia
Canada
Libya
Iraq
Brazil
Norway
US
-1.5 -1.0 -0.5 0.0 0.5 1.0 1.5 2.0 2.5 3.0
Africa
Middle East
Latin America
Europe/FSU
North America
mb/d

REFINING AND TRADE
OIL MARKET REPORT 2018 101
countries. The other two oil exporting regions, Africa and Latin America, will see overall declines for slightly different reasons. In Latin America, Brazil’s crude supply growth coincides with declines in Venezuela and other countries, resulting in a net loss of 400 kb/d for the continent. In Africa, the largest change comes from Angolan crude exports declining by almost 400 kb/d on lower output, while Nigeria’s 200 kb/d decline is due to the start-up of a large new refinery. Higher refining demand and lower output cut Algerian export volumes by some 200 kb/d. Egypt turns into a net crude oil importer as output declines and refinery throughput rises. The only visible increase in crude oil exports out of the continent is from Libya, which exports 300 kb/d more, subject to political stability.
Major crude trade flows, 2017 (2023), mb/d Map 3.2
Note: Numbers in parenthesis refer to 2023 volumes.
The net impact of the developments described above is an increased concentration of flows into the East of Suez region. By 2023, the net deficit East of Suez will reach 5.4 mb/d, tripling from 2017’s levels, signifying an enormous swing of 10 mb/d over two decades. In our calculations, East of Suez combines the crude balances of the Middle East, Asia and East and South Africa, and this has been in deficit since 2012. Direct flows from Russia and Kazakhstan via pipelines or sea ports in Russia’s Far East will reduce the deficit to 3.7 mb/d, which will need to be filled by Atlantic Basin seaborne crude.
Filling the gap will be a major challenge. More so when some of the long-established flows from the Middle East to the Atlantic Basin are taken into account. In 2017, the US imported 1.7 mb/d of crude oil from the region, while Europe purchased 3 mb/d. Europe and North America combined are expected to reduce their Middle East crude purchases only by 600 kb/d. Thus, flows to Asia from the Middle East can only increase by 1 mb/d. FSU, Africa and Latin America together will send almost 1 mb/d more crude towards Asia, reducing their supplies primarily to Europe. The rest of the Asian imports growth comes from the United States. The US will also send more oil to Europe, which will compensate for reduced volumes of Nigerian and Algerian light low sulphur crudes.
0.7 (0.5)

REFINING AND TRADE
102 OIL MARKET REPORT 2018
Figure 3.23 East of Suez crude oil balance (adjusted for direct flows from Russia/Kazakhstan)
US-China-India nexus
The largest increases in export availability and import requirements come from the United States and China, respectively. Interestingly, the volumes are quite symmetrical at around 2 mb/d. While developments in these countries have played an important role in the global oil market in recent years, their future influence will be even more remarkable.
Thanks to its scale and growing appetite for petrochemical feedstocks, China is likely to become the largest importer of US crude oil. Indeed, by the end of 2017 China was already the largest market for US crude oil exports. So far, conventional grades such as WTI have dominated China’s US import slate, but this is likely due to a medium-heavy crude deficit resulting from OPEC’s output cuts. With the build-up in export infrastructure along the US Gulf Coast (see North American Oil Looking For Way Out), and the ramp-up in petrochemically-oriented Chinese refining capacity, the imports will become lighter, and more so when the IMO spec change gives an additional boost to low-sulphur crude demand from refineries worldwide.
Chinese net crude oil import requirement is expected to reach 10 mb/d in 2023. The United States was the only country to have ever imported 10 mb/d of crude oil (between 2004-07), but now it produces 10 mb/d domestically. Moreover, a large part of the US imports come from Canada, which is effectively a captive supplier. Currently, US imports from international markets are down to 4.5 mb/d, as Canadian volumes take care of the remaining 3 mb/d or so.
China, too, has some captive supplies – in Russian and Kazakh pipeline flows, but volumes are smaller. The flows will grow from about 0.6 mb/d to 0.9 mb/d with the expansion of the ESPO pipeline that was technically completed in early 2018. However, most of China’s incremental imports need to come from seaborne markets that will need to supply 9 mb/d in 2023. Moreover, most of it will need to come from further afield. In the case of the United States, out of the 8.5 mb/d of peak seaborne imports, some 3 mb/d came from geographically close Mexico, Venezuela and Colombia. In Asia, as discussed above, there will be no net exporting country from early 2020s, and Russian seaborne volumes out of the Far East ports are unlikely to increase much from 1 mb/d currently.
-6
-4
-2
0
2
4
6
2003 2005 2007 2009 2011 2013 2015 2017 2019 2021 2023
mb/d
Russia/Kazakhstan direct flows to the Far East
Middle East + Asia crude oil balance

REFINING AND TRADE
OIL MARKET REPORT 2018 103
India, for its part, will also see an increase in import volumes. Although the volumes are less than China’s, India is closer to the Middle East as well as the Suez Canal and Africa and, typically, does not receive oil via the Malacca Strait, an important chokepoint that will become even more crowded over the next six years.
Figure 3.24 Seaborne crude oil imports
China has been very strategic in trying to offset its growing appetite for international oil. Chinese oil companies currently produce about 3 mb/d of equity oil overseas, whereas Indian companies produce less than 0.5 mb/d. US-based companies, for comparison, produced some 4 mb/d from overseas assets last year. US oil companies are also far more integrated in the global downstream industry than either Chinese or Indian companies. Sinopec is now the world’s largest refinery by processing volumes, having overtaken ExxonMobil earlier this decade, but, while more than half of ExxonMobil’s refining volumes are outside the US, Sinopec only has a minority share in the Yasref refinery in Saudi Arabia.
The growing import requirements of both China and India will likely result in more active participation in international upstream and downstream markets. Both India and China are also importing US LPG, and China will become the second Asian off-taker of US ethane exports after India. With this, China is likely to become the largest buyer of US shale output overall.
Product Trade The main factors that have driven global product trade flows – surging natural gas liquids (NGLs) production, especially in the US, and higher refinery runs in the Middle East and Asia – are set to continue, while the IMO bunker fuel specification change adds a new element. Asian and European product balances generally show a growing deficit, except for fuel oil that sees demand destruction after the IMO change. In Europe, this is due to lower refinery throughtput, while in Asia it is due to supply lagging demand.
The Middle East leads in incremental refined product exports, with levels doubling from 2017 to 1.7 mb/d in 2023. It also increases LPG and naphtha exports derived from NGLs. The United States and China also add extra supplies of refined products. Russia’s total balances remain unchanged, but most fuel oil exports are transformed into distillates thanks to yield changes. The most counterintuitive developments are perhaps in Africa. Despite 750 kb/d of refining capacity additions,
0
2
4
6
8
10
2003 2005 2007 2009 2011 2013 2015 2017 2019 2021 2023
mb/d Chineseimports ofseabornecrude
US imports ofseabornecrude
Indian imports

REFINING AND TRADE
104 OIL MARKET REPORT 2018
product balances barely change as increased demand absorbs all of the product supply growth. Indeed, if planned projects are further delayed, Africa, already the largest net product importer, could see its import requirements increase by half to nearly 3 mb/d.
Ethane/LPG A higher forecast of US ethane demand in this Report is matched by higher NGLs production, which, overall, leaves export availability unaffected. There will soon be an addition to the existing roster of US ethane buyers in the UK, Norway, Sweden and India, as a Chinese company has signed a deal to feed its planned cracker in Shandong. China will also see higher LPG imports, but the pace of growth is nowhere near the breakneck speed of the last few years. Chinese refiners prefer to maximise LPG production to optimise the petrochemical supply chain. India will accelerate its LPG imports, almost catching up with China by 2023, as shipments reach 0.6 mb/d, while additionally, it continues to ramp up ethane imports from the US. The largest volume of incremental supply for LPG comes from the Middle East, but the US remains the sole seaborne exporter of ethane through to 2023.
Regional LPG/ethane balances in 2017 and 2023 (kb/d) Map 3.3
Gasoline/naphtha These products are grouped together out of necessity due to inherent difficulties in refinery yield modelling, but, of course, the drivers for their respective markets are very different. In the Atlantic Basin, naphtha demand growth is more subdued, as the petrochemical sector developments are dominated by the US, where ethane and LPG are the preferred feedstocks. In Asia, due to constrained LPG availability, naphtha is the default feedstock. This is where most of incremental naphtha demand comes from over the forecast period, and it is expected to be met primarily from increased exports from the Middle East.

REFINING AND TRADE
OIL MARKET REPORT 2018 105
In a change to last year’s forecast, North American gasoline balances are expected to decline, due to expected yield switches to middle distillates. This causes the net surplus of US gasoline to disappear, making room in the export markets for Europe’s enduring surplus of the product. Higher exports from the Middle East are expected to easily find outlets in Asia and North and East Africa.
Regional gasoline/naphtha balances in 2017 and 2023 (kb/d) Map 3.4
Diesel/kerosene The IMO bunker fuel specification change has the most dramatic impact on European and Asian balances. Europe, already the largest importing region for both diesel and kerosene, increases its dependence on imports from 1.5 mb/d to almost 2 mb/d. Asia, currently a net exporter of some 0.8 mb/d of diesel, sees all of the surplus disappearing. With this, middle distillate trade essentially concentrates on flows to the three importing regions in the Atlantic Basin – Europe, Africa and Latin America, with Europe accounting for all the incremental demand, much as it did in 2004-2008.
Zooming in on the Asian market, we will see increased exports from China compensating for a fall in Indian and Korean surpluses that occur due to, respectively, diesel demand growth and the switch to diesel bunkers. Singapore’s bunker fuelling hub will have to import diesel, competing for available supply, mostly from the Middle East, with importers in Australia and other Asian countries.
Fuel oil Asia will remain the largest importing region for fuel oil, even though the net short position will be halved after the IMO bunker fuel specification change. The Middle East, on the other hand, is expected to increase imports as fuel oil demand grows in power generation, while refinery fuel oil yields decline with more complex capacity coming online.
The Atlantic Basin, therefore, will continue to supply fuel oil to the East of Suez region. However, with Russian exports dramatically reduced due to the significant refinery upgrade programme under

REFINING AND TRADE
106 OIL MARKET REPORT 2018
way, the flows from west to east will no longer be dominated by Russian exports. Instead, it will be an aggregation from a broad base of outlets in Russia, Europe and North America.
Regional diesel/kerosene balances in 2017 and 2023 (kb/d) Map 3.5
Regional fuel oil balances in 2017 and 2023 (kb/d) Map 3.6
NORTH AMERICAN OIL LOOKING FOR A WAY OUT
OIL MARKET REPORT 2018 107
4. SPECIAL FEATURE: NORTH AMERICAN OIL LOOKING FOR A WAY OUT
Highlights • Pipelines carrying Canadian crude to the US reached full capacity at the end of 2017. With
no new investments planned in 2018 and the expected continued growth in the country’s production, we expect line space shortages to become more acute, forcing producers to ship more crude by rail. There is 800-900 kb/d of unused rail export capacity.
• Canadian crude by rail exports grow from 150 kb/d in late 2017 to 250 kb/d on average in 2018 and to 390 kb/d on average in 2019. Canada is unlikely to regain sufficient takeaway pipeline capacity until 2021, when the expansion of Trans Mountain and the commissioning of Keystone XL are planned. Both projects face regulatory headwinds, however.
• West Texas is expected to be the main source of pipeline growth in North America over the 2018-20 period with 2.8 mb/d of capacity announced, equivalent to more than half of all investments. The year 2019 will be key with a significant 1.7 mb/d of projects, the most since LTO started being exploited in the region.
• At the end of 2017, there was just 160 kb/d of line space available out of Western Texas. This small surplus is likely to turn into a deficit in the second half of 2018. The pipeline gap could widen further until mid-2019, in turn reducing the price of WTI Midland relative to Cushing. From 2020, projects look plentiful and may result in overcapacity.
• US Gulf Coast export capacity will grow from 1.9 mb/d at the end of 2017 to 4.9 mb/d at the end of 2023, thanks to growing pipeline capacity and investments in infrastructure. Midstream operators plan to build or modernise 10 export terminals on the US Gulf Coast. Corpus Christi will solidify its place as the largest crude export hub in North America.
Overview Colossal growth in North American supply from 2018 to 2023 raises the crucial question of whether there is enough pipeline capacity to transport and sell all of that oil. If sufficient capacity is not built, the increase in production we foresee could be at risk, with serious implications for global markets. The anticipated supply boom has already triggered a flurry of investment in new pipelines in West Texas, the US Midwest and West Canada. Potential export bottlenecks exist, however, because of the rapid pace of the supply increase and the long distances involved. At the same time, increasing environmental concerns have made legal challenges to new pipeline projects more likely. Keystone XL, a project to boost exports of Canadian heavy crude to the US, is a case in point. First proposed in 2008, the pipeline has become a symbol of the fight against the oil industry and climate change.
This section looks at the areas of growth in midstream capacity in North America, which has long relied on a network of pipelines to carry crude and condensate from oil fields to refineries and consumption centres. Since 2010, the light tight oil (LTO) revolution has led to a significant increase in transport needs. During 2013-17, over 19 000 kilometres (km) of crude oil pipelines were laid in North America out of a global total of 31 000 km, according to the Oil and Gas Journal6
6 Worldwide Pipeline Construction Projects 2017.

NORTH AMERICAN OIL LOOKING FOR A WAY OUT
108 OIL MARKET REPORT 2018
Global crude pipeline capacity additions Figure 4.1
Note: 2018, 2019 and 2020 are forecast years. Source: PennWell Knowledge Center/Oil and Gas Journal.
• Pipelines carrying Canadian crude to the US reached full capacity at the end of 2017. With no new investments in 2018 and production forecast to grow, we expect line space shortages to become more acute. Producers will be forced to find alternative transport, with rail the most obvious. Sufficient takeaway pipeline capacity is unlikely to be regained until 2021, when the Trans Mountain expansion is due to come online.
• West Texas is expected to be the main source of North American pipeline growth in 2018-20 with 2.8 mb/d of capacity to handle soaring LTO output. At the end of 2017, LTO output and pipeline capacity were finely balanced with just 160 kb/d of line space available. This small cushion will come under pressure in 2018 as LTO output rises. The key question for West Texas crude producers over the next year is likely to be whether or not TexStar Logistic’s 550 kb/d EPIC pipeline will be up and running in 2019 as originally planned. A pipeline shortage could reduce the price of WTI Midland relative to Cushing – the prime US crude pricing hub – and Houston, on the Gulf Coast.
• The United States has seen a substantial rise in crude exports along with booming LTO, but hopes for higher shipments could be hindered by limited capacity currently available on the Gulf Coast. To alleviate existing limitations, investment in new pipeline capacity and terminals is being targeted. We peg realistic export capacity at 2.5 mb/d by the end of 2018, 4.7 mb/d in 2020 and 4.9 mb/d in 2023. Corpus Christi will solidify its place as the largest crude export hub in North America thanks to superior pipeline connectivity with the Permian and Eagle Ford basins and a deeper harbour.
• During 2018-19, West Texas and West Canada are likely to face shortages in midstream capacity brought about by a rapid production increase. The situation will be much more severe in Canada than West Texas as legal delays mean capacity is unlikely to increase before the end of 2019. Over the long-term, we estimate there are more than enough projects planned to ensure market access for North American crudes.
0
2 000
4 000
6 000
8 000
10 000
12 000
14 000
16 000
2013 2014 2015 2016 2017 2018 (f) 2019 (f) 2020 (f)
km of installed capacityOther
MiddleEast
AsiaPacific
NorthAmerica

NORTH AMERICAN OIL LOOKING FOR A WAY OUT
OIL MARKET REPORT 2018 109
Canada: Oil pipelines stretched to the limit In 2017, Canada exported 3.32 mb/d of crude, or around 86% of its production. The lion’s share went via pipelines to the US, with a small portion going by rail and ship. Deliveries of Canadian crude to the US have almost doubled in the last decade since the start-up of oil sands output in Alberta. At the same time, Canadian crude has consistently been discounted to West Texas Intermediate (WTI), mainly because of its lower quality but also because of higher transport costs. Following the rise in 2011-12 of Canadian output and Bakken shale production in the US, pipeline space grew more limited. In October 2012, following the partial unplanned closure of the Keystone pipeline, the price of West Canadian Select (WCS) in Hardisty, Canada, plummeted by USD 20-25 (United States dollar)/bbl relative to WCS in Cushing. Similar heavy discounts occurred in 2013 and 2014, as production increased. Investments into new pipelines, the commissioning of new rail export facilities and most notably, lower production growth in the aftermath of the oil price fall of 2014, helped stabilise prices.
Canada’s existing and planned pipelines Map 4.1
Output accelerated in 2016-17 following the start-up of several new oil sands projects and increased upgrader capacity. We estimate that total output from Alberta, British Columbia, Manitoba and Saskatchewan of crude, condensate and pentanes reached 4.2 mb/d at the end of 2017, up 350 kb/d

NORTH AMERICAN OIL LOOKING FOR A WAY OUT
110 OIL MARKET REPORT 2018
from the end of 2015. This compares with refining throughput of 590 kb/d in Western Canada and an effective crude pipeline export capacity, when accounting for scheduling, maintenance and minor oil product transportation requirements, of 3.6 mb/d. At the end of 2017, the amount of oil available for export was thus 310 kb/d higher than takeaway pipeline capacity. When Keystone closed for an unplanned outage in November 2017, operational capacity fell even more. The shutdown left producers with few choices other than to store crude or cut output. Keystone restarted in late November and operated at reduced rates until late January.
WCS delivered at Canada’s Hardisty terminal came under significant price pressure as a result. It was assessed at WTI USD -32/bbl at the start of February 2018, down from USD -19/bbl at the start of November. Meanwhile, the price in Hardisty fell around USD 20/bbl below Cushing (see Figure 4.2). While rail shipments have picked up in recent months and there is plenty of notional capacity, new rail car standards, which resulted in the decommissioning of a lot of older units, competition from grain exports and a lack of trained staff have made it hard to ramp up exports quickly. Rail companies are also loath to invest in new rail cars without long-term take or pay contracts with crude producers. The standoff has hampered rail flows and may well continue over the next few months.
West Canadian select Cushing to Hardisty price differential Figure 4.2
Source: Argus Media Group.
We estimate that rail costs from Edmonton terminal to the US Gulf Coast are around USD 7-8/bbl higher than the same journey by pipeline, or nearly twice as expensive. Wildfires in 2016-17 and lower oil prices reduced Canadian production growth and the rail capacity utilisation rate suffered as a result. It reached only 13% (130 kb/d) in 2017, according to data from the National Energy Board. In December 2017, rail flows increased to 150 kb/d. A total of 1 mb/d of rail export capacity was commissioned between 2011-15 at 23 facilities in Alberta and Saskatchewan.
Planned investments
Canadian midstream operators identified more than a decade ago that current pipeline infrastructure would eventually be fully utilised and thus lined up new investments. Two were under way in early 2018 and two were still being considered. Two major projects were cancelled in 2016-17 due to opposition from the Canadian government, including the 525 kb/d Northern Gateway pipeline, which would have carried crude from Alberta to the port of Kitimat, in British Columbia, as
-5
0
5
10
15
20
25
30
35
2012 2013 2014 2015 2016 2017
USD/bbl
Canada-US pipelines at full capacity.Bakken competing for line space.
July 2013: Lac Megantic rail accident.
October 2012: Keystone shut due to leak.
2015: Line 9B reversal. Line 3 expansion.
November 2017: Keystone shut. Canada-US pipelines full.

NORTH AMERICAN OIL LOOKING FOR A WAY OUT
OIL MARKET REPORT 2018 111
well as 190 kb/d of condensate in the opposite direction. The government also struck down the 1.1 mb/d Energy East pipeline, which would have transported crude between Alberta and refineries in eastern Canada. Both pipeline projects had faced stiff opposition.
During 2018-19, most of the gains in Canadian takeaway capacity are likely to come from the optimisation or replacement of existing lines. Enbridge is leading the way with a plan to replace line 3 between Hardisty, Alberta, and Superior, Wisconsin. The project received the green light from Canada in 2016 but is still awaiting approval from Minnesota. The state’s Public Utilities Commission recommended some additions to the project’s environmental evaluation in December 2017 and is not expected to make a final decision until 2Q18. In our outlook we anticipate the project being completed at the end of 2019. Separately, Enbridge is continuously working on the optimisation of its Mainline pipeline and this is set to bring on a further 125 kb/d of capacity, also by the end of 2019.
Kinder Morgan is also planning to expand the capacity of Trans Mountain to 890 kb/d thanks to the addition of a parallel line. The project was approved by the Canadian government in 2016 but lawsuits have caused delays and the project is now scheduled for completion late in 2020. In early 2018, British Columbia, where the pipeline ends, proposed new rules to ban the transportation of diluted bitumen. The state is currently led by the Green Party, which has long opposed the project and could delay or even prevent its construction by withholding approval for local infrastructure. If it goes ahead, we do not think Trans Mountain is likely to be operational until early 2021.
Planned investments in Canadian takeaway capacity Table 4.1
Project Extra
Capacity (kb/d)
Length (km) Timeline Operator Type Status
Mainline/Line 3 375 1 659 4Q19 Enbridge Expansion Likely Mainline 125 1 659 4Q19 Enbridge Expansion Likely Trans Mountain 590 980 1Q21 Kinder Morgan Expansion Uncertain
Keystone XL 830 1 897 2Q21 TransCanada New Build Uncertain Mainline 275 - - Enbridge Expansion Uncertain
Total 2 245
Source: Company reports.
Finally, the largest and most controversial project has been TransCanada’s new-build 830 kb/d Keystone XL, which would take a more direct route towards Cushing than the existing Keystone line. The project was struck down by President Obama in 2015 and revived by President Trump in 2017, although, at the time of writing, lawsuits in Nebraska are holding it up. TransCanada has secured 500 kb/d of firm supply commitments and has started to plan construction work. We do not expect the pipeline to be operational before mid-2021 due to the time required for permitting and building.
Takeaway capacity to rise, but not until 2019-20
Western Canada’s operational takeaway capacity will remain flat through 2018 and then rise by 450 kb/d in late 2019, thanks to the replacement of line 3 on Enbridge’s Mainline and further optimisation of the pipeline. During 2018-20, however, we expect production to be higher than outgoing capacity, forcing producers to find alternative transport. The most obvious one is rail, as there currently exists 800-900 kb/d of spare export capacity. Crude by rail exports are likely to enjoy

NORTH AMERICAN OIL LOOKING FOR A WAY OUT
112 OIL MARKET REPORT 2018
a renaissance, growing from their current 150 kb/d to an implied 250 kb/d on average in 2018 and to 390 kb/d in 2019. At their peak in 2019, rail exports of crude oil could be as high as 590 kb/d – though this calculation assumes producers do not resort to crude storage in peak months. In 2020, the call on rail will ease to 170 kb/d thanks to the increased capacity on the Mainline.
If needed, we estimate that there is a further 300-400 kb/d of expansion potential at current rail facilities in Canada, which could be quickly commissioned in case output rises further. Such projects have typical lead times of no more than a few months. While most existing rail facilities are owned by midstream companies such as Keyera, Torq, Plains or Kinder Morgan, in some cases crude producers have taken stakes in those projects to ensure market access for their oil. However, it should be noted that rail terminals have seen limited utilisation in recent years and will therefore take time to ramp up to their full potential. We estimate that only half of existing facilities are able to handle the longer unit trains that have lower operational costs.
Planned pipeline capacity and crude production Figure 4.3
As Canadian crude production typically falls in the second quarter due to field maintenance, we expect the call on rail to decline in that period and to be seasonally higher during July-December. This will, in turn, create volatility for rail exports, even if storage at Edmonton/Hardisty could help reduce such seasonal swings. Our calculation assumes rail fills the gap between pipeline capacity and production, that refineries in Western Canada are fully utilised and that existing pipelines run at 90% capacity without any interruptions or maintenance. We also assume that a small portion of Canada’s pipeline capacity (around 200 kb/d) is used to ship LPG and oil products instead of crude and condensate. Finally, we have assumed the system would only take Canadian oil, shutting out Bakken crude, which normally flows to Enbridge’s Mainline via existing connections to Regina, Cromer and Clearbrook. During 2018-19, those Bakken volumes are unlikely to be able to join the Mainline which will be fully utilised for Canadian crude production, and will have to find other transport methods.
If it materialises, the 530 kb/d expansion of Trans Mountain in late 2020 will mean Canada regains enough takeaway pipeline capacity, while the commissioning of the 830 kb/d Keystone XL line will give it additional spare capacity. However, we must acknowledge the substantial risks that those upgrades will be delayed or even cancelled, possibly due to legal action. If the Trans Mountain project was cancelled due to opposition from British Columbia, then Canada would rely heavily on the construction of Keystone XL to export its excess crude and would have little spare capacity in
0
1 000
2 000
3 000
4 000
5 000
6 000
2017 2018 2019 2020 2021 2022 2023
kb/d Keystone XL
Trans Mountain
Keystone
Rangeland/Milk River
Spectra Express
Mainline
Oil available forexport

NORTH AMERICAN OIL LOOKING FOR A WAY OUT
OIL MARKET REPORT 2018 113
case of further production increases. Pipeline risks are evident in the WCS-WTI forward differential curve, which is lower now than a year ago, when we released our first outlook on Canadian pipelines. The curve has sunk by an average USD 3.75/bbl in 2018 and USD 2/bbl in 2019, highlighting reduced expectations from traders about takeaway capacity following the cancellation of Energy East and delays to Trans Mountain and Keystone XL.
Canadian crude oil exports by rail Figure 4.4
Sources: NEB, IEA.
The USD 7-8/bbl higher costs of transporting Canadian crude by rail relative to pipelines, on top of the quality differential will ensure that WCS Hardisty remains at a substantial discount to WTI through 2018 and 2019. While the current USD 30/bbl discount reflects the difficulty of ramping up rail exports quickly, a more moderate USD 20-25/bbl discount for WCS versus WTI through 2018-19 is likely, once rail terminals are able to increase throughput.
West Texas: Strong investments amid production growth Texas has been in recent years the largest source of production growth in North America. Total onshore production of crude and condensate was 4 mb/d at the end of 2017, up 640 kb/d from the end of 2015. Of this, 2.8 mb/d was light tight oil. The majority of existing pipelines from the Permian Basin lead to the Gulf Coast, however both the Basin and Centurion pipelines move crude to Cushing. West Texas had 2.8 mb/d of nameplate transmission capacity at the end of 2017, the bulk of which was commissioned during 2013-17 following the boom in LTO production. In addition, we estimate that six refineries, with a combined 530 kb/d of capacity, use LTO as their main feedstock. The crude they consume is not exported via transmission pipelines. There is also capacity of around 300 kb/d to export crude by rail, but it is not significant compared to the Bakken shale and Canada.
Over the past few years, new pricing locations for WTI have emerged in Texas, at the gathering point of Midland, close to LTO fields, and at the refining and export hub of Houston. Prices there from time to time diverge significantly from the cash WTI price in Cushing. While variations in refining demand in the Midwest or in Canadian and Bakken production can influence the relative price in Cushing, constrained pipeline capacity in Texas has also featured prominently. WTI Midland saw discounts to Cushing of USD 5-20/bbl at times in 2012, 2013 and 2014, reflecting a lack of takeaway capacity.
0
200
400
600
800
1 000
1 200
2011 2012 2013 2014 2015 2016 2017 2018 2019 2020 2021 2022 2023
kb/dRail capacity
Capacityforecast
Rail exports
Implied railexports

NORTH AMERICAN OIL LOOKING FOR A WAY OUT
114 OIL MARKET REPORT 2018
Since 2014, the price of WTI in Midland has largely been in line with the Cushing price as new takeaway capacity started up and as Permian crude production growth decelerated in line with lower oil prices. Early in 2018, WTI Midland was trading above WTI Cushing, reflecting the commissioning of the 300 kb/d Midland to Sealy pipeline and the expansion of the Cactus and BridgeTex pipelines at the end of 2017. With the expected boom in Permian and Eagle Ford production over the next few years, the question is whether new Texas pipeline takeaway capacity will keep pace with crude output, consigning such heavy price discounts to the past.
WTI Midland versus Cushing price Figure 4.5
Source: Argus Media Group.
Planned investments
The Permian and Eagle Ford basins are likely to see significant growth in takeaway capacity in 2018-20, with virtually every single North American midstream operator involved in at least one project in the region. As of early 2018, we are not aware of projects planned beyond 2020, as the investment cycle is typically no more than three years. If all planned investments come to fruition, Permian and Eagle Ford nameplate takeaway capacity would more than double from its current 2.7 mb/d to 5.8 mb/d by the end of 2020. Companies planning new projects in Texas have big advantages in that they do not need to obtain approval for pipelines crossing several states, which can add years to the planning process, and do not typically face much resistance from local residents. Most projects are expected to run between the Permian/Eagle Ford and the Gulf Coast.
Energy Transfer Partners (ETP) plans to commission its Permian Express 3 pipeline, between Midland and Nederland, in 1Q18, before adding capacity later in 2018. The first phase of the project focuses on crude from the Permian Midland, whereas phase 2 in 2019, with 120 kb/d of extra capacity, will expand to the Permian Delaware. Additionally, Enterprise’s Midland to Sealy pipeline, which was commissioned in late 2017, will ramp up to its full 450 kb/d potential in early 2Q18. It could in time increase throughput by a further 100 kb/d thanks to additional pumping capacity, according to Enterprise. The pipeline is linked to the company’s Houston ECHO export terminal via the Rancho 2 pipeline. Magellan is also likely to increase throughput on BridgeTex, between Colorado City and Houston, by 40 kb/d to the line’s full capacity of 440 kb/d.
On current plans, 2019 promises to be the biggest year yet for pipeline additions with 1.7 mb/d of capacity in the works. TexStar Logistics’ new build EPIC pipeline, with a capacity of 550 kb/d, will be
- 25
- 20
- 15
- 10
- 5
0
5
2012 2013 2014 2015 2016 2017
USD/bbl
WTI Midland minus NYMEX WTI
New Permian pipelinestartups
Hurricane Harvey shuts BridgeTex, Longhorn pipelines
Constrained pipeline space out of Permian.
- 3
- 2
- 1
0
1
2
2016 2017
USD/bbl

NORTH AMERICAN OIL LOOKING FOR A WAY OUT
OIL MARKET REPORT 2018 115
the largest line ever built between the Permian/Eagle Ford and the Gulf Coast. Construction started in 2018 and it is expected to come online in the second half of 2019. Around three quarters of capacity has been earmarked for the Permian and the rest for Eagle Ford connections. The pipeline will deliver Permian and Eagle Ford barrels in separate batches, enabling producers to market different crude specifications. It is also one of several projects targeting the port of Corpus Christi, rather than the more traditional hubs of Houston and Beaumont/Port Arthur.
Texas’ existing and planned pipelines Map 4.2
Note: For existing pipelines, capacity taken at the end of 2017.
© OECD/IEA, 2018

NORTH AMERICAN OIL LOOKING FOR A WAY OUT
116 OIL MARKET REPORT 2018
Plains All American confirmed in early 2018 that it will build a new line called Sunrise between the Delaware basin and Cushing, the only project that does not target the Gulf Coast. The company already operates the 450 kb/d Basin pipeline between the Permian and Cushing. Plains is also working on the expansion of Cactus to 575 kb/d for commissioning at the end of 2019. It wants to build new lines between Wink and McCamey, and McCamey and Corpus Christi. At the end of 2017, trader Trafigura signed a long-term offtake contract for 300 kb/d from the pipeline, in Corpus Christi.
Phillips 66 and Enbridge have plans for a new 385 kb/d Gray Oak pipeline between several Texas storage terminals (Reeves, Loving, Winkler, Crane) and Corpus Christi, Freeport and Houston. It would mark the arrival of Canadian midstream company Enbridge into the Permian basin. Finally, Magellan said in late 2017 it was considering the construction of a new 350 kb/d link between Crane and Three Rivers, giving shippers the option to deliver crude to either Houston or Corpus Christi via new pipelines. The pipeline system could later expand to 600 kb/d.
Planned investments in Permian/Eagle Ford crude and condensate pipelines Table 4.2
Project Extra
Capacity (kb/d)
Length (km) Timeline Operator Type Status
Permian Express 3 50 538 1Q18 ETP New Build Construction Midland to Sealy 80 669 2Q18 Enterprise Expansion Construction BridgeTex 40 644 3Q18 Magellan Expansion Construction Permian Express 3 90 538 3Q18 ETP Expansion Construction Sunrise 120 950 2Q19 Plains New Build Confirmed EPIC 550 1 127 3Q19 TexStar New Build Construction Permian Express 3 120 538 3Q19 ETP Expansion Likely Cactus 2 185 838 4Q19 Plains Expansion Confirmed Gray Oak 385 843 4Q19 P66/Enbridge New Build Uncertain - 350 604 4Q19 Magellan New Build Uncertain South Texas Gateway 600 966 1Q20 Buckeye New Build Uncertain NGL Conversion 200 1 360 2Q20 ETP Conversion Uncertain - 250 604 - Magellan Expansion Uncertain Midland to Sealy 100 669 - Enterprise Expansion Uncertain
Total 3 090
Source: Company reports.
Beyond 2019, Buckeye has announced plans for a new 400 kb/d line called South Texas Gateway between Wink, Midland, Crane and Corpus Christi, to be commissioned at the start of 2020. The project was expanded to a bigger diameter and 600 kb/d in December 2017. If built, it would therefore be even larger than EPIC (550 kb/d) and Cactus (575 kb/d). Finally, ETP is considering the conversion of one of its existing NGL pipelines with around 200-300 kb/d of capacity to crude and condensate transportation in 2020. The company will conduct feasibility studies in 2018 and take a final investment decision in 2019, when it launches its Shin Oak NGL pipeline. Those later projects are more uncertain and depend on a continued and rapid increase in Permian crude output.
Some capacity constrains in 2018-19 LTO production expanded rapidly during 2017, reducing the amount of available line space in West Texas, from nearly 300 kb/d at the start of the year to just 160 kb/d in December 2017, according to

NORTH AMERICAN OIL LOOKING FOR A WAY OUT
OIL MARKET REPORT 2018 117
our calculations. However, this small capacity cushion is likely to come progressively under pressure in 2018 as LTO production increases by 720 kb/d to 3.5 mb/d in December 2018. The volume increase will be larger than the combined capacity expansions of the Midland to Sealy, BridgeTex and Permian Express 3 pipelines.
We expect Permian and Eagle Ford takeaway capacity to become insufficient in mid-2018, with the deficit possibly increasing to 180 kb/d in 3Q18 and 260 kb/d in 4Q18. It could grow further to 290 kb/d during the first half of 2019. This, in turn, will reduce the price of WTI Midland relative to Cushing and Houston, and possibly trigger a temporary increase in Permian crude exports by rail. This calculation assumes full utilisation rates at the Texan refineries connected to LTO fields, leaving the possibility that even more volumes could be available for export from the region in case of maintenance or unit malfunctions. There is significant uncertainty over Permian and Eagle Ford production as it is highly sensitive to prices and fast responding. The LTO output line in Figure 4.6 factors in the current oil forward curve with prices easing out over the next few years. It is possible that actual production will rise above this level, thus filling up announced pipeline additions.
Planned Permian/Eagle Ford pipeline capacity and LTO production Figure 4.6
Over the next year or so, the key question for West Texas crude producers is likely to be whether or not TexStar Logistic’s 550 kb/d EPIC pipeline is up and running in 2019 as originally planned. When it is commissioned, EPIC will add much needed takeaway capacity for the Permian and it will likely be filled quickly. If EPIC is delayed to the last quarter of 2019, however, capacity shortages could become more severe towards the middle of 2019. Other pipeline additions planned in 2Q19 (Sunrise) or later in 2019 (Permian Express 3, Cactus 2, Gray Oak, Magellan) are mostly still on the drawing board. If built, they will quickly expand the available takeaway capacity out of the region.
US Gulf Coast: Connectivity, storage terminals key to higher exports Since the the ban on crude exports was lifted in late 2015 the US has become a major crude exporter. As US production returned to growth in 2017, crude and condensate exports rose sharply to average 1 mb/d, up from 600 kb/d in 2016. The Gulf Coast, as the largest refining and storage cluster in the world and a major recipient of US and Canadian crude, was the exit point for 79% of US exports. In some weeks exports rose above 2 mb/d. Most of the production growth in the next few years will be light crude whereas Gulf Coast refineries are largely geared to heavier grades. Thus, export volumes are likely to grow significantly and the role of the Gulf Coast area will only grow.
0
1 000
2 000
3 000
4 000
5 000
6 000
2017 2018 2019 2020 2021 2022 2023
kb/d ETP NGL conversionSouth Texas GatewayCactus 2MagellanGray OakSunriseEPICCenturionBasinPermian Express 3Permian Express 2Permian Express 1AmdelWest Texas GulfBridgeTexMidland/SealyLonghornCactusLocal refiningLTO output

NORTH AMERICAN OIL LOOKING FOR A WAY OUT
118 OIL MARKET REPORT 2018
Nonetheless, there are limitations currently to ambitions of becoming an even larger crude exporter, ranging from limited crude pipeline connectivity, to lack of storage in some locations and competition from product exports for infrastructure. Most important of all, Gulf Coast terminals were built as import, rather than export facilities, and due to their limited depth, they cannot currently accommodate the largest oil tankers. Nearly half of all export movements from the Gulf Coast in 2017 were done via ship-to-ship transfer, according to Kpler, adding to costs. To alleviate these limitations, midstream operators are targeting investments into pipelines connecting different terminals, storage and export facilities.
US crude exports Figure 4.7
Source: Energy Information Administration.
Planned investments Interconnectors
Several projects came online in recent years, including phase one of ETP’s Bayou Bridge pipeline between the refining hub of Lake Charles, Louisiana, and Nederland, Texas. The project aims to improve access to LTO and imported crudes for refineries situated in Lake Charles. In 2017, Plains All American started up its 80 kb/d Caddo pipeline between Longview, Texas, and Shreveport, Louisiana, to allow refineries in Shreveport access to crudes from the Midwest. TransCanada commissioned HoustonLink in order to connect the Marketlink pipeline with Magellan’s Houston and Texas City terminals, thus allowing Canadian crudes to flow all the way to the Gulf Coast. Finally, Energy Transfer’s Crude Oil Pipeline Project (ETCOP) between Patoka, Illinois, and Nederland, was launched in June 2017, connecting with the Dakota Access pipeline and allowing Bakken crude to flow to the Gulf Coast for the first time.
Over 2018-19, several additional projects are planned. ETP is working on an expansion of Bayou Bridge from Lake Charles to a storage terminal in St James, Louisiana. When built, the pipeline will connect with the Dakota Access and ETCOP pipelines, enabling Bakken crude to flow to the Louisiana Offshore Oil Port (LOOP). The project received all necessary regulatory approvals at the end of 2017, despite stiff opposition from environmental groups. We expect it to go online in 3Q18. In addition, Shell is also expected to complete the expansion of its existing Zydeco pipeline from Houma, Louisiana, to St James, in 1Q18, while Magellan is working on a connection between its East Houston terminal to Galena Park, situated on the Houston Ship Channel, for launch in 3Q18.
0
200
400
600
800
1000
1200
2008 2009 2010 2011 2012 2013 2014 2015 2016 2017
kb/d
Total US
Gulf Coast
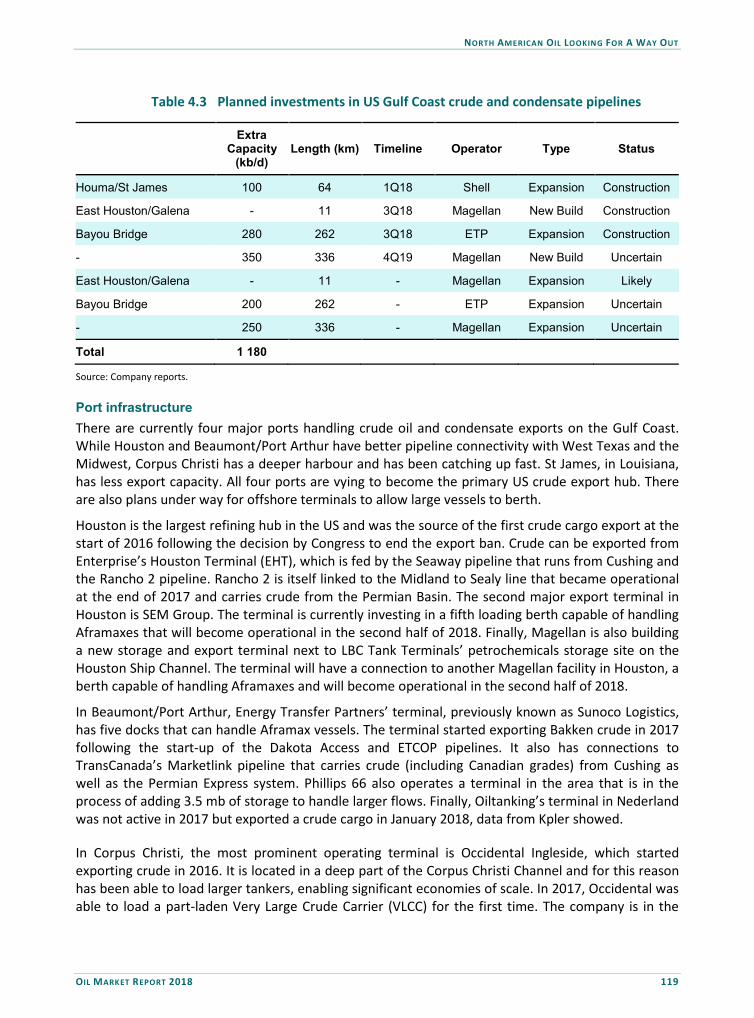
NORTH AMERICAN OIL LOOKING FOR A WAY OUT
OIL MARKET REPORT 2018 119
Planned investments in US Gulf Coast crude and condensate pipelines Table 4.3
Extra
Capacity (kb/d)
Length (km) Timeline Operator Type Status
Houma/St James 100 64 1Q18 Shell Expansion Construction
East Houston/Galena - 11 3Q18 Magellan New Build Construction
Bayou Bridge 280 262 3Q18 ETP Expansion Construction
- 350 336 4Q19 Magellan New Build Uncertain
East Houston/Galena - 11 - Magellan Expansion Likely
Bayou Bridge 200 262 - ETP Expansion Uncertain
- 250 336 - Magellan Expansion Uncertain
Total 1 180
Source: Company reports.
Port infrastructure There are currently four major ports handling crude oil and condensate exports on the Gulf Coast. While Houston and Beaumont/Port Arthur have better pipeline connectivity with West Texas and the Midwest, Corpus Christi has a deeper harbour and has been catching up fast. St James, in Louisiana, has less export capacity. All four ports are vying to become the primary US crude export hub. There are also plans under way for offshore terminals to allow large vessels to berth.
Houston is the largest refining hub in the US and was the source of the first crude cargo export at the start of 2016 following the decision by Congress to end the export ban. Crude can be exported from Enterprise’s Houston Terminal (EHT), which is fed by the Seaway pipeline that runs from Cushing and the Rancho 2 pipeline. Rancho 2 is itself linked to the Midland to Sealy line that became operational at the end of 2017 and carries crude from the Permian Basin. The second major export terminal in Houston is SEM Group. The terminal is currently investing in a fifth loading berth capable of handling Aframaxes that will become operational in the second half of 2018. Finally, Magellan is also building a new storage and export terminal next to LBC Tank Terminals’ petrochemicals storage site on the Houston Ship Channel. The terminal will have a connection to another Magellan facility in Houston, a berth capable of handling Aframaxes and will become operational in the second half of 2018.
In Beaumont/Port Arthur, Energy Transfer Partners’ terminal, previously known as Sunoco Logistics, has five docks that can handle Aframax vessels. The terminal started exporting Bakken crude in 2017 following the start-up of the Dakota Access and ETCOP pipelines. It also has connections to TransCanada’s Marketlink pipeline that carries crude (including Canadian grades) from Cushing as well as the Permian Express system. Phillips 66 also operates a terminal in the area that is in the process of adding 3.5 mb of storage to handle larger flows. Finally, Oiltanking’s terminal in Nederland was not active in 2017 but exported a crude cargo in January 2018, data from Kpler showed.
In Corpus Christi, the most prominent operating terminal is Occidental Ingleside, which started exporting crude in 2016. It is located in a deep part of the Corpus Christi Channel and for this reason has been able to load larger tankers, enabling significant economies of scale. In 2017, Occidental was able to load a part-laden Very Large Crude Carrier (VLCC) for the first time. The company is in the

NORTH AMERICAN OIL LOOKING FOR A WAY OUT
120 OIL MARKET REPORT 2018
process of adding new loading arms (4Q18), a new dock (4Q19) and 5.4 mb of crude storage at the site, which will enable faster cargo loading. The terminal is linked to the Cactus pipeline and the Permian gathering system. In addition, Buckeye and Trafigura co-own a terminal with five vessel berths handling Aframaxes with 2.6 mb of crude, condensate and product storage. Like Occidental’s Inglesite facility, it is linked to the Cactus pipeline carrying crude from the Permian. There is also NuStar’s terminal, which is in the process of adding a third dock due to be operational in 2Q18 and can handle Suezmax vessels. NuStar is working on a project to link its Navigator pipeline system in the Permian to the terminal.
Existing and planned US Gulf Coast crude export terminals Table 4.4
Operator Location 2017
exports (kb/d)
Timeline Investment Vessel Size
ETP/Sunoco Beaumont 80 Operational - Aframax
Phillips 66 Beaumont 20 Operational/4Q18 Storage (4Q18) Aframax
Oiltanking Beaumont 0 Operational - Aframax
Buckeye/Trafigura Corpus Christi 30 Operational - Aframax
NuStar Corpus Christi - Operational/2Q18 New dock (2Q18) Suezmax
Harvest/Vitol Corpus Christi - - New terminal -
Castleton Corpus Christi - 2H19 New terminal -
Magellan Corpus Christi - 2022 New crude dock VLCC
Occidental CC/Ingleside 120 Operational/2018 Various Suez/Part VLCC
Flint Hills/Koch CC/Ingleside 20 Operational - Suezmax
Enterprise Houston 100 Operational - Aframax
SEM Group Houston 10 Operational/2H18 New dock (2H18) Aframax
Magellan Houston - 2H18 New terminal Aframax
Enterprise Freeport 20 Operational - Aframax
NuStar St James 10 Operational - Aframax
Plains St James 30 Operational - Aframax
LOOP Offshore - 1Q18 Export line VLCC
Magellan Offshore - - New terminal VLCC
Source: Company reports, Kpler.
Separately, there are three other projects under way for new export facilities at Corpus Christi in the 2019-22 period, related to the construction of new pipelines from West Texas. Oil trader Castleton started the construction of a new terminal in December 2017 with 4.5 mb of crude storage, 100 kb/d of processing capacity and three docks. The first phase will operate one berth, 1.5 mb of storage and be operational in 2019 in time for the launch of the EPIC pipeline from the Permian that will be attached to the facility. Traders Harvest, Vitol and midstream operator Magellan have also announced plans for new terminals, but few details were available at the time of writing. Once Corpus Christi has been dredged in 2022, Magellan ambitions to build a dock able to handle VLCCs.

NORTH AMERICAN OIL LOOKING FOR A WAY OUT
OIL MARKET REPORT 2018 121
LOOP, which operates a single buoy mooring (SBM) point that is currently the only US terminal able to accommodate fully loaded VLCCs, has invested in a plan to partly reverse the flow in 2018. The SBM will dedicate a portion of its capacity to exports. A test vessel departed in February 2018. The terminal is likely to export sour grades such as Mars and Poseidon, rather than LTO, owing to its connection to the Clovelly storage hub that handles grades from the Gulf of Mexico. LOOP will export one VLCC a month (70 kb/d) for now, but it is expected that it will ramp up to 300 kb/d eventually and has long-term potential of 1.2 mb/d. Finally, Magellan said at the end of 2017 it wants to build a new SBM offshore to accommodate VLCCs. Preliminary engineering work was under way in 2018.
US crude export capacity to reach 4.9 mb/d by 2023
Pipeline capacity to US Gulf Coast terminals amounted to 3.7 mb/d at the end of 2017, versus average exports of 800 kb/d for the year and a maximum monthly total of 1.6 mb/d reached in October 2017. The difference can be explained by export inefficiencies and the fact US Gulf Coast refineries use up some of the crude sent from Cushing (via Seaway and Marketlink), Illinois (ETCOP) and some LTO. We estimate that pipeline buildout capacity to Texan ports will grow to 6.4 mb/d in 2020 and 6.8 mb/d in 2023. However, realistic export capacity is unlikely to be as high, as Gulf Coast refineries will continue to use pipeline crude. We peg realistic export capacity at 2.5 mb/d by the end of 2018, 4.7 mb/d in 2020 and 4.9 mb/d in 2023. The calculation assumes that all pipeline capacity going to Corpus Christi will be used for export and only around half for Beaumont and Houston.
Forecast crude pipeline capacity buildout by primary delivery port Figure 4.8
We expect Corpus Christi to solidify its position as the largest crude export hub in North America during the period, thanks to the addition of new pipelines from the Permian and Eagle Ford basins, such as EPIC, Cactus 2, Gray Oak, Magellan in 2019, and South Texas Gateway in 2020. Corpus Christi is being targeted owing to its deeper channel and the potential to accommodate larger tankers. There is also less refining capacity and competition with oil products than in Beaumont and Houston, allowing it to operate as a dedicated crude oil export terminal. However, several pipelines planned for Corpus Christi (EPIC, Sunrise, South Texas Gateway) are likely to have connections to Houston.
0
1 000
2 000
3 000
4 000
5 000
6 000
7 000
8 000
2017 2018 2019 2020 2021 2022 2023
kb/dLOOP
Corpus Christi
Beaumont
Houston
Realistic exportcapacity

NORTH AMERICAN OIL LOOKING FOR A WAY OUT
122 OIL MARKET REPORT 2018
In 2018, Corpus Christi plans to dredge the main channel to 54 feet (16.5 metres) from the current 45 feet (13.7 meters) and to expand its width to allow for two-way large vessel traffic. Once this is done, fully loaded Suezmaxes will be able to sail into the harbour. Unlike other Gulf Coast ports, the waters off the coast become deeper quickly, reducing the need for dredging. The first phase of the project will focus on Ingleside, the deepest part of the harbour, which will be dredged from its current 47 feet (14.3 meters) to 56 feet (17.1 meters). In 2022, a further deepening dependent on US government funding and the construction of a bridge will allow clearance for VLCCs.

TABLES
OIL MARKET REPORT 2018 123
5. Tables
1Q17 2Q17 3Q17 4Q17 2017 1Q18 2Q18 3Q18 4Q18 2018 2019 2020 2021 2022 2023
OECD DEMANDAmericas 24.7 24.6 25.1 25.1 24.9 24.8 24.7 25.2 25.2 25.0 25.1 25.1 25.0 24.9 24.9Europe 14.1 14.3 14.7 14.3 14.3 14.1 14.4 14.7 14.3 14.4 14.4 14.3 14.2 14.2 14.1Asia Oceania 8.7 7.7 7.9 8.4 8.2 8.5 7.5 7.7 8.3 8.0 8.0 8.0 7.9 7.9 7.9
Total OECD 47.4 46.6 47.6 47.8 47.4 47.5 46.6 47.7 47.9 47.4 47.6 47.4 47.2 47.0 46.8
NON-OECD DEMANDFSU 4.5 4.7 5.0 4.9 4.8 4.6 4.8 5.1 5.0 4.9 4.9 5.1 5.2 5.3 5.3Europe 0.7 0.7 0.7 0.7 0.7 0.7 0.8 0.8 0.8 0.8 0.8 0.8 0.8 0.8 0.8China 12.1 12.4 12.4 12.8 12.5 12.5 12.8 12.8 13.2 12.8 13.2 13.5 13.8 14.1 14.4Other Asia 13.4 13.4 13.0 13.5 13.3 13.9 13.9 13.5 14.0 13.8 14.2 14.6 15.0 15.4 15.8Latin America 6.4 6.5 6.7 6.7 6.6 6.4 6.6 6.8 6.8 6.7 6.7 6.8 6.9 7.0 7.1Middle East 7.8 8.3 8.7 8.2 8.3 8.1 8.5 9.0 8.4 8.5 8.6 8.8 9.0 9.2 9.4Africa 4.4 4.3 4.2 4.3 4.3 4.5 4.4 4.3 4.4 4.4 4.5 4.6 4.7 4.8 5.0
Total Non-OECD 49.3 50.4 50.8 51.2 50.4 50.6 51.7 52.1 52.6 51.8 52.9 54.1 55.4 56.7 57.9
Total Demand1 96.7 97.0 98.4 99.0 97.8 98.1 98.4 99.8 100.4 99.2 100.4 101.5 102.6 103.7 104.7
OECD SUPPLYAmericas 19.9 19.8 20.2 21.1 20.2 21.3 21.6 22.0 22.6 21.9 23.0 23.5 23.9 24.3 24.4Europe 3.7 3.5 3.3 3.4 3.5 3.5 3.5 3.4 3.5 3.5 3.4 3.5 3.7 3.8 3.8Asia Oceania 0.4 0.4 0.4 0.4 0.4 0.4 0.4 0.4 0.5 0.4 0.5 0.6 0.6 0.5 0.5
Total OECD 24.0 23.6 23.9 24.9 24.1 25.3 25.5 25.8 26.6 25.8 26.9 27.6 28.2 28.6 28.8
NON-OECD SUPPLYFSU 14.4 14.3 14.3 14.4 14.4 14.4 14.4 14.4 14.5 14.4 14.6 14.7 14.8 14.7 14.7Europe 0.1 0.1 0.1 0.1 0.1 0.1 0.1 0.1 0.1 0.1 0.1 0.1 0.1 0.1 0.1China 3.9 3.9 3.8 3.8 3.9 3.8 3.8 3.8 3.7 3.8 3.7 3.6 3.6 3.6 3.6Other Asia 3.5 3.4 3.4 3.4 3.5 3.4 3.3 3.3 3.3 3.3 3.2 3.2 3.1 3.0 2.9Latin America 4.6 4.5 4.5 4.5 4.5 4.6 4.7 4.6 4.8 4.7 5.0 5.1 5.1 5.3 5.4Middle East 1.2 1.2 1.2 1.3 1.2 1.2 1.2 1.3 1.2 1.2 1.2 1.2 1.2 1.2 1.1Africa 1.7 1.7 1.7 1.8 1.7 1.7 1.8 1.8 1.7 1.7 1.7 1.7 1.6 1.6 1.5Total Non-OECD 29.5 29.3 29.2 29.3 29.3 29.3 29.3 29.2 29.4 29.3 29.7 29.6 29.5 29.4 28.6Processing Gains2 2.3 2.3 2.3 2.3 2.3 2.3 2.3 2.3 2.3 2.3 2.3 2.4 2.4 2.4 2.5Global Biofuels 1.9 2.4 2.8 2.4 2.4 2.0 2.5 2.8 2.5 2.5 2.6 2.7 2.7 2.8 2.8Total Non-OPEC3 57.7 57.7 58.2 58.9 58.1 58.9 59.7 60.2 60.8 59.9 61.5 62.4 62.8 63.2 63.3
OPECCrude3 32.1 32.3 32.7 32.3 32.3OPEC NGLs 6.8 6.9 6.9 6.9 6.9 6.9 6.9 7.0 7.0 7.0 7.1 7.1 7.2 7.3 7.3Total OPEC3 38.9 39.2 39.6 39.2 39.2Total Supply 96.6 96.9 97.8 98.1 97.4
Memo items:Call on OPEC crude + Stock ch.4 32.2 32.4 33.3 33.2 32.8 32.3 31.8 32.6 32.6 32.3 31.8 32.0 32.6 33.2 34.11 Measured as deliveries from refineries and primary stocks, comprises inland deliveries, international marine bunkers, refinery fuel, crude for direct burning, oil from non-conventional sources and other sources of supply.2 Net volumetric gains and losses in the refining process and marine transportation losses.3 Total Non-OPEC excludes all countries that are currently members of OPEC. Total OPEC comprises all countries which are current OPEC members.4 Equals the arithmetic difference between total demand minus total non-OPEC supply minus OPEC NGLs.
WORLD OIL SUPPLY AND DEMAND(million barrels per day)
Table 1

TABLES
124 OIL MARKET REPORT 2018
3. TABLE 1A WORLD OILSUPPLY AND DEMAND: CHANGES FROM LAST MEDIUM TERM REPORTREPORT
1Q16 2Q16 3Q16 4Q16 2016 1Q17 2Q17 3Q17 4Q17 2017 2018 2019 2020 2021 2022
OECD DEMANDAmericas 0.1 0.1 0.0 0.3 0.1 0.2 0.2 0.2 0.2 0.2 0.4 0.6 0.6 0.6 0.7Europe -0.1 -0.1 0.0 0.0 0.0 0.2 0.2 0.2 0.2 0.2 0.3 0.4 0.5 0.6 0.7Asia Oceania 0.0 0.1 0.1 0.0 0.0 0.1 0.1 0.1 0.1 0.1 0.0 0.1 0.0 0.1 0.1
Total OECD 0.0 0.1 0.1 0.3 0.1 0.4 0.5 0.5 0.5 0.5 0.7 1.1 1.1 1.2 1.4
NON-OECD DEMANDFSU -0.1 -0.1 0.0 -0.1 -0.1 -0.1 -0.1 -0.1 -0.1 -0.1 -0.1 -0.2 -0.1 -0.1 0.0Europe 0.0 0.0 0.0 0.0 0.0 0.0 0.0 0.0 0.0 0.0 0.0 0.0 0.0 0.0 0.0China 0.1 0.0 -0.1 -0.2 -0.1 0.2 0.2 0.2 0.2 0.2 0.3 0.3 0.4 0.4 0.4Other Asia -0.1 -0.1 0.0 -0.5 -0.2 -0.4 -0.4 -0.4 -0.4 -0.4 -0.4 -0.6 -0.8 -0.9 -1.0Latin America 0.0 -0.1 -0.1 -0.1 -0.1 -0.1 -0.1 -0.1 -0.1 -0.1 -0.1 -0.1 -0.1 -0.2 -0.2Middle East -0.1 -0.1 -0.2 -0.3 -0.2 -0.4 -0.3 -0.4 -0.4 -0.4 -0.3 -0.4 -0.4 -0.5 -0.5Africa 0.2 0.1 0.1 0.1 0.1 0.0 0.0 0.0 0.0 0.0 -0.1 -0.1 -0.2 -0.3 -0.3
Total Non-OECD -0.1 -0.2 -0.4 -1.1 -0.4 -0.7 -0.6 -0.7 -0.8 -0.7 -0.8 -1.1 -1.3 -1.4 -1.5Total Demand 0.0 -0.2 -0.3 -0.8 -0.3 -0.2 -0.1 -0.2 -0.2 -0.2 -0.1 -0.1 -0.2 -0.2 -0.1
OECD SUPPLYAmericas 0.0 0.0 0.0 0.0 0.0 0.4 0.2 0.3 1.1 0.5 1.4 1.9 2.2 2.2 2.4Europe 0.0 0.0 0.0 0.0 0.0 0.1 0.0 0.1 -0.1 0.0 0.0 0.1 0.2 0.2 0.3Asia Oceania 0.0 0.0 0.0 0.0 0.0 0.0 0.0 0.0 0.0 0.0 0.0 0.0 0.0 0.0 0.0
Total OECD 0.0 0.0 0.0 0.0 0.0 0.4 0.2 0.4 0.9 0.5 1.4 2.0 2.4 2.5 2.8
NON-OECD SUPPLYFSU 0.0 0.0 0.0 0.1 0.0 0.1 0.1 0.0 -0.1 0.0 -0.1 0.1 0.2 0.4 0.4Europe 0.0 0.0 0.0 0.0 0.0 0.0 0.0 0.0 0.0 0.0 0.0 0.0 0.0 0.0 0.0China 0.0 -0.1 -0.1 -0.1 -0.1 0.0 0.1 0.0 0.1 0.0 -0.1 0.0 -0.1 -0.1 -0.1Other Asia 0.0 0.0 0.0 0.0 0.0 0.0 0.0 0.0 0.0 0.0 -0.1 -0.1 -0.1 -0.1 -0.2Latin America 0.0 0.0 0.0 0.0 0.0 -0.1 -0.1 -0.2 -0.1 -0.1 -0.2 -0.1 -0.1 -0.2 -0.2Middle East 0.0 0.0 0.0 0.0 0.0 0.0 0.0 0.0 0.0 0.0 0.0 0.0 0.0 0.0 -0.1Africa 0.0 0.0 0.0 0.0 0.0 0.0 0.0 0.0 0.0 0.0 0.0 0.0 -0.1 -0.1 -0.1Total Non-OECD 0.0 0.0 0.0 0.0 0.0 0.1 0.1 -0.2 -0.1 0.0 -0.5 -0.2 -0.2 -0.2 -0.2Processing Gains 0.0 0.0 0.0 0.0 0.0 0.0 0.0 0.0 0.0 0.0 0.0 0.0 0.0 0.0 0.0Global Biofuels 0.0 -0.1 0.0 0.0 0.0 -0.1 0.0 0.0 -0.1 -0.1 -0.1 -0.1 0.0 0.0 0.0
Total Non-OPEC 0.0 0.0 0.0 0.0 0.0 0.5 0.3 0.2 0.7 0.4 0.8 1.7 2.2 2.3 2.5
OPECCrude -0.1 -0.1 -0.1 0.0 -0.1OPEC NGLs 0.1 0.1 0.0 0.0 0.1 0.1 0.0 0.0 -0.1 0.0 0.0 0.1 0.1 0.1 0.2Total OPEC 0.0 0.0 0.0 0.0 0.0Total Supply 0.0 0.0 -0.1 0.0 0.0
Memo items:Call on OPEC crude + Stock ch. -0.1 -0.2 -0.3 -0.8 -0.4 -0.8 -0.4 -0.3 -0.8 -0.6 -0.9 -1.8 -2.4 -2.6 -2.8
Table 1aWORLD OIL SUPPLY AND DEMAND: CHANGES FROM LAST MEDIUM-TERM REPORT
(million barrels per day)

TABLES
OIL MARKET REPORT 2018 125
1Q17 2Q17 3Q17 4Q17 2017 1Q18 2Q18 3Q18 4Q18 2018 2019 2020 2021 2022 2023Demand (mb/d)Americas 24.7 24.6 25.1 25.1 24.9 24.8 24.7 25.2 25.2 25.0 25.1 25.1 25.0 24.9 24.9Europe 14.1 14.3 14.7 14.3 14.3 14.1 14.4 14.7 14.3 14.4 14.4 14.3 14.2 14.2 14.1Asia Oceania 8.7 7.7 7.9 8.4 8.2 8.5 7.5 7.7 8.3 8.0 8.0 8.0 7.9 7.9 7.9Total OECD 47.4 46.6 47.6 47.8 47.4 47.5 46.6 47.7 47.9 47.4 47.6 47.4 47.2 47.0 46.8Asia 25.5 25.8 25.4 26.4 25.8 26.4 26.7 26.3 27.2 26.6 27.4 28.1 28.8 29.5 30.3Middle East 7.8 8.3 8.7 8.2 8.3 8.1 8.5 9.0 8.4 8.5 8.6 8.8 9.0 9.2 9.4Latin America 6.4 6.5 6.7 6.7 6.6 6.4 6.6 6.8 6.8 6.7 6.7 6.8 6.9 7.0 7.1FSU 4.5 4.7 5.0 4.9 4.8 4.6 4.8 5.1 5.0 4.9 4.9 5.1 5.2 5.3 5.3Africa 4.4 4.3 4.2 4.3 4.3 4.5 4.4 4.3 4.4 4.4 4.5 4.6 4.7 4.8 5.0Europe 0.7 0.7 0.7 0.7 0.7 0.7 0.8 0.8 0.8 0.8 0.8 0.8 0.8 0.8 0.8Total Non-OECD 49.3 50.4 50.8 51.2 50.4 50.6 51.7 52.1 52.6 51.8 52.9 54.1 55.4 56.7 57.9World 96.7 97.0 98.4 99.0 97.8 98.1 98.4 99.8 100.4 99.2 100.4 101.5 102.6 103.7 104.7of which:
US50 19.7 19.6 20.0 20.0 19.9 19.9 19.8 20.2 20.2 20.0 20.1 20.1 20.0 19.9 19.8Euro5* 8.3 8.3 8.5 8.3 8.3 8.3 8.3 8.5 8.3 8.4 8.3 8.3 8.2 8.2 8.1China 12.1 12.4 12.4 12.8 12.5 12.5 12.8 12.8 13.2 12.8 13.2 13.5 13.8 14.1 14.4Japan 4.4 3.6 3.7 4.1 3.9 4.3 3.4 3.6 4.0 3.8 3.8 3.7 3.7 3.7 3.7India 4.7 4.8 4.4 4.8 4.7 5.0 5.1 4.7 5.1 5.0 5.2 5.4 5.6 5.8 5.9Russia 3.4 3.6 3.8 3.7 3.6 3.4 3.6 3.9 3.7 3.7 3.7 3.8 3.9 4.0 4.0Brazil 3.0 3.0 3.1 3.2 3.1 3.0 3.1 3.2 3.2 3.1 3.2 3.2 3.2 3.3 3.3Saudi Arabia 2.9 3.3 3.5 3.1 3.2 3.0 3.4 3.7 3.2 3.3 3.4 3.5 3.5 3.6 3.6Korea 2.7 2.6 2.6 2.7 2.7 2.7 2.6 2.6 2.7 2.6 2.7 2.7 2.7 2.7 2.7Canada 2.4 2.4 2.5 2.4 2.4 2.4 2.3 2.4 2.4 2.4 2.4 2.4 2.4 2.4 2.4Mexico 1.9 1.9 1.9 2.0 1.9 1.9 1.9 1.9 2.0 1.9 1.9 1.9 2.0 2.0 2.0Iran 1.8 1.8 1.8 1.8 1.8 1.9 1.9 1.9 1.9 1.9 1.9 1.9 2.0 2.1 2.1
Total 67.4 67.3 68.4 68.9 68.0 68.3 68.2 69.4 69.9 69.0 69.8 70.5 71.0 71.5 72.0% of World 69.6 69.4 69.5 69.6 69.5 69.6 69.3 69.5 69.6 69.5 69.5 69.4 69.2 69.0 68.8Annual Change (% per annum)Americas 0.5 0.4 0.1 0.9 0.5 0.6 0.4 0.5 0.6 0.5 0.6 -0.2 -0.4 -0.3 -0.3Europe 3.4 3.0 1.6 0.5 2.1 0.6 0.5 0.5 0.5 0.5 -0.2 -0.6 -0.4 -0.5 -0.5Asia Oceania 1.1 -0.4 0.3 0.7 0.4 -1.8 -1.7 -1.8 -1.7 -1.8 0.2 -0.9 -0.3 -0.3 -0.4Total OECD 1.4 1.1 0.6 0.8 1.0 0.1 0.1 0.1 0.2 0.1 0.3 -0.4 -0.4 -0.4 -0.4Asia 2.9 2.9 4.5 5.8 4.0 3.4 3.3 3.3 3.3 3.3 2.8 2.5 2.7 2.4 2.4Middle East -0.4 -1.5 0.2 0.6 -0.3 2.8 2.8 2.8 3.1 2.9 1.0 2.8 2.4 2.3 1.6Latin America -1.7 -1.0 0.2 2.3 0.0 1.4 1.4 1.4 1.4 1.4 1.3 1.3 1.3 1.2 1.1FSU -0.5 5.1 2.2 0.5 1.8 1.3 1.1 1.1 1.3 1.2 1.1 3.6 1.5 2.6 1.0Africa 1.7 0.2 0.5 0.7 0.8 1.5 1.5 1.5 1.5 1.5 2.5 1.7 3.0 2.9 3.1Europe 3.3 1.3 2.7 4.6 3.0 2.5 2.6 2.6 2.6 2.6 1.7 0.7 2.1 2.0 2.0Total Non-OECD 1.3 1.6 2.6 3.5 2.3 2.6 2.6 2.6 2.7 2.6 2.1 2.4 2.4 2.3 2.1World 1.4 1.3 1.6 2.2 1.7 1.4 1.4 1.4 1.5 1.4 1.4 1.1 1.1 1.1 1.0Annual Change (mb/d)Americas 0.1 0.1 0.0 0.2 0.1 0.1 0.1 0.1 0.1 0.1 0.2 0.0 -0.1 -0.1 -0.1Europe 0.5 0.4 0.2 0.1 0.3 0.1 0.1 0.1 0.1 0.1 0.0 -0.1 -0.1 -0.1 -0.1Asia Oceania 0.1 0.0 0.0 0.1 0.0 -0.2 -0.1 -0.1 -0.1 -0.1 0.0 -0.1 0.0 0.0 0.0Total OECD 0.7 0.5 0.3 0.4 0.4 0.1 0.1 0.0 0.1 0.1 0.1 -0.2 -0.2 -0.2 -0.2Asia 0.7 0.7 1.1 1.4 1.0 0.9 0.9 0.8 0.9 0.9 0.8 0.7 0.8 0.7 0.7Middle East 0.0 -0.1 0.0 0.0 0.0 0.2 0.2 0.2 0.2 0.2 0.1 0.2 0.2 0.2 0.1Latin America -0.1 -0.1 0.0 0.2 0.0 0.1 0.1 0.1 0.1 0.1 0.1 0.1 0.1 0.1 0.1FSU 0.0 0.2 0.1 0.0 0.1 0.1 0.1 0.1 0.1 0.1 0.1 0.2 0.1 0.1 0.1Africa 0.1 0.0 0.0 0.0 0.0 0.1 0.1 0.1 0.1 0.1 0.1 0.1 0.1 0.1 0.2Europe 0.0 0.0 0.0 0.0 0.0 0.0 0.0 0.0 0.0 0.0 0.0 0.0 0.0 0.0 0.0Total Non-OECD 0.7 0.8 1.3 1.7 1.1 1.3 1.3 1.3 1.4 1.3 1.1 1.3 1.3 1.3 1.2World 1.3 1.3 1.6 2.1 1.6 1.4 1.4 1.4 1.4 1.4 1.2 1.1 1.1 1.1 1.0Revisions to Oil Demand from Last Medium Term Report (mb/d)Americas 0.2 0.2 0.2 0.2 0.2 0.4 0.4 0.4 0.4 0.4 0.6 0.6 0.6 0.7Europe 0.2 0.2 0.3 0.2 0.2 0.3 0.4 0.4 0.4 0.4 0.5 0.5 0.6 0.7Asia Oceania 0.1 0.1 0.1 0.1 0.1 0.0 0.0 0.0 0.1 0.0 0.1 0.0 0.1 0.1Total OECD 0.5 0.6 0.6 0.6 0.6 0.7 0.8 0.8 0.8 0.8 1.1 1.2 1.3 1.5Asia -0.1 -0.1 -0.2 -0.2 -0.1 -0.1 -0.1 -0.2 -0.2 -0.2 -0.3 -0.4 -0.5 -0.6Middle East -0.4 -0.3 -0.4 -0.4 -0.4 -0.3 -0.3 -0.3 -0.3 -0.3 -0.4 -0.4 -0.5 -0.5Latin America -0.1 -0.1 -0.1 -0.1 -0.1 -0.1 -0.1 -0.1 -0.1 -0.1 -0.1 -0.1 -0.2 -0.2FSU -0.2 -0.1 -0.1 -0.2 -0.1 -0.2 -0.2 -0.2 -0.2 -0.2 -0.2 -0.1 -0.1 -0.1Africa 0.0 0.0 0.0 0.0 0.0 -0.1 -0.1 -0.1 -0.1 -0.1 -0.1 -0.2 -0.3 -0.3Europe 0.0 0.0 0.0 0.0 0.0 0.0 0.0 0.0 0.0 0.0 0.0 0.0 0.0 0.0Total Non-OECD -0.7 -0.7 -0.7 -0.8 -0.7 -0.8 -0.8 -0.9 -0.9 -0.8 -1.2 -1.3 -1.5 -1.6World -0.2 -0.1 -0.2 -0.2 -0.2 -0.1 0.0 0.0 -0.1 -0.1 -0.1 -0.2 -0.2 -0.1Revisions to Oil Demand Growth from Last Medium Term Report (mb/d)World -0.2 0.1 0.1 0.6 0.2 0.1 0.1 0.1 0.1 0.1 0.0 -0.1 0.0 0.1* France, Germany, Italy, Spain and UK
Table 2SUMMARY OF GLOBAL OIL DEMAND

TABLES
126 OIL MARKET REPORT 2018
1Q17 2Q17 3Q17 4Q17 2017 1Q18 2Q18 3Q18 4Q18 2018 2019 2020 2021 2022 2023OPECCrude Oil Saudi Arabia 9.88 9.97 9.99 9.99 9.96 Iran 3.78 3.77 3.83 3.82 3.80 Iraq 4.46 4.50 4.48 4.45 4.47 UAE 2.96 2.93 2.94 2.90 2.93 Kuwait 2.71 2.71 2.70 2.70 2.71 Neutral Zone 0.00 0.00 0.00 0.00 0.00 Qatar 0.60 0.62 0.60 0.61 0.61 Angola 1.64 1.64 1.67 1.62 1.64 Gabon 0.20 0.20 0.20 0.21 0.20 Nigeria 1.39 1.49 1.62 1.60 1.53 Libya 0.66 0.71 0.94 1.00 0.83 Algeria 1.05 1.06 1.06 1.02 1.05 Equatorial Guinea 0.13 0.12 0.12 0.13 0.13 Ecuador 0.52 0.53 0.54 0.53 0.53 Venezuela 2.08 2.05 1.99 1.75 1.97
Total Crude Oil 32.07 32.31 32.68 32.33 32.35Total NGLs1 6.84 6.89 6.90 6.85 6.87 6.91 6.94 6.98 7.01 6.96 7.08 7.13 7.19 7.26 7.32
Total OPEC2 38.91 39.20 39.58 39.18 39.22NON-OPEC3
OECDAmericas 19.93 19.76 20.17 21.09 20.24 21.32 21.57 22.02 22.58 21.88 22.95 23.54 23.90 24.27 24.43 United States 12.67 12.97 13.15 14.00 13.20 14.18 14.64 14.78 15.27 14.72 15.67 16.18 16.46 16.78 16.90 Mexico 2.33 2.31 2.16 2.13 2.23 2.11 2.07 2.04 2.00 2.05 1.95 1.93 1.93 1.92 1.93 Canada 4.92 4.47 4.86 4.95 4.80 5.03 4.85 5.19 5.31 5.10 5.33 5.43 5.50 5.56 5.59 Chile 0.00 0.00 0.01 0.01 0.01 0.00 0.00 0.00 0.00 0.00 0.00 0.00 0.00 0.00 0.00Europe 3.66 3.48 3.35 3.41 3.47 3.52 3.50 3.40 3.54 3.49 3.40 3.51 3.71 3.76 3.81 UK 1.06 1.03 0.96 0.97 1.01 1.03 1.12 1.07 1.15 1.09 1.11 1.06 1.04 0.97 0.92 Norway 2.08 2.00 1.89 1.92 1.97 1.99 1.88 1.83 1.89 1.90 1.78 1.95 2.20 2.31 2.43 Others 0.52 0.45 0.50 0.52 0.50 0.50 0.50 0.49 0.50 0.50 0.50 0.49 0.48 0.48 0.47Asia Oceania 0.39 0.40 0.41 0.40 0.40 0.41 0.41 0.42 0.45 0.42 0.54 0.58 0.57 0.55 0.53 Australia 0.31 0.32 0.33 0.33 0.32 0.34 0.34 0.35 0.38 0.35 0.48 0.52 0.51 0.49 0.47 Others 0.07 0.08 0.08 0.07 0.07 0.07 0.07 0.07 0.07 0.07 0.07 0.06 0.06 0.06 0.06
Total OECD 23.98 23.64 23.93 24.90 24.11 25.25 25.49 25.83 26.58 25.79 26.90 27.63 28.18 28.57 28.77NON-OECDFormer USSR 14.45 14.35 14.26 14.37 14.36 14.44 14.40 14.36 14.47 14.42 14.62 14.73 14.79 14.71 14.66 Russia 11.46 11.34 11.30 11.32 11.36 11.32 11.32 11.33 11.36 11.33 11.48 11.63 11.74 11.72 11.57 Others 2.99 3.01 2.96 3.05 3.00 3.12 3.09 3.02 3.11 3.08 3.14 3.10 3.04 3.00 3.09Asia 7.44 7.35 7.27 7.27 7.33 7.19 7.13 7.09 7.03 7.11 6.96 6.83 6.72 6.64 6.48 China 3.91 3.91 3.83 3.84 3.87 3.81 3.79 3.76 3.73 3.77 3.72 3.64 3.62 3.65 3.62 Malaysia 0.71 0.69 0.69 0.70 0.70 0.69 0.68 0.68 0.66 0.68 0.65 0.66 0.63 0.60 0.57 India 0.87 0.85 0.86 0.85 0.86 0.83 0.82 0.84 0.85 0.83 0.85 0.86 0.87 0.87 0.84 Indonesia 0.85 0.85 0.84 0.84 0.85 0.83 0.83 0.82 0.81 0.82 0.78 0.74 0.70 0.66 0.61 Others 1.10 1.04 1.06 1.04 1.06 1.03 1.01 1.00 0.99 1.01 0.96 0.93 0.90 0.86 0.83Europe 0.13 0.13 0.13 0.13 0.13 0.13 0.12 0.12 0.12 0.12 0.11 0.11 0.10 0.10 0.09Latin America2 4.56 4.53 4.54 4.54 4.54 4.59 4.66 4.64 4.79 4.67 5.03 5.09 5.07 5.26 5.35 Brazil 2.75 2.74 2.73 2.73 2.74 2.78 2.88 2.87 3.03 2.89 3.32 3.45 3.46 3.65 3.76 Argentina 0.59 0.56 0.58 0.58 0.58 0.58 0.58 0.58 0.58 0.58 0.58 0.57 0.56 0.55 0.55 Colombia 0.85 0.86 0.86 0.86 0.86 0.85 0.84 0.83 0.82 0.84 0.79 0.75 0.70 0.66 0.63 Others 0.38 0.37 0.37 0.37 0.37 0.37 0.36 0.36 0.36 0.36 0.35 0.34 0.35 0.39 0.42Middle East2 1.24 1.24 1.25 1.25 1.25 1.25 1.25 1.25 1.25 1.25 1.22 1.19 1.18 1.18 1.13 Oman 0.98 0.98 0.98 0.98 0.98 0.98 0.98 0.98 0.98 0.98 0.98 0.96 0.94 0.92 0.91 Syria 0.02 0.02 0.02 0.02 0.02 0.02 0.02 0.02 0.02 0.02 0.02 0.02 0.04 0.06 0.02 Yemen 0.03 0.03 0.03 0.03 0.03 0.03 0.03 0.03 0.03 0.03 0.03 0.03 0.03 0.03 0.03 Others 0.22 0.22 0.22 0.22 0.22 0.22 0.22 0.22 0.22 0.22 0.19 0.18 0.17 0.17 0.17Africa2 1.68 1.69 1.73 1.78 1.72 1.73 1.76 1.77 1.73 1.75 1.73 1.68 1.61 1.56 1.54 Egypt 0.63 0.64 0.64 0.64 0.64 0.63 0.62 0.61 0.60 0.62 0.58 0.54 0.50 0.47 0.44 Sudan 0.07 0.07 0.07 0.07 0.07 0.07 0.06 0.06 0.06 0.06 0.06 0.05 0.05 0.04 0.04 Others 0.97 0.99 1.02 1.07 1.01 1.03 1.08 1.09 1.07 1.07 1.10 1.08 1.06 1.05 1.06
Total Non-OECD 29.49 29.30 29.19 29.35 29.33 29.32 29.33 29.23 29.40 29.32 29.67 29.62 29.47 29.45 28.65Processing Gains4 2.29 2.29 2.29 2.29 2.29 2.32 2.32 2.32 2.32 2.32 2.35 2.38 2.41 2.44 2.46Global Biofuels 1.93 2.45 2.82 2.41 2.40 2.04 2.51 2.78 2.51 2.46 2.61 2.73 2.73 2.78 2.83TOTAL NON-OPEC2 57.69 57.68 58.23 58.95 58.14 58.93 59.65 60.16 60.81 59.89 61.53 62.36 62.79 63.23 63.32TOTAL SUPPLY 96.60 96.88 97.82 98.13 97.361 Includes condensates reported by OPEC countries, oil from non-conventional sources, e.g. Venezuelan Orimulsion (but not Orinoco extra-heavy oil), and non-oil inputs to Saudi Arabian MTBE. Orimulsion production reportedly ceased from January 2007.2 Total OPEC comprises all countries which are current OPEC members. Total Non-OPEC excludes all countries that are current members of OPEC.3 Comprises crude oil, condensates, NGLs and oil from non-conventional sources.4 Net volumetric gains and losses in refining and marine transportation losses.
Table 3WORLD OIL PRODUCTION
(million barrels per day)

TABLES
OIL MARKET REPORT 2018 127
TABLE 3a: Selected Upstream Project Start-Ups OECD Americas FSU
USA Coulomb Phase 2 10 2018 Russia Imlorskoye 100 2014
USA Tahiti Vertical Expansion 25 2018 Russia Novoportovskoye 160 2014
USA Vito 100 2022 Russia Prirazlomnoye 100 2015
USA Buckskin 30 2019 Russia East Messoyakha 130 2016
USA Caesar/Tonga 20 2018 Russia Suzun 90 2016
USA Big Foot 75 2018 Russia Tagul 100 2017
USA Stampede (Knotty Head & Pony) 80 2018 Russia Erginskoye/Kondaneft 170 2017
USA Appomattox/Vicksburg 175 2020 Russia Yurubcheno-Tokhomskoe 100 2018
USA Mad Dog Phase 2 140 2021 Russia Naulskoe 20 2019
USA Kaikias 40 2019 Russia Russkoe 120 2019
Mexico Area 1 (Amoco, Tecoalli, Mizton) 150 2019 Russia Taas-Yuriakh 75 2019
Mexico Zama 100 2023 Russia Kuyumba 60 2019
Canada Christina Lake Ph G (Cenovus) 50 2019 Russia Rospan 110 2019
Canada Mackay River ph 1 35 2017 Russia Lodochnoe 40 2020
Canada Fort Hills ph 1 194 2017 Azerbaijan Shah-Deniz 2 65 2018
Canada Horizon ph 3 80 2017 Kazakhstan Kashagan phase 1a (restart) 370 2016
Canada Hebron 150 2017 Kazakhstan Tengizchevroil FGP 260 2022
Canada Christina Lake Ph G 50 2019 AsiaCanada Kirby North 40 2020 China Peng-Lai 19-3 80 2018
Canada Suncor - Meadow Creek East ph 1 40 2023 China Weizhou -4 50 2020
OECD Europe India Mumbai High 50 2018
Denmark Tyra Future 25 2022 India B-127 15 2017
Italy Tempa Rossa 50 2018 India Manik 20 2021
Norway Maria 30 2017 India Barmer Hill 25 2018
Norway Johan Castberg 190 2022 Latin AmericaNorway Snorre Expansion Project 70 2021 Brazil Atlanta EPS 45 2018
Norway Gina Krog 65 2017 Brazil Cidade de Caraguatatuba (Lapa) 100 2016
Norway Martin Linge 40 2019 Brazil Cidade de Marica (Lula Alto) 150 2016
Norway Trestakk 20 2019 Brazil Cidade de Saquarema (Lula Central) 150 2016
Norway Njord 120 2020 Brazil P-66 (Lula Sul) 150 2017
Norway Johan Sverdrup ph 1 440 2019 Brazil Tartaruga Verde/Tartaruga Mestica 150 2018
Norway Oda 35 2019 Brazil P-67 (Lula Norte) 150 2018
Norway Johan Sverdrup ph 2 220 2022 Brazil Libra pilot 45 2017
Norway Yme Redevelopment 30 2021 Brazil P-68 (Lula Ext. Sul) 150 2018
Norway Snadd (Skarv) 20 2020 Brazil Libra ph 1 150 2021
Norway Brage 25 2021 Brazil Libra ph 2 150 2022
UK Schiehallion (Quad 204) 120 2017 Brazil Buzios Phase 1-5 750 2018-20
UK Catcher 45 2017 Brazil Marlim redevelopment (Module 1) 100 2021
UK Kraken 50 2017 Brazil Sepia 180 2021
UK Western Isles 30 2017 Brazil Berbigao/Sururu (Iara) 150 2018
UK Clair Ridge 120 2018 Brazil Itapu 120 2022
UK Mariner 55 2018 Guyana Liza 100 2020
UK Cheviot 20 2020 Congo Nene Marine 35 2016
UK Penguin 45 2021 Congo Moho North 100 2017
OECD Asia Oceania Congo Litchendjili 10 2017
Australia Wheatstone 30 2017 Ghana Tweneboa-Enyera-Ntomme 80 2016
Australia Prelude 40 2018 Ghana OTCP 30 2018Australia Ichthys 130 2018 Uganda Albert Basin (Kingfisher) 60 2021Australia Greater Enfield 40 2020
Start Year
Table 3aSELECTED NON-OPEC UPSTREAM PROJECT START-UPS
Country ProjectPeak
Capacity (kbd)
Start Year Country Project
Peak Capacity
(kbd)

TABLES
128 OIL MARKET REPORT 2018
TABLE 3b: Selected OPEC Upstream Project Start-Ups
Crude Oil Projects NGL & Condensate Projects
Angola East Hub Development 80 2017 Iran South Pars 20-21 (condensate) 75 2017
Angola Kaombo 230 2018 Iran South Pars 22-24 (condensate) 75 2019
Kuwait Ratqa 270 2018 Iran South Pars 11 (condensate) 75 2022
Nigeria Egina 220 2018 Nigeria Gbaran-Ubie Phase 2 20 2017
Nigeria Bonga SW & Aparo 150 2023
Nigeria Zabazaba/Etan 120 2023
Saudi Khurais Expansion 300 2018
Saudi Marjan Expansion 300 2023
Saudi Zuluf Expansion 600 2023
Saudi Berri Expansion 250 2023
UAE Sarb 100 2017
UAE Nasr 65 2018
UAE Upper Zakum (Phase 2) 1000 2019
Start Year
Table 3b Selected OPEC upstream project start-ups
Country ProjectPeak
Capacity (kbd)
Start Year Country Project
Peak Capacity
(kbd)

TABLES
OIL MARKET REPORT 2018 129
Table 3c MTOMR – WEO Non-OPEC supply comparison
Calculation 2010 2016 2017 2018 2019 2020 2021 2022 2023
NON-OPEC SUPPLY 52.0 57.4 58.1 59.9 61.5 62.4 62.8 63.2 63.3 Processing gains 2.1 2.3 2.3 2.3 2.3 2.4 2.4 2.4 2.5
Global biofuels 1.8 2.3 2.4 2.5 2.6 2.7 2.7 2.8 2.8
NON-OPEC PRODUCTION(excl. processing gains and biofuels) 1 48.1 52.8 53.4 55.1 56.6 57.2 57.7 58.0 58.0
Crude 2 41.9 44.9 45.2 46.7 47.9 48.5 48.8 48.8 48.6 of which: Condensate 3 2.4 2.8 2.9 3.1 3.3 3.4 3.4 3.5 3.1
Tight oil 4 0.6 4.3 4.8 6.1 7.1 7.7 8.1 8.3 8.3
Un-upgraded bitumen 5 0.7 1.5 1.6 1.8 2.0 2.1 2.2 2.3 2.3 NGLs 6 4.8 6.5 6.7 6.9 7.1 7.2 7.2 7.4 7.6 Syncrude (Canada) 7 0.8 0.9 1.0 1.1 1.1 1.1 1.1 1.1 1.1 CTL, GTL, kerogen oil and additives1 8 0.5 0.4 0.4 0.5 0.5 0.5 0.6 0.7 0.8
NON-OPEC PRODUCTION(excl. processing gains and biofuels) =1 48.1 52.8 53.4 55.1 56.6 57.2 57.7 58.0 58.0 Conventional 45.5 45.6 45.5 45.6 45.9 45.9 45.8 45.7 45.5
Crude oil =2-3-4-5 38.3 36.4 35.9 35.6 35.6 35.3 35.1 34.8 34.9
Natural gas liquids (total) =3+6 7.2 9.2 9.6 10.0 10.4 10.5 10.7 10.9 10.7
Unconventional 2.5 7.1 8.0 9.5 10.6 11.4 11.9 12.3 12.5 EHOB (incl. syncrude)2 =5+7 1.5 2.4 2.7 2.9 3.0 3.2 3.2 3.3 3.4
Tight oil =4 0.6 4.3 4.8 6.1 7.1 7.7 8.1 8.3 8.3
CTL, GTL, kerogen oil and additives1 =8 0.5 0.4 0.4 0.5 0.5 0.5 0.6 0.7 0.8
1 CTL = coal to liquids; GTL = gas to liquids.
2 Extra-heavy oil and bitumen
World Energy Outlook definitions
Table 3cNon-OPEC supply - Oil Market Report and WEO definitions
Medium Term Oil Market Report definitions
(million barrels per day)

TABLES
130 OIL MARKET REPORT 2018
Refinery Capacity Additions
2017 2018 2019 2020 2021 2022 2023 Total
Refining Capacity Additions and Expansions1
OECD Americas 160 47 20 350 577 OECD Europe 200 200 OECD Asia Oceania 9 FSU 313 90 30 100 533 Non-OECD Europe China 420 200 450 200 400 350 1,600 Other Asia 264 236 238 210 280 724 300 1,988 Latin America 46 33 33 Middle East -116 330 400 82 615 293 290 2,010 Africa 30 60 30 500 30 100 750
Total World 623 1,269 1,485 572 1,795 1,080 1,490 7,691
Upgrading Capacity Additions2 OECD Americas 62 55 55 OECD Europe 127 106 43 20 296 OECD Asia Oceania 68 29 97 FSU 63 137 227 302 180 130 30 1,006 Non-OECD Europe 33 25 58 China 273 229 264 400 522 259 1,674 Other Asia 110 45 100 80 97 63 495 Latin America 100 29 129 Middle East -41 -22 288 11 316 593 Africa 57 25 70 240 392
Total World 358 861 1,017 908 1,065 572 372 4,795
Desulphurisation Capacity Additions3
OECD Americas 77 75 75 OECD Europe 50 114 164 OECD Asia Oceania FSU 40 156 249 210 20 635 Non-OECD Europe China 281 156 120 464 746 200 1,686 Other Asia 90 239 50 159 130 110 70 757 Latin America 64 64 Middle East -22 170 527 248 658 153 1,756 Africa 42 200 242
Total World 466 888 1,060 1,081 1,754 327 270 5,379 1 Comprises new refinery projects or expansions to existing facilities including condensate splitter additions. Assumes zero capacity creep.
2 Comprises gross capacity additions to coking, hydrocracking, residue hydrocracking, visbreaking, FCC or RFCC capacity.
3 Comprises additions to hydrotreating and hydrodesulphurisation capacity.
Table 4
WORLD REFINERY CAPACITY ADDITIONS(thousand barrels per day)

TABLES
OIL MARKET REPORT 2018 131
Table 4a World refinery capacity additions, changes from last Oil Report 2017
2016 2017 2018 2019 2020 2021 2022 Total
Refining Capacity Additions and Expansions1
OECD Americas 114 -40 -33 47 20 -6 OECD Europe -200 200 OECD Asia Oceania 143 141 141 FSU -35 175 30 170 Non-OECD Europe China -140 140 190 -220 -200 -320 -550 Other Asia -196 236 56 -40 -190 472 338 Latin America 6 -33 33 6 Middle East -286 242 -120 -235 -18 116 -301 Africa -30 30 500 -500
Total World 257 -580 590 403 -508 92 -199 -202
Upgrading Capacity Additions2 OECD Americas 62 62 OECD Europe -50 -1 106 43 148 OECD Asia Oceania 68 29 97 FSU -6 -177 -238 51 207 180 130 153 Non-OECD Europe 33 25 58 China -137 47 230 400 92 -94 538 Other Asia 39 79 -35 100 80 52 276 Latin America 100 -29 -133 29 -33 Middle East -45 -22 67 -30 -215 136 -64 Africa -57 37 -50 70 240 240
Total World -62 -309 71 402 772 287 253 1,476
Desulphurisation Capacity Additions3 OECD Americas 42 75 117 OECD Europe -64 114 50 OECD Asia Oceania FSU -57 58 249 210 20 480 Non-OECD Europe China -144 -140 60 464 255 -180 315 Other Asia 228 -159 159 130 60 419 Latin America -64 -74 64 -74 Middle East -27 -82 63 102 126 -153 153 209 Africa -42 -3 200 155
Total World -27 -283 218 303 959 378 97 1,670 1 Comprises new refinery projects or expansions to existing facilities including condensate splitter additions. Assumes zero capacity creep.
2 Comprises stand-alone additions to coking, hydrocracking or FCC capacity. Excludes upgrading additions counted under 'Refinery Capacity Additions
and Expansions' category.
3 Comprises stand-alone additions to hydrotreating and hydrodesulphurisation capacity. Excludes desulphurisation additions counted under
'Refinery Capacity Additions and Expansions' category.
Table 4aWORLD REFINERY CAPACITY ADDITIONS:
Changes from Last Oil Market Report(thousand barrels per day)

TABLES
132 OIL MARKET REPORT 2018
Table 4b Selected refinery Capacity Additions: Changes from last Medium Term Report
ChinaCanada North West Redwater Partnership - Edmonton 80 2018 China Sinopec/KPC - Zhanjiang 200 2020United States ExxonMobil Refining & Supply Co. - Beaumont 350 2023 China Hengli Petrochemical - Dalian 200 2019United States Targa Resources Partners LP - Corpus Christi 35 2018 China Rongsheng Petrochemical - Zhoushan island phase 1 200 2021United States Meridian Resources - Davis North Dakota 27 2019 China Hengli Petrochemical - Dalian 200 2021United States Calumet Montana Refining - Great Falls 20 2020 China Shenghong Petchem - Lianyungang 150 2023United States Valero Energy Corp. - St. Charles 20 2019 China Sinopec - Shanghai Gaoqiao 140 2023United States Flint Hills Resources - Corpus Christi 16 2018 China CNOOC Ningbo Daxie - Ningbo Zhejiang 120 2019United States Valero Energy Corp. - Port Arthur 15 2018 China PetroChina - Renqiu, Hebei 100 2018United States Holly Corp. - Woods Cross 14 2018 China Zhuhai Huafeng - Zhuhai 100 2018OECD Europe China CNOOC - Dongying 70 2019Turkey Socar - Aliaga/Izmir 200 2019 China PetroChina - Qingyang 60 2023Middle East China Sinochem - Quanzhou 60 2019Bahrain Bahrain Petroleum Co. - Sitra 355 2022 IndiaBahrain Bahrain Petroleum Co. - Sitra -262 2022 India Indian Oil - Panipat 200 2022Iran National Iranian Oil Co. - Abadan 195 2020 India HPCL - Visakhapatnam 150 2020Iran National Iranian Oil Co. - Persian Gulf Star Refinery 120 2020 India Indian Oil - Koyali, Gujarat 86 2022Iran National Iranian Oil Co. - Persian Gulf Star Refinery 112 2018 India Indian Oil - Barauni 60 2021Iran National Iranian Oil Co. - Siraf (Assaluyeh) 60 2022 India HPCL - Mahul, Mumbai 60 2020Iran National Iranian Oil Co. - Siraf (Assaluyeh) 60 2023 India BPCL - Bina 36 2018Iran National Iranian Oil Co. - Abadan -233 2020 Other AsiaIraq INOC-ORA - Karbala 140 2022 Brunei Zhejiang Hengyi Petrochemicals - Pulau Muara Besar 148 2019Iraq Qaiwan - Bazian 20 2018 Indonesia Pertamina/Rosneft - Tuban 300 2023Kuwait Kuwait National Petroleum Co. - Al-Zour 615 2021 Indonesia Pertamina - Balikpapan, Kalimantan 100 2022Kuwait Kuwait National Petroleum Co. - Mina Abdulla 200 2018 Indonesia Pertamina/Saudi Aramco - Cilacap, Central Java 52 2022Oman Oman Refinery Co. - Duqm 230 2023 Malaysia Petronas - Rapid 220 2021Oman Oman Refinery Co. - Sohar 82 2018 Malaysia Petron - Port Dickson 90 2022Saudi Arabia Saudi Aramco - Jazan 400 2019 Philippines Petron Corp. - Limay, Bataan 90 2019Saudi Arabia Saudi Aramco - Jeddah -84 2018 Thailand Thai Oil Co. Ltd. - Sriracha 126 2022UAE ENOC - Jebel Ali 65 2020 Vietnam Petro vietnam/KPC/Idemitsu Kosan - Nghi Son 200 2018FSU Vietnam Petro Vietnam/gazpromNeft - Quang Ngai/Dung Quat 70 2022Azerbaijan SOCAR - Heydar Aliev 30 2020 AfricaBelarus Naftan - Novopolotsk 35 2018 Algeria Naftec SPA - Tiaret 100 2023Kazakhstan Kazmunigas - Pavlodar 20 2018 Cameroon SONARA - Cape Limboh Limbe 30 2018Kazakhstan Kazmunigaz/PetroChina - Chimkent 15 2018 Egypt MIDOR - Alexandria 60 2019Kazakhstan Kazmunigas - Atyrau 10 2018 Nigeria Dangote Oil Refining Company - Lekki Free Trade Zone 500 2021Russia Tatneft/Taneko - Nizhnekamsk 140 2018 Uganda Total/Tullow/CNOOC - Albertine Graben 30 2020Russia Mari El refinery - Mari Republic 63 2018 Uganda Total/Tullow/CNOOC - Albertine Graben 30 2022Russia Yayski - Irkutsk 60 2019 Non-OECD AmericasRussia Antipinsky Refinery - Antipinsky 30 2018 Peru Petroperu SA - Talara, Piura 33 2022Russia Gazprom Neft - OMSK 30 2019Uzbekistan Uzbekneftegaz - Jizzakh 100 2023
Start Year
OECD Americas
Table 4bSELECTED REFINERY CRUDE DISTILATION PROJECT LIST
Country ProjectCapacity
(kbd)1Start Year Country Project
Capacity (kbd)1

TABLES
OIL MARKET REPORT 2018 133
Table 5 World Ethanol Production
2015 2016 2017 2018 2019 2020 2021 2022 2023
OECD North America 995 1,027 1,054 1,071 1,074 1,077 1,057 1,047 1,039
United States 966 997 1,025 1,040 1,043 1,045 1,023 1,012 1,001
Canada 29 29 28 29 30 30 31 31 33
OECD Europe 88 77 92 89 97 103 96 89 89
Austria 5 5 4 4 4 4 3 3 3
Belgium 6 5 9 9 9 9 9 8 8
France 17 13 15 16 16 16 16 15 15
Germany 16 16 16 16 16 18 15 14 14
Italy 0 0 0 0 0 1 0 0 0
Netherlands 6 2 5 6 7 7 6 5 5
Poland 4 4 4 4 5 6 7 5 4
Spain 8 6 6 6 7 8 7 6 5
UK 9 6 11 5 10 11 11 11 13
OECD Pacific 4 4 5 5 9 9 10 10 10
Australia 4 4 4 4 7 7 9 9 9
Total OECD 1,088 1,108 1,151 1,164 1,180 1,189 1,163 1,147 1,137
FSU 3 3 5 3 4 4 4 4 4
Non-OECD Europe 1 1 1 1 2 2 2 1 1
China 45 46 53 57 61 78 86 98 114
Other Asia 42 47 48 55 66 78 85 89 95
India 13 17 14 18 21 27 32 33 34
Indonesia 1 1 1 1 1 1 1 1 1
Malaysia 0 0 0 0 0 0 0 0 0
Philippines 3 4 4 4 6 7 7 8 8
Singapore 1 1 2 1 1 1 1 1 1
Thailand 20 21 24 26 31 35 37 39 41
Latin America 552 532 521 521 543 587 619 659 681
Argentina 14 15 18 19 19 19 19 20 21
Brazil 516 486 478 481 498 541 573 611 629
Colombia 8 7 6 7 9 10 10 10 11
Middle East 1 1 2 1 1 1 1 1 1
Africa 4 4 6 4 8 10 11 12 15
Total Non-OECD 648 633 637 643 685 759 808 864 911
Total World 1,736 1,741 1,788 1,807 1,865 1,948 1,971 2,011 2,049
World Ethanol Production1Table 5
(thousand barrels per day)
1 Volumetric production; to convert to energy adjusted production, ethanol is assumed to have 2/3 energy content of conventional gasoline.

TABLES
134 OIL MARKET REPORT 2018
Table 5a World Biodiesel Production
2015 2016 2017 2018 2019 2020 2021 2022 2023
OECD North America 88 109 113 126 128 133 140 146 146
United States 83 102 105 117 120 125 129 135 135
Canada 5 7 8 9 9 9 11 11 11
OECD Europe 228 242 237 229 257 272 240 228 230
Austria 4 9 6 6 6 6 6 6 6
Belgium 5 9 8 7 9 10 7 7 7
France 46 45 40 40 45 45 41 38 37
Germany 57 60 60 53 56 60 51 47 47
Italy 9 11 14 18 20 21 18 16 16
Netherlands 32 28 29 27 31 33 29 28 28
Poland 17 17 17 15 17 18 15 14 14
Spain 22 26 23 19 21 24 18 18 17
UK 3 3 6 7 11 11 11 11 12
OECD Pacific 11 11 11 16 17 18 18 18 16
Australia 3 1 1 1 1 3 3 3 0
Total OECD 327 362 362 371 402 424 398 392 392
FSU 4 4 4 4 4 4 4 4 4
Non-OECD Europe 4 4 4 5 6 6 4 4 5
China 16 16 18 20 21 23 25 27 27
Other Asia 90 106 103 115 141 156 165 175 181
India 2 3 3 3 3 3 3 4 4
Indonesia 28 48 43 60 75 78 83 90 100
Malaysia 17 12 12 8 13 19 21 23 23
Philippines 3 4 4 3 4 9 9 9 4
Singapore 19 18 18 16 20 20 20 20 20
Thailand 21 21 24 25 26 28 28 29 30
Latin America 119 132 136 157 167 169 158 159 159
Argentina 35 51 50 51 53 54 40 39 38
Brazil 68 65 70 88 93 95 96 97 99
Colombia 10 9 10 12 14 15 15 16 17
Middle East 0 0 1 1 1 1 1 1 1
Africa 2 3 3 4 4 5 5 5 13
Total Non-OECD 236 265 269 305 344 364 362 374 390
Total World 563 627 631 676 746 788 760 766 782
(thousand barrels per day)
World Biodiesel ProductionTable 5a

Onl
in
e bookshopPDF versions at 20% discount
ww
w.i
ea.o
rg/booksIn
tern
atio
nal
Energy Agency
Secure Sustain
able T
oget
her
World Energy Outlook series
World Energy
Investment series
Energy Statistics series
Energy Policiesof IEA
Countriesseries
Energy Technology
Perspectives series
E-mail: books@
iea.org
Market ReportSeries
Oil
Coal
RenewableEnergy Energy
Efficiency
Gas
Global Gas Security series
EnergyPolicies
Beyond IEA Countriesseries

This publication reflects the views of the IEA Secretariat but does not necessarily reflect those of individual IEA member countries. The IEA makes no representation or warranty, express or implied, in respect of the publication’s contents (including its completeness or accuracy) and shall not be responsible for any use of, or reliance on, the publication.
Unless otherwise indicated, all material presented in figures and tables is derived from IEA data and analysis.
This publication and any map included herein are without prejudice to the status of or sovereignty over any territory, to the delimitation of international frontiers and boundaries and to the name of any territory, city or area.
IEA/OECD possible corrigenda on: www.oecd.org/about/publishing/corrigenda.htm
IEA PublicationsInternational Energy Agency
Website: www.iea.orgContact information: www.iea.org/about/contact
Typeset in France by IEA - March 2018 (612018011E1) ISBN: 9789264288874
Cover design: IEA; Photo credits: ©Shutterstock

Ma
rk
et
Re
po
rt
Se
rie
s
OIL 2O18
€80 (61 2018 01 1E1) ISSN 2520-2707
ISBN: 978-92-64-28887-4
9HSTCQE*ciiihe+
Oil 2018 is the IEA’s annual five-year forecast of global oil demand, supply refining, and trade.
Global oil demand growth remains healthy driven by developing countries in Asia, even as oil consumption growth slows down in China thanks to new environmental policies designed to curb air pollution. Strong growth in petrochemicals demand globally is another key area of growth.
Upstream investments have not rebounded from the historic two-year decline seen in 2015-2016 except in the United States which dominates the supply growth story. Meanwhile, there is uncertainty over the longer-term prospects of the successful OPEC and non-OPEC market management policy.
These strands set the scene for Oil 2018’s analysis of the market, which examines a wide range of other important issues and uncertainties, including:
n The implications for oil demand of the 2020 IMO marine fuel regulations.
n The growth of the global petrochemicals sector.
n The rise of electrification in China’s transport fleet.
n Decline rates in key oil producing countries.
n Crude quality issues arising from the rapid increase in US production.
n Investment needs in North American takeaway capacity.
n Implications for global refining of the looming capacity surplus.
n Trends in global oil trade.
Analysis and Forecasts to 2O23
Copyright © 2022 FDOKUMEN