
Comparative performance of the FSCL neural net and K-means algorithm for market segmentation
12
ELSEVIER European Journal of Operational Research 93 (1996) 346-357 EUROPEAN JOURNAL OF OPERATIONAL RESEARCH Comparative performance of the FSCL neural net and K-means algorithm for market segmentation P.V. (Sundar) Balakrishnan a, Martha C. Cooper b, Varghese S. Jacob c,., Phillip A. Lewis d a Business Administration Program, University of Washington, Bothell, WA 98024, USA b Department of Marketing, The Ohio State University, Columbus, OH, USA c Department of Accounting and MIS, The Ohio State University, 1775 College Road, Columbus, OH 43210-1399, USA a Department of Marketing, Rowan College of New Jersey, Glassboro, NJ, USA Received 1 July 1995; revised 1 August 1995 Abstract Given the success of neural networks in a variety of applications in engineering, such as speech and image quantization, it is natural to consider its application to similar problems in other domains. A related problem that arises in business is market segmentation for which Clustering techniques are used. In this paper, we explore the ability of a specific neural network, namely the Frequency-Sensitive Competitive Learning Algorithm (FSCL), to cluster data for developing strategic marketing decisions. To this end, we investigate the comparative performance of FSCL vis-h-vis the K-means clustering technique. A cluster analysis conducted on brand choice data for the coffee category revealed that the two methodologies resulted in widely differing cluster solutions. In an effort to address the dispute over the appropriate methodology, a comparative performance investigation was undertaken using simulated data with known cluster solutions in a fairly large experimental design to mimic varying data quality to reflect data collection and measurement error. Based on the results of these studies, it is observed that a combination of the two methodologies, wherein the results of the FSCL network are input as seeds to the K-means, seems to provide more managerially insightful segmentation schemes. Keywords: K-means; Neural networks; Segmentation; Comparative performance; Brand choice; Data quality; Marketing 1. Introduction A common research objective across a variety of disciplines is to group items that are similar. This grouping can be of people for identifying market segments; or of cities and regions for selecting test market sites; or of species of plants and animals for classification; or of speech and signals for data com- pression. The methodologies for such grouping ef- forts include multivariate analyses and, more re- * Corresponding author. cenfly, neural network techniques. Management scientists are interested in neural networks particularly for analyzing noisy data, deal- ing with problems that have no clear cut solutions and their ability to learn. Neural networks have been designed for various purposes, including managerial problems such as handling census data (Openshaw and Wymer, 1991), forecasting (Murtagh, 1991a), time-varying data (Rowher, 1991), bankruptcy pre- diction (Wilson and Sharda, 1994), the traveling salesman problem (Fort, 1991), and grouping or clustering (Ahalt et al., 1990; Gath and Geva, 1988; Krishnamurthy et al., 1990; Osipenko, 1988). 0377-2217/96/$15.00 Copyright © 1996 Elsevier Science B.V. All fights reserved. Pll S0377-2217(96)00046-X
Transcript of Comparative performance of the FSCL neural net and K-means algorithm for market segmentation
E L S E V I E R European Journal of Operational Research 93 (1996) 346-357
EUROPEAN JOURNAL
OF OPERATIONAL RESEARCH
Comparative performance of the FSCL neural net and K-means algorithm for market segmentation
P . V . ( S u n d a r ) B a l a k r i s h n a n a, M a r t h a C . C o o p e r b, V a r g h e s e S . J a c o b c , . , P h i l l i p A . L e w i s d
a Business Administration Program, University of Washington, Bothell, WA 98024, USA b Department of Marketing, The Ohio State University, Columbus, OH, USA
c Department of Accounting and MIS, The Ohio State University, 1775 College Road, Columbus, OH 43210-1399, USA a Department of Marketing, Rowan College o f New Jersey, Glassboro, N J, USA
Received 1 July 1995; revised 1 August 1995
Abstract
Given the success of neural networks in a variety of applications in engineering, such as speech and image quantization, it is natural to consider its application to similar problems in other domains. A related problem that arises in business is market segmentation for which Clustering techniques are used. In this paper, we explore the ability of a specific neural network, namely the Frequency-Sensitive Competitive Learning Algorithm (FSCL), to cluster data for developing strategic marketing decisions. To this end, we investigate the comparative performance of FSCL vis-h-vis the K-means clustering technique. A cluster analysis conducted on brand choice data for the coffee category revealed that the two methodologies resulted in widely differing cluster solutions. In an effort to address the dispute over the appropriate methodology, a comparative performance investigation was undertaken using simulated data with known cluster solutions in a fairly large experimental design to mimic varying data quality to reflect data collection and measurement error. Based on the results of these studies, it is observed that a combination of the two methodologies, wherein the results of the FSCL network are input as seeds to the K-means, seems to provide more managerially insightful segmentation schemes.
Keywords: K-means; Neural networks; Segmentation; Comparative performance; Brand choice; Data quality; Marketing
1. Introduction
A common research objective across a variety of disciplines is to group items that are similar. This grouping can be of people for identifying market segments; or of cities and regions for selecting test market sites; or of species of plants and animals for classification; or of speech and signals for data com- pression. The methodologies for such grouping ef- forts include multivariate analyses and, more re-
* Corresponding author.
cenfly, neural network techniques. Management scientists are interested in neural
networks particularly for analyzing noisy data, deal- ing with problems that have no clear cut solutions and their ability to learn. Neural networks have been designed for various purposes, including managerial problems such as handling census data (Openshaw and Wymer, 1991), forecasting (Murtagh, 1991a), time-varying data (Rowher, 1991), bankruptcy pre- diction (Wilson and Sharda, 1994), the traveling salesman problem (Fort, 1991), and grouping or clustering (Ahalt et al., 1990; Gath and Geva, 1988; Krishnamurthy et al., 1990; Osipenko, 1988).
0377-2217/96/$15.00 Copyright © 1996 Elsevier Science B.V. All fights reserved. Pll S0377-2217(96)00046-X

P.V. Balakrishnan et al./ European Journal of Operational Research 93 (1996) 346-357 347
However for these newer technologies, such as neural networks, to become accepted in practice they should demonstrate at least parity if not superiority over existing techniques. To this end, in this paper we analyze the capabilities of a specific neural net- work implementation against a more traditional tech- nique, namely K-means, for the general problem of clustering.
Although several networks have been proposed, little comparison with traditional techniques is avail- able. Further, different applications of the same basic technique may produce different results leading to a lack of stability in the cluster solutions as illustrated in Section 3. The researcher must determine which data reduction method to use for h is /her purposes. Which method is best for the data characteristics, the sample size, the amount of data reduction needed? Some of the more common techniques, such as factor analysis and clustering, have extensive re- search bases behind them to suggest where problems may arise and which methods might be best for which data characteristics and purposes (e.g., Bezdek and Hathaway, 1990; Milligan, 1980; Milligan and Cooper, 1985; Cooper and Milligan, 1988; Dubes, 1987).
The recent interest in neural network analysis has resulted in numerous techniques suggested for many different applications (e.g., Fort , 1991; Hecht-Niel- sen, 1990; Kohonen, 1982a,b,1989). This relatively new methodological area has had little of the rigor- ous testing of these newly suggested methods to help the researcher answer comprehensively the questions posed in the preceding paragraph. A small literature, however, is beginning to develop (e.g., Balakrishnan et al., 1992, 1994; Bezdek, 1991; Naylor and Li, 1988).
This paper reports on the performance of one kind of neural network, the Frequency-Sensitive Competi- tive l_~arning (FSCL) network developed by Krish- namurthy et al. (1990) for Vector quantization. This method is compared with K-means non-hierarchical clustering. Both of these methods attempt to achieve the same objective, namely, associating a set of objects with a corresponding representative object. In vector quantization, the goal is to classify vectors into classes. In engineering applications these vectors represent input from speech or images. In manage- ment applications, such as market segmentation, data
are collected in the form of attribute's values and clustering techniques are used to classify each data point. In either case, the goal is to classify the input into one of the pre-specified number of output groups.
One of the problems in applying these techniques directly to real data for market segmentation is that the results obtained from the two techniques do not typically match. Since there is no absolute criterion to unequivocally say the results of one technique are right and the other wrong it becomes incumbent on the researcher to test these techniques using simu- lated data whose properties are known (Milligan and Cooper, 1987). This paper, therefore, examines both simulated data and brand choice probabilities data to compare the FSCL neural network with the K-means algorithm.
The remainder of the paper is organized into a brief explanation of the two approaches, the method- ology for the study, the results of the study, limita- tions of the study, and conclusions and future re- search directions.
2. Neural networks
A neural network consists of two basic compo- nents: processing elements (or nodes) and their in-
terconnections. The processing element receives a number of input signals and then generates a single output signal which is then " sen t " to one or more processing elements via the interconnections. How the nodes are connected to each other between the various layers constitutes the system's knowledge and determines how the neural network will respond to any arbitrary input. A connection between two nodes could have positive or negative weights. The weight wiy is positive if node j excites node i and negative i f j inhibits i. The strength of the connec- tion is given by the absolute value of the weight wij. The pattern of connectivity can be represented by a weight matrix W in which wij represents the strength and sense (i .e. , excitatory or inhibitory) of the con- nection between: j and i. During the learning process these :weights a r e modified based on the learning algorithm used and the desired output (supervised learning) for a given input. Since several sources discuss the concept of neural networks in detail (see for example, Rumelhart et al., 1987; Nelson and

348 P.V. Balakrishnan et aL / European Journal of Operational Research 93 (1996) 346-357
Illingworth, 1991; Hecht-Nielsen, 1990), here we will only discuss the specific approach we have used.
2.1. The FSCL network
Krishnamurthy et al. (1990) and Ahalt et al. (1990) report on a revised method of vector quantization using frequency sensitive competitive learning (FSCL). Vector quantization is described as " a sta- tistical method of encoding data for transmission to a receiver" (Krishnamurthy et al., 1990). Neural net- works are suggested as particularly suited to this task since they are adaptive in two senses. First, each new training vector can modify the codebook vectors so there is on-line learning. This may be needed when the source statistics change over time, for example, when communication channels are changed. Second, neural networks can process one vector of data at a time instead of requiring the entire training set to be processed at once in a batch mode, as in the ap- proach by Linde et al. (1980). The latter is particu- larly computationally intensive (Krishnamurthy et al., 1990).
The frequency sensitive competitive learning al- gorithm works as follows. Information or voices can be represented as a vector x consisting of k dimen- sions. Usually, k dimensions are too large for trans- mission over current lines o r fiber optics. Therefore, the k dimensions must be reduced to a smaller number for transmission.
To compress the data or voice for transmission, there needs to be a system for encoding the data before transmission and then decoding it at the re- ceiving location. A codebook is used for this pur- pose. The codebook C consists of M codewords c,., each of k dimensions. One of the M codewords is used to represent the k-dimensional vector x. This is basically a data reduction approach. The codebook is developed using a large set of training data.
When a vector is to be encoded, it is matched with the closest codeword by calculating the distor- tion d(x, ci), i = 1 . . . . . M between the vector and each codeword. If the jth codeword is the closest, the vector is then encoded as codeword cj., Upon receipt of the signal, the receiver decodes using the appropriate codeword.
The basic neural network will have M neural units, each with an associated weight vector that is the ith codeword, i.e., wi = cg. All k dimensions of
the input vector x are fed in parallel to the neural network. Distortions d( x, w i) are calculated between the input vector and each of the M units. The distortions may be measured using some distance measure, the Euclidean distance being a common approach for clustering techniques. The unit with the minimum distortion 'wins ' and the input vector is assigned to the codeword ci.
In this process, a few codewords may account for a disproportionate share of the input vectors. Gross- berg (1976) and Hecht-Nielsen (1988) suggest means of minimizing the winner-take-all problem. Lipp- mann (1987) and Winters and Rose (1989) indicate means of finding the winner. Competitive learning algorithms adjust the weight vectors of neural units that win too frequently, or are in the neighborhood of the winner in the case of the Kohonen self-organiz- ing map (Kohonen, 1989). Competitive learning is useful if a criterion of the effort is to maximize entropy, that is, to have codewords chosen with relatively equal frequency.
The Frequency-Sensitive Competitive Learning (FSCL) Training Algorithm counts the number of times, u i, a particular unit wins and increases the distortion measure using the non-decreasing 'fair- ness' function F ( u ) . The fairness function initially favors uniform codeword usage but minimizes dis- tortion as training progresses. The algorithm is an implementation of the Grossberg conscience princi- ple and works as follows (Krishnamurthy et al., 1990): 1. Consider an input vector x. 2. Find the distortion D i = F ( u i ) d ( x , w i) for all
output units. 3. Select the output unit i* with the smallest distor-
tion and label it as the winning unit and increment
g i * "
4. Adjust the selected weight vector wi.(n + 1)= wi,(n) + E(n)[ x ( n ) - wi,(n)] where n is the training time and 0 < E(n) < 1.
5. Repeat steps 1 -4 for all training vectors.
2.2. K-means clustering
Clustering algorithms are a class of data reduction techniques. Hierarchical clustering algorithms start with n clusters, where n is the number of observa- tions, such as people, each having information on k
P.V. Balakrishnan et a l . / European Journal of Operational Research 93 (1996) 346-357 349
dimensions, such as demographic data. The distance between observations is calculated in k-dimensional space. The two closest points are merged into a cluster. This process continues until all observations are in one cluster. One then has to determine the number of clusters using a decision rule (Milligan and Cooper, 1985).
In non-hierarchical clustering, the researcher spec- ifies the number of clusters in the data set a priori. Since this approach matches the vector quantization problem, a non-hierarchical method is used here for comparison. The K-means procedure, as used by FASTCLUS in SAS (SAS, 1990), selects M random points from the data set. These are used as cluster seeds and all other points are assigned to the nearest cluster seed. Successive iterations involve replacing the current cluster seed by the cluster mean and then reassigning all points to the nearest new cluster seed. The process continues until there is no change in cluster means from the previous iteration or the difference is very small.
3. An application o f the FSCL network and K- means methodology
The actual data employed in this study represent the brand switching probabilities on 18 different coffee brands derived from scanner data. The data collection procedure and method of constructing these switching probabilities are described in Bucklin and Srinivasan (1991). The input to the K-means cluster- ing algorithm and FSCL network was an average probability switching vector (18-dimensional) at the sub-household level. There were a total of 207 sub- households which were to be clustered into six dis- tinct segments as recommended by Bucklin and Srinivasan (1991). Each of these 207 objects to be grouped was represented by a vector specifying choice probabilities for 18 brands of coffee.
The data set comprising 207 × 18 choice proba- bilities was then clustered using the FSCL network as well as the K-means algorithm to generate a six-segment solution. In the study, the K-means procedure for non-hierarchical clustering was per- formed with iterations. In this case, the algorithm needed 11 iterations to converge using the default values and stopping rule.
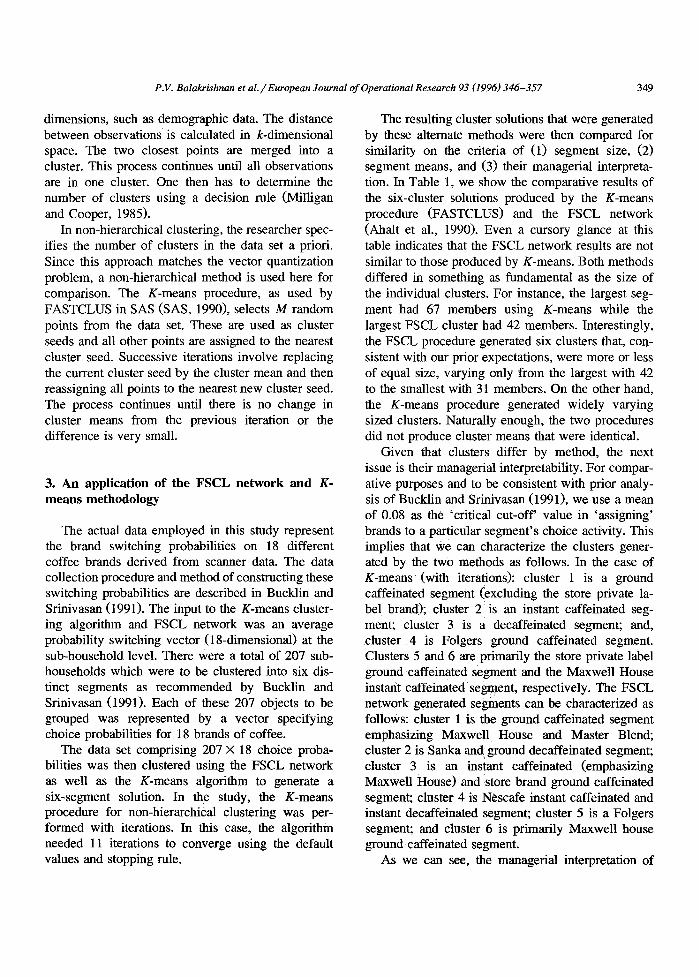
The resulting cluster solutions that were generated by these altemate methods were then compared for similarity on the criteria of (1) segment size, (2) segment means, and (3) their managerial interpreta- tion. In Table 1, we show the comparative results of the six-cluster solutions produced by the K-means procedure (FASTCLUS) and the FSCL network (A_halt et al., 1990). Even a cursory glance at this table indicates that the FSCL network results are not similar to those produced by K-means. Both methods differed in something as fundamental as the size of the individual clusters. For instance, the largest seg- ment had 67 members using K-means while the largest FSCL cluster had 42 members. Interestingly, the FSCL procedure generated six clusters that, con- sistent with our prior expectations, were more or less of equal size, varying only from the largest with 42 to the smallest with 31 members. On the other hand, the K-means procedure generated widely varying sized clusters. Naturally enough, the two procedures did not produce cluster means that were identical.
Given that clusters differ by method, the next issue is their managerial interpretability. For compar- ative purposes and to be consistent with prior analy- sis of Bucklin and Srinivasan (1991), we use a mean of 0.08 as the 'critical cut-off' value in 'assigning' brands to a particular segment's choice activity. This implies that we can characterize the clusters gener- ated by the two methods as follows. In the case of K-means (with iterations): cluster 1 is a ground caffeinated segment (excluding the store private la- bel brand); cluster 2 i s an instant caffeinated seg- ment; cluster 3 is a decaffeinated segment; and, Cluster 4 is Folgers: ground caffeinated segment. Clusters 5 and 6 are primarily the store private label ground caffeinated segment and the Maxwell House instant caffeinated segment, respectively. The FSCL network generated segments can be characterized as follows: cluster 1 is the ground caffeinated segment emphasizing Maxwell House and Master Blend; cluster 2 is Sanka and ground decaffeinated segment; cluster 3 i s an instant caffeinated (emphasizing Maxwell House) and store brand ground caffeinated segment; cluster 4 is Nescafe instant caffeinated and instant decaffeinated segment; cluster 5 is a Folgers segment; and cluster 6 is primarily Maxwell house ground caffeinated segment.
As we can see, the managerial interpretation of
C~
Tab
le
I
Mea
ns
of
clus
ters
gen
erat
ed w
ith
K-m
ean
s an
d F
SC
L n
etw
ork
Clu
ster
ing
tech
niqu
e C
lust
er
Siz
e C
lust
er m
ean
s a
GC
G
D
IC
ID
MH
b
MB
H
L
FG
S
PL
B
R
MH
S
A
MH
N
C
TC
F
G
BR
M
H
SA
N
C
TC
H
P
K-m
eans
: F
AS
TC
LU
S
1
wit
h 11
ite
rati
ons
2 3 4 5 6
FS
CL
neu
ral
net
wo
rk
1 2 3 4 5 6
67
0.35
0.
30
0.09
0.
10
0.06
0.
01
0.04
0.
01
0.01
0.
01
0.02
0.
01
..
..
..
62
0.05
0.
05
0.03
0.
04
0.04
0.
01
0.03
0.
02
0.08
0.
11
0.12
0.
11
0.04
0.
05
0.05
0.
08
0.07
0.
04
'36
0.
02
0.01
0.
02
0.02
-
0.17
0.
18
0.19
-
- 0.
01
0.01
0.
06
0.06
0.
12
0.02
0.
09
0.02
20
0.12
0.
07
0;03
0.
64
0.01
-
0.02
-
- 0.
01
0.04
0.
07
..
..
..
12
0.14
0.
01
0.08
0.
05
0.56
-
0.05
0.
01
0.04
-
- 0.
02
- 0.
01
0.01
-
- -
10
..
..
..
..
0.
66
0.12
0.
04
0.14
-
0.03
0.
01
0.01
-
-
42
0.30
0.
41
0.09
0.
06
0.06
-
0.03
-
0.01
0.
01
0.02
.
..
..
..
35
0.04
0.
04
0.03
0.
03
0.04
0.
10
0.21
0.
19
0.01
0.
01
0.02
0.
01
0.03
0.
05
0.10
0.
03
0.03
0.
01
34
0.
03
0.02
0.
04
0.02
0.
15
- 0.
01
- 0.
30
0.08
0.
08
0.13
0.
02
0.05
0.
03
0.02
0.
01
-
33
0.01
0.
01
0.01
0.
01
- 0.
09
0.02
0.
03
0.02
0.
13
0.04
0.
03
0.08
.0
07
0.10
0.
13
0.16
0.
07
32
0.07
0.
07
0.06
0.
41
0.03
0.
01
0.02
0.
01
0.02
0.
03
0.13
0.
12
0.01
-
- -
0.02
-
31
0.43
0.
09
0.05
0.
16
0.11
0.
02
0.05
0.
02
0.02
0.
01
0.01
0.
04
..
..
..
a C
hoic
e pr
obab
ilit
ies
of e
ight
een
bran
ds o
f co
ffee
(B
01
-B 1
8) c
olle
cted
fro
m 2
07 h
ouse
hold
s (N
=
207)
. C
lust
ers
are
list
ed i
n d
esce
nd
ing
ord
er a
cco
rdin
g t
o si
ze.
Mea
ns
less
than
0.0
05 a
re d
enot
ed w
ith
"-".
,~
b
Cof
fee
Typ
es:
GC
= g
rou
nd
caf
fein
ated
, G
D =
gro
un
d d
ecaf
fein
ated
, IC
= i
nsta
nt c
affe
inat
ed,
ID =
in
stan
t de
caff
eina
ted.
Cof
fee
Bra
nds:
MH
=
Max
wel
l H
ouse
, M
B =
Mas
ter
Ble
nd,
HL
=
Hil
ls B
roth
ers,
FG
= F
olge
rs,
SP
L =
sto
re p
riva
te l
abel
, B
R =
Bri
m,
SA
= S
anka
, N
C =
Nes
cafe
, T
C =
Tas
ter'
s C
hoic
e, H
P =
H
igh
Poi
nt.
I "-.4

P. V. Balakrishnan et al. / European Journal of Operational Research 93 (1996) 346-357 351
the two sets of segments is not the same. This raises an interesting question about which segmentation scheme should be adopted in the development of marketing strategies. To answer such a question requires studying the comparative performance of the two approaches to cases wherein the ' true' clus- ter solutions are known. To this end, the next stage of the research, then focuses on studying the two approaches on simulated data with known cluster solutions representing different qualities of data.
4. Methodology
Several factors can affect the quality of cluster recovery, such as the number of clusters in the data, the number of dimensions used to describe the data, and the level of error in the data (Milligan, 1980). This study consists of a full factorial experimental design crossing the number of clusters with the number of dimensions (attributes) with levels of error. The result is a 4 × 3 × 3 design with three replications per cell, for a total of 108 data sets. This is a common approach to evaluating clustering meth- ods (Milligan, 1980; Milligan and Cooper, 1985, 1987). Each data set is generated using the procedure of Milligan (1985) procedure and contains 50 points. The FSCL network and the K-means algorithms each clustered all 108 data sets.
The number of true clusters in each data set was 2, 3, 4, or 5 with a roughly equal distribution of points in each cluster. The number of measures (i.e., attributes) used to characterize each data set was varied so that all points in a data set were described by a 4-, 6-, or &dimensional: space. The three levels of error were no error, low error; or high error. The no error level would be similar to a noiseless trans- mission of data or data obtained when there is no data collection and measurement error.
The simulation data were generated as mmcated, multivariate normal distributions in Euclidean space. The data sets were :created to have reasonably dis- tinct and separate clusters as defined by internal cohesion and external isolation (Cormack, 1971). Internal cohesion in these data sets require all data points to be within the boundaries of the cluster on all dimensions. Boundaries were three standard devi- ations across for all dimensions. External isolation
was operationalized by having the first dimension be non-overlapping. The distance between clusters was f ( S 1 + $2), where f is the separation factor and S l and S 2 are the standard deviations of cluster 1 and 2, respectively, on the first dimension (see Milligan, 1985). The value of f was randomly selected from a uniform distribution bounded by 0.25 and 0.75. Other dimensions were permitted to overlap. Thus, cluster separation is guaranteed on the first dimension only in the non-error condition.
The data point coordinates were error-perturbed to distort the true distances between points to achieve low and high error. This simulates noise in the data which can occur with data collection or measurement error. The low error condition still did not permit overlap on the first dimension but the separation was very small. The high error condition did have cluster overlap on the first dimension and possibly on the other dimensions. New interpoint distances were cal- culated using [~'~,i( A i j - A i k - 3Eijk)2] l/2, where Aij and Aik are the original coordinate values for obser- vation j and k on dimension i. The error term is generated from a univariate normal distribution with a mean of zero and a standard deviation determined by taking the average of the standard deviations on dimension i for the two clusters containing points j and k. The multiplication factor, 8, had values of 1 or 2, which determined the low and high error levels, respectively (Milligan, 1985).
The FSCL network Used the fairness function F(u i) = It i t i e - ( / r where /3 and T are constants and t is the training iteration number. The current imple- mentation uses a /3 value of 0.06 and 1 / T value of 0.00005. T h e learning rate used was E(n) = 0.06 e-°"°5("- l).
5. Results on simulated data
The results of the K-means clustering and FSCL network techniques were compared on overall cluster recovery and sensitivity to cluster characteristics. The percent of the 50 observations misclassified by the different techniques indicated cluster recovery performance. Analyses of variance (ANOVAs) using the general linear models procedure (GLM) available in the current edition of SAS (1990) tested hypothe- ses about the effects of the data characteristics on the
352 P.V. Balakrishnan et al. / European Journal of Operational Research 93 (1996) 346-357
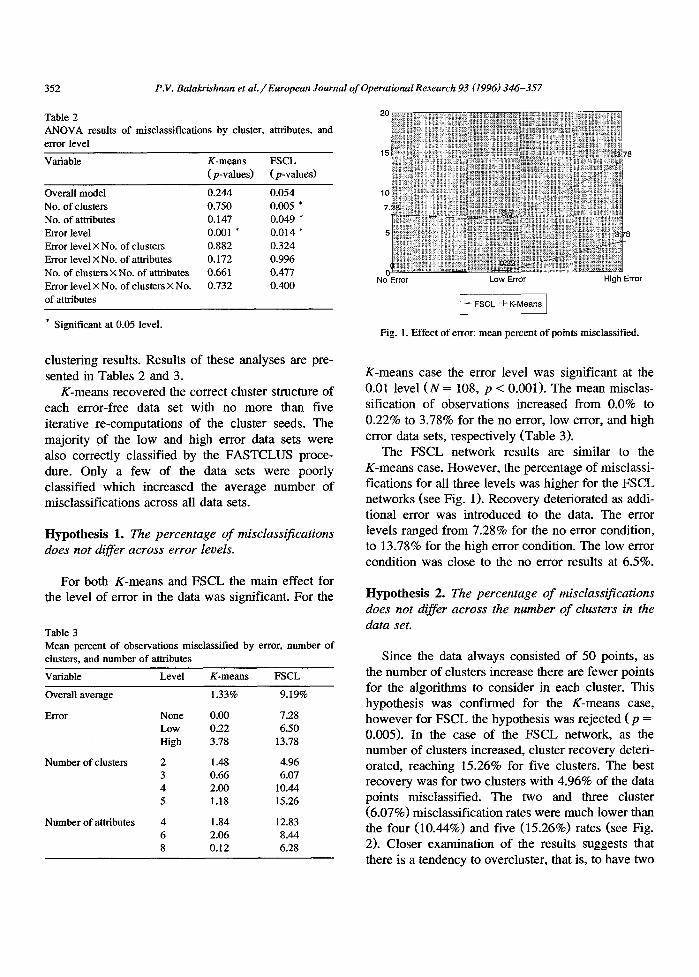
Table 2 ANOVA results of misclassifications by cluster, error level
attributes, and
Variable K-means FSCL (p-values) (p-values)
Overall model 0.244 0.054 No. of clusters 0.750 0.005 * No. of attributes 0.147 0.049 * Error level 0.001 * 0.014 * Error level × No. of clusters 0.882 0.324 Error level × No. of attributes 0.172 0.996 No. of clusters × No. of attributes 0.661 0.477 Error level X No. of clusters × No. 0.732 0.400 of attributes
* Significant at 0.05 level.
No Error Low Error High Error
~ - ~ FSCL q- K-Means
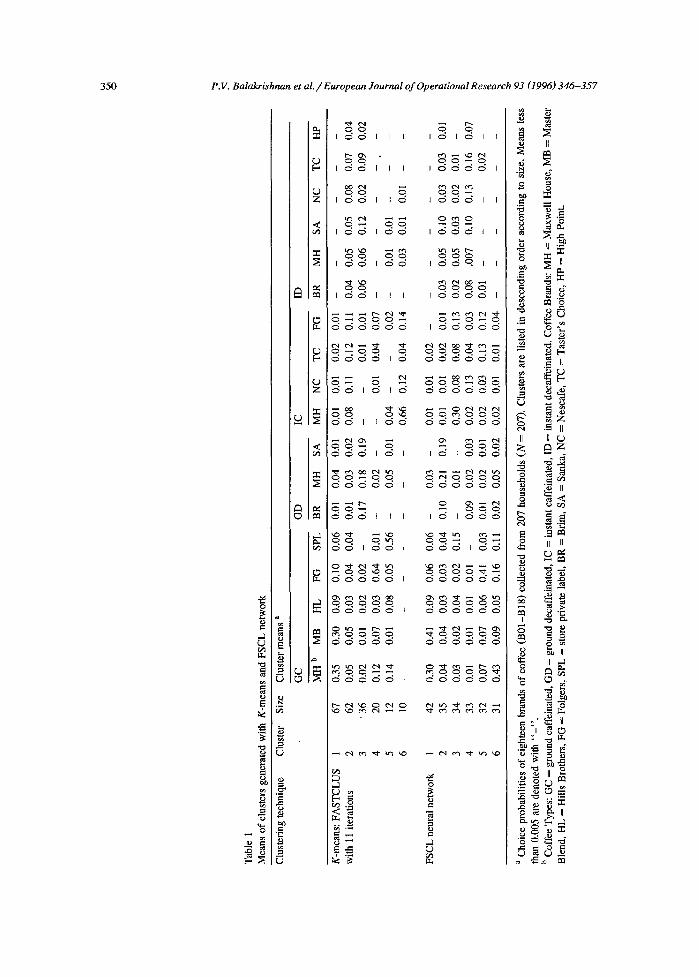
Fig. 1. Effect of error: mean percent of points misclassified.
clustering results. Results of these analyses are pre- sented in Tables 2 and 3.
K-means recovered the correct cluster structure of each error-free data set with no more than five iterative re-computations of the cluster seeds. The majority of the low and high error data sets were also correctly classified by the FASTCLUS proce- dure. Only a few of the data sets were poorly classified which increased the average number of misclassifications across all data sets.
Hypothesis 1. The percentage o f misclassifications does not differ across error levels.
For both K-means and FSCL the main effect for the level of error in the data was significant. For the
Table 3 Mean percent of observations misclassified by error, number of clusters, and number of attributes
Variable Level K-means FSCL
Overall average
Error
Number of clusters
Number of attributes
1.33% 9.19%
None 0.00 7.28 Low 0.22 6.50 High 3.78 13.78
2 1.48 4.96 3 0.66 6.07 4 2.00 10.44 5 1.18 15.26
4 1.84 12.83 6 2.06 8.44 8 0.12 6.28
K-means case the error level was significant at the 0.01 level (N = 108, p < 0.001). The mean misclas- sification of observations increased from 0.0% to 0.22% to 3.78% for the no error, low error, and high error data sets, respectively (Table 3).
The FSCL network results are similar to the K-means case. However, the percentage of misclassi- fications for all three levels was higher for the FSCL networks (see Fig. 1). Recovery deteriorated as addi- tional error was introduced to the data. The error levels ranged from 7.28% for the no error condition, to 13.78% for the high error condition. The low error condition was close to the no error results at 6.5%.
Hypothesis 2. The percentage o f misclassifications does not differ across the number of clusters in the data set.
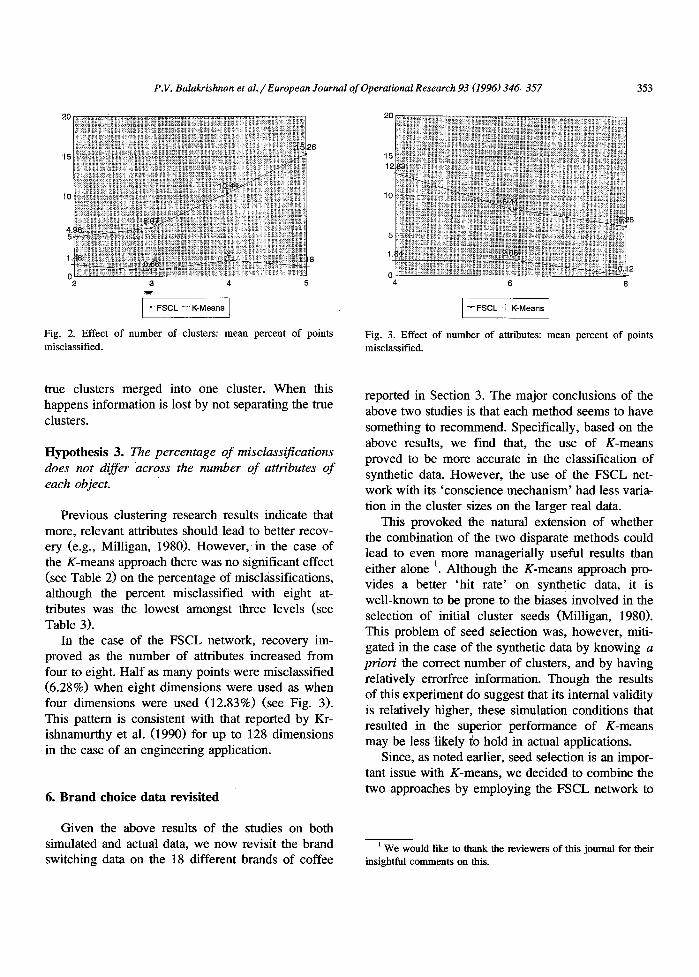
Since the data always consisted of 50 points, as the number of clusters increase there are fewer points for the algorithms to consider in each cluster. This hypothesis was confirmed for the K-means case, however for FSCL the hypothesis was rejected (p = 0.005). In the case of the FSCL network, as the number of clusters increased, cluster recovery deteri- orated, reaching 15.26% for five clusters. The best recovery was for two clusters with 4.96% of the data points misclassified. The two and three cluster (6.07%) misclassification rates were much lower than the four (10.44%) and five (15.26%) rates (see Fig. 2). Closer examination of the results suggests that there is a tendency to overcluster, that is, to have two
P.V. Balakrishnan et al. / European Journal of Operational Research 93 (1996) 346-357 353
2 3 4 5
FSCL + K-Means 1
Fig. 2. Effect of number of clusters: mean percent of points misclassified.
4 6 8
FSCL + K-Means
Fig. 3. Effect of number of attributes: mean percent of points misclassified.
true clusters merged into one cluster. When this happens information is lost by not separating the true clusters.
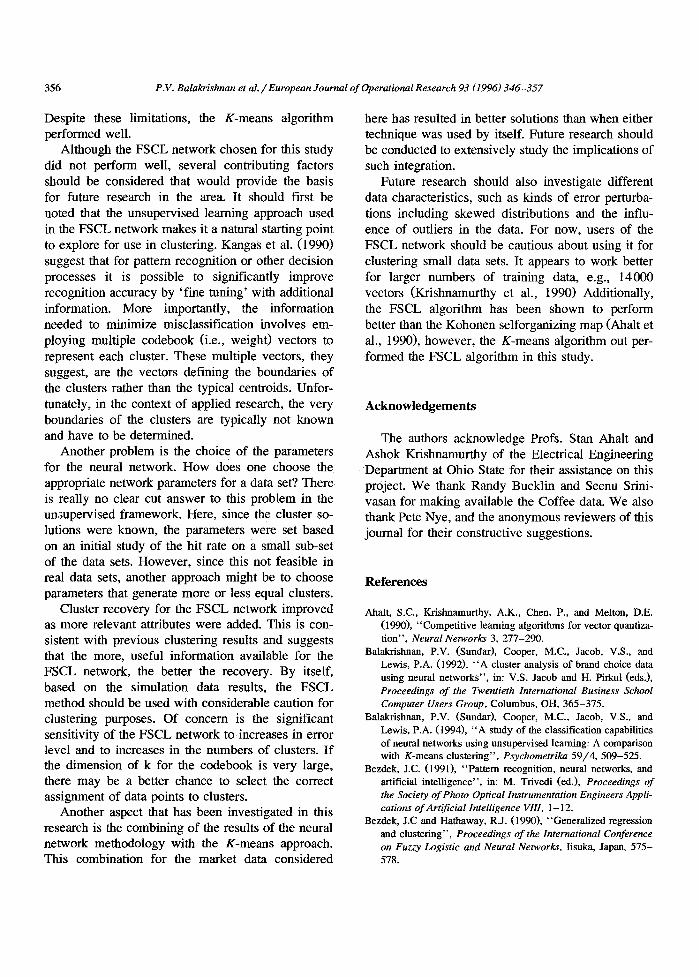
Hypothesis 3. The percentage of misclassifications does not differ across the number of attributes of each object.
Previous clustering research results indicate that more, relevant attributes should lead to better recov- ery (e.g., Milligan, 1980). However, in the case of the K-means approach there was no significant effect (see Table 2) on the percentage of misclassifications, although the percent misclassified with eight at- tributes was the lowest amongst three levels (see Table 3).
In the case of the FSCL network, recovery im- proved as the number of attributes increased from four to eight. Half as many points were misclassified (6.28%) when eight dimensions were used as when four dimensions were used (12.83%) (see Fig. 3). This pattern is consistent with that reported by Kr- ishnamurthy et al. (1990) for up to 128 dimensions in the case of an engineering application.
6. Brand choice data revisited
Given the above results of the studies on both simulated and actual data, we now revisit the brand switching data on the 18 different brands of coffee
reported in Section 3. The major conclusions of the above two studies is that each method seems to have something to recommend. Specifically, based on the above results, we find that, the use of K-means proved to be more accurate in the classification of synthetic data. However, the use of the FSCL net- work with its 'conscience mechanism' had less varia- tion in the cluster sizes on the larger real data.
This provoked the natural extension of whether the combination of the two disparate methods could lead to even more managerially useful results than either alone i~ Although the K-means approach pro- vides a better 'hit rate' on synthetic data, it is well-known to be prone to the biases involved in the selection of initial cluster seeds (Milligan, 1980). This problem of seed selection was, however, miti- gated in the case of the synthetic data by knowing a priori the correct number of clusters, and by having relatively errorfree information. Though the results of this experiment do suggest that its internal validity is relatively higher, these simulation conditions that resulted in the superior performance of K-means may ibe less likely to hold in actual applications.
Since, as noted earlier, seed selection is an impor- tant issue with K-means, we decided to combine the two approaches by employing the FSCL network to
We would like to thank the reviewers of this journal for their insightful comments on this.

354 P.V. Balakrishnan et al. / European Journal of Operational Research 93 (1996)346-357
assist in providing the initial seeds. We use the FSCL network results as the seeds to the K-means method, the approach that we 'trust ' more for the final cluster solution. The resulting solution should be intriguing because we now have the opportunity to assess how the K-means results change with the new seeds. If the K-means method is particularly robust, then even with the different starting point the results may turn out to be identical to the original K-means. Altematively, given the new starting point, the results could be similar to the FSCL results or somewhere in between the original FSCL and K- means results. Hence, we now have the opportunity to assess the quality of the resulting solution in terms of ease of interpretation, face validity, and disparity in the obtained cluster sizes when the seeds from FSCL are employed.
In the study, the K-means procedure for non- hierarchical clustering was performed with iterations using as the input seeds (reported in Table 1) the centroids of the cluster solution provided by the FSCL network. In this case, the K-means algorithm needed 15 iterations to converge using the traditional default values stopping rule 2(see Table 4).
Interestingly, the resulting solution provided clus- ters of more equal sizes than the K-means method by itself. The variation of cluster sizes ranged from a high of 49 to a low of 19 3. Given that these cluster sizes are managerially more useful, the next issue is their managerial interpretability. We can characterize the clusters generated by the combination of the two methods as follows: cluster 1 is the segment Maxwell House and Master Blend ground caffeinated; cluster 2 is the ground decaffeinated segment; cluster 3 is the instant caffeinated segment; cluster 4 is the in- stant decaffeinated segment; cluster 5 is the Folgers ground caffeinated segment; and cluster 6 is the ground caffeinated segment emphasizing Maxwell House.
As should be fairly clear from the above cluster solution, the resulting segments are much 'cleaner',
2 The analysis was rerun by relaxing the various default param- eters of convergence and number of iterations. Changing these parameters had no effect on the resulting clusters.
3 This was, however, a more unequal sized outcome than that provided by the FSCL network by itself.
and have better managerial interpretability than ei- ther of the methods individually as reported in Table 1. In particular, the combined approach seems to have generated clusters with greater precision. For instance, even though we started with the seeds using the FSCL network, the new cluster 5 with 19 house- holds and 0.64 choice probability for Folgers' ground caffeinated (GC-F) is more meaningful than the one obtained by FSCL alone which had 32 members but grouped together more households with greater pur- chase variations to lower the GC-F choice probabil- ity to 0.41. Similarly, the new cluster 1 has fewer (35) members who on aggregate have a much higher purchase probability (0.45) for the 'Master Blend- ground caffeinated' when compared with 67 mem- bers with 0.30 choice probability for the K-means stand alone approach. Again, the new cluster 2 iden- tifies more precisely the members of the Ground Decaffeinated segment, i.e., those having greater purchase probabilities, than either of the other two methods by themselves. The higher 'face validity' of the results obtained, and the fewer anomalies pre- sent, seems to imply that the combination of conven- tional statistical techniques along with the newer machine learning algorithms may have much to offer and might be the direction to take in the future.
7. Discussion and conclusions
While the procedure for generating data sets in the study reported here has been used for clustering research comparisons, it has only been used once for neural networks (Balakrishnan et al., 1994). As such, some limitations relating to the study are noted. First, the number of data points may be considered relatively small when compared to those commonly used for neural networks. Second, conducting the analysis on error-free data and knowing the correct number of clusters in the data may have favorably biased the results as the most serious problem in the K-means approach is the selection of initial cluster seeds (see Milligan, 1980). Using the correct number of clusters and error-free data significantly reduced the problem of selecting the seeds. Analyses con- ducted on data with skewed distributions or other forms of error may result in a lower recovery rate.

Tab
le 4
Mea
ns o
f cl
uste
rs g
ener
ated
wit
h K
-mea
ns
usin
g F
SC
L n
etw
ork
out
put
as s
eeds
Clu
ster
ing
tech
niqu
e C
lust
er
Siz
e C
lust
er m
ean
s a
GC
G
D
IC
ID
MH
b
MB
H
L
FG
S
PL
B
R
MH
S
A
MH
N
C
TC
F
G
BR
M
H
SA
N
C
TC
H
P
K-m
ean
s w
ith
FS
CL
1
Net
wo
rk O
utpu
t as
See
ds
2 3 4 5 6
35
0.33
0.
45
0.07
0.
04
0.03
-
0.04
-
- -
0.01
.
..
..
..
23
0.02
0.
02
0.03
0.
04
0.02
0.
21
0.28
0.
24
- -
- 0.
01
0.03
0.
02
0.05
--
0.
01
0.02
46
0.06
0.
05
0.04
0.
05
0.13
-
0.01
-
0.23
0.
08
0.13
0.
15
0.02
0.
03
0.01
0.
01
0.01
-
49
0.
03
0.03
0.
02
0.01
0.
02
0.03
0.
04
0.04
0.
04
0.10
0
.04
0.
03
0.06
0.
08
0.13
0.
11
0.13
0.
05
19
0.09
0
.09
0.
03
0.64
0.
01
- 0.
02
- -
0.01
0
.04
0.
07
..
..
..
~"
35
0.38
0
.09
0.
10
0.16
0.
13
0.02
0.
04
0.01
0.
01
0.01
0.
02
0.03
.
..
..
.
~
a C
hoic
e pr
obab
ilit
ies
of
eigh
teen
bra
nds
of
coff
ee (
B0
1-B
18
) co
llec
ted
fro
m 2
07 h
ou
seh
old
s (N
=
207)
. M
ean
s le
ss t
han
0.00
5 ar
e d
eno
ted
wit
h "-
".
b C
offe
e T
ypes
: G
C =
gro
un
d C
affe
inat
ed,
GD
= g
rou
nd
dec
affe
inat
ed,
IC -
in
stan
t ca
ffei
nate
d, I
D =
ins
tant
dec
affe
inat
ed.C
offe
e B
rand
s: M
H =
M
axw
ell
Hou
se,
MB
= M
aste
r
Ble
nd,
HL
= H
ills
Bro
ther
s, F
G =
Fol
gers
, S
PL
= S
tore
Pri
vate
Lab
el,
BR
= B
rim
, S
A =
San
ka,
NC
=
Nes
cafe
, T
C =
Tas
ter'
s C
hoic
e, H
P =
H
igh
Poi
nt.
,.4
tji
356 P.V. Balakrishnan et aL / European Journal of Operational Research 93 (1996) 346-357
Despite these limitations, the K-means algorithm performed well.
Although the FSCL network chosen for this study did not perform well, several contributing factors should be considered that would provide the basis for future research in the area. It should first be noted that the unsupervised learning approach used in the FSCL network makes it a natural starting point to explore for use in clustering. Kangas et al. (1990) suggest that for pattern recognition or other decision processes it is possible to significantly improve recognition accuracy by 'fine tuning' with additional information. More importantly, the information needed to minimize misclassification involves em- ploying multiple codebook (i.e., weight) vectors to represent each cluster. These multiple vectors, they suggest, are the vectors defining the boundaries of the clusters rather than the typical centroids. Unfor- tunately, in the context of applied research, the very boundaries of the clusters are typically not known and have to be determined.
Another problem is the choice of the parameters for the neural network. How does one choose the appropriate network parameters for a data set? There is really no clear cut answer to this problem in the unsupervised framework. Here, since the cluster so- lutions were known, the parameters were set based on an initial study of the hit rate on a small sub-set of the data sets. However, since this not feasible in real data sets, another approach might be to choose parameters that generate more or less equal clusters.
Cluster recovery for the FSCL network improved as more relevant attributes were added. This is con- sistent with previous clustering results and suggests that the more, useful information available for the FSCL network, the better the recovery. By itself, based on the simulation data results, the FSCL method should be used with considerable caution for clustering purposes. Of concern is the significant sensitivity of the FSCL network to increases in error level and to increases in the numbers of clusters. I f the dimension of k for the codebook is very large, there may be a better chance to select the correct assignment of data points to clusters.
Another aspect that has been investigated in this research is the combining of the results of the neural network methodology with the K-means approach. This combination for the market data considered
here has resulted in better solutions than when either technique was used by itself. Future research should be conducted to extensively study the implications of such integration.
Future research should also investigate different data characteristics, such as kinds of error perturba- tions including skewed distributions and the influ- ence of outliers in the data. For now, users of the FSCL network should be cautious about using it for clustering small data sets. It appears to work better for larger numbers of training data, e.g., 14000 vectors (Krishnamurthy et al., 1990) Additionally, the FSCL algorithm has been shown to perform better than the Kohonen selforganizing map (Ahalt et al., 1990), however, the K-means algorithm out per- formed the FSCL algorithm in this study.
Acknowledgements
The authors acknowledge Profs. Stan Ahalt and Ashok Krishnamurthy of the Electrical Engineering Department at Ohio State for their assistance on this project. We thank Randy Bucklin and Seenu Srini- vasan for making available the Coffee data. We also thank Pete Nye, and the anonymous reviewers of this journal for their constructive suggestions.
References
Ahalt, S.C., Krishnamurthy, A.K., Chen, P., and Melton, D.E. (1990), "Competitive learning algorithms for vector quantiza- tion", Neural Networks 3, 277-290.
Balakrishnan, P.V. (Sundar), Cooper, M.C., Jacob, V.S., and Lewis, P.A. (1992), "A cluster analysis of brand choice data using neural networks", in: V.S. Jacob and H. Pirkul (eds.), Proceedings of the Twentieth International Business School Computer Users Group, Columbus, OH, 365-375.
Balakrishnan, P.V. (Sundar), Cooper, M.C., Jacob, V.S., and Lewis, P.A. (1994), " A study of the classification capabilities of neural networks using unsupervised learning: A comparison with K-means clustering", Psychometrika 59/4, 509-525.
Bezdek, J.C. (1991), "Pattern recognition, neural networks, and artificial intelligence", in: M. Trivedi (ed.), Proceedings of the Society of Photo Optical Instrumentation Engineers Appli- cations of Artificial Intelligence VIII, 1-12.
Bezdek, J.C and Hathaway, RJ. (1990), "Generalized regression and clustering", Proceedings of the International Conference on Fuzzy Logistic and Neural Networks, Iisuka, Japan, 575- 578.

P.V. Balakrishnan et aL / European Journal of Operational Research 93 (1996) 346-357 357
Bucklin, R.E., and V. Srinivasan (1991), "Determining interbrand substitutability through survey measurement of consumer pref- erence structures", Journal of Marketing Research XXVII (February), 58-71.
Cooper, M.C., and Milligan, G.W. (1988), "The effect of mea- surement error on determining the number of clusters in cluster analysis", Data Analysis, Decision Support and Expert Knowledge Representation in Marketing and Related Areas of Research, Karlsruhe, Germany, 319-328.
Cormack, R.M. (1971), "A review of classification", Journal of the Royal Statistical Society, Series A 134, 321-367.
Dubes, R.C. (1987), "How many clusters are best? - - An experiment", Pattern Recognition 20/6, 645-663.
Fort, J.C. (1991), "Kohonen algorithm and the traveling salesman problem", in: F. Murtagh (ed.), Neural Networks for Statisti- cal and Economic Data, Munotec Systems Ltd, Dublin (sup- ported by the Statistical Office of the European Communities, Luxembourg), 113-118.
Gath, I., and Geva, A.B. (1988), "Unsupervised optimal fuzzy clustering", IEEE Transactions on Pattern Analysis and Ma- chine Intelligence 11/7, 773-781.
Grossberg, S. (1976), "Adaptive pattern classification and univer- sal recoding: I. Parallel development and coding of neural feature detectors", Biological Cybernetics 23, 121-134.
Hecht-Nielsen, R. (1988), "Application of counterpropogation networks", Neural Networks 1/2, 131-141.
Hecht-Nielsen, R. (1990), Neurocomputing, Addison-Wesley, Reading, MA.
Kangas, J.A., Kohonen, T.K., and Laaksonen, J.T. (1990), "Variants of self-organizing maps", IEEE Transactions on Neural Networks' 1/1, 93-99.
Kohonen, T. (1982a), "Self-organized formation of topologically correct feature maps", Biological Cybernetics 43, 59-69.
Kohonen, T. (1982b), "Analysis of a simple self organizing process", Biological Cybernetics 44, 135-140.
Kohonen, T. (1989), Self Organization and Associative Memory, 3rd edn., Springer-Verlag, New York.
Krishnamurthy, A.K., Ahalt, S.C., Melton, D.E., and Chen, P. (1990), "Neural networks for vector quantization of speech and images", IEEE Journal on Selected Areas in Communica- tions 8, 1449-1457.
Linde, Y., Buzo, A., and Gray, R.M. (1980), "An algorithm for vector quantization design", IEEE Transactions on Communi- cations 28/1, 84-95.
Lippmann, R. R. (April, 1987), "An inla'oduction to computing with neural nets", IEEE Acoustics, Speech and Signal Pro- cessing Magazine 4/2, 4-22.
Milligan, G.W. (1980), "An examination of the effect of six types
of error perturbation on fifteen clustering algorithms", Psy- chometrika 45, 325-342.
Milligan, G.W. (1985), "An algorithm for generating artificial test clusters", Psychometrika 50, 123-127.
Milligan, G.W., and Cooper, M.C. (1985), "An examination of procedures for determining the number of clusters in a data set", Psychometrika 50, 159-179.
Milligan, G.W., and Cooper, M.C. (1987), "Methodology review: Clustering methods", Applied Psychological Measurement 11/4, 329-354.
Murtagh, F. (1991a), "A short survey of neural networks for forecasting", in: F. Murtagh (ed.), Neural Networks for Statis- tical and Economic Data, Munotec Systems Ltd, Dublin (sup- ported by the Statistical Office of the European Communities, Luxembourg), 87-94.
Naylor, J., and Ei, K.P. (1988), "Analysis of a neural network algorithm for vector quantization of speech parameters", Pro- ceedings of the First Annual INNS Meeting, Pergamon, new York, 310.
Nelson, M.M., and Illingworth, W.T. (1991), A Practical Guide to Neural Networks, Addison-Wesley, Reading, MA.
Openshaw, S., and Wymer, C. (1991), "A neural net classifier system for handling census data", in: F. Murtagh (ed.), Neu- ral Networks for: Statistical and Economic Data, Munotec Systems Ltd, Dublin (supported by the Statistical Office of the European Communities, Luxembourg), 73-86.
Osipenko, V.V. (1988), "Solution of a double clusterization problem with the use of self-organization' ', Sooiet Journal of Automation and Information Sciences 21/3, 77-82.
Rowher, R. (i991), "Neural networks for time-varying data", in: F. Murtagh (ed.), Neural Networks for Statistical and Eco- nomic Data, Munotec Systems Ltd, Dublin (supported by the Statistical Office of the European Communities, Luxembour~, 59-69.
Rumelhart, D.E., McClelland, J.L., and the PDP Research Group (1987), Parallel Distributed Processing: Explorations in the Microstructure of Cognition, Volume 1: Foundations, MIT Press, Cambridge, MA.
SAS (1990), SAS User's Guide: Statistics, (Version 5 Edition) SAS Institute Inc., Cary, NC.
Wilson, R.L., and Sharda, R. (1994), "Bankruptcy prediction using neural networks", Decision Support Systems 11/3, 545-557.
Winters, J.H., and Rose; C: (1989), "Minimum distance automata .in parallel networks for optimum classification", Neural Net- works 127-132.