Using K-means Cluster and Fuzzy C Means for Defect Segmentation in Fruits
7
Proceedings of the 2 nd International Conference on Current Trends in Engineering and Management ICCTEM-2014 17 – 19, July 2014, Mysore, Karnataka, India Copyright © 2014 by VVCE, Mysore USING K-MEANS CLUSTER AND FUZZY C MEANS FOR DEFECT SEGMENTATION IN FRUITS VaniAshok 1 , Dr. D.S. Vinod 2 1 Research Scholar, Computer Science & Engineering, Sri Jayachamarajendra College of Engg., Mysore, India 2 Associate Professor, Information Science & Engineering, Sri Jayachamarajendra College of Engg., Mysore, India 1 [email protected] 2 [email protected] Abstract: Quality and safety are the key factors in modern food industries. The quality of fruits and vegetables is a common combination of characteristics, attributes and properties that have significance and make for acceptability. One of the most popular applications of computer vision is to inspect qualities of food products based on form, color and presence of defects. Appearance factors such as size or dimension, shape, surface texture, surface color, and external or surface defects define external quality and directly influence consumers in purchasing a product, and they can be evaluated by means of computer vision techniques. The proposed paper presents defect segmentation of fruits based on surface color features with unsupervised K-Means clustering and Fuzzy C-Means algorithms. As the first step, the digital color images of defective apples are pre-processed using Gaussian low-pass filter (GLPF) smoothing operator to remove noise. The images are then segmented with the purpose of separating the defects from the edible regions using proposed clustering algorithms. A comparison analysis is also performed among the two methods. Keywords: Image segmentation, Clustering, Histogram, Filtering, K-means, Fuzzy C-Means (FCM) 1. INTRODUCTION Quality and safety are the key factors in modern food industries. Increasing consciousness of quality, particularly in the food and health sector, strongly demands research activities regarding the production of defined quality, the preservation of quality during marketing, and thus also the possibilities of evaluating quality parameters and of integrating this into production processes. The pallet of possible damage to fruit and vegetables is extremely extensive and is often a criterion of quality determination methods, for example, malformations, rust fungi, formation of cork, splits, bitter pit, insect damage, rots, scalds, temperature damage, and glassiness or other physiological diseases of the storage phase. In addition, there are various risks for injuries during harvest and transport [1]. With the increasing quality awareness among consumers, the expectation for improved quality in agricultural and food products has increased the need for enhanced quality monitoring. There is a need to develop various image analysis techniques to meet the demand of the growing population. Moreover there is growing demand for automation in food industries due to the fact that the traditional labor intensive manual inspection processes are inefficient, inaccurate and ineffective. The application of computer vision in agriculture has increased considerably in recent years due to the fact that it provides substantial amounts of information about the nature and attributes of the objects present in a scene. The use of this technology has spread rapidly in inspecting agri-food commodities, including meat quality assessment, automated poultry carcass inspection, quality evaluation of fish, visualization of sugar distribution of melons, measuring ripening of tomatoes, defect detection of pickling cucumber, and classification of wheat kernels [2]. The computer vision is particularly used more in automatic inspection of fruits and vegetables, since it is more reliable and objective than human inspection [3]. Quality assessment of fruits and vegetables is done based on the analysis of external features like color, size, shape, texture and presence of damage. As consumers are mostly influenced to choose or reject a particular fruit by its color, it is the most important attribute for assessing 1213
Transcript of Using K-means Cluster and Fuzzy C Means for Defect Segmentation in Fruits

Proceedings of the 2nd
International Conference on Current Trends in Engineering and Management
ICCTEM-2014
17 – 19, July 2014, Mysore, Karnataka, India
Copyright © 2014 by VVCE, Mysore
USING K-MEANS CLUSTER AND FUZZY C MEANS FOR DEFECT SEGMENTATION IN FRUITS
VaniAshok1, Dr. D.S. Vinod2
1 Research Scholar, Computer Science & Engineering, Sri Jayachamarajendra College of Engg., Mysore, India
2 Associate Professor, Information Science & Engineering, Sri Jayachamarajendra College of Engg., Mysore, India
Abstract: Quality and safety are the key factors in modern food industries. The quality of fruits and vegetables is a common combination of characteristics, attributes and properties that have significance and make for acceptability. One of the most popular applications of computer vision is to inspect qualities of food products based on form, color and presence of defects. Appearance factors such as size or dimension, shape, surface texture, surface color, and external or surface defects define external quality and directly influence consumers in purchasing a product, and they can be evaluated by means of computer vision techniques. The proposed paper presents defect segmentation of fruits based on surface color features with unsupervised K-Means clustering and Fuzzy C-Means algorithms. As the first step, the digital color images of defective apples are pre-processed using Gaussian low-pass filter (GLPF) smoothing operator to remove noise. The images are then segmented with the purpose of separating the defects from the edible regions using proposed clustering algorithms. A comparison analysis is also performed among the two methods.
Keywords: Image segmentation, Clustering, Histogram, Filtering, K-means, Fuzzy C-Means (FCM)
1. INTRODUCTION
Quality and safety are the key factors in modern food
industries. Increasing consciousness of quality,
particularly in the food and health sector, strongly
demands research activities regarding the production of
defined quality, the preservation of quality during
marketing, and thus also the possibilities of evaluating
quality parameters and of integrating this into production
processes. The pallet of possible damage to fruit and
vegetables is extremely extensive and is often a criterion
of quality determination methods, for example,
malformations, rust fungi, formation of cork, splits, bitter
pit, insect damage, rots, scalds, temperature damage, and
glassiness or other physiological diseases of the storage
phase. In addition, there are various risks for injuries
during harvest and transport [1]. With the increasing
quality awareness among consumers, the expectation for
improved quality in agricultural and food products has
increased the need for enhanced quality monitoring.
There is a need to develop various image analysis
techniques to meet the demand of the growing
population. Moreover there is growing demand for
automation in food industries due to the fact that the
traditional labor intensive manual inspection processes
are inefficient, inaccurate and ineffective. The application
of computer vision in agriculture has increased
considerably in recent years due to the fact that it
provides substantial amounts of information about the
nature and attributes of the objects present in a scene.
The use of this technology has spread rapidly in
inspecting agri-food commodities, including meat quality
assessment, automated poultry carcass inspection, quality
evaluation of fish, visualization of sugar distribution of
melons, measuring ripening of tomatoes, defect detection
of pickling cucumber, and classification of wheat kernels
[2]. The computer vision is particularly used more in
automatic inspection of fruits and vegetables, since it is
more reliable and objective than human inspection [3].
Quality assessment of fruits and vegetables is done
based on the analysis of external features like color, size,
shape, texture and presence of damage. As consumers are
mostly influenced to choose or reject a particular fruit by
its color, it is the most important attribute for assessing
1213
Proceedings of the 2nd
International Conference on Current Trends in Engineering and Management
ICCTEM-2014
17 – 19, July 2014, Mysore, Karnataka, India
Copyright © 2014 by VVCE, Mysore
the quality of fruits. The most widely used color spaces in
computers and digital images are RGB, HIS and L*a*b*.
In RGB the color of a pixel in image is expressed as three
coordinates of primary colors red, green and blue in a
color space. HIS is the color space which is closer to the
human perception of color, like the hue, saturation and
intensity. However, RGB and HIS are non-uniform color
spaces and hence uniform color space like L*a*b* is used
to implement the proposed algorithms.
The defect segmentation of fruits based on surface
color feature can be considered as an instance of image
segmentation where we are segmenting only the defective
portion of the fruit. Image segmentation is the process of
partitioning the image into several constituent
components. It partitions the digital image into disjoint
(non-overlapping) regions. Segmentation is an essential
step in computer vision and automatic pattern recognition
processes based on image analysis of foods as subsequent
extracted data are highly dependent on the accuracy of
this operation. Food image segmentation is still an
unsolved problem because of its complex and under
constrained attributes [4].
Image segmentation methods are generally based on
one of two fundamental properties of the intensity values
of image pixels: similarity, where the image is partitioned
into regions that are similar according to a set of
predefined criteria, and discontinuity, where the image is
partitioned based on sharp changes in intensity values.
Based on the discontinuity or similarity criteria, many
segmentation methods have been introduced which can
be broadly classified into six categories: (1) Histogram
based method, (2) Edge Detection, (3) Neural Network
based segmentation methods, (4) Physical Model based
approach, (5) Region based methods (Region splitting,
Region growing and merging), (6) Clustering (Fuzzy C-
means clustering and K-Means clustering) [5]. The
unsupervised clustering algorithms are particularly
appropriate for the exploration of interrelationship among
the data points to make an assessment of the structure
where there is little a priori information available about
the data [6].
2. RELATED WORKS
Physical appearances of food extremely vary causing
difficulties for computer vision systems. Fruits, in
particular, have numerous kinds of defects and highly
varying skin color. Hence, they pose even more problems
for computer vision-based quality inspection systems.
Paul Martinsen and Peter Schaare [7] have proposed a
method for predicting chemical component distribution in
kiwifruit using imaging spectroscopy techniques. The
author used partial least- squares method for data
modeling. J Blasco et al. [8] proposed the segmentation
procedure, based on a Bayesian discriminant analysis, to
allow fruits to be precisely distinguished from the
background. The machine vision system thus developed
detected the external defects of the apples with 86%
accuracy. The feasibility of NIR spectroscopy in
combination with powerful multivariate calibration
techniques, such as Partial Least Squares regression
(PLS), to measure quality attributes of fruit and
vegetables has been demonstrated by B.M. Nicolai et al.
[9]. J. Tan [10] suggested filtering, background removal,
segmentation of fat from muscles, isolation of the LD
muscle, and segmentation of marbling from the LD
muscle to assess the quality attributes of meat images.
K.Vijayarekha [11] discusses the multivariate image
analysis technique applied to the defect segmentation of
apple fruit in multispectral range.
An intensive study on apple quality inspection is
carried out by Unay [12]. The apple images were
captured through color/monochrome camera in diffusely
illuminated tunnel with two different light sources
(fluorescent tubes and incandescent spots). To improve
the image quality a noise removal operation was
performed before applying the image segmentation
operation to detect the defect type. The image intensity
and texture based shape features were extracted from
each segmented portion of the image. The performance of
several classification methods (Linear Discriminant
Classifier (LDC), k-Nearest Neighbors (k-NN), Fuzzy k-
NN, Support Vector Machine (SVM), Decision Tree and
Multi-layer Perceptrons (MLP)) were studied for defect
segmentation and detection. They identified bruise, flesh
damage, frost damage, hail, hail with perforation, limb
rub, scar tissue, rots, russet and scald defects.
Gabriel Leiva et al. [13] devised methodology to
classify blueberries with fungal decay, shrivelling and
mechanical damage using statistical pattern recognition
techniques: extracting the most possible features,
selecting the best ones, training the best classification
algorithm. The feature extraction strategies used were
Sequential Forward Selection (SFS), with objective
functions: Fisher discriminant, K-Nearest Neighbour
(KNN), Linear and Quadratic Discriminant Analysis”
(LDA and QDA); and other feature extractors without
objective function used were: Forward orthogonal search
algorithm by maximizing the overall dependency, Least
Squares Ellipse Fitting (LSEF) and Rank key features by
class separability criteria. With the selected features,
decision lines, planes or hyper planes classifiers were
implemented using LDA, QDA, minimal distance,
Mahalanobis Distance (MD), KNN (with 4 to 30 nearest
neighbours), Support Vector Machine (SVM) and
different Neural Networks techniques (NN).
Apart from fruit quality assessment researchers are
trying to investigate fruit characteristics that can be used
for fruit grading process. V. Leemans et al. [14] have
achieved fruit grading is six steps: image acquisition;
ground colour classification; defect segmentation; calyx
and stem recognition; defects characterization and finally
the fruit classification into quality classes. They realized
1214

Proceedings of the 2nd
International Conference on Current Trends in Engineering and Management
ICCTEM-2014
17 – 19, July 2014, Mysore, Karnataka, India
Copyright © 2014 by VVCE, Mysore
color grading using a simple neural network with no
hidden layer, using the three luminances (red, green and
blue) of the considered pixel as input. The calyx and stem
ends, which appear on an image as defects, were detected
using a correlation pattern recognition technique and
defect segmentation was done using Gaussian model of
the fruit color, measuring the Mahalanobis distance
separating the mean color of the fruit and of each pixel.
Yousef Al Ohali [15] has designed computer
mediated date fruit quality assessment and sorting system.
He has used the color intensity distribution in the image
as an estimate of flabbiness of date fruit. Back
propagation neural network (BPNN) is used to classify
the dates into three groups, Grade-1: fruits having good
shape, high flabbiness, Grade 2: fruits with distorted
shape, low flabbiness and Grade 3: fruits having defects.
3. CLUSTERING ALGORITHMS
In this section, the basic sets of definitions are
presented to provide the preliminaries of the clustering
methods. First we define the K-means clustering method.
The second part discusses about Fuzzy C- means (FCM)
clustering.
3.1 K-Means Clustering Algorithm
K-means method is an unsupervised clustering
method that classifies the input data objects into multiple
classes on the basis of their inherent distance from each
other [5]. Clustering algorithm assumes that a vector
space is formed from the data features and tries to
identify natural clustering in them. The objects are
clustered around the centroids 1ii …..k which are
computed by minimizing the following objective
V =2
1 S x
j )(xij
i
k
i
(1)
Where k is the number of clusters i.e. Si, i = 1, 2…., k and
i is the mean point or centroid of all the points
ij Sx .
The algorithm of an iterative version K-means
clustering is as follows:
Step 1. Compute the distribution of the intensity values.
Step 2. Using k random intensities initialize the
centroids.
Step 3. Cluster the image points based on the distance of
their intensity values from the centroid intensity
values.
)(ic := arg minj
2)(
j
ix (2)
Step 4. Compute new centroid for each cluster.
m
i
i
m
i
i
i
i
jc
xjc
1
)(
1
)(
)(
}{1
}{1
: (3)
where k is the number of clusters, i iterates over
all the intensity values, j iterates over all the
centroids.
Step 5. Repeat Step 3 and Step 4 until the labels of the
cluster do not change any more.
3.2 Fuzzy C-Means Clustering Algorithm
Fuzzy C-means (FCM) is a clustering technique
which differs from hard K-means that employs hard
partitioning [16]. The FCM employs fuzzy partitioning
such that a data point can belong to all groups with
different membership grades between 0 and 1. FCM is an
iterative algorithm. The aim of FCM is to find cluster
centers (centroids) that minimize a dissimilarity function.
To accommodate the introduction of fuzzy partitioning,
the membership matrix (U) is randomly initialized
according to,
njuc
i
ij ,....,1,11
(4)
The dissimilarity function used in FCM is given by,
2
1 11
21 ),....,,,( ij
c
i
n
j
m
ij
c
i
ic duJcccUJ
(5)
Uij is between 0 and 1;
Cij is the centroid of cluster i;
dij is the Euclidean distance between ith
centroid(ci) and jth
data point;
m [1,∞] is a weighting exponent or fuzziness parameter
To reach a minimum of dissimilarity function there
are two conditions which are given in Equation 6 and
Equation 7.
n
j
m
ij
j
mn
j ij
i
u
xuc
1
1 (6)
1215
Proceedings of the 2nd
International Conference on Current Trends in Engineering and Management
ICCTEM-2014
17 – 19, July 2014, Mysore, Karnataka, India
Copyright © 2014 by VVCE, Mysore
c
k
m
kj
ij
ij
d
du
1
)1/(2
1 (7)
Precisely speaking, initially the Uij and the centers of the
clusters are assigned randomly; moreover the Uij is
updated in each iteration. The iterative process stops
when
)1()()1()( max s
ij
S
ij
SS uuUU (8)
The FCM that iteratively updates the cluster centers
and the membership grades for each data point is as
follows:
Step 1. Randomly initialize the membership matrix (U)
that has constraints as given in Equation (4)
Step 2. Calculate centroids (ci) by using Equation (6).
Step 3. Compute dissimilarity between centroids and
data points using equation (5). Stop if its
improvement over previous iteration is below a
threshold.
Step 4. Compute a new U using Equation (7). If
condition given in Equation (8) is False, go to
Step 2.
FCM iteratively moves the cluster centers to the
"right" location within a data set.
4. DEFECT SEGMENTATION
In this section, the implementation of K-means and
Fuzzy C-means clustering algorithms for defect
segmentation in apple fruits is presented.
4.1 Using K-Means Clustering
Step 1. Read the input image of defective fruit.
Step 2. In order to remove the image noise and reduce
detail levels the Gaussian low-pass filter (GLPF)
smoothing operator is applied.
Step 3. Transform the image from RGB to L*a
*b
* color
space as all of the color information is present in
the a* and b
* layers only.
Step 4. Calculate the histograms of the image to decide
the number of clusters.
Step 5. Classify colors using K-means clustering in a*b
*
space, with Euclidean distance to measure the
distance between two colors.
Step 6. Label each pixel in the image from the results of
K-means. Every pixel of the image will be
labeled with its cluster index.
Step 7. Generate different images for each cluster.
4.2 Using Fuzzy C-Means
Step 1. Read the input image of defective fruit.
Step 2. In order to remove the image noise and reduce
detail levels the Gaussian low-pass filter (GLPF)
smoothing operator is applied.
Step 3. Calculate the histograms of the image to decide
the number of clusters.
Step 4. Classify pixel intensities using FCM algorithm
(initial value of m = 2 and = 0.01) with
number of clusters as determined in Step 3.
Step 5. Generate image by allocating different intensity
levels for each subclass of the image.
5. EXPERIMENTAL RESULTS
To determine the performance of the clustering
approaches, we have considered apples as a case study.
The data set consists of various images of apples with
defects such as apple scab, rot and blotch for the purpose
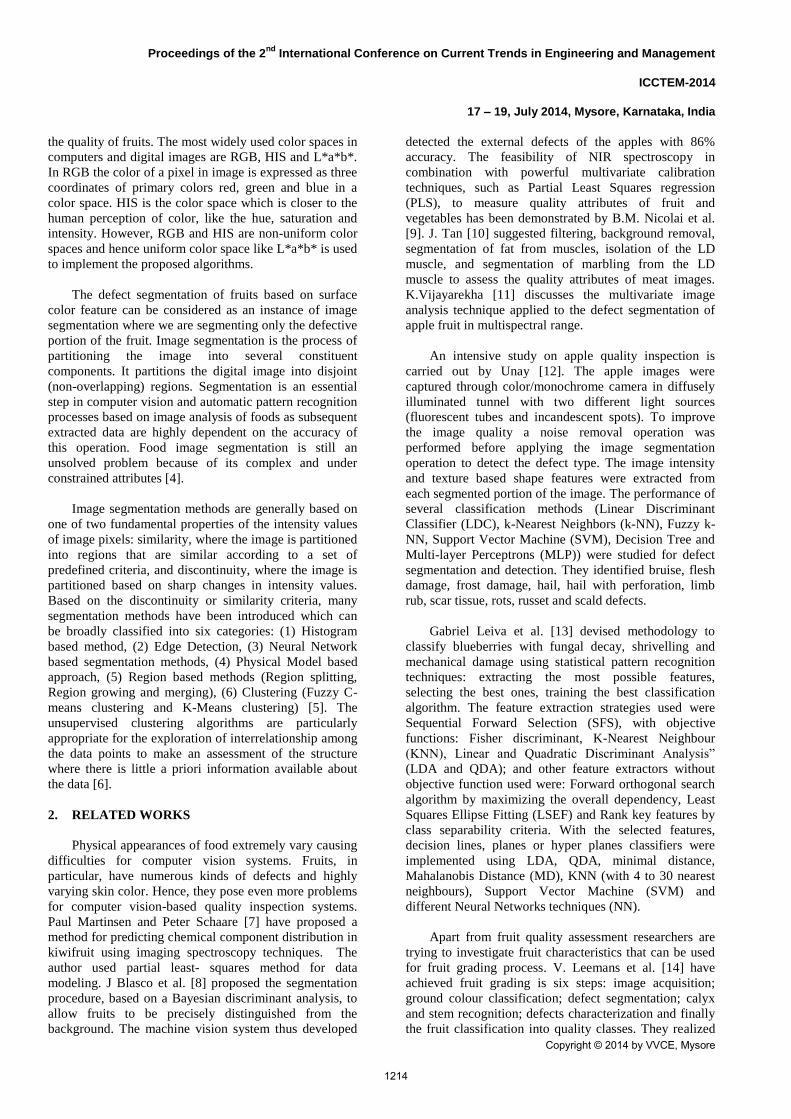
of defect segmentation. Fig. 1 represents some of the
images of defective apples from the data set.
(a) (b) (c)
Fig. 1: Sample Images from the Dataset
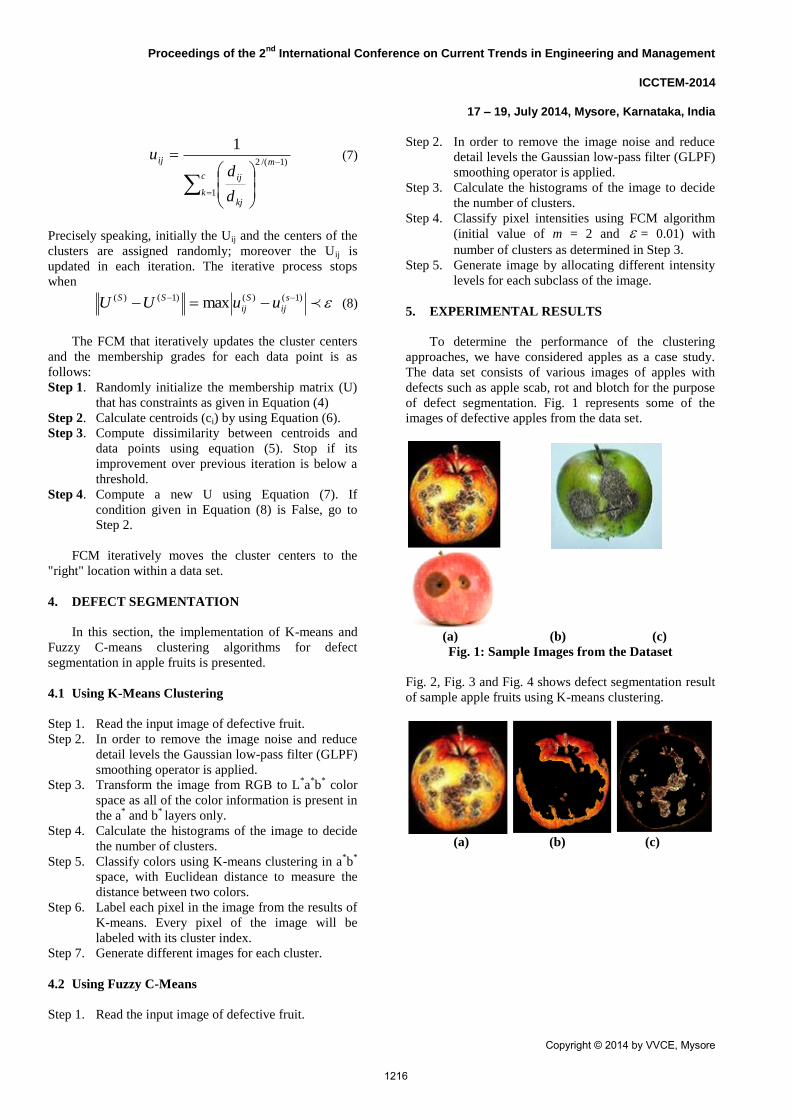
Fig. 2, Fig. 3 and Fig. 4 shows defect segmentation result
of sample apple fruits using K-means clustering.
(a) (b) (c)
1216
Proceedings of the 2nd
International Conference on Current Trends in Engineering and Management
ICCTEM-2014
17 – 19, July 2014, Mysore, Karnataka, India
Copyright © 2014 by VVCE, Mysore
(d) (e)
Fig. 2: K-Means Defect Segmentation of an Apple
with Scab (a) Filtered Image (b) First Cluster
(c) Second Cluster (d) Third Cluster (e) Histogram
(a) (b) (c)
(d) (e)
Fig. 3: K-Means Defect Segmentation of an Apple
with Blotch (a) Filtered Image (b) First Cluster
(c) Second Cluster (d) Third Cluster (e) Histogram
(a) (b) (c)
(d) (e)
Fig. 4: K-Means Defect Segmentation of a Rotten
Apple (a) Filtered Image (b) First Cluster
(c) Second Cluster (d) Third cluster (e) Histogram
We have segmented the input image into three
clusters depending on the data provided by the histogram
shown in Fig. 2(e), Fig. 3(e) and Fig. 4(e). Fig. 2(a), Fig.
3(a) and Fig. 4(a) show the preprocessed image filtered
by Gaussian low-pass filter smoothing operator. Among
the images in different clusters second cluster correctly
segments the defective portion of the image whereas the
first cluster demonstrates the non-defect part of the fruit.
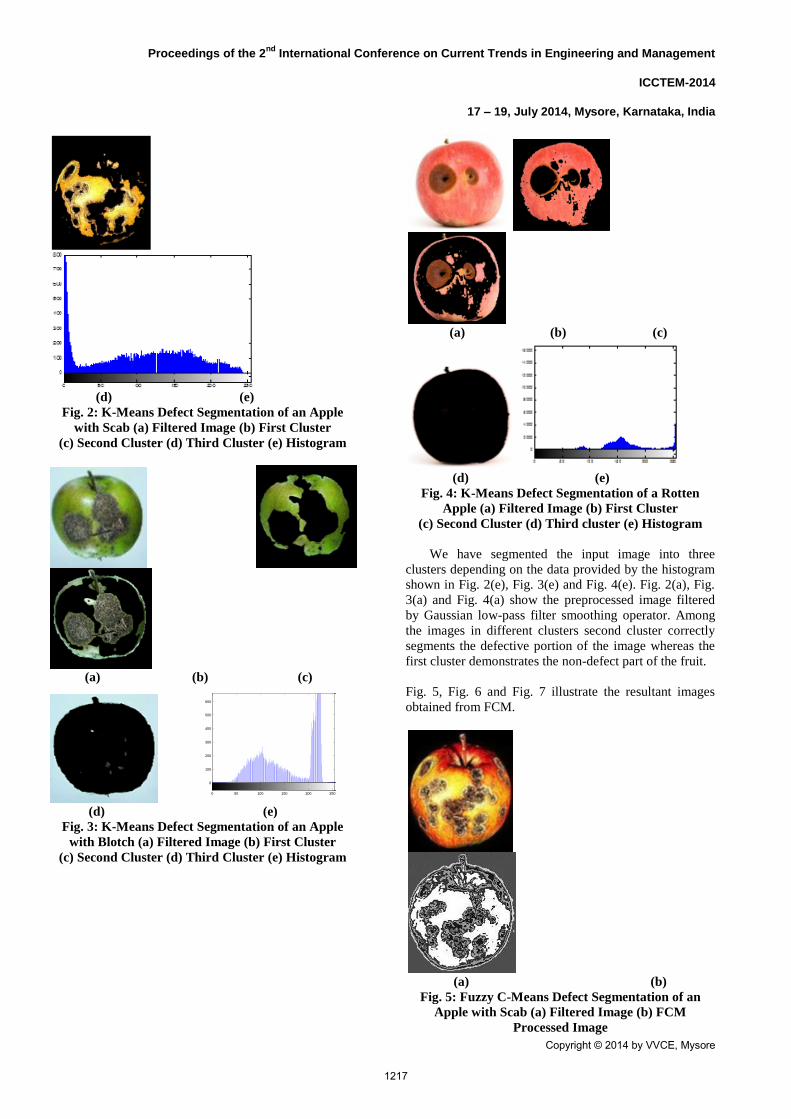
Fig. 5, Fig. 6 and Fig. 7 illustrate the resultant images
obtained from FCM.
(a) (b)
Fig. 5: Fuzzy C-Means Defect Segmentation of an
Apple with Scab (a) Filtered Image (b) FCM
Processed Image
0
100
200
300
400
500
600
0 50 100 150 200 250
1217

Proceedings of the 2nd
International Conference on Current Trends in Engineering and Management
ICCTEM-2014
17 – 19, July 2014, Mysore, Karnataka, India
Copyright © 2014 by VVCE, Mysore
(a) (b)
Fig. 6: Fuzzy C-Means Defect Segmentation of an
Apple with Blotch (a) Filtered Image (b) FCM
Processed Image
(a) (b)
Fig. 7: Fuzzy C-Means Defect Segmentation of a
Rotten Apple (a) Filtered Image (b) FCM Processed
Image
The filtered image is shown in Fig. 5(a), Fig. 6(a)
and Fig. 7(a). The FCM segmented images with three
clusters are shown in Fig. 5(b), Fig. 6(b) and Fig. 7(b).
The amount of defect in a given sample using K-Means
and FCM clustering is tabulated in Table 1. FCM, being
unsupervised fuzzy clustering algorithm, is motivated by
the need to find interesting patterns or groupings in a
given set of data. The cluster allocation in FCM is based
on the high membership value and less distance.
Table 1: Amount of Defect in Selected Fruit Samples
SI.
No.
Data
Sample
K-Means FCM
1 Figure 1(a) 60% 52%
2 Figure 1(b) 44% 40%
3 Figure 1(c) 10% 9%
6. CONCLUSION
The automated inspection of agricultural products,
fruits in particular, is an important process as it reduces
human interaction with the inspected goods, classify
generally faster than humans and tend to be more
consistent in their classification. The segmentation of
defects in fruits is proposed and evaluated in this paper.
The proposed approach used K-Means clustering and
Fuzzy C-Means clustering to segment defects in apple
images. Experimental results suggest that the algorithms
are able to segment the defects more accurately. The
major drawback of K-Means is that, there may be a
skewed clustering result if the cluster number estimate is
incorrect. It is overcome to certain extent in the proposed
method by determining the number of clusters using the
histogram of the image. The image is also pre-processed
to remove noise.
7. REFERENCES
1. Peter Butz, Claudia Hofmann, Bernhard
Tauscher, “Recent Developments in Noninvasive
Techniques for Fresh Fruit and Vegetable Internal
Quality Analysis”, Journal Of Food Science, Vol. 70,
Nr. 9, 2005.
2. Sun, D.-W., “Hyperspectral imaging for food
quality:A non-destructive tool for food quality and
safety evaluation and inspection”, London:
Academic, 2010.
3. Sergio Cubero, Nuria Aleixos, Enrique Moltó,
Juan Gómez-Sanchis, Jose Blasco, “Advances in
Machine Vision Applications for Automatic
Inspection and Quality Evaluation of Fruits and
Vegetables”, Food Bioprocess Technol 4:487–504,
2011.
4. Domingo Mery, Franco Pedreschi, “Segmentation
of colour food images using a robust algorithm”,
Journal of Food Engineering 66, 2005, pp. 353–360.
5. Shiv Ram Dubey, Pushkar Dixit, Nishant Singh,
Jay Prakash Gupta, “Infected Fruit Part Detection
using K-Means Clustering Segmentation Technique”,
International Journal of Artificial Intelligence and
Interactive Multimedia, 2013, Vol. 2, No.2.
6. Jaskirat Kaur, Sunil Agarwal, Venu Vig,
“Performance analysis of clustering based image
segmentation and optimization methods”, CS&IT-
CSCP, 2012, pp. 245-254.
7. Paul Martinsen, Peter Schaare, “Measuring
soluble solids distribution in kiwifruit using near-
infrared imaging spectroscopy”, Postharvest
Biology and Technology 14014, 1998, 271–281.
8. J. Blasco, N. Aleixos, E. Molt′o, “Machine Vision
System for Automatic Quality Grading of Fruit,”
Biosystems Engineering, 2003, 85 (4), 415–423.
9. Bart M. Nicolai, Katrien Beullens, Els Bobelyn,
Ann Peirs, Wouter Saeys, Karen I. Theron,
Jeroen Lammertyna, “Nondestructive measurement
1218

Proceedings of the 2nd
International Conference on Current Trends in Engineering and Management
ICCTEM-2014
17 – 19, July 2014, Mysore, Karnataka, India
Copyright © 2014 by VVCE, Mysore
of fruit and vegetable quality by means of NIR
spectroscopy: A review”, Postharvest Biology and
Technology, 46, 2007, 99–118.
10. J. Tan, “Meat quality evaluation by computer
vision”, Journal of Food Engineering 61, 2004, 27–
35.
11. K. Vijayarekha, “Multivariate image analysis for
defect identificationof apple fruit images”, IEEE
Transactions, 2008.
12. Unay, Dervim, “Multispectral Image Processing
and Pattern Recognition Techniques for Quality
Inspection of Apple Fruit”, Ph.D. Thesis, 2006,
Facult´e Polytechnique de Mons, Belgium.
13. Gabriel Leivaa, Germán Mondragónb, Domingo
Meryb, José Miguel Aguilera, “The automatic
sorting using image processing improves postharvest
blueberriesstorage quality”, 2011, ICEF.
14. V. Leemans, H. Mageinb, M.-F. Destain, “On-line
Fruit Grading according to their External Quality
using Machine Vision”, Biosystems Engineering,
2002, 83 (4), 397–404.
15. Yousef Al Ohali, “Computer vision based date fruit
grading system: Designand implementation”, Journal
of King Saud University – Computer and
Information Sciences, 2011, 23, 29–36.
16. Ebrahim.Aghajari, Gharpure Damayanti,
“Incorporating FCM and Back Propagation Neural
Network for Image Segmentation”, International
Journal of Computer & communication Technology,
2011, Volume-2, Issue-VIII.
1219