Inflationary effect of oil-price shocks in an imperfect market: a partial transmission input-output...
44
NOTA DI LAVORO 29.2011 By Libo Wu, Center for Energy Economics and Strategy Studies, Fudan University and Institute of World Economy, Fudan University, China Jing Li, Department of World Economy, School of Economics, Fudan University, China ZhongXiang Zhang, Research Program, East-West Center, USA Inflationary Effect of Oil- Price Shocks in an Imperfect Market: A Partial Transmission Input-output Analysis
-
Upload
independent -
Category
Documents
-
view
3 -
download
0
Transcript of Inflationary effect of oil-price shocks in an imperfect market: a partial transmission input-output...

NOTA DILAVORO29.2011
By Libo Wu, Center for Energy Economics and Strategy Studies, Fudan University and Institute of World Economy, Fudan University, China Jing Li, Department of World Economy, School of Economics, Fudan University, China ZhongXiang Zhang, Research Program, East-West Center, USA
Inflationary Effect of Oil-Price Shocks in an Imperfect Market: A Partial Transmission Input-output Analysis

The opinions expressed in this paper do not necessarily reflect the position of Fondazione Eni Enrico Mattei
Corso Magenta, 63, 20123 Milano (I), web site: www.feem.it, e-mail: [email protected]
SUSTAINABLE DEVELOPMENT Series Editor: Carlo Carraro
Inflationary Effect of Oil-Price Shocks in an Imperfect Market: A Partial Transmission Input-output Analysis By Libo Wu, Center for Energy Economics and Strategy Studies, Fudan University and Institute of World Economy, Fudan University, China Jing Li, Department of World Economy, School of Economics, Fudan University, China ZhongXiang Zhang, Research Program, East-West Center, USA Summary This paper aims to examine the impacts of oil-price shocks on China’s price levels. To that end, we develop a partial transmission input-output model that captures the uniqueness of the Chinese market. We hypothesize and simulate price control, market factors and technology substitution - the three main factors that restrict the functioning of a price pass-through mechanism during oil-price shocks. Using the models of both China and the U.S., we separate the impact of price control from those of other factors leading to China’s price stickiness under oil-price shocks. The results show a sharp contrast between China and the U.S., with price control in China significantly preventing oil-price shocks from spreading into its domestic inflation, especially in the short term. However, in order to strengthen the economy’s resilience to oil-price shocks, the paper suggests a gradual relaxing of price control in China. Keywords: Oil-price Shocks, Price Transmission, Price Control, Input-output Analysis, Inflation, Industrial Structure, China, the United States JEL Classification: Q43, Q41, Q48, O13, O53, P22, E31 Address for correspondence: ZhongXiang Zhang Senior Fellow Research Program East-West Center 1601 East-West Road Honolulu, HI 96848-1601 USA Phone: +1 8089447265 Fax: +1 8089447298 E-mail: [email protected]
Inflationary effect of oil-price shocks in an imperfect market: a
partial transmission input-output analysis
Libo Wua,d1, Jing Lib, ZhongXiang Zhangc*
a Center for Energy Economics and Strategy Studies, Fudan University, No. 600 Guoquan Road, Shangha, 200433, China b Department of World Economy, School of Economics, Fudan University, No. 600 Guoquan Road, Shanghai 200433, China c Research Program, East-West Center, 1601 East-West Road, Honolulu, HI 96848-1601, USA d Institute of World Economy, Fudan University, No. 600 Guoquan Road, Shanghai 200433, China
Abstract This paper aims to examine the impacts of oil-price shocks on China’s price levels. To that end, we develop a partial transmission input-output model that captures the uniqueness of the Chinese market. We hypothesize and simulate price control, market factors and technology substitution - the three main factors that restrict the functioning of a price pass-through mechanism during oil-price shocks. Using the models of both China and the U.S., we separate the impact of price control from those of other factors leading to China’s price stickiness under oil-price shocks. The results show a sharp contrast between China and the U.S., with price control in China significantly preventing oil-price shocks from spreading into its domestic inflation, especially in the short term. However, in order to strengthen the economy’s resilience to oil-price shocks, the paper suggests a gradual relaxing of price control in China. JEL classification: Q43; Q41; Q48; O13; O53; P22; E31 Keywords: Oil-price shocks; Price transmission; Price control; Input-output analysis; Inflation; Industrial structure; China; the United States
Corresponding author. ZhongXiang Zhang, Senior Fellow, Research Program, East-West Center, 1601 East-West Road, Honolulu, HI 96848-1601, USA Tel.: +1-808-944 7265; fax: +1-808-944 7298. E-mail address: [email protected]
2
1. Introduction
1.1. Oil-price Shocks and China’s Economic Performance
Inflationary impacts of oil-price shocks have always concerned oil importing
countries. China’s dependence of oil imports has increased by more than 30%
over the past decade, implying that China is becoming more sensitive or even
more vulnerable to external oil price shocks. However, China’s economy has
managed to maintain a stunning growth for the past 10 years, despite the rapid
increase of world oil prices since 2003. China’s oil consumption continues to
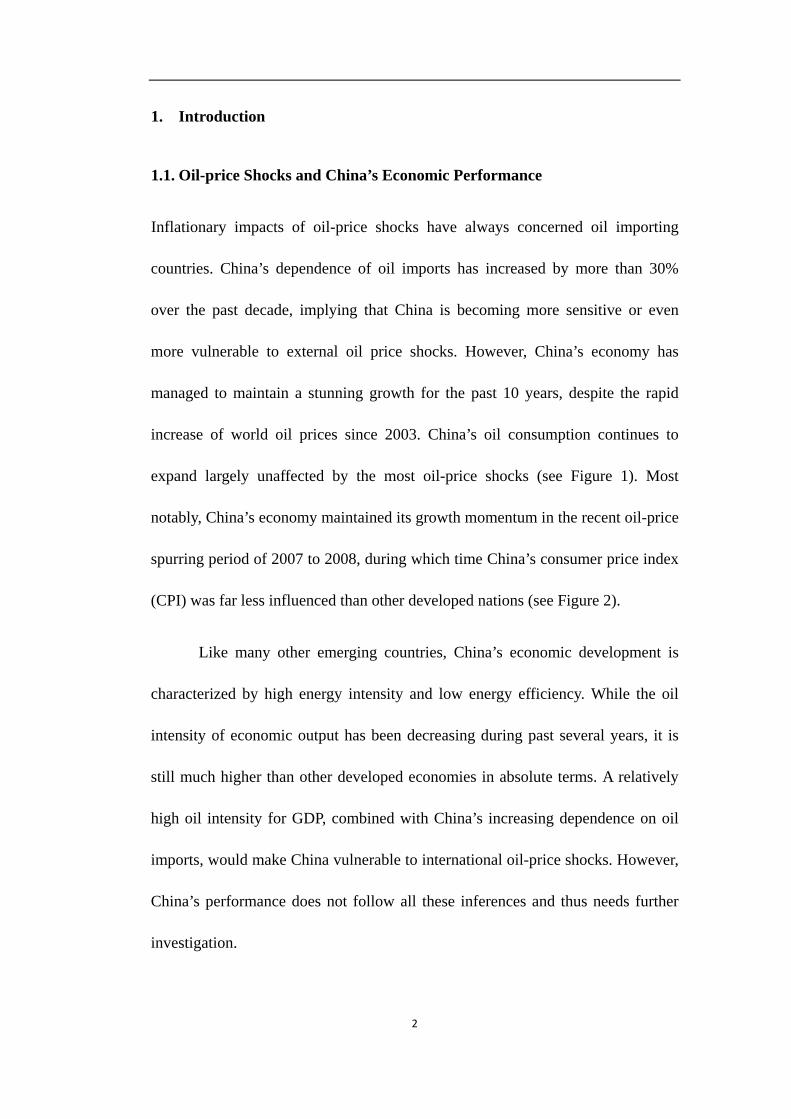
expand largely unaffected by the most oil-price shocks (see Figure 1). Most
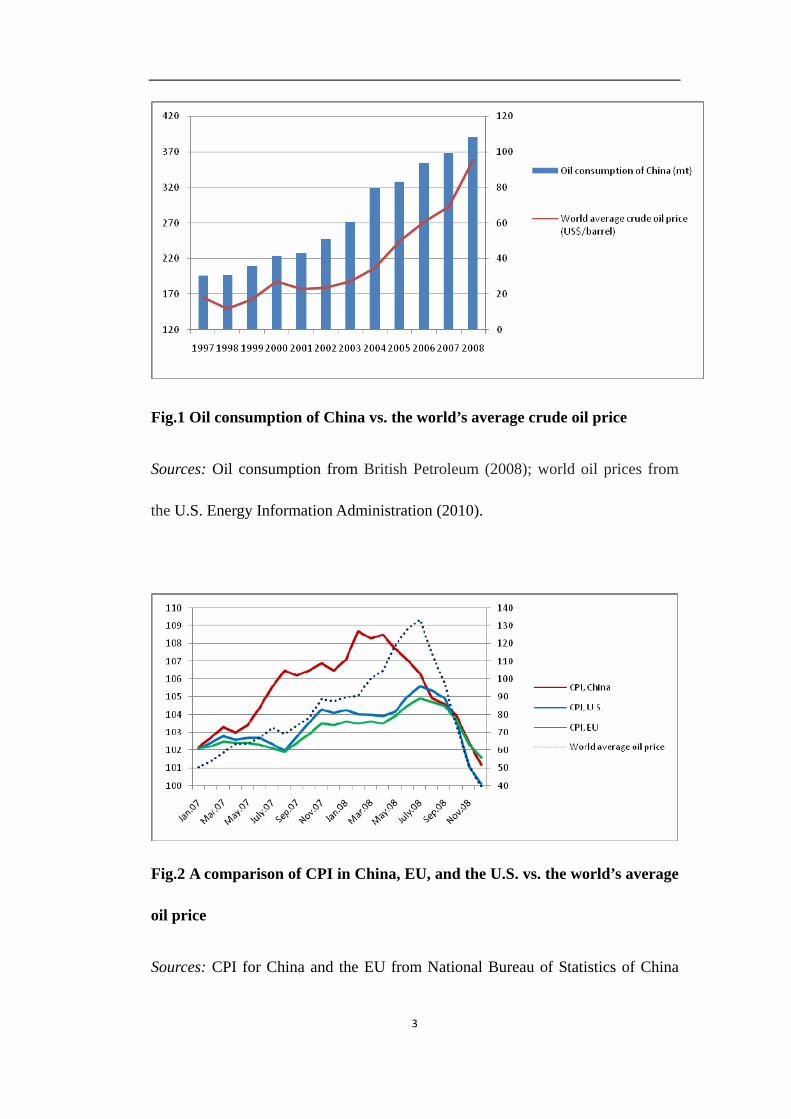
notably, China’s economy maintained its growth momentum in the recent oil-price
spurring period of 2007 to 2008, during which time China’s consumer price index
(CPI) was far less influenced than other developed nations (see Figure 2).
Like many other emerging countries, China’s economic development is
characterized by high energy intensity and low energy efficiency. While the oil
intensity of economic output has been decreasing during past several years, it is
still much higher than other developed economies in absolute terms. A relatively
high oil intensity for GDP, combined with China’s increasing dependence on oil
imports, would make China vulnerable to international oil-price shocks. However,
China’s performance does not follow all these inferences and thus needs further
investigation.
3
Fig.1 Oil consumption of China vs. the world’s average crude oil price
Sources: Oil consumption from British Petroleum (2008); world oil prices from
the U.S. Energy Information Administration (2010).
Fig.2 A comparison of CPI in China, EU, and the U.S. vs. the world’s average
oil price
Sources: CPI for China and the EU from National Bureau of Statistics of China

4
(2010) and the OECD (2010); CPI for the U.S. calculated from the original data
from Bureau of Labor Statistics of the U.S. Department of Labor (2011); world oil
prices from the U.S. Energy Information Administration (2010).
1.2. Oil-price Shocks and China’s Price Control Policy
Relying on theoretical verification and empirical observation, we would like to
hypothesize that China’s lessened vulnerability may be partly due to China’s price
control policy. Despite the continuous efforts towards price liberalization, a
certain level of price control is still imposed on China’s economy.
In China, price control policy targets two kinds of commodities:
fundamental resources and CPI-indexed commodities. Since those industries
producing the first category of commodities are prone to be monopolized, price
control is implemented mainly to prevent the monopoly from encroaching on
public interest. Measures taken are to keep their profit at reasonable levels. For
the second category, price control is enforced to restrain inflation and to mitigate
the impact of price turbulence on the general public’s lives. Price control policy
has acted as a useful tool in controlling inflation in China for a long period of time.
However, what remains unknown is the extent of this price control, and most
importantly, how this extent of price control has influenced China’s responses to
an oil-price shock.
5
1.3. Recent Studies
Over the past decade, there has been a growing body of literature that has
examined China’s economic development under international oil-price shocks.
Adopting a VAR model, Du et al. (2010) find that while China’s GDP growth is
positively correlated with the world oil price, oil-price shocks can have a
significant impact on domestic inflation. Faria et al. (2009) examine the reasons
behind the rapid expansion of the Chinese exports under oil-price shocks. Huang
and Guo (2007) investigate the impact of oil-price shocks on China’s real
exchange rate.
However, not until recently have researchers brought the issue of China’s
sticky oil price pass-through into their research framework. Tang et al. (2010)
observe China’s price stickiness in the oil price pass-through, and using a SVAR
model they show that price stickiness and rigidity of investment in a short period
make the impact of oil-price shocks on China’s economy gradual but permanent.
Using an input-output model, Ren et al. (2007) measure the impact of oil price on
China’s price index and attribute the stickiness of China’s oil price pass-through to
such factors as market competition, price control and energy substitution.
Despite the number of studies focused on China’s partial oil-price
transmission mechanism, it is still unclear how different factors have contributed
to the stickiness of China’s oil price pass-through. In particular, how and to what
extent does China’s price control policy affect its price index and economic
6
development under recurring international oil-price shocks? To address these
questions, we will develop a unique China model in the remaining part of this
paper. Section 2 introduces the modeling framework of our analysis. We tailor the
traditional input-output method to better reflect the uniqueness of China’s reality.
In Section 3, we manage to separate the effect of price control from that of other
factors leading to China’s price stickiness under oil-price shocks, using the partial
transmission input-output models of both China and the U.S.. Section 4 discusses
some policy implications. The conclusions are drawn in Section 5.
2. The Model
The input-output (IO) analysis is a powerful tool in determining the gradual
inflationary effect of oil-price shocks. Therefore, we have adopted an IO
framework for our study. However, given the built shortcomings in the traditional
IO model, we have developed a partial transition IO model to better reflect the
imperfect market conditions in China.
2.1. Why Input-output Analysis?
The advantage of an IO analysis can be observed at least from the following three
perspectives:
7
First, IO modeling is specialized in analyzing the “cost-driven inflation”,
while China’s inflation observed during the last oil-price shock is just
characterized as “cost-driven”, during which time international market had seen
steep rise in metal, energy and grain prices - which largely led to China’s high
inflation rate during the period. Secondly, an oil-price shock is gradually realized
through the inter-connection between industries. Meanwhile, the IO table gives a
comprehensive structural description of the entire economy in a particular year
(Carter, 1974; Leontief, 1986). Therefore by using the information provided by an
IO table, an IO model enables us to dissect the complex interdependencies of
industries within an economy, and measure the complete inflationary effect of
oil-price shocks. Thirdly, while other empirical methods ignore the indirect or
ripple effects, an IO analysis allows to capture inter-industry linkages and
measures both the direct and indirect effects of oil-price shocks (Christian and
Klaus, 2009, Liu and Ren, 2006).
2.2. Traditional Input-output Analysis
Major Consumptions
Three main consumptions are built in an IO analysis:
First, the demand-driven nature. All input requirements for the production of some
exogenously given demand will be automatically and instantaneously met.
Secondly, instant transmission. The price turbulence in upstream industries can be
8
completely and instantaneously transmitted to downstream industries. Thirdly,
fixed technical coefficients. The cost reduction efforts made by manufacturers
through technology innovation are not considered.
The demand-driven nature of an IO model may not be justifiable for a
Western economy (Giarrantani, 1976); however, given the abundant unused
capacity of China, this assumption may work for our analysis. The “instant
transmission” assumption of an IO model ignores any possible impediment in the
transmission of oil-price shocks; and thus exaggerates the effect of oil-price
shocks. Since this is usually not the case in reality, we will ease this assumption in
Section 2.3. The ignorance of technical innovations in an IO model may not be
justifiable in the long term; however, this may reflect the short-term reality in
China. As we will further discuss in Section 4, the price control in China actually
discourages manufacturers from applying energy-saving technologies to reduce
their costs when oil price rises.
Traditional Input-output Methodology
Under the assumptions discussed above, a price increase in industry i of ipΔ will
lead to a cost rise in industry j, which uses products from industry i by i ijp aΔ ,
where ija is the corresponding direct requirement coefficient. Likewise, to keep
profit steady, industries other than industry i will have to increase their prices by

9
1 2 , 1 , 1... ...T
i i i i i i i inp a a a a a− +⎡ ⎤Δ ⎣ ⎦ ,
with the matrix form of Ti ip aΔ , where ia represents the vectors in row i
excluding iia . This reflects the first-round effect of a price shock in the upstream
industry.
The price rise of other products incurred by the initial price surge in
industry i will gradually lead to the ripple effects on other industries. The second
round of a price shock can be shown by
( )Ti ip a AΔ , or T T
i ip A aΔ ;
and
( )Ti ip a A AΔ ⋅ , or 2( )T T
i ip A aΔ
for the third round…The total inflationary effects of the initial price shock can be
summarized into
2 3 1[ ( ) ( ) ...] (1 )T T T T T T T Ti i i i i i ip a Aa A a A a p A a−Δ + + + = Δ − .
This is the famous Leontief’s inversion method (Leontief, 1986). It
represents both the direct and indirect impacts of a price shock, initiated from
industry i on other industries. The Leontief’s inversion method enables us to
calculate the total effect of a price shock. In order to further analyze the marginal
changes in price level under oil-price shocks, we will adopt the iteration method
to simulate the gradual price change during an oil-price shock.

10
2.3. Partial Transmission Input-output Model
As the traditional IO model reflects the inflationary effect of a price shock in an
ideal world, the ultimate impact of the initial price surge is certainly not as
significant and swift as the model indicates, due to a number of factors, such as
market competition pressure, technology innovation, energy substitution, etc.
Most notably, price control policies on certain commodities are still implemented
in China today, suggesting the need to modify the traditional IO model to better
reflect the real economy and derive the realistic results. In this section, we will
introduce some new concepts into the traditional IO model. Specifically, we will
incorporate the “frictions” in China’s price transmission mechanism into the
traditional IO model, quantify the impacts of such frictions and thus better
simulate the price pass-through during an oil-price shock.
Capability of Transmitting Cost
Since the real price adjustment scale may not be as great as the cost increase level,
we use the ratio of “real price increase” to “ideal price increase” to reflect the
capability of an industry in transmitting its cost pressure to downstream industries.
Here the “ideal price increase” equals the weighted average cost increase,
assuming that an upstream manufacturer can fully transmit its cost increase to
downstream manufacturers. The cost increase for each input is derived from CPI
indices, while the cost weights for each industry are obtained from the

11
corresponding columns in the IO direct requirement tables. We term this ratio as
“capability of transmitting cost (CTC)”.2
We denote jrpΔ as the real price increase, and 1
n
i iji
p a=∑ as the weighted
cost increase or “ideal price increase”. Therefore, the “capability of transmitting
cost (CTC)” can be written as
1
CTC ij n
i iji
rp
p a=
Δ=
Δ∑.
CTC is a row vector. Intuitively, the greater the capability of transmitting
cost, the greater the ability of industry to pass cost pressures to other industries by
raising its price. The empirical results of CTC are shown in Section 3. Given the
values of CTC, we can understand how under a certain level of cost increase,
producers are capable of transmitting their cost pressures or to what level they can
raise their prices.
Partial Transmission IO Model
Arguably, CTC contains valuable information regarding frictions in price
transmission mechanism. In light of this, our next step is to modify the “direct
2 Ren et al. (2008) introduce the concept of “capability of transmitting cost” in order to illustrate the capability of different industries in transmitting cost pressure during inflation. Here we broaden the scope of its application by incorporating CTC into the traditional IO model to create the “partial transmission IO model”.
12
requirement table” by using the CTC matrix. By using the modified direct
requirement table, our aim is to create a “partial transmission IO model”, which
considers price transmission frictions on top of IO relations between industries.
The modified direct requirement table is denoted as 'A
T' Cij j ijA CT A= ⋅ ,
and
a 'ij j ijCTC a= ⋅ .
'A is obtained by multiplying every coefficient in the original direct
requirement table by the corresponding “capability of transmitting cost” of the
output industry. Using the modified direct requirement table 'A , the total impact
of an oil-price shock on inflation can be obtained by summarizing all rounds of
price shocks, calculated by means of
2 3[( ') ' ( ') ( ' ) ( ') ( ' ) ( ') ...]T T T T T T Ti i i i ip a A a A a A aΔ + + + .
Here,
a 'ij j ijCTC a= ⋅ .
a 'ij contains information from both sides: the cost composition (from the
original direct requirement coefficient) and the capability of transmitting cost for
each industry. For example, when cost of the ith input of the jth industry increases
by x%, with all other costs remaining unchanged, it will increase the cost of the jth
industry by (x*aij) percent; since the jth industry is only capable of transmitting
13
CTCj (in percentages) of its cost rise, the initial price increase should be
(x*aij*CTCj), i.e. (x*aij’). This initial price increase will then spread into other
industries, thus resulting in a cost-driven inflation. Because this new IO model
reflects baffled price transmission mechanism in reality, we call it the “partial
transmission input-output model”.
2.4. Multi Scenario Analysis
With the partial transmission IO model introduced above, we will now develpe
two scenarios, using data from both China and the U.S., in an effort to identify
factors in blocking price pass-through during oil-price shocks. We take the U.S. as
a reference because it is considered as the freest market in the world, with little
intervention from the government. Most of the frictions in price transmission in
the U.S. result from the market itself, rather than price control policies of the
government. On the contrary, the baffled price transmission mechanism in China
is a result of both government intervention and market factors. Therefore, a
comparison between China and the U.S. scenarios can give us valuable
information regarding the relative impact of different transmission frictions in
price pass-through mechanisms.
Scenario I: Complete Transmission

14
Under this scenario, we ignore the factors that baffle a price pass-through during
an oil-price shock, and use the traditional IO method to determine the maximum
impact of an oil-price shock on general price level. Simulation results of a
hypothetical 100% oil-price increase under this scenario are derived using data
from both China and the U.S. (see Section 3).
Scenario II: Partial Transmission
Under the assumption that price adjustment is baffled by distorted price
mechanism, we use the “partial transmission IO model” to simulate the inflation
level during a hypothetical oil-price shock. Arguably, simulation results in both
countries under this scenario should be smaller and more plausible compared with
that under Scenario I.
3. Data, Empirical Results and Discussion
3.1. Data
In the calculation of CTC, recall
1
CTC ij n
i iji
rp
p a=
Δ=
Δ∑
15
ija comes from direct IO tables. Here we use the 2007 China IO table (National
Bureau of Statistics of China, 2009) and the 2002 U.S. benchmark IO table
(Bureau of Economic Analysis of the U.S. Department of Commerce, 2008), both
of which are the latest available IO tables.
For irpΔ , we use relevant monthly CPI and PPI (producer price index)
indices between July 2007 and July 2008 to calculate “real price increase” from
July 2007 to July 2008. Similarly, we use the corresponding CPI and PPI indices
during the same period to represent cost increase ( ipΔ ) of different inputs for
different industries.
The reason why we use price variance data from July 2007 to July 2008 is
because, to calculate CTC, we need to choose a period during which many
industries face cost surges so that we can observe whether producers are
sufficiently able to increase their prices. Meanwhile, the world has experienced
unprecedented oil-price shocks over the same period, during which the world’s
average crude oil price rose from 73 to 134 US$/barrel. As a result, both China
and the U.S. have seen sharp increases in the inflation rates (see Figure 2). This
enables us to observe producers’ responses to wide-spread cost surges and
quantify their capability of transmitting costs.
3.2. Capability of Transmitting Cost
As would be expected, the CTC coefficients vary from one industry to another,

16
with patterns widely differentiated between China and the U.S..
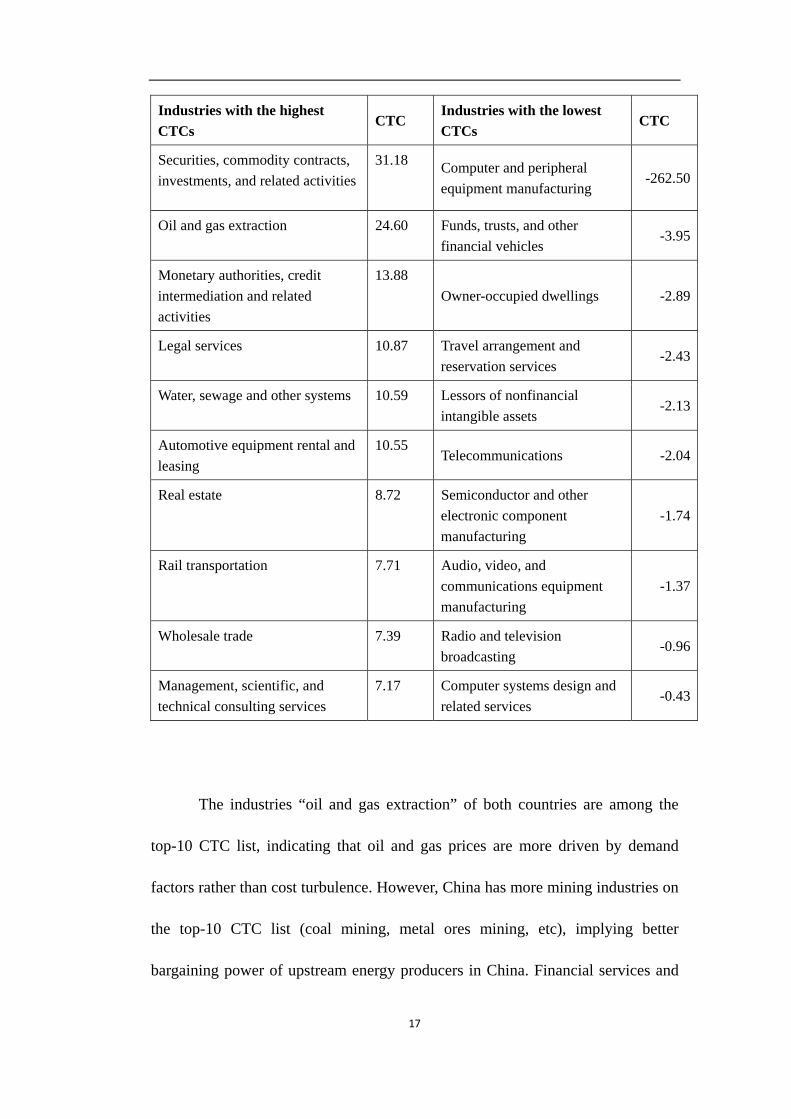
Table 1 Ten Chinese industries with the highest CTCs and ten with the lowest CTCs
Industries with the highest CTCs
CTC Industries with the lowest CTCs
CTC
Financial services 13.18 Information, computer services and software
-1.03
Oil and gas extraction 8.37 Communications equipment, computer and other electronic instrument manufacturing
-0.96
Waste products and materials 5.75 Culture, sports and entertainment
-0.29
Agriculture, forestry, fishing and herding
4.46 Post services 0.00
Coal mining 4.01 Electric power, heat generation, transmission and distribution
0.15
Metal ores mining 3.55 Transportation equipment manufacturing
0.16
Nonmetallic mineral mining and quarrying
2.39 Device, office equipment manufacturing
0.16
Real estate 2.06 Chemistry 0.24
Health, Social security and social benefit
1.53 Electronic equipment manufacturing
0.24
Research and experiment 1.52 Natural gas manufacturing and distribution
0.27
Table 2 Ten U.S. industries with the highest CTCs and ten with the lowest CTCs
17
Industries with the highest CTCs
CTC Industries with the lowest CTCs
CTC
Securities, commodity contracts, investments, and related activities
31.18 Computer and peripheral equipment manufacturing
-262.50
Oil and gas extraction 24.60 Funds, trusts, and other financial vehicles
-3.95
Monetary authorities, credit intermediation and related activities
13.88 Owner-occupied dwellings -2.89
Legal services 10.87 Travel arrangement and reservation services
-2.43
Water, sewage and other systems 10.59 Lessors of nonfinancial intangible assets
-2.13
Automotive equipment rental and leasing
10.55 Telecommunications -2.04
Real estate 8.72 Semiconductor and other electronic component manufacturing
-1.74
Rail transportation 7.71 Audio, video, and communications equipment manufacturing
-1.37
Wholesale trade 7.39 Radio and television broadcasting
-0.96
Management, scientific, and technical consulting services
7.17 Computer systems design and related services
-0.43
The industries “oil and gas extraction” of both countries are among the
top-10 CTC list, indicating that oil and gas prices are more driven by demand
factors rather than cost turbulence. However, China has more mining industries on
the top-10 CTC list (coal mining, metal ores mining, etc), implying better
bargaining power of upstream energy producers in China. Financial services and
18
the real estate industry have similar high levels of CTCs in both China and the
U.S., consistent with the common sense that these industries set prices according
to the benchmark price level (often set by influential manufacturers in the
industry), rather than their costs. As for industries with the lowest CTCs, China
and the U.S. follow more or less the same pattern: information-related industries
occupy most of the list; their negative CTCs imply that prices in these industries
are mostly irrelevant to their manufacturing costs, revealing their vulnerability
under a general price surge.
While some industries have CTCs well above 1 (notice those industries
with the highest CTCs), other industries have very low CTCs (far less than 1),
indicating little discretion in price adjustment under oil-price shocks. The reason
behind manufacturers raising prices beyond cost hikes is indeed very complex.
While the cost of production is among the most important factors in pricing, other
factors cannot be neglected. For example, price turbulence in global market,
demand surge in local market, perceived reliability of supply and supply
disruption as a result of natural disasters and other unexpected events, either
individually or in combination, would lead to dramatic price hikes where the cost
of production has not markedly increased. Moreover, it is likely that industries
having CTC larger than 1 would have taken advantage of cost hikes (e.g. oil-price
shocks) by excessively adjusting their price (compared with their cost rise levels).
The phenomenon of “over-shooting” under oil-price shocks is intriguing in
19
itself; but it goes beyond the scope of this paper. As mentioned above, we intend
to focus on industries where price transmission has been baffled, given that IO
types of models implicitly exclude the possibility of demand-driven inflation.
Consequently, we will only pay attention to industries with CTC less than 1,
leaving those “over-shooting” industries for future studies. Accordingly, for
industries with CTC coefficients larger than 1, we adjust them to 1, implying that
manufacturers will adjust their price no greater than the level of their cost surge.
As for most industries with CTCs less than 1, it is clear that many manufacturers
are not capable of fully transmitting cost to their customers. The reason behind a
partial transmission in China during oil-price shocks can be attributed to such
factors as price control, market factors and technology substitution, each briefly
explained below.
Price control
Price control policy in China targets two kinds of commodities: fundamental
resources and CPI-indexed commodities. This policy is enforced in efforts to
control inflation and prevent monopoly from encroaching on the public interest.
While price control policy is implemented out of goodwill and is arguably helpful
in mitigating the impact of price shocks, it has made price extremely rigid and has
kept industries from quickly reacting to cost shocks (see Appendix for further
discussion).
20
Market factors
Even in a market free of price controls (like the U.S.), producers still cannot fully
transmit cost increases to their customers. This can result from several factors,
market competition pressure being among one of them. For example, producers
may want to keep their price level unchanged or even lower (as is the case in
information industries), which have negative CTCs for both China and the U.S.3,
in order to remain competitive in the market, even if their costs have been
increased. There are also possibilities that demand elasticity is extremely high.
Therefore a slight rise in price will cause huge decrease in demand, which deters
producers from lifting their prices. In other cases, prices may be set beforehand in
annual contracts; therefore producers are prohibited from raising prices, even
when their costs have been markedly increased.
Technology substitution
In an economy that is frequently and severely attacked by oil-price shocks,
producers will gradually find ways to adapt and counteract the negative influence
of oil-price shocks by improving their manufacturing technologies. For example,
3 This implies that manufacturers lower their prices when costs rise. This may result from the highly competitive nature of information industry. Prices of new products tend to drop after hitting the market.
21
they can use renewable energies instead of oil, or adopt technologies with higher
energy efficiency. The technology substitution efforts made by producers will help
cut costs and therefore curb inflation during oil-price shocks. However, this effect
cannot be realized in the short term, especially when we consider the slow pace of
technology advancement in China today.
3.3. Oil-price Shocks and General Price Levels
General Price Level
Applying both complete and partial transmission IO model to China and the U.S.
would enable us to simulate price changes in different industries under two
scenarios when crude oil price doubles, namely, increases by 100%.
The IO table provides us with the composition of the final residential
consumption. By using this data as the weighting number, we can have the
weighted average “general price level” changes under hypothetical oil-price
shocks. However, it should be pointed out that, although this number offers
meaningful information regarding how consumers are affected during oil-price
shocks, the so-called “general price level” is still not equal to the CPI due to
different statistical approach.
Simulation Results
22
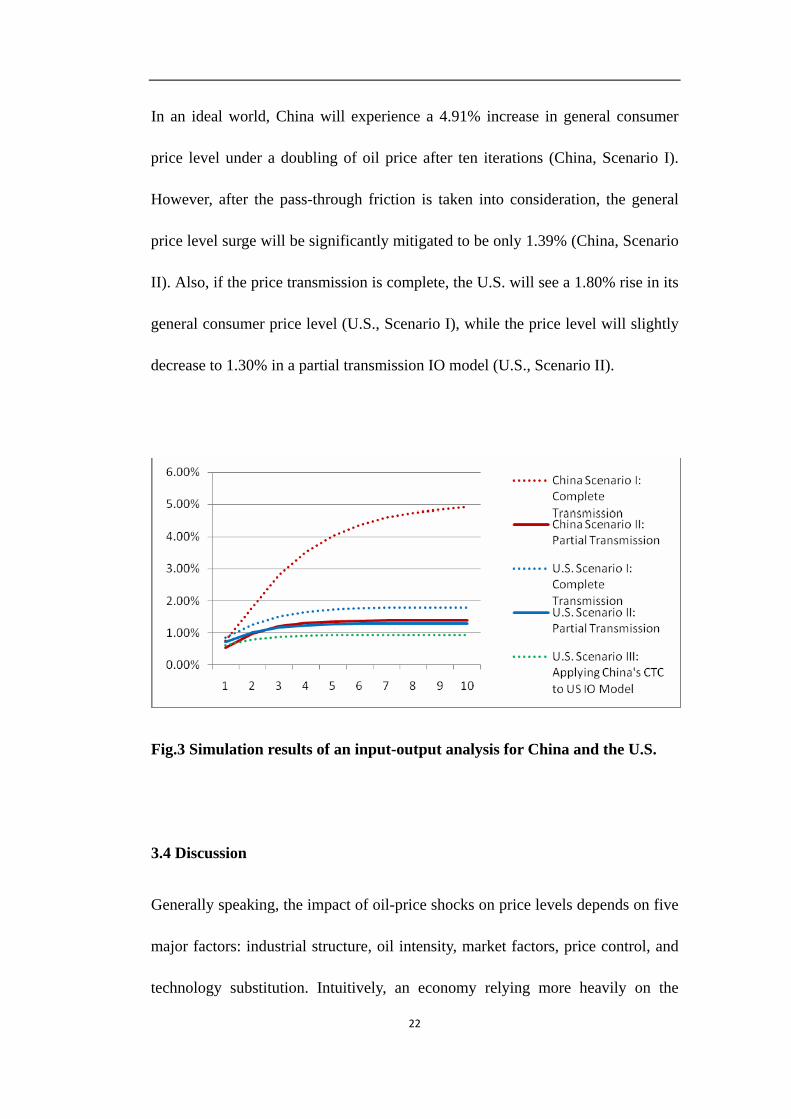
In an ideal world, China will experience a 4.91% increase in general consumer
price level under a doubling of oil price after ten iterations (China, Scenario I).
However, after the pass-through friction is taken into consideration, the general
price level surge will be significantly mitigated to be only 1.39% (China, Scenario
II). Also, if the price transmission is complete, the U.S. will see a 1.80% rise in its
general consumer price level (U.S., Scenario I), while the price level will slightly
decrease to 1.30% in a partial transmission IO model (U.S., Scenario II).
Fig.3 Simulation results of an input-output analysis for China and the U.S.
3.4 Discussion
Generally speaking, the impact of oil-price shocks on price levels depends on five
major factors: industrial structure, oil intensity, market factors, price control, and
technology substitution. Intuitively, an economy relying more heavily on the

23
manufacturing industry than the service industry will be more prone to oil-price
shocks. Likewise, an economy with higher oil intensity is more vulnerable to
oil-price shocks than those with less oil dependence. In a market with less
favorable market conditions where competition is more intense, manufacturers
may feel reluctant to raise prices in order to pass through the impact of oil-price
shocks. However, the price control policy distorts pricing mechanisms and
mitigates the short-term impact of oil-price shocks on price levels. Moreover, the
quick adaption to oil-price shocks by technology substitution can help businesses
overcome oil-price shocks without raising prices.
In order to understand the impact of the aforementioned factors, we
categorize the above five factors into two groups: group A (industrial structure and
energy intensity) and group B (market factors, price control, and technology
substitution). While the information for factors in group A can be found in the IO
table, the information contained in group B are embodied in our CTC coefficients
(See Table 3).
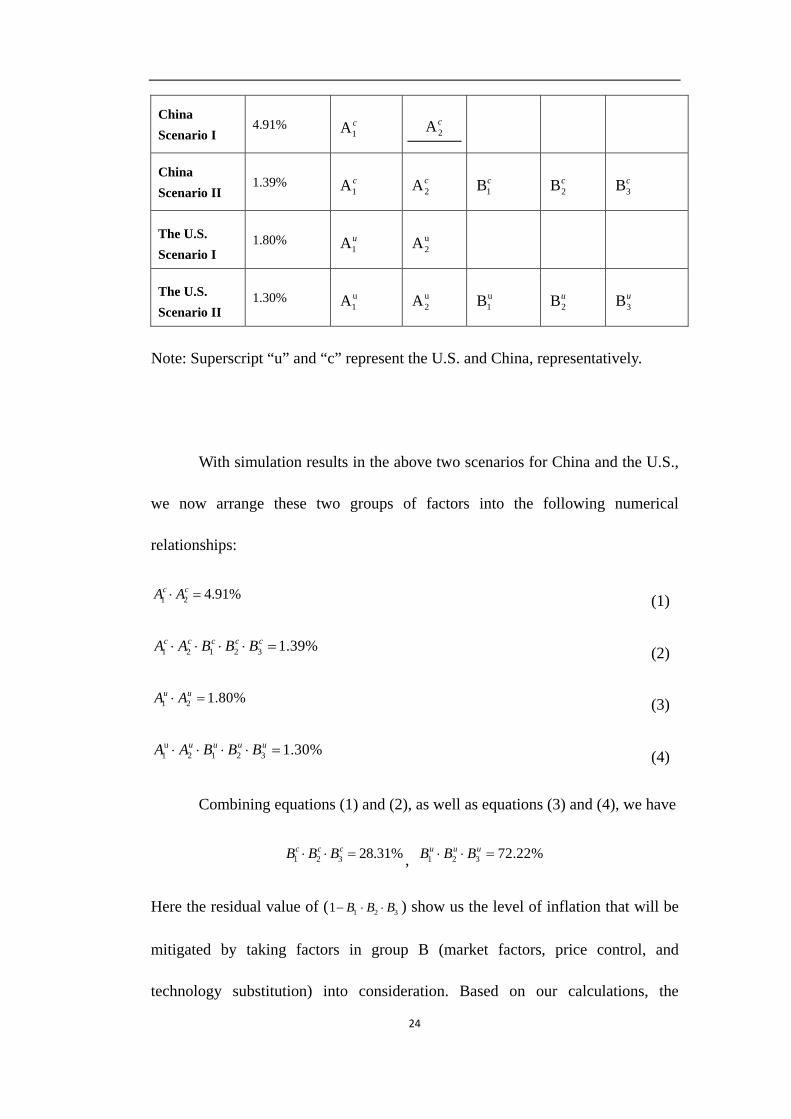
Table 3 Simulation results and the five major factors in determining the impact of oil-price shocks
Major factors in determining the impact of oil-price shocks
Simulation results
Industrial structure (A1)
Oil intensity (A2)
Market factors (B1)
Price control (B2)
Technology substitution (B3)
24
China Scenario I
4.91% 1A c
2Ac
China Scenario II
1.39% 1A c
2Ac 1Bc
2Bc 3Bc
The U.S. Scenario I
1.80% 1Au
u2A
The U.S. Scenario II
1.30% u1A
u2A
u1B 2Bu
3Bu
Note: Superscript “u” and “c” represent the U.S. and China, representatively.
With simulation results in the above two scenarios for China and the U.S.,
we now arrange these two groups of factors into the following numerical
relationships:
1 2 4.91%c cA A⋅ = (1)
1 2 1 2 3 1.39%c c c c cA A B B B⋅ ⋅ ⋅ ⋅ = (2)
1 2 1.80%u uA A⋅ = (3)
u1 2 1 2 3 1.30%u u u uA A B B B⋅ ⋅ ⋅ ⋅ = (4)
Combining equations (1) and (2), as well as equations (3) and (4), we have
1 2 3 28.31%c c cB B B⋅ ⋅ = , 1 2 3 72.22%u u uB B B⋅ ⋅ =
Here the residual value of ( 1 2 31 B B B− ⋅ ⋅ ) show us the level of inflation that will be
mitigated by taking factors in group B (market factors, price control, and
technology substitution) into consideration. Based on our calculations, the

25
combination of market factors, price control and technology substitution will push
the inflation rate in China down by 71.69% ( 1 2 31 c c cB B B− ⋅ ⋅ ), while these three
factors will mitigate the inflation rate in the U.S. only by 21.78% ( 1 2 31 u u uB B B− ⋅ ⋅ ).
Also, the difference between 1 2c cA A⋅ (4.91%) and 1 2
u uA A⋅ (1.80%) shows that the
less industry-oriented economic structure and lower oil intensity in the U.S. help
mitigate inflation by 3.11% in absolute terms or 63.34% in relative terms.
To further separate the impact of price control from other influences, we
need to examine these factors more closely. To that end, we need to make the
necessary assumptions.
Technology substitution
Ideally, in the face of an oil shock, some manufacturers may counteract the
negative impact through technical innovation, by adopting less oil-intensive
technology and/or substituting oil with other type of energy. Substituting a
technology to mitigate the impact of oil-price shocks is based on two prerequisites:
adequate technology competency and quick technology transformation pace.
Although the reoccurring oil-price shocks have prodded industries to find
alternative energies or develop more oil-efficient technologies, it will usually take
quite some time before the technologies come to commercialization. Therefore,
the effect of technology substitution may not be reflected during the current round
of an oil-price shock, but will help counteract the risks of oil-price shocks in the

26
future. In light of this, we assume that the factor of “technology substitution” can
be neglected in the near term, both in the U.S. and in China, namely,
3 3 100%u cB B= = .
Market factors
Market factors, such as willingness to remain competitive, high price elasticity
and fixed contracts, are the major causes behind partial price pass-through,
especially for a free markets like the U.S.. The significance of market factors in
determining oil price pass-through is dependent very much on the bargaining
power of different industries. In a market where competition is very intensive or
where products have very high price elasticity, suppliers are expected to have
lower bargaining power and are more likely to bear the cost during oil-price
shocks, or sign fixed contracts which expose themselves to future cost shocks.
The terms of trade index compares export price change with import price
change. A rise in the index means that relative export price increase exceeds
relative import price increase; in other words, the trade condition is in favor of the
exporting country with a rise in the bargaining power in international trade.
Enlightened by this, we employ the terms of trade index published by UNCTAD
(2010) to quantify the relative bargaining power of the overall economy for China
and the U.S..
As shown in Figure 4, the terms of trade index of the U.S. is 24% higher

27
than that of China in 2008, implying that industries in the U.S. have greater
bargaining power than those in China. In other words, it is more difficult for
industries in China to pass through the cost pressure.
Fig. 4 Terms of trade indices for China and the U.S., 1980-2009
Source: UNCTAD (2010).
With this in mind, we assume that the retardant effect of market factors in
China is 24% greater than that of the U.S., assigning 1 1(1 24%)u cB B= + ⋅ . Meanwhile,
the technology substitution factor can be neglected in the short term, and no price
control policy is enforced in the U.S., i.e.
2 3 3100%, 100%u u cB B B= = = ,
We have
1 72.22%uB = , 1 58.24%cB = , c2 48.61%B = .
The results show that the market factors in the U.S. and China account for
a 21.78% and 41.76% decrease in the inflation rate respectively, implying that
28
China’s market is more stagnated than that of the U.S. in terms of transmitting the
cost pressure during oil-price shocks. Meanwhile, the price control mitigates
inflation by 51.39%, indicating that price control in China significantly prevents
producers from passing through their costs during oil-price shocks.
4. Policy Implications
Our empirical results have shown that China’s price control policy significantly
lowers the capability of China’s industries in price pass-through during oil shocks.
This policy prevents oil shocks from quickly spreading into downstream
industries and thus helps curb inflation in the short term. However, effective as it
is, the side effects of price control are very destructive for the economy.
First of all, the policy distorts price adjustment mechanisms. When
international oil price surges, domestic oil price will not rise simultaneously due
to an adjustment lag caused by oil price control. With domestic oil prices
remaining unchanged, manufacturers will increase their current demand for oil
products, since they expect oil price to rise in the near future. Consequently, oil
price control turns the price elasticity of downstream manufacturers from negative
to positive; the higher the international oil prices, the higher the demand, the
larger the discrepancy between demand and supply for oil products. Price control,
in fact, prevents the economy from reaching market equilibrium by itself.
29
Secondly, price control causes manipulation and probably amplifies the
overall inflationary effect. The widening gap between oil supply and demand
would prod manipulation activities, driving prices in black markets higher and
higher. This, in turn, increases price expectation in the regulated market and
exaggerates oil shortage crises, adding enormous pressure on policy makers.
When the oil price control is eventually relaxed, the oil price is sometimes
increased more than enough to cover the original international oil price surge, due
to higher demand for oil products. From an economic point of view, the resulting
inflation is both pushed by cost and pulled by demand. As a result, although oil
price control can delay the impact of oil shocks on inflation in the short term, it is
possible that the overall inflationary effect is greater than that without oil price
control, especially in the long term, when the expectation of oil price rise is fully
realized.
Thirdly, price control discourages technical innovation. Ideally, in a
market where oil price pass-through is very difficult, manufacturers will be
seriously hit by oil shocks. In order to mitigate the negative impact, they will try
to find alternative technologies. On the other hand, in a market where the pricing
mechanism is less stagnated and manufacturers manage to pass through the cost
impact, customers will choose products using less oil since their prices are less
affected by oil shock. A combination of the two factors encourages producers to
adopt new technologies. By contrast, because of oil price control in China, the
domestic oil price fails to respond to international oil price surge in the short term.
30
Therefore, downstream manufacturers have less incentive to reduce oil intensity.
As a result, as the inflationary effect of oil shocks fully comes into play, the
producers will be seriously hurt in the long term, since they are not fully prepared
due to rigidness in oil price pass-through.
Last but not least, price control squeezes business profits and lowers
investment incentives. During an oil shock, price control on oil products will
gradually erode the profits of oil producers, with an increasing discrepancy
between imported and domestic oil prices. After the government adjusts the
domestic oil price, however, downstream manufacturers will gradually feel the
cost pressure when the price shock is gradually transmitted through the industry
chain. However, for those producers of CPI-indexed commodities under price
control, they are incapable of further transmitting cost increase. Consequently,
investment in those industries will be largely cut back, which will in turn have a
negative impact on the upstream industries. As a result, the investment incentives
within the whole economy will be greatly diminished, thus leading to lower
chances of survival for individual business and slower recovery for the whole
economy.
All the aforementioned taken into account, although price control can
offset the impact of oil-price shocks in the short term, it in fact distorts price
mechanism, exaggerates long-term inflation effect, discourages technical
innovation and dampens investment incentives. Thus, instead of imposing a price
31
control policy on commodities, efforts towards reducing energy intensity and
adjusting industrial structure can be seen as a more persistent and instructive
policy tool in combating inflation during oil-price shocks (less industrial structure
and lower oil intensity in the U.S. help mitigate inflation by 63.34%, compared
with China).
In addition, lack of bargaining power is another major reason behind
China’s unsuccessful oil shock pass-through (this market factor decreases the
inflation rate by 41.76% for China). In light of this, industrial upgrading can be
considered as another long-term solution to mitigate the impact of oil shocks on
China’s economy.
It should be emphasized that the consequence of relaxing price control
combined with efforts in reducing energy intensity, adjusting industrial structure
and industrial upgrading is not as terrible as some may expect. As shown in our
study, in a free market economy like the U.S., a 100% oil-price increase will only
raise the inflation rate by 1.30%, which is even lower than our simulation results
of China (1.39%) under price control.
5. Conclusions
China’s oil imports have accounted for over half of its total oil consumption and

32
the oil intensity of its economy is still very much higher than that of industrialized
countries. A combination of the two factors would make China’s economy
vulnerable to world oil-price shocks. However, China had managed to maintain its
growth momentum with its CPI less influenced during the 2007-8 oil-price shock.
In this paper, we attempt to explain China’s lessened vulnerability to oil-price
shocks by investigating the price control policy in China. To that end, we tailor
the traditional IO analysis to China’s uniqueness. Taking into consideration the
baffled price pass-through mechanism in reality, we incorporate the capability of
transmitting cost into the direct IO table and develop a partial transmission IO
model. This new approach reflects the frictions in a price transmission process and
thus enables us to better simulate the cost-driven inflation during oil-price shocks.
Our simulation results show that under an ideal scenario China will
experience a 4.91% increase in general price level when oil price doubles; the
inflation rate will drop significantly to 1.39%, after factoring in the transmission
friction. By contrast, the inflation rate in the U.S. will only decrease from 1.80%
under a complete transmission scenario to 1.30% under a partial transmission
scenario.
To further identify the factors in determining the impact of oil-price shocks,
we divide those factors into industrial structure, oil intensity, market factors, price
control, and technology substitution, and incorporate the five factors into the
traditional IO model. Under several reasonable assumptions, we find that the
33
lower industry-oriented economic structure and lower oil intensity in the U.S. help
mitigate inflation by 3.11% in absolute terms or 63.34% in relative terms.
Meanwhile, the market factors (including fierce competition, high demand
elasticity, fixed contract, etc.) in the U.S. and China account for a 21.78% and
41.76% decrease in the inflation rate, respectively; and the price control in China
mitigates inflation by 51.39%.
Based on our quantitative results, we can draw the following conclusions.
First, reducing oil intensity and adjusting industrial structure can be taken as a
persistent and instructive policy tool in curbing inflation during oil-price shocks.
Secondly, lack of bargaining power is another major reason behind China’s partial
oil price pass-through. Therefore, industrial upgrading is another long-term
solution to mitigate the impact of oil-price shocks on China’s economy. Thirdly,
although price control offsets the impact of oil-price shocks in the short term, it
distorts price adjustment mechanism, exaggerates long-term inflation effect,
discourages technical innovation and dampens investment incentives.
Consequently, relaxing price control is a necessary step towards making price
pass-through mechanism work in China. Finally, the consequences of relaxing
price control as well as other recommended policies are acceptable and
controllable. Our simulation results show that in a free market economy like the
U.S., a doubling of oil price will only raise the inflation rate by 1.30%, which is
even lower than our simulation results of China under price control.
34
References
Anne P. Carter, 1974. Applications of input-output analysis to energy problems,
Science 184 (4134), 325-329.
Bureau of Economic Analysis of the U.S. Department of Commerce, 2008. 2002
benchmark input-output data. Available at:
http://www.bea.gov/industry/io_benchmark.htm.
British Petroleum, 2008. BP Statistical Review of World Energy. London.
Bureau of Labor Statistics of the U.S. Department of Labor, 2011. Consumer price
index. Washington, DC, 17 February, available at:
ftp://ftp.bls.gov/pub/special.requests/cpi/cpiai.txt.
Liumin Du,Yanan He, Chu Wei, 2010. The relationship between oil price shocks
and China’s macro-economy: an empirical analysis. Energy Policy 38 (8),
4142-4151.
João Ricardo Faria,André Varella Mollick, Pedro H. Albuquerque, Miguel A.
León-Ledesma, 2009. The effect of oil price on China’s exports. China
Economic Review 20 (4), 793-805.
Giarratani F., 1976. Application of an interindustry supply model to energy issues.
Environment and Planning 8, 447–54.
Ying Huang, Feng Guo, 2007. The role of oil price shocks on China’s real
exchange rate. China Economic Review 18 (4), 403-416.
35
Christian Kerschner, Klaus Hubacek, 2009. Assessing the suitability of
input–output analysis for enhancing our understanding of potential
economic effects of peak oil. Energy 34, 284-290.
Wassily Leontief, 1986. Input-Output Economics, Oxford University Press,
Cambridge.
Qiyun Liu, Zeping Ren, 2006. Estimation and empirical study on price impact
model. China Price 2006.12, 35-40.
National Bureau of Statistics of China, 2009, 2007 Input-Output Tables of China.
China Statistics Press, Beijing.
National Bureau of Statistics of China, 2010. General consumer price index.
China Statistics Database, Beijing, available at:
http://219.235.129.58/indicatorMonthQuery.do.
Organisation for Economic Co-operation and Development (OECD), 2010. Key
short-term economic indicators: consumer prices - annual inflation. OECD
StatExtracts, Paris, available at:
http://stats.oecd.org/index.aspx?queryid=21761.
Zeping Ren, Wenqing Pan, Qiyun Liu, 2007. Crude oil price effects on China’s
price level based on input-output price model. Statistical Research 24 (11),
22-28.
Zeping Ren, Jianlong Yang, Kangping Wu, 2008. Inflation’s impact on industrial
climate based on CTC model. Statistical Research 25 (10), 46-53.
State Development and Planning Commission, 2001. The pricing catalogue by the
36
State Development and Planning Commission and other concerned
departments under the State Council. 4 July, available at:
http://www.ndrc.gov.cn/zcfb/zcfbl/zcfbl2003pro/t20050707_27540.htm.
The Price Department of the National Development and Reform Commission,
2009. Thirty years of price reform in China. Economic Daily, 5 February,
available at: http://cpc.people.com.cn/GB/64093/64387/8751851.html.
United Nations Conference on Trade and Development (UNCTAD), 2010.
Merchandise trade indices, annual, 1980-2009 -- terms of trade indices.
UnctadStat, Geneva,
http://unctadstat.unctad.org/TableViewer/tableView.aspx?ReportId=119.
U.S. Energy Information Administration (2010). World crude oil prices.
Washington, DC, available at:
http://www.eia.doe.gov/dnav/pet/pet_pri_wco_k_w.htm.
Weiqi Tang, Libo Wu, ZhongXiang Zhang, 2010. Oil price shocks and their short-
and long-term effects on the Chinese economy. Energy Economics 32
(Supplement 1), S3-S14.
37
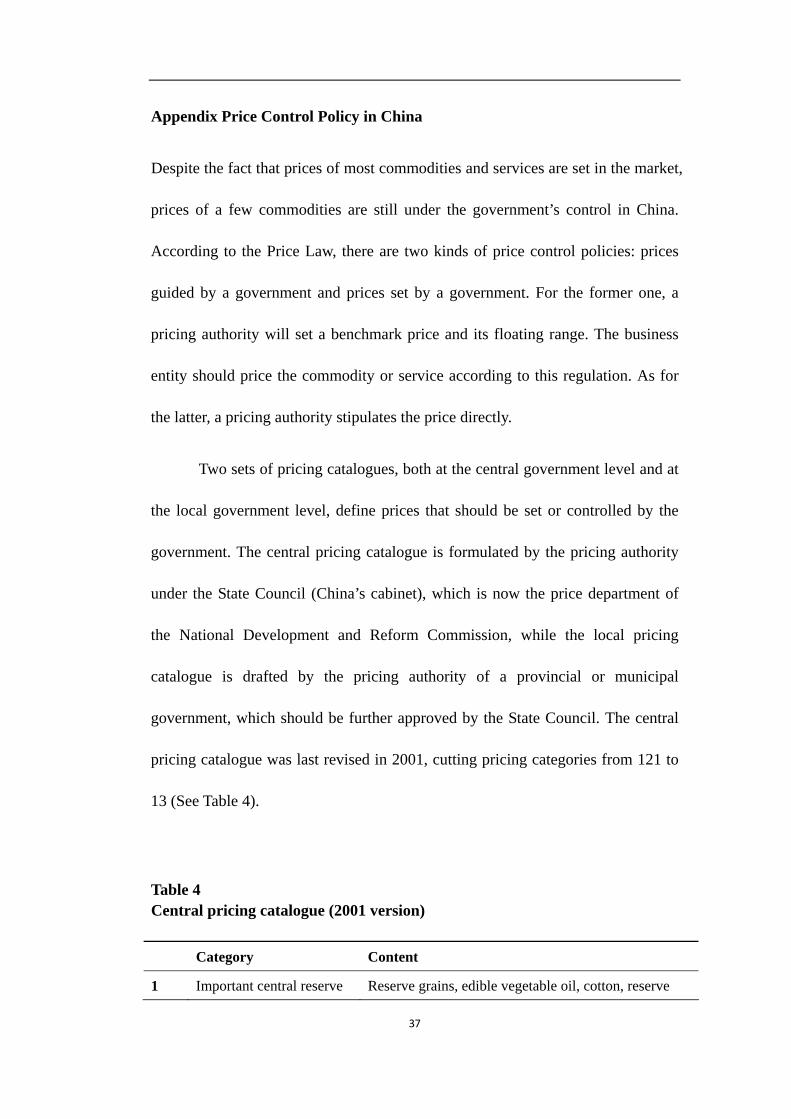
Appendix Price Control Policy in China
Despite the fact that prices of most commodities and services are set in the market,
prices of a few commodities are still under the government’s control in China.
According to the Price Law, there are two kinds of price control policies: prices
guided by a government and prices set by a government. For the former one, a
pricing authority will set a benchmark price and its floating range. The business
entity should price the commodity or service according to this regulation. As for
the latter, a pricing authority stipulates the price directly.
Two sets of pricing catalogues, both at the central government level and at
the local government level, define prices that should be set or controlled by the
government. The central pricing catalogue is formulated by the pricing authority
under the State Council (China’s cabinet), which is now the price department of
the National Development and Reform Commission, while the local pricing
catalogue is drafted by the pricing authority of a provincial or municipal
government, which should be further approved by the State Council. The central
pricing catalogue was last revised in 2001, cutting pricing categories from 121 to
13 (See Table 4).
Table 4 Central pricing catalogue (2001 version) Category Content
1 Important central reserve Reserve grains, edible vegetable oil, cotton, reserve
38
commodities sugar, reserve oil, reserve chemical fertilizer, reserve silk,
2 Tobacco, salt and civil explosion equipments
Tobacco leaf, salt, civil explosion equipments
3 Chemical fertilizers Urea, ammonium nitrate, etc.
4 Important medicines Stupefacient, specific psychotropic drugs, prophylactic, etc.
5 Textbooks Textbooks for elementary schools, middle schools, universities and colleges
6 Natural gas Onshore natural gas
7 Water Water of hydraulic projects directly managed by central government and cross-provincial hydraulic projects
8 Electricity Electricity purchasing price without competition, electricity retail price
9 Military goods Military equipments, army provisions, oil supply for military use
10 Important transportation services
Pipeline transportation, port charge, airplane ticket price and discount, railway ticket price, etc.
11 Post services Postage for letter, parcel, newspaper, emergent mail, etc.
12 Telecom services Telecom charge for fixed phone and mobile phone
13 Important professional services
Financial service, geotechnical survey and design service, specific intermediary service
Source: National Development and Planning Commission (2001).
In addition to controlling prices of commodities and services listed in the
pricing catalogue, the government withholds the right of using other policy
instruments to regulate market prices. For example, the price regulation fund can
be used to stabilize market prices; government can implement the “temporary

39
price-intervention policy” by limiting profit margin, setting price upper bounds
and so on (The Price Department of the National Development and Reform
Commission, 2009). The “temporary price-intervention policy” was employed in
2003 and 2008 to curb inflation.
Generally speaking, the price control policies in China today mainly target
five kinds of commodities and services: a) commodities of great importance to
national economy and people’s lives, b) commodities using scarce resources, c)
commodities of a natural monopoly nature, d) important utility services, and e)
public welfare services. Take oil price as an example: According to current
regulation, domestic oil prices can be adjusted when the average increase of the
weighted average oil price of New York, Rotterdam and Singapore continuously
exceeds 4% within 22 working days. Despite the already long adjustment interval,
the pricing authority tends to maintain the domestic oil price even if the above
condition is met, in the name of preventing inflation. As a result, domestic oil
prices lag far behind international oil prices during an international oil price hike
(see Figure 5).

40
Fig.5 Gasoline price in China and the U.S.
Comparing an ideal price increase (using an input-output table) and actual
price increase (from price indices) provides us with some insights into the impact
of price control. For example, for industries like natural gas production and supply,
during the 2007-08 oil-price shock, in order to maintain the profit level, an ideal
price increase of 26.19% was required. However, the industry only managed to
increase the price by 7%. Some other industries under price control with a partial
oil price pass-through are given in Figure 6.

41
Fig.6 A comparison between ideal and actual price increases for five
industries under price control
Despite the still rigorous control on price, it is well recognized that price
control policy should be eventually eliminated through a gradual price reform. As
a matter of the fact, price reform since 1978 has greatly deregulated China’s
market. The categories of commodities and services in pricing catalogue have
been significantly reduced to 13, compared with nearly 800 at the beginning of the
reform. As a result, the current share of government regulated goods and services
only accounts for 4.4%, 2.9% and 7.6% in the total sales of retail commodities,
farm products and production materials, respectively (The Price Department of
the National Development and Reform Commission, 2009).
NOTE DI LAVORO DELLA FONDAZIONE ENI ENRICO MATTEI
Fondazione Eni Enrico Mattei Working Paper Series
Our Note di Lavoro are available on the Internet at the following addresses: http://www.feem.it/getpage.aspx?id=73&sez=Publications&padre=20&tab=1
http://papers.ssrn.com/sol3/JELJOUR_Results.cfm?form_name=journalbrowse&journal_id=266659 http://ideas.repec.org/s/fem/femwpa.html
http://www.econis.eu/LNG=EN/FAM?PPN=505954494 http://ageconsearch.umn.edu/handle/35978
http://www.bepress.com/feem/
NOTE DI LAVORO PUBLISHED IN 2011 SD 1.2011 Anna Alberini, Will Gans and Daniel Velez-Lopez: Residential Consumption of Gas and Electricity in the U.S.:
The Role of Prices and Income SD 2.2011 Alexander Golub, Daiju Narita and Matthias G.W. Schmidt: Uncertainty in Integrated Assessment Models of
Climate Change: Alternative Analytical Approaches SD 3.2010 Reyer Gerlagh and Nicole A. Mathys: Energy Abundance, Trade and Industry Location SD 4.2010 Melania Michetti and Renato Nunes Rosa: Afforestation and Timber Management Compliance Strategies in
Climate Policy. A Computable General Equilibrium Analysis SD 5,2011 Hassan Benchekroun and Amrita Ray Chaudhuri: “The Voracity Effect” and Climate Change: The Impact of
Clean Technologies IM 6.2011 Sergio Mariotti, Marco Mutinelli, Marcella Nicolini and Lucia Piscitello: Productivity Spillovers from Foreign
MNEs on Domestic Manufacturing Firms: Is Co-location Always a Plus? GC 7.2011 Marco Percoco: The Fight Against Geography: Malaria and Economic Development in Italian Regions GC 8.2011 Bin Dong and Benno Torgler: Democracy, Property Rights, Income Equality, and Corruption GC 9.2011 Bin Dong and Benno Torgler: Corruption and Social Interaction: Evidence from China SD 10.2011 Elisa Lanzi, Elena Verdolini and Ivan Haščič: Efficiency Improving Fossil Fuel Technologies for Electricity
Generation: Data Selection and Trends SD 11.2011 Stergios Athanassoglou: Efficient Random Assignment under a Combination of Ordinal and Cardinal
Information on Preferences SD 12.2011 Robin Cross, Andrew J. Plantinga and Robert N. Stavins: The Value of Terroir: Hedonic Estimation of
Vineyard Sale Prices SD 13.2011 Charles F. Mason and Andrew J. Plantinga: Contracting for Impure Public Goods: Carbon Offsets and
Additionality SD 14.2011 Alain Ayong Le Kama, Aude Pommeret and Fabien Prieur: Optimal Emission Policy under the Risk of
Irreversible Pollution SD 15.2011 Philippe Quirion, Julie Rozenberg, Olivier Sassi and Adrien Vogt-Schilb: How CO2 Capture and Storage Can
Mitigate Carbon Leakage SD 16.2011 Carlo Carraro and Emanuele Massetti: Energy and Climate Change in China SD 17.2011 ZhongXiang Zhang: Effective Environmental Protection in the Context of Government Decentralization SD 18.2011 Stergios Athanassoglou and Anastasios Xepapadeas: Pollution Control: When, and How, to be Precautious SD 19.2011 Jūratė Jaraitė and Corrado Di Maria: Efficiency, Productivity and Environmental Policy: A Case Study of
Power Generation in the EU SD 20.2011 Giulio Cainelli, Massimiliano Mozzanti and Sandro Montresor: Environmental Innovations, Local Networks
and Internationalization SD 21.2011 Gérard Mondello: Hazardous Activities and Civil Strict Liability: The Regulator’s Dilemma SD 22.2011 Haiyan Xu and ZhongXiang Zhang: A Trend Deduction Model of Fluctuating Oil Prices SD 23.2011 Athanasios Lapatinas, Anastasia Litina and Eftichios S. Sartzetakis: Corruption and Environmental Policy:
An Alternative Perspective SD 24.2011 Emanuele Massetti: A Tale of Two Countries:Emissions Scenarios for China and India SD 25.2011 Xavier Pautrel: Abatement Technology and the Environment-Growth Nexus with Education SD 26.2011 Dionysis Latinopoulos and Eftichios Sartzetakis: Optimal Exploitation of Groundwater and the Potential for
a Tradable Permit System in Irrigated Agriculture SD 27.2011 Benno Torgler and Marco Piatti. A Century of American Economic Review SD 28.2011 Stergios Athanassoglou, Glenn Sheriff, Tobias Siegfried and Woonghee Tim Huh: Optimal Mechanisms for
Heterogeneous Multi-cell Aquifers SD 29.2011 Libo Wu, Jing Li and ZhongXiang Zhang: Inflationary Effect of Oil-Price Shocks in an Imperfect Market: A
Partial Transmission Input-output Analysis