the hydration status of malaysia's young male soccer players ...
Upload
independentCategory
view
2download
0
Jurnal Ekonomi Malaysia 26 (Disember 1992) 3 - 20
Market Share Analysis of Malaysia's Palm Oil Exports: Implications on its Competitiveness
Mohammad Haji Alias Fatimah Mohd. Arshad Abdul Aziz Abdul Rahman
ABSTRACT
The objective of this article is to analyse the market share of Malaysia's palm oil exports using the constant market share ( CMS)
approach in order to assess its competitiveness in the world market. Palm oil exports in period 1981·85 were analysed in comparison to the base period 1976·80 quantities. Next , palm oil exports in period 1986-90 were analysed in comparison to period 1981-85, andfinally a comparison between period 1981-85 and 1986-90. The results of the CMS analysis show that size of market is the dominant factor in contributing to the country's palm oil export expansion. The competitiveness [actor plays relatively minor role and it is declining over time.
ABSTRAK
Objektif artike! ini ialah menganalisis bahagian pasaran eksport minyak kelapa sawit Malaysia. Pendekatan bahagian pasaran malar ( BPM) digunakan untuk menilai daya saing eksporf di pasaran dunia. Eksport minyak ke!apa sawit bagi jangka masa 1981-85 dianalisis berbanding kepada kuantiti tahun asas 1976-80. Seterusnya, eksport minyak kelapa sawit bagijangka masa 1986-90 dianalisis berbanding kepada tempoh 1981-85, dan akhir sekali antara tempoh 1981-85 dan 1986-90. Keputusan analisis BPM menunjukkan saiz pasaran adalah faktor !ltama menyumbang kepada pengembangan eksport. Faktor daya saing memainkan peranan kedl dan sumbangannya merosot mengikut masa.
4 Jurnal Ekonomi Malaysia 26
INTRODUCTION
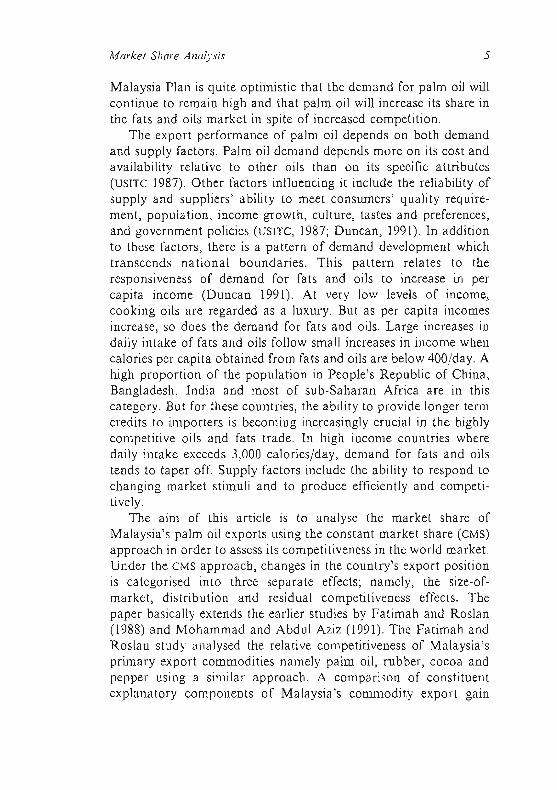
Palm oil has been dubbed as the golden crop of the Malaysian economy. Its contribution to the Gross Domestic Product has increased from 4.3% in 1980 to 8.4% in 1989. Export earnings from palm oil accounted for $4.4 billion in 1990 ie. the third largest export earner after petroleum and timber (Malaysia, 1992). The oil palm sector provided employment for a large number of population both in estates and Government land schemes and individual smallholdings.
Malaysia has established itself as the largest world producer and exporter of palm oil since the 1960s. This reflects the success of agricultural diversification efforts initiated in the 1960s to overcome the country's reliance on natural rubber and tin for export earnings. Much investment and research and development have been undertaken to promote the industry, together with positive actions taken by the Government to encourage smallholders' participation in oil palm cultivation. A combination of favourable endowment, both in physical resources, a growing demand for palm oil and palm oil products in the international market and supportive government policies, helped to explain the rapid growth of the palm oil industry (Pletcher 1991).
Palm oil competes directly with more than 16 major oils and fats in a highly competitive international market. The major oils and fats in terms of global production are soya bean oil, rapeseed oil, sunflower oil, tallow and butter. Palm oil accounted for about 13.7% of world requirements of oils and fats in 1990. Malaysian palm oil relies heavily on the export market as more than 85% of production is exported. At the same time, the ability of palm oil to compete with the other oils and fats becomes an issue of great urgency to planners and policy makers especially in the context of enhancing export and Government revenues to support the National Development Policy.
Palm oil, together with natural rubber and cocoa, are likely to continue to be the mainstay of agriculture in this country. By the end of the Sixth Malaysia Plan period, 1995, palm oil output and exports are expected to reach 7.6 million tonnes and 6.7 million tonnes respectively (Malaysia 1991). Export markets for the additional production therefore need to be found. The Sixth
Markel Share Analysis 5
Malaysia Plan is quite optimistic that the demand for palm oil will continue to remain high and that palm oil will increase its share in the fats and oils market in spite of increased competition.
The export performance of palm oil depends on both demand and supply factors. Palm oil demand depends more on its cost and availability relative to other oils than on its specific attributes (USITC 1987). Other factors influencing it include the reliability of supply and suppliers' ability to meet consumers' quality requirement, population, income growth, culture, tastes and preferences, and government policies (USITC, 1987; Duncan, 1991). In addition to these factors, there is a pattern of demand development which transcends national boundaries. This pattern relates to the responsiveness of demand for fats and oils to increase in per capita income (Duncan 1991). At very low levels of income, cooking oils are regarded as a luxury. But as per capita incomes increase, so does the demand for fats and oils. Large increases in daily intake of fats and oils follow small increases in income when calories per capita obtained from fats and oils are below 400/day. A high proportion of the population in People's Republic of China, Bangladesh, India and most of sub-Saharan Africa are in this category. But for these countries, the abil ity to provide longer term credits to importers is becoming increasingly crucial in the highly competitive oils and fats trade. In high income countries where daily intake exceeds 3,000 calories/day, demand for fats and oils tends to taper off. Supply factors include the ability to respond to changing market stimuli and to produce efficiently and competitively.
The aim of this article is to analyse the market share of Malaysia's palm oil exports using the constant market share (CMS)
approach in order to assess its competitiveness in the world market. Under the CMS approach, changes in the country's export position is categorised into three separate effects; namely, the size-ofmarket, distribution and residual competitiveness effects. The paper basically extends the earlier studies by Fatimah and Roslan (1988) and Mohammad and Abdul Aziz (1991). The Fatimah and Roslan study analysed the relative competitiveness of Malaysia's primary export commodities namely palm oil, rubber, cocoa and pepper using a similar approach. A comparison of constituent explanatory components of Malaysia's commodity export gain

6 Jumal Ekonomi Malaysia 26
berween sub-periods 1971-75, 1976-80 and 1981-85 were made. A comparison between the 1971-75 and 1981-85 period indicated that out of 1,333,991 tonnes of palm oil export gain, 56.9% were attributed to size-of-market effect, 42.4% to competitive effect and 0.7% to distribution effect. In another study using the eMS model, Malaysian palm oil exports have also been shown to be competitive during the 1978-82 period with world market effect contributing 26.7% to export gain, competitive effect 58.5% and market distribution effect 14.8% (Mielke 1983). This achievement has been attributed to the rapid growth of palm oil production in Malaysia.
The paper does not directly analyse the impact of supply and demand factors on export competitiveness. What is done is to analyse the changes in the palm oil export shares and see whether the observed increase in export shares, is associated with an increase in competitiveness or not.
The plan of the paper is as follows. The methodology of the eMS
approach is described in the next section. This is followed by the eMS analysis of palm oil exports. Policy implications are given in the concluding remarks.
THE eMS MODEL
The eMS model decomposes the actual gain in exports into three separate effects: size-of-market, market distribution and competitiveness. Export growth is ascribed to either structural or competitive forces. The eMS identity for the actual change in Malaysia's palm oil exports between two periods may be written (Bowen and Pelzman 1984; Richardson 1971):
where q is total Malaysian palm oil exports, qi is Malaysian palm oil exports to country i, r is the rate of growth of total world palm oil exports, ri is the rate of growth of world export of palm oil to country i, and superscripts 0 and I refer to the initial and second period respectively.
Market Share Analysis 7
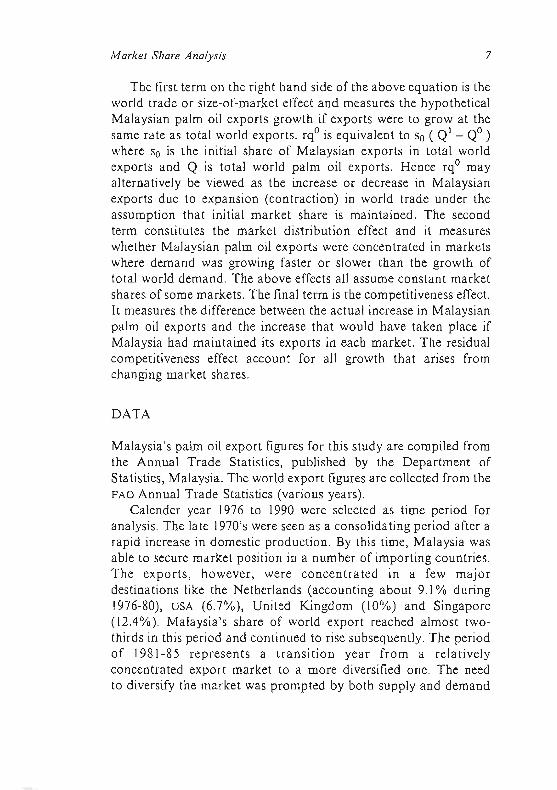
The first term on the right hand side of the above equation is the world trade or size-of-market effect and measures the hypothetical Malaysian palm oil exports growth if exports were to grow at the same rate as total world exports. rqo is equivalent to So ( Q' _ QO) where So is the initial share of Malaysian exports in total world exports and Q is total world palm oil exports. Hence rqo may alternatively be viewed as the increase or decrease in Malaysian exports due to expansion (contraction) in world trade under the assumption that initial market share is maintained. The second term constitutes the market distribution effect and it measures whether Malaysian palm oil exports were concentrated in markets where demand was growing faster or slower than the growth of total world demand. The above effects all assume constant market shares of some markets. The final term is the competitiveness effect. It measures the difference between the actual increase in Malaysian palm oil exports and the increase that would have taken place if Malaysia had maintained its exports in each market. The residual competitiveness effect account for all growth that arises from changing market shares.
DATA
Malaysia's palm oil export figures for this study are compiled from the Annual Trade Statistics, published by the Department of Statistics, Malaysia. The world export figures are collected from the FAO Annual Trade Statistics (various years).
Calender year 1976 to 1990 were selected as time period for analysis. The late 1970's were seen as a consolidating period after a rapid increase in domestic production. By this time, Malaysia was able to secure market position in a number of importing countries. The exports, however, were concentrated in a few major destinations like the Netherlands (accounting about 9.1 % during 1976-80), USA (6.7%), United Kingdom (10%) and Singapore (12.4%). Malaysia's share of world export reached almost twothirds in this period and continued to rise subsequently. The period of 1981-85 represents a trans ition year from a relatively concentrated export market to a more diversified one. The need to diversify the market was prompted by both supply and demand
8 Jurnal Ekonomi Malaysia 26
factors. The continuous increase in domestic production, rapid increase in the production of other vegetable oils and fats and increase in income and population necessitate export expansion in other consuming countries. During this period, exports have diversified into other markets like the USSR, India and Pakistan and the Middle East. The last period of 1986-90 signifies a more balanced and diversified markets. This period saw the emergence of new palm oil users like China (accounting about 14.3% of Malaysia's export by 1990), Turkey, South Korea and Egypt; besides those captured in the 1981-85 period. During this period also, Malaysia's palm oil was subjected to a serious adverse publicity campaign launched by the American Soybean Association in 1987 as well as the dumping of soybean oil at below market prices into palm oil's traditional markets in the Indian subcontinent. The five year averages (1976-80, 1981-85 and 1986-90) were designated as Periods I , II and III, respectively for the market share analysis. Palm oil exports (crude palm oil and processed palm oil) are disaggregated into 17 major markets consisting of individual countries and groups of countries (rest of the world category).
CMS ANALYSIS OF PALM OIL EXPORTS
The three structural components of the market share model were calculated under the assumption that base period export shares were maintained in other market periods. Under this assumption , palm oil exports in Period II (1981 -85) were analysed in comparison to Period I (1976-80) quantities. Next, palm oil exports in Period III (1986-90) were analysed in comparison to Period II. Lastly, palm oil exports during Period II and III were analysed. The three periods represent five year averages. A five year average is chosen in order to iron out year to year fluctuations.
Table 1 presents the five - year average of world export to the selected 17 countries and the share of Malaysian export in each country in the three defined periods. This table suggests several conclusions. Firstly, during period I and III, Malaysia's export has increased by 115.4% from 2.6 mn t to 5.6 mn t. Except for the UK,
US, Netherlands (where their palm oil imports have declined), the
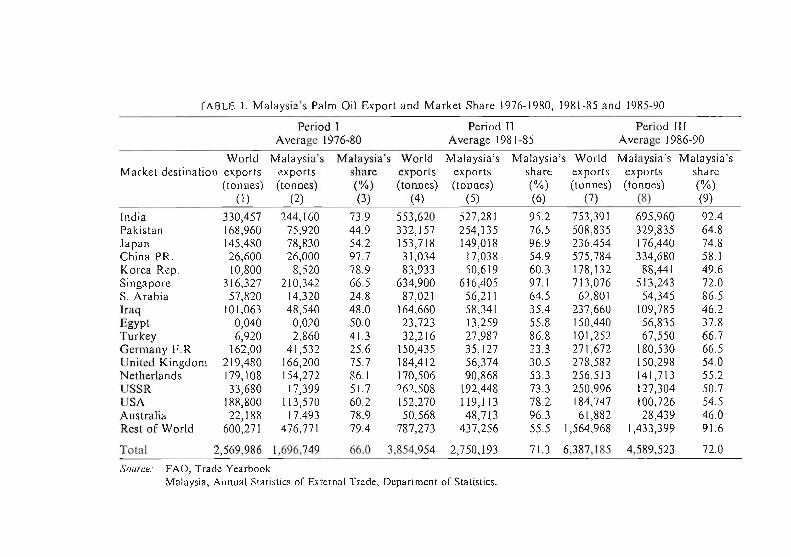
TABLE I. Malaysia 's Palm Oil Export a nd Market Share 1976- 1980, 198 1-85 and 1985-90
Period I Period II Period III Average 1976-80 Average 1981-85 Average 1986-90
World Malaysia's Malaysia's World Malaysia's Malaysia's World Malaysia 's Malaysia's Market destination exports exports share exports exports share exports exports share
(tonnes) (tonnes) (%) (tonnes) (tonnes) (%) (tonnes) (tonnes) (%) (I) (2) (3) (4) (5) (6) (7) (8) (9)
India 330,457 244,160 73.9 553,620 527,281 95.2 753,39 1 695,960 92.4 Pakistan 168,960 75,920 44.9 332, 157 254,135 76.5 508,835 329,835 64.8 Japa n 145,480 78,830 54.2 153,7 18 149,01 8 96.9 236,454 176,440 74.8 China PR o 26,600 26,000 97.7 3 1,034 17,038 54.9 575,784 334,680 58.1 Korea Rep. 10,800 8,520 78.9 83,933 50,619 60.3 178, 132 88,441 49.6 Singapore 3 16,327 210,342 66.5 634,900 616,405 97.1 713,076 513,243 72.0 S. Arabia 57,820 14,320 24.8 87,02 1 56,2 11 64.5 62,801 54,345 86.5 Iraq 101 ,063 48,540 48.0 164,660 58,34 1 35.4 237,660 109,785 46.2 Egypt 0,040 0,020 50.0 23,723 13,259 55.8 150,440 56,835 37.8 T urkey 6,920 2,860 41.3 32,216 27,987 86.8 101,252 67,550 66.7 Germany F.R 162,00 4 1,532 25.6 150,435 35, 127 23.3 27 1,672 180,530 66.5 U ni ted Kingdom 219,480 166,200 75.7 184,4 12 56,374 30.5 278,582 150,298 54.0 Netherlands 179,108 154,272 86. 1 170,506 90,868 53.3 256,5 13 141 ,7 13 55.2 USSR 33,680 17,399 51.7 262,508 192,448 73.3 250,996 127,304 50.7 USA 188,800 113,570 60.2 152,270 11 9, 11 3 78.2 184,747 100,726 54.5 Australia 22,188 17,493 78.9 50,568 48,7 13 96.3 61,882 28,439 46.0 Rest o f World 600,27 1 476,771 79.4 787,273 437,256 55 .5 1,564,968 1,433,399 91.6
Total 2,569,986 1,696,749 66.0 3,854,954 2,750,193 71.3 6,387, 185 4,589,523 72.0
Source: FAD, Trade Yearbook Ma laysia, Annual Statistics or Ex ternal Trade, Department or Statistics.

10 Jurnal Ekonomi Malaysia 26
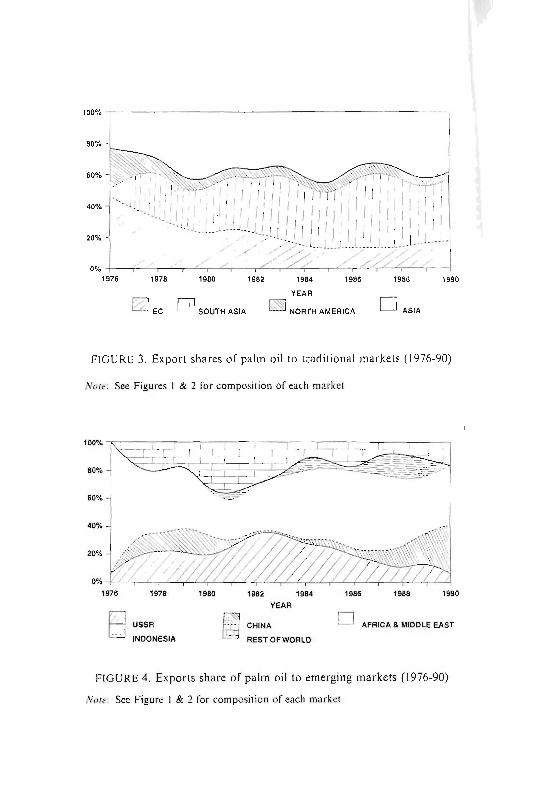
rest of countries registered an increase in imports of Malaysia's palm oil. Secondly, the pattern of export has undergone a structural change where the market has diversified worldwide - beyond the traditional markets like India, EEC, us and Singapore. Malaysia was able to capture new markets like USSR (from importing 1.0% of Malaysia's total exports to 2.7% during the two periods), Pakistan (from 4.5% to 7.1 %), China (from 1.5% to 7.3%), Egypt (from 0% to 1.2%), Turkey (from 0.1 % to 1.5%) and rest of the world (from 28 .1 % to 31.2%). Traditional markets like India, EEC
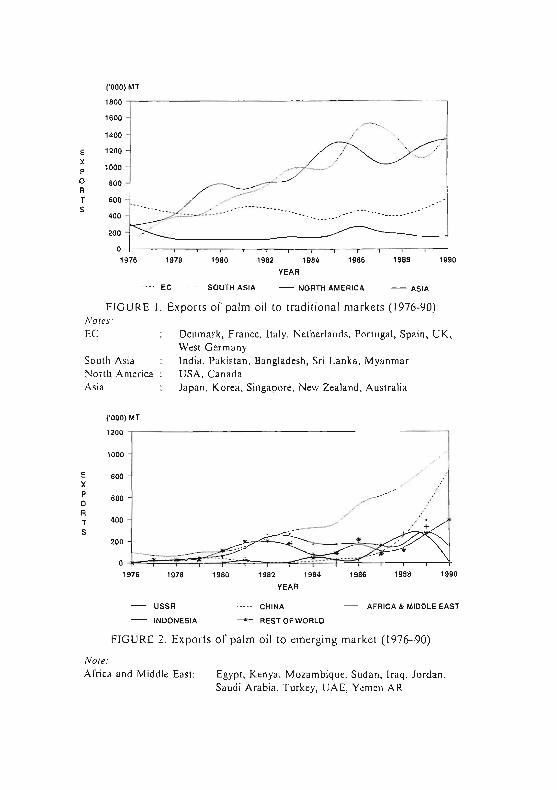
countries, Japan and us have more or less maintained their market shares. The change in the palm oil exports among these countries are depicted in Figure I to 4.
This phenomenal change begs the question of what contributes towards this development. As mentioned earlier, the CMS model attempts to explain and quantify the factors contributing the change. As indicated in Table I, it can be seen that Malaysia's share of palm oil exports has increased from 66% in Period I to 71.3% in Period II and 72.0% in Period III. Comparison between Period I and II indicates that the net increase in export was 1,053,444 tonnes. If Malaysia's market share of 66% in period I was maintained in period II, total exports would have been 2,544,269 t. If Malaysia had maintained its 1976-80 market share in individual markets in 1981-85, total exports would have been 2,503,405 t (Table 2). The difference between the two hypothetical figures represents the distribution effect of - 40,864 t (Table 3). This distribution effect measures the shift in the relative importance of the various markets. The balance gives the size-of-market and competitive effects.
If Malaysia had maintained tile aggregate market share of 66.0% (period I) in period II, total exports would have been 2,544,269 t. This is 871,520 t above the actual exports in period I. This measures the size-of-market effect. The competitive effect is the difference between the actual aggregate exports in period II and the hypothetical Malaysian exports in period II at 1976-80 market share in each individual markets. The competitive effect is 246,788 t. The positive size-of-market and competitive effects compensate for the negative distribution effect.
Table 3 shows the relative contribution of each effect on the expansion in palm oil exports between the three sub-periods.
('000) MT
1800
1600 .--..... 1400 / ,
E 1200 / ,
X / P 1000 ._-0 800 R T .00 .. ' S
400 -~-<':-.-
200
0 1976 1978 1980 1982 1984 1986 1988 ,,'"
YEAR
---- EC SOUTH ASIA - NORTH AMERICA - ASIA
FIGURE I. Exports of palm oil to traditional markets (1976-90) NOles: EC
South Asia North America Asia
('000) MT
Denmark , France, Italy, Netherlands, Portugal , Spain, UK , West Germany India, Pakistan, Bangladesh, Sri Lanka, Myanmar USA, Canada Japan, Korea, Singapore, New Zealand, Austral ia
1200 ,--------------------------------------------------,
E X P o R T S
1000
1976 1978
USSR
INDONESIA
"80 1982 1984 1986 1988 ,99<> YEAR
--- - CHINA - AFRICA & MIDDL.E EAST
-- REST OF WORLD
FIGURE 2. Exports o f palm oi l to emerging market (1976-90)
Nole: Africa and Middle East: Egypt, Kenya , Mozambique, Sudan, Iraq, Jordan,
Saudi Arabia , Turkey, UAE, Yemen AR
100% ,~~~~~~~~~~~~~~~~~~~~~~
80%
1976 1978 1980 1982 1984 1986 1988 1990
YEAR
IZJ EC 0 SOUTH ASIA ~ NORTH AMERICA o ASIA
FIGURE 3. Export shares of palm oil to traditional markets (1976-90)
Note: See Figures I & 2 for composition of each market
100% ,,~~-'---~~---'-~-'---~~~-r~-r~~~---'r-~~~--' .,. T ~=~_
~~' ;s:L. ~£;~-~~~~;> 80%
60% -=..",-
40%
20%
O%+---'r--r~~~~~-L~~~~~~-L~~~~~~~ 1976
El 1978
USSR
INDONESIA
1980 1982 1984 1986 1988 1990
YEAR
CHINA D AFRICA & MIDDLE EAST
REST OF WORLD
FIGURE 4. Exports share of palm oi l to emerging markets (1976-90)
Note: See Figure I & 2 for composition of each market
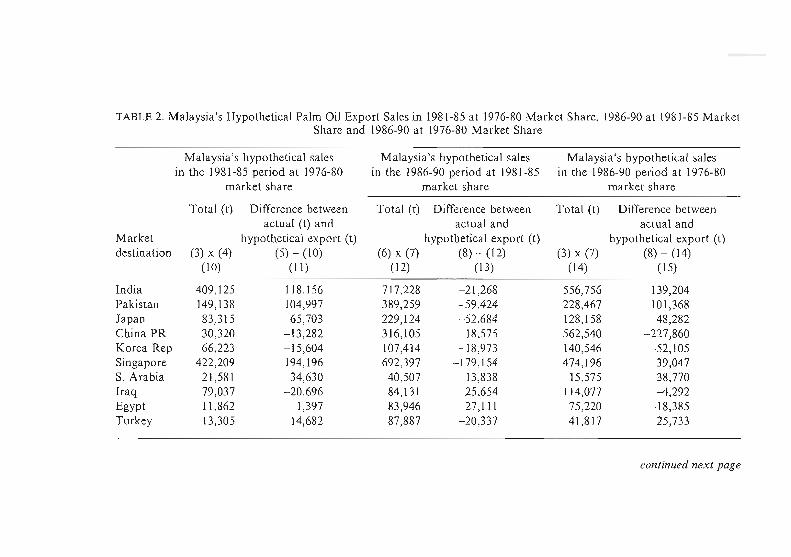
TABLE 2. Malaysia's Hypothetical Palm Oil Export Sales in 1981-85 at 1976-80 Market Share, 1986-90 at 1981-85 Market Share and 1986-90 at 1976-80 Market Share
Malaysia's hypothetical sales Malaysia's hypothetica l sales Malaysia's hypothetical sales in the 1981-85 period at 1976-80 in the 1986-90 period at 198 1-85 in the 1986-90 period at 1976-80
market share market share market share
Total (t) Difference between Total (t) Difference between Total (t) Difference between actua l (t) and actual and actual and
Market hypothetical export (t) hypothetical export (t) hypothetical export (t) destination (3) x (4) (5) - ( 10) (6) x (7) (8) - (12) (3) x (7) (8)-(14)
(10) ( II ) (12) ( 13) ( 14) ( 15)
India 409, 125 11 8, 156 7 17,228 - 21,268 556,756 139,204 Pakistan 149, 138 104,997 389,259 - 59,424 228 ,467 101,368 Japan 83,315 65,703 229, 124 - 52,684 128, 158 48,282 China PR 30,320 - 13,282 316,105 18,575 562,540 - 227,860 Korea Rep 66,223 - 15,604 107,414 - 18,973 140,546 -52, 105 Singapore 422,209 194,196 692,397 - 179,154 474,196 39,047 S. Arabia 21,581 34,630 40,507 13,838 15,575 38,770 Iraq 79,037 -20,696 84, 131 25,654 114,077 -4,292 Egypt 11 ,862 1,397 83,946 -27, 111 75,220 - 18,385 Turkey 13,305 14,682 87,887 - 20,337 41,817 25,733
continued next page

Table 2 (Continued)
Malaysia's hypothetical sales in the 1981-85 period at 1976-80
market share
Market destination
Germany F.R U. Kingdom Netherlands USSR USA Australia Rest of World
Total (t)
(3) x (4) (10)
38,511 139,599 146,805 135,716 91,666 39,898
625,095
Difference between actual (t) and
hypothetical export (t) (5)-(10)
(II )
- 3,384 - 83,225 -55,937
56,732 27,447 8,815
- 187,839
Total 2,503,405 b 246,788 2,544,269 e
Note: a This table utilises colums from Table 1
Malaysia's hypothetical sales in the 1986-90 period at 1981-85
market share
Total (t) Difference between actual and
hypothetical export (t) (6) x (7) (8) - (12)
(12) (13)
63,299 117,231 84,968 65,330
136,721 4,992 183,980 - 56,676 144,472 -43,746 59,592 - 31 ,153
868,557 564,842
4,289,587 c 299,936 4,554,063 r
b, c and d are total of columns 10, 13 and 15 respectively
Malaysia's hypothetical sales in the 1986-90 period at 1976-80
market share
Total (t)
(3) x (7) (14)
69,548 210,887 220,858 129,765 111 ,218 48,825
1,242,584
Difference between actual and
hypothetical export (t) (8) - (14)
(15)
110,982 - 60,589 -79.145
-2,461 - 10,492 -20,386 190,815
4,371 ,037 d 218,486 4,215,542 g
e, f and g are columns (3) x: (4) from total row, (6) x (7) from total row and (3) x (7) from total row respectively
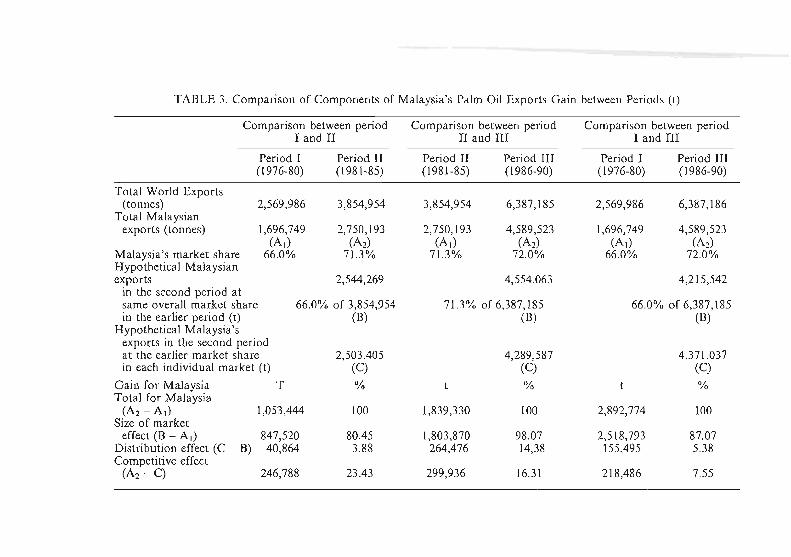
TABLE 3. Comparison of Components of Malaysia 's Palm Oil Exports Gain between Periods (t)
Comparison between period Comparison between period Comparison between period I and II II and III I and III
Period I Period II Period II Period III Period I Period III (1976-80) ( 1981-85) (1981 -85) (1986-90) (1976-80) (1986-90)
Total World Exports (tonnes) 2,569,986 3,854,954 3,854,954 6,387,185 2,569,986 6,387, 186
Total Malaysian exports (tonnes) 1,696,749 2,750,193 2,750, 193 4,589,523 1,696,749 4,589,523
(A,) (A, ) (A,) (A,) (A,) (A,) Malaysia's market share 66.0% 71.3% 71.3% 72.0% 66.0% 72.0% Hypothetical Malaysian exports 2,544,269 4,554.063 4,215,542
in the second period at same overall market share 66.0% of 3,854,954 71.3% of 6,387, 185 66.0% of 6,387,185 in the earlier period (t) (8) (8) (B)
Hypothetical Malaysia's exports in the second period at the earlier market share 2,503.405 4,289,587 4,371.037 in each individual market (t) (C) (C) (C)
Gain for Malaysia T % % % Total for Malaysia
(A, - A,) 1,053,444 100 1,839,330 100 2,892,774 100 Size of market
effect (B - A,) 847,520 80.45 1,803,870 98.07 2,518,793 87.07 Distribution effect (C - B) --40,864 -3.88 -264,476 -14,38 155,495 5.38 Competitive effect
(A, - C) 246,788 23.43 299,936 16.31 218,486 7.55
16 furna! Ekonomi Malaysia 26
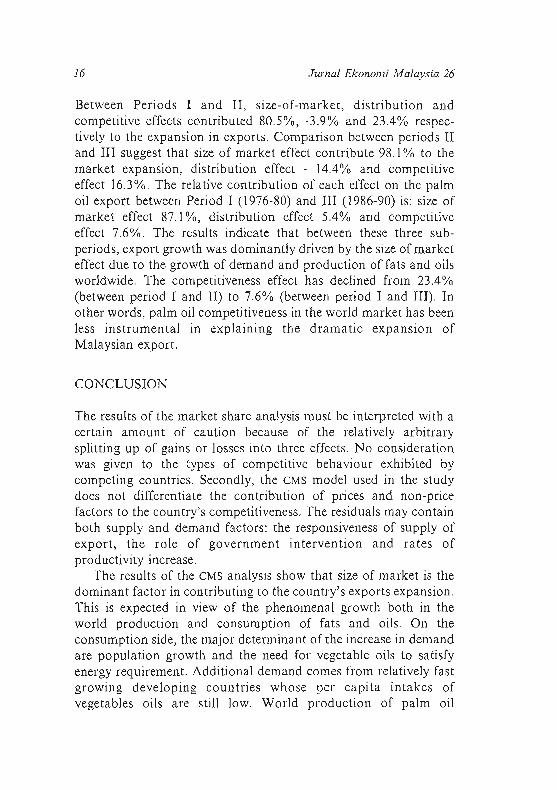
Between Periods I and II, size-of-ma rket, distribution and competitive effects contributed 80.5%, -3.9% and 23.4% respectively to the expansion in exports. Comparison between periods 11 and III suggest that size of market effect contribute 98.1 % to the market expansion, distribution effect - 14.4% and competitive effect 16.3%. The relative contribution of each effect on the palm oil export between Period I (1976-80) and III (1986-90) is: size of market effect 87.1 %, distribution effect 5.4% and competitive effect 7.6%. The results indicate that between these three subperiods, export growth was dominantly driven by the size of market effect due to the growth of demand and production of fats and oils worldwide. The competitiveness effect has declined from 23.4% (between period I and II) to 7.6% (between period I and Ill) . In other words, palm oil competitiveness in the world market has been less instrumental in explaining the dramatic expansion of Malaysian export.
CONCLUSION
The results of the market share analysis must be interpreted with a certain amount of caution because of the relatively arbitrary splitting up of gains or losses into three effects. No consideration was given to the types of competitive behaviour exhibited by competing countries. Secondly, the CMS model used in the study does not differentiate the contribution of prices and non-price factors to the country's competitiveness. The residuals may contain both supply and demand factors: the responsiveness of supply of export, the role of government intervention and rates of productivity increase.
The results of the CMS analysis show that size of market is the dominant factor in contributing to the country's exports expansion. This is expected in view of the phenomenal growth both in the world production and consumption of fats and oils. On the consumption side, the major determinant of the increase in demand are population growth and the need for vegetable oils to satisfy energy requirement. Additional demand comes from relatively fast growing developing countries whose per capita intakes of vegetables oils are still low. World production of palm oil
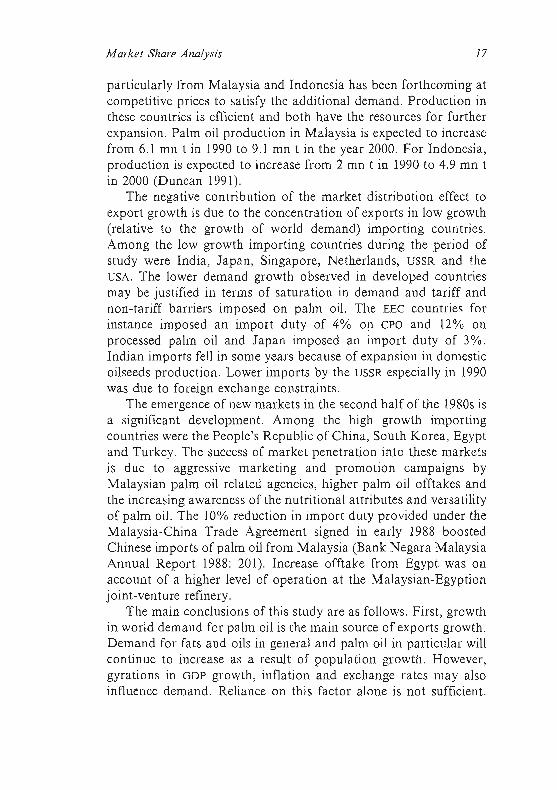
A1arket Share Analysis 17
particularly from Malaysia and Indonesia has been forthcoming at competitive prices to satisfy the additional demand. Production in these countries is efficient and both have the resources for further expansion. Palm oil production in Malaysia is expected to increase from 6.1 mn t in 1990 to 9.1 mn t in the year 2000. For Indonesia, production is expected to increase from 2 mn t in 1990 to 4.9 mn t in 2000 (Duncan 1991).
The negative contribution of the market distribution effect to export growth is due to the concentration of exports in low growth (relative to the growth of world demand) importing countries. Among the low growth importing countries during the period of study were India, Japan, Singapore, Netherlands, USSR and the USA. The lower demand growth observed in developed countries may be justified in terms of saturation in demand and tariff and non-tariff barriers imposed on palm oil. The EEC countries for instance imposed an import duty of 4% on CPO and 12% on processed palm oil and Japan imposed an import duty of 3%. Indian imports fell in some years because of expansion in domestic oilseeds production. Lower imports by the USSR especially in 1990 was due to foreign exchange constraints.
The emergence of new markets in the second half of the 1980s is a significant development. Among the high growth importing countries were the People's Republic of China, South Korea, Egypt and Turkey. The success of market penetration into these markets is due to aggressive marketing and promotion campaigns by Malaysian palm oil related agencies, higher palm oil offtakes and the increasing awareness of the nutritional attributes and versatility of palm oil. The 10% reduction in import duty provided under the Malaysia-China Trade Agreement signed in early 1988 boosted Chinese imports of palm oil from Malaysia (Bank Negara Malaysia Annual Report 1988: 201). Increase offtake from Egypt was on account of a higher level of operation at the Malaysian-Egyption joint-venture refinery.
The main conclusions of this study are as follows. First, growth in world demand for palm oil is the main source of exports growth. Demand for fats and oils in general and palm oil in particular will continue to increase as a result of population growth. However, gyrations in GDP growth, inflation and exchange rates may also influence demand. Reliance on this factor alone is not sufficient.
18 Jurnal Ekonomi Malaysia 26
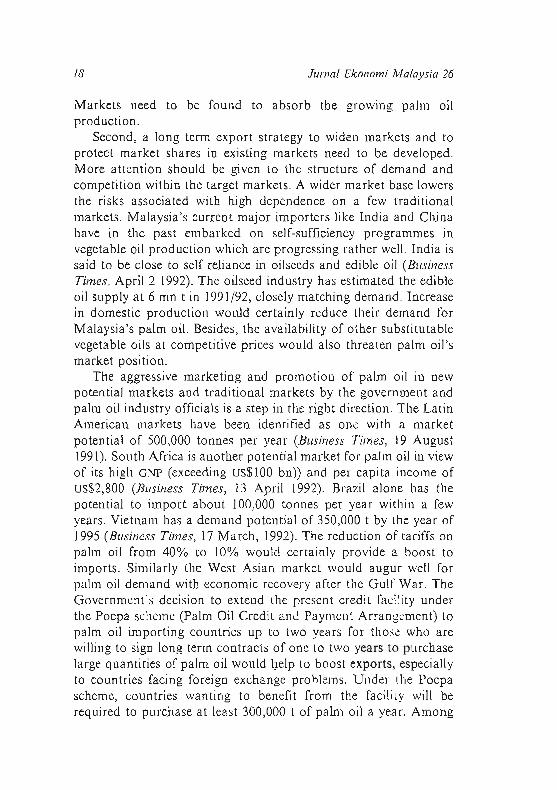
Markets need to be found to absorb tbe growing palm oil production.
Second, a long term export strategy to widen markets and to protect market shares in existing markets need to be developed. More attention should be given to the structure of demand and competition within the target markets. A wider market base lowers the risks associated with higb dependence on a few traditional markets. Malaysia's current major importers like India and China have in the past embarked on self-sufficiency programmes in vegetable oil production which are progressing rather well. India is said to be close to self reliance in oil seeds and edible oil (Business Times, April 2 1992). The oilseed industry has estimated the edible oil supply at 6 mn t in 1991 /92, closely matching demand. Increase in domestic production would certainly reduce their demand for Malaysia's palm oil. Besides, tbe availability of other substitutable vegetable oils at competitive prices would also threaten palm oil's market position.
The aggressive marketing and promotion of palm oil in new potential markets and traditional markets by the government and palm oil industry officials is a step in the right direction. The Latin American markets have been identified as one with a market potential of 500,000 tonnes per year (Business Times, 19 August 1991). South Africa is another potential market for palm oil in view of its high GNP (exceeding us$\OO bn)) and per capita income of uS$2,800 (Business Times, 13 April 1992). Brazil alone has the potential to import about 100,000 tonnes per year within a few years. Vietnam has a demand potential of 350,000 t by the year of 1995 (Business Times, 17 March, 1992). The reduction of tariffs on palm oil from 40% to 10% would certainly provide a boost to imports. Similarly the West Asian market would augur well for palm oil demand with economic recovery after the Gulf War. The Government's decision to extend the present credit facility under the Pocpa scheme (palm Oil Credit and Payment Arrangement) to palm oil importing countries up to two years for those who are willing to sign long term contracts of one to two years to purchase large quantities of palm oil would I)elp to boost exports, especially to countries facing foreign exchange problems. Under the Pocpa scheme, countries wanting to benefit from the facility will be required to purchase at least 300,000 t of palm oil a year. Among
Market Share Analysis 19
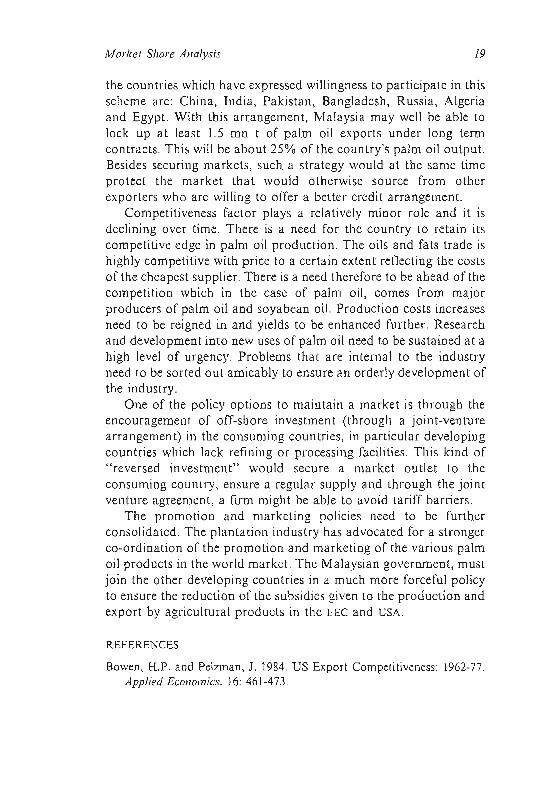
the countries which have expressed willingness to participate in this scheme are: China, India, Pakistan, Bangladesh, Russia, Algeria and Egypt. With this arrangement, Malaysia may well be able to lock up at least 1.5 mn t of palm oil exports under long term contracts. This will be about 25% of the country's palm oil output. Besides securing markets, such a strategy would at the same time protect the market that would otherwise source from other exporters who are will ing to offer a better credit arrangement.
Competitiveness factor plays a relatively minor role and it is declining over time. There is a need for the co untry to retain its competitive edge in palm oil production. The oils and fats trade is highly competitive with price to a certain extent reflecting the costs of the cheapest supplier. There is a need therefore to be ahead of the competition which in the case of palm oil, comes from major producers of palm oil and soya bean oil. Production costs increases need to be reigned in and yields to be enhanced further. Research and development into new uses of palm oil need to be sustained at a high level of urgency. Problems that are internal to the industry need to be sorted out amicably to ensure an orderly development of the industry.
One of the policy options to maintain a market is through the encouragement of off-shore investment (through a joint-venture arrangement) in the consuming countries, in particular developing countries which lack refining or processing facilities. This kind of " reversed investment" would secure a market outlet to the consuming country, ensure a regular supply and through the joint venture agreement, a firm might be able to avoid tariff barriers.
The promotion and marketing policies need to be further consolidated. The plantation industry has advocated for a stronger co-ordination of the promotion and marketing of the various palm oil products in the world market. The Malaysian government, must join the other developing countries in a much more forceful policy to ensure the reduction of the subsidies given to the production and export by agricultural products in the EEC and USA.
R.EFERENCES
Bowen, H.P. and Pelzman, J. 1984. US Export Competitiveness: 1962-77. Applied Economics. 16: 461-473.

20 Jumal Ekonomi Malaysia 26
Duncan, R. 1991. Global Outlook for Agricultural Primary Commodities. Paper presented at National Seminar on Agricultural Primary Commodities, 3-4 June, Kuala Lumpur.
Fatimah Mohd. Arshad and Roslan Abdul Ghaffar. 1988. Malaysia's Primary Commodities: Constant-Markets-Share Analysis. In Fatimah Mohd. Arshad et al. (eds.). Malaysian Agricultural Policy: Issues and Directions, Centre for Agricultural Policics Studies, UPM.
Malaysia. 1988. Economic Report 1988/89. Ministry of Finance. Malaysia. 1990. Profile: Malaysia's Primary Commodities. Ministry of
Primary Industries. Malaysia. 1991. Sixth Malaysia P/an199J-J995. Kuala Lumpur: National
Printing Department. Malaysia. 1992. Economic Report 1992/93. Ministry of Finance Malaysia. Mielke. 1983. The Past 25 Years and the Prospects for the Next 25. Oil
World, ISTA, Hamburg. Mohammad Haji Alias aDd Abdul Aziz Abdul Rahman. 1991. The
Competitiveness of Malaysia Palm Oil Exports: An Application of the Constant Market Share Analysis. 1991 POR1M International Palm Oil Conference Proceedings, Promotion and Marketing.
Pletcher, J. 1991. Regulation with Growth: The Political Economy of Palm Oil in Malaysia. World Development , 19(6): 623-636.
Richardson, J.D. 1971. Some Sensitivity Tests for a 'Constant MarketShare' -Analysis of Export Growth. Review of Economics and Statistics 53: 300-304.
United States International Trade Commision. 1987. U.S. Global Competitiveness: Oilseeds and Oilseed Products. USITC Publication 2045, Washington, DC.
Mohammad Haji Alias labatan Statistik Ekonomi Fakulti Ekonomi Universit i Kcbangsaan Malaysia 43600 UKM Bangi Selangor Darul Ehsan
Fatimah Mohd. Arshad & Abdul Aziz Abdul Rahman Fakulti Ekonomi dan Pcngurusan Universiti Pertanian Malaysia 43400 UPM, Serdang Selangor Darul Ehsan.
Copyright © 2022 FDOKUMEN