Investment, Technological Upgrading, and Exports in Indian ...
53
Heinz School, 2 nd Paper, Carnegie Mellon, 2008 1 | Page No Such Thing as a Free Lunch: Investment, Technological Upgrading, and Exports in Indian Pharmaceuticals Chirantan Chatterjee {[email protected]} April 2008 Draft for 2 nd Paper Requirements, H John Heinz III School of Public Policy & Management, Carnegie Mellon University Advisory Committee Professor Lee Branstetter, Carnegie Mellon Professor Ashish Arora, Carnegie Mellon Professor Irina Murtazashvili, University of Pittsburgh
-
Upload
khangminh22 -
Category
Documents
-
view
2 -
download
0
Transcript of Investment, Technological Upgrading, and Exports in Indian ...

H e i n z S c h o o l , 2 n d P a p e r , C a r n e g i e M e l l o n , 2 0 0 8
1 | P a g e
No Such Thing as a Free Lunch:
Investment, Technological Upgrading, and Exports in Indian Pharmaceuticals
Chirantan Chatterjee
April 2008 Draft for 2nd Paper Requirements,
H John Heinz III School of Public Policy & Management,
Carnegie Mellon University
Advisory Committee
Professor Lee Branstetter, Carnegie Mellon
Professor Ashish Arora, Carnegie Mellon
Professor Irina Murtazashvili, University of Pittsburgh

H e i n z S c h o o l , 2 n d P a p e r , C a r n e g i e M e l l o n , 2 0 0 8
2 | P a g e
Abstract
The Indian pharmaceutical industry’s exports began to exceed its imports in the late 1980s.
Since then, exports have grown rapidly, and the leading Indian firms have become significant exporters
of generic drugs to the most advanced markets, including the U.S. As the Indian pharmaceutical industry
increases its R&D spending and innovative efforts, leading firms clearly hope to export new products
and processes to the U.S. and other advanced markets. Because it constitutes a (rare) example of a high
tech exporting industry in a developing country, the Indian pharmaceutical industry provides an
interesting context in which to explore the relationship between exports and technological upgrading.
We investigate these linkages in this paper. The received literature has suggested that the
exposure to advanced country technologies achieved through exports should lead to technological
improvements in the exporting firms’ products and processes. Researchers have generally tried to
measure these improvements by looking for changes in exporting firms’ measured total factor
productivity that could be ascribed to increase in exports. The conceptual association in the literature
between technological learning or upgrading through exports and increases in TFP is so strong that the
phrase “learning by exporting” has come to mean an increase in TFP following an increase in exports.
We find that there is not much learning effect (from exports) observed for the overall industry. Some
apparent learning effect is observed for a section of the industry, but only for firms who appear to be
technologically backward within the industry. The leading firms that have undertaken the most
technological upgrading and have had the most success exporting to the most advanced markets appear
to show no signs of “learning by exporting.” The concentration of apparent “learning by exporting”
effects in technologically backward firms would appear to be highly problematic. Given the narrow way
the received literature has conceptualized learning by exporting effects, we might be lead to conclude
that these either do not exist in the Indian pharmaceutical industry or are unimportant for its significant
firms.
We disagree with this assessment, and our disagreement is partly founded on our belief that the
received literature has conceptualized the “learning by exporting” phenomenon too narrowly. Exports
can induce technological upgrading even if conventionally measured TFP fails to rise after exports start.
In making this criticism, we are contributing to a stream of recent papers which also argue that past work
has looked for the effects of exporting on technological upgrading in the wrong places. Recent work by
Trefler (2008) and Javorcik et.al (2008) argue that the learning by exporting literature should take a

H e i n z S c h o o l , 2 n d P a p e r , C a r n e g i e M e l l o n , 2 0 0 8
3 | P a g e
more inclusive view of the phenomenon. They argue that exporting often follows substantial (costly)
investment by the firm that allows it to raise its product/process quality to the levels required by more
advanced markets. In the Indian pharmaceutical industry, while we find only weak evidence of TFP
growth after exporting, we find strong evidence of significant increases in capital investment prior to
exporting, and this is especially true for firms exporting to the most advanced markets. We refer to this
as a “getting ready to export” effect, following Javorcik et al. (2008), and present arguments supporting
the view that these investments can be viewed as a form of costly technological upgrading.
Key Words: Indian Pharmaceuticals; learning by exporting; TFP.

H e i n z S c h o o l , 2 n d P a p e r , C a r n e g i e M e l l o n , 2 0 0 8
4 | P a g e
A. Introduction
A key strand of the new international economics literature explores the impact of firm or plant level
exports on the technological upgrading of the firm as measured by total factor productivity. Dubbed
informally as the learning by exporting literature the genesis of this stream of research dates back to
Bernard and Jensen’s seminal paper on exporting and productivity in US manufacturing in the mid
1990s. Since that work, researchers have found at best mixed evidence for productivity increases, or a
learning effect that are caused by exporting by firms. On the one hand the literature has documented no
evidence from exporting on the productivity of firms in many contexts in which it might be reasonably
expected (Clerides, Lach and Tybout 1998, Bernard and Jensen 1999, 2004, Bernard and Wagner 1997,
Delgado, Farinas and Ruano 2002). More recently, a small number of researchers have found a positive
effect of exporting on firm productivity (Aw, Chung, and Roberts 2000, Baldwin and Gu 2003, Van
Biesebroeck 2004, Lileeva 2004, Hallward-Driemeier, Iarossi and Sokoloff 2005, Fernandes and Isgut
2006, Park, Yang, Shi, and Jiang 2006, Aw, Roberts and Winston 2007 and De Loecker (forthcoming)).
Given the mixed and largely inconclusive state of the evidence in the received literature, it is perhaps not
surprising that our own findings are also mixed. While at an overall level, the industry does not witness
much learning effect from exporting, certain subsections of the industry do reveal significant increases in
total factor productivity accruing from exporting. They are not, however, the industry subsections that
have experienced the most technological upgrading. Measured TFP growth in the elite firms at the
forefront of the industry – the firms that have had the most success exporting to the most advanced
markets – appears unrelated to export activity.
Recent work by Trefler (2007) and Javorcik et.al (2008) argue that the learning by exporting literature
should broaden its focus to include alternative measures of technological upgrading other than TFP.
They argue that successful exporting often requires (costly) ex ante investments in capital and more
skilled labor. These investments must often be made before any significant level of exporting occurs.
Whereas the learning by exporting literature has tended to view productivity improvements from
exporting as something that comes “for free,” the more recent work suggests that much of the upgrading
occurs before, not after exports commence. In addition, much of the technological upgrading is
embodied in new capital equipment, worker training, and quality certifications, all of which require real
outlays on the part of the firm. Furthermore, once firms enter the export market, they are often
constrained in terms of their ability to appropriate the gains from their technological upgrading. Facing
fierce competition from existing incumbents and from other foreign entrants, exporters must often accept

H e i n z S c h o o l , 2 n d P a p e r , C a r n e g i e M e l l o n , 2 0 0 8
5 | P a g e
lower profit margins on export sales than on sales in their domestic market. All of this can lead to very
modest measured increases in TFP after the inception of exports. Yet the prospect of serving export
markets can induce firms to make costly investments in technological upgrading that they would not
make in the absence of the export opportunities. Trefler (2007) shows that Canadian manufacturing
firms seeking to exploit opportunities in the U.S. market are disproportionately likely to invest in
advanced manufacturing technologies. Javorcik et al. (2008) show similar results for Mexican firms
preparing to export. Following this recent work, we show that while learning effects seem negligible,
Indian pharmaceutical firm’s investments in physical capital appear to be related to future export plans.
We discuss in the text a number of reasons why these investments are likely to be driven, in part, by
technological upgrading. Evidence suggests that the leading firms within the Indian pharmaceutical
industry are getting ready to export.
Our data is an unbalanced panel of 315 publicly traded Indian drug firms from 1990 to 2005, accounting
for close to 80% of the industry’s output. We capture for these firms, annual financial information on
sales, gross fixed assets, plant and equipment, labor, materials and power and fuel expenses, R & D
expenditure and exports. Our learning effect or the lack of it is arrived in the following econometric
manner. We compute first a Cobb Douglas production function where in any year, a firm’s output (sales)
are a function of its inputs (labor, capital, materials, power and fuel expenses). The residual in this
specification is what economists have conventionally termed as total factor productivity (TFP). An
introduction of the exports variable in this Cobb Douglas equation, gives us the impact on output from
exports. If we can control for other inputs, a positively signed exports variable (we use logs, intensity,
levels and dummy for exporting), should imply the following. Output is increasing in exports and that
happens through a positive effect of exporting on the residual, in this case TFP. The sign of the exporting
variable is not always positive or even significant in our overall regressions but then, in certain
subsections they do reveal a positive impact on output through total factor productivity. These also
happen to be those firms, who are more or less technologically backward in terms of their R & D
capabilities. However, further investigation on investing-exporting linkages unearths evidences of
getting ready to export in the industry i.e. Indian pharmaceutical firms’ current investments indeed are
positively influencing its future decision to enter export markets, this while controlling for year effects
and other firm level factors (like size, technological competence, past productivity, or past export
performance).

H e i n z S c h o o l , 2 n d P a p e r , C a r n e g i e M e l l o n , 2 0 0 8
6 | P a g e
The following sections are organized thus. We discuss the exporting history of the industry following up
with a review of the learning by exporting literature. The set-up used to explore learning by exporting is
then discussed followed by a section on our data and variables. Our first set of mixed findings on
learning effect from exporting are presented next. We then discuss why the traditional approaches in the
learning by exporting literature might not be best suited to understand technological upgradation and
exporting. We then summarize the getting ready to export literature and present our results on the
investing-exporting linkages. We conclude with key findings and implications of the paper. The
appendix contains discussion on industry categories, variable construction, and some additional results.
B. Background on exporting history in Indian pharmaceuticals.
Indian pharmaceutical exports have seen a quantum shift in its character as well as importance in global
trade in the last three decades. A 2003 Business Week articlei pointed out that Indian drug makers could
export drug deflation (cheaper drugs) to the world, the impact being as much as China’s impact on the
electronics industry. In 1980, total exports of drug and pharmaceuticals from India was some $ 87.9 mil,
in 1990 it reached $ 514.6 mil, and in 2000 it stood at $ 1668 mil levels. Analysts predict that
pharmaceutical exports, $ 5.7 billion in 2007, will at an annual average growth of 30% surpass domestic
sales figures by 2008. India now accounts for 8% of global drug product sales in volume terms (ranked
4th) and 1% in value terms (ranked 13th) of global pharmaceutical sales. The past decade also has seen a
shift in the nature of the drug products exported. Starting from mainly being a bulk and active
pharmaceutical ingredients (API) supplier, Indian drug firms have now moved on to becoming a major
player in the world generics and formulations marketii. Further its destinations for exports have widened
globally to more than 200 countries.
Figure 1: Exports breakup in $ mil, Indian Pharma
(Souce: CMIE data from Business Beacon provided by Professor Sudip Chaudhuri, IIM Kolkata, India. Respective year end average exchange rates have
been used from RBI Handbook to convert INR values in USD million. 2005 data comes from data cited by USITC report from World Trade Atlas. 2006 data:
http://www.sunmediaonline.com/indiachroniclejanuary/policyupdate.html. 2007 data:
http://economictimes.indiatimes.com/Pharma_exports_to_surpass_retail_sales/articleshow/2140285.cms)
H e i n z S c h o o l , 2 n d P a p e r , C a r n e g i e M e l l o n , 2 0 0 8
7 | P a g e
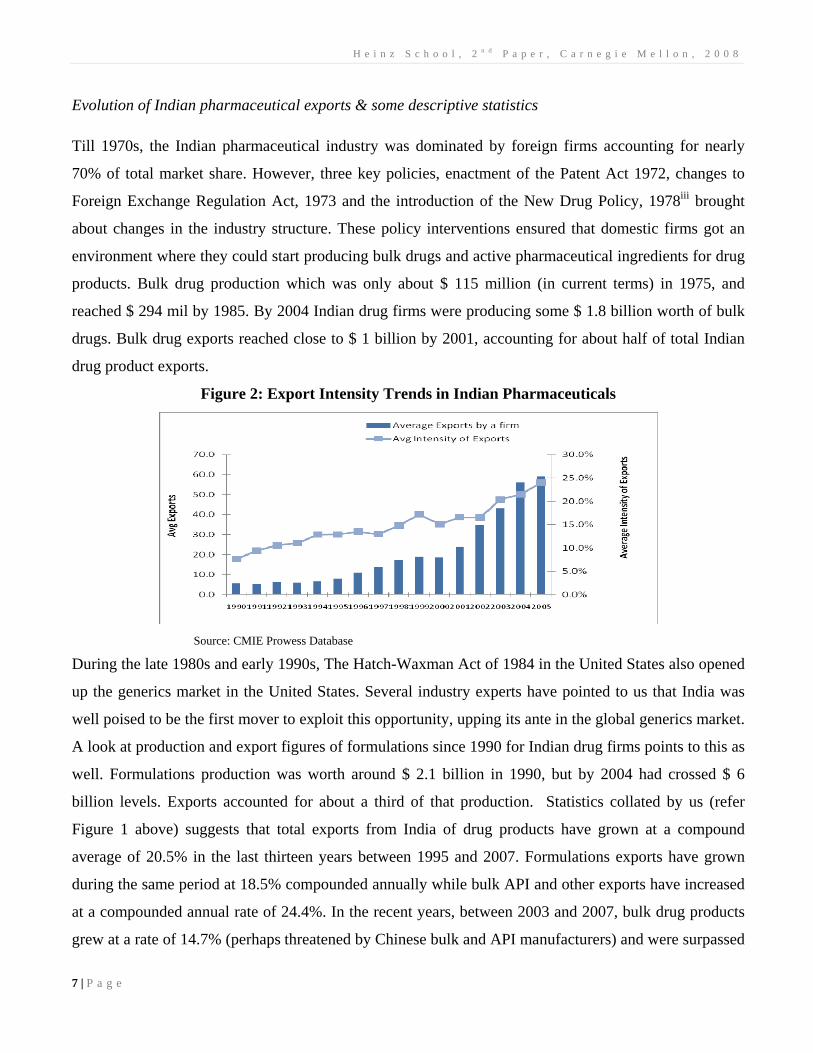
Evolution of Indian pharmaceutical exports & some descriptive statistics
Till 1970s, the Indian pharmaceutical industry was dominated by foreign firms accounting for nearly
70% of total market share. However, three key policies, enactment of the Patent Act 1972, changes to
Foreign Exchange Regulation Act, 1973 and the introduction of the New Drug Policy, 1978iii brought
about changes in the industry structure. These policy interventions ensured that domestic firms got an
environment where they could start producing bulk drugs and active pharmaceutical ingredients for drug
products. Bulk drug production which was only about $ 115 million (in current terms) in 1975, and
reached $ 294 mil by 1985. By 2004 Indian drug firms were producing some $ 1.8 billion worth of bulk
drugs. Bulk drug exports reached close to $ 1 billion by 2001, accounting for about half of total Indian
drug product exports.
Figure 2: Export Intensity Trends in Indian Pharmaceuticals
Source: CMIE Prowess Database
During the late 1980s and early 1990s, The Hatch-Waxman Act of 1984 in the United States also opened
up the generics market in the United States. Several industry experts have pointed to us that India was
well poised to be the first mover to exploit this opportunity, upping its ante in the global generics market.
A look at production and export figures of formulations since 1990 for Indian drug firms points to this as
well. Formulations production was worth around $ 2.1 billion in 1990, but by 2004 had crossed $ 6
billion levels. Exports accounted for about a third of that production. Statistics collated by us (refer
Figure 1 above) suggests that total exports from India of drug products have grown at a compound
average of 20.5% in the last thirteen years between 1995 and 2007. Formulations exports have grown
during the same period at 18.5% compounded annually while bulk API and other exports have increased
at a compounded annual rate of 24.4%. In the recent years, between 2003 and 2007, bulk drug products
grew at a rate of 14.7% (perhaps threatened by Chinese bulk and API manufacturers) and were surpassed
H e i n z S c h o o l , 2 n d P a p e r , C a r n e g i e M e l l o n , 2 0 0 8
8 | P a g e
in growth rates by formulation export growth rates of 16.2%. Intensity of total exports as a percentage of
total industry sales has risen from 8.6% in 1990 to 31.7% in 2005. The average firm was exporting some
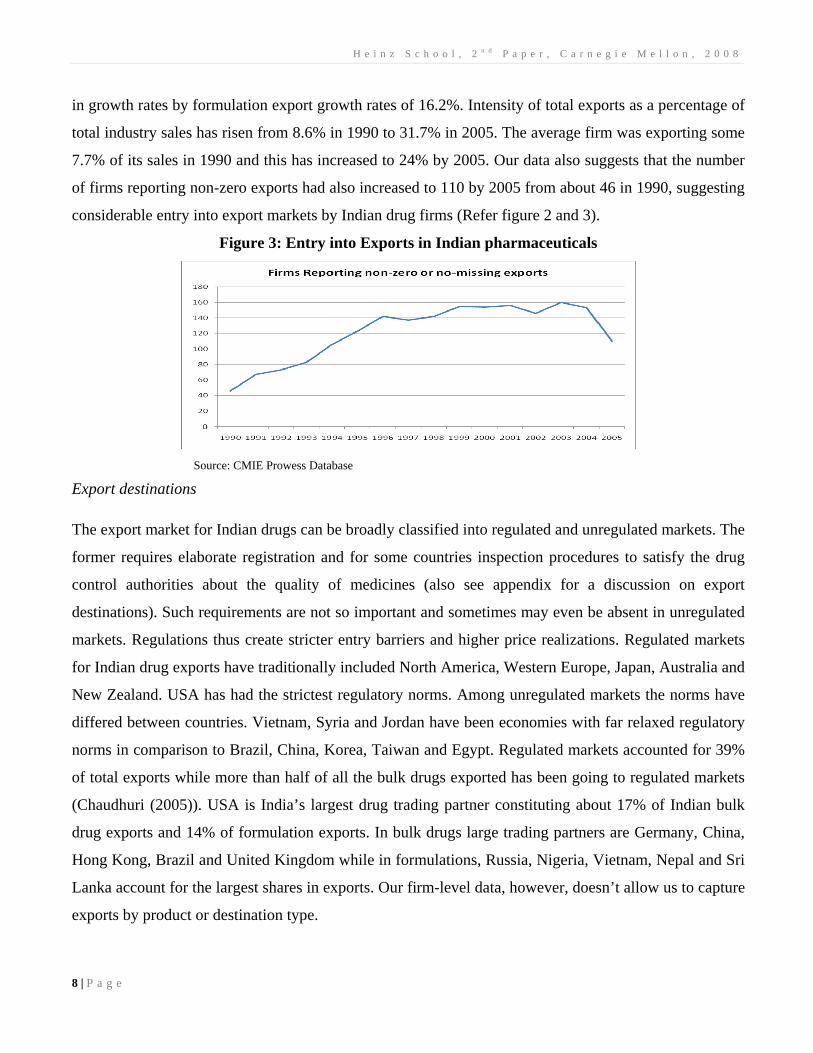
7.7% of its sales in 1990 and this has increased to 24% by 2005. Our data also suggests that the number
of firms reporting non-zero exports had also increased to 110 by 2005 from about 46 in 1990, suggesting
considerable entry into export markets by Indian drug firms (Refer figure 2 and 3).
Figure 3: Entry into Exports in Indian pharmaceuticals
Source: CMIE Prowess Database
Export destinations
The export market for Indian drugs can be broadly classified into regulated and unregulated markets. The
former requires elaborate registration and for some countries inspection procedures to satisfy the drug
control authorities about the quality of medicines (also see appendix for a discussion on export
destinations). Such requirements are not so important and sometimes may even be absent in unregulated
markets. Regulations thus create stricter entry barriers and higher price realizations. Regulated markets
for Indian drug exports have traditionally included North America, Western Europe, Japan, Australia and
New Zealand. USA has had the strictest regulatory norms. Among unregulated markets the norms have
differed between countries. Vietnam, Syria and Jordan have been economies with far relaxed regulatory
norms in comparison to Brazil, China, Korea, Taiwan and Egypt. Regulated markets accounted for 39%
of total exports while more than half of all the bulk drugs exported has been going to regulated markets
(Chaudhuri (2005)). USA is India’s largest drug trading partner constituting about 17% of Indian bulk
drug exports and 14% of formulation exports. In bulk drugs large trading partners are Germany, China,
Hong Kong, Brazil and United Kingdom while in formulations, Russia, Nigeria, Vietnam, Nepal and Sri
Lanka account for the largest shares in exports. Our firm-level data, however, doesn’t allow us to capture
exports by product or destination type.

H e i n z S c h o o l , 2 n d P a p e r , C a r n e g i e M e l l o n , 2 0 0 8
9 | P a g e
MNC firms in India have traditionally never exported with the exception of Aventis which has exported
in excess of 20% of its sales in the last few years or GlaxoSmithKline which has exported only about 3%
of its sales from its Indian unit. The exporters are thus local Indian companies and a large number of
them, especially those exporting to unregulated markets come from the pool of more than 200 small
scale bulk drug exporters. The larger Indian firms are placed both in bulks as well as formulation
exports. The share of the top five in total exports was 48% in 1990, was about 39% in 1995 and 2000
and was marginally higher at 41% in 2005. Aurobindo Pharma, Aventis, Cipla Ltd, Kopran Ltd, Ipca
Labs, Lupin Ltd, Matrix Laboratories, Orchid Chemicals, Ranbaxy Labs, Dr Reddy’s Labs and Sun
Pharmaceuticals have been the firms who have been the largest exporters of both bulk and formulations
products from India. Broadly, firms like Ranbaxy Ltd and Cipla have been exporting branded generics or
formulations in their own brands to unregulated markets and they also own their own marketing assets.
Some others like Aurobindo Pharma, Orchid Pharmaceuticals, and Matrix laboratories have exported
specialized bulk drugs to both regulated and unregulated markets. Only a few firms have moved into
exporting to the US with a broad majority still stuck in exporting to unregulated markets. The benefits of
sticking to unregulated markets are lower entry barriers in terms of requirement for product registrations
or non-inspections. The trade-off is that price realizations are low. This is not the case with regulated
markets like the US, where, while entry barriers are high, price realizations are high too. The broad
basket of firm strategies as discussed above encouraged us to classify firms into within industry
categories. We explore for learning effects within these sub-categories.
The United States Market & Entry Barriers
The United States has historically been India’s largest trading partner in pharmaceuticals exports.
Formulation marketing in the US requires Indian firms to file an Abbreviated New Drug Application
(ANDA)iv with the Food and Drug Administration (FDA) in the US. This also includes information on
the supplier of bulk drugs used to make the end product. The requirement to file an ANDA started in the
United States after the Hatch-Waxman Act of 1984. This act was implemented to spur the generic
markets with regulated proceedings on the safety and efficacy of generic drugs. If one looks at ANDA
counts or ANDA concentration counts (a single ANDA can be filed in more than one concentration) that
generic Indian firms have been required to file for a drug product to enter US generics market one can
observe a steep rise. The maximum number of ANDAs filed by an Indian drug firm has increased to 22

H e i n z S c h o o l , 2 n d P a p e r , C a r n e g i e M e l l o n , 2 0 0 8
10 | P a g e
in 2008 from none in 1996. If one considers industry totals, ANDA counts in 2008 were 205 in
comparison to only 32 filed by the industry in 1990 (Refer Figure 4 below).
Figure 4: ANDA Counts at FDA by Indian Drug firms
Bulk drug exports to the US on the other hand requires filing of a Drug Master File with detailed
information to the Food and Drug Administration (FDA) about kind of equipment, location of the plant,
description of production facility, process chemistry, raw materials specification, stability and impurity
data and so on. Anecdotal evidence suggests that the cost for filing a DMF could be in the range of
$200,000 depending on the extent of information required and provided but despite that DMF filings are
also on the rise for the industry. This also points that Indian pharmaceutical firms are increasingly
becoming aggressive in terms of its entry strategies overseas. In our data on ANDA applications, we
found that there 8 such Indian drug firms, the most technologically progressive firms in the industry,
who are known to have a focus on US markets. They are the ones who have gone through the entire
experience curvev to handle the entry barriers in the US markets. Also, we observe firm strategies to
enter US markets in various combinations. There are few firms who have both DMFs and ANDAs in
their own names. A few others have DMFs but not ANDAs, these firms are tied up with marketing
partners who have ANDAs in their names (Cipla Ltd ANDA filed by US marketing partner, and JB
Chemicals has a joint venture in US). Finally there are bulk suppliers or contract manufacturers who
only have DMFs in their names.
Firm strategies in the US markets could also be classified in terms of generic products exported. Quite a
few in the industry like Lupin Ltd in anti-Tuberculosis drugs, Shasun Drugs in ibuprofen exports, USV
Ltd for metmorfin, Sri Krishna Drugs Ltd for acetaminophen, Calyx Ltd for pyrazinamide and Divis
Labs for naproxen have adopted what the industry analysts call a commodity generic exports strategy.

H e i n z S c h o o l , 2 n d P a p e r , C a r n e g i e M e l l o n , 2 0 0 8
11 | P a g e
The other category would be of exports in value-added generics to the US markets. Various strategies to
enter the value-added generics segment would include non-infringing processes (as Matrix Laboratories
did for citalopram) that allow firms to use novel non-patent infringing processes for the manufacture of
generic drugs, novel drug delivery systems (Ranbaxy Ltd. developed a once-a-day version to administer
ciprofloxacin instead of the prevalent twice-a-day one), and successful Para IV ANDA application and
180-day exclusivity. 180-day exclusivity is infact a lucrative but difficult to surmount option ever since
Figure 5: Increasing International Alliances of Indian pharmaceuticals
Source: Newspaper & analyst reports, incomplete list, MERIT – CATI data provided by Geert Duysters; Also, this is
an incomplete list with 1990 numbers including ones prior to it and in 1990.
the Hatch-Waxman Act, from when generics producers have been encouraged to introduce drugs that
compete with patented products even before those patents expire. Any generic producer that can
demonstrate its competing product does not infringe on the patent earns a brief period (180 days) during
which it can exclusively market its rival product without any legal competition. During this period, the
generics producer becomes the monopoly producer of a product that is certified as biologically
equivalent to a patented product. The producer can charge a premium price during this interval. After
the 180-day exclusivity period expires, any generics producer is allowed to offer a competing product
based on the pioneers’ methods or compounds. Ranbaxy received one of these 180-day exclusivity
periods for ibuprofen and Dr Reddy’s Ltd for fluoxetime after challenging Eli Lilly’s blockbuster
Prozac. There are some other strategies emerging as well. Firms like Morepen Labs have opted to play it
safer by establishing ties with a successful para IV ANDA filer, Geneva the generics arm of Novartis Ltd.
Couple of them have opted to act aggressive, directly challenging a patented drug as Ranbaxy did for
cefuroxime axetil with a crystalline version of the salt contending GSK’s amorphous version. It must be
mentioned here that the high risk high returns US markets are being complemented by Indian firms with

H e i n z S c h o o l , 2 n d P a p e r , C a r n e g i e M e l l o n , 2 0 0 8
12 | P a g e
entry into other markets as well. One can note (refer Figure 5 above) Indian drug firms adopting various
FDI instruments apart from pure exporting activity to enter other advanced markets.
C. Literature on the exporting-productivity relationship
As cited in the introduction, the literature on exporting and productivity has found mixed evidences on
the key question bothering researchers in this area. Do firms acquire better technology through exporting
activity? In the literature, this question is usually recast: after a transition to exporting, does measured
TFP grow more quickly in a manner that can be reasonably attributed to a “learning by exporting”
effect? There could be two broad effects one of which might dominate as one tries to answer that
question. The first is the market selection hypothesis, which argues that firms self select into export
markets. The reason for this is that there exists an additional cost of selling goods in foreign countries,
which might include transportation costs, distribution or marketing costs, costs involved in overcoming
country specific non-tariff barriers as mentioned above, costs for recruiting personnel with skill to
manage foreign networks, or even production costs in modifying current domestic products for foreign
consumption. These costs are a source of entry barriers that less successful firms cannot overcome.
Furthermore, the behavior of firms might be anticipatory i.e. they desiring to export tomorrow want to
improve performance today to be competitive on the foreign market in the future. Cross-section
differences between exporters and non-exporters, therefore, may in part be explained by differences ipso
facto between firms: The more productive firms become exporters. The second dominating hypothesis is
the learning effect hypothesis, which argues that a presence in export markets helps in enhancing
productivity in firms. This is not unreal too, knowledge flows from international buyers and competitors
can always aid in improving post-entry performance of export starters. Furthermore, firms participating
in international markets are exposed to more intense competition and must improve faster than firms
who sell their products domestically only. Finally, it is always possible that exporting generates
knowledge spillovers, which other domestic firms could gain from raising the productivity of the
industry as a whole. Exporting thus could have a learning effect making firms more productive.
Earliest works in the area, spearheaded by Bernard and Jensen (1995) looked at the linkages between
exports and productivity in US manufacturing and documented some interesting observations. First, they
observe, that while exports made up a small fraction of total US manufacturing output, exporting plants
had a disproportionate share in total employment and output. While they do report that good plants are
exporters, they are cautious in interpreting if on an average ‘today’s exporters will become tomorrow’s

H e i n z S c h o o l , 2 n d P a p e r , C a r n e g i e M e l l o n , 2 0 0 8
13 | P a g e
success stories’, this due to the self-selection of good plants becoming tomorrow’s exporters being a
more plausible reality. In another seminal paper in the area (Clerides, Lach, and Tybout 1998), the
authors point out that in a dataset of Colombian and Moroccan plants, the causal hypothesis that
exporting leads to firm efficiencies is not econometrically validated. Current literature at large too has
observedvi, no learning effect from exporting for firms (Clerides, Lach, and Tybout 1998, Bernard and
Jensen 1999, Bernard and Wagner 1997, Delgado, Farinas and Ruano 2002, Bernard and Jensen 2004,
Trefler 2007) There are however some studies who provide evidences to the contrary i.e. there is indeed
a positive effect on productivity from exporting (Aw, Chung, and Roberts (2000), Baldwin and Gu
(2003), Van Biesebroeck (2004), Lileeva (2004), Hallward-Driemeier, Iarossi, and Sokoloff (2005),
Fernandes and Isgut (2006), Park, Yang, Shi, and Jiang (2006), Aw, Roberts, and Winston (2007) and
De Loecker (forthcoming)).
Given that the verdict is still not out on the exporting-productivity relationship, it might be worthwhile to
outline the empirical strategy for researchers in econometrically understanding the exports-productivity
relation. The most favored approach has obviously taken to observing a firm or plant performance
measure, like unit costs, labor productivity or total factor productivity and establishes its relationship
with exports, lagged or contemporaneous. Controls used are for unobserved effects, for example for firm
managerial competence taken care of with fixed effects, time dummies (to control for year to year
macroeconomic changes like exchange rate shifts) and for firm size, past productivity. This paper adopts
the total factor productivity (TFP) approach. To keep matters simple, we use a Cobb Douglas
specification to compute total factor productivity, where sales of a firm i in time t is the output measure
which is a function of some input measures, labor, capital, materials and fuel. We introduce the export
variable directly into our TFP regressions. The argument for this is as follows: First, the traditional
approach of computing estimated TFP (residuals from the first stage Cobb Douglas specifications) and
regressing them on measured export variable might lead us to potential problems in error structure.
Second, a direct one stage regression could be used such that the sign on the coefficient on the exports
variable could be interpreted as follows: sales or the output measure could be increasing or decreasing in
exports, controlling for all the other input variables. This impact of exports on output could only happen
if TFP is increasing or decreasing in exports, depending on the sign of the coefficient. A positive sign
thus on the RHS, on the export variable would mean observing a performance enhancing or a learning
effect controlling for other inputs following literature. Absence of it, or a –ve sign (we occasionally use –
ve for negative and +ve for positive all along in the paper) would imply non-observance of a learning

H e i n z S c h o o l , 2 n d P a p e r , C a r n e g i e M e l l o n , 2 0 0 8
14 | P a g e
effect as a section of the literature finds. We discuss more details of our model specification in the
following section.
One key problem of this literature has been identifying if better firms self-selected into export markets or
exports enhanced productivity, in a nutshell as outlined above identifying the direction of causality. It
would be more than helpful, if one could find an instrument, for example a policy instrument that
stimulated exports but to the extent rationalisable, not productivity. One could then say, that we have
identified a policy (plant specific tariffs for example) which enhanced exports (and not productivity) and
check if that resulted in enhanced productivity. This is however easier said than done in real life,
literature much like us has struggled in identifying that policy instrument. We did try our best to identify
a policy instrumentvii. Not finding one, we instead do the following. We investigate if within sub-
samples of the industry, we could identify any substantial learning effects. Thus we check if learning
effects can be observed in the following categories of firms Principal exporters, Major exporters, FDA
firms, Modern Firms, Bulk exporters, Generic firms and firms based on whether they were domestically
or foreign owned (See appendix for approaches to firm categorisation) in Indian pharmaceuticals.
In Indian pharmaceuticals, it might further be important to understand what might be the mechanisms of
learning, whether firms learn by exporting certain particular portfolio of drug products and not others,
and whether exporting to regulated markets yields more learning effects than exporting to regulated
markets. Another interesting issue worth investigating could be to check if other forms of international
presence, like FDI instruments such as joint ventures, wholly owned subsidiaries, or overseas
acquisitions has led to an increase in firm productivity, or is it that we observe self selection in these
modes of international strategic presence as well! Unfortunately, our data limits us in investigating
product wise, destination wise, or firm international strategy wise, learning or selection effects. We
instead report our findings on learning from exporting and proceed to see if as Trefler (2008) & Javorcik
(2008) has argued, firm exporting decision in future is based on contemporaneous investments in Indian
pharmaceuticals. More details on our strategy to investigate investing and the decision to exports, in
short getting ready to exporting effects in Indian pharmaceuticals are outlined in Section H.

H e i n z S c h o o l , 2 n d P a p e r , C a r n e g i e M e l l o n , 2 0 0 8
15 | P a g e
D. Set-Up & Empirical Strategy
The Production Function
Our model specification for investigating learning by exporting follows the literature closely. First, we
outline a production function of the Cobb Douglas form like below:
titi utititititi eFMKALY ,,,,,,,
+Ω= κδβα (1)
where the subscripts i, t denotes various input and output measures for the firm i in year t. Y the output
measure is normally observed through sales, revenues or value-added. L denotes labor in the firm, K is
capital stock, M materials, F energy and fuel expenses with ti ,Ω referring to the productivity shock
known to the firm but unobserved to the econometrician and tiu , an i.i.d. error referring to all other
disturbances and shocks affecting output that are unknown to the firm when making input decisions.
Taken in logs, equation (1) can be simplified as follows:
tititititititi uFMKLAY ,,,,,,, lnlnlnlnlnln +Ω+++++= κδβα (2)
Total factor productivity (TFP), could then be computed by estimating the coefficients κδβα ,,, and the
intercept term. The residual gives the value of ln TFPs or:
titititititi FMKLYTFP ,
^
,
^
,
^
,
^
,, lnlnlnlnlnln κδβα −−−−= (3)
There is obviously some level of endogeneity in this specification (Marschack and Andrews 1944), firms
based on some sort of optimizing behavior choose inputs in such a manner unknown to the
econometrician. A more productive firm could thus absorb more inputs and this could make the OLS
estimates of equation (2) above inconsistent and biased, because productivity of the firm could both be
contemporaneously and serially correlated with the inputs. Contemporaneous correlation will occur for
example, if a firm hires more workers based on its current productivity in anticipation of future
profitability while serial correlation between productivity and hiring decisions like above could upward
bias the estimate in a single-input setting, the direction of bias not being obvious in a multi-input setting
as ours. To address simultaneity as highlighted above, we estimate equation (2) adopting the Levinsohn-
Petrin approach of production function estimation following literature. This was done apart from simple
pooled OLS with time dummies, with and without fixed effects, and with first differences.

H e i n z S c h o o l , 2 n d P a p e r , C a r n e g i e M e l l o n , 2 0 0 8
16 | P a g e
Identification by introducing the export variable
Our key identification comes from the introduction of the exports variable in the production function in
equation (2). The export variable was introduced in four variations, log of exports, intensity of exports as
a percent of sales, a dummy for the exporting decision which takes the value of 1 if our data on exports
showed a non-zero and a non-missing value and also level of exports. It must be mentioned here that this
meant that equation (2) would have an additional term, either as an input just like labor or capital, in this
case exports (which reduces to the variation log of exports in the final estimation), or the term would be
an exponentiated form of the export variable (for intensity of exports, dummy for exporters, level of
exports), as in Ze where Z stands for either the intensity, dummy or level of exports in the firm i at time t
and this enters the production function in (2) multiplicatively. All the variables, input, output as well as
exports are deflated using literature specified deflators as used previously in the Indian context. The
estimation approaches for all the export introduced regressions are similar to the basic TFP regressions.
The results for the contemporaneous case are similar if we instrument with lagged exports both for the 1st
and 2nd lag of the export variable, use revenues as another output measure, or use R & D expenditure
stocks as an additional input in the production function.
Searching for learning from exports
As outlined above, our basic identification comes from introducing exports into the production function
and estimation of the coefficients on the export variable. If we look at the variation of the export
variable, viz. log of exports, equation (2) would in effect look like this:
titi utitititititi eFMKLExportsAY ,,*)(** ,,,,,,
+Ω= κδβαρ (4)
One just needs to take logs of the above equation and carry out an estimation of the coefficient on
exports, ρ . If the variation of the export variable used in our analysis is intensity of exports, dummy for
exporters, or level of exports, then denoting either of them as z, Ze enters equation (2) multiplicatively:
tititi utitititi
Zti eFMKLeAY ,,, *)(** ,,,,
)(,
+Ω= κδβαρ (5)
where tiZ , in equation (5) is the relevant exports variable (intensity, dummy or level) and ρ is the
coefficient on either of them. The key contribution of this analysis comes from whether we can identify
learning effects from exports. The sign of the coefficient on the export variable ρ helps us in identifying

H e i n z S c h o o l , 2 n d P a p e r , C a r n e g i e M e l l o n , 2 0 0 8
17 | P a g e
that irrespective of the nature of the export variable used (levels, logs, intensity or dummy). The
explanation would be as follows. Controlling for other inputs into the production function, a +vely
signed export variable would mean that revenues (or sales) our dependent variable, is increasing in
exports. That is only possible, if exports positively impact the residual, in this case, TFP, this in turn
showing up in increasing sales or revenues. Based on their product mix and export destinations different
categories of firms as discussed in Section B might have differential learning and even no observed
learning effects Bearing this in mind, we subdivide our sample of Indian pharmaceutical firms into
various sub-samples and search for learning evidences (See appendix for within industry firm category
classification). The empirical strategy used to identify sub-category level learning effects was as follows.
We used the group dummy and interacted that with our export variable (and all its variations). Our
regressions included the interaction term, the group dummy, and the export variable, and we report
learning effect if the linear combination of the point estimates on the export variable and the interaction
term was positive besides reporting their significance. Details are outlined in the section with results on
learning effects.
E. Data and Variables
Firm Data
Our primary source for firm data was the Prowess database from the Center for Monitoring of Indian
Economy, this database providing us a ready-made industry classification of firms. The Prowess
database is similar to Compustat database for U.S. companies providing information that incorporated
companies are required to disclose in their annual reports. Our study is conducted on a panel of 315
publicly listed Indian drugs and pharmaceutical firms (National Industrial Classification 2423) from
1990 to 2005. For these firms, the dataset provides us annual firm financial data from 1990 to 2005. The
key firm variables used were sales (deflated and its logs used as Y), exports (deflated and otherwise),
raw material expenses (deflated and its logs used as M), power and fuel expenses (deflated and its logs
used as F), salaries and wages and gross fixed assets (deflated and its logs used as capital stocks, K). We
additionally extracted data on plant and equipment expenses of firms and R & D expenditure, whose use
we outline in the section on getting ready to exports.
Exports, Capital Stocks and Labor
Some words are in order especially for the exports, capital stocks, and labor data used. The CMIE data
dictionary, defines the export variable as ‘total revenue earned from goods and services inclusive of

H e i n z S c h o o l , 2 n d P a p e r , C a r n e g i e M e l l o n , 2 0 0 8
18 | P a g e
income earned in foreign currency by way of interest, dividend, or consultancy fees.’ The value is on
FOB basis and deemed export sales are also included in the data. For capital stocks, our ideal bet would
have been to follow standard best practice as here in the US, using a firm’s yearly series on new plant
and equipment investment, applying suitable depreciation rates and create stocks with a perpetual
inventory method. Unfortunately, Indian accounting standards don’t require a compulsory reporting of
new plant and equipment. Given that, we used gross fixed assets (refer appendix on capital stock
creation), deflated with the wholesale price index, as our measure of capital stocks as reported by firm
annual reports and furnished by the Prowess dataset. Admittedly, this will have limitations, given the
firm to firm accounting tricks and depreciation rates used; nonetheless for reasons mentioned in the
appendix this looks like the best measure for capital stocks. Finally, publicly traded Indian firms are not
required to report the number of employees on their annual reports. The Prowess database thus reveals
that firm reporting of yearly count of employees is inconsistent. The standard approach as used for
Indian data was thus adopted. Following previous literature on Indian manufacturing (Basant and Fikkert
1996, Kathuria 2000, and Unel 2003), we use the wage bill, salaries and wages reported by firms
annually, together with industry numbers to create a proxy for labor. We first computed ‘man days
worked’ for a firm in a year as follows: Man-days worked = (Salaries and wages for a firm-year
observation)/(Average Wage Rate). Average wage rate was obtained by dividing total emoluments of the
pharmaceutical industry to its employees by the industry’s total yearly man day employees as given in
the Annual Survey of Industries data in India. Industry codes for pharmaceuticals posed some issues
given that the National Industrial Classification (NIC) in India had undergone a change in 1997-1998.
Following previous literature on Indian manufacturing (Basant and Fikkert 1996, Hasan Mitra and
Ramaswamy 2007), we used the code 304 for drugs and pharmaceuticals till ASI 1997-1998 as per the
NIC 87 3 digit level. For ASI data from 1998-1999 till 2004-2005, the 4 digit industry code 2423 was
used to extract total emoluments and yearly man day employees data for Indian drugs and
pharmaceuticals firms.
Deflator data
All variables used in our analysis (except those used to create a proxy for labor) were deflated. A variety
of deflators have been used in the Indian context, in our case, we use the whole sale price index (WPI)
from the RBI Statistical Handbook (base year = 1993-94). Sales and material expenses were deflated
using the WPI for all commodities. It is conceivable, that given that an overall WPI exists, there should
be the existence of a price deflator for capital goods that should have been used on gross fixed assets for

H e i n z S c h o o l , 2 n d P a p e r , C a r n e g i e M e l l o n , 2 0 0 8
19 | P a g e
our capital stock calculations. Our search for a capital goods price deflator however yielded
unsatisfactory results and we decided to proceed with the WPI for all commodities for deflating gross
fixed assets to create our capital stocks. We don’t here discount the fact that especially in the recent
years, WPI in India might not track trends in capital good prices all that closely, but given that we are
using time dummies and fixed effects in our regressions, this should not significantly alter our results.
WPI for fuel and power was used to deflate power and fuel expenses.
Table 2 on Descriptive Statistics of Key Variables
Variable Obs Mean Std. Dev. Min Max
log of sales 2798 -1.75243 2.001509 -9.77509 3.236235
log of labor 2765 4.103458 1.990653 -1.88585 8.857314 log of capital stocks 2843 -2.29846 1.582982 -9.21034 2.10563
log of material expenses 2673 -2.63658 1.931647 -9.83788 2.064384 log of fuel expenses 2552 -5.49542 1.905799 -10.232 -1.18332
Exports Variable
Deflated export levels 5120 0.087019 0.49943 0 15.34257
log of exports 1953 -3.46057 2.259972 -9.83789 2.730631 Intensity of Exports 2798 0.156734 0.236887 0 3 Dummy for exporter 5120 0.381445 0.485789 0 1
Industry sub-sample data
We outline above our search for learning not only at the overall industrial level in Indian
pharmaceuticals but also in industry subsections. The data used for identifying sub-samples within the
industry comes from a range of sources. We use Drug Master Files (DMF) filings available on the FDA
website to identify bulk makers (refer appendix for more details on firm categories). FDA also provides
us kindly with data on manufacturing facilities that have been granted a FDA certification in India
between 1995 and 2005. Finally, Orange Book in FDA website tracks Abbreviated New Drug
Applications, for generic products, we do a search by firm name and extract that data for our analysis.
Data for identifying modern firms comes from scanning of websites by firms, website of the Department
of Science and Technology, India and popular press searches and data provided to us by Professor Geert
Duysters at UNU-MERIT from the MERIT-CATI database.

H e i n z S c h o o l , 2 n d P a p e r , C a r n e g i e M e l l o n , 2 0 0 8
20 | P a g e
F. Findings on Learning Effect
In this section, we discuss the coefficients from basic TFP regressions moving on to discuss our results
from our primary identification by introducing the exports variable in the TFP regressions. We wrap up
with our search for learning effects, the productivity-exports findings for industry sub-samples.
Basic TFP results
Table 3: Basic TFP Coefficients
Pooled OLS First Differences Fixed effects Lev-Pet
Labor 0.354 0.193 0.278 0.362
(20.98)** (8.44)** (12.61)** (12.99)**
Capital 0.035 0.051 0.026 0.403
(2.04)* (1.70) (1.32) (5.85)**
Materials 0.542 0.451 0.528 --
(49.27)** (34.53)** (43.56)** --
Fuel 0.052 0.138 0.106 --
(3.31)** (6.95)** (5.69)** -- Observations 2396 1953 2396 2396
Number of firms 302 279 302 320 R-Squared 0.93 0.60 0.77 --
Dependent Variable: log of sales. Value of z stats in parenthesis except t-stats for Fixed effects. * Significant at 5% level; ** significant at 1% level. Lev-pet Wald test of constant returns to scale: Chi2 = 16.12 (p = 0.0001)
The table above reports the point estimates from the basic TFP regressions. All regressions include time
dummies and results are for pooled OLS with and without fixed effects, first differences and Lev-Pet. At
first glance, the elasticity of sales with respect to labor is highest with the Lev-Pet approach where
materials is used an instrument to control for productivity shocks. It is significant all through, and the
labor elasticity varies between 19% to 40%, higher than 6-10% levels reported from previous studies on
overall Indian manufacturing (Unel 2003, Topalova 2004) but lower still from levels in OECD
economies (Bernard and Jones 1996). The coefficient on capital stocks, are very low, between 2% to 5%
though its performance improves in the Lev-Pet approach. Materials have close to 50% elasticity while
for fuels this varies between 5 %-14%. Materials, fuel and labor show some level of significance. The
industry seems closer to constant returns to scale though this is not observed in Lev-Pet. The coefficients
are roughly the same if one introduces R & D in the regressions as another input or one uses revenues as
the output measure. At an overall level, TFP computed from the residuals in equation (3) in Section D is
reported in the appendix for all estimation approaches.

H e i n z S c h o o l , 2 n d P a p e r , C a r n e g i e M e l l o n , 2 0 0 8
21 | P a g e
Results on learning effect from introducing the export variable
As Table 4 indicates, we introduce exports in four variations in our TFP regressions for the overall
industry. We report here the results from pooled OLS with fixed effects and from the Lev-Pet approach.
When exports enter as levels, the impact of exports on productivity, controlling for other inputs, and thus
on sales is close to 0. This is negative if we use the variable intensity of exports as % of sales though one
should be cautious while introducing this variable because sales would then appear on both sides of our
estimating equation skewing the intuition behind the findings. The dummy for exporter variable appears
more realistic, it taking a value of 1 if a firm-year observation shows the firm’s export market presence.
This throws up a positive effect of exporting on productivity with the Lev-Pet approach though the point
estimates are small and insignificant, but with fixed effects, sales and productivity seem to be decreasing
in exports. With log of exports, a positive effect is observed but the sizes of the point estimate are close
to 0 while being significant. Point estimates for the other inputs into the production function follow the
broad trend as outlined in the basic TFP regressions. The results don’t change if we use revenues as an
output measure. They follow the broad trend of small size or –vely signed point estimates on the export
variable, if we instrument for exports (given the self selection problem) with 1st and 2nd lags of exports.
A word of caution is however in order here while arriving at an immediate conclusion. We must
acknowledge that there might be differential learning by firms based on the type of products that they
export (bulks/API/formulations) or the destination to where they export. Further, our basic motivation
was to investigate the link between exporting and technological upgradation, and we argue in section G
that learning by exporting might not capture all sources of enhancement of technical efficiency for a
firm from its presence in export markets. Finally, our data doesn’t permit us to capture break up of firm
exports either in terms of product or destination and this could be clouding our findings.
Searching for Learning in Industry Sub-Samples
Having failed in identifying performance enhancement from exports at the broad industrial level, we try
to do the next best thing given our data limitations in capturing exports by product or destination type.
We explore for within-industry effects of learning from exports by industry subcategories namely, in
firms that we categorized as Principal exporters, Major exporters, firms with FDA approval of
manufacturing facility, Modern Firms, Original Bulk exporters, Generic firms and firms based on
whether they were domestically or foreign owned. A short discussion is in order to discuss our estimation
approach as we search for learning within the industry.

H e i n z S c h o o l , 2 n d P a p e r , C a r n e g i e M e l l o n , 2 0 0 8
22 | P a g e
Table 4: Searching for Learning at the Overall Industry level
FIXED
EFFECTS Lev-Pet
FIXED
EFFECTS Lev-Pet
FIXED
EFFECTS Lev-Pet
FIXED
EFFECTS Lev-Pet
Log of labor: L
0.271 0.364 0.278 0.348 0.28 0.361 0.292 0.384
(12.19)** (16.77)** (12.58)** (15.92)** (12.64)** (18.62)** (13.64)** (19.59)**
Exports
0.001 0.001
(2.52)* (1.52)
Intensity of Exports
-0.003 -0.178
(0.01) (2.40)*
Dummy
for exporters
-0.024 0.037
(0.91) (1.00)
Log of exports
0.062 0.046
(10.06)** (4.15)**
K
0.021 0.385 0.026 0.427 0.026 0.398 -0.022 0.33
(1.04) (5.41)** (1.32) (5.97)** (1.29) (6.35)** (1.23) (3.37)*
M
0.528 0.528 0.53 0.583
(43.55)** (43.52)** (43.26)** (38.79)**
F
0.108 0.106 0.106 -0.017
(5.82)** (5.69)* (5.69)** (0.98)
Observations 2396 2396 2396 2396 2396 2396 1781 1781
Number of firms 302 320 302 320 302 320 249 320
R-squared 0.77 -- 0.77 -- 0.77 -- 0.84 --
Dependent variable log of sales, results don’t change when we use revenues, time dummies included. Absolute value of z statistics in
parentheses for Lev-Pet and t-stats for fixed effects;* Significant at 5%; ** significant at 1%. Results go through similarly in terms of
sign on export variable on pooled OLS and first differences. Wald test of constant returns to scale in Lev-Pet yields a p value less than
0.01 in all cases.

H e i n z S c h o o l , 2 n d P a p e r , C a r n e g i e M e l l o n , 2 0 0 8
23 | P a g e
Our identification for learning effect comes from introducing the exports variable in the basic production
function. When it enters the production function just like other inputs in (4) the expression takes the
form:
titi utitititititi eFMKLExportsAY ,,*)(** ,,,,,,
+Ω= κδβαρ
A +vely signed ρ from the above specification with some level of significance will be the first evidence
of a learning effect from exporting as discussed in Section D. We find that at the broad industry level we
don’t see much learning effect due to either a –vely signed ρ or its insignificantly small size despite it
being +ve. It is however possible that learning is observed within industry, in select sub-samples of the
industry and for that we introduce group dummies to identify various categories of firms as discussed in
section C. The GroupDummy (for example the bulk exporter dummy) could then be interacted with the
exports variable as above to check if learning effects are observed. If exports enter the production
function multiplicatively like any other input (log of exports being our variable of interest), with the
interaction term the specification would be:
....)log(***)log(*loglog ,'
,, ++++= tititi ExportsGroupDummyGroupDummyExportsAY ααρ (i)
where the ‘…’ section in (i) above, includes the log of the other input variables, L, K, M and F and the
error terms as in equation (2). Partial effects of exports in an industry sub-sample are then)(log
))(log(
,
,
ti
ti
ExportsY
∂
∂ ,
a linear combination of the point estimates ρ and 'α from (i) above.
When the export variable of interest enters the production function multiplicatively, but in an
exponentiated form like in (5):
tititi utitititi
Zti eFMKLeAY ,,, *)(** ,,,,
)(,
+Ω= κδβαρ
the expanded equivalent of (i) above to identify learning comes from the following specification:
....)(***)(*loglog ',, ++++= ZGroupDummyGroupDummyZAY titi ααρ (ii)
where tiZ , is the concerned exports variable (in our case is intensity of exports, dummy for exporters, and
export level). The partial effects of exports (or Z more generally) from (ii) would be)(
))(log(
,
,
ti
ti
ZY
∂
∂ , again a
linear combination of the point estimates ρ and 'α from (ii) above. We report below the sign of these

H e i n z S c h o o l , 2 n d P a p e r , C a r n e g i e M e l l o n , 2 0 0 8
24 | P a g e
partial effects for all our export variables, when we include time dummies and conduct a pooled OLS,
with and without fixed effects, and also adopt the Levinsohn-Petrin approach for the production function
estimation. The point estimates outside the braces are the linear combinations, the numbers within (.) are
the z-stats for the pooled OLS and Lev-Pet regressions and t-stats for the fixed effects regressions. The
numbers within the curly braces {.} indicates the p-value if we test the null that interaction term
)(* ZGroupDummy is 0.
Table 5 on point estimates of the partial effects in the next page reveal that the size of the point
estimates, indicating the impact of exports on productivity might be throwing up a +ve sign in some sub-
categories, but then the sizes are small and then again based on the type of export variable used or the
estimation approach adopted, they are not consistently signed. In a nutshell not much productivity
enhancement from exports is observed as any broad trend from the within-industry search for learning
among firm categories. If at all, there is some trend, it is the fringe firms (dummy for bulk exporters) in
the industry, those who could be called as the technologically backward ones (having started off
originally as downstream bulk producers), who yield a consistently +vely signed partial effect of exports
on productivity. Another category that comes close to convincingly showing some learning effects are
the Principal exporters, those exported greater than 40% of their sales any year between 1990 and 2005.
This is puzzling, especially if one expects, the industry to have shifted gears in the last decade with
stronger appropriability coming into place. Firms which are technologically progressive, the modern or
the FDA tagged firms, could be hypothesized to be the ones who would show up productivity
enhancements from exports. This however is not the case, one way to rationalize might be as follows.
Maybe, the set-up of learning by exporting doesn’t capture the entire gamut of experiences that enhances
a firm’s technical efficiency. We argue that could be a strong possibility. The learning by exporting
literature has tended to view productivity improvements from exporting as something that comes “for
free”. Yet, recent work suggests that much of the upgrading occurs before, not after exports commence.
In addition, much of the technological upgrading is embodied in new capital equipment, worker training,
and quality certifications, all of which require real outlays on the part of the firm. Furthermore, once
firms enter the export market, they are often constrained in terms of their ability to appropriate the gains
from their technological upgrading. Facing fierce competition from existing incumbents and from other
foreign entrants, exporters must often accept lower profit margins on export sales than on sales in their
domestic market. All of this can lead to very modest measured increases in TFP after the inception of

H e i n z S c h o o l , 2 n d P a p e r , C a r n e g i e M e l l o n , 2 0 0 8
25 | P a g e
exports. While all of this is true, the very prospect of serving export markets can induce firms to make
costly investments in technological upgrading that they would not make in the absence of the export
opportunities. We are not convinced thus that lack of learning invalidates our basic premise, that firms
get technically more efficient with entry into export markets. It might not show up in TFP improvements,
but there might be a link between ex-ante investments and the decision to export. The motivation for this
track of investigation, the empirical strategy, and the results on this are presented next in the paper.
Table 5: Partial effects of Exports Variable
(Note: The point estimates outside the braces are the linear combinations, the numbers within (.) are the z-stats for the pooled OLS and Lev-Pet
regressions and t-stats for the fixed effects regressions. The numbers within the curly braces {.} indicates the p-value if we test the null that
interaction term )(* ZGroupDummy is 0. )

H e i n z S c h o o l , 2 n d P a p e r , C a r n e g i e M e l l o n , 2 0 0 8
26 | P a g e
G. An introspection on learning by exporting
Our findings in the preceding section indicate that there are no substantial productivity enhancements or
learning effects observed in the Indian pharmaceutical industry. Infact, we are presented with a challenge
to explain learning in bulk exporters, firms who appear to be technologically non-progressive in the
industry. We believe that this is not unexpected given the methodological and data constraints. Let us
take these one by one. First, it has been well established that in the absence of detailed firm (or plant)-
product-price level data, conventional methods like learning by exporting cannot capture the full benefits
from exporting. A simple exposition as laid out in the diagram below could explain why.
Let us suppose that the firm faces a downward sloping domestic demand curve and a flat foreign demand
curve (with no global market power). Let us also assume that in this static setting, the firm is ex-ante
only present in domestic markets; entry into exports comes later on. Marginal costs for this product in
both markets are assumed to be the same for the firm. How does the firm behave in terms of its
production decisions? A domestic firm in an imperfectly competitive setting domestically produces an
amount of domesticQ till E. At E, its marginal revenue from selling one unit of the product in domestic
markets is just equal to its marginal revenue from selling that product in foreign markets (foreign
marginal revenue curve is same as the flat foreign demand curve). From E onwards, marginal revenue
from export markets exceeds it marginal revenue from domestic markets and the firm focuses on exports
till F, producing ForeignQ units for its export markets. From F onwards, the firm’s marginal cost curve
exceeds even its marginal revenues from export markets and it would then have to rethink its strategies.
The producer’s surplus for the firm till E, is given by the trapezoidal area ABCD, it’s profits from

H e i n z S c h o o l , 2 n d P a p e r , C a r n e g i e M e l l o n , 2 0 0 8
27 | P a g e
domestic markets. An entry into export markets generates profits in the form of the triangular area ECF.
This diagram illustrates the shortcoming of the learning by exporting methodology, this despite being a
very informal static depiction of the situation with assumptions on the demand and marginal cost curve
of the firm. Conventional methods like TFP (that we also employ) will only indicate that profits from
entering export markets declined from its current domestic market levels, the new area ECF vis-à-vis its
old surplus, area ABCD. It however will not fully capture the impact of exporting behavior on
technology absorption by local firms, especially among firms within the same industry. This is
specifically so because the methodology fails to distinguish effectively between changes in firm profits
and changes in the technical efficiency of production for the firm.
Anecdotal evidences have shown that once the decision is taken, an entry into export markets has made a
firm inarguably more technically efficient in various industrial settings globally. An exporting firm is
able to implement process improvements, learn about employing advanced marketing techniques, or
incorporate the Western consumer tastes in its initial product that was initially geared towards a domestic
consumer. Further, in a setting as ours, these learnings by the firm could have spillover effects. Entry in
the US markets for example, of the first Indian pharmaceutical firm in a certain therapeutic category,
could bring in new knowledge on how to succeed in those categories in Western drug markets for other
firms. They could then follow suit. For these set of subsequent entrants in the export markets, entry into
foreign markets would then come almost at no cost, as if they had instant access to a “free window” to
exploit export opportunities. However profit opportunities for these firms will be minimal given the
perfectly competitive nature in global drug markets. Thus an Indian pharmaceutical firm’s entry into
global drug markets might result in a short run lowering of profits for the first moving firm or close to
non-existential profits for subsequent entrants, this registering as fall or perhaps only modest increases in
TFP. However the benefits from exports still remain raising the firm’s as well as the industry’s technical
efficiency but for the econometrician employing the TFP approach this will remain out of bounds. It is
thus well nigh possible that learning by exporting might then systematically underestimate the true
benefits for the firm from exporting. There might then be less to be discouraged about from findings on
no learning in the previous section.
What are the alternatives then for a researcher to understand technological upgradation and the true
benefits from exporting? One option as recent work suggests (Trefler 2007 and Javorcik 2008) is to
search for more detailed data at the plant or firm product-price level. One could ask plant managers (as
done in Trefler 2007) if they invested in advanced technological upgradation, before or after entering

H e i n z S c h o o l , 2 n d P a p e r , C a r n e g i e M e l l o n , 2 0 0 8
28 | P a g e
export markets. Alternatively, one can use unit values of products (as in Javorcik 2008), to truly measure
a firm’s surplus generated after entering export markets. In the absence of either, we do the next best
thing. We look for our version of evidences to support what the new international economics literature
dubs as getting ready to export. We argue that an entry into export markets, more so advanced export
markets, would be preceded by ex-ante investment bumps, a hypothesis that will synchronize with our
argument, that an entry into foreign markets entails an ex-ante technological upgradation by the firm.
One can witness that in our case with bumps in investments (a proxy for substantial technological
upgradation) occurring prior to entry into export markets. We also argue (and indeed find) that
especially for entry into the most advanced markets (US generic markets with ANDA filings), the partial
effect of an investment bump on the decision to enter is quite substantial. The next section details more
on investing-exporting linkages.
H. The literature & Set-Up for Getting to Ready Export
Getting Ready to Export
Recent work in new international economics (Trefler 2007, Javorcik et.al 2008, Melitz 2003) argue that
contemporaneous investments and the future exporting decision are complementary to each other. This is
not unrealistic if investment is done as discussed in Section G for ex-ante technological upgradation by a
firm entering export markets. It is hard to imagine that without costly productivity enhancing
investments (somewhat close to what the literature dubs as fixed costs of exporting) in previous periods,
a firm is going to enter an export marketviii. We argue then that exploring linkages between investing and
exporting could help us understand the decision behind the Indian pharmaceutical firm’s entry into
export markets. This is especially relevant in our case, where we don’t witness much learning for the
industry at large. We argue learning by exporting, fails to fully capture the ex-ante enhancements in
technical efficiency of a firm before it enters export markets. This section then documents that the firm’s
decision to export is increasing in ex-ante technological upgradation as measured through year to year
firm investment bumps. We argue that this adds more evidence to our basic premise, that indeed, a
presence in export markets for Indian pharmaceutical firms is closely related to the upgradation of its
technical efficiency frontier.
The Set-Up
Closely following this literature on getting ready to export, we model the exporting decision (a binary
choice variable) as a function of lagged investments, subject to controls, time dummies, and firm fixed

H e i n z S c h o o l , 2 n d P a p e r , C a r n e g i e M e l l o n , 2 0 0 8
29 | P a g e
effects in a binary choice linear probability, probit and conditional-logit setting. Our simple set up
models a firm’s entry into the exporting market conditional on a vector of firm level characteristics. Thus
the exporting decision Y is 1 if in a particular firm-year observation, one is present in the export market,
zero else. Thus:
tiititi xY ,,, ελβ ++= (6)
where the exporting decision tiY , for a firm i in time t is modeled thus:
tiY , = 1 if firm is present in the export market in a particular year
= 0 if it is absent in the export market in a particular year.
where tix , is a firm specific vector which includes lagged investments, firm size controls, in our case log
of deflated sales, lagged TFP, log of current labor, one lagged intensity of exports, and also one lagged
log of deflated R & D expenses. We also control for year-effects by including time dummies in the
regressions. Further unobserved heterogeneity is accounted for with firm level fixed effects iλ and ti,ε is
an idiosyncratic i.i.d error term. In a binary choice setting, more specifically in linear probability models,
one can take expectations of (6) and thus:
)()|()|( ,,,,,, itititiitititi ExxxExYE λβελβ +=++= (7)
Also one can show that in a binary choice setting, expectations are equal to the probability of the
dependent variable taking on the value of 1, thus:
)|1()|1(Pr)|( ,,,,,, titititititi xYPxYobxYE ==== (8)
Using (8) and (7) one can then write:
βtititi xxYP ,,, )|1( == (9)
Our objective is to see how lagged investments, subject to firm controls and year-effects influence the
conditional probability of the exporting decision )|1( ,, titi xYP = . We carry out our analysis thus with our
setup as illustrated in the equations (6) to (9), employing a linear probability setting, a pooled probit
estimator and conditional logit, following closely Trefler (2007), Javorcik et.al (2008) and Bernard and

H e i n z S c h o o l , 2 n d P a p e r , C a r n e g i e M e l l o n , 2 0 0 8
30 | P a g e
Jensen (2004). We include firm effects in linear probability and group by firm in conditional logit
allowing for firm specific unobserved heterogeneity, iλ that we drop in (9).
Data & Variables
Our data comes as before from the Prowess dataset as outlined in Section E. Our key independent
variable in the vector of firm characteristics is investments. As discussed, Indian firms don’t report a
series on new plant and equipment, instead CMIE Prowess collects what is reported, figures for plant
and equipment for our panel firms. The figures that we have are of gross block, that includes plant and
equipment at the end of a financial year lumped with additions and deletions of plant and equipment
investment during a current year. We take these figures of gross block and difference gross block of year
t with year t-1 to get current year investment in plant and equipment. We deflate these figures with the
WPI of all commodities. We then use the logs of 1st, 2nd, 3rd and 4th lags of these deflated investments
(defonelaginv, deftwolaginv, defthreelaginv, deffourlaginv) in the binary choice regressions (See figure
in Appendix illustrating plant and equipment accounting norms from the annual report of Aurobindo
Pharma in 2005).
For measures of a firm’s decision to be an exporter or a non-exporter we adopt the following five
approaches. First, we use our dataset to notice if the exports variable used in our TFP regressions is non-
missing and non-zero. If it is then we say that the dummy for exporting, Dumexp is 1, if it is not it takes a
value of 0. Second, we use data of firm counts of filings with the Food and Drug Administration for
Abbreviated New Drug Application, Drug Master Files, along with the data from FDA approval of a
firm’s manufacturing plant in a certain year. We say that the fact that a firm had a non-zero or a non-
missing ANDA or DMF count in a particular year, proxies for its entry in the export markets, the ANDA
indicator, ANDAI and the DMF indicator, DMFI takes a value of 1 or 0 accordingly. We also employ this
approach if a firm had a FDA approval in a particular year, the FDA indicator, FDAI taking a value of 1,
0 otherwise. We also take a union set of the three indicator variables for exports, ANDAI, DMFI and
FDAI. That is, if a firm-year observation had a non-zero ANDA count, or a non-zero DMF count, or a
non-zero FDA approval of its manufacturing plants (one or more), the union dummy OI takes a value of
1, 0 otherwise. This is off course an informal measure to proxy for entry into export markets apart from
using the Dumexp indicator. But industry sources point out that the fact, that a firm in a particular year
has a presence in the list of US regulatory filings, should in most cases point to it having transcended the
entire exporting cycle that is in general the norm for Indian pharmaceutical firms, viz. starting off with

H e i n z S c h o o l , 2 n d P a p e r , C a r n e g i e M e l l o n , 2 0 0 8
31 | P a g e
production for domestic markets, exporting to unregulated markets, exporting to regulated markets other
than USA and then finally setting sight on US markets. To the extent that is true and in the absence of
export destination wise firm-year data, we argue that a particular firm-year observation has a non-zero
ANDA, DMF or a FDA approval count, should proxy sensibly for its presence in export markets at large.
There are 1953 firm-year observations which are 1s for Dumexp, 29 ANDA observations which are 1s,
and the number for DMFs, FDAs and the Union Indicator with 1s are 222, 94, and 258. The plot by year
(see appendix) for dummy of exporters indicate that there is more entry near the end of the sample period
but the latest year sees a fall which might be due to exit of firms in general as we have already seen with
sales figures of the industry declining in 2005. A table on the variables and their descriptive statistics,
used for this getting ready to exports analysis is provided in the appendix.
Other variables used in the regressions are controls for firm’s technological competence, Logldefnrnd,
log of deflated total firm-year R & D investments, Logoneltfplevpet, and a control for past productivity
level of a firm with log of one period lag of firm TFP computed by the Levinsohn-Petrin approach. We
also use controls for firm size, log of current labor, and Logldefsales, log of deflated current sales. Past
export performance is controlled for with Lagged Intensity of exports, one period lag of intensity of
exports as percentage of sales. All of the controls are introduced in the basic exporting decision-lagged
investments regressions in a staged manner as means of robustness checks for the relationship between
investing and exporting. The regressions also include controls for year effects with time dummies. As the
correlation matrix highlights below, lagged investments are positively correlated with all proxies for
decision to enter export markets.
The next section presents results on contemporaneous investing and future exporting decision of the
firms. The sign on the lagged investment variable is a pointer to whether, the future exporting decision is
increasing or decreasing in contemporaneous investments, subject to the firm controls, firm specific
unobserved heterogeneity discussed above and year effects. Some cautionary words might be in order
here, while executing our empirical strategy. These relate to trade-offs from the models used in the
binary choice regressions. The linear probability model allows one to control for firm effects and has
been used by researchers for computational simplicity and a benchmark to start with (Javorcik 2008 &
Bernard and Jensen 2004).The Probits looks like the more obvious choice and also has been used by
others (Trefler 2007), however the sign and size of the point estimates on the lagged investments will not
be giving the marginal effects at the sample average, the coefficients are only illustrative of the

H e i n z S c h o o l , 2 n d P a p e r , C a r n e g i e M e l l o n , 2 0 0 8
32 | P a g e
relationship between the exporting decision and investments. The conditional logits allows us to control
for firm unobserved heterogeneity by grouping at the firm level.
Table 6: Correlation between Investment and Future Exporting Decision Analysis
1st Lagged Investments
2nd Lagged Investments
3rd Lagged Investments
4th Lagged Investments Dumexp ANDAI DMFI FDAI OI
1st Lagged Investments
1 2nd Lagged Investments
0.2477 1 3rd Lagged Investments
0.1311 0.5446 1 4th Lagged Investments
0.1277 0.3546 0.5209 1
Dumexp 0.1882 0.1029 0.0796 0.0668 1
ANDAI 0.1885 0.1381 0.1272 0.096 0.064 1
DMFI 0.2915 0.1515 0.1218 0.0983 0.2 0.2523 1
FDAI 0.2701 0.13 0.0878 0.1102 0.1292 0.2223 0.4424 1 OI 0.2807 0.1479 0.1195 0.0949 0.2014 0.3276 0.9242 0.5937 1
I. Findings on Getting Ready to Export
We don’t report all results from the binary choice set-up for all the lags of investments used, with step
wise introduction of controls in all the three estimation approaches adopted for all our five exporting
decision variable. Instead for expositional simplicity, we summarize the findings here, highlighting the
signs on the lagged investments in the probit and c-logit estimation approaches. We also highlight a table
of the linear probability results with time dummies and fixed effects, that captured the exporting decision
as a union set of the ANDA, DMF and FDA indicator to proxy for entering the export markets.
The table below summarizes the complementarities between current investment and future exporting
decision from the probit regressions. Some regressions due to the numerical iterative nature of the probit
did not converge, we don’t report the sign on the investment variable for these as a result. Broadly,
lagged investment (all lags) positively impacts the exporting decision, irrespective of proxy for entry into
export markets. In other words the future probability of the firm being an exporter increases with
increasing current levels of investments. This is with not only firm size control and time dummies, but

H e i n z S c h o o l , 2 n d P a p e r , C a r n e g i e M e l l o n , 2 0 0 8
33 | P a g e
also when we introduce other controls in the regressions to account for firm size, technological
competence, past export performance or past productivity.
Table 7: Complementarities between current investments and future exports: Probits
Sign of investment variable in Probit
With Controls Only firm size controls, Fixed Effects, time dummies
LHS: Dummy of export variable = 1 if non-zero or non-missing exports, else 0
1st Lag +ve +ve 2nd Lag +ve (mostly) +ve 3rd Lag +ve (mostly) +ve
LHS: ANDA as proxy for entry into export markets 1st Lag -ve +ve 2nd Lag -- -- 3rd Lag -- --
DMF as proxy for entry into export markets 1st Lag +ve +ve 2nd Lag +ve +ve 3rd Lag +ve +ve
LHS: FDA as proxy for entry into export markets 1st Lag +ve +ve 2nd Lag +ve +ve 3rd Lag +ve +ve
LHS: Union Set of ANDA-DMF-FDA as proxy for entry into export markets
1st Lag +ve +ve 2nd Lag +ve +ve 3rd Lag +ve +ve
In conditional logit, as shown in the table 8 below, controlling for firm level fixed effects and year
effects, lagged investment (less convincingly than the probit) positively impacts the exporting decision.
We must mention here that in binary choice setting, marginal effects except for the linear probability
model are dependent on the distribution assumption imposed in probit or logit. The findings here report
only the sign of the point estimate on the investment variable rather than reporting marginal effects
which will be similarly signed, its size changing depending on the distributional assumption. The linear
probability set up in Table 9 adheres to the trends revealed by the probit regressions. Current investments
again positively impact the future exporting decision with firm size controls and year dummies.
However, the sign on the point estimate of the lagged investment variable is not as consistently +ve if we
introduce controls, either the full set at once or in stages. Table 9 also documents the most encouraging
behavior in terms of the proxy used to model firm’s decision to enter export markets, the union set of
ANDA-DMF-FDA proxies across various specifications. Lagged investment most convincingly impacts

H e i n z S c h o o l , 2 n d P a p e r , C a r n e g i e M e l l o n , 2 0 0 8
34 | P a g e
the decision to enter export markets when entry is proxied with this variable. The results with the union
variable for the linear probability model are reported in the table below. The 1st to 4th lags all positively
impact the exporting decision probability. Interestingly, the technological competence control is also
positive and significant, perhaps the decision to enter export markets is increasing in R & D competence
of firms, a finding that has been highlighted in past work (Bhaduri and Ray 2004).
Table 8: Complementarities between current investments and future exports – C-logit
Sign of investment variable in C-Logit
With Controls Only firm size controls, Fixed Effects, time dummies
LHS: Dummy of export variable = 1 if non-zero or non-missing exports, else 0
1st Lag -ve +ve
2nd Lag +ve -ve
3rd Lag -ve -ve
LHS: ANDA as proxy for entry into export markets
1st Lag -ve +ve
2nd Lag -- --
3rd Lag -- --
LHS: DMF as proxy for entry into export markets
1st Lag -- -ve
2nd Lag -- -ve
3rd Lag -- +ve
LHS: FDA as proxy for entry into export markets
1st Lag -ve -ve
2nd Lag +ve +ve
3rd Lag +ve +ve
LHS: Union Set of ANDA-DMF-FDA as proxy for entry into export markets
1st Lag +ve -ve
2nd Lag +ve +ve
3rd Lag +ve +ve
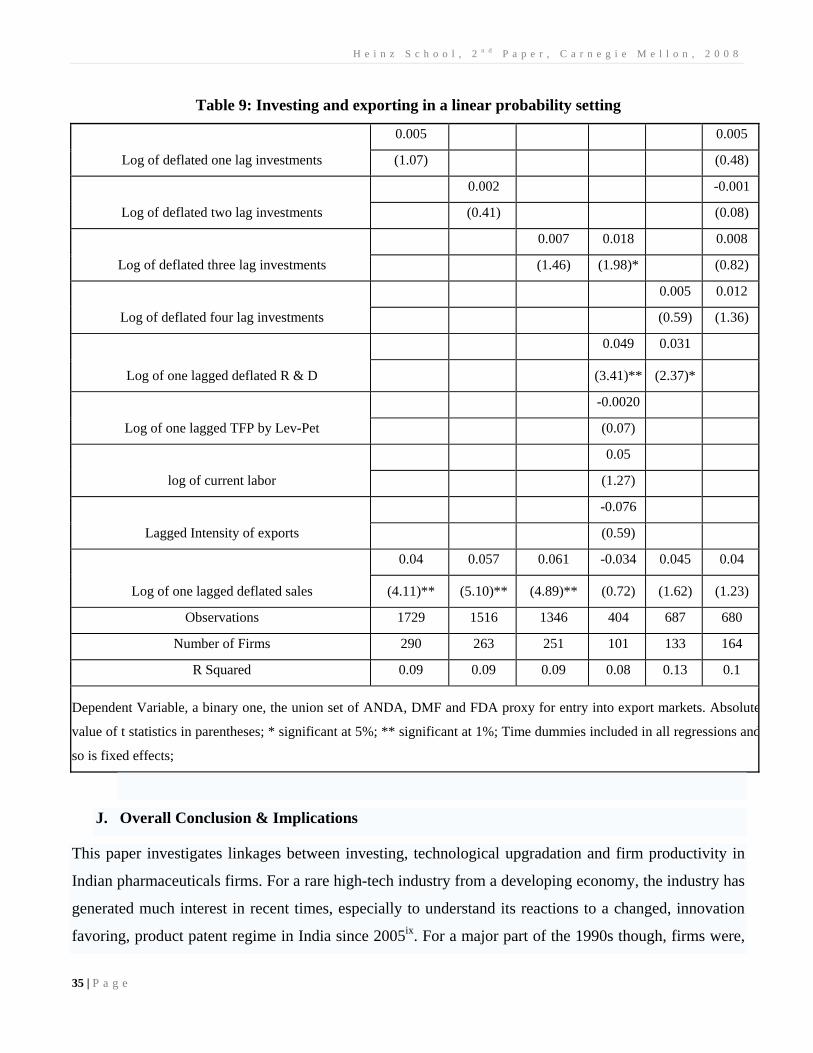
H e i n z S c h o o l , 2 n d P a p e r , C a r n e g i e M e l l o n , 2 0 0 8
35 | P a g e
Table 9: Investing and exporting in a linear probability setting
Log of deflated one lag investments
0.005 0.005
(1.07) (0.48)
Log of deflated two lag investments
0.002 -0.001
(0.41) (0.08)
Log of deflated three lag investments
0.007 0.018 0.008
(1.46) (1.98)* (0.82)
Log of deflated four lag investments
0.005 0.012
(0.59) (1.36)
Log of one lagged deflated R & D
0.049 0.031
(3.41)** (2.37)*
Log of one lagged TFP by Lev-Pet
-0.0020
(0.07)
log of current labor
0.05
(1.27)
Lagged Intensity of exports
-0.076
(0.59)
Log of one lagged deflated sales
0.04 0.057 0.061 -0.034 0.045 0.04
(4.11)** (5.10)** (4.89)** (0.72) (1.62) (1.23)
Observations 1729 1516 1346 404 687 680
Number of Firms 290 263 251 101 133 164
R Squared 0.09 0.09 0.09 0.08 0.13 0.1
Dependent Variable, a binary one, the union set of ANDA, DMF and FDA proxy for entry into export markets. Absolute
value of t statistics in parentheses; * significant at 5%; ** significant at 1%; Time dummies included in all regressions and
so is fixed effects;
J. Overall Conclusion & Implications
This paper investigates linkages between investing, technological upgradation and firm productivity in
Indian pharmaceuticals firms. For a rare high-tech industry from a developing economy, the industry has
generated much interest in recent times, especially to understand its reactions to a changed, innovation
favoring, product patent regime in India since 2005ix. For a major part of the 1990s though, firms were,

H e i n z S c h o o l , 2 n d P a p e r , C a r n e g i e M e l l o n , 2 0 0 8
36 | P a g e
as is typical of an industry from a developing economy, focused on exports as a key revenue earner. Did
firms show technological upgradation or learn from exports? This question motivates the study. We
don’t find learning effects at the broad industry level, as witnessed through productivity increases from
exports. The self-selection argument in the learning by exporting literature made us look for suitable
instruments that might be correlated with exports but not our dependent variable, firm productivity. We
instrument with lags of exports and our primary result of no learning still went through both at the
overall industry and sub-industry level.
Subsequently, we adopt a different tack, arguing that exports teased out by product or destination type
for firms might result in performance enhancements in firms. In short, exporting formulations or generics
might indeed enhance productivity but not exporting bulks per se. Further, in the high profits regulated
markets, say for example in the United States, firms might have more to learn on how to conduct their
drugs businesses, than say if they export to an unregulated market for example in the CIS countries. Data
constraints however limited us from identifying firm-year exports either by product or destination type.
We could however categorize firms into within-industry categories, informally trying to capture both the
export by product type and export by destination arguments. Our categories thus included firms who
originally started off as bulk exporters, generic firms, firms whose manufacturing facilities have been
approved by the FDA, firms subdivided on foreign or domestic ownership or even principal exporters
with intensity of exports greater than 40% of sales anytime during our panel period. Broadly however,
within-industry categories failed to show learning effects consistently across the various estimation
approaches adopted or the export variable used. If at all some learning is observed, it is seen not in the
technologically progressive firms in the industry, but in firms who could be termed as the fringe firms in
the industry. These included both firms who started off as bulk producers or firms who were
domestically owned. We argue that off course this is what is expected given methodological constraints
in the learning by exporting literature and limitations in our data.
We then take the next logical step of showing that ex-ante technological upgradation by firms as
evidenced through investment bumps in firm-year observations condition the firm’s decision to enter
export markets. We argue that the TFP approach could not capture fully the benefits from technical
efficiency accrued by firms with a presence in export markets. Instead, this is captured by the firm’s
current investment outlay which measures a firm’s endeavors in technological upgradation. This impacts
positively its likelihood to enter export markets. We present our findings on this complementarity
between firm exporting and investing in a binary choice set up documenting evidences of getting ready
H e i n z S c h o o l , 2 n d P a p e r , C a r n e g i e M e l l o n , 2 0 0 8
37 | P a g e
to export in Indian pharmaceutical firms. Our results, based on five different proxies to capture the
decision to enter export markets were encouraging even when we employed different estimation
approaches or controlled for year-effects, firm size, technological competence, past productivity, or past
export performance.
Various implications emerge from our findings. First, in the literature on learning by exporting our
findings fit in somewhere in between those who found no learning and argued for self selection and
those who found learning effects in more recent years. Puzzlingly, technologically backward firms reveal
some performance enhancement from exports within the industry. This is indicative of an interesting
assortment of firms’ strategies that might emerge from the industry in the coming years. To the extent
that learning by exporting really captures true learning, this finding is also a pointer to policy makers and
governments that while, stronger patents and R&D subsidies might induce the industry to become more
innovative, the old war horse for emerging economies, exports-led growth, cannot be completely
disregarded. The government will thus have to frame policies adopting a judicious mix of exports and
innovation promotion. This however has to be handled carefully, especially in light of our ‘getting ready
to export’ findings showing complementarities between firm’s current investments and future exporting
decision especially to advanced markets.
At another level, this study is a pointer towards future research. In recent years as discussed in the
background section, Indian drug firms have increasingly moved into international markets adopting a
variety of FDI instruments. A comparison of these approaches on firm level learning might be worth
pursuing. If we broaden our focus, both the firm decision maker as well as the policy maker will possibly
like to probe into further interesting issues. What exactly might pharmaceutical firms from emerging
economies, learn from exports, from whom do they learn and how do they learn? Do firms become better
in producing outputs depending on contractual obligations with their clients or learning is witnessed at a
more general level, say for example how to handle price control regimes, overcome non-tariff measures,
master regulations or utilize distribution channels in foreign drug markets? How long does it take for all
these benefits of exporting to appear? How does one address and capture spillovers from these kinds of
learning to the overall industry? Ongoing work hopes to take up some of these questions. For now
though, there seems to be no such thing as a free lunch for an Indian pharmaceutical firm.

H e i n z S c h o o l , 2 n d P a p e r , C a r n e g i e M e l l o n , 2 0 0 8
38 | P a g e
Acknowledgements: This paper is written as part of my dissertation work and 2nd paper requirements at the Heinz School,
Carnegie Mellon University. I owe my sincerest gratitude for an evolving understanding of the industry through numerous
discussions with Professor Ashish Arora and Professor Lee Branstetter, my faculty advisors and committee members here at
Carnegie Mellon. I would also like to thank Matej Drev, Anand Nandkumar, and Romel Mostafa my colleagues in the
doctoral program at CMU, Professor Melvin Stephens at Heinz School and Aart Kraay at World Bank’s Washington DC
Office. My wife Anubrata pepped me up through a few waking nights. Industry experts especially Mr D G Shah, Secretary
General of the Indian Pharmaceutical Alliance was kind enough to provide me with suitable pointers. I owe sincere thanks to
Dr Saibal Ghosh at Reserve Bank of India, Mumbai for discussions on deflators, capital stock creations and useful data.
Thanks are much due to Mr Maharathi Basu at IIM Calcutta, India for help with additional data. Also my sincerest gratitude
to Professor Jayati Sarkar, at IGIDR, India and Professor Sudip Chaudhuri at IIM Kolkata, India for labor related data on
Indian manufacturing from the Annual Survey of Industries, country level exports and useful suggestions. I am solely
responsible for all errors in this essay.
End Notes
i Refer to the article “How India Could Export Drug Deflation” at
www.businessweek.com/technology/content/feb2003/tc20030224_5858_tc058.htm?chan=search.
ii Bulk drug makers specialize in producing chemicals that go into the production of drug formulations. Advanced
intermediates or advanced bulk makers also focus on doing that at a further specialized stage of production. Formulation
makers are firms who make the final drug products in various medicinal forms like tablets or capsules using the chemicals
supplied by bulk makers and adding excipients. Formulation makers could opt to be generic makers if they decide to use an
off-patent going drug originally produced by another firm, and enter the market with a product of similar chemical
composition but a different brand name. All of these activities, bulk (also called active pharmaceutical ingredients or APIs),
advanced intermediates, or formulations could be one vertically integrated operation within a pharmaceutical firm coupled
with its R & D divisions who might specialize not only in generic R & D but also engage in R & D for new drug molecules.
iii These three policies had one single ideal, promote the domestic pharmaceutical industry in the light of Indo-China war of
1963 when the Government of India’s suddenly realization of a capable domestic drugs sector to take care of wartime
antibiotic and vaccine needs at affordable prices. The Indian Patents Act 1972 promoted process innovations and a reverse
engineering focused imitative domestic drugs sector. Multinational positions till 1970 were weakened considerably by the
Foreign Exchange Regulation Act of 1973, which limited the permitted level of foreign equity ownership and the scope of
business of multinational drug firms. The New Drug Policy of 1978 introduced further new restrictions weakening the
position of the multinationals. A series of drug price control acts, begun in the 1970s, further reduced the attractiveness of the
Indian market for foreign multinational firms.
iv ANDAs can be filed in four categories, if the required patent information has not been filed, if the patent has expired, if the
patent has not yet expired and approval is sought after patent expiration, if the patent is invalid or will not be infringed by the
H e i n z S c h o o l , 2 n d P a p e r , C a r n e g i e M e l l o n , 2 0 0 8
39 | P a g e
generic drug for which ANDA is being sought. These Para I, II, III and IV ANDAs may cost up to $ 1 million per product
with the approval process taking up to 5 years in some cases. While Para I and II applications could be approved by the FDA
with immediate effect, Para IV applications can become effective from the date of patent expiry. Para IV applications are
relevant when the patent on the NCE has expired but not patents on associated formulations or methods of use which may
still be valid. A Para IV applicant thus has to provide a notice to the patent holder, and if in response the innovator files an
infringement suit against the ANDA filer within the permissible 45 days, FDA cannot immediately approve the ANDA but
wait for 30 months unless the patent expires or the patent litigation suit is settled. The innovator company can procure
multiple such 30 month stays by listing secondary patents. Para IV ANDA filing thus while being a high-returns option is
also time consuming and costly. If a Para IV ANDA is finally approved then the filer gets a 180 day exclusivity to market the
product, during which time, other filers of ANDA for the generic version of the same drug product won’t be allowed
permission to enter the market. An ANDA approval requires inspection by the FDA and getting a compliance certification of
manufacturing for the bulk drug and other facilities. Also any change of supplier has to be approved by the FDA and
certification is not a one-time process, besides once granted, the FDA norms have to be adhered to throughout. A study by
Ranbaxy Labs suggests that an ordinary drug manufacturing plant will rank about 50 on a cost index, it will clock 100 for a
WHO-GMP certified plant, 200 for a EU certification and 300 for a FDA certification. Indian firms have invested to file Para
IV ANDAs while setting up dedicated facilities with greater than $10 mil investment.
v A firm’s entire set of experiences would include an union set of setting up a plant according to the FDA norms, bearing the
costs and risks of litigation while challenging a patent for an original drug with a para IV ANDA, or being the bulk supplier if
one misses being upstream and the 180 day exclusivity that comes with a para IV ANDA or be a bulks supplier to a firm who
is not a first to file ANDA generic maker and make advanced manufacturing investments on the same.
vi Also see Table 1 page 20-27 of Wagner (2007) for a summary of the literature on exporting and productivity.
vii Two policy instruments immediately come to our mind. The introduction of Supplementary Protection certificates in Italy,
in the early 1990s, which resulted in Italian generic exports declining and India picked up from there. It is however not
obvious from our data if the Italian policy change was the single most determining factor in rising Indian generic exports to
the US from the mid 1990s. The FDA approval of a drug manufacturing plant could be another however our data on non-
approval is extremely small, only 12 observations and further the FDA data is restricted to the years 1995-2005.
vii Chaudhuri (2005) reports that an ordinary drug manufacturing plant will rank about 50 on a cost index, it will clock 100 for
a World Health Organisation certification, 200 for a European Union certification and 300 for a FDA certification. An Indian
pharmaceutical firm looking at entering US markets with FDA approval will thus have to invest close to 6 times the levels of
expenditure it would have done to set up an ordinary drugs manufacturing plant. We argue that this is captured in our data on
investment bumps and should condition the decision to enter US or more advanced markets by an Indian drug firm.
vii India signed the WTO-TRIPs agreement in 1995 and took a decade in implementing a patent regime that recognizes
product patents from 2005. Till 2005 starting from the early 1970s, the patent regime in India did not grant product patents
encouraging process innovations.

H e i n z S c h o o l , 2 n d P a p e r , C a r n e g i e M e l l o n , 2 0 0 8
40 | P a g e
Appendix – Export Destinations, Industry-Subsets, Capital Stock Creation, Figures and Tables
A. Non-Tariff Measures and Export Destinations
While exporting to regulated and unregulated markets, Indian firms have traditionally faced non-
tariff measures (NTM) that have made them adopt various strategies to continue their overseas
ambitions. As listed in Table 1,, at least 8 different kinds of NTMs, including company and
product registrations, product registration alone, WHO-GMP certification, packaging and
labeling requirements, import bans, anti-dumping measures and pre-shipment inspections were
faced by Indian drug firms in export markets. Developed and regulated markets tended to have
one main type of NTM, namely company and product registrations, while developing or
transition economies have a different set of NTMs imposed on Indian drug firms. Single NTMs
like the FDA (Food and Drug Administration) approval requirement in the USA have been
traditionally more difficult to surmount than other kinds of NTMs. Within the developing world
there is variation both in the nature and number of NTMs imposed. Responses by Indian drug
firms to counter the NTMs as listed in the Table above could be classified as an offensive or a
defensive one (Nixson and Wignaraja 2004).
Table 1: Export Market and Non-Tariff Measures
Export Market Non-Tariff Measures faced
USA FDA approval for company and products.
Japan Requirement of local clinical trials as a part of
company/product registration.
Georgia & Russia Product registration; WHO-GMP certification; Russian
labeling regulation and pre-shipment inspection.
Nigeria, Kenya, Uganda, Algeria, Mauritius, South Africa Product registration and WHO-GMP certification;
packaging and labeling regulations.
Argentina & Brazil Discriminatory bilateral treaty for PIC Treaty countries &
Anti-Dumping Duties.
Source: Nixson and Wignaraja (2004)

H e i n z S c h o o l , 2 n d P a p e r , C a r n e g i e M e l l o n , 2 0 0 8
41 | P a g e
B. Industry Subsets:
We adopted the following approaches to classify our industry sub-samples.
Principal Exporters (prex dummy)– These are firms which had an intensity of exports greater
than or equal to 40% of their sales, any time during the panel period under investigation. There
were 103 such firms with mean exports of Rs 2 million. The average firm was exporting Rs 0.1
million in 1990 but by 2005 its value of exports on an average had risen to Rs 3.7 million by
2005.
Major Exporters (Mexp dummy) – These were firms who in a particular firm-year observation
had intensity of exports greater than or equal to 40% of their sales. There were 417 such firm-
year observations and each of them was coded as 1, Mexp==1 for these firm-year observations
and 0 for the rest of the sample.
FDA firms (FDA dummy) – These were firms which had an FDA approval of their
manufacturing facility anytime during the panel period. There were 42 such firms, with the
average firm exporting Rs 4.9 million, out of average sales of Rs 3410 million. In 1990 the
average firm was exporting Rs 0.6 million out of sales of Rs 1130 million, and this had increased
by 2005 to an average of Rs 9.2 million from an average sales figure of Rs 6050 million.
Modern Firms (modern dummy) – This was our most inclusive definition of technologically
progressive firms, and this set included all firms with a formal R & D facility. There were 145
such firms, with the average firm exporting Rs 1.7 million out of sales worth Rs 1720 million.
The average firm was exporting Rs 0.2 million out of a sales of Rs 840 million in 1990 but by
2005 this had increased to Rs 3.1 million worth of exports out of sales clocking Rs 2850 million.
Dummy for Bulk Exporters (dbulk dummy) – These were firms who had started off their
business mainly producing bulks and active pharmaceutical ingredients. We utilized our existing
dataset to arrive at this definition of subsample of firms. These firms had filed a Drug Master
File any time during our panel, but had not filed an ANDA during that year. There were certain
firm-year observations when five firms, Dr Reddy’s, Glenmark, Ranbaxy, Sun Pharmaceuticals
and Wockhardt had filed a DMF but not an ANDA during our panel period. Our knowledge of
these firms suggests that they could hardly be classified as having started off with bulk-making
aspirations. So we recoded them as 0s for the bulk dummy, the rest of the firms retained a code
of 1 and were classified as firms who started off their firm history as bulk/API makers. We

H e i n z S c h o o l , 2 n d P a p e r , C a r n e g i e M e l l o n , 2 0 0 8
42 | P a g e
finally checked our classification with the product portfolio and firm history details on the
websites of these firms and assigned them the tag of being the Bulk Exporters. There were 53
such firms, who on average exported Rs 2.3 million out of sales worth Rs 1860 million. In 1990
the average firm’s exports stood at Rs 0.2 million out of sales worth Rs 770 million and this had
increased exports worth Rs 5.9 million out of sales worth Rs 3610 million in 2005.
Generic firms – two possible definitions (genanal and genP dummies) – These firms could be
safely and most inclusively classified as the ones having a substantial generics presence in the
global pharmaceutical and domestic OTC formulations markets as of today. We arrived at this
classification using the following algorithm. First we investigated firms who in particular firm-
year observations had a non-zero (or non-missing) ANDA filing but for that particular year, the
firm had not filed a DMF. There were 6 such firms, Dr Reddy’s, Glenmark, Ranbaxy, Sun
Pharmaceuticals, Wockhardt and Vista Pharmaceuticals. Given the paucity of firms who could
be classified as the real generics makers, we decided to expand our list. We expanded the above
list by comparing to our subsample of firms who were rated as the industry leaders by analysts
and also with the firms who had one or more US patents. The union set of them were then
classified as firms with the dummy genanal and genP respectively. We went back and cross
checked our definition of generic firms finally, with the product lines of these firms as listed on
their websites to arrive at our overall list of generic firms as per these two possible definitions.
The genanal definition of generic firms yielded 42 firms and the genP definition yielded 48 such
firms. The average genanal firm had exports worth Rs 4.8 million out of sales of Rs 3510
million. In 1990 the average genanal firm was exporting Rs 0.5 million out of a sales of Rs 1170
million, but this had increased to the average genanal firm exporting Rs 9.2 million in 2005 out
of sales of Rs 5860 million. For the average genP firm exports were Rs 4.2 million out of sales
of Rs 3280 million, in 1990 this average firm was exporting Rs 0.6 million out of sales of Rs
1030 million, this had increased to Rs 7 million out of sales of Rs 6370 million in 2005.
Domestic Firms – (og dummy) – These were firms coded as 1 if they were domestically owned
and 0 otherwise. There were 286 such firms, the average firm exporting Rs 0.8 million out of
sales of Rs 860 million, in 1990 exports for the average firm clocked Rs 0.1 million out of sales
of Rs 500 million and this increased to Rs 1.5 million out of sales of Rs 1640 million in 2005.

H e i n z S c h o o l , 2 n d P a p e r , C a r n e g i e M e l l o n , 2 0 0 8
43 | P a g e
C. Capital Stock Creation
Previous literature reports on a different dataset used in Indian manufacturing (from the Annual
Survey of Industries data) that construction of capital stocks could adopt one of two methods. Start
with the book value of gross fixed assets (GFA), to measure capital formation at replacement costs.
Use the wholesale price indicator to deflate GFA at current to constant prices. Compute an implicit
deflator by dividing GFA at current prices by GFA at constant prices and then use the difference
between current year and previous year GFA to get an estimate of gross yearly investment. The
implicit deflator can then be used on the investments series thus computed. One can start with a
particular year’s GFA to get benchmark capital stock, add up the investment series computed to that
to create the series on capital stock. (Banga and Goldar 2007, Unel 2003). Another approach could
be that adopted by Balakrishnan et al. (2000). It applies the Perpetual Inventory Model, while
correcting for the fact that the value of capital is recorded at historic and not replacement cost. In
order to arrive at a measure of the capital stock at its replacement cost for a base year (assume a base
year), one can construct a revaluation factor assuming a constant rate of change of the price of
capital and a constant rate of growth of investment throughout the 20-year lifetime assumed for
capital stock. This revaluation factor converts the capital in the base year into capital at replacement
cost at current prices, which is then deflated using a deflator constructed from the series on gross
capital formation. To get at the capital stock for every time period, one can then take the sum of
investment in subsequent years. We were however apprehensive of starting with a GFA value or
using an implicit deflator as outlined above. The second approach too is less convincing, ideal in our
case would have been availability of a series on new plant and equipment. In its absence, we subject
ourselves to the vagaries of the firm accountant’s tricks and depreciation rates using firm-year gross
fixed assets, deflated with WPI and use that as our capital stock measures. To the extent that we use
time dummies in our regressions and control for firm fixed effects our results should broadly not
change, as our primary identification comes from introducing exports in the TFP regressions.

H e i n z S c h o o l , 2 n d P a p e r , C a r n e g i e M e l l o n , 2 0 0 8
44 | P a g e
D. Figures and Tables on computed TFP through various approaches
Descriptive Statistics of TFPs
Variable Obs Mean Std. Dev. Min Max
tfpfd 1973 -1.40721 1.76341 -8.51212 3.085741 tfpols 2396 0.014307 0.471459 -2.81384 3.305186
tfplevpet 2590 1.82352 1.877185 -2.63599 9.775167 tfpFE 2396 3.84E-10 0.501703 -3.02692 3.219508
Distribution of TFP by Lev-Pet approach by year
010
2030
010
2030
010
2030
010
2030
-5 0 5 10 -5 0 5 10 -5 0 5 10 -5 0 5 10
1990 1991 1992 1993
1994 1995 1996 1997
1998 1999 2000 2001
2002 2003 2004 2005
Frequency
tfplevpetGraphs by year
The movement of the coefficients on time dummies in TFP regressions

H e i n z S c h o o l , 2 n d P a p e r , C a r n e g i e M e l l o n , 2 0 0 8
45 | P a g e
E. Results on learning from introducing instrument of 1st and 2nd lags of exports in firm categories.
Partial Effects with 1st lags of exports in TFP regressions Pooled OLS Fixed Effects Lev Pet
Principal Exporters Exports (levels, deflated) .015 (0.95) {0.38} .026 (1.58) {0.60} .123 (3.09) {0.33}
Intensity of Exports .074 (1.32) {0.42) .130 (2.25) {0.33} -.001 (-0.02) {0.75} Dummy for exporters -.022 (-0.68) {0.24} -.005 (-0.18) {0.57} .038 (0.87) {0.36}
Log of exports .031 (3.14) {0.20} .033 (3.24) {0.03} .077 (4.58) {0.07} Major Exporters
Exports (levels, deflated) .019 (1.19) {0.84} .027 (1.63) {0.77} .119 (3.41) {0.44} Intensity of Exports .235 (3.04) {0.00} .293 (3.69) {0.00} .111 (0.85) {0.04}
Dummy for exporters -.007 (-0.14) {0.81} .014 (0.26) {0.90} .069 (0.81) {0.94} Log of exports .054 (4.38) {0.00} .054 (4.21) {0.0008} .108 (4.13) {0.00}
FDA Approved Firms Exports (levels, deflated) .014 (0.86) {0.40} .025 (1.57) {0.51} .103 (2.91) {0.86}
Intensity of Exports -.105 (-0.75) {0.31} .120 (0.75) {0.97} -.17 (-1.21) {0.811} Dummy for exporters -.090 (-1.47) {0.10} -.062 (-0.99) {0.23} -.012 (-0.09) {0.59}
Log of exports .013 (1.14) {0.76} .029 (2.36) {0.23} .027 (2.24) {0.735} Modern Firms
Exports (levels, deflated) .0188 (1.19) {0.55} .027 (1.71) {0.55} .10 (2.53) {0.69} Intensity of Exports -.089 (-1.12) {0.06} .058 (0.65) {0.41} -.257 (-2.36) {0.22}
Dummy for exporters -.001 (-0.06) {0.79} .006 (0.18) {0.90} .013 (0.23) {0.41} Log of exports .017 (2.17) {0.91} .021 (2.52) {0.38} .020 (1.04) {0.97}
Dummy for bulk exporters Exports (levels, deflated) -.043 (-1.29) {0.04} -.012 (-0.35) {0.20} .153 (1.99) {0.36}
Intensity of Exports -.158 (-1.40) {0.07} -.108 (-0.86) {0.05} .022 (0.15) {0.27} Dummy for exporters -.065 (-1.46) {0.08} -.034 (-0.75) {0.29} -.036 (-0.62) {0.16}
Log of exports .004 (0.31) {0.25} .016 (1.18) {0.92} .026 (1.46) {0.97} Generic firms, also analyst certified
firms
Exports (levels, deflated) .016 (0.99) {0.83} .028 (1.69) {0.99} .106 (2.20) {0.66} Intensity of Exports .074 (0.57) {0.68} .381 (2.52) {0.06} -.250 (-1.84) {0.40}
Dummy for exporters -.036 (-0.66) {0.42} -.004 (-0.07) {0.81} .043 (0.54) {0.91} Log of exports .022 (1.99) {0.5552} .032 (2.75) {0.111} .029 (1.34) {0.71}
Generic Firms, also US patenting firms Exports (levels, deflated) .014 (0.87) {0.303} .024 (1.48) {0.21} .101 (2.57) {0.78}
Intensity of Exports .071 (0.77) {0.60} .230 (2.33) {0.16} -.249 (-1.75) {0.37} Dummy for exporters -.067 (-1.26) {0.14} -.039 (-0.74) {0.33} -.033 (-0.48) {0.20}
Log of exports .014 (1.31) {0.775} .015 (1.37) {0.89} .038 (1.81) {0.43} Ownership group wise firms
Exports (levels, deflated) .017 (1.06) {0.5773} .025 (1.55) {0.49} .114 (2.44) {0.194} Intensity of Exports .054 (1.04) {0.097} .126 (2.21) {0.27} -.084 (-0.92) {0.269}
Dummy for exporters .004 (0.22) {0.961} .008 (0.37) {0.996} .056 (1.63) {0.87} Log of exports .023 (3.54) {0.016} .023 (3.31) {0.01} .025 (2.42) { 0.32}
Linear combination of point estimates, (.) indicates z stats except for fixed effects where it is t-stats, {.} is p-value from test of if the interaction term = 0

H e i n z S c h o o l , 2 n d P a p e r , C a r n e g i e M e l l o n , 2 0 0 8
46 | P a g e
Partial Effects with 2nd lags of exports in TFP regressions Pooled OLS Fixed Effects Lev Pet
Principal Exporters Exports (levels, deflated) .003 (0.15) {0.98} .015 (0.74) {0.68} .091 (2.28) {0.11}
Intensity of Exports -.005 (-0.08) {0.84} .006 (0.09) {0.96} -.009 (-0.06) {0.53} Dummy for exporters -.071 (-2.35) {0.09} -.060 (-1.93) {0.34} .013 (0.29) {0.32}
Log of exports -.001 (-0.16) {0.07} -.003 (-0.31) {0.28} .041 (2.56) {0.58} Major Exporters
Exports (levels, deflated) .007 (0.38) {0.76} .015 (0.77) {0.61} .097 (3.47) {0.00} Intensity of Exports .057 (0.64) {0.20} .091 (0.95) {0.21} .044 (0.29) {0.23}
Dummy for exporters -.050 (-1.06) {0.70} -.025 (-0.52) {0.75} -.005 (-0.09) {0.43} Log of exports .010 (0.77) {0.90} .005 (0.37) {0.95} .056 (2.91) {0.05}
FDA Approved Firms Exports (levels, deflated) .007 (0.38) {0.67} .020 (1.01) {0.41} .096 (2.55) {0.18}
Intensity of Exports -.13 (-1.05) {0.44} -.022 (-0.16) {0.82} -.22 (-1.52) {0.70} Dummy for exporters -.076 (-1.45) {0.38} -.052 (-0.96) {0.78} -.011 (-0.14) {0.46}
Log of exports .004 (0.31) {0.77} .017 (1.30) {0.33} .012 (0.82) {0.91} Modern Firms
Exports (levels, deflated) .005 (0.33) {0.21} .011 (0.72) {0.11} .037 (0.91) {0.43} Intensity of Exports -.145 (-1.99) {0.04} -.059 (-0.74) {0.23} -.307 (-2.79) {0.22}
Dummy for exporters -.020 (-0.72) {0.48} -.012 (-0.43) {0.19} .019 (0.47) {0.72} Log of exports .008 (1.08) {0.76} .014 (1.61) {0.14} .007 (0.44) {0.88}
Dummy for bulk exporters Exports (levels, deflated) -.070 (-1.82) {0.04} -.041 (-1.02) {0.18} .067 (1.09) {0.56}
Intensity of Exports -.022 (-0.19) {0.81} .018 (0.14) {0.91} .015 (0.09) {0.19} Dummy for exporters -.108 (-2.62) {0.04} -.087 (-2.09) {0.17} -.061 (-1.46) {0.04}
Log of exports -.009 (-0.67) {0.16} -.002 (-0.13) {0.51} .016 (0.92) {0.81} Generic firms, also analyst certified firms
Exports (levels, deflated) .011 (0.57) {0.49} .024 (1.23) {0.25} .101 (3.12) {0.004} Intensity of Exports -.070 (-0.59) {0.83} .117 (0.88) {0.35} -.29 (-2.24) {0.44}
Dummy for exporters -.036 (-0.77) {0.95} .005 (0.10) {0.32} .023 (0.25) {0.88} Log of exports .014 (1.25) {0.46} .024 (2.01) {0.07} .022 (1.13) {0.49}
Generic Firms, also US patenting firms Exports (levels, deflated) .008 (0.45) {0.61} .019 (0.99) {0.43} .097 (1.75) {0.183}
Intensity of Exports -.116 (-0.95) {0.500} .013 (0.10) {0.94} -.348 (-2.13) {0.311} Dummy for exporters -.028 (-0.60) {0.89} -.007 (-0.15) {0.46} .001 (0.02) {0.65}
Log of exports .006 (0.52) {0.89} .005 (0.43) {0.93} .021 (1.16) {0.46} Ownership group wise firms
Exports (levels, deflated) -.001 (-0.08) {0.210} .004 (0.29) {0.195} .045 (0.92) {0.50} Intensity of Exports -.027 (-0.50) {0.85} -.003 (-0.05) {0.616} -.123 (-1.49) {0.187}
Dummy for exporters -.043 (-2.06) {0.157} -.047 (-2.18) {0.16} .025 (0.97) {0.40} Log of exports .003 (0.53) {0.16} .000 (0.08) {0.09} .009 (1.03) {0.716}
Linear combination of point estimates, (.) indicates z stats except for fixed effects where it is t-stats, {.} is p-value from test of if the interaction term = 0

H e i n z S c h o o l , 2 n d P a p e r , C a r n e g i e M e l l o n , 2 0 0 8
47 | P a g e
F. Additional descriptors and results from investing-exporting linkages
The Exporter Dummy through the Years
010
020
030
00
100
200
300
010
020
030
00
100
200
300
-1 0 1 2 -1 0 1 2 -1 0 1 2 -1 0 1 2
1990 1991 1992 1993
1994 1995 1996 1997
1998 1999 2000 2001
2002 2003 2004 2005
Freq
uenc
y
DumexpGraphs by year
Reporting of Gross Block of Plant and Equipment from Annual Report 2005, Aurobindo Pharma

H e i n z S c h o o l , 2 n d P a p e r , C a r n e g i e M e l l o n , 2 0 0 8
48 | P a g e
Descriptive Statistics For variables used in Getting Ready to Export analysis
Variable Obs Mean Std. Dev. Min Max • The various investment variables
Deflated 1st lag of investments 5120 1.514272 8.40295 -193.758 134.0856
Deflated 2nd lag of investments 5120 2.135904 12.45449 -180.816 259.2609
Deflated 3rd lag of investments 5120 2.228618 12.79094 -174.538 227.945
Deflated 4th lag of investments 5120 2.266736 12.64239 -168.783 237.9299 • The various proxies to model the entry decision into export markets
Dummy for exporter 5120 0.381445 0.485789 0 1
ANDA Indicator 5120 0.005664 0.075054 0 1
DMF Indicator 5120 0.043359 0.203685 0 1
FDA Indicator 5120 0.018359 0.13426 0 1 Union of ANDA-
DMF-FDA 5120 0.050391 0.218771 0 1 • Firm Level Vector of Controls
Log of deflated and lagged R & D expenditure 1141 -0.56742 1.9663 -5.18863 5.425869
Log of one-lag TFP by Lev-Pet 2040 0.497133 1.034119 -5.92331 2.279845
Log of Labor 2765 4.103458 1.990653 -1.88585 8.857314 One Lagged
Intensity of Exports 2653 0.152179 0.233986 0 3 Log of one lag deflated sales 2653 2.841307 2.000102 -5.16992 7.841405

H e i n z S c h o o l , 2 n d P a p e r , C a r n e g i e M e l l o n , 2 0 0 8
49 | P a g e
Complementarities between current investments and future exports – Linear Probability
Comment on sign of investment variable in LPM
With Controls Only firm size controls, Fixed Effects, time dummies
Dummy of export variable = 1 if non-zero or non-missing exports, else 0 1st Lag -ve +ve 2nd Lag -ve -ve 3rd Lag -ve -ve 4th Lag -ve -ve
ANDA as proxy for entry into export markets 1st Lag -ve +ve 2nd Lag +ve +ve 3rd Lag +ve +ve 4th Lag +ve +ve
DMF as proxy for entry into export markets 1st Lag -ve +ve 2nd Lag -ve +ve 3rd Lag +ve +ve 4th Lag +ve +ve
FDA as proxy for entry into export markets 1st Lag -ve +ve 2nd Lag +ve +ve 3rd Lag +ve +ve 4th Lag -ve +ve
Union Set of ANDA-DMF-FDA as proxy for entry into export markets 1st Lag -ve +ve 2nd Lag -ve +ve 3rd Lag +ve +ve 4th Lag -ve +ve

H e i n z S c h o o l , 2 n d P a p e r , C a r n e g i e M e l l o n , 2 0 0 8
50 | P a g e
References
Achilladelis, B. and Amiti, Mary and Jozef Konings forthcoming. “Trade liberalization, intermediate
inputs and productivity: Evidence from Indonesia”. American Economic Review.
Alvarez, Roberto and Ricardo A. Lopez. 2005. “Exporting and performance: Evidence from Chilean
plants”. Canadian Journal of Economics 38(4):1384–1400.
Antonakis, K., 2001: “The dynamics of technological innovation: the case of the pharmaceutical
industry”, Research Policy, 30, 535-588.
Atkeson, Andrew and Ariel Burstein, 2006. “Innovation, firm dynamics, and international trade”,
Mimeo, UCLA.
Aw, Bee Yan, Sukkyun Chung, and Mark J. Roberts, 2000. “Productivity and turnover in the export
market: Micro evidence from Taiwan (china) and the Republic of Korea”. World Bank Economic
Review 14(1):65–90.
Aw, Bee Yan, Mark J. Roberts, and Tor Winston. 2007. “Export market participation, investments in
R&D and worker training and the evolution of firm productivity”, World Economy 14(1):83–104.
Balakrishnan, P., K. Pushpangadan and M.S. Babu, 2000, “Trade Liberalization and Productivity
Growth in Manufacturing: Evidence from Firm-Level Panel Data,” Economic and Political Weekly
(October).
Baldwin, John R. and Wulong Gu. 2003. Participation in export markets and productivity performance
in Canadian manufacturing. Canadian Journal of Economics 36(3):634–657.
Basant, R., Fikkert, B., 1996. The effects of R&D, foreign technology purchase, and domestic and
international spillovers on productivity in Indian firms. Review of Economics and Statistics, pp. 187–
199.
Basu, Susanto. 1996. Procyclical productivity: Increasing returns or cyclical utilization? Quarterly
Journal of Economics 111(3):719–751.
Bernard, Andrew B. and J. Bradford Jensen. 1999. Exceptional exporter performance: Cause, effect, or
both? Journal of International Economics 47(1):1–25.

H e i n z S c h o o l , 2 n d P a p e r , C a r n e g i e M e l l o n , 2 0 0 8
51 | P a g e
Bernard, Andrew B. and J. Bradford Jensen. 2004. “Exporting and productivity in the U.S”. Oxford
Review of Economic Policy 20(3):343–357.
Bernard, Andrew B. and Joachim Wagner. 1997. Exports and success in German manufacturing.
Weltwirtschaftliches Archive 133(1):134–157.
Branstetter, L., 2001: “Are knowledge spillovers international or intranational in scope?” Journal of
International Economics, 53(1), 53-79.
Chaudhuri, S, Goldberg K. Pinelopi and Jia, Panle, 2006: “Estimating the effects of Global patent
protection in pharmaceuticals: A Case study of Quinolones in India”, American Economic Review,
2007.
Chaudhuri, S, 2005: “The WTO and India’s Pharmaceuticals Industry”, Oxford University Press, New
Delhi, India.
Clerides, Sofronis, Saul Lach, and James R. Tybout. 1998. Is learning by exporting important? Micro-
dynamic evidence from Colombia, Mexico, and Morocco. Quarterly Journal of Economics 113(3):903–
947.
De Loecker, Jan. forthcoming. Do exports generate higher productivity? Evidence from Slovenia.
Journal of International Economics.
Delgado, Miguel A., Jose C. Fariñas, and Sonia Ruano. 2002. Firm productivity and export markets: A
non-parametric approach. Journal of International Economics 57(2):397–422.
Ederington, Josh and Phillip McCalman. forthcoming. Endogenous firm heterogeneity and the dynamics
of trade liberalization. Journal of International Economics.
Fernandes, Ana M. and Alberto E. Isgut. 2006. Learning-by-exporting effects: Are they for real?
Mimeo, The World Bank and Institute for Competitiveness & Prosperity.
Goldar, B., 2002, “Trade Liberalization and Manufacturing Employment,” Employment Paper 2002/34,
International Labor Organization.
Griliches, Zvi and Haim Regev. 1995. Firm productivity in Israeli industry: 1979-1988. Journal of
Econometrics 65(1):175–203.

H e i n z S c h o o l , 2 n d P a p e r , C a r n e g i e M e l l o n , 2 0 0 8
52 | P a g e
Hallward-Driemeier, Mary, Giuseppe Iarossi, and Kenneth L. Sokoloff. 2005. Exports and
manufacturing productivity in East Asia: A comparative analysis with firm-level data. Mimeo, The
World Bank and UCLA.
Hasan, R., D. Mitra and K. V. Ramaswamy, 2003, “Trade Reforms, Labor Regulations and Labor-
Demand Elasticities: Evidence from India,” NBER Working Paper 9879, (July).
Helpman, Elhanan. 2006. Trade, FDI and the organization of firms. Journal of Economic Literature
XLIV (3):589–630.
Iacovone, Leonardo and Javorcik, S. Beata, 2008: "Getting Ready: Preparation for Exporting," Working
Paper, World Bank.
Lanjouw, O. J., 1998: “The Introduction of Product Patents in India: Heartless Exploitation of the Poor
and Suffering?” Growth Center Discussion Paper, Yale University, and NBER Working Paper no. 6366.
Levinsohn, J. and A. Petrin, 2003, “Estimating Production Functions Using Inputs to Control for
Unobservables,” Review of Economic Studies, Vol. 70(243) (April).
Lileeva, Alla & Trefler, Daniel, 2007. Improved Access to Foreign Markets Raises Plant Level
Productivity... for some Plants, NBER Working Paper.
Marshak J. and Andrews W., 1944, "Random Simultaneous Equations and the Theory of Production",
Econometrica, 12, 143-205.
Olley, G. S. and A. Pakes, 1996, “The Dynamics of Productivity in the Telecommunications Equipment
Industry,” Econometrica, Vol. 64(6).
Park, Albert, Dean Yang, Xinzheng Shi, and Yuan Jiang. 2006. Exporting and firm performance:
Chinese exporters and the Asian financial crisis. Mimeo, University of Michigan.
Pavcnik, N., 2002, “Trade Liberalization, Exit and Productivity Improvements: Evidence from Chilean
Plans,” Review of Economic Studies, Vol. 69(238).
Petrin, A. and Levinsohn, J., 2004, "Measuring and Mismeasuring Industry Productivity Growth Using
Plant Level Data", Manuscript, National Bureau of Economic Research.
Sampath, Gehl Padmashree, 2006: “Indian Pharma within Global Reach?” UNU-Merit Working Paper
Series No 2006 – 031

H e i n z S c h o o l , 2 n d P a p e r , C a r n e g i e M e l l o n , 2 0 0 8
53 | P a g e
Topalova, P, 2004: "Trade Liberalization and firm productivity: the case of India", IMF Working Paper
WP/04/28.
Trefler, Daniel. 2004. The long and short of the Canada-US free trade agreement. American Economic
Review 94(4):870–895.
Tybout, J. and M. Westbrook, 1995, “Trade Liberalization and the Dimensions of Efficiency Change in
the Mexican Manufacturing Industries,” Journal of International Economics, Vol. 39.
Unel, Bulent, 2003, “Productivity Trends in India’s Manufacturing Sectors in the Last Two Decades,”
IMF Working Paper, WP/03/22
Van Biesebroeck, Johannes. 2004. Exporting raises productivity in sub-Saharan African manufacturing
firms. Journal of International Economics 67(2):373–391.
Young, Alwyn, 1991, “Learning by Doing and the Dynamics Effects of International Trade,” Quarterly
Journal of Economics, Vol. 10.
.