Non-Tariff Measures, Import Competition, and Exports
44
Policy Research Working Paper 9801 Non-Tariff Measures, Import Competition, and Exports Massimiliano Cali Angella Faith Montfaucon Macroeconomics, Trade and Investment Global Practice October 2021 Public Disclosure Authorized Public Disclosure Authorized Public Disclosure Authorized Public Disclosure Authorized
-
Upload
khangminh22 -
Category
Documents
-
view
0 -
download
0
Transcript of Non-Tariff Measures, Import Competition, and Exports

Policy Research Working Paper 9801
Non-Tariff Measures, Import Competition, and Exports
Massimiliano CaliAngella Faith Montfaucon
Macroeconomics, Trade and Investment Global Practice October 2021
Pub
lic D
iscl
osur
e A
utho
rized
Pub
lic D
iscl
osur
e A
utho
rized
Pub
lic D
iscl
osur
e A
utho
rized
Pub
lic D
iscl
osur
e A
utho
rized

Produced by the Research Support Team
Abstract
The Policy Research Working Paper Series disseminates the findings of work in progress to encourage the exchange of ideas about development issues. An objective of the series is to get the findings out quickly, even if the presentations are less than fully polished. The papers carry the names of the authors and should be cited accordingly. The findings, interpretations, and conclusions expressed in this paper are entirely those of the authors. They do not necessarily represent the views of the International Bank for Reconstruction and Development/World Bank and its affiliated organizations, or those of the Executive Directors of the World Bank or the governments they represent.
Policy Research Working Paper 9801
The empirical evidence on the impact of import compe-tition on economic performance relies mainly on import tariff liberalization as the source of changes to competition. This paper extends this evidence by focusing on non-tariff measures, an increasingly important trade policy tool glob-ally. The analysis examines the competition effect of four specific non-tariff measures on the exporting activity of the universe of Indonesian firms. The focus is on measures that do not clearly address any negative externalities of imports—the supposed objective of non-tariff measures—and hence
appear to be protectionist in nature. The results suggest that by restricting import competition, these measures reduce the survival of firms in export markets as well as the intensive and extensive margins of their exports. Non-tariff measures have a more negative effect than import tariffs in most cases and these results are robust to various checks. The analysis provides suggestive evidence that markups are an important channel through which these effects are mediated.
This paper is a product of the Macroeconomics, Trade and Investment Global Practice. It is part of a larger effort by the World Bank to provide open access to its research and make a contribution to development policy discussions around the world. Policy Research Working Papers are also posted on the Web at http://www.worldbank.org/prwp. The authors may be contacted at [email protected] and [email protected].

Non-Tariff Measures, Import Competition, and Exports∗
Massimiliano Cali†and Angella Faith Montfaucon‡
World Bank
JEL Classification : F10; F13; F14; L25
Keywords : Non-tariff measures, import competition, export performance, firms, Indonesia
∗The findings in this paper are entirely those of the authors and do not necessarily represent the viewsof the World Bank and its affiliated organizations. The authors are grateful to the Indonesia’s DirectorateGeneral of Customs for the cooperation - particularly Rudy Rahmaddi - including also through the provisionof customs data; participants of EAP Chief Economist KL Seminar, Aufa Doarest, Doan Thi Thanh Haand Samuel Kaspar Rosenow for helpful comments; Ana Fernandes for technical guidance on the survivalanalysis; Nabil Rizky Ryandiansyah for excellent research assistance and together with Agnesia AdhissaHasmand and Bayu Agnimaruto, for their help in assembling NTM dataset. All errors are our responsibility.
†[email protected]‡[email protected], corresponding author

1 Introduction
One of the key ideas in economics is that increased competition is associated with
enhanced performance of firms. More intense competition may induce firms to invest in
productivity-enhancing activities in order to stay in the market (Bustos (2011), Bloom et al.
(2016), Bloom et al. (2019)). Competition may also drive less productive firms out of the
market, thus raising the average productivity in the industry (Bernard et al., 2006).
A large share of these empirical results comes from studies using reductions in import
tariffs as the source of increased competition. The global wave of trade liberalization in
the 1980s and 1990s induced increased competition from imports for domestic incumbents
(Amiti and Konings (2007), Topalova and Khandelwal (2011)). Given the existing web
of multilateral and pluri-lateral trade agreements, governments have now considerably less
room to affect competition at home by changing import tariffs. At the same time, non-
tariff measures (NTMs) have become a more prominent trade policy tool. Governments
typically use these measures to achieve desirable non-trade objectives, such as protection of
consumers’ health and safety. However some NTMs appear to be protectionist in nature, and
hence their impact is potentially more akin to import tariffs (Cali, Le Moglie, et al., 2021).
To the extent that this is the case their introduction should reduce import competition.
In spite of their increased policy relevance, little evidence exists on the import com-
petition impact of NTMs. This paper starts to fill this gap by providing novel evidence on
the competition effects of four specific import NTMs on Indonesian exporters. The focus
on NTMs allows us to examine the impact of changes in trade policy towards a more pro-
tectionist rather than more liberal stance, as typical of the literature focusing on the tariff
liberalization episodes. To the extent that there may be asymmetric effects of changes in
import competition, this is an important complement to existing studies on trade liberaliza-
tion.
Indonesia provides a suitable context for this analysis for a number of reasons. The
Indonesian government has been increasing the use of import NTMs over the past decades
1

through relatively frequent changes in their application across HS-10 digit products. In ad-
dition, exports span a multitude of products, allowing for a large variation in exposure to
NTM changes across firms. At the same time, Indonesia has weak performance of manufac-
turing exports relative to comparators in South-east Asia. The deterioration of Indonesia’s
manufacturing competitiveness has led to a decreasing share of manufacturing as a share of
GDP. While this trend is common among countries that migrate from middle-income to high-
income status, Indonesia is deindustrializing at an unusually low-income level (Calı et al.,
2019). This process of premature deindustrialization (Rodrik, 2012) is undermining employ-
ment creation and slowing productivity growth, which are typically faster in manufacturing
than in other sectors.
Besides being an important outcome in its own right, exporting activity is also inher-
ently linked to the productivity of the firm.1 As such it is a useful dimension to capture the
impact of import competition on firms.
Porter (1990) advanced the hypothesis that the degree of competition in domestic
markets is positively related to performance in international markets. We argue that ex
ante the relation is in fact theoretically ambiguous. That is because import competition can
work through different mechanisms whose impacts on international competitiveness may go
in different directions. Specifically we consider three main mechanisms.
The first is the productivity channel. Lower import competition can reduce exports
by stifling productivity-enhancing investments which become less necessary to survive in the
domestic markets (Bustos (2011); Bloom et al. (2016)).
The second channel is mark-ups. To the extent that reduced import competition in-
creases domestic markups (relative to markups in export markets), this could induce firms
to start supplying the domestic market at the expense of their exporting activities.
The final channel - returns to scale - goes in the opposite direction to the first two.
If joint economies of scale/scope between export and domestic sales exist, increased import
1In standard trade models with heterogeneous firms for instance, only firms with productivity above acertain threshold are able to export (Melitz, 2003).
2

competition may negatively affect exporting activities. Clougherty and Zhang (2009) model
this channel theoretically and Autor et al. (2020) provide some indirect support for it.2
We focus on four measures that are widely applied in Indonesia. We argue that they
have a protectionist flavor as they do not address potential externalities from imports, or they
try to do so by imposing an unnecessarily large burden on trade. This is a key principle that
should not be breached according to WTO rules. These NTMs are pre-shipment inspections
(PSI), restrictions on port of entry of imports, mandatory certification with Indonesian
product standards (Standar Nasional Indonesia, SNI) and import approval requirements.
Our contention is that each of them aims to achieve a non-trade objective which is already
fulfilled or could be fulfilled through other less burdensome measures. As a result, they
unnecessarily restrict domestic competition.
In order to examine the competition impact of NTMs, we match two unique datasets.
The first consists of monthly data on the universe of Indonesian exporters which includes
information on exports, destination, and Harmonized System (HS) 10-digit products. The
second is a novel monthly dataset on the specific NTMs applied by Indonesia on its imports
at the same level of product disaggregation. The data allows us to observe in each month and
for each exporter which products are covered by individual NTMs. We use these datasets
to construct a measure of firm-level competition exposure to specific NTMs (classified at
the MAST 3-digit). We do this using a weighted share of products exported by a firm that
are subject to import NTMs. To the best of our knowledge, such a measure is novel in the
literature. A higher value in this exposure signals lower import competition for that firm, in
the products they export.
We investigate the reduced form impacts of NTMs on various margins of exports at
the firm-level, including survival in the export market, as well as the extensive and intensive
margin of exports. The extensive set of product, firm and time-varying controls help relieve
the endogeneity concerns of the NTM policies. In addition working with exporter-level data
2This is also the type of argument supporting “infant industry” protection (Chang, 2002).
3

strengthens the assumption that the treatment (NTM) may be exogenous to the treated unit
(exporting firm). To examine the impact on export survival we apply an accelerated failure
time (AFT) model that provides a better alternative to the commonly used proportional
hazards models in survival analysis. We employ fixed effects panel regressions on firm-level
outcomes for the extensive and intensive margin regressions.
Our results show that an increase in firm exposure to each of the four NTMs leads
to a decrease in the survival of firms in the export market through a reduction in import
competition. On the extensive margin, higher exposure also leads to lower number of firm-
level distinct products exported, decreased number of export destinations and a lower number
of product-destination combinations. On the intensive margin, a higher exposure to each
of the four NTMs also reduces firm-level export values and quantities. In most cases, the
negative effect of NTMs exceeds that of import tariffs, consistent with several studies (on
imports) such as World Bank and UNCTAD (2018) and those listed in Ederington and Ruta
(2016). These findings are robust to a variety of checks.
We provide some suggestive evidence on the mechanisms driving these results. We find
some evidence for the mark-up channel. The impact of NTMs is generally less negative for
firms with higher mark-ups, as measured by the relative unit values of their exports.
This paper relates to the literature on the impact of import policy on exports. Most
empirical work has been on tariffs, and have used data that is substantially more aggregated
than the categories to which trade policy is applied. For instance, Hayakawa et al. (2020)
find that a tariff reduction by a country tends to increase the country’s exports indicating a
new mechanism through which reductions in import restrictions lead to export expansions.
On the other hand, Fitzgerald and Haller (2018) find that tariffs only have modest effect
on aggregate export for a country, meaning that reduction in tariffs will not trigger more
firms to export. Unlike these studies, Bramati et al. (2015) look at the impact of import
competition on exports using a firm-level approach. Our analysis expands on these studies
by combining the highest level of product disaggregation available with particularly relevant
4
trade policy changes, which have not been modelled before.
Our results also speak to the broader literature on trade policy on firm performance,
including the pro-competitive effect of trade liberalization (Goldberg and Pavcnik (2016),
Amiti and Konings (2007), Bustos (2011), Feliciano and Doytch (2020), Epifani (2003),
Fontagne and Orefice (2018)). Within this literature only a few studies focus on NTMs, such
as Fontagne and Orefice (2018) and Asprilla et al. (2019), with the latter also recognizing that
NTMs are also a competition-policy issue. However, they typically use aggregate measures
of NTMs, despite the heterogeneous nature of individual regulations and the policy relevance
in communicating specific regulations. Further, within each disaggregated regulation, there
are usually hundreds of individual regulations.
Finally, this paper relates to broader challenges in the literature with measuring trade
policy and identifying its effects. This is especially crucial as the inability to precisely
measure non-tariff barriers that have replaced tariffs as the tools of trade policy is even more
relevant (Goldberg & Pavcnik, 2016). One of the main reasons behind this is the difficulty
in collecting sufficiently comprehensive and detailed data on NTMs and further linking that
to firms that trade in the products affected by the NTMs. Our novel NTM dataset allows
us to largely overcome this limitation. In this way, our paper is most closely related to Cali,
Le Moglie, et al. (2021). Our paper complements it by focusing on exporting activity and
by covering a wider range of protectionist NTMs.
The rest of this paper is organized as follows. Section 2 provides the Indonesia trade
policy context. Section 3 details the data. Section 4 describes the methodology; Section 5
presents the results. Finally, Section 6 concludes.
5

2 NTMs in Indonesia
2.1 Institutional Context
Various government institutions are responsible to determine NTMs for specific prod-
ucts in Indonesia. Although the overall responsibility lies with the Ministry of Trade (MoT),
NTM-related regulations have been spread out among a total of 13 government institutions
(ministries and agencies) during our period of analysis (2014-2018). As each has its own
mandate, this makes monitoring NTMs difficult, especially since there is no dedicated gov-
ernment institution to carry out NTM regulatory review and stocktaking Munadi (2019).
As explained below, we rely on comprehensive NTM data over time that allows to overcome
these issues.
It is useful to classify NTMs in groups/types as they comprise a large variety of different
measures enacted by different parts of government. To that end we follow the international
classification developed by the Multi-Agency Support Team (MAST), an inter-organization
group chaired by UNCTAD. This classification includes broad groupings, comprising different
NTMs according to their typology, e.g. Sanitary and Phyto-Sanitary Standards (SPS), Tech-
nical Barriers to Trade (TBT) and pre-shipment inspection and other formalities (INSP).
It also includes more refined measures, classified at the 2- and 3-digit level, which typically
match specific measures introduced by the individual regulations.3 This level of classification
is therefore the appropriate one for policy advice and that is what we use in the analysis
below.
In line with global trends, the incidence of NTMs has been increasing in Indonesia in
the past decade. This increase applies to almost all the different categories of NTMs, both in
terms of frequency and coverage ratios (Figure 1a).4 In 2018, Indonesia had a higher NTM
3In fact each ministerial or agency regulation can introduce or modify more than 1 NTM (at the 3-digitlevel).
4The frequency index is the percentage of HS-10 codes affected by at least one NTM. The Coverage Ratiois the share of import value subject to NTMs.
6
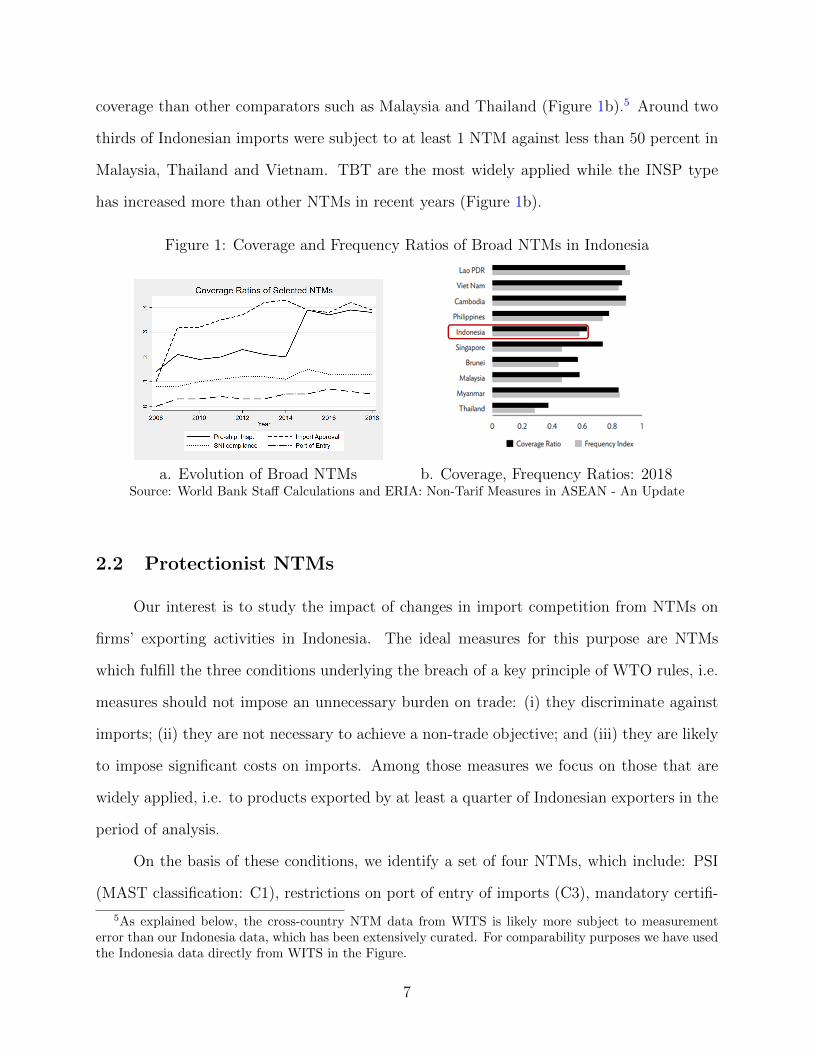
coverage than other comparators such as Malaysia and Thailand (Figure 1b).5 Around two
thirds of Indonesian imports were subject to at least 1 NTM against less than 50 percent in
Malaysia, Thailand and Vietnam. TBT are the most widely applied while the INSP type
has increased more than other NTMs in recent years (Figure 1b).
Figure 1: Coverage and Frequency Ratios of Broad NTMs in Indonesia
a. Evolution of Broad NTMs b. Coverage, Frequency Ratios: 2018Source: World Bank Staff Calculations and ERIA: Non-Tarif Measures in ASEAN - An Update
2.2 Protectionist NTMs
Our interest is to study the impact of changes in import competition from NTMs on
firms’ exporting activities in Indonesia. The ideal measures for this purpose are NTMs
which fulfill the three conditions underlying the breach of a key principle of WTO rules, i.e.
measures should not impose an unnecessary burden on trade: (i) they discriminate against
imports; (ii) they are not necessary to achieve a non-trade objective; and (iii) they are likely
to impose significant costs on imports. Among those measures we focus on those that are
widely applied, i.e. to products exported by at least a quarter of Indonesian exporters in the
period of analysis.
On the basis of these conditions, we identify a set of four NTMs, which include: PSI
(MAST classification: C1), restrictions on port of entry of imports (C3), mandatory certifi-
5As explained below, the cross-country NTM data from WITS is likely more subject to measurementerror than our Indonesia data, which has been extensively curated. For comparability purposes we have usedthe Indonesia data directly from WITS in the Figure.
7

cation with SNI (B7) and import approval requirements (B14). Our contention is that each
of them aims to achieve a non-trade objective which is already fulfilled or could be fulfilled
through other less burdensome measures. As a result they unnecessarily restrict domestic
competition.
PSI, which is imposed on around 40 percent of Indonesian imports, requires shipments
to be inspected at the port of departure before leaving for Indonesia. The objective is to
ensure that the import declaration lists the correct classification of the goods to be imported
as a way of detecting improper importing activities. This measure appears redundant in a
country like Indonesia, where the customs agency applies a risk management system aiming
to detect suspicious shipment at the border. Indeed, Indonesian Customs do not take into
account the outcome of the PSI in their assessment of the risk of the shipment at the border.
While arguably not necessary, this measure also significantly increases compliance costs for
imports.
In Indonesia only two State-Owned Enterprises have the authority (granted by the
MoT) to perform PSI for the Indonesian government. Anecdotal evidence suggests that
such limited supply of inspection agencies increases the uncertainty around the time it takes
to comply with such procedure. Thus, PSI can increase the cost of trade not only through
the monetary costs of compliance for the importer, but also by increasing the uncertainty of
the import process. Cali, Le Moglie, et al. (2021) find that this measure reduces productivity
and increases domestic markups in the manufacturing product markets to which it is applied.
Indonesian regulations mandate that certain goods must go through designated ports.
For example, horticulture goods must enter through four designated entry points, which are
Tanjung Perak Port (Surabaya), Balawan Port (Medan), Makassar Port (Makassar), and
Soekarno-Hatta Airport (Jakarta). This requirement is intended to ensure the safety of
imported products by directing imports to ports that possess adequate screening facilities.
However, ensuring the safety of imported goods does not require such port restrictions. In-
troducing appropriate facilities (for example quarantine in the case of horticultural products)
8

in Indonesia’s seaports and airports is more cost-effective than restricting port of entry. The
latter raises trade costs and increases prices in product markets as goods are not able to enter
through their natural entry port according to market demand. Cali, Pasha, et al. (2021)
show that eliminating this restriction on agricultural imports would reduce the domestic
price of the products subject to the measure by 12 percent.
Compliance with national standards SNI is mandatory in Indonesia for thousands of
goods, including also domestically produced ones. As certification requires a visit to the
factory premises by an Indonesian certifying agency, the cost is considerably higher for
imported goods. The monetary cost is compounded by the uncertain duration of the process.
Only a few agencies, mandated by the Ministry of Industry, can certify a specific product,
so producers in need of certification must often wait a long time to find an agency available
for certification. Interviews with firms suggest that the certification process for an imported
good may require up to 5 months.
This is also a recurrent cost as the certification must be renewed every year against
a fee and the certification process must be carried out again every 3 or 4 years depending
on the product. Cali, Doarest, et al. (2021) find that SNI certification costs Indonesian
importers equivalent to a tariff of up to 58 cents per dollar of imported good. At the same
time, compulsory certification does not appear necessary to ensure the safety of consumers
for those products which do not carry significant health and safety risks. These are the bulk
of the products subject to compulsory certification, from water bottles to light bulbs, from
bicycles to tires. For such products voluntary certification or self-certification are less trade
distorting and equally protective options.6
Over 40 percent of Indonesian imports are subject to special approvals issued by the
MoT. Obtaining this approval is cumbersome and its duration often unpredictable thus
raising the costs of importing. The main hurdle in the process is the requirement of recom-
mendation letters from sectoral ministries. These letters aim to fulfill non trade objectives,
6For example in the EU, producers self-certify compliance with EU standards but are still liable for anynon-conformity of the products with those standards.
9

which are often related to the protection of domestic producers in the sector. Ministries
have relatively high discretion in deciding on the recommendation, including whether or not
to grant it, how long it takes them to respond and on the quantity allowed for the specific
approval, which can differ from what the producer requested. When the import approval
aims to protect producers, this NTM does not seem to comply with the WTO principle
that “any person fulfilling the legal requirements should be equally eligible to apply for and
obtain import licenses” (WTO GATT, Article 2.1).
The four NTMs we focus on were issued by 11 different ministries between 2008 and
2018 and some by government regulations. For instance, SNI (B7) regulations were issued
by 8 different ministries. As of December 2018 however, the regulations coded within the
MAST classifications of the four NTMs in this paper were mainly issued by 3 ministries.
3 Data
We use two main sources of data, both of which are novel: a dataset on the universe
of Indonesian exporters in the period 2014-18 and a time-varying dataset of NTMs applied
on Indonesian imports.
For the trade data, we use customs-level data covering the universe of Indonesian
exporters from 2014 to 2018 in a monthly series. The data are collected by Indonesian
customs and record values exported by each firm at the 10-digit level of the Harmonized
System (HS). The data also has information on the country of destination, the value of
export, the quantities and status of the exporting firm (for example whether it is a producer
and/or an importing firm). Although our data excludes export zones, the export values
covered by the data represent over 90 percent of all export values for Indonesia in the
period.
We combine this data with monthly data on NTMs applied by Indonesia on imports
at a highly disaggregated sectoral level (HS-10 digit). This is a novel dataset built by the
10

World Bank on the basis of data collected by the Economic Research Institute for ASEAN
and East Asia (ERIA) in collaboration with UNCTAD. The UNCTAD/ERIA data identifies
the stock of NTMs applied by Indonesia as of 2015. The World Bank team has cleaned this
data extensively addressing several coding and interpretation errors. It has also extended the
data tracking the individual NTMs applied to each product before and after 2015, effectively
making this a time-varying dataset.7
To the best of our knowledge, this is the first comprehensive dataset on time-varying
NTM, at this level of disaggregation and frequency. A total of over 60 3-digit NTMs are
available in the dataset, each with values coded between 0 and 1 to signify when they were
in effect at in that month-product pair. Figure A1 in the Appendix provides more details on
our data compilations and compares the data with the ERIA/UNCTAD. This comparison
shows the large discrepancy between the data used in this paper and the UNCTAD/ERIA
data.
We observe a total of 22,915 individual exporting firms in the 2014-18 period. The
number of firms exporting has been increasing in the time period from 13,361 in 2014 to
17,738 in 2018. The top 10 firms accounted for 20 percent of export value and the top 25
firms make up 30 percent of the export value, with the highest firm accounting for 5 percent
of all export value in the period (Figure 2). About 9365 firms are in the 90th percentile in
terms of total export value. Only about 44 firms have above average export value, consistent
with stylized fact in the literature that exporting is concentrated and dominated by a few
large firms (Bernard et al., 2007).
Exporters that sell to only one destination represent over 77 percent of exporting firms
in our sample, but only 12 percent of the export value. The average number of destinations
per firm in our time period is 2 countries. On the other hand, 66 percent of export value is
generated by exporters with at least 5 destinations (Figure 3). A similar pattern is observed
7Appendix A1 details the process and the dissimilarities and coding errors corrected by our data. Further,Cali, Le Moglie, et al. (2021) and Cali, Doarest, et al. (2021) also provide more details on the constructionof the data.
11

with products. Single product firms generate 23 percent of export value whilst those with
more than 5 products make up 43 percent. Over 70 percent of firms sell one product to one
destination.
Figure 2: Export Concentration in Indonesia
a. Distribution of Export Value b. Cumm. Dist FunctionSource: IDN Customs Data and Author Calculations
Figure 3: Indonesian Exporters: Destinations and Products
Source: ID Customs and Author Calculations from Authors’ NTM dataset
Large firms (with average export values above the median) also mostly fall in the
category of those in industries having increasing returns to scale. These firms may need
exports to achieve scale. About 11 percent of firms fit this criterion and we will test this
mechanism in the empirical analysis below. In general, a higher share of large firms have
12

higher average unit values, higher product and higher market diversity. On the other hand,
a higher share of small exporters export more frequently.
We use the coverage ratio (CR) and the frequency ratio (FR) to measure the regulatory
intensity of NTMs across products. The incidence of the specific NTMs we focus on - as
measured by either CR or FR - increased during the period of analysis (Figure A1). At any
point in the period, at least one of these 4 NTMs is applied to imports of HS-10 digit products
that are exported by over 80 percent of Indonesian exporters. Table 1 shows the share of
exporting firms that export HS-10 products which are subject to import restrictions in
Indonesia through each of the four NTMs. Note that this applies to all exporters, regardless
of whether they themselves import.
Specifically, between 2014 and 2018, an average of 47% of exporters were exporting
products subject to pre-shipment inspections (C1) and port of entry restrictions (C3), 56%
to import approvals (B14) and 27% to SNI (B7). For all NTMs, the number of firms affected
has increased.
Table 1: Firms Exposed Based on whether the affected product is Exported (Competition)
PSI (C1) Port of Entry (C3) SNI (B7) Imp. Appr(B14)
% Share of Firms Affected
2014 48.4 48.0 27.8 57.02015 48.2 47.6 27.5 56.82016 48.2 47.9 27.3 57.02017 45.1 45.0 25.4 53.32018 45.4 45.7 25.3 53.5
Note: Affected in based on dummy on whether the NTM affecting the product exported by the firm is ineffect in that year
Source: Authors’ estimations based on Indonesia customs data.
4 Empirical Framework
Our aim is to examine the impact of these NTMs on the exports of Indonesian firms
through the changes in import competition brought about by the introduction of these mea-
13

sures. As long as their exporting product is among those subjected to any of the regulations
when it is being imported, it affects the concentration of that product in the market.
As explained above, given the data available, we focus on the reduced form impact by
relating the application of NTMs on HS-10 digit imports to the same products exported by
the firms.
To identify the effects, we construct a firm-level measure of competition exposure to
each of the universe of all NTMs applied to all products in Indonesia. This exposure measure
is our key variable of interest. Specifically, for each exporter i, we compute the share of
exports of HS-10 products subject to each NTM. To minimize the endogeneity of these
shares, we consider only the first two years when we observe the firm (usually 2014-2015):
NTM Exposurenit =∑j
(EXPij∑j EXPi
)∗NTMn
jt (1)
where n = 1.....60 represents each of the 60 3-digit level MAST NTMs in our data, thus
we have an exposure for each NTM n, though we focus on the four NTMs in our results. j
is the HS product, EXPij =∑t=2015
t=2014Exportsijt, and is the invariant weight of export value
product j in exporter i exports in the years 2014 and 2015, NTMnjt = 1 if an NTM n on
product j was in effect in month t and 0 otherwise. NTMnjt is what gives out NTM exposure
variable its time-variant nature.
This variable measures the exposure of each firm to the monthly changes in the NTM
application on the basis of its initial exported products. A higher value in this exposure
signals lower import competition for that firm in the products that the firm exports due
to import NTMs being applied to those products. This is our key measure to identify the
reduced form of the import competition channel of NTMs via exports. A similar exposure
is constructed for tariff, where NTMnjt is replaced by Tariffjt. The descriptive statistics of
this key variable are provided in Table 2. In line with the statistics above, import approval
covers on average the highest share of exports (25 percent), followed by PSI (24 percent).8
8Note that the statistics in the previous section included the entire export value of each exporter if at
14

Table 2: Descriptive Statistics of Firm-Level Exposure Variables
Variable Obs Mean Median Std. Dev. Min Max
Tariff 1,144,186 0.078 0.050 0.113 0.000 5.179C1 (PSI) 1,144,186 0.239 0.000 0.398 0.000 1.000C3 (Port of Entry) 1,144,186 0.093 0.000 0.280 0.000 1.000B7 (SNI) 1,144,186 0.076 0.000 0.234 0.000 1.000B14 (Imp. App) 1,144,186 0.251 0.000 0.400 0.000 1.000
Note: This covers the full sample period, 2014-2018Source: ID Customs and Author Calculations
Finally, in all estimations we control for all the import NTMs that the firm is also
exposed to via its exporting activity besides the specific NTM n of focus. This variable is
simply Other NTM Exposureall−nit . For example if we are regressing the effect of exposure to
port of entry requirements, this variable would capture all other NTMs (the remaining 59)
the firm is exposed to via its exporting activity. This control is important to help address
possible omitted variable bias.
We employ these NTM variables to analyze their reduced form effect on exports through
the competition channel. We focus on three sets of dependent variables to account for the
various margins of exports. The first is export survival, i.e. the likelihood that an export
relationship stays active for a specific period of time. This is the extensive margin at the firm
level. The second set measures the extensive margins conditional on the exporting activity
including changes in the number of exported products and destinations. The final dependent
variable measures the intensive margin through changes in export flows of existing trade ties
(Besedes & Prusa, 2011).
4.1 Survival Analysis
We consider hazard or duration models to assess export survival, as it is commonly
the case in the literature (Besedes & Prusa, 2006; Fernandes & Paunov, 2015; Stirbat et al.,
2015). Within this class of models, we use the accelerated failure-time (AFT) model. We
least 1 product was subject to NTM. As a result the shares above are higher than those computed on thebasis of equation 1.
15

prefer this to the multiplicative or proportional hazards (PH) model as the latter imposes
the assumption that the effect of firm characteristics on the hazard rate does not depend
on time duration, which may fail due to unobserved heterogeneity. It is common for this
assumption not to hold and the validity of the PH model has been questioned (Paul Brenton,
2011).
Under AFT models, we measure the direct effect of the explanatory variables on the de-
pendent variable, which is the natural logarithm of the survival time, log T. This is expressed
as a linear function of the covariates allowing for an easier interpretation of the results. The
regression parameter estimates from the AFT models are also robust to omitted covariates.
We also test the robustness of the estimates to using the Cox proportional hazard models
for comparability.
For a given survival time T and a vector of covariates X, the accelerated failure time
model can be formulated as:
Yi = log(ti) = β1NTM Exposurenit + β2Tariffit+
β3Other NTM Exposureall−nit + ∆4MSit ∗ γt + γt + εi
(2)
Where MSit ∗ γt is a series of interaction terms between the firm’s market share in an
HS-10 product in the first 12 months of exporting and year dummies. These controls should
help address the possible endogenous introduction of NTMs with respect to the initial size
or past performance of the exporter. We also control for time fixed effects (γt), while εi is a
random error term. For our estimation, we employ the loglogistic model where ε follows a
logistic distribution.9
In order to define exit, we take the last month of known exporting activity by the firm
in the data. Then, we need to know if it is the last export because it is at the edge of the
dataset or if it is because the exporting activity effectively ”died”. To determine this, we
9The fitted survival function for the ith firm is: Si(t) =
(1
1+t1σ exp(xiβ)
1σ
)where σ is a scale parameter
which scales ε.
16

calculate the average number of months it normally takes the firm to export. If the time
between the last known activity of the firm and the edge of the dataset is at least 3 times its
normal duration between exporting activities, then we consider the firm’s exporting activity
dead. We code a dummy equal to one for the firm having died in the current month. By
definition, we look only at the chronologically latest observation on each entity, whether they
failed then or not. The time difference between that observation and the first observation
is the period of survival. Those which never fail are still in the analysis, and are treated,
appropriately, as censored observations.
We acknowledge the shortcomings of non-linear models, including that the maximum
likelihood estimator tends to be inconsistent the if length of the panel is fixed, among other
concerns (Greene, 2008). We address this issue by also estimating survival using equation 3
in our robustness checks.
4.2 Extensive Margins and Market Entry
We then assess the effect of NTMs on the extensive margin of trade: new export prod-
ucts, new destinations and new product-destination pairs. The extensive margin is key to
understanding aggregate trade flows (Bernard et al., 2006) and the impact of import com-
petition on the incentives to explore new market opportunities. We estimate the impacts
by using the fixed effects Poisson estimator with robust standard errors, which is appropri-
ate for dependent variables which are non negative count variables (Correia et al., 2019).
The Poisson regression models the log of the expected count as a function of the predictor
variables:
Pr(Yit = yit|β1NTM Exposurenit + β2Tariffit+
β3Other NTM Exposureall−nit + β4MSit ∗ γt + αi + γt + vjt + εit)
(3)
where Yit is a variable measuring the extensive margins of exports, including through
the number of distinct products the firm exports (product diversity), the number of distinct
17
countries the firm exports to (market diversity) and the number of product-market pairs. αi
are exporter fixed effects, γt are time fixed effects, vjt captures industry j (at the HS-2 level)
and time varying characteristics and uit is the idiosyncratic error.
4.3 Intensive Margins: Export Values and Quantities
Finally, we assess the effect of NTM exposure on firms’ intensive margins. To measure
the impact on the intensive margin of export, we estimate the following fixed effects panel
regression:
Yit = β1NTM Exposurenit + β2Tariffit + β3Other NTM Exposureall−nit
+β4MSit ∗ γt + αi + γt + vjt + εit
(4)
where Yit represents the dependent variables of export value and export quantities for
firm i time t level.
4.4 Endogeneity
The estimation relies on the critical assumption that conditional on all the controls,
changes in NTM application are independent of firm-level exporting activity. There are a
number of threats to this assumption. The first is reverse causality, as NTMs may be changed
precisely in response to firms’ export trajectory. For example to the extent that increasing
exports of a product may signal increased domestic competitiveness in the industry, the
government may want to reduce its protection through NTMs. Alternatively, increased
exports may provide greater resources for firms to lobby the government for protection
(Bombardini & Trebbi, 2012). Whatever the direction of influence, this reverse causality
may bias the estimated parameter on NTM Exposure it. Moreover, unobservable variables
may also bias the coefficient if they are related with both firms’ exports and NTM application.
For example an able manager may improve firm’s exports and also be effective at lobbying
the government for protection.
18

To the extent that these sources of bias are time invariant or are common across
all exporters, the set of fixed effects (at the firm and time level) will address them. We
address the remaining concerns for the time-varying sources of bias in three ways. First, in
all regressions we include 2-digit HS industry-year fixed effects which should also capture
eventual changes in lobbying activity over time. The 2-digit industry classification is suitable
for that objective as it roughly matches the classification around which sectoral business
associations are organized (e.g. textile, garments, processed food, etc.). It could also be the
case that lobbying may occur at a finer level of sectoral disaggregation than 2-digit industry.
To control for such a possibility, we control for initial market share of the firm in an HS
10-digit export product interacted by time effects. This is also a reflection of initial firm
size or past firm performance referred to in most literature (See for example Fernandes and
Paunov (2015)).
Finally, we check the robustness of the findings to excluding the largest 1 percent of
firms by export values. As the largest exporters these could be particularly influential firms
in the government decision to introduce NTMs. We also present other robustness checks
related to the estimation methods and definition of entry in the results section.
In all cases, we report standardize coefficients of the variables of NTMs and tariffs by
normalizing the regressors to have mean zero and unit standard deviation.
5 Results
5.1 Export Market Survival
We start by providing some stylized facts on export survival that motivate some of
the empirical analyses below. We have 22,915 firms observed over 60 months (Jan 2014 to
Dec 2018) and 1,077,509 observations. We first present Kaplan–Meier (KM) estimates of
the time distribution of the Indonesia exporter survival in international markets and report
S (t) across firms based on their characteristics. This provides initial evidence on the survival
19

rates.10 The KM curve allows us to estimate percentiles of the survival distribution. The
mean survival time is calculated as the area under the Kaplan–Meier survivor function. The
graph is a series of declining steps showing declining hazard rate (or increasing survival) as
export spells grow older.
The results show that between 2014-2018, 22 percent of Indonesian exporting firms
(5,046) exited the export market, an average of just over 1,000 firms a year or 85 firms a
month. Figure 4 a shows the overall survival function. These figures suggest that a firm
exporting at the beginning of the period has an average 20% probability to exit the market
by midway through our sample period. The 25th percentile of completed survival times
(meaning that 25% have failed and 75% have yet to fail) occurs where F(t) = .25, and that
is t=40 months.
Exporting firms that are larger and have higher unit values have higher survival rates
(Figure 4 b and d). This result could be explained by greater economies of scale that larger
firms enjoy (Krugman, 1980).
We also observe higher survival rates among firms that export less frequently (Figure 4
c). This finding may be contrary to what we expect a priori, as frequent exporters may have
higher sunk costs and thus have longer survival time in the market. However, less frequent
exporters may have higher valued shipments, making any changes take longer. Again, we
check for this mechanism in the empirical analysis of export survival.
In table A1, we show results of the AFT model in equation 2. Negative coefficients
imply the survival time is shortened; hence, the hazard rate is increasing, and vice versa.
The baseline results show that an increase in NTM exposure leads to a reduction in the
export survival time for the average Indonesian exporter. This effect is statistically significant
for all the NTMs of interest except for SNI, whose coefficient is negative but not significant.
Import tariff exposure has also a negative and significant impact on exporters’ survival and
10It is not feasible to calculate a Kaplan-Meier curve for continuous predictors since there would be a curvefor each level of the predictor and a continuous predictor simply has too many different levels.
20

the effect is larger in magnitude than that of NTMs except for import approvals.11
Figure 4: K-M Survival Estimates
a. All Firms b. Unit Values
c. Exporting Frequency d. Firm SizeNote: The y-axis is in probability scale; x-axis contains the duration of trade. For the NTM graphs,estimates control for tariff and other NTMs and are computed by declaring NTMs as time varying.
We translate these results into elasticities in Figure 5 which shows the percentage
change in survival time associated with a percentage change in exposure. A 1 percent increase
in exposure to PSI is expected to reduce the firm’s average survival time by 3 percent, while
import approvals reduce it by 12 percent.12 The latter translates into a decrease in survival
time for the average firm by 12 months.
11Since we use standardized values of the coefficients, a 1 unit increase in exposure is an increase in astandard deviation for each variable of interest. For instance, the percentage change in survival time for a 1standard deviation increase in a firm’s exposure to PSI is 121 percent (see Table 2).
12This is calculated as follows: The standard deviation of PSI is 0.398. The 121% decrease in survivaltime for a 1 standard deviation increase translates to 121% decrease for a 39.8% increase in exposure, i.e121/39.8. All others are calculated the same way.
21

Figure 5: % change in survival time for a 1% increase in NTM exposures
Note: lines show standard errors.Source: ID Customs and Author Calculations from estimates in Table A1
5.2 Extensive Margins of Trade
Next we present the results of the Poisson regressions on NTMs and the impact on the
firm’s extensive margins.
We find that all four NTMs negatively affect the number of new products exported by
firms in Indonesia. Again the negative effect also applies to import tariffs (Table A2, top
panel). In this case, SNI has the largest effect in magnitude and is also the only NTM with a
coefficient larger than tariffs (at the 5% level of significance). Figure 6 reports the elasticities
derived from the estimated standardized coefficients. A 10 percent increase in exposure to
port of entry restrictions leads to a 1.5 percent decline in the number of distinct products,
while the value for SNI is 2 percent, and for import approval and PSI below 1 percent.
We also find a negative effect of NTMs on the number of destination markets per firm
(Table A2, bottom panel). In this case, all NTMs are larger than tariff except SNI. Import
approval followed by port of entry requirements have the larger effects, similar to the results
on firm survival. A 10 percent increase in exposure to import approval for instance leads to
a 1.1 percent decline in the number of distinct destinations (Figure 6). This has implications
as the literature shows that there is a positive relationship between the productivity of firms
22

and the number of export destinations (Muuls & Pisu, 2009).
Figure 6: % change in products/destination time for a 10 % increase in NTM exposures
Source: ID Customs and Author Calculations from Authors’ NTM dataset
5.3 NTMs and the Intensive Margin
The results suggest that NTMs have also a negative impact on the intensive margins
of trade. Table A3 show the effect on firms’ export values and quantities . In all cases,
the negative effect of each of the NTMs is larger in absolute magnitude than that of tariffs.
Import approval again appears to have the most negative impacts, similar to results on firm
survival and the number of export destinations per firm. A 28 percent increase in a firm’s
exposure to port of entry requirements (i.e. 1 standard deviation of port of entry variable,
see Table 2) leads to 24 (22) percent decline in a firms’ export values (quantities).13 Figure
6 shows the elasticities.
A 1 percent increase in exposure to port of entry leads to a decline of 0.9 percent
in values and -0.8 percent in quantity. The tariff on the other hand has about 20 percent
13The interpretation is that a 1 standard deviation increase in NTM exposure leads to the coefficient valuechange in the log of exports and/or just 100*coefficients.
23

pass-through.
Figure 7: % change for a 1% increase in NTM exposure
Source: ID Customs and Author Calculations from Authors’ NTM dataset
5.4 Robustness
We check the robustness of our results to different methods and assumptions. For the
survival analysis, we test how robust empirical results are to changes in model specification
and functional forms.
First we estimate the survival probability using a Weibull distribution, which the lit-
erature has shown to yield consistent results with the loglog specification. The main results
are robust to this alternative estimation: a one standard deviation increase in exposure to
these NTMs raises the hazard of exit increases by 20 to 44 percent (Table A4). For instance,
a standard deviation increase in exposure to PSI, increases the probability of exit by 44
percent, almost double the impact of tariffs (24 percent).
We also estimate the survival using the Poisson regression with multiple fixed effects
and code 1 for the month when the firm exits. This too yields consistent results. We find
24

that all four NTMs positively predict firm exist, as does tariffs (Table 3). We include time
fixed effects and industry*time fixed effects as in other extensive margin analysis presented.
Table 3: Effect of NTMs on the Hazard of Exit- Poisson fixed effects Model
PSI (C1) Port of Entry (C3) SNI (B7) Import Approval (B14)
NTM Exposure 0.1686*** 0.1780*** 0.0947*** 0.1439***(0.0032) (0.0038) (0.0024) (0.0030)
Other NTMs Exposure 0.4326*** 0.3932*** 0.4284*** 0.5066***(0.0078) (0.0067) (0.0067) (0.0077)
Tariff Exposure 0.0402*** 0.0413*** 0.0404*** 0.0404***(0.0027) (0.0027) (0.0027) (0.0027)
Observations 786000 786000 786000 786000
Note: Results with Poisson regression with multiple fixed effects. We include all controls. Standard errorsclustered at the firm level. Firm FE and Time *Industry FE included. Source: Authors’ estimations.
For the extensive margin, we test the robustness of the results to employing a log-
linear regression instead of the Poisson estimation. All the results with the three dependent
variables are also consistent in both magnitude and coefficient signs (Table A5).
To check that our results are not driven by influential observations, we re-run the
specifications excluding the top one percent of exporters in value. All our results for the
extensive margins (Table A6) and intensive margins (Table A7) are robust to this change,
including also that NTMs have a larger effect (in absolute terms) than tariffs on firm exports.
5.5 Mechanism- Markups
The analysis shows that NTMs that shelter domestically operating firms from import
competition have a negative impact on their exports. If interpreted in light of the mechanisms
hypothesized above, the results suggest that the productivity and/or the mark-up effects
dominate the economies of scale effect. In this section we test more explicitly the mark-up
mechanism. We focus in particular on the survival analysis as that captures the export
margin most clearly affected through these channels. In other words, whether to export or
not is likely to be the key decision affected by changes in import competition.
25

To the extent that decreased import competition from NTMs drive up domestic markups
(which is a possibility in models with variable markups), this could reduce domestic firms’
incentives to export, assuming that markups on exports do not change. In turn, this would
lead to a positive relation between import competition and the probability to export.
The key assumption to test for this channel with the data available is that firms with
higher mark-ups in export markets may be less responsive to changes in domestic mark-ups.
This is because other things being equal, the higher the markup in the export market, the
greater would be the gap between export and domestic markups. Further, the Indonesian
domestic market is sufficiently large to enable firms to achieve some economies of scale by
focusing only on it. This is likely to make the markup channel potentially more salient.
Hence, we expect NTMs to have a less negative effect on export survival for high markup
firms.
As we cannot compute export markup with our export data, we use unit values to
construct a proxy for markup. In particular we consider high markup exporters those with
unit values of HS-10 digit exports higher than the median unit value across all exporters of
that product. To check whether the impact of NTMs on the various export margins is less
negative for high markup firms, we run equation 2 and interact the NTM variable with a
dummy representing high unit values (HUV) as follows: NTM Exposurenit ∗HUV .
The coefficient of the interaction between NTMs and unit values is positive for two of
the four NTMs in the survival analysis while the other two are not significant (Table 4, top
panel). That is, the impact of NTM exposure to pre-shipment inspection and port of entry
on survival time is less negative for firms with higher unit prices. This result is in line with
what is expected for the markup channel.
26

Table 4: Effect of NTMs on Firm Survival Time: Mechanism
C1 (PSI) C3(Entry Port) B7(SNI) B14(Imp.Appr)
Exporters with higher unit values (HUV)
Low Unit Values -2.1652*** -3.3662*** -0.6082 -5.2618***(0.5188) (0.4428) (0.4863) (0.5617)
High Unit Values -0.1892 -1.4804*** 0.0453 -4.0972***(0.6175) (0.5204) (0.6105) (0.6279)
Observations 687647 687647 687647 687647
Note: Results with loglogistic distribution model with time fixes effects. Results based oninteractions terms from stata’s lincom. Standard errors clustered at the firm level.
Source: Authors’ estimations.
6 Conclusions
This paper extends the evidence on the impact of import competition on firms’ perfor-
mance by using NTMs as the source of changes in competition and by focusing on exporting
activity. To that end it matches two unique datasets on Indonesia: a transaction-level dataset
from customs covering the universe of Indonesian exporters and a novel time-varying dataset
on NTMs and tariffs at a highly disaggregated product level.
The analysis suggests that an increase in exposure to four protectionist NTMs, which
unnecessarily burden trade, significantly reduces the survival probability of firms in the
export markets. For three of the four NTMs the magnitude of the effect is larger in absolute
term than for import tariffs. The effect is less acute for firms with higher markups in export
markets, consistent with one of the key mechanisms linking import competition and exports.
The four NTMs generally also negatively affect exporters’ extensive and intensive margins.
The NTM effects on the various margins of firms’ exports are larger in absolute terms than
tariffs.
This has implications, not only for the growth of exports at the macro level, but also
for the performance of firms at the micro level. As the literature has shown, firms that
export are exposed to higher levels of competition in the global market, incentivizing them
27

to innovate and are more productive than non-exporters (Biesebroeck (2005), De Loecker
(2007)).
The evidence in this paper contributes to call into question import protectionism,
particularly by governments that are interested in improving their external balance position.
The negative incentives that import protectionism appears to provide to exporters, especially
in a large domestic market like Indonesia, should give some pause to policy-makers interested
in export-led growth and diversification. Further, the results underscore the importance of
moving beyond the aggregate NTM variables that much of the literature has focused on,
allowing for more focused policy implications in this line of research.
The limitation of the analysis is that we do not explicitly measure competition in the
domestic market but rely on existing theoretical and empirical evidence on market concentra-
tion and export performance. Linking the customs trade data to firm level data on revenues
and costs for the entire production would allow to better understand the mechanisms behind
our results.
28

References
Amiti, M., & Konings, J. (2007). Trade liberalization, intermediate inputs, and productivity:
Evidence from indonesia. American Economic Review, 97, 1611–1638. https://doi.
org/DOI:10.1257/aer.97.5.1611
Asprilla, A., Berman, N., Cadot, O., & Jaud, M. (2019). Trade policy and market power:
Firm-level evidence. International Economic Review, 60, 1647–1673.
Autor, D., Dorn, D., Hanson, G. H., Pisano, G., & Shu, P. (2020). Foreign competition and
domestic innovation: Evidence from us patents. American Economic Review: Insights,
2, 357–74.
Bernard, A. B., Jensen, J. B., & Schott, P. (2006). Survival of the best fit: Exposure to
low-wage countries and the (uneven) growth of us manufacturing plants. Journal of
international Economics, 68, 219–237.
Bernard, A. B., Jensen, J. B., Redding, S. J., & Schott, P. K. (2007). Firms in international
trade. Journal of Economic Perspectives, 21 (3), 105–130. https://doi.org/10.1257/
jep.21.3.105
Besedes, T., & Prusa, T. J. (2011). The role of extensive and intensive margins and export
growth. Journal of Development Economics, 96 (2), 371–379. https://ideas.repec.org/
a/eee/deveco/v96y2011i2p371-379.html
Besedes, T., & Prusa, T. J. (2006). Product differentiation and duration of us import trade.
Journal of International Economics, 70 (2), 339–358. https://doi.org/https://doi.
org/10.1016/j.jinteco.2005.12.005
Biesebroeck, J. V. (2005). Exporting raises productivity in sub-saharan african manufac-
turing firms. Journal of International Economics, 373–391. https://doi.org/https:
//doi.org/10.1016/j.jinteco.2004.12.002
Bloom, N., Brynjolfsson, E., Foster, L., Jarmin, R., Patnaik, M., Saporta-Eksten, I., &
Van Reenen, J. (2019). What drives differences in management practices? American
Economic Review, 109, 1648–83.
29

Bloom, N., Draca, M., & Van Reenen, J. (2016). Trade induced technical change? the impact
of chinese imports on innovation, it and productivity. The review of economic studies,
83, 87–117.
Bombardini, M., & Trebbi, F. (2012). Competition and political organization: Together or
alone in lobbying for trade policy? Journal of International Economics, 87 (1), 18–26.
Bramati, M., Gaggero, A., & Solomon, E. (2015). International trade and domestic com-
petition: Evidence from belgium. Review of Industrial Organization, 46 (4), 383–399.
https://EconPapers.repec.org/RePEc:kap:revind:v:46:y:2015:i:4:p:383-399
Bustos, P. (2011). Trade liberalization, exports, and technology upgrading: Evidence on the
impact of mercosur on argentinian firms. American Economic Review, 101, 304–40.
Cali, M., Doarest, A., Lake, J., & Puzzello, L. (2021). The changing nature of protection and
its consequences for welfare: Evidence from indonesia (Mimeo). The World Bank.
Cali, M., Pasha, M., Darko, F., Sumarto, S., Hidayat, T., & Tiwari, S. (2021). Nutritional
impacts of trade policies: Evidence from indonesia (Mimeo). The World Bank.
Cali, M., Le Moglie, M., & Presidente, G. (2021). Gain without pain ? non-tariff measures,
plants’ productivity and markups (Policy Research Working Paper Series No. 9654).
The World Bank. https://EconPapers.repec.org/RePEc:wbk:wbrwps:9654
Calı, M., Chang, P., Daga, R., & Mehta, G. (2019). Unlocking the dynamism of the indonesian
private sector: A country private sector diagnostic. World Bank Group.
Chang, H. J. (2002). Kicking away the ladder: Development strategy in historical perspective.
Anthem Press.
Clougherty, J. A., & Zhang, Z. (2009). Domestic rivalry and export performance: Theory
and evidence from international airline markets. Canadian Journal of Economics, 42,
440–468.
Correia, S., Guimaraes, P., & Zylkin, T. (2019). ppmlhdfe: Fast Poisson Estimation with
High-Dimensional Fixed Effects.
30

De Loecker, J. (2007). Do exports generate higher productivity? evidence from slovenia.
Journal of International Economics, 73, 69–98. https://doi.org/https://doi.org/10.
1016/j.jinteco.2007.03.003
Ederington, J., & Ruta, M. (2016). Non-tariff measures and the world trading system (Policy
Research Working Paper Series No. 7661). The World Bank. https://ideas.repec.org/
p/wbk/wbrwps/7661.html
Epifani, P. (2003). Trade liberalization, Firm Performances and Labor Market Outcomes in
the Developing World, what Can We Learn From Micro-Level Data? Rivista italiana
degli economisti, (3), 455–486. https://ideas.repec.org/a/mul/jqat1f/doi10.1427-
12530y2003i3p455-486.html
Feliciano, Z. M., & Doytch, N. (2020). Trade liberalization and firm performance: The case
of thailand. Contemporary Economic Policy, 38 (4), 607–621. https://doi.org/https:
//doi.org/10.1111/coep.12488
Fernandes, A. M., & Paunov, C. (2015). The risks of innovation: Are innovating firms less
likely to die? The Review of Economics and Statistics, 97, 638–653.
Fitzgerald, D., & Haller, S. (2018). Exporters and shocks. Journal of International Eco-
nomics, 113, 154–171.
Fontagne, L., & Orefice, G. (2018). Let’s try next door: Technical barriers to trade and
multi-destination firms. European Economic Review, 101 (100), 643–663. https : / /
EconPapers.repec.org/RePEc:eee:eecrev:v:101:y:2018:i:c:p:643-663
Goldberg, P., & Pavcnik, N. (2016). Chapter 3 - the effects of trade policy. In K. Bagwell &
R. W. Staiger (Eds.). North-Holland. https://doi.org/https://doi.org/10.1016/bs.
hescop.2016.04.002
Greene, W. H. (2008). Econometric analysis (6th). Pearson Education, Inc.,
Hayakawa, K., Ishikawa, J., & Tarui, N. (2020). What goes around comes around: Export-
enhancing effects of import-tariff reductions. Journal of International Economics, 126.
https://doi.org/https://doi.org/10.1016/j.jinteco.2020.103362
31

Krugman, P. (1980). Scale economies, product differentiation, and the pattern of trade.
American Economic Review, 70, 950–959.
Melitz, M. J. (2003). The impact of trade on intra-industry reallocations and aggregate
industry productivity. Econometrica, 1695–1724. https://doi.org/https://doi.org/10.
1111/1468-0262.00467
Munadi, E. (2019). Chapter 3 - indonesian non-tariff measures: Updates and insights. In
H. T. T. Doan & S. Rosenow (Eds.). ERIA. https://doi.org/https://doi.org/10.
1016/bs.hescop.2016.04.002
Muuls, M., & Pisu, M. (2009). Imports and exports at the level of the firm: Evidence from
belgium. World Economy, 32, 692–734.
Paul Brenton, E. v. U., Christian Saborowski. (2011). What explains the low survival rate
of developing country export flows? World Bank Economic Review, 24, 474–499.
Rodrik, D. (2012). Unconditional Convergence in Manufacturing *. The Quarterly Journal
of Economics, 128 (1), 165–204. https://doi.org/10.1093/qje/qjs047
Stirbat, L., Record, R., & Nghardsaysone, K. (2015). The experience of survival: Determi-
nants of export survival in lao pdr. World Development, 76, 82–94. https://doi.org/
https://doi.org/10.1016/j.worlddev.2015.06.007
Topalova, P., & Khandelwal, A. (2011). Trade liberalization and firm productivity: The case
of india. Review of economics and statistics, 93, 995–1009.
World Bank and UNCTAD. (2018). The unseen impact of non-tariff measures: Insights from
a new database (tech. rep.). United Nations; World Bank. https://unctad.org/system/
files/official-document/wb unctad 2018d1 NTMs en.pdf
32

Appendix
A1 Building and Comparing the NTM Data Set
Building on the Economic Research Institute for ASEAN and East Asia (ERIA) NTM
2015 stock-take, we engaged in a labor-intensive exercise of compiling all the relevant reg-
ulations on NTMs issued in Indonesia by various ministries from 2008-2018 with the help
of the Global Trade Alert dataset. For each regulation, we assigned the NTM 3-digit codes
(based on UNCTAD Multi-Agency Support Team (MAST) classification) emanating from
that regulation and applied it to the HS codes included in the regulation.
The workflow can be summarized as follows:
1. Compiling relevant regulations that follows (or preceded) the regulations already com-
piled by ERIA (as available on UNCTAD website) and checking whether the measures
are correctly coded.
2. Compile the HS codes attached to every regulations reviewed
3. Match each regulation with the HS codes they contain
4. Transform the matched dataset into a panel HS-month level data that trace the evo-
lution of each NTM code applied in one particular 10-digit HS code product.
Figure A1 gives a snapshot of the NTM data comparison for Indonesia, comparing
the number of HS 6 digit codes between UNCTAD and our data across the 3-digit NTMs
in the analysis. The comparison across all 60 NTMs reveal a relatively high correlation
between the 2 datasets over the entire period of 2008-2018 for which our NTM dataset spans
(0.6675). However the comparison reveals a significant extent of measurement error, which
may explain some discrepancies in the table below.
In several cases the UNCTAD/ERIA number is larger than our number (e.g., 2016 for
port of entry (C3)). The team investigated these instances and found that the discrepancy
comes from differences in the way we interpret what NTMs are derived from the original reg-
ulations, as well as from some mis classification of HS codes by ERIA. For example, ERIA
33
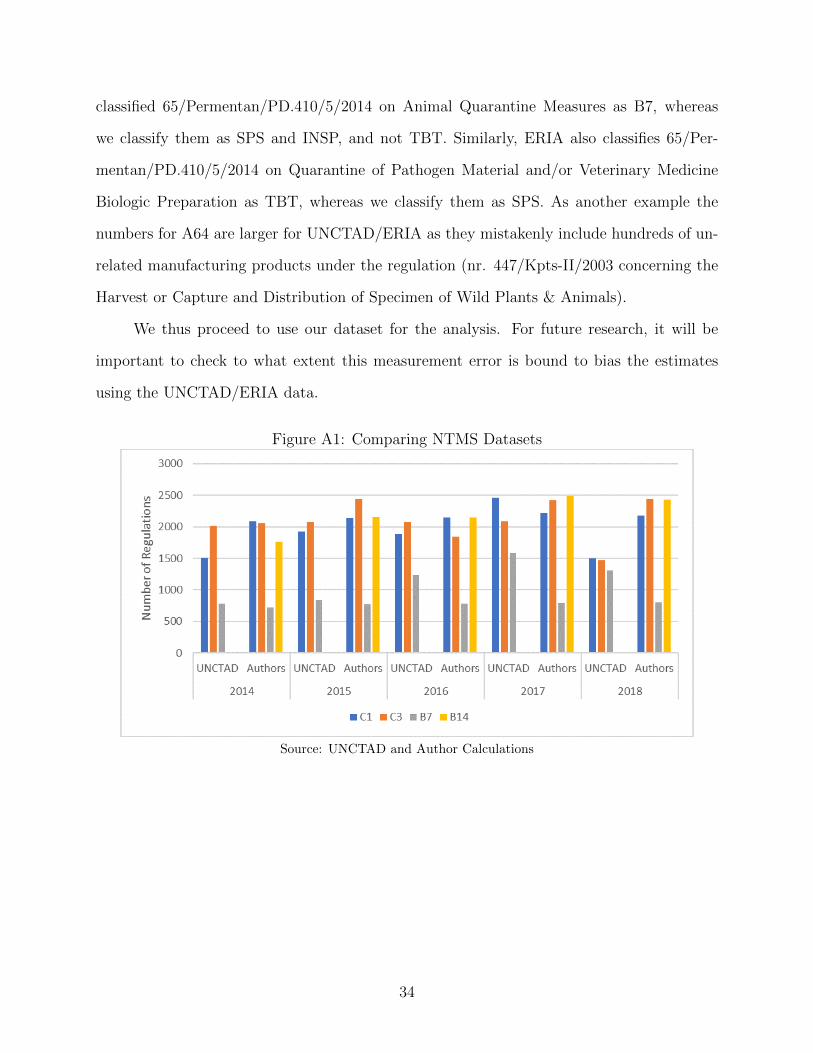
classified 65/Permentan/PD.410/5/2014 on Animal Quarantine Measures as B7, whereas
we classify them as SPS and INSP, and not TBT. Similarly, ERIA also classifies 65/Per-
mentan/PD.410/5/2014 on Quarantine of Pathogen Material and/or Veterinary Medicine
Biologic Preparation as TBT, whereas we classify them as SPS. As another example the
numbers for A64 are larger for UNCTAD/ERIA as they mistakenly include hundreds of un-
related manufacturing products under the regulation (nr. 447/Kpts-II/2003 concerning the
Harvest or Capture and Distribution of Specimen of Wild Plants & Animals).
We thus proceed to use our dataset for the analysis. For future research, it will be
important to check to what extent this measurement error is bound to bias the estimates
using the UNCTAD/ERIA data.
Figure A1: Comparing NTMS Datasets
Source: UNCTAD and Author Calculations
34

Coverage and Frequency Ratios of the 4 NTMs in Indonesia’s Imports
Figure A2: Evolution of NTMs on Imported Products in Indonesia
a. Coverage Ratios b. Frequency RatiosSource: ID Customs and Author Calculations
35

A2 Baseline Results Tables
Survival Analysis
Table A1 shows the baseline estimates on the survival analysis.
Table A1: Effect of NTMs on Firm Survival Time
C1 (PSI) C3(Entry Port) B7 (SNI) B14(Imp. Appr)
NTM Exposure -1.2070*** -2.3882*** -0.4388 -4.6648***(0.4478) (0.3510) (0.3975) (0.4397)
Other NTM Exposure -11.7578*** -7.4951*** -8.3723*** -4.7247***(1.0069) (0.9938) (0.8904) (1.0078)
Tariff Exposure -3.7292*** -3.0773*** -3.1943*** -3.2212***(1.1432) (1.0810) (1.0761) (1.0877)
No of Firms/Failures 16304/4717 16304/4717 16304/4717 16304/4717Observations 686,358 -686,358 -686,358 -686,358Log-pseudo-likelihood -30164.441 -30192.035 -30185.543 -30176.786
Note: Results with loglogistic distribution model with time fixed effects and model controlsfor MSit ∗ γt, the initial firm market share. Standard errors clustered at the firm level.
Source: Authors’ estimations.
36

Extensive Margin
We present the baseline estimates on the extensive margin in Table A2.
Table A2: Effect on Product Diversity, Market Diversity and Product-Destination Pairs
C1 (PSI) C3 (Ports) B7 (SNI) B14 (Imp.Appr)
Number of Products
NTM -0.0225** -0.0419*** -0.0467*** -0.0357***(0.0110) (0.0143) (0.00953) (0.0108)
Other NTMs -0.0375*** -0.0369*** -0.0363*** -0.0249**(0.0119) (0.0118) (0.0119) (0.0106)
Tariff -0.0262*** -0.0262*** -0.0260*** -0.0262***(0.00454) (0.00455) (0.00455) (0.00455)
Observations 1,012,877 1,012,877 1,012,877 1,012,877Firm; Time; Ind*Time FE Yes Yes Yes YesNTM=Tariff: p-value .76 .3 .05 .42
Number of Destinations
NTM -0.0303*** -0.0320*** -0.00852** -0.0362***(0.00456) (0.00547) (0.00394) (0.00439)
Other NTMs -0.0371*** -0.0388*** -0.0398*** -0.0306***(0.00480) (0.00463) (0.00467) (0.00436)
Tariff -0.00138 -0.00141 -0.00155 -0.00133(0.00181) (0.00181) (0.00181) (0.00181)
Observations 1,012,877 1,012,877 1,012,877 1,012,877Firm; Time; Ind*Time FE Yes Yes Yes YesNTM=Tariff: p-value 0 0 .11 0
Note: Results from Poisson regressions. Coefficients for covariates are standardized. *** for 1%, ** for 5%,and * for 10%. Robust standard errors in parenthesis and are clustered at the firm level. Time and Firm
FEs included
Source: Authors’ estimations.
37

Intensive Margin
Table A3 with the baseline estimates on the intensive margin.
Table A3: Effect of NTMs on Export Values and Quantities
C1 (PSI) C3(Entry Port) B7 (SNI) B14(Imp.Approv)
Values
NTM -0.238*** -0.256*** -0.191*** -0.282***(0.0191) (0.0202) (0.0192) (0.0150)
Other NTMs -0.295*** -0.306*** -0.308*** -0.241***(0.0168) (0.0162) (0.0164) (0.0176)
Tariff -0.0260*** -0.0262*** -0.0261*** -0.0268***(0.00577) (0.00577) (0.00577) (0.00578)
Observations 1,013,391 1,013,391 1,013,391 1,013,391R-squared 0.706 0.706 0.706 0.706Firm; Time; Ind*Time FE Yes Yes Yes YesNTM=Tariff test: p-value 0 0 0 0
Quantities
NTM -0.195*** -0.235*** -0.187*** -0.249***(0.0171) (0.0187) (0.0183) (0.0136)
Other NTMs -0.276*** -0.275*** -0.275*** -0.225***(0.0157) (0.0147) (0.0148) (0.0162)
Tariff -0.0210*** -0.0214*** -0.0211*** -0.0218***(0.00503) (0.00503) (0.00503) (0.00503)
Observations 1,013,391 1,013,391 1,013,391 1,013,391R-squared 0.707 0.707 0.707 0.707Firm; Time; Ind*Time FE Yes Yes Yes YesNTM=Tariff test: p-value 0 0 0 0
Note: Coefficients are standardized to make the comparable. Asterics *** for 1%, ** for 5%, and * for10%. Robust standard errors are in parenthesis and are clustered at the firm level.
Source: Authors’ estimations.
38
Robustness Checks
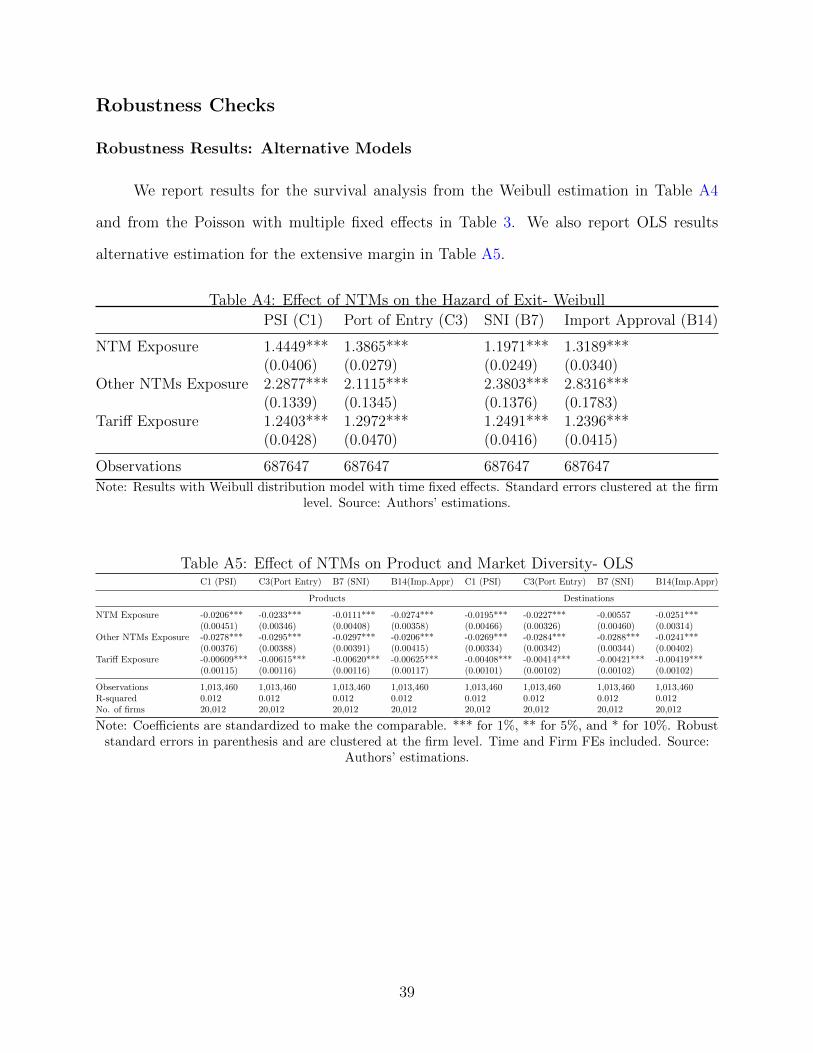
Robustness Results: Alternative Models
We report results for the survival analysis from the Weibull estimation in Table A4
and from the Poisson with multiple fixed effects in Table 3. We also report OLS results
alternative estimation for the extensive margin in Table A5.
Table A4: Effect of NTMs on the Hazard of Exit- Weibull
PSI (C1) Port of Entry (C3) SNI (B7) Import Approval (B14)
NTM Exposure 1.4449*** 1.3865*** 1.1971*** 1.3189***(0.0406) (0.0279) (0.0249) (0.0340)
Other NTMs Exposure 2.2877*** 2.1115*** 2.3803*** 2.8316***(0.1339) (0.1345) (0.1376) (0.1783)
Tariff Exposure 1.2403*** 1.2972*** 1.2491*** 1.2396***(0.0428) (0.0470) (0.0416) (0.0415)
Observations 687647 687647 687647 687647
Note: Results with Weibull distribution model with time fixed effects. Standard errors clustered at the firmlevel. Source: Authors’ estimations.
Table A5: Effect of NTMs on Product and Market Diversity- OLSC1 (PSI) C3(Port Entry) B7 (SNI) B14(Imp.Appr) C1 (PSI) C3(Port Entry) B7 (SNI) B14(Imp.Appr)
Products Destinations
NTM Exposure -0.0206*** -0.0233*** -0.0111*** -0.0274*** -0.0195*** -0.0227*** -0.00557 -0.0251***(0.00451) (0.00346) (0.00408) (0.00358) (0.00466) (0.00326) (0.00460) (0.00314)
Other NTMs Exposure -0.0278*** -0.0295*** -0.0297*** -0.0206*** -0.0269*** -0.0284*** -0.0288*** -0.0241***(0.00376) (0.00388) (0.00391) (0.00415) (0.00334) (0.00342) (0.00344) (0.00402)
Tariff Exposure -0.00609*** -0.00615*** -0.00620*** -0.00625*** -0.00408*** -0.00414*** -0.00421*** -0.00419***(0.00115) (0.00116) (0.00116) (0.00117) (0.00101) (0.00102) (0.00102) (0.00102)
Observations 1,013,460 1,013,460 1,013,460 1,013,460 1,013,460 1,013,460 1,013,460 1,013,460R-squared 0.012 0.012 0.012 0.012 0.012 0.012 0.012 0.012No. of firms 20,012 20,012 20,012 20,012 20,012 20,012 20,012 20,012
Note: Coefficients are standardized to make the comparable. *** for 1%, ** for 5%, and * for 10%. Robuststandard errors in parenthesis and are clustered at the firm level. Time and Firm FEs included. Source:
Authors’ estimations.
39
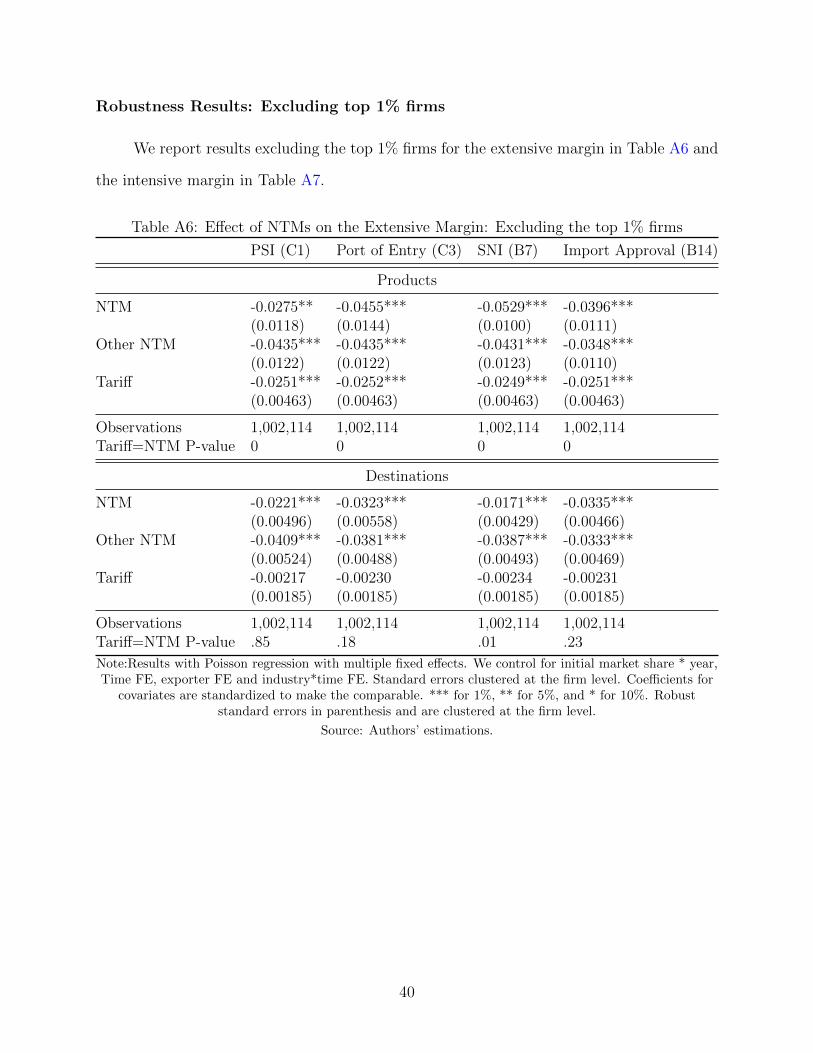
Robustness Results: Excluding top 1% firms
We report results excluding the top 1% firms for the extensive margin in Table A6 and
the intensive margin in Table A7.
Table A6: Effect of NTMs on the Extensive Margin: Excluding the top 1% firms
PSI (C1) Port of Entry (C3) SNI (B7) Import Approval (B14)
Products
NTM -0.0275** -0.0455*** -0.0529*** -0.0396***(0.0118) (0.0144) (0.0100) (0.0111)
Other NTM -0.0435*** -0.0435*** -0.0431*** -0.0348***(0.0122) (0.0122) (0.0123) (0.0110)
Tariff -0.0251*** -0.0252*** -0.0249*** -0.0251***(0.00463) (0.00463) (0.00463) (0.00463)
Observations 1,002,114 1,002,114 1,002,114 1,002,114Tariff=NTM P-value 0 0 0 0
Destinations
NTM -0.0221*** -0.0323*** -0.0171*** -0.0335***(0.00496) (0.00558) (0.00429) (0.00466)
Other NTM -0.0409*** -0.0381*** -0.0387*** -0.0333***(0.00524) (0.00488) (0.00493) (0.00469)
Tariff -0.00217 -0.00230 -0.00234 -0.00231(0.00185) (0.00185) (0.00185) (0.00185)
Observations 1,002,114 1,002,114 1,002,114 1,002,114Tariff=NTM P-value .85 .18 .01 .23
Note:Results with Poisson regression with multiple fixed effects. We control for initial market share * year,Time FE, exporter FE and industry*time FE. Standard errors clustered at the firm level. Coefficients for
covariates are standardized to make the comparable. *** for 1%, ** for 5%, and * for 10%. Robuststandard errors in parenthesis and are clustered at the firm level.
Source: Authors’ estimations.
40

Table A7: Effect of NTMs on the Intensive Margin: Excluding the top 1% firms
PSI (C1) Port of Entry (C3) SNI (B7) Import Approval (B14)
Values
NTM Exposure -0.240*** -0.253*** -0.192*** -0.275***(0.0191) (0.0202) (0.0200) (0.0151)
Other NTMs Exposure -0.286*** -0.301*** -0.302*** -0.241***(0.0169) (0.0163) (0.0165) (0.0177)
Tariff Exposure -0.0260*** -0.0262*** -0.0260*** -0.0266***(0.00577) (0.00577) (0.00577) (0.00578)
Observations 1,002,627 1,002,627 1,002,627 1,002,627R-squared 0.695 0.695 0.695 0.695Tariff=NTM p-value 0 0 0 0
Quantity
NTM Exposure -0.199*** -0.232*** -0.190*** -0.242***(0.0170) (0.0187) (0.0190) (0.0137)
Other NTMs Exposure -0.266*** -0.270*** -0.270*** -0.224***(0.0158) (0.0148) (0.0149) (0.0163)
Tariff Exposure -0.0211*** -0.0214*** -0.0211*** -0.0217***0 0 0 0
Observations 1,002,627 1,002,627 1,002,627 1,002,627R-squared 0.694 0.694 0.694 0.694Tariff=NTM p-value 0 0 0 0
Note: Asterisks *** for 1%, ** for 5%, and * for 10%. Robust standard errors are inparenthesis. Standard errors clustered at the firm level.
Source: Authors’ estimations.
41