Total Export and Import - SESRIC
16
1 OIC OUTLOOK June 2008 TRENDS IN INTERNATIONAL MERCHANDISE TRADE: A REVIEW OF THE OIC MEMBER COUNTRIES ORGANISATION OF THE ISLAMIC CONFERENCE STATISTICAL, ECONOMIC AND SOCIAL RESEARCH AND TRAINING CENTRE FOR ISLAMIC COUNTRIES Attar Sokak No: 4, 06700 GOP, Ankara, TURKEY Tel : +90-312-468 6172 (4 lines) Fax : +90-312-467 3458 E-mail : [email protected] Web : www.sesric.org
-
Upload
khangminh22 -
Category
Documents
-
view
0 -
download
0
Transcript of Total Export and Import - SESRIC

1
OIC OUTLOOK June 2008
TRENDS IN INTERNATIONAL
MERCHANDISE TRADE: A REVIEW OF THE
OIC MEMBER COUNTRIES
ORGANISATION OF THE ISLAMIC CONFERENCE
STATISTICAL, ECONOMIC AND SOCIAL RESEARCH
AND TRAINING CENTRE FOR ISLAMIC COUNTRIES
A t t a r S o k a k N o : 4 , 0 6 7 0 0 G O P , A n k a r a , T U R K E Y
T e l : + 9 0 - 3 1 2 - 4 6 8 6 1 7 2 ( 4 l i n e s ) F a x : + 9 0 - 3 1 2 - 4 6 7 3 4 5 8
E - m a i l : o i c a n k a r a @ s e s r i c . o r g W e b : w w w . s e s r i c . o r g

2
O I C O U T L O O K TRENDS IN INTERNATIONAL MERCHANDISE TRADE: A REVIEW
OF THE OIC MEMBER COUNTRIES
INTRODUCTION
The volume of merchandise trade among countries has been rapidly increasing in recent
two decades along with the tidal wave of globalization that began in the late 1980s. In this
respect, the growing levels of economic integration through the emergence of economic
blocks in addition to the increasing number of trade agreements around the world, the
formation of more flexible global production systems thanks to the developments in
information and telecommunication technologies accompanied by the proliferation of
multinational firms and foreign direct investments, and the improvements in modes of
transportation that have resulted in lower costs have been the major contributors to the
expansion in the global merchandise trade.
With these in mind,
estimates show that world
merchandise trade –
exports plus imports of
goods– amounted to US$
24.4 trillion in 2006,
more than 6-fold of the
1980 level of US$ 3.8
trillion (Figure 1). During
the period 1980-2006, the
second half of the 1980s
and the mid-1990s
witnessed booms while
the recent years also
recorded unprecedented
growth rates that seem to persist in the years to come.
This study presents the developments in the structure and patterns of international
merchandise trade of the member countries of the Organisation of the Islamic Conference
(OIC) for the period 2000 – 2006 that began with a global economic slowdown but ended
with a great resurgence. It should be noted that all the trade figures in this study are
expressed in current prices and cover only the “visible trade” –the exports and imports of
physical goods– leaving out the “invisible trade” that comprises expenditures on services,
property income payments, and transfer payments. On the other hand, exports are valued
at f.o.b. prices while imports are valued at c.i.f. prices.
In addition to the OIC level aggregation comprising all member countries, an aggregation
into sub-groups has also been employed in the study where necessary in order to better
reflect their situations: the Fuel Exporting Countries (FECs), major export gains of which
come from fuel, the Least Developed Countries (LDCs), as classified by the United
Nations, and the remaining ones as the Middle-Developed Countries (MDCs)1.
1 See Appendix 1 for this classification.
Figure 1: World Merchandise Trade
0
5
10
15
20
25
1980
1982
1984
1986
1988
1990
1992
1994
1996
1998
2000
2002
2004
2006
Trillion U
S$
-1
2
5
8
11
14
%
World Merchandise Trade
5-Year Compound Annual Grow th Rate (rhs)
Source: Estimates from IMF’s Direction of Trade
Statistics, December 2007.

3
Total Exports and Imports
Total exports of the OIC member countries was US$ 539 billion in 2000 and after a
decline in the following year, they showed an increasing trend and arose to US$ 1221
billion in 2006 (Figure 2). On the other hand, total imports also followed the same trend
in this period, reaching up to US$ 1010 billion in 2006 from its 2000 level of US$ 396
billion. The contraction of both exports and imports in 2001 was obviously due to the
global economic downturn experienced in 2000-2001, mainly induced by a sharp increase
in oil prices in 2000 (57%) but followed by a decline in the prices of all commodities
including oil (13.8%) in 2001 which all had an important effect on the global economic
performance at that time.
Although the 17 fuel-exporting
countries of the OIC account
for more than half of its total
exports, it is not
straightforward to argue that
they may have been benefited
from high oil prices of the year
2000 so as to generate an
increase in the total exports in
that year. Part of their export
earnings was, by nature, offset
by losses from decreased
demand for exports due to
economic recession experienced by their trading partners. Considering the negative
impacts also on the oil-importing members, it seems that the gain of the oil-exporting
countries provided by high oil prices was less than the loss of the oil-importing countries,
resulting in net negative effect on the total exports of the OIC. The signs of lower global
demand are also clear from the decrease in prices of all commodities in the following
year, which was also reflected as lower exports and imports as well.
As shown by Figure 3, the share of FECs in total exports of the OIC was 52.9% in 2000
and even higher in 2006 (57.3%), indicating that an increasing majority of the exports of
the OIC comes from these countries. At the other extreme, the 20 LDCs of the OIC
constituted only 1.9% and 2.1% of the total exports in the respective years. The remaining
countries that are classified as MDCs accounted for 45.3% of the total exports in 2000 but
this share decreased to 40.6% in 2006.
Figure 3: Distribution of Total OIC Exports by Groups of Countries:
2000 vs 2006 (%)
FEC
MDC
LDC
45.3
2000
52.9
1.9
FEC
MDC
LDC
57.3
40.6
2.1
2006
Source: SESRIC, BASEIND Statistical Database.
Figure 2: Total Exports and Imports
1250
1000
750
500
250
0
250
500
750
1000
1250
2000 2001 2002 2003 2004 2005 2006
Bill
ion U
S$
Export
Import
Source: SESRIC, BASEIND Statistical Database.

4
As for imports, it is clear from Figure 4 that the majority of imports of the OIC belong to
the MDCs, though their share fell from 2000 level of 64.2% to 56.4% in 2006. All of this
decrease was reflected in a boost in the share of the FECs from 30.7% to 38.7% as the
share of the LDCs also slightly decreased from 5.1% to 4.9%. Considering the
developments in exports and imports together, the shares of the FECs and the MDCs in
total trade of the OIC became almost equal in 2006 –48.9% and 47.7% respectively–
while these shares were 43.5% and 53.3% respectively in 2000.
Figure 4: Distribution of Total OIC Imports by Groups of Countries:
2000 vs 2006 (%)
FEC
LDCMDC
64.2
30.7
5.1
2000
FEC
MDC
LDC
56.4
38.7
4.9
2006
Source: SESRIC, BASEIND Statistical Database.
At the country level, Saudi Arabia was the leading exporter of the OIC with US$
190.2 billion of exports, constituting 15.6% of the total OIC exports in 2006 (Figure
5). Together with Malaysia, Indonesia, United Arab Emirates, and Turkey, the exports
of these five
countries accounted
for 54.2% of the
total OIC exports.
On the other hand,
Turkey with was the
leading importer of
the OIC US$ 139.5
billion of imports,
constituting 13.8%
of the total OIC
imports. Together
with the other four
countries, the top
five importer
countries accounted for 54.2% of the total OIC imports. Such a concentration of trade
in a few countries is a clear sign of the vast difference among the OIC member
countries in terms of economic size and level of development.
Trade Balance
Considering the period from 2000 to 2006, the trade balance of the OIC was always
positive (Figure 6). Given the downward conjuncture in the world economy in the
early 2000s, it decreased considerably to US$ 82.7 billion in 2002, compared to 2000
level of US$ 143 billion, but then turned to an increasing trend and reached up to US$
210.7 billion in 2006.
Figure 5: Top 5 Exporters and Importers (2006)
S. Arabia Malaysia Indonesia UAE Turkey0
20
40
60
80
100
120
140
160
180
200
Bill
ion U
S$
0
2
4
6
8
10
12
14
16
18
20
%
Export Import Share in Total OIC Exports (rhs) Share in Total OIC Imports (rhs)
Source: SESRIC, BASEIND Statistical Database.

5
The highest contribution to this
trade surplus came from the
FECs. The trade surplus of this
group reached up to US$ 308.9
billion in 2006, almost doubling
the 2000 level of US$ 163.3
billion despite the shrink in 2001
and 2002 down to US$ 94.6
billion (Figure 6). Surprisingly,
the MDCs turned out to have
improvement in the years of
slowdown in global economic
activity. Having a deficit of US$
10.3 billion in 2000, the MDCs created a surplus of US$ 7.3 billion in 2001. In the
following recovery period, however, these countries started to experience increasing
deficits that reached US$ 74.1 billion in 2006. On the other hand, the LDCs that had a
deficit of US$ 10 billion in 2000 continued to have increasing levels of deficits in the
following years to reach up to US$ 24.1 billion in 2006. Consequently, it is obvious
that, thanks to their high amount of surplus, it is the FECs that give direction to the trade
balance of the OIC as a whole.
The trend in the number of
countries with trade deficits
was parallel to the
developments in the trade
balance of the OIC. Overall,
there were 29 member
countries suffering trade
deficits in 2000 (Figure 7). This
number increased in the
following years to reach 37 in
2003. As of 2006, there were
34 member countries which
had trade deficits ranging from
US$ 67.7 million by Guinea-Bissau to US$ 54 billion by Turkey. At country-groups
level, the number of countries with trade deficits showed a parallel trend in all the
groups –an increase between 2000 and 2003, a decrease in 2004, and relatively stable
trend in the recent years (Figure 7). Among the 17 FECs, there was no country with
trade deficit in 2000, while three of them –Sudan, United Arab Emirates, and Yemen–
were experiencing trade deficits as of 2006. Actually, the trade balance of Sudan,
which is also classified by the United Nations as an LDC like Yemen, was always
negative in the period 2001-2006. As for the MDCs, 11 out of 19 countries had trade
deficits in 2000, and this number was 14 in the following three years before reaching
down to 12 in 2006. The unexpected trade surplus of this group in 2001 despite the
increasing number of countries with deficits was the result of the higher level of
contraction in deficits than in surpluses. On the other hand, among the 20 LDCs,
Guinea and Guinea-Bissau were the only countries with a positive trade balance both
in 2000 and 2001. In the next years, only Chad achieved to have a trade surplus, from
2004 to 2006.
Figure 6: Trade Balance
2000 2001 2002 2003 2004 2005 2006
-150
-100
-50
0
50
100
150
200
250
300
350
Bill
ion U
S $
FEC LDC MDC OIC Total
Source: SESRIC, BASEIND Statistical Database.
Figure 7: Countries with Trade Deficit
18 18 20 20 19 19 19
1114
14 1412 13 12
2 3
2 2 31
0
0
5
10
15
20
25
30
35
40
2000 2001 2002 2003 2004 2005 2006
Num
ber
of
Countr
ies
FEC
MDC
LDC
Source: SESRIC, BASEIND Statistical Database.

6
Figure 8A shows that Saudi Arabia was by far the top country with the largest trade
surplus of US$ 119.9 billion in 2006. It was followed by Malaysia, Libya, and Algeria
each with around US$ 30 billion of trade surplus. Four of the top five countries are from
the FECs. Moreover, the surplus of only Saudi Arabia was even more than the sum of the
trade deficits of all the member countries –US$ 111 billion– excluding Turkey, which
experienced the largest trade deficit in the OIC in 2006 (US$ 54 billion). The deficit of
Turkey was larger than the sum of the deficits of 28 member countries. Figure 8B shows
the other four countries as well as Turkey that had the largest trade deficits in 2006.
Figure 8: Top 5 Countries with the Highest Trade Surpluses and Deficits (2006)
A. Highest Trade Surpluses B. Highest Trade Deficits
Saudi A
rabia
Ma
laysia
Lib
ya
Alg
eria
Kuw
ait
0
30
60
90
120
Bill
ion U
S$
Lebanon
Mo
rocco
Pakis
tan
Egypt
Tu
rkey
0
10
20
30
40
50
60
Bill
ion U
S$
Source: SESRIC, BASEIND Statistical Database.
However, it was not only the change in the number of countries with deficit/surplus that
characterized the overall trade balance of the OIC but also the change in the size of these
deficits/surpluses. As shown earlier by Figure 6, both surpluses and deficits increased
remarkably in 2006 compared to 2000, but the faster growth of surpluses gave occasion to
the trade balance of the OIC to improve its 2000 level of + US$ 143 billion up to + US$
210.7 billion in 2006. However, the number of countries with trade deficit also increased
from 29 to 34 in this period. In this respect, Figure 9 enlightens an important aspect of the
change in the trade balance of the OIC that principally originated from the substantial and
rapid expansion of the global trade volume in the recent years. The comparison of
frequencies of net trade volumes between 2000 and 2006 for the member countries
revealed that the majority of countries formerly used to have quite small volumes of trade
balances –up to ±US$ 1 billion. However, the latter situation is that more countries with
higher deficits and more countries with even higher surpluses.
Figure 9: Dimensional Change in the Trade Balance*
0
2
4
6
8
10
12
14
16
-2500 -2000 -1500 -1000 -500 0 500 1000 1500 2000 2500 3000
Trade Balance (Billion US$)
Num
ber
of
Countr
ies
0.5-0.5-1-5-10< 1 5 10 20 >
OIC Trade Balance in 2006:
US$ 210.7 Billion
OIC Trade Balance in 2000:
US$ 143 Billion
2000
2006
Source: Source: SESRIC, BASEIND Statistical Database.

7
* For the horizontal axis, the data points reflect the intervals they fall in, not the actual volume.
As shown by Figure 9, the number of countries with trade deficit of less than US$ 500
million was 14 in 2000 but this number decreased to 8 in 2006. The other 6 countries
and the 5 new countries with deficit turned out to have larger deficits in 2006: 1 with
up to US$ 1 billion, 5 with up to US$ 5 billion, 3 with up to US$ 10 billion, and 2
with more than US$ 10 billion. On the other hand, the number of countries with trade
surplus of less than US$ 500 million was 7 in 2000 but this number decreased, as
well, to 1 in 2006. There was also a decrease in the number of countries which had a
surplus of US$ 0.5-1 billion (1 country), US$ 5-10 billion (2 countries), and US$ 10-
20 billion (3 countries). This was reflected such that 5 more countries gave deficits in
2006, 2 more countries increased their surpluses up to US$ 5 billion, and, most
importantly, 5 more countries had a surplus of more than US$ 20 billion. Briefly, the
result is that more losers with more loss vis a vis more winners with more gains.
Trade to GDP
Trade to GDP ratios are frequently used indicators to measure a country’s “openness”
or “integration” in the world economy, reflecting, to some extent, the foreign trade
policy of the country. Figure 10 presents the development of the total exports and
imports of the OIC as a percentage of its total GDP in the period from 2000 to 2006.
Accordingly, it is observed that the exports constituted 34.9% of the GDP in 2000
while this ratio increased up to 39.9% in 2006 despite the decline in 2001 and 2002.
On the other hand, the share of imports also increased from 25.6% to 33.0% in this
period, but without any interruption. This implies that the openness ratio (the sum of
exports and imports divided by
GDP) of the OIC increased from
2000 level of 60.5% to 72.9% in
2006, indicating fairly high
openness and integration in the
world economy.
On the other hand, the trade
balance to GDP ratio presented
by Figure 10 shows that the
share of net foreign
expenditures/demand (exports
minus imports) in the GDP of
the OIC decreased from 9.3% to
6.9% in the period 2000-2006,
though it was always positive
due mainly to the high surpluses
of the FECs. The decrease in the trade balance during this period can be explained by
higher growth rates of imports than exports, as described below.
Growth Rates and World Market Shares
During the recession years of the early 2000s, the annual growth rate of both exports
and imports of the OIC showed a considerable decline, and even a negative growth in
2001 (Figure 11). While the annual growth rate of exports was %33.8 in 2000, there
was a 7.7% decrease in 2001. Moreover, the growth rate in 2002 was only 1.8%,
which was insufficient to bring the exports to their 2000 level. However, in the
Figure 10: Trade to GDP Ratios
0
10
20
30
40
50
60
70
80
2000 2001 2002 2003 2004 2005 2006
%
Export/GDP
Import/GDP
Trade Balance/GDP
Trade/GDP
Source: SESRIC, BASEIND Statistical Database.

8
following two years, there was a significant increase in the exports, and, despite the
declining trend in the recent two years, it still remained over 20% in 2006. On the
other hand, the annual growth rate of imports was also negative, but less than that of
exports (-3.2%) in 2001 while it was 12.4% in 2000. Unlike in the case of exports, the
10.5% growth in imports in 2002 was high enough to exceed the 2000 level of
imports. Given the high growth rates also in the following two years, it is obvious that
the import performance of the OIC was better than that of export in 2001, 2002, and
2004, which clearly explains the decline in the trade balance in those years (Figure
10).
Figure 11: Annual Growth of Exports and Imports and the World Market Share
(%)
-10
-5
0
5
10
15
20
25
30
35
40
45
2000 2001 2002 2003 2004 2005 2006
0
1
2
3
4
5
6
7
8
9
10
11
Growth of Exports Growth of Imports
World Export Market Share (rhs) World Import Market Share (rhs)
Source: SESRIC, BASEIND Statistical Database; IMF, Direction of Trade Statistics, December 2007.
The growth performance of exports and imports also gave direction to the course of world
market share of the OIC. As displayed by Figure 11, the exports of the OIC accounted for
8.4% of world exports in 2000, but this rate decreased down to 7.9% in 2002. Along with
the recovery, world export market share of the OIC improved in the following years and
reached up to 10.2% in 2006. The imports of the OIC, on the other hand, constituted 6%
of the world imports in 2000, and with a steady growth path, it reached up to 8.2% in
2006. Taking exports and imports together, the OIC member countries as a whole
accounted 9.3% of world trade in 2006, compared to 2000 level of 7.2%.
Figure 12: World Market Shares, 2006
EU15
USAChina
Japan
Canada
Other
OIC
34.6
10.2
8.78.1
5.4
3.2
29.8
Exports
EU15
China
Japan
Canada
Other
USA
OIC
33.9
15.5
8.26.4
4.7
3.1
28.
3
Imports
Source: IMF, Direction of Trade Statistics, December 2007.
9
Despite the improvement in the OIC member countries’ share in the world exports
and imports, it appears that there is still a long way ahead to go, when compared to
leading economies in the world. As Figure 12 presents, the world export market share
of the OIC lags well behind that of the 15 members of the European Union (EU15).
Moreover, USA and China each have a share of more than 8% in world exports. As
for imports, EU15 also has almost as high a market share as its export share, quite
higher than the share of the OIC. Furthermore, the share of the USA alone is also
higher than that of the OIC. Of course, lower import shares cannot be interpreted as a
disadvantage unless the domestic economies are heavily dependant on imports.
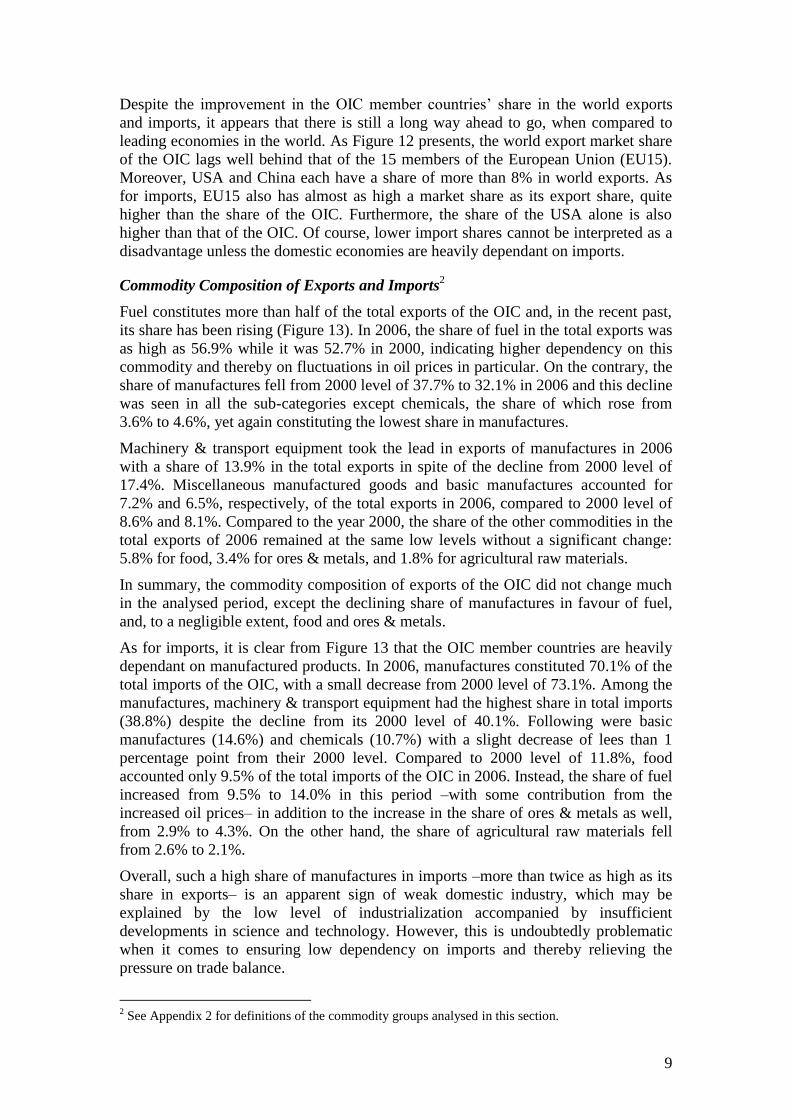
Commodity Composition of Exports and Imports2
Fuel constitutes more than half of the total exports of the OIC and, in the recent past,
its share has been rising (Figure 13). In 2006, the share of fuel in the total exports was
as high as 56.9% while it was 52.7% in 2000, indicating higher dependency on this
commodity and thereby on fluctuations in oil prices in particular. On the contrary, the
share of manufactures fell from 2000 level of 37.7% to 32.1% in 2006 and this decline
was seen in all the sub-categories except chemicals, the share of which rose from
3.6% to 4.6%, yet again constituting the lowest share in manufactures.
Machinery & transport equipment took the lead in exports of manufactures in 2006
with a share of 13.9% in the total exports in spite of the decline from 2000 level of
17.4%. Miscellaneous manufactured goods and basic manufactures accounted for
7.2% and 6.5%, respectively, of the total exports in 2006, compared to 2000 level of
8.6% and 8.1%. Compared to the year 2000, the share of the other commodities in the
total exports of 2006 remained at the same low levels without a significant change:
5.8% for food, 3.4% for ores & metals, and 1.8% for agricultural raw materials.
In summary, the commodity composition of exports of the OIC did not change much
in the analysed period, except the declining share of manufactures in favour of fuel,
and, to a negligible extent, food and ores & metals.
As for imports, it is clear from Figure 13 that the OIC member countries are heavily
dependant on manufactured products. In 2006, manufactures constituted 70.1% of the
total imports of the OIC, with a small decrease from 2000 level of 73.1%. Among the
manufactures, machinery & transport equipment had the highest share in total imports
(38.8%) despite the decline from its 2000 level of 40.1%. Following were basic
manufactures (14.6%) and chemicals (10.7%) with a slight decrease of lees than 1
percentage point from their 2000 level. Compared to 2000 level of 11.8%, food
accounted only 9.5% of the total imports of the OIC in 2006. Instead, the share of fuel
increased from 9.5% to 14.0% in this period –with some contribution from the
increased oil prices– in addition to the increase in the share of ores & metals as well,
from 2.9% to 4.3%. On the other hand, the share of agricultural raw materials fell
from 2.6% to 2.1%.
Overall, such a high share of manufactures in imports –more than twice as high as its
share in exports– is an apparent sign of weak domestic industry, which may be
explained by the low level of industrialization accompanied by insufficient
developments in science and technology. However, this is undoubtedly problematic
when it comes to ensuring low dependency on imports and thereby relieving the
pressure on trade balance.
2 See Appendix 2 for definitions of the commodity groups analysed in this section.

10
Figure 13: Composition of Exports and Imports: 2000 vs. 2006
Manufactures
37.7%
Fuel
52.7%
Ores & Metals
2.4%
Food
5.4%
Agricultural Raw
Materials
1.8%
Machinery &
Transport Eqp.
17.4%
Misc. Manf. Goods
8.6%
Basic Manufactures
8.1%
Chemicals
3.6%
Chemicals
4.6%
Misc. Manf. Goods
6.5%
Basic Manufactures
7.2%
Machinery &
Transport Eqp.
13.9%
Agricultural Raw
Materials
1.8%
Food
5.8% Ores & Metals
3.4%
Fuel
56.9% Manufactures
32.1%
Food
11.8%
Fuel
9.5%
Manufactures
73.1%
Agricultural Raw
Materials 3%
Ores & Metals
2.9%
Machinery &
Transport Eqp.
40.1%
Basic Manufactures
14.7%
Misc. Manf. Goods
7.0%
Chemicals
11.2%
Food
9.5%
Fuel
14.0%
Manufactures
70.1%
Agricultural Raw
Materials 2%
Ores & Metals
4.3%
Machinery &
Transport Eqp.
38.8%
Basic Manufactures
14.6%
Misc. Manf. Goods
5.9%
Chemicals
10.7%
E
X
P
O
R
T
I
M
P
O
R
T
2
0
0
0
2
0
0
6
2
0
0
0
2
0
0
6
Source: Estimates from United Nations Commodity Trade Statistics Database (UN COMTRADE).

11
Further analysis into groups of countries reveals a better picture of the commodity composition of
trade for countries with similar economic structure or level of development. In this context,
Figure 14 presents the commodity composition of exports and imports of the year 2006 for OIC
member countries grouped into FECs, MDCs, and LDCs.
In this picture, the situation of the FECs stands out as a particular case, for their fuel exports
accounted for almost 90% of their total exports of 2006, leaving only around 10% for exports of
all other commodities. On the other hand, more than three-quarters (77.1%) of their imports
consisted of manufactures. Briefly, the trade of the FECs is concentrated on selling fuel in
exchange for other commodities, mainly manufactured products.
As for the MDCs, exports are proportionate to imports in terms of the relative shares of
commodities; manufactures taking the lead, followed by fuel, food, agricultural raw materials,
and ores & metals. In this structure of 2006, Manufactures accounted for 58% of their total
exports and 68.8% of their total imports. Unlike in the case of the FECs, the concentration in
manufactures in both exports and imports of the MDCs may be due to intra-industry trade –
simultaneous imports and exports of differentiated but similar products.
In a parallel manner, fuel constituted 23.2% of the total exports and 16.5% of the total imports of
the MDCs. Of course, this cannot be simply explained by product differentiation but by the fact
that there are fuel exporting countries –though it is not their primary export commodity– as well
as fuel importing countries in the group of MDCs. On the other hand, food, ores & metals, and
agricultural raw materials constituted, in turn, 10.1%, 5.4%, and 3.3% of their total exports and
7.7%, 4.6%, and 2.5% of their total imports.
The exports of the LDCs are more heterogeneous compared to the exports of the other two
groups. The highest share in exports, which belongs to manufactures, is 33.5%. Moreover, the
shares of food (24.6%), ores & metals (22.7%), and agricultural raw materials (6.8%) in their
exports are, as expected, higher than in the case of the other two groups. Under the current
conditions, these countries have no other choice than relying on their natural resources and
agricultural products. Although manufactures account for 55.5% of their imports, fuel (23.1%)
and food (19.1%) also constitute an important portion of their total imports. Given these ratios
and considering the rapid increase in oil prices and the recent crisis experienced in food prices,
obviously, it is the group of LDCs that most suffers.

12
3.3%
10.1%
23.2%
5.4%
58.0%
89.2%
8.2%
1.3%
1.1%
0.2%
7.7%
16.5%
68.8%
4.6%
2.5%
19.1%
23.1%
1.4%
0.9%
55.5%
6.8%
24.6%
12.4%
22.7%
33.5%
Figure 14: Composition of Exports and Imports in Groups of Countries (2006)
E
X
P
O
R
T
I
M
P
O
R
T
Source: Estimates from United Nations Commodity Trade Statistics Database (UN COMTRADE).
FECs 0.9%
12.4%
6.0%
3.5%
77.1%
MDCs
LDCs
6.8%
24.6%
12.4%
22.7%
33.5%Agricultural Raw Materials Food
Fuel Manufactures
Ores & Metals

13
Concluding Remarks
Recent developments in the world economy characterized by tremendous globalization with
higher levels of economic integration and developments in information and telecommunication
technologies have brought about many challenges and opportunities in all aspects of life,
including international trade in particular. Parallel to the trends in world merchandise trade, both
exports and imports of the OIC member countries increased rapidly in recent years after an
interruption in 2001 due to the global economic slowdown in the early 2000s accompanied by
fluctuations in oil prices.
More than half of the total exports of the OIC belong to the group of FECs, and this share has
been steadily increasing in recent years. Their share in total imports, on the other hand, has also
been on the rise to the detriment of the group of MDCs, whose share accounted for almost two-
third of the total imports in 2000. These developments point out increasing weight of the FECs in
total trade of the OIC.
On the contrary, considering that the group of LDCs –consisted of 20 members– accounted for
only 3.4% of the total trade of the OIC in 2006 with only 0.2 percentage point increase from its
2000 level, the development in these countries obviously remained quite limited. However, the
historically high share of primary goods in their exports along with high fuel imports has
inevitably been rendering them vulnerable to fluctuations in fuel and commodity prices in the
international market.
Despite the increasing number of countries suffering trade deficits and the accumulating level of
these deficits –particularly from the LDCs and MDCs– in the last few years, overall trade balance
of the OIC has been positive and even increasing since 2002 as a result of high surpluses of the
FECs due to fuel exports that constitute almost 90% of their total exports. In fact, the trade
surplus of only three of the FECs was enough to meet the deficits of all 34 members in 2006,
pointing out huge gaps among the member countries in terms of their trade performance.
Given the increasing share of trade in GDP up to 73% in 2006 besides the rising share in global
trade, the economy of the OIC appears to be more open and integrated in the global economy.
However, the fact that manufactures account for only one-third of the exports (the remaining is
mostly fuel and some other primary products) compared to three-forth of the imports cast a
shadow on this accomplishment since such a structure is a sign of industrial dependency on
imports. Although this is more evident in the case of fuel exporters, the other member countries
also should pay attention to their industrialization process if they are to relieve the pressure on
their trade balance, reduce their dependency on other countries, and close the gap with the
industrialized nations of today.

14
Appendix 1: Aggregation of Countries
Fuel Exporting Countries (FECs)
Algeria, Azerbaijan, Bahrain,
Brunei, Gabon, Iran, Iraq, Kuwait,
Libya, Nigeria, Oman, Qatar, Saudi
Arabia, Sudan*, Turkmenistan,
United Arab Emirates, Yemen*.
Least Developed Countries (LDCs)
Afghanistan, Bangladesh, Benin,
Burkina Faso, Chad, Comoros,
Djibouti, Gambia, Guinea, Guinea-
Bissau, Maldives, Mali, Mauritania,
Mozambique, Niger, Senegal, Sierra
Leone, Somalia, Togo, Uganda.
Middle-Developed Countries (MDCs)
Albania, Cameroon, Cote d'Ivoire,
Egypt, Guyana, Indonesia, Jordan,
Kazakhstan, Kyrgyz Republic,
Lebanon, Malaysia, Morocco,
Pakistan, Palestine**, Suriname,
Syria, Tajikistan, Tunisia, Turkey,
Uzbekistan.
Source: SESRTCIC (2007), Annual Economic Report on the OIC Countries 2007,
[http://www.sesric.org/research_reports.php].
* Classified by the United Nations among the LDCs but included among the FECs for the
purpose of this study.
** For consistency reasons, national data obtained from the country has not been
included in the analysis.

15
Appendix 2: Definitions of the Commodity Groups
Agricultural Raw Materials
Correspond to the commodities in
SITC section 2 (crude materials
except fuels) excluding divisions 22,
27 (crude fertilizers and minerals
excluding coal, petroleum, and
precious stones), and 28
(metalliferous ores and scrap).
Food
Corresponds to the commodities in
SITC section 0 (food and live
animals), 1 (beverages and tobacco),
and 4 (animal and vegetable oils and
fats) and division 22 (oil seeds, oil
nuts, and oil kernels).
Fuel Corresponds to the commodities in
SITC section 3 (mineral fuels).
Manufactures
Correspond to the commodities in
SITC sections 5 (chemicals), 6
(basic manufactures), 7 (machinery
and transport equipment), and 8
(miscellaneous manufactured
goods), excluding division 68
(nonferrous metals).
Ores & Metals Correspond to the commodities in
SITC divisions, 27, 28, and 68.
Source: World Bank (2007), World Development Indicators 2007, p.205, 209.

Statistical, Economic and Social Research and Training Centre
for Islamic Countries (SESRIC)
Attar Sokak No. 4, 06700 GOP, Ankara, TURKEY
Tel: (90-312) 468 6172 (4 lines) Fax: (90-312) 468 5726
E-mail: [email protected] Web: www.sesric.org