From import substitution to export diversification in Colombia
92
econstor Make Your Publications Visible. A Service of zbw Leibniz-Informationszentrum Wirtschaft Leibniz Information Centre for Economics Wogart, Jan Peter Working Paper — Digitized Version From import substitution to export diversification in Colombia Kiel Working Paper, No. 31 Provided in Cooperation with: Kiel Institute for the World Economy – Leibniz Center for Research on Global Economic Challenges Suggested Citation: Wogart, Jan Peter (1975) : From import substitution to export diversification in Colombia, Kiel Working Paper, No. 31, Kiel Institute of World Economics (IfW), Kiel This Version is available at: http://hdl.handle.net/10419/46882 Standard-Nutzungsbedingungen: Die Dokumente auf EconStor dürfen zu eigenen wissenschaftlichen Zwecken und zum Privatgebrauch gespeichert und kopiert werden. Sie dürfen die Dokumente nicht für öffentliche oder kommerzielle Zwecke vervielfältigen, öffentlich ausstellen, öffentlich zugänglich machen, vertreiben oder anderweitig nutzen. Sofern die Verfasser die Dokumente unter Open-Content-Lizenzen (insbesondere CC-Lizenzen) zur Verfügung gestellt haben sollten, gelten abweichend von diesen Nutzungsbedingungen die in der dort genannten Lizenz gewährten Nutzungsrechte. Terms of use: Documents in EconStor may be saved and copied for your personal and scholarly purposes. You are not to copy documents for public or commercial purposes, to exhibit the documents publicly, to make them publicly available on the internet, or to distribute or otherwise use the documents in public. If the documents have been made available under an Open Content Licence (especially Creative Commons Licences), you may exercise further usage rights as specified in the indicated licence. www.econstor.eu
-
Upload
khangminh22 -
Category
Documents
-
view
0 -
download
0
Transcript of From import substitution to export diversification in Colombia
econstorMake Your Publications Visible.
A Service of
zbwLeibniz-InformationszentrumWirtschaftLeibniz Information Centrefor Economics
Wogart, Jan Peter
Working Paper — Digitized Version
From import substitution to export diversification inColombia
Kiel Working Paper, No. 31
Provided in Cooperation with:Kiel Institute for the World Economy – Leibniz Center for Research on Global EconomicChallenges
Suggested Citation: Wogart, Jan Peter (1975) : From import substitution to export diversificationin Colombia, Kiel Working Paper, No. 31, Kiel Institute of World Economics (IfW), Kiel
This Version is available at:http://hdl.handle.net/10419/46882
Standard-Nutzungsbedingungen:
Die Dokumente auf EconStor dürfen zu eigenen wissenschaftlichenZwecken und zum Privatgebrauch gespeichert und kopiert werden.
Sie dürfen die Dokumente nicht für öffentliche oder kommerzielleZwecke vervielfältigen, öffentlich ausstellen, öffentlich zugänglichmachen, vertreiben oder anderweitig nutzen.
Sofern die Verfasser die Dokumente unter Open-Content-Lizenzen(insbesondere CC-Lizenzen) zur Verfügung gestellt haben sollten,gelten abweichend von diesen Nutzungsbedingungen die in der dortgenannten Lizenz gewährten Nutzungsrechte.
Terms of use:
Documents in EconStor may be saved and copied for yourpersonal and scholarly purposes.
You are not to copy documents for public or commercialpurposes, to exhibit the documents publicly, to make thempublicly available on the internet, or to distribute or otherwiseuse the documents in public.
If the documents have been made available under an OpenContent Licence (especially Creative Commons Licences), youmay exercise further usage rights as specified in the indicatedlicence.
www.econstor.eu

Kiele'r ArbeitspapiereKiel Working Papers
Working Paper No. 31
FROM IMPORT SUBSTITUTION TO
EXPORT DIVERSIFICATION IN COLOMBIA
by
Jan Peter| Wogart
Institut fiir Wfeltwirtschaft an der Universitat Kiel

Kiel Institute of World Economics
Department IV
2300 Kiel, Diis ternbrooker Weg 120
Working Paper No. 31
FROM IMPORT SUBSTITUTION TO
EXPORT DIVERSIFICATION IN COLOMBIA
by
Jan PeteriWogart
July 1975
Kiel Working Papers are preliminary papers written by staff
members of the Kiel Institute of World Economics. Respon-
sibility for contents and distribution rests with the author.
Critical comments and suggestions for improvement are
welcome. Quotations should be cleared with the author.

A92 315 7!
FROM IMPORT SUBSTITUTION TO EXPORT DIVERSIFICATION IN COLOMBIA*
INTRODUCTION
The recent surge of industrial exports from some Latin American
countries has prompted a number of studies which have examined the new
outward-looking strategies of a few nations such as Brazil, Mexico and
Argentina. There are, however, at least two characteristics which do
not apply to most other countries of the Southern Hemisphere of the
Americas. First, export diversification in the large nation states
began only after import substitution had run its course and seemed to
be exhausted. Secondly, in spite of their importance for the balance
of payments, exports contribute a relatively small part to the forma-
tion of the gross national products in these countries. Hence indus-
trialization will depend on the expansion of domestic markets.
This situation is already quite different in the Andean countries,
where import substitution industrialization was not only hampered by
small and fragmented markets but also by lower per capita income and
more widespread poverty. To overcome this handicap Chile, Bolivia,
Peru, Ecuador, Colombia and later Venezuela have joined in the Andean
Common Market. Simultaneously they have promoted industrial exports
the results of which have been modest except in the case of Colombia.
Unless one includes Peru's fishmeal into industrial exports, only Chile
and Colombia have been able to raise the share of manufactured goods
in total exports beyond 10 %. But whereas industrial exports' share
has been falling considerably in Chile in the last few years, Colombia
was able to raise that share from less than 2 % in 1960 to over 15 %
in 1973.2
This paper reports research undertaken in the "SonderforschungsbereichMr. 86, Weltwirtschaft und Internationale Wirtschaftsbeziehungen(Kiel/Hamburg)", with financial support provided by the DeutscheForschungsgemeinschaft. I am grateful to J.B. Donges and S. Heldt forhelpful comments on an earlier draft.

- 2 -
There is more than just the successful beginning of export diver-
sification, which makes a study of Colombia's industrialization process
worthwhile. Colombia represents a good sample of a typical Latin
American country: with a rapidly growing population of about 25
million in 1975, and a per capita income of nearly US $ 400, which is
near the average per capita income of total Latin America, it suffers
from high rates of un- and underemployment as well as substantial
income inequalities. Furthermore, Colombia has been heavily dependent
on one major export crop, - coffee - the price fluctuations of which
are still causing substantial disturbances in the whole economy,
although coffee's share in total exports has fallen from over 80 % in
1953/54 to less than 50 % in 1973/74.
It is then the purpose of this study to examine Colombia's indus-
trialization process and its relationship to the development of the
external sector. More specifically^ it will be attempted to find some
answers to the following questions:
Which were the major causes and consequences of Colombia's indus-
trialization drive in the 1930s and 40s?
What kind of industrial pattern emerged during the import sub-
stitution process of the post-war era?
How was the export diversification program conceived and
implemented and what were its effects on the balance-of-payments
and the price level as well as on industrial growth and employ-
ment?
Consequently the essay will be divided into three parts. First,
we will look into the major expansion of traditional industries, which
followed the collapse of coffee prices during the early years of the
Great Depression, and the beginning of import substitution in the early

- 3 -
post-war years. Between 1945 and 1953 coffee prices boomed, facilitating
modernization and expansion of industry. Import substitution indus-
trialization became both more urgent and necessary again, once the
foreign exchange reserves got scarce in the late Fifties and Sixties.
Progress and problems of this period will be examined in the second
part. The third section will discuss a different response of policy
makers to the foreign exchange constraint; it will analyze the major
tools they have used to promote non-traditional exports in general and
manufactured exports in particular. This will be followed by an
analysis of the effects the export expansion had on the major variables
of the Colombian economy. A brief outlook towards the future prospects
of the industrial export strategy will conclude the essay.

I. External Shocks and the Beginning of Colombian Industrialization
It has long been the contention of the "structuralist" school of
thought that Latin America's specialization in international trade as
a supplier of raw materials, foodstuffs, metals, and fuels has been3
disadvantageous to its own economic development. Not only did the
terms of trade allegedly move against raw material producers, any
attempt of industrialization was made difficult, if not impossible,
by the laissez-faire attitude of policy-makers around the world, who
favored specialization according to comparative advantage.
19th century Colombia fits neatly into this pattern. The first
industrialization attempt between 1821 and 1845, which had been
encouraged by moderately protective tariffs and the granting of
limited monopoly privileges, was soon to be abandoned when coffee proved4to be a profitable export cash crop after 1365. The revolution in
maritime and land transportation, together with rapid industrialization
in Europe and North America, created a rising demand for tropical
products. In return, industrial goods from the advanced nations now
substituted whatever domestic manufactures had been produced in
Colombia before.
The dominance of coffee with its dependence on relatively few
foreign markets were to remain in the 20th century as reflected in Table 1,
but industrialization got under way when the first shocks of the Great
Depression and later World War II interrupted the previously expanding
flows of international trade.

Table 1
Value, Composition and Distr ibution of Colombian Exports
Years
1925-1929
1930-1934
1935-1939
1940-1944
1945-1949
1950-1954
1955-1959
1960-1964
1965-1969
1970-1972
Total ValueMill. US $
108.0
74.2
78.0
99.5
239.9
532.2
585.6
513.6
586.4
751.5
a inc ludes : nontnonetary goldwhich averaged $ 50 mi l l .
b195O-1953. - C1958-1962 -
CoffeeExports %
70.9
67.8
64.4
71.8
76.2
78.5
72.8
65.4
63.8
59.7
(between ?per year in
d 1973-74.
PetroleumExports %
14.2
20.5
23.3
19.2
15.2
13.6
13.5
13.9
10.7
2.6
10-15 mi l l ,the '50s and
BananasExports
6.1
7.0
6.1
1.4
1.7
%
7
13
20
25
37
.9
.7
.7
.5
.7
Othersa
Exports %
8
4
6
7
6
per year) and sincewas estimated to be
.8
7
2
6
9
Exports toUS %
80.2
I 65.5
• 7 9 . 1
8 0 . 8 b
6 3 . 7 C
41.8
35 . «d
1955 estimate foi> around j5 25 mill
Exports toEurope %
12.9
20.7
4 . 3
9.7 b
28. l c
42.7
34.5
ExportsLatin
Americai
4.7
1.0
3.2
1.4b
1.6C
6 .8
20.9
* unrecorded border. per year in the '
to
%
Exports toOther
Countries %
2.1
12.8
13.4
8.0b
6.6C
8.7
9.5
t rade ,60s. -
Source: 1925-1949 from United Nations, ECLA, Analyses and Projections of Economic Development, I I I . The Economic Developmentof Colombia, New York 1955. For 1950-1968 Internat ional Bank for Eeconstruction and Development, Economic Growthof Colombia, Baltimore 1972. Data for d i s t r ibu t ion of exports from DANE, Boletin Mensuel de E s t a t i s t i c a .

- 6 -
In 1915 it was estimated that there existed only 121 industrial
firms with a total capital of US # 12.4 m. Although these figures
probably do not include a great number of small enterprises in the
food-processing industry, the first more reliable information in the
mid-twenties represents a similar picture. In 1925 the manufacturing
sectors' contribution to total gross domestic product was 7.1 % out of
which over 50 % came from food-processing industries, such as threshing
of coffee and cereals as well as sugar mills and refineries. After
industrial production had expanded by an annual average of 4.4 2,
between 1925 and 1929, it started to accelerate to 8 'I in the Thirties
and after a brief dip during World War II the growth rate climbed to
nearly 10 % between 1945 and 1953. The share of manufacturing in
total gross domestic product fell slightly during the first two years
of the Depression, but doubled from 6.1 Z in 1931 to 12.6 % at the end
of World War 11^
There seems to be then some evidence that adverse shocks may
induce particularly favorable circumstances for rapid industrialization
in relatively backward countries. This has indeed been a major thesis
of several Latin American economists (such as Furtado and Kafka), who
have maintained that the sudden decrease in foreign demand during the
Depression, which left the raw material producers to either cut their
prices, their quantities, or both, had a positive effect on economic
development and on industrialization in Latin America because it
lessened its dependence on foreign trade by redistributing income from
the traditional agricultural to the modern industrial sector and - due
to the drastic cutback of consumer good imports - shifted consumer and
business preferences from consumption to saving and investment.
- 7 -
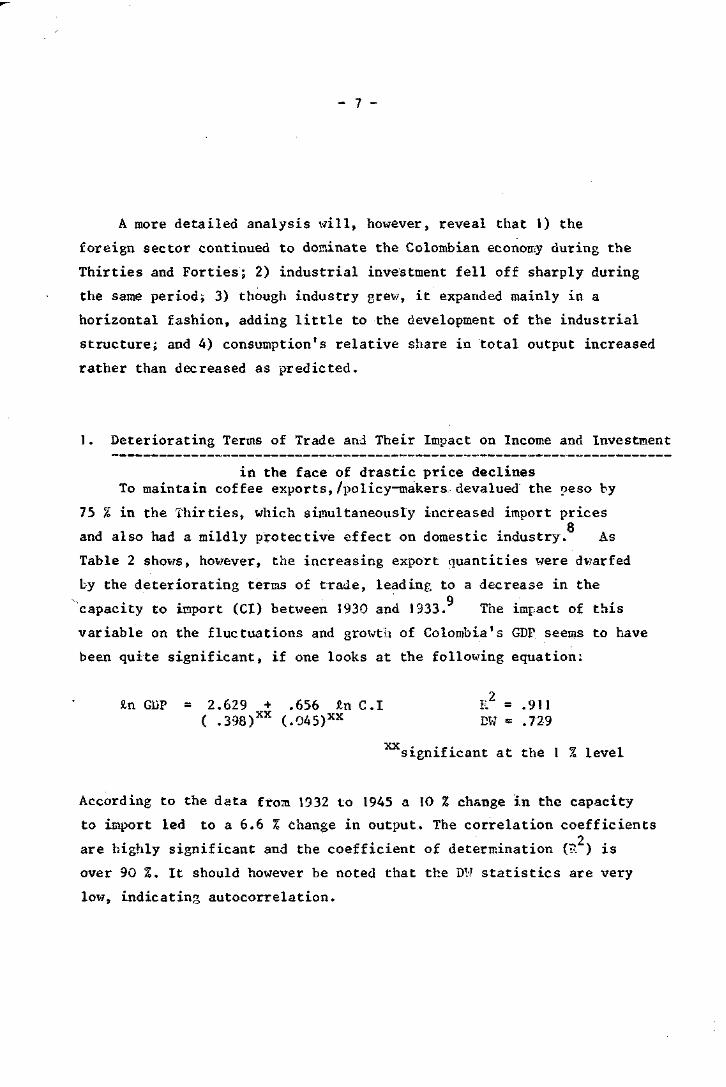
A more detailed analysis will, however, reveal that 1) the
foreign sector continued to dominate the Colombian economy during the
Thirties and Forties; 2) industrial investment fell off sharply during
the same period; 3) though industry grew, it expanded mainly in a
horizontal fashion, adding little to the development of the industrial
structure; and 4) consumption's relative share in total output increased
rather than decreased as predicted.
1. Deteriorating Terms of Trade and Their Impact on Income and Investment
in the face of drastic price declinesTo maintain coffee exports,/policy-makers devalued the peso by
75 % in the Thirties, which simultaneously increased import pricesQ
and also had a mildly protective effect on domestic industry. As
Table 2 shows, however, the increasing export quantities were dwarfed
by the deteriorating terms of trade, leading to a decrease in the9
capacity to import (CI) between 1930 and 1333. The impact of this
variable on the fluctuations and growth of Colombia's GDP seems to have
been quite significant, if one looks at the following equation;
In GDP = 2.629 + .656 Jin C.I E2 = .911( .398)XX (.Q45)xx DW = .729
significant at the 1 % level
According to the data from 1932 to 1945 a 10 % change in the capacity
to import led to a 6.6 % change in output. The correlation coefficients2
are highly significant and the coefficient of determination (R ) is
over 90 %. It should however be noted that the DW statistics are very
low, indicating autocorrelation.
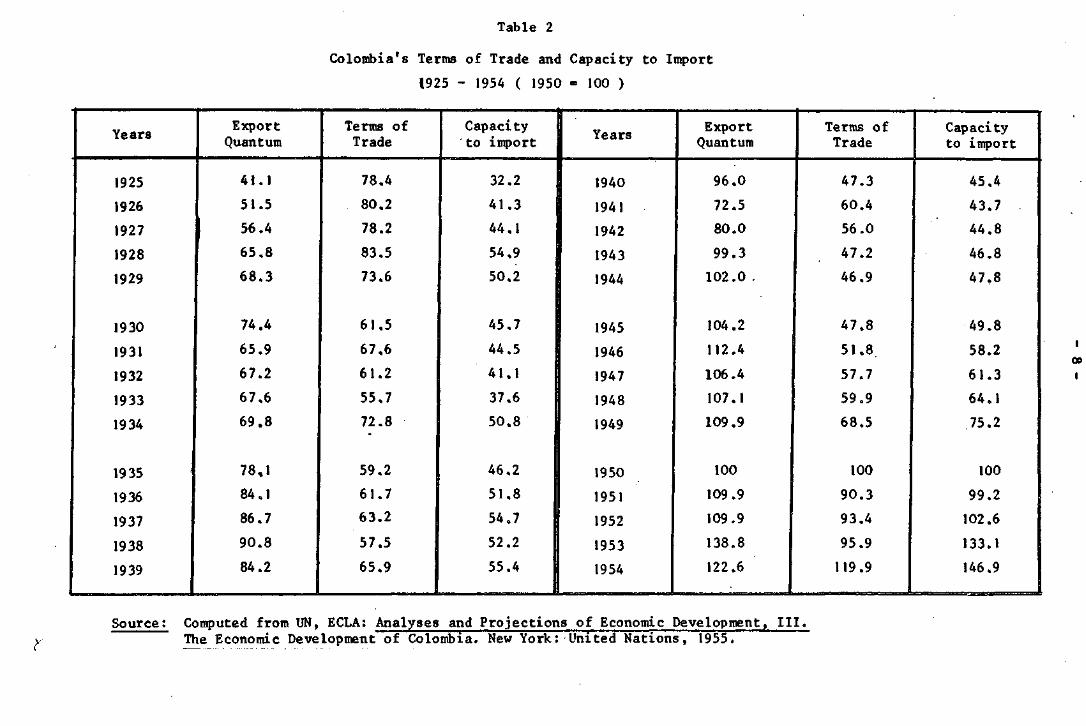
Table 2
Colombia's Terms of Trade and Capacity to Import
»925 - 1954 ( 1950 - 100 )
Years
1925
1926
1927
1928
1929
1930
1931
1932
1933
1934
1935
1936
1937
1938
1939
ExportQuantum
41.1
51.5
56.4
65.8
68.3
74.4
65.9
67.2
67.6
69.8
78,1
84.1
86.7
90.8
84.2
Terms ofTrade
78.4
80.2
78.2
83.5
73.6
61.5
67.6
61.2
55.7
72.8
59.2
61.7
63.2
57.5
65.9
Capacity'to import
32.2
41.3
44.1
54.9
50.2
45.7
44.5
41.1
37.6
50.8
46.2
51.8
54,7
52.2
55.4
Years
1940
1941
1942
1943
1944
1945
1946
1947
1948
1949
1950
1951
1952
1953
1954
ExportQuantum
96.0
72.5
80.0
99.3
102.0 ,
104.2
112.4
106.4
107.1
109.9
100
109.9
109.9
138.8
122.6
Terms ofTrade
47.3
60.4
56.0
47.2
46.9
47.8
51.8
57.7
59.9
68.5
100
90.3
93.4
95.9
119.9
Capacityto import
45.4
43.7
44.8
46.8
47,8
49.8
58.2
61.3
64.1
75.2
100
99.2
102.6
133.1
146.9
Source: Computed from UN, ECLA: Analyses and Projections of Economic Development, I I I .The Economic Development of Colombia. New York: United Nations, 1955.

The alleged changes in preferences from consumption to investment
and a shift of capital expenditures from the traditional to the modern
sector are not proven by the available data. Consuinption1 s share in
total GDP rose from 78 % between 1925 and 1929 to 89 % in the following
time period, averaging 84 % in the late Thirties. Whereas the growth
rate of per capita income shows a sharp decline from annual increases
of 4.6 % to 0.8 % in the Depression years and continuing at 0.8 %
until 1945, per capita consumption which had been rising at 2.1 %
annually kept increasing at 1.4 % between 1929 and 1938, becoming only
negative during the War years, when the problem of foreign exchange
scarcity turned into a problem of procuring foreign commodities both
in the producer and consumer sector.
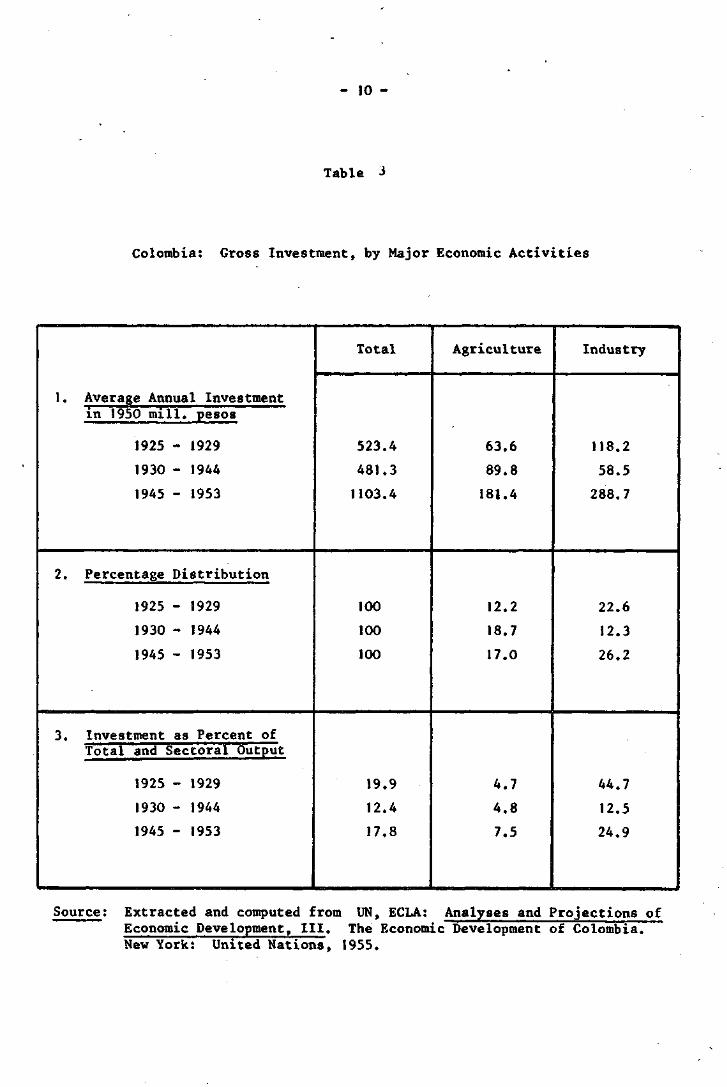
Industrial investment fell from 151 m. pesos in 1928 to less than
50 m. pesos during the Depression years (1930-37) and reached the
1928 figure only again in 1945. Investment in agriculture declined
less, from 80 m. pesos to an averag2 of 60 m. pesos reaching its 1928
mark already in 1938. The figures in Table 3 confirm the foregoing
statistics: industrial investment was badly hurt by the adversities
of Depression and IJsr, mainly because it depended critically on
imports of foreign capital goods, for which there was insufficient
foreign exchange during the Depression and which were in short supply
during World War II.
- 10 -
Table 3
Colombia: Gross Investment, by Major Economic Activities
1. Average Annual Investmentin 1950 mill, pesos
1925 - 1929
1930 - 1944
1945 - 1953
2. Percentage Distribution
1925 - 8929
1930 - 1944
1945 - 1953
3. Investment as Percent ofTotal and Sectoral Output
1925 - 1929
1930 - 1944
1945 - 1953
Total
523.4
481.3
1103.4
100
100
100
19.9
12.4
17.8
Agriculture
63.6
89.8
181.4
12.2
18.7
17.0
4.7
4.8
7.5
Industry
118.2
58.5
288. 7
22.6
12.3
26.2
44.7
12.5
24.9
Source; Extracted and computed from UN, ECLA: Analyses and Projections ofEconomic Development, III. The Economic Development of Colombia.New York: United Nations, 1955.

- 11 -
2. The Industrialization Pattern in the 30s and 40s
With respect to the diversification of the Colombian economy
between the Thirties and the Fifties the data of Table 4, which combine
the structure of national manufacturing with the participation of
imports in total industrial output show that industry remained
dominated by non-durable consumer goods industries, the share of which
was still at 68 % in the early Fifties. Durable consumer goods and
capital goods industries which combined to 8.4 % of the total industrial
output in 1937-39 managed to raise that share by a little over 1 % at
the end of World War II, reaching 12.6 % in the early 1950s. These
branches remained dominated by imported goods, the share of which were
reduced during the War but still made up 40 % and 58 % respectively in
the early post-war years.
Table 4 also contains some rough calculations of the role import
substitution has played between 1937/1939 and 1951/1953. Computations
according to the Chenery formula show that between a fifth and a fourth
of changes in total supply in the durable goods, capital goods, and
intermediate goods industries can be traced to import substitution.
Although its share in the expansion of the supply of non-durable
consumer good was considerably smaller (5.2 %) it should be remembered
that output in that sector rose sixfold whereas the other industries
only had an increase of 200 %.
There are no value-added data for individual Colombian industries
before 1953, but it may be interesting to look at the compound growth
rate of overall production as given by quantum indices which have been
constructed by ECLA in 1954. Although most of the traditional consumer

Table 4
Structure of National Industry, Participation of Manufactured Imports in Total Supply, and Import Substitution1937 - 1953
Non-durable consumer goods
as % of domestic industrialImports as % of - " -Distribution of imports
Durable consumer goods
as % of domestic industrialImports as % of - " -Distribution of imports
Capital goods
as % of domestic industrialImports as % of - " -Distribution of imports
Intermediate goods
as % of domestic industrialImports as % of - " -Distribution of imports
Fuels
as % of domestic industrialImports a£ % of - " - a
Distribution of imports
aFigures in third column are
output_ n _
output
output
output
output
1937/39
741724
256
6
57336
154526
1331
for 1948-52.
.7
.5
.8
.6
.3
.0
.8
.9
.7
.0
.0
.8
.8
.3
.3
Sum
1944/46
71.77.2
3.133.5
6.761.2
16.833.0
1.729.8
1951/53
68.04.0
12.2
3.740.94.8
8.958.344.3
17.0. 29.5
32.9
2.437.74.0
of shares is less than
Importsubstitution
in mill, pesos
296.8
31.5
104.9
112.1
- 5.5
1937/39-1951/53
in % oftotal Supply
5.2
22.5
23.8
25.8
- 6.1
100,because of unclassified imports
1937/39-1951/53
Supply Changein %
595
199
189
157
298
*
Source: Computed from UN, ECLA: Analyses and Projections of Economic Development, III. The Economic Developmentof Colombia. New York: United Nations, 1955.

a \mtLt •tur Weltwirtediaft Kiel
- 13 -
goods grew at a slightly lesser rate than the average, the change from
the production of these goods to more sophisticated products was slow
and hardly visible by the end of World War II. Two sets of figures
reflect this process. Whereas the sura of the traditional non-durable
consumer goods (the first five industries of Table 5) made up
85.5 % of total industrial output in 1937, the share of the "modern"
industries (the last five of the same Table) was hardly 9 %. In 1945
the respective shares were 82 % and 10.7 % and in 1953 75.6 % and
15.5 %, i.e. the structural change in the 8 post-war period years was
substantially faster than in the 8 Depression and war years. This is
also reflected in the development of the growth rates which picked up
considerably for the latter groups in the 1945-53 period.
The 1953 value-added figures of Table 5 give a more realistic
picture of the composition of industries output, pointing towards
the dominant agricultural inputs in food processing. It should,
however, be noted that even the value-added of the five traditional
industries still made up two-thirds of total industrial value-added
in 1953 whereas the "modern" five branches reached not even a quarter
of industrial production.
The rather modest role of the so-called modern industries is not
surprising if one looks more closely into individual branches such as
rubber, paper and pulp, and the mechanical and metallurgical industries.
In the first case Colombia possessed only two tyre factories in 1953,
which were established after World War II and which still bought 80 %
of their inputs from abroad, i.e. the linkage effect to the domestic
economy was extremely weak. Similar to rubber, paper and pulp were
still at the beginning in 1953. Production of paper and paper board

Table 5
Structure and Growth of Colombian Industry
1937 - 1953
Industry
Compound Growth Hatesof Gross Output
1929-37 1937-45 1945-53
Shares of Outputin Total
Industry GrossOutput
1937 1945 1953
Shares ofValue AddedIn 56 of
Total ValueAdded1953
Value Added1953
in mill.pesos
PersonnelEmployment
ValueAddedper Man
Number ofFirms
Number ofpersonsper firm
FixedCapital
Capital-OutputRatio
Food.........
Beverages....
Tobacco.......Textiles
Clothing andFootwear
Wood and Cork....
Vooden Furniture*
Paper and Pulp...
Printing andEngraving......••
Leather
Rubber
Chemicals
Petroleum andCoal Derivatives.
Cement, Ceramics,Glass
Mechanical andMetallurgical....Miscellaneous....Total (Average)..
0.7
12.01.6
19.6
34.5
n.a.
n.a.
12.5
n.a.
9.3n.a.
is.'*
4.5
8.3
(8.6)
4.9
10.3
3.79.2
4.3
2.8
7.2
0.2
17.9
28.59.8
7.5
8.8
8.2
7.1
5.310.7
7-97.6
5.0
3-511.0
23.5
16.0
4.9
27.5
14.7
14.1
13.0
15.9
9-4
U9.3
7.2
2.913.3
12.8
2.2
0.8
0.3
1.6
0.8
0. 1
1.3
3.0
2.1
45.7
9.9
2.512.6
1.8
0.9
0.3
1.0
2.7
0.4
3.2
3.7
1.4
ill.6
11.5
2.3
11.5
8.7
1 .2
1 . 1
0.7
1.7
2.0
1.5
5.0
2.0
4.3
4.20.7
18.5
19.6
3.6
15. 1
9.4
1.4
1.7
1.1
2.7
2.0
2.2
7.0
1 . 1
7.3
6.11.2
287.3
303.8
55.8
233.6
145.6
21.0
26.6
16.4
42.4
31.8
34.9
108.5
16.8
114.0
95.2
17.61551.3
1(4,893
13,575
9,123
36,594
57,234
7,191
9,851
2,053
8,360
6,122
2,731
13,304
1,553
22,290
22,317It,480
261,671
6,400
22,380
6,119
6,384
2,544
3,294
2,698
8,000
5,066
5,200
1 ,278
8, 152
10,845
5,113
4,4813,916100
4.986
567
1 .088
2.220
21.157
2.314
3.478
84
618
1.139144
965
12
2.544
• 976
.45146.743
9
24
8
16
3
3
3
24
13
5
19
14
129
9
6
36
695
473
80
830
280
40
55
55
130
100
60
190
13
270
20016
2.44
1.56
1.43
3-57
1.92
1.89
2.08
3.33
3.01
3.13
1.72
1.75
0.78
2.38
2.080.912.27
Sourcel Computed from UN, ECLAl Analyses and Projections of Economic Development, III. The Economic Development of Colombia. New York!United Nations, 1955.

- 15 -
came from one major factory which was not being fully utilized in 1953.
Other plants only produced such final products as paper board boxes and
paper bags. There seemed to be potential for increased production if a
somewhat higher degree of protection had been granted. In the case of
basic metals the first major steel mill at Paz del Rio was still not
completed in 1953. Whatever existed at that time were small and medium-
sized ''craft shops" the average employment of which was 6 persons in
the early Fifties.
The situation was quite different in the chemical industry.
Except for the small-scale operated soap and candle factories and the
traditional match factories, most branches from pharmaceutical products
and paint to artificial fibres and fertilizers, caustic soda and
sulphuric acid were established in the late Forties and early Fifties
and were represented by only a few large scale enterprises, which were
either partly foreign or state owned, and which imported a high
percentage of their inputs from abroad.
Hot surprisingly then that the chemical industry did not only
constitute one of the largest and most dynamic industries but also one
which offered further possibilities for import substitution both in
the production of new final goods and material inputs.
A more complex picture is represented by the cement, ceramics and
glass industries. This is both a traditional and rather rapidly
expanding branch in Colombia. Although regionalization of urban centres
and high transport cost had led to an early establishment of local cement
plants and in spita of the handicraft nature of most of the glass and
ceramic industries, a rapidly increasing demand of the urbanizing

Colombians and the development of new building material (e.g., asbestos
cement products) provided sufficient impetus to new growth, expansion
and modernization.
A brief look at the "traditional" industries shows a similarly
mixed picture between 1937 and 1953. Besides many small-scale food-
processing industries the data of Table 5 show that the beverage
industry was dominated by larger enterprises which had the highest
value-added per man in Colombian industry. The simultaneous existence
of very large and efficient plants with handicraft shops were typical
for tobacco as well as textile industries. In 1953 only one firm (with
various factories) supplied almost the whole cigarette market of
Colombia which made up two-thirds of overall tobacco products. In
cotton manufacturing which produced over 50 % of total value-added in
the textile industry, it was estimated that three firms supplied over
75 % of the total market. Its relatively large size, high productivity
and substantial employment (textiles were the third largest employer
behind footwear, clothing and foodstuffs), as well as the backward and
forward linkages made textile probably the most important industry
between 1925-and 1953. Out of its total production, 34 % went as
intermediate products to the clothing industry, and the production of
cotton was to increase production from 4,000 tons in the first post-
war years to 10,000 tons in 1952 and 17,000 tons in 1953.
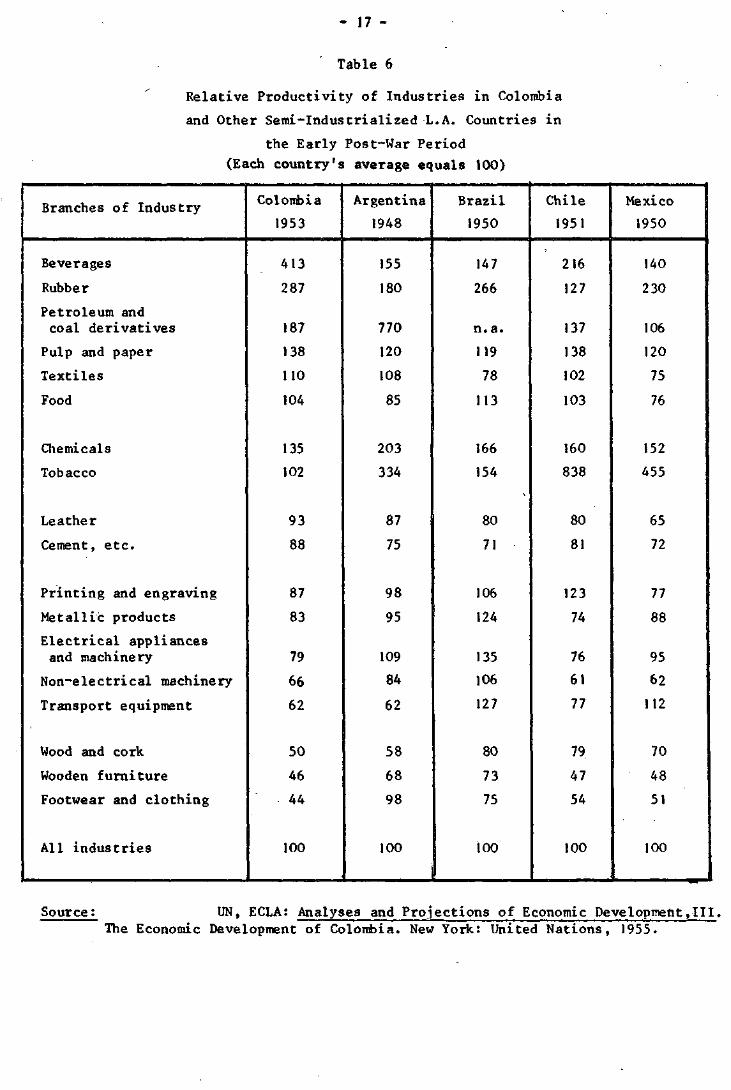
The heterogeneous characteristics of Colombian industry in the
early post-war period can also be observed in comparison with other
industrializing Latin American countries. Table 6 presents relative
productivity figures for Colombia, Argentina, Brazil, Chile and Mexico.
- 17 -
Table 6
Relative Productivity of Industries in Colombia
and Other Semi-Industrialized L.A. Countries in
the Early Post-War Period
(Each country's average equals 100)
Branches of Industry
Beverages
Rubber
Petroleum andcoal derivatives
Pulp and paper
Textiles
Food
Chemicals
Tobacco
Leather
Cement, e tc .
Printing and engraving
Metallic products
Electrical appliancesand machinery
Non-electrical machinery
Transport equipment
Wood and cork
Wooden furniture
Footwear and clothing
All industries
Colombia
1953
413
287
187
138
110
104
135
102
93
88
87
83
79
66
62
50
46
44
100
Argentina
1948
155
180
770
120
108
85
203
334
87
75
98
95
109
84
62
58
68
98
100
Brazil
1950
147
266
n.a.
119
78
113
166
154
80
71
106
124
135
106
127
80
73
75
ioo
Chile
1951
216
127
137
138
102
103
160
838
80
81
123
74
76
61
77
79.
47
54
100
Mexico
1950
140
230
106
120
75
76
152
455
65
72
77
88
95
62
112
70
48
51
100
Source: UN, ECLA: Analyses and Projections of Economic Development,III.The Economic Development of Colombia. New York: United Nations, 1955.

- 18 -
First it should be noted that the rank of these industries according to
productivity correlates closely with the average size of the industrial
firms in each industry as measured by number of employees (r = 0.904).
The beverage, textile and food industries do not only have higher than
average productivity within Colombia, they also are above similar
activities in the other countries. The same is true for the rubber,
paper and pulps and petroleum and coal derivatives industries. Chemicals
and tobacco are also above the average in Colombia but these figures
are smaller than the comparative indices in other Latin American
countries which may be due to the relatively late development of new
chemical plants in Colombia and the existence of a virtual monopoly in
its cigarette industry.
The relative backwardness of the engineering industries from printing
to electrical machinery, and from steel to transport vehicles both within
Colombia and in comparison with the large Latin American countries
reconfirms the above made assertion that full industrialization in
Colombia was at its beginning after the two shocks of the Depression
and World War II had passed. Finally, the predominance of handicraft
production in v/ood and cork, xrooden furniture, and footwear and
clothing becomes obvious in the low productivity figures. The "dualism"
between these branches and the leading industries was even greater in
Colombia than in the other semi-industrialized countries of Latin
America in 1953.

- 19 -
II. The Foreign Exchange Constraint, Capital Formation, and Import
Substitution Industrialization
In the discussion of the Colombian policy response to the sudden
deterioration of world market conditions for coffee it was mentioned
that devaluation and the tariff reform of 1931 as well as some quanti-
tative controls between 1933 and 1937 were primarily undertaken to
equilibrate the balance of payments. In addition, they indirectly
benefited domestic industry which was able to expand its production
quite rapidly during that time.
In the early post-war period a different trend dominated the
economic scene for a short while. Because of the rapid accumulation of
foreign exchange from 1941-1945 exchange controls were lifted in 1946.
Similar to the experience in other Latin American countries, the inter-
national reserves were exhausted quite rapidly, leading to new exchange
controls in 1947. Interestingly enough however the liberalization
policies did not lead to such an excess of durable consumer goods imports
as in Argentina or Brazil but were mainly used for the
purchase of machinery and equipment.
Table 7 shows that the investment ratios for the Colombian economy
between 1950 and 1956 ware substantially above the same ratios for the
following fifteen years. As can be further seen this difference was
mainly a function of the substantial drop in the purchase of machinery
and other equipment, over 90 % of whichtjas imported during the early
Fifties. One explanation is the relatively large amount of infra-
structure and the investment in basic / auring that time period> the
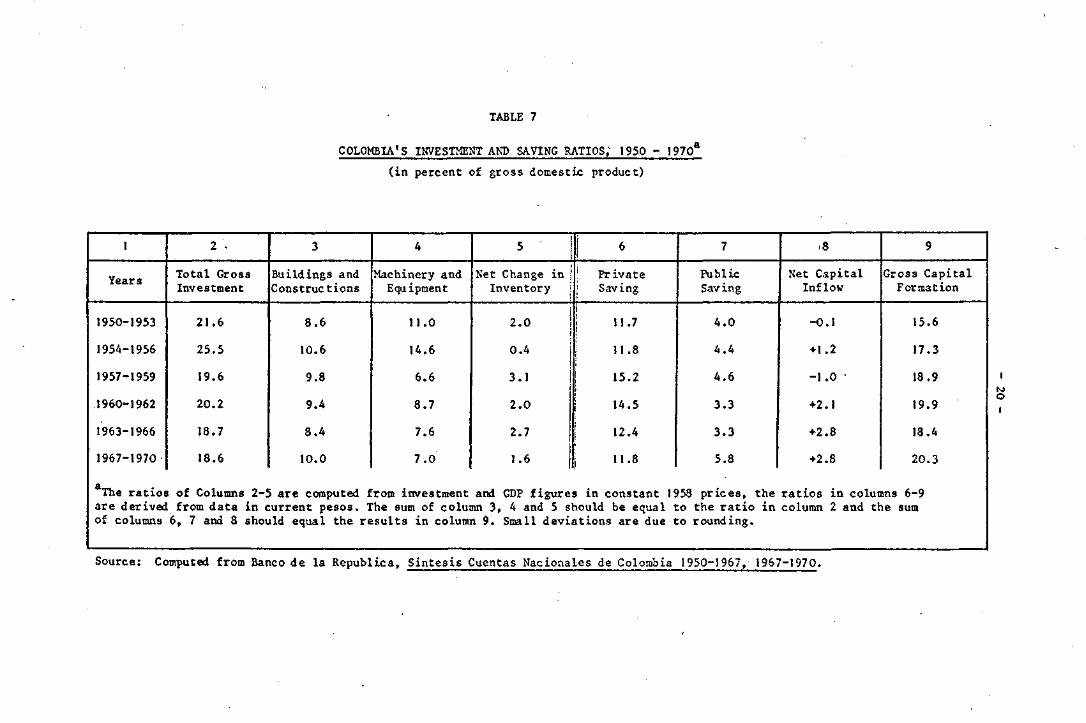
TABLE 7
COLOMBIA'S INVESTMENT AND SAVING RATIOS; 1950 - 1970
(in percent of gross domestic product)
I
Years
1950-1953
1954-1956
1957-1959
1960-1962
1963-1966
1967-1970
aThe r a t i o sa re derivecof columns
2 •
Total GrossInvestment
21.6
25.5
19.6
20.2
18.7
18.6
i of Columnsfrom data
6, 7 and 8
3
Buildings andConstructions
8 .6
10.6
9.8
9.4
8 .4
10.0
2-5 are computedin current pesos,should equal the
4
Machinery andEquipment
11.0
14.6
6.6
8.7
7.6
7 . 0
5
Net Change inInventory I
from investment andThe sum of column 3
results in column 9.
2.0 1
0.4 j
3 . 1 ii
2 . 0
2 .7
1.6
6
Private1 Saving
j 1 1 . 7
\ 11.8
I 1 5 . 2
1 14.5
| 12.4
j 1 1 . 8
GDP figures in constant4 and 5 should be equal
Small deviations are due
7
PublicSaving
4 . 0
4 .4
4 . 6
3 .3
3 . 3
5.8
1958 prices, theto the rat io into rounding.
8
Net CapitalInflow
-0.1
+ 1.2
-1.0 •
+2.1
+2.8
+2.8
9
Gross CapitalFormation
15.6
17.3
18.9
19.9
18.4
20.3
ratios in columns 6-9column 2 and the sum
Source: Computed from Banco de la Republica, Sintesis Cuentas Nacionales de Colombia 1950-1967, 1967-1970.

- 21 -
steel plant at Paz del Rio being one example. Another reason is
probably the decrease of the terms of trade and the capacity to
import which started in 1955 with a renewed fall in coffee prices and the
ensuing devaluations of the peso, which bought five times less machinery
for the same amount of export goods in the mid Sixties than in the
early Fifties.
The importance of the price changes in capital goods is even more
obvious, if one looks at the investment-GD? ratios in current prices
(column 9). Here the investment ratio shows an increasing trend, i.e.
the actual efforts to foster capital formation and with it the
capacity of the economy to produce and consume more goods in the long
run is clearly visible, but they were frustrated by unfavourable
external circumstances.
Does this mean that Colombia's economic development was still deter-
mined single-handedly by the fate of coffee prices in the Fifties and
Sixties? The saving ratios of Table 7 indicate that the saving effort
was raised considerably in the late Fifties as a response to the negative
external circumstances. The saving rate of the private domestic sector
actually increased from 12 to 15.7 % of GDP. It is, however, interesting
to see how the increased inflow of foreign capital, which poured into
Colombia as the showcase of the Alliance for Progress,n§eem to nave
diminished the domestic saving effort to the level reached between 1950
and 1954.

- 22 -
Although the importance of coffee exports on overall foreign
trade is clearly reflected in Figure 1, two characteristics indicate that
the relationship was not as stringent as it may appear at first sight.
First, the gap between coffee exports and total exports was widening
during the Sixties and has become substantial during the first years of
the Seventies. To what extent the increased importance of non-
traditional exports were a policy induced and how they influenced over-
all development will be discussed in part three. Secondly, the
fluctuations in coffee exports and with it overall exports were
pronounced and serious, the swing in imports however which were
heavily controlled by government policies were even stronger, making
private investment decisions more difficult than they already had
become through the export constraint.
It becomes therefore necessary to analyse import control and
industrialization policies in some detail below.
1. Tariff and Import Control Policies in the Fost-War Period
A combination of tariffs, quantitative controls, and prior
deposits attempted to allocate imports under the constraint of scarce
and fluctuating foreign exchange reserves. Between 1950 and 1974
there were six substantial changes in tariff rates which ranged between
3 % and 100 % according to the "essential" quality of the good for
the development of the Colombian economy. In general there was a
tendency to increase rates in the late Fifties and during the Sixties,
but a substantial cut in the rates of over two thousand items was
decreed as late as March 1974.

Figure 1 - ADJUSTED0 EXPORTS (X) AND IMPORTS (M) OF COLOMBIA 1950-1972(in mill1. $ US)
m i1000
800
300
/..•' Coffee Exports
1950 1955 1960 1965 1970 1975
Exports and Imports are adjusted for illegal Trade and are on customs basis (*1973 estimated)

- 24 -
More important than level and variation of tariff rates were the
grouping of goods into lists of free imports, prohibitive imports, or
imports subject to prior licences. Table 8 gives a fair impression
of the importance of these restrictions beyond the nominal tariff
rates. It should be clear from the above description that the compu-
tation of "effective protection" becomes not only a frustrating
experience due to frequent changes in the nominal tariff structure,
it also may become meaningless in the case where imports are on the
prohibitive list, (as was the case with non-durable consumer goods in
1968) since effective protection becomes infinite.
Nevertheless, a study by Hutchesbn, who computed the effective
rate of protection in 1969, shows that not only was industry as a
whole effectively protected whereas agriculture was not but also a
great variance of the protection rates within the industrial sector.
Effective protection was particularly high for such industries as
electrical machinery and transport equipment but hardly less for the
traditional beverage and tobacco industries, which were followed by
chemicals, metal manufacturing and basic metallurgy. These industries,
which made up nearly one-third of total value added of manufacturing
in 1968, would have probably not been able to compete with foreign
products if protection had been withdrawn.
Table 8 has shown the characteristics of the import control system
for 1968, a year which seems to be rather representative. Earlier
imports had constantly been shifted back and forth from the prohibitive
list to the ones which needed prior licences and to the free list
depending on the foreign exchange situation. Whereas from 1951 to 1954 most
restrictions had been removed they xrere gradually reintroduced in the

TABLE 8
PROTECTIVE MEASURES OF COLOMBIAN INDUSTRY, 1968
Sector
Non-durable Consumer Goods
Textiles
Clothing
Footwear and otherLeather Goods
Durable Consumer Goods
Electrical Appliances
Cars
Tires
Intermediate Goods
Capital Goods
Metals and Machines
Transport Equipment
Average Nominal
Tariff
64
225
150
70
340
50
29
39
67
Prior
Deposits
130
130
130
66
130
30
104
22
23
Inputs
Average Nominal
Tariff
33
106
51
48
96
28
17
29
28
Prior
Deposits
99
130
83
75
60
16
57
77
37
Licencing
Arrangement
All goods on prohibitive
list except textile inputs
and tanning material
All Goods subject to
prior licence
All goods subject to
prior licence; refined
zinc and tin are on free
list
All products subject
to prior licence
Source: International Bank for Reconstruction and Development, Economic Growth of Colombia: Problems and Prospects(Baltimore and London, The John Hopkins University Press, 1972).

- 26 -
latter part of the Fifties. Inspite of attempts to liberalize some of
them by the newly installed Superintendency of Imports, the further fall
in coffee prices and the reluctance of the Colombian government to
devalue the peso had the effect to shift practically all items either
to the "prior" or "prohibitive" category in 1962. During that year
a drastic fall of the auction rate from 6.7 to 9 pesos per dollar
initiated a new trend towards liberalization which however was rapidly
reversed when it became clear that continuous foreign exchange problems
remained. In late 1964 the free import list was eliminated altogether
and several items moved into the prohibitive lists.
There was a swift change in policies in 1965-66 which became known
as the years of the "liberalization experiment". However, since imports
rose rapidly foreign exchange was exhausted soon and with tumbling
coffee prices in 1966 the experiment was halted and it x as only in
1967-68 that the free import list regained some importance. Since that
time there has been a more stable pattern of relaxation of import
controls, increasing the items on the free list, particularly for those
goods coming from Chile, Peru, Equador and Bolivia - countries which
Colombia had signed the Andean Pact with in 1969. In 1973 imports on
the free list made up 43 % of total reimbursable imports of 1972 and all
items on the prohibitive import list were transferred to the prior
licensing list. It has only teen in 1974 that the delays in processing
of import requests signal a new reversal towards stricter import controls.
The frequent changes in relaxing and introducing controls would hardly
have as the primary motive to grant domestic industry adequate protec-
tion from abroad. The pattern clearly indicates that the major purpose
of these policy moves was to adjust the domestic demand for foreign
goods to the limited capacity of import, which was determined by the

- 27 -
export performance and the inflow of foreign capital from private and
public lenders.
A detailed analysis of the behavioral pattern of the Colombian
import control agency INCOMEX by Diaz Alejandro confirms this observ-
ation. The same author maintains however that the industrial entre-
preneurs in Colombia felt that this agency served also as the major
"balwark against foreign competition and at the same time an even
icore reliable supplier of cheap imported inputs".
In its 1970 report, the World Bank was more critical, maintaining
that licensing had created several negative effects on the efficient13
allocation of resources in the Colombian economy. First it was argued
that the controls had contributed to lower quality of domestic consumer
goods, many of which did not need any protection since they had been
an integral part of the economy for many years. Secondly and more
seriously, the control system was creating bottlenecks in the
production during periods of exchange scarcity and excess capacity when14liberalization experiments were implemented.
To what extent the investment of machinery and equipment fluc~
tuated according to the Colombian imports can be derived from the fact
that in the early 1950s over 90 % of these investments were imported
and that share was still 68 % between 1970 and 1972. Not surprisingly
regressions between these two variables were both high and significant.
Although the coefficients are smaller, the close relationship also
holds for the industrial investment in Colombia and the capacity to
import of their economy as shown in the following equation;

- 28 -
£n I = 3.1343 + 0.7205 £n CI R = .51m (1.7727)x (O.1832)xx t~l 0W = 1.50
signif icant at the 5 % level
signif icant a t the 1 % level
where
I =investment in machinery 1950-1965m
CI . capacity to import 1949-1964
The discussion of the investment and industrialization pattern during
the late Twenties and Thirties have shown that the importance of
foreign exchange availability to further capital formation does not
necessarily mean an immediate increase in industrial output. Although
industrial growth did not follow a completely independent pattern,
Figure 2 demonstrates that its relatively minor fluctuation and its
continuous positive development indicates that foreign exchange
fluctuations - and vjith it the capacity to import - had a much lesser
impact on industrialization than on the capital formation process.
2. The Role of Monetary and Fiscal Policy in the Import
Substitution Process
Monetary and fiscal policies have been used quite frequently in
LDCs to stabilize and stimulate the overall economy and to favour or
discriminate through channelling credits at differential interest rates
to particular sectors and supplying differential tax treatments and
subsidies. If industrialization xrould have been indeed the major goal
of the various Colombian governments one would have expected prefer-
ential treatment for this sector in the fiscal and monetary system.

Figure 2 - INDUSTRIAL GROWTH AND FLUCTUATIONS IN GROSS INVESTMENT1952 - 1972
growthrates in %
20
16
12
0
- 8
-121950 1955 . 1960 1965 1970 1975 t

- 30 -
Table 9 has shown that monetary policy tried to influence the
pattern of imports by asking importers to deposit between 10 and 130 %
of the value of their imports upto six months prior to the arrival of
the commodities. Both rates and time periods have been altered many
times during the period under consideration, including the granting of
certain exemptions for capital goods going to public enterprises and
basic industrial imports from LAFTA countries. In general these policies
contributed to the constant shortage of working capital Colombian indus-
trial firms were suffering from and which seems to be still one of the
major bottlenecks of a smooth functioning business management.
In addition to the prior deposit system for imports, industry had
to render certain pension funds (which they formerly had used for
internal financing) to the social security institute, which channelled
most of these funds into the central mortgage bank. Since 1970/71 that
institution attracted further loanable funds by being able to offer a
high and inflation indexed interest rate to lenders.
Although the agrarian sector received both preferential interest
rates and special earmarked funds (which the commercial banks had to
grant to the primary sector), the share of loans going to this sector
remained rather constant (about 30 % ) , whereas industry raised its
share from 28 to 39 % between 1960 and 1967. The loser was commerce,
the share of which fell from 42 % to 30 % during the same time period.
In order to stimulate medium and long-term finance into domestic
industry as well as to channel foreign funds into the secondary sector,
the Colombian government created Corporaciones Financeras in 1960,

- 31 -
These financial intermediaries bad been proposed by the national indus-
trial association (AKDI) as well as some international organizations
(such as the World Bank and the Federal Reserve System).Although there
was initial animosity of the private sector because of the semi-public
character of these institutions, the Financeras have beccn.e a vital
tool in the development process of Colombian industry3 providing nearly
a quarter of total credit which this sector received during the late
Sixties. The balance of the corporations reflect the growing importance
of these new sources of credit quite significantly; their share in total
finance was 11 % in 1360, climbed to 33 % in 1963, and although later
data are not available, the statistics on total bank credits (i.e.
commercial banks and Financeras) in overall financing increased sub-
stantially reaching 50 % in 1958 after having only been 30 % in 1960.
Consequently, it has been argued that the loans from the Financeras sub-
stituted internally and externally generated funds of Colombian national
enterprises which were now able to grant credits to their customers in a18
more lenient way than previously.
Colombian fiscal policies affected industry in many ways. Here
only a short discussion of the tax incentive system will suffice. It
particularly favoured basic and complementary industries as well as
granted special tax cuts for import substituting and exporting firms19
of non-traditional products. Although the so-called basic industries
included iron and steel, non-ferrous metals, machinery and machine
tools, paper and products, artificial fibres, a number of chemical
products, sulphur, coal and asbestos and some others, it has been
estimated that less than 30 firms used these incentives in 1963
decreasing the tax revenue for that year by approximately 17 m.20
pesos.

- 32 -
An even smaller number of firms received up to ICO % income
tax exemptions between 1961 and 196S, because they bought 50 % and
more of their inputs from the national steel mill, Acerias Paz del Rio,
S.A. The stimulation of new branches to complete import substitution
is also reflected in tax exemptions for automobiles and their parts,
electrical appliances, ships, machinery, and printing and publishing
industries. Finally, 15 % of the net taxable income was allowed to be
exempted in order to build reserves for the recuperation of fixed
assets, upto the amount of those assets bought before 1957. Although
estimates of all the incentives have been made for individual years,
such as for 1963 when the tax loss was said to amount to 7 % of the income
tax assessment, it is impossible to evaluate their benefits as long as
one does not know to what extent Colombian industrial investors
reacted to them. Even the various tax missions to Colombia have not21
been able to come up with any cost-benefit ratios. -
There is, however, quite a stock of experience with tax incentive
schemes all over the world which would raise the following'objections
to these schemes: first, empirical studies have shown that from all the
factors influencing investment decisions of private business, exemptions
from income taxes play a minor role, largely because they are not very
helpful during the first years of operation, when profits are often low
or negative. Secondly, the granting and administering of tax exemptions
is difficult and there is a tendency that other groups will also press
for similar privileges, lowering badly needed fiscal revenues and
turning specific incentives to key industries into general subsidies
for business. It is then also interesting to note the World Bank opinion
that the Colombian government is levying an excess profit tax on
corporations "in order to recover some of its implicit subsidies to the22
business sector".

- 33 -
A more specific fiscal and monetary effort of the Colombian
government to support domestic industry can be seen in the formation of
an industrial development organization, the Instituto de Fomento
Industrial (IFI) in 1940. Realizing the inability of the private
sector to plan and implement major industrial ventures, such as steel
or heavy chemicals, the Institute invested in these fields to make
Colombia more independent from foreign supplies of intermediate pro-
ducts and capital goods.
Since 1940 public investment lias grown rapidly, its relative
importance has nearly doubled from 15 % of total investment to 28 %23of total investment in 1963. These figures include both, the
major investments of IFI in basic industry and public investment by
other government agencies, which are mainly concentrated in the fields
of transport, communication, power generation and distribution. As
such these autonomous agencies serve industry only indirectly, though
the possible subsidies are substantial.
The major direct participation besides basic metals, and heavy
chemicals, has taken place in petroleum drilling and refining. In spite
of the increasing involvement in industrial activities, however, the
share of public output in total industry is still very modest and far
below the public sector participation of Brazil, Mexico or Chile.
3. Growth and Structure of Colombian Industry 1953-1967
Since the foreign sector's impact continued its unstable develop-
ment and domestic policy response was not able to counterbalance these
influences effectively, it is no surprise that the development of the
Colombian economy in general and the industrial sector specifically did

- 34 -
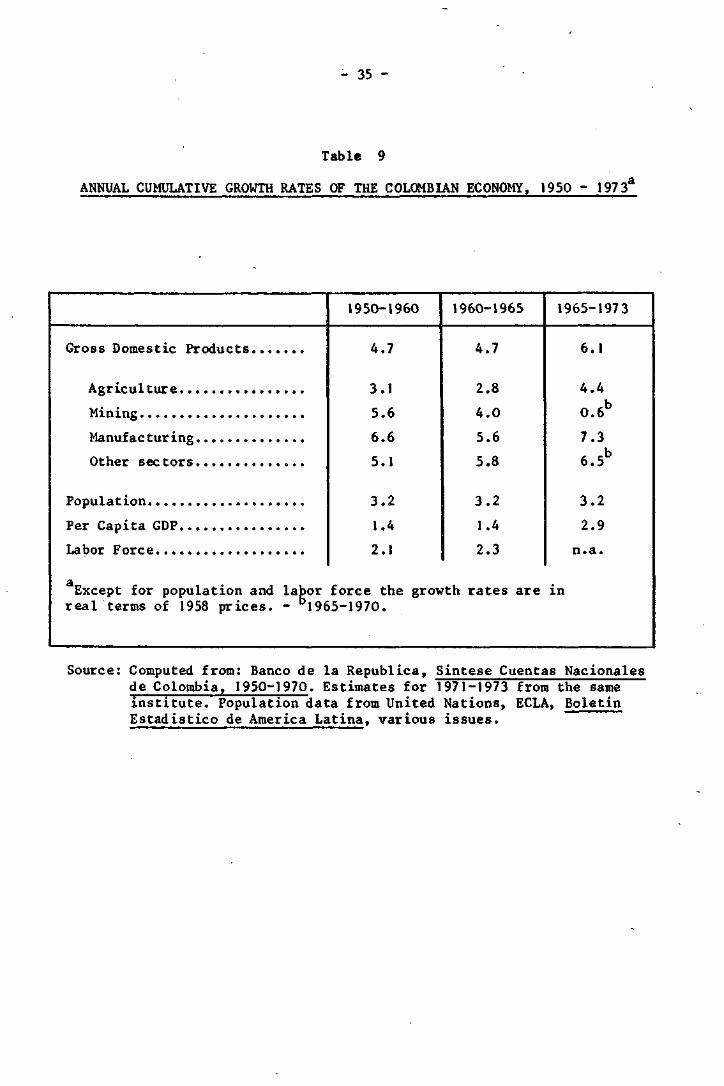
not advance as rapidly as planned during the Fifties and Sixties. Table
9 shows that the compounded growth rate for the gross domestic product
amounted to 4.7 % between 1950 and 1965. This means a per capita growth rate
of 1.4% which was rather slow due to the rapid increase in population.
Industry was the most dynamic sector but even here the expansion during
the major import substitution process was moderate and tended to
decelerate until 1967. Substantially higher increases have only been
realized between 1970 and 1973, which benefited both from rapidly25
expanding foreign demand and stimulation of construction activities.
A more detailed picture of the manufacturing output development
between 1953 and 1967 is given in Table 10. The overall growth rates
differ slightly from the previous figures, not only because they are
average rather than compounded rates, but mainly because of slightly
different time periods involved. 1967 marks a better breaking point
than 1965, since it was in 1967 that Colombia decided to use an overall
export strategy, which included a change in incentives, the sliding peg,
and a more continuous effort to liberalize imports.
The slowing down of overall industrial growth in the Sixties
reflected in the missing dynamics of the intermediate and capital
goods industries which had provided a powerful impetus in the Fifties.
Immediate increases in output after the installation of new capacities
in petroleum and basic metals were not sustained in the Sixties. A
similar decline took place in electrical machinerya which had started
from scratch in the mid Fifties. The capital goods sector experienced
the fastest growth, but its share of total industrial output had been
a mere 1.4 % in 1953 which it was able to raise to 4.7 % in 1967.
The situation was similar in the durable consumer goods industry which
grew by nearly 10 % but whose contribution to total industrial growth
- 35 -
Table 9
ANNUAL CUMULATIVE GROWTH RATES OF THE COLOMBIAN ECONOMY, 1950 - 19733
1950-1960 1960-1965 1965-1973
Gross Domestic Produc t s .
Agriculture...
Mining
Manufac tur ing.
Other sectors.
Population
Per Capita GDP.
Labor Force....
4.7
3.1
5.6
6.6
5.1
3.2
1.4
2.1
4.7
2.8
4.0
5.6
5.8
3.2
1.4
2.3
6.1
4.4
0.61
7.3
6.5*
3.2
2.9
n.a.
Except for population and labor force the growth rates are inreal terms of 1958 prices. - b1965-197O.
Source: Computed from: Banco de la Republica, Sintese Cuentas Nacionalesde Colombia, 1950-1970. Estimates for 1971-1973 from the sameinstitute. Population data from United Nations, ECLA, BoletinEstadistico de America Latina, various issues.

- 36 -
Table 10
GROWTH OF MANUFACTURING OUTPUT, 1953 - 1967
Industries 1953-1960 1960-1967 1953-1967Growth ofOutput per
Worker
Contributionto Growth
Nondurable Consumer Goods...
Food
Textiles
Pharmaceuticals
Durable Consumer Goods
Rubber products .
Electrical Appliances
Motor vehicles
Intermediate Goods
Paper and produc ts
Chemicals, othersPetroleum
Non-metallic mineralproducts
Basic metal
Metal products
Capital Goods
Mechanical machinery
Electrical machinery
TOTAL
4.3
1 .7
8.4
13.5
10.5
11.2
18.8
6.9
12.8
18.1
17.6
17.5
6.9
41.8
13.3
15.6
10.8
34.7
7.0
4.6
5.2
3.5
10.5
9.4
9.1
12.5
12.6
6.9
14.3
21.0
2.8
6.8
3.2
8.1
10.4
7.8
13.8
5.8
4.4
3.5
5.9
12.0
9.9
10.2
15.1
9.7
9.8
16.2
19.2
10.1
6.9
22.5
10.7
13.0
9.3
24.2
6.4
2.9
3.9
5.3
1.6
3.1
46.2
7.7
40.4
4.7
100
Source: International Bank for Reconstruction and Development, Economic Growth ofColombia: Problems and Prospects,, Baltimore and London: The John Hopkins Univer-sity Press, 1972.

- 37 -
amounted to only 7.7 %.
On the other hands the two leading sub-groups of manufacturing,
non-durable consumer goods and intermediate products contributed nearly
equally to growth. Here the dynamics of import substitution can be
seen more clearly. Output and productivity grew nearly twice as fast
for the intermediate goods than for the nondurable consumer goods
which was constrained not only by the alleged income inelasticity of
demand but also by the slov; growth in per capita income itself.
The different growth rates led to changes in the structure of
industrial output between 1953 and 1968 which were quite significant.
The comparative data of column 1 and 2 of Table 11 reflect these changes*
The share of non-durable consumer goods fell from 66 to 51 % whereas
metallurgy, machines and transport equipment rose from 6 % to 13 %,
especially noteworthy is the increasing contribution of chemicals,
petroleum and coal products.
Table 11 also compares the actual industrial structure of Colom-
bia in 1953, 1963 and 1968 with the "normal" structure which is derived
from a cross-sectional comparison of the relationship between
countries' per capita income, market size ,and the degree of industria-
lization. A comparison between the actual and normal shares in the three
selected years shows that Colombia approached a more typical pattern
of industrialization in the Sixties. The ratios of the actual overstandard deviation
the normal percentages were approaching unity in 1968. Whereas the /
of this ratio was still .8 in 1953 ,it fell to .56 in 1963 and to
.42 in 1968.

Tabl* 11
ACTUAL AND NORMAL STRUCTURE OF COLOMBIA'S MANUFACTURING SECTOR 1953. 1963. 1968
($ of total value added at current factor costs)
Sec tor
Food Products
Beverages
Tobacco
Textiles
Clothing and Footwear
Vood and Cork Products
FurniturePaper and Paper Products
Printing and Publications
Leather and Leather Products
Rubber Products
Chemicals
Petroleum and Coal Products
Otner Non-metallic MineralProducts
Basic MetalsFabricated Metal Products
Non-electrical Machinery
Electrical Machinery
Transport Equipment
Miscellaneous
l.sxo Nr.
20
21
22
23
24
25
26
27
28
29
30
31
32
333435
36
3738
39
1953
Actual Share
18.519.6
3.6
15.1
9.41.4
1.71.1
2.72.1
2.2
7.0
1.1
1 7'3
J> 6.1
J1.1
Normal Share
14.2
7-96.8
10.9
2.9
4.71.92.7
3.71.2
2.6
10.6
4.2
4.82.85.0
2.0
2.7
5-52.7
1963
Actual Share
15.713.4
4.0
13.0
4.21.0
0.6
1.9
3.1
1.1
2.5
13.3
3-7
5-52.1
4.5
1 .2
3-2
2.6
2.7
Normal Share
14.1
6.65.2
12.8
3-33-71.8
2.6
3.61.1
2.4
11.1
3.8
5.1
3.55.0
2.3
3.1
6.0
3.0
1968
Actual Share
14.7
13.74.4
13.9
4.30.9
0.8
2.9
2.8
0.9
2.5
12.8
4.1
5.42.0
4.8
1 . 1
2.92. 1
3-1
Normal Share
14.0
6.1
4.913.5
3-33-31.8
2.5
3-51 .1
2.4
11.53.8
5.2
3.85-0
1.9
3.46.0
3-1
Ratios of actual over* _*__
normal snares
1953
1 .30
2.48
0.53
1.393.24
0.30
0.890.41
0.73
1.75
0.85
0.66
O.26
V 1.52
Jy 0.34
0.41
«=p.8O34
1963
1.11
2.03
0.77
1 .02
1.27
0.27
0.330.73
0.86
1 .00
1 .04
1 .20
0.97
1 .08
0.60
0.90
0.52
1 .03
0.42
0.90
6=0.5598
1968
1.05
2.25
0.90
1.03
1.30
O.27
0.441.16
0.80
0.82
1 .04
1.11
1.08
1 .04
0.530.96
0.58
O.85
0.35
1 .00
ff=0.4169
Source 1 Computed from Departamento y Administraci6n Nacional de Estadistica (DANE) on the basis of regression estimates by i>. Fels , V.W.Schatz, F. Woltor, "Der Zusammenhang zwischen Produktionsstruktur und Entwicklungsniveau." VeltvirtschaftItches Archly. 106.1(1971), PP. 240-27".

- 39 -
In general, the comparative data reflect the rapid growth and
possibly over-expansion of chemicals, petroleum and coal derivates, as
well as paper and rubber industries, and the lesser importance of the
previously dominating food, textile, clothing and footwear manufacturing.
The only industry which continued to contribute far above its normal
share was the beverage producers, whereas under-representation seemed
to be largest in traditional branches of wood and furniture production
and two newer industries; basic metals and transport equipment. In the
latter case, import substitution was still in its infancy facing a
relatively small market and an underdeveloped road system, but the decline
in the furniture industry seems to be characteristic for a branch which
is mainly made up of small and medium-size firms.
The role of import substitution is reflected in Table 12 which
compares the shares of imports in total supplies of nine industries for
1953 and 1967. The amount of imports which would have prevailed if the
1953 share had remained constant, is shown for each industry in column 4.
If we take these dollar amounts as percent of changes in total industry
output we get an estimate for the importance of import substitution in
each industrial branch and for the nine industries as a whole.
The methodological problems of this type of procedure which has been
introduced by Chenery have been discussed elsewhere and do not need to26
be repeated here. In addition, the presented data are both, incomplete
and the 1953 import share of several industries conflict with the data
earlier provided by the ECLA study. Nevertheless, it can be maintained
that import substitution played an important role in the Colombian
industrialization process, probably more important than in the large
Latin American countries. It seems to have been crucial in the inter-
mediate and capital goods sector.

- 40 -
Table 12
IMPORT SUBSTITUTION IN VARIOUS SECTORS OF COLOMBIAN INDUSTRY, 1953 - 1967
(in %)
Sec tor
Basic metals
Petroleum and coalproducts
Metal products
Chemicals
Paper products
Textiles
Leather
Wood products
Non-metallic mineral
M. » Imports of good
It88.5
57.2
58.576.8
64.430.0
4 .0
12.5
11.6
i
31.6
8 .5
10.5
36.5
25.9
4.4
0 . 0
1.1
3 . 6
ImportSubstitution (IS)
in mi l l . US $
78.010
40.908
49.296
79.230
33.033
36.122
976
2.063
7.504
IS.
AZ.
88.1
76.8
71.9
69.6
60.3
50.1
33.7
23.9
14.1
Z. • Total supplies of good i .
&Z a increase of total supplies in various industries.
Source: Computed from: International Bank for Reconstruction and Development, EconomicGrowth of Colombia: Problems and Prospects, Baltimore and London: The JohnHopkins University Press, 1972.

- 41 -
If one looks at the aggregate data between 1953 and 1973 there is
also some explanation for the decline of the industrial growth rate
during most of the Cixties. Whereas import substitution played a
dominant role between 1953 and 1963, its share in total industrial
demand fell from 38 % to 4 % in the following years and recovered only
slightly after 1968. At that time the export diversification drive had
started to play a more important part, contributing with 11.6 % to the
expansion of industrial production (see Table 13). Even more dramatic
than the difference in growth rates are the changes in industry's
labour absorption during the three periods under consideration. To
what extent the export diversification drive contributed to fuller
employment will be discussed in Chapter III. Here it is important to
relate the growth and decline of import substitution not only to the
industrial sector's growth of output and employment but also to its
effects on microeconomic efficiency and the saving of foreign exchange.
4. Import Substitution, Economic Efficiency and the "Learning Effect"
in Colombian Industry
One major problem which became acute during the Colombian industrial-
ization process in the Sixties was the underutilization of human and
physical capital. With respect to the excess capacity issue, Munk wrote
in an evaluation of the automobile industry that "it is not clear why
developing countries fail to achieve significant cost reductions as
output expands, but one characteristic of production in these countries27
is inefficient use of existing production capacity." This had also
been the contention of other observers of the Colombian economy in the
early Sixties and a sample survey which had been undertaken in 1960/6128
seemed to provide the empirical evidence for it. Out of the 342
responding firms, 55 % were working only 8 hours, i.e. one shift; most
of these firms belonged to the "traditional industries" such as clothing
and shoes, furniture, leather goods, tobacco, and some food processing
industries.

- 42 -
Table 13
IMPORT SUBSTITUTION, EXPORT DIVERSIFICATION AND INDUSTRIAL
DEVELOPMENT, 1963-73
( in p e r c e n t )
INDICATORS OF IMPORT SUBSTITUTIONAND EXPORT DIVERSIFICATION
1.
2.
3.
4.
Imports (cif)
Industrial Production8
Total Supply of Industry (1+2)
Industrial Exports
INDUSTRIAL GROWTH AND ITS FACTORS
1.
2.
3.
Annual Average Growth Ratesof Industrial Output
Annual Average Growth Ratesof Industrial Employment
Sources of Industrial Growth(in % of Industrial Output)
a) Domestic Demand
b) Import Substitution
c) Export Diversification
felue Added of Industrial Productior
1953
544
994
1 538
5
1953-63
7.4
3.5
61.0
38.0
1.0
L in 1968
1963
506
1 938
2 444
19
1963-68
5.3
1.6
91.7
4.0
4.3
pesos.
1968
643
2 585
3 228
54
1968-73
9.3
8.3
77.8
7.7
15.0
Source; Computed according to the Chenery method from unpublished dataof Banco de la Republica and INCOMEX.

- A3 -
Multiple shift work was common in the "continuous process" industries
such as petroleum refining and chemical industries, breweries and sugar£ l» £ *
refining, paper and pulp, and plastics. In general 43 %.worked on a two
shift basis at least with part of their equipment, and 27.5 % did work
with part of their capital around the clock. While even within the group
working on a multiple shift basis it was admitted that some machines
remained idle, and that a sudden increase in demand could be satisfied by
using larger shift crews, the excess capacity thesis could not be
convincingly proven, because all firms planned to increase investment in
the near future, i.e. they seemed to consider their unused machines,as a
necessary means to increase supplies originating from sudden changes for
unused capacity; in addition it seemed that not insufficient demand but
insufficient financing and unreliable energy supplies were the major
causes of unused capacity.
On the other hand there was no doubt about the underutilization of
Colombian manpower. Although rising un- and underemployment in Colombian29
cities, which have been estimated to reach 25 % in 1967 , were a function
of both, rapidly increasing population growth and urban migration on the
supply side as well as the inability of all economic sectors to absorb
more manpower on the demand side, the drop of industrial employment
expansion from 3.5 to 1.6 % after 1963 shows that the modern manufacturing
sector was particularly responsible for the increasingly serious situation
in the labor market.
The inability of the manufacturing sector to increase employment
rapidly in LDCs has been explained with distortions of factor prices and
the inelasticity to substitute labor for capital. The evidence for the
first allegation is rather clear. Long term credit, especially for the
heavy intermediate industries, in which the state participated,were
granted at real negative interest rates. Labor costs, on the other
hand, have been inflated by 50 % through fringe benefits and other fees31
employers had to pay in addition to the basic wages.

- 44 -
With respect to factor substitution, a study undertaken by the
National Planning Department cans to the conclusion that elasticities of
substitution of 17 out of the 20 two-digit ISIC industries were close to
1, i.e. the technical structure of Colombian industry should not have32prevented the adoption of a more rational factor allocation. On the
other hand, the use of a more generalized production function, which
relaxed the unrealistic assumption of perfect competition and constant
returns to scale, showed that all elasticities were substantially below
1 (average 0.42). Moreover in only 7 out of 20 cases was the t-ratio
high enough to reject the null hypothesis.
The changing pattern of Colombian industrialization towards more
capital-intensive production processes which make factor substitution
difficult is reflected in the investment figures of Table 14. A dramatic
shift occurred from rather balanced shares of traditional consumer goods
industries (ISIC 20-24) and the newly installed intermediate products
(ISIC 30-35) for 1958/62 to large differences for 1962/67, wh«n the
relative share of the latter group was nearly twice the size of the
former. It was the time when over 2.2 billion pesos were sunk into the
petroleum refining industry followed by 1.4 billion pesos of investment
in chemical industries. These industries are characteriszed by high
capital-labor ratios,and direct as well as indirect employment effects
are very modest. Morawetz has estimated that "for each $ 100 million
invested in petrochemicals in Colombia, some 2,500 pesos are employed,
while investment of the same # 100 million in labor-intensive industries
could create 50,000 jobs. Similar results can be obtained from the35employment multipliers of the inverted input-output table of 1968.
Whereas an increase in aggregate demand of 100 million pesos for clothing
and textiles, shoes and the leather goods as well as wood products is
able to raise employment directly and indirectly by over 2,700 jobs, the
same rise in demand for chemical and oil refining products as well as
basic metals would create not more than 1,200 employment openings.

Table 14
NET INVESTMENT IN INDUSTRIES 1958-1969
S E C T O R
Food ProductsBeveragesTobaccoTextilesClothing and FootwearWood and Cork ProductsFurniturePaper and Paper ProductsPrinting and PublicationsLeather and Leather ProductsRubber ProductsChemicalsPetroleum and Coal ProductsOther Non-metallic Mineral ProductsBasic MetalsFabricated Metal ProductsNon-electrical MachineryElectrical MachineryTransport EquipmentMiscellaneous
T O T A L
1958/63
mill .Pesos
447.0232.0
33.9589.2
76.550.614.7
201.191.440.690.1
296.6376.8306.9117.4234.449.9
151.099.091.1
3,590.2
A
12.56.50.9
16.42.11.40.45.62.61.12.58.3
10.58.63.36.51.44.22.82.5
100.0
1
12
9
1962/67
mill .Pesos
,277.6274.341.3
799.6189.085.226.2
439.3155.055.9
148.3,412.0,224.6657.9240.8405.3
,112.6231.0144.8182.7
,033.6
iit
14.13.00.58.92.10.90.34.91.70.61.6
15.624.6
7.32.74.51.32.61.62.0
100.0
1968-69
mill .Pesos
905.8381.3
17.6583.7
89.944.817.7
143.3175.933.5
159.4397.799.2
368.5178.9212.0
70.077.9
167.6167.4
4,291.4
ik
21.18.90.4
13.62.11.00.43.34.10.83.79 .32.38.64.24.91.61.83.93.9
100.0
Source: Computed from Boletin Mensual de Estadistica, vol . 250-51 (May/June 1972).

- 46 -
The major reason for many LDCs to plunge into an import substitution
program is the hope of saving foreign exchange and the import constraint
on economic development. Similarly to the experience of other Latin
American countries, however, the industrialization process in Colombia
only changed the structure of imports not the amount. Imports' share in
total supply fluctuated between 20 and 23 % from 1951 to 1965. Whereas
consumer goods saw their share in total imports curtailed from 12.8 % to
6.2 %, capital goods raised their contribution from 33.4 % to 41.2 %.
The import of intermediate goods remained around 53 %, in spite of the
heavy import substitution in these industries. It seemed to be parti-
cularly difficult to lower the import coefficients of the chemical,
rubber, and metal industries, which needed alone for their raw material
inputs 45 % from abroad.
The picture is somehow more positive if one looks into the foreign
exchange earnings of the newly developing intermediate products.
Increasing amounts of chemicals, paper and pulp and, for a few years,
also rubber and petrochemicals were sold to foreign countries. The
average annual exports of these products (ISIC 28 & 30-34) amounted to
t 15 million between 1963 and 1967, reaching approximately 50 % in indus-
trial exports, but less than 5 % of total Colombian exports. These
exports - most of which went to the other Andean countries - were,
however, more a function of low marginal than low average costs of the
Colombian industry. Once the large investments for plant and equipment
had been undertaken, it was useful to run at close to full capacity and
sell the excess output to neighboring countries at "dumping prices".
In any case these exports were not able to reduce the deficit of the
current account balance which averaged $ 570 million in 1960/63 and37nearly doubled in 1964/68. At the same time the foreign debt services,
which had been 5 % of total exports in the early Fifties, increased from
15 % to 22 % of exports from 1960 to 1968.
In order to evaluate the efficiency of Colombian industry in
earning and saving foreign exchange, adequate data on domestic resource

- 47 -
costs would clearly be required. There are presently only a number of
rough estimates for several industries which indicate that the foreign
exchange earnings and savings were at a substantial higher price than
the exchange rate at the time of measurement. In the case of auto-
mobiles the excess costs were between 30 % and 80 % for commercial38
vehicles and over 100 % for passenger cars. In petrochemicals the
estimates were 50 % to 75 % above the equilibrium exchange rate and for39chemicals between 30 % and 50 %. On the other hand the domestic
resource costs for clothing and shoes was below the actual exchange
rate and the one for textiles was slightly above it; in that industry
artificial fibres, which were produced with domestic inputs of the
petrochemical industry, seemed to be responsible for the inefficiencies.
The domestic resource costs for cotton textiles were below the exchange
rate.
Unemployment can be regarded as "the macroeconomic counterpart of
the microeconomic inefficiency which results from a system in which the
economy does not have comparative advantage." With respect to some
indications of that microeconomic inefficiency it has been stated that
the evidence on excess capacity is not sufficient to support the thesis
that the Colombian industrialization process led to an inefficient use
of capital at the firm level.
A stronger case for the possible misallocation of resources is41
given by a recent study on the concentration of Colombian industry.
Out of 89 three-digit ISIC industrial groups 47 % were characterized
by an "oligopolistic" structure, i.e. the largest four firms shared
more than 50 % of the respective markets. The dominating 150 industrial
enterprises produced 53.2 % of value added in 1968. Were the concen-
trated industries examplifying the "high costs, high price - high
profit" profile, which seems to be typical for several other Latin
American countries? There are no comparative cost data and the
evidence from the pricing behavior is mixed, but in spite of the sub-
stantial differences in the estimates of the average rates of return,
there is a high correlation between higher profit rates and concen-
tration of industries.

- 48 -
It is now interesting to note that the authors of the concentra-
tion study justify these profit differentials, at least in the inter-
mediate product industries, because of the necessity to amortize the
large outlays for capital goods and the requirements for substantial
future investments. The barriers to entry are consequently not only a
function of technology and possible collusion, but they are also
directly and indirectly furthered by government policy. As a matter of
fact, even the largest existing refinery in Colombia is small in
comparison to the normal size of these installations in the industrial-
ized countries and is consequently producing at substantially higher
per unit costs as its competitors abroad. The critical question is
then, if that and other industries, such as steel and automobiles, will
reach efficient levels of production in the foreseeable future. For
two of these three industries the forecasts are pessimistic, but there
is clearly some need for more empirical work at the industry level.
The studies should trace the structural change from an infant
industry to a relatively efficient unit of production, which will be
able to compete in world markets.
In this context it is interesting that only one study has tackled
one of the most important arguments in favor of protecting infant
industry in less developed countries: the process of learning both by44management and workers. In analyzing the importance of learning both
with respect to output and time,Dudley found that it had contributed
significantly to the expansion of the metal working and machine making
industries. Would any increase in labor productivity mean that these
branches will be able to reduce the costs and prices to such an extent
that they will be able to compete in world markets in the long run?
Again more evidence is required, especially about the productivity of
the factor capital. Nevertheless, it is interesting to remember that
40 years ago the Colombian textile industry was considered as much of
being a "white elephant" as has been the case with the above mentioned
automobile and oil refining industries in the last 10 to 20 years.
Today textiles are not only one of the most efficiently operated indus-
tries in Colombia, they also have proven to be able to compete in world
markets. To what extent government policies and rapidly expanding
world markets contributed to the export expansion of Colombian industry
will be discussed in the following chapter.

- 49 -
III. Export Promotion Policies and their Effects on Manufactured Exports
1960-1972
In the Fifties and Sixties Colombian government attempted to con-
serve foreign exchange and to encourage import substitution industrializ-
ation through import restrictions and protective tariffs, public
financing and tax incentives, and the provision of low-cost raw material
and intermediate and capital goods from abroad. Simultaneously it began
to further "non-traditional" or "minor" exports, i.e. all exportable46
products besides coffee, petroleum, and raw hides. Since the export
promotion policies have been discussed by other authors in some detail,47
a summary survey will be sufficient to give the necessary background.
I. Quantitative and Qualitative Incentives of "New" Exports
Similarly to the measures to aid import substituting industry, the
export promotion policy of Colombia consisted of tariff regulations, tax
incentives, and credit subsidies. All policies except one applied also
to agricultural and mineral exports. In addition, exchange rate policies
and a systematic planning and promotion system of non-traditional exports
has played a decisive part in the overall export strategy of Colombia
since 1960.
Special exchange rates for minor exports were already introduced
in 1948 and have existed side by side with mostly fixed rates (for
imports, government transactions, and freights), free market rates (for
most private capital and tourism), and special rates (for coffee and
petroleum). The mixed pattern of exchange rate policies shows attempts
to experiment with various systems. During three periods (1951-52,
1958, and 1965-67) the minor export rate was fixed. Most of the time
that rate was flexible, however, either following the free market rate,
or a special rate which was decreed by the government. Except for the
export vouchers between 1952 and 1955, which gave the exporter the rightamount
to import commodities at the equivalent/of foreign exchange earned by

- 50 -
his exports, the exchange rate system did not grant any other incentives
but rather sudden and irregular depreciations of the pv.so, which were
to become continuous only after 1967. In Column 9 of Table 15 the
exchange rates are adjusted with an index of purchasing-power-parity
between Colombia and the U.S., The deflated exchange rate shows little
change until 1955, the year the coffee prices fell first and required
new export promotion. Between 1956 and 1967, the "real11 exchange rate
fluctuated back and forth between 8.88 and 11.86. This changed only
after 1967 when the policies of the "sliding peg" raised the real rate
of exchange step by step until 1974.
The fiscal incentives took the form of income tax exemptions from
1960-67, which were then replaced by tax credit certificates (Certificados
de Abono Tributario - CAT). Whereas the 40 % tax cut mainly helped the
already profitable enterprises to effectively reduce their tax payment,
and even induced large commercial banks to go into export business, the
certificates gave exporters a 15 % rebate on total sales abroad. The
CATs could either be used for tax payment within a previously determined
period of time or they could be sold at a discount on the stock exchange
markets in Bogota and Medellin. The value of the tax subsidies are
shown in column 4 of Table 15. They amounted to 14.4 % of exports from
1961 to 1967 and fluctuated around 15 % afterwards, depending on the
redemption periods and the supply of and demand for the certificates in
the financial markets.
In the monetary field, the Bank of, the Republic was helping
exporting firms by allowing them to borrow foreign funds up to one year
prior to the actual transactions. These loans were repaid at the rate
which had prevailed on the day of "advance exchange surrender". Since
it was not difficult to anticipate the devaluation of the peso, the
repayment in local currencies gave the exporters a welcome interest
subsidy which was at the order of 4-6 % of the export value. Since
1967, the government established Export Promotion Fund (PROEXPO) is

- 51 -
-1" PQ
il'I
V)W
X
JO
H
QO
K
oo
T
CO
+
"Real"
effective
exchange rate
"Real" basic
exchange rate
Colombian
prices
deflated by
US prices
Nominal
effective
exchange rate
ValeJo
Plan
Credit
subsidies
Tax subsidies
(CAT)
Export taxea
Baaio
exchange rate
t~.ooco«f~oocoo\ooo*o o\oj- M -- irvw <M n n j j mmj
m^ooovMOOvMmiDsojmjrioooxinrijiv-OM,) M
t»00C0'Or~tO00CTvO'-C*~0sO'-O00-O\CTvOO--'-CMN~
\o 01 r- n w t^o\*r\o\c\0\o\voJ"v©*© •- O I A N V O ry\o t> cy _^ dir*\ o r~ ^ o\-^ ^ *~ o O\ r* •$ r t^ r c o\ oo cy * c\ &\ t * .~ \o o N
X
c•He
- o
O -H
I l l l l l l l l l l l l
c* orr «
0.07
0.39
0.29
0.58
0.55
0.26
0.51
0.81
1.13
1.27
1.23
la price index,
bstituted by the
d 3« o
0 -HC\^^oojfoovoco\oooa\irtr- yx
" " * " "~ " >H
XJ eo
5 d
oi .- »- - o • *I l l l l l l l l I l l l l l l l l l l l l V o
O O O O O C J31 1 1 1 1 -^ *
• go 3
P. Bo
• HW O
d o
N O O W W ^ O~f l A ^ O f^^ 00 ^ O O •^ O ^ O C OO O *~ O^O O +*
*7
B *0
•acd •
dE uO -H•* H
0. O
o aaM EU o
h
d•o
c xlo o•> aM
• JO3
§§•oc ed o
f- Co
• -H
3E u0 H
. h d<M a
•O x )
E •o oO N

- 52 -
attempting to take over the lending to exporters. Until 1972 total
export loans channeled through that institution amounted to less than
10 % of outstanding short-term liabilities of commercial banks lending
for export prefinancing. Its participation has, however, grown sub-
stantially in 1975 to make up for the reduced subsidies.
The financial value of the special credit facilities can be
estimated by taking the differential of interest rates in foreign
markets (Eurodollar rate) and domestic rates, and adjust them for the
commission fee Colombian banks received for their brokerage services.
The resulting difference is then multiplied with the share of total
exports which these loans prefinanced. The subsidies fluctuated
according to the level of change of international interest rates,
averaging 2.7 % of the basic exchange rate between 1960 and 1974.
(Column 5, Table 15).
Exporters of industrial products received a third major benefit
from the Vallejo Plan, which has allowed them to import raw materials,
intermediate inputs, and capital equipment without prior licence,
advance import deposits, and free of customs duties since 1959. Rather
stringent rules ensured that only firms which really used these inputs
for producing manufactured exports succeeded in receiving these benefits.
Since this feature benefited gross exports receipts rather than the
value-added contribution of exported products and led to more intensive
importing than desirable, changes were introduced in 1967. With a
"drawback" system, which makes the refunding of tariffs for imported
inputs dependent on value-added of exports, and the granting of freedom
from licensing and prior deposits only on the basis of previous exports,
it was hoped to direct the incentive features towards a better allocation
of resources.
The import preferences under the Vallejo Plan are difficult to
quantify, because they require computations of average imported
components of manufactured exports, average effective import duty,

- 53 -
average rate of advanced import deposits, and the number of months these
deposits were held by the Central Bank as well as the prevailing
interest rate in Colombia. For the 15 years under consideration this
special subsidy for manufactured exporters amounted to 10.5 % of the
basic exchange rate.
If one now compares the "real effective" exchange rate in Column
10 during the 1960s with their development during the Fifties,the
difference becomes quite obvious, the respective averages being 14.4
and 9.0 pesos per dollar;in other words, exporters have received about
60 % more in pesos for each earned dollar of exports since the intro-48
duction of the various export promotion measures.
In addition there are a number of non-quantifiable features which
have helped to stimulate Colombian exports in the 1960s and which have
become even more important now since the direct and indirect subsidies
have been reduced. With Decree No. 444 of 1967 on exchange rates and
foreign trade, Colombia did not only revise many of the earlier incen-
tives, it also founded an institution for the promotion of exports
(PROEXPO), which was originally financed from a 1.5 % tax on imports,
the rate of which has been increased to 3.5 % in 1975.
This institution has a number of tasks which range from the
granting and insurance of export credits to dissemination of information
relevant to exporters, education and training of certain exporting
techniques, and actual marketing and advertising. Although the actual
performance is difficult to measure*the evidence seems to indicate
that PROEXPO is playing an increasing role in fostering non-traditional
exports.
In spite of the rather modest role in arranging for credit in the
first year of its existence, interviews with industrial enterprises in
1972 showed that the majority of the medium-size firms have made use
of these credits and found them helpful in solving the problem of

- 54 -
49working capital shortages. The credit insurance of exports which
covers 75 % of economic and 80 % of political risk, was fully implemented
in 1969 and is similarly regarded as a necessary device in promoting
exports.
With respect to the dissemination of information, PROEXPO has been
actively engaged in providing Colombian exporters with various types
of analysis for export markets, sales methods, as well as freight and
insurance problems. Since the transportation system, both within
Colombia and with its neighbors, is still a major bottleneck in the
expanding exchange of goods and services, PROEXPO has concentrated its
efforts on that sector and has succeeded in achieving freight reductions
for a number of industrial products within the LAFTA and other countries
of the Western Hemisphere.
In an empirical study which concentrated on the information aspect
in the exporting of 120 Colombian firms in the four major cities during
1972/73, the researchers found that over 50 % of the firms thought
direct travel still the most important and complete channel of infor-
mation which was followed by the information provided by PROEXPO and
other agencies (12.5 % used them as first, 10 % as second and 7.5 % as
a third means of information). If one combines those figures with
publications, a large part of it which was also provided by PROEXPO,
the amount of first channel information increases to 25 %, ranging far
above such other possibilities as market studies conducted by exporters
themselves, foreign buyers, and business contacts other than exporters.
: In the field of technical aid, PROEXPO has provided exports for
solving such problems as packaging, quality control, and the organiz-
ation of the required paperwork(ranging from writing out offers to
fulfilling the various formalities with the administrative bureau-
cracies). Most importantly it has engaged in active marketing. In
direct contact with the exporters it has engaged in advertising
Colombian products in the most important world markets. This task is
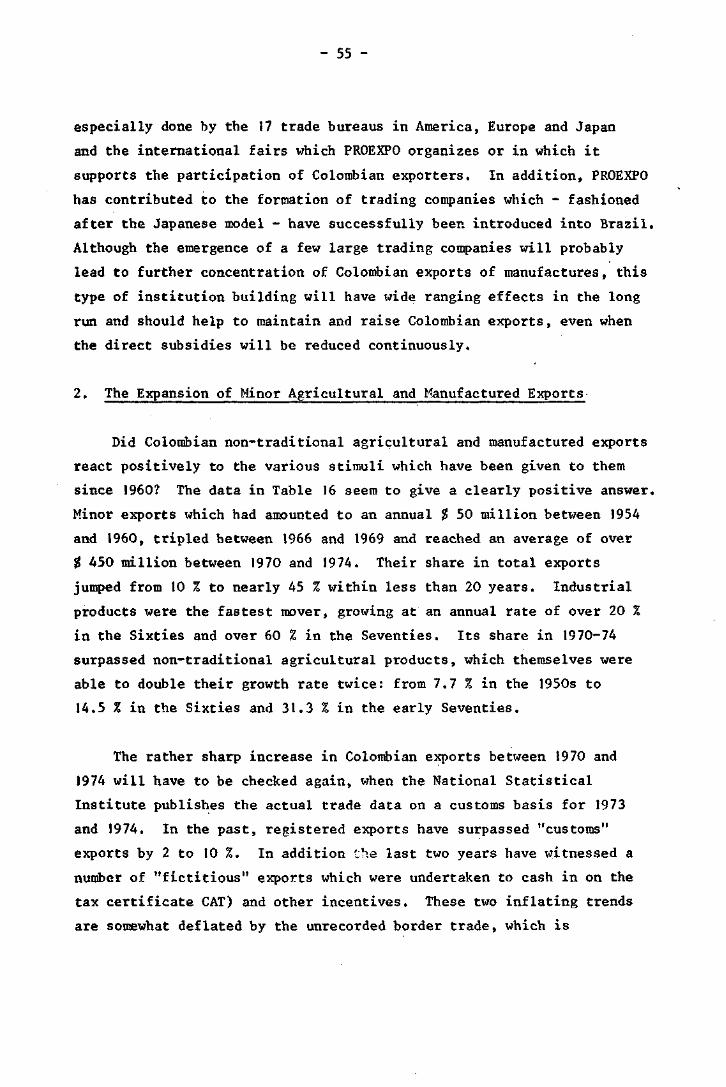
- 55 -
especially done by the 17 trade bureaus in America, Europe and Japan
and the international fairs which PROEXPO organizes or in which it
supports the participation of Colombian exporters. In addition, PROEXPO
has contributed to the formation of trading companies which - fashioned
after the Japanese model - have successfully been introduced into Brazil.
Although the emergence of a few large trading companies will probably
lead to further concentration of Colombian exports of manufactures, this
type of institution building will have wide ranging effects in the long
run and should help to maintain and raise Colombian exports, even when
the direct subsidies will be reduced continuously.
2. The Expansion of Minor Agricultural and Manufactured Exports
Did Colombian non-traditional agricultural and manufactured exports
react positively to the various stimuli which have been given to them
since 1960? The data in Table 16 seem to give a clearly positive answer.
Minor exports which had amounted to an annual $ 50 million between 1954
and 1960, tripled between 1966 and 1969 and reached an average of over
$ 450 million between 1970 and 1974. Their share in total exports
jumped from 10 % to nearly 45 % within less than 20 years. Industrial
products were the fastest mover, growing at an annual rate of over 20 %
in the Sixties and over 60 % in the Seventies. Its share in 1970-74
surpassed non-traditional agricultural products, which themselves were
able to double their growth rate twice: from 7.7 % in the 1950s to
14.5 % in the Sixties and 31.3 % in the early Seventies.
The rather sharp increase in Colombian exports between 1970 and
1974 will have to be checked again, when the National Statistical
Institute publishes the actual trade data on a customs basis for 1973
and 1974. In the past, registered exports have surpassed "customs"
exports by 2 to 10 %. In addition the last two years have witnessed a
number of "fictitious" exports which were undertaken to cash in on the
tax certificate CAT) and other incentives. These two inflating trends
are somewhat deflated by the unrecorded border trade, which is
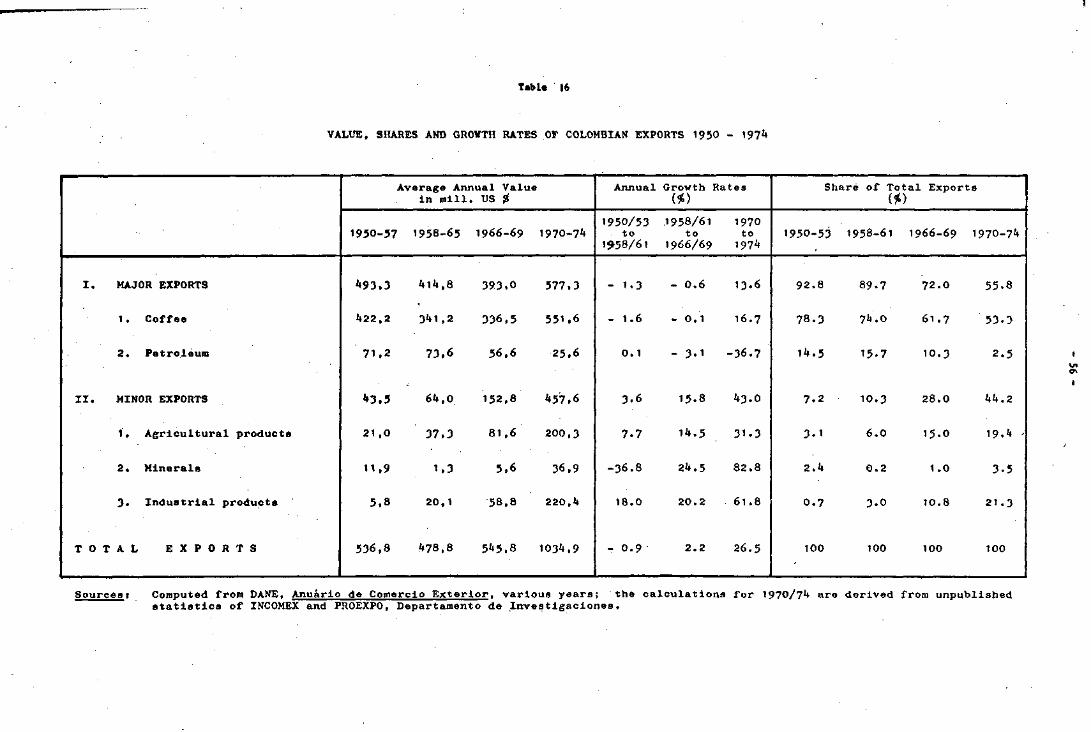
Table 16
VALUE, SHARES AND GROWTH RATES OF COLOMBIAN EXPORTS 1950 - 1974
I. MAJOR EXPORTS
1 .
2.
Coffee
Petroleum
II. MINOR EXPORTS
1.
2.
3.
Agricultural products
Minerals
Industrial products
T O T A L E X P O R T S
Average Annual Valuein mill. US $
1950-57
493,3
422,2
71,2
43.5
21 ,0
11,9
5.8
536,8
1958-65
414,8
341,2
73,6
64,0
37,3
1.3
20,1
478.8
1966-69
393.0
336,5
56,6
152,8
81,6
5,6
58.8
545,8
1970-74
577,3
551,6
25,6
457,6
200,3
36.9
220,4
1034,9
Annual
1950/53to
1958/61
- 1.3
- 1.6
0. 1
3.6
7.7
-36.8
18.0
- 0.9
Growth(*)
.1958/61to
1966/69
- 0.6
- 0.1
- 3-1
15.8
14.5
24.5
20.2
2.2
Rates
1970to1974
13.6
16.7
-36.7
43.O
31.3
82.8
61.8
26.5
Share of Total Exports(*)
1950-53
92.8
78.3
14.5
7.2
3.1
2.4
0.7
100
1958-61
89.7
74.0
15.7
10.3
6.0
0.2
3.0
100
1966-69
72.0
61.7
10.3
28.0
15-0
1.0
10.8
100
1970-74
55.8
53.3
2.5
44.2
19.4 '
3-5
21 .3
100
Sources 1 Computed from DANE, Anuario de Comercio Exterior, various years! the calculations for 1970/74 are derived from unpublishedstatistics of INCOMEX and PROEXPO, Departamento de Investigaciones.

- 57 -
particularly strong between Colombia and Venezuela. Keeping these
reservations in tnind it seems, nevertheless, certain that the growth
of the non-traditional products accelerated in 1972 and 1973, before
new problems of domestic supply shortages for important agricultural
products, chemicals, and building materials made export controls and
restrictions necessary, dampening the 1974 growth rates and the
prospects of continuous rapid expansion for the coining years.
Besides the rapid increase in total exports, there is ample
evidence that Colombia was able to diversify its exports in the Sixties
and early Seventies and that this process is to continue during most
of the Seventies. An analysis of the concentration ratio between 1962
and 1969/72 showed that the degree of diversification rose by about
8 %. This may not be a large amount, it is however, significant if
one realizes that the other members of the Andean Pact were able to
raise this degree of diversification by less than 2 %, with Peru and
Chile actually suffering from a higher degree of concentration in
1969/70 than in 1962.
Table 17 lists some important export industries and their perfor-
mance between 1965 and 1973. The dominant role of textiles and more
recently clothing is obvious. Their share in total industrial exports
rose to 25 % in 1971/73, averaging $ 50 mill, during those years. The
same table also shows the growing importance of other more labor-inten-
sive goods, such as shoes, leather goods, and furniture. Although the
absolute amounts of several producer goods were still substantial, the
share of such products as paper and cardboard, cement, and some chemicals
decreased after 1970. Before we analyze the changing pattern in greater
detail, a look at the most important export markets is in order.
3. Colombia's Export Markets and the Issue of Comparative Advantage
With respect to Colombia's most important customers, Table 1 has
shown that the U.S. participation had substantially declined after the

Table 17
EXPORTS OF IMPORTANT MANUFACTURED GOODS 1965 - 1973
I n d u s t r i e s
Textiles
Clothing
Shoes
Leather goods
Wood
Furniture
Paper
Pharmaceuticals
Glass and Glassware
Cement
Agricultural Machinery
Sub-Total
Total Industrial Exports
Selected Exports as percentof Total Exports
Average Annualin mill. US
1965/67
7.2
0.5
-
5.3
0.2
-
5.3
2.6
0.3
2.9
0.2
24.5
41.1
1968/70
12.4
0.8
1.2
4.8
4.4
0.6
7.6
2.7
3.1
4.1
1.4
43.1
74.2
Value$
1971/73
34.3
16.1
3.8
15.1
6.5
4.8
7.8
5.8
3.7
5.7
1.7
105.3
203.5
In Percent ofIndustrial Exports
1965/67
17.5
1.2
-
12.9
0.5
-
12.9
6.3
0.7
7.1
0.5
59.6
1968/70
16.7
I.I
1.6
6.5
5.9
0.8
10.2
3.6
4.2
5.5
1.9
58.0
1971/73
16.9
7.9
1.9
7.4
3.2
2.4
3.8
2.9
1.8
2.8
0.8
51.8
in00
Source: Computed from H. Calvo and J.F. Escandon, Las Exportaciones Colombianas de Manufacturas1963-1971 (Bogota, 1973) and unpublished data of INCOMEX.

- 59 -
peak of the coffee boom in 1954. Although the Latin American share had
risen from 1.6 % to 6.8 % in the Sixties, it was still very small
compared to the volume of exports going to the European and North
American countries until recently. The latest figure for 1973/74
indicate, however, that Colombia has - at least for the last two years -
dramatically altered its trading pattern in favor of its neighboring
countries in Latin America. Table 18 demonstrates that these countries
have played a more important role in buying Colombian non-traditional
agricultural and particularly manufactured products. The major shift
within the minor export group as a whole is from Western Europe to the
Andean countries and somewhat less to new customers in Eastern Europe,
Asia and Australia. Total LAFTA exports, which were less than half of
the U.S. exports in 1960/62, have increased ten-fold since then and
surpassed exports to the U.S. by $ 5 m. in 1970/73. Data for manu-
factured products are presented for four individual years up to 1972.
Although expansion has been rapid, the shares remained rather constant,
with a third to a fourth going to the U.S., the Andean Pact countries,
and the other non-LAFTA countries of the Western Hemisphere, i.e. mainly
Central America and the Caribbean.
More conclusive evidence of manufactured exports, and the degree of
differentiation according to region is presented in Table 19, which
lists export values, percentage shares going into LAFTA countries, and
capital-intensity as measured by the non-wage value-added per worker.
A casual glance at the figures reveals substantial differences in LAFTA
participation with one product group of which 60 % and more is bought
by Latin American countries and a second group of commodities, of which
less than 20 % is sold in the same region. With the exception of a
few catch-all items (other chemicals, and other miscellaneous manufac-
tured articles on the one hand and other textiles and non-metallic
manufactures on the other), the two groups have clearly distinct
market shares. Although the data for capital-intensity are only
proxies, since they are not always covering exactly the same groups,
the first hunch that mainly capital-intensive goods are finding their
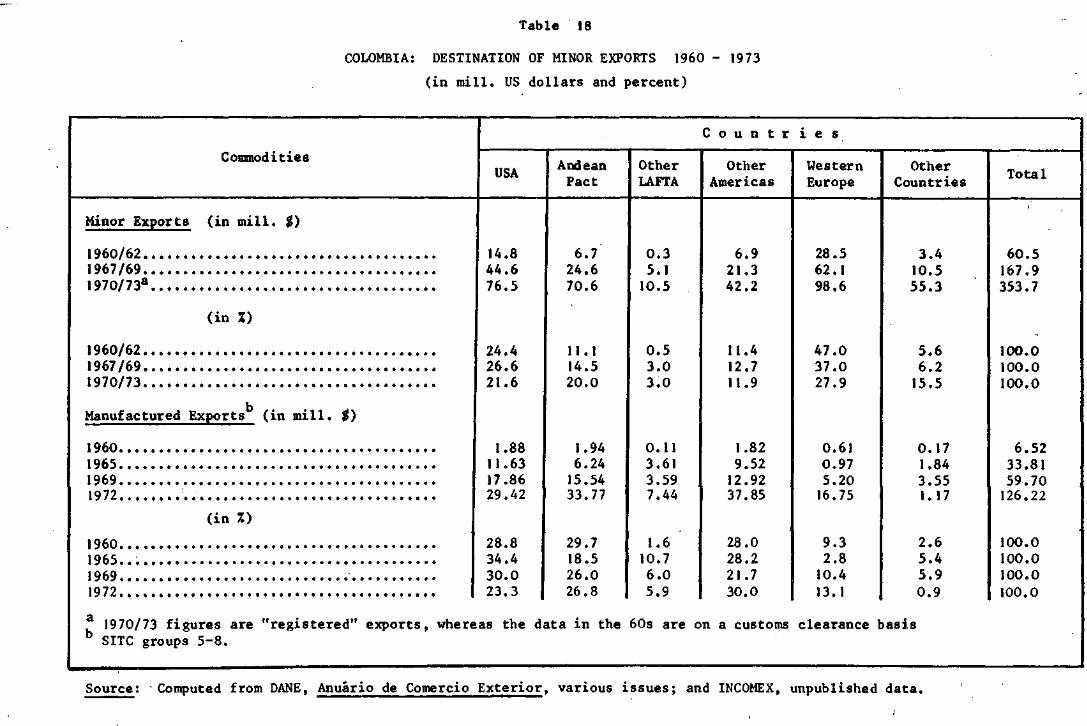
Table 18
COLOMBIA: DESTINATION OF MINOR EXPORTS 1960 - 1973
(in mill. US dollars and percent)
Commodities
C o u n t r i e s
USA AndeanPact
OtherLAFTA
OtherAmericas
WesternEurope
OtherCountries Total
Minor Exports (in mill. $)
1960/62.,1967/69..197O/73a.
(in %)
1960/62.1967/69.1970/73.
Manufactured Exports (in mill, t)
1960.1965.1969.1972.
(in %)
1960.1965.1969.1972.
14.844.676.5
24.426.621.6
1.8811.6317.8629.42
28.834.430.023.3
6.724.670.6
11.114.520.0
1.946.2415.5433.77
.7
.529,18.26.026.8
0.35.110.5
0.53.03.0
0.113.613.597.44
1.610.76.05.9
6.921.342.2
11.412.711.9
1.829.5212.9237.85
28.028.221.730.0
28.562.198.6
47.037.027.9
0.610.975.2016.75
9.32.810.413.1
3.410.555.3
5.66.215.5
0.171.843.551.17
2.65.45.90.9
1970/73 figures are "registered" exports, whereas the data in the 60s are on a customs clearance basisSITC groups 5-8.
60.5167.9353.7
100.0100.0100.0
6.5233.8159.70126.22
100.0100.0100.0100.0
Source: Computed from DANE, Anuario de Comercio Exterior, various issues; and INCOMEX, unpublished data.

- 61 -
Table 19
COLOMBIAN MANUFACTURED EXPORTS
SITC
Group
3
513
54!
581
5(Other)62
64
661
67
69
7
892
8(Other)
61
63
651
652
65(Other)
665
667
66(Other)
68
841
851
Mineral Fuels excl. Crude Petroleum
Inorganic Chemicals
Medical and Pharmaceutical Products
Plastic, Cellulose, Resins
Other Chemicals
Rubber Manufacture
Paper and Paper Products
Cement and Construction Materials
Iron and Steel
Manufacture of Metals
Machinery and Transport Equipment
Printing
Other Miscellaneous Manufactured Articles
SUBTOTAL / AVERAGES .
(Column 3)/(Columns 4 and 5)
Leather and Leather Goods
Wood and Cork Manufactures
Threads and Spun Fibres
Cotton Textiles
Other Textile Yarn and Fabrics
Manufacture of Glass
Pearls and Precious Stones
Other Non-metallic Mineral Manufactures
Non-ferrous Metals
Clothing
Shoes
SUBTOTAL / AVERAGE
(Column 3)/(Column 4 and 5)
TOTAL
1970
Exportvalue
in mi 11.$
17.41
2.43
2.68
1.02
1.96 .
1.29
1.37
3.55
0.42
2.58
5.58
2.23
2.20
44.72
5.67
1.96
4.18
7.51
1.02
3.16
3.55
1.49
4.42
1.10 .
0.74
34.73
79.45
Z going
to
LAFTA
90.0
61.4
75.8
69.5
44.8
82.6
56.3
40.8
72.0
55.5
58.9
58.5
45.8
62.5
2.9
0.8
8.3
8.6
24.5
13.1
0.5
29.6
3.8
11.2
0.3
9.4
Non-WageValue addedper Worker
1968
285.77
88.42
69.50
51.45
40.19
56.14
28.45
52.18
24.31
78.13
22.29
n.a.
72.45
22.53
15.99
26.64
54.90
22.77
32.86
n.a.
16.20
n.a.
17.58
19.06
25.39
Sources: Carlos Dfti Alejandro, "El Cambio de una politica de substitucion de importaciones a una promocionde export?.ciones en Colombia", (Bogota: FE0F.SARROLLO, 1973) and computed from DANE, IndustriaManufacturera Nacional 1968.

- 62 -
markets in the LAFTA countries seems to be confirmed by the data which
show that for these goods the capital-intensity is three times as high
as for the commodities which are mainly sold to the U.S. and European
countries. The evidence from these averages is strengthened by the
results of the following cross-sectional regression:
26.666 + 0.284 x 2 =
(3.405) (2.806) R O < 3 0 4
where
y is the percentage share of exports going to LAFTA
x is the capital-intensity; and the figures in brackets are
t-ratios significant at 1 %.
It would seem logical that Colombia sells its more labor-intensive goods,
such as clothing, shoes, leather, wood and some of its textiles to the
advanced countries whereas it is able to export the modern and more
capital-intensive goods to its neighbors, most of which are still much
less industrialized than Colombia. In other words, Colombia seemed to
use its comparative advantage quite correctly in 1970. It should, how-
ever, be noted that the special protection of LAFTA and the Andean
Market made it possible to sell at prices not only substantially above
world market level, but - due to the export promotion scheme in general
and the Vallejo Plan in particular - also above the domestic price level
in Colombia itself. A more precise indication of Colombia's use of its
comparative advantage is presented in Table 20, where factor-intensities52
are compared with export shares. The division into relatively capital-
intensive and labor-intensive industries shows that the former group
has participated very little in total industrial exports between 1965
and 1973. The only clear cut exemption are chemicals, which owed at
least part of their rather constant participation to the above mentioned53
"excess" production of their newly installed capacities.

- 63 -
Table 20
FACTOR- AND EXPORT-IKTENSITY OF COLOMBIAN INDUSTRY
I n d u s t r y
RELATIVELY CAPITAL-INTENSIVEINDUSTRIES
Petroleum
Tobacco
Beverages
Chemicals
Basic Metals
Rubber
E l e c t r i c a l Machinery
RELATIVELY LABOR-INTENSIVEINDUSTRIES
Food
Textiles
Glass and Glassware
Cement and Asbestos
Paper and Cardboard
Printing and Publishing
Non-electrical Machinery
Transport Equipment
Metal Products
Leather Goods
Other Industrial Products
Hood and Cork Products
Clothing
Shoes
Furniture
a - 1964/65 average;
Value-Added per Employee 1973National Average - 100
Total
632
348
276
124
102
101
100
95
93
88
82
87
75
78
73
67
67
54
51
37
36
35
b » less
Wages andSalaries
409
113
151
159
149
142
109
82
106
103
100
86
105
97
104
78
79
67
62
51
59
56
Chan 0.1 I .
Other
744
467
340
184
79
80
96
101
86
81
72
87
60
69
57
62
61
49
45
24
25
Exports as X ofTotal Exports of
Manufactured Goods
1965
2.8a
0.1
b
8.9
0.6
14.0
0.7
11.8
25.8
2.2
8.7
2.5
1.4
1.3
b
4.4
6.9
2.2
3.8
b
1970
0.5
b
b
9.5
1.5
1.7
1.5 -
12.1
21.6
4.6
5.0
8.4
2.7
2.6
1.7
3.2
6.1
6.5
6 .8
1.3
2.0
0.9
1973
n.a.
n.a.
b
10.0
2.2
0.9
0.7
2.4
19.8
1.3
2.5
2.7
2.1
0.4
0.7
5.4
6.9
17.9
4 .3
II.1
1.6
3.4
Export Share as Xof Industrial Output
1967
0.6
0.1
b
1.4
0.4
3.8
0.8
0.7
2.7
11.5
0.1
1.8
0.1
2.2
12.4
1.3
2.6
b
1973
n.a.
n.a.
b
6 .3
0.9
3.1
1.5
0.8
8.7
7.4
4.8
5.0
16.1
1.2
5.1
41.8
51.7
33.5
18.5
41.5
Sources; Computed from Boletin Mensual de Estatistica 283 (February 1975) and data from INCOMEX.

-64 -
Shares in the more labor-intensive industries have been increasing
substantially. It is now of particular interest to observe that within
this group there has been a shift from the intermediate to the most
labor-intensive industries. For those industries for which the relative
capital-intensities.are between 70 and 100 the export share rose from
52.4 % to 58.7 % between 1965 and 1970, but fell in the following years
to 31.9 %. On the other hand there was a substantial gain for industries
with capital-intensities below 60 from 18.8 % over 26.8 % and finally to
50.6 % during the same time period. A similar trend is visible in the
last column of Table 20, which lists the export shares of total produc-
tion in each industry. Export business seems to be of particular
importance for wood and furniture, leather goods and shoes, as well as
clothing and even for the machine producing industries. For all other
branches exports made up less than 10 % of total business, but all sharesi
have been increasing over the last few years.
The rising importance of Colombia as a low wage country in inter-
national business can be illustrated by the following example. Wages
in'the clothing industry of Hong Kong rose from $ 1.09 in 1963/64 to
$ 1.85 in 1967/68 and finally to $ 3.75 in 1971. In contrast to that
wages in Colombia fell from $ 2.20 in 1964 to $ 1.72 in 1967 and
remained at that level until 1971. If one considers that a large
part of the Colombian clothing exports comes .from the Freeport Zone of
Barranquilla, where ail imported inputs are duty free and internal trans-
port costs are minimal, the importance of relative wages becomes
immediately apparent.
4. Determinants of Colombia's Manufactured Export Performance
At this point it would seem to be appropriate to test the relation-
ship between export promotion and export success a little bit closer.
Two types of analysis will help us (1) to establish to what extent the
increase of Colombia's industrial exports are a function of their
increased level of competitiveness rather than a favourable development

- 65 -
in world markets and (2) to test the relationship of exchange rate
and other export promotion policies (as quantified in the concept of
the "real effective" exchange rate) with the change and fluctuations
of manufactured exports.
Table 21 gives the result of the constant-market share analysis,
which has been undertaken to analyze the export performance of Colombian
manufactures between 1960 and 1969. Clearly, the growth of world
trade benefited Colombian exporters. Under the assumption that it
took no special effort to maintain its constant share in world trade,
it can be hypothesized that 30 % of the increase of Colombia's manu-
factured exports of over $ 50 m. were simply the result of more
favorable world trade opportunities. A similar positive effect was
due to the composition of commodities which Colombia had to offer. The
demand for most of these goods grew more rapidly than the average.
On the other hand, the markets into which these products went were
characterized by a lack of dynamic expansion. As a matter of fact
the negative market distributions effect more than cancelled out the
positive market composition effect.
Colombia's increased efforts to compete in world markets are
reflected in the figures of the last row. For the nine^year period
the "competitiveness" effect accounted for nearly 75 % of expansion
of manufactured exports. But Table 21 shows also, how sensitive the
constant market share analysis is to the terminal years of the period
under consideration. From 1965 to 1969 the same effect only contri-
buted 25 % to the explanation of export growth, because Colombia did
not change its export share in total world manufactures between these
two years. A further breakdown into various regions showed that
Colombia's internal effort to become competitive was relatively more
important in the Andean and LAFTA countries (50 %) than in Europe
(83 %) or the U.S. (60 %) and other countries of the Western Hemis-58
phere (66 % ) . With respect to individual industries only two,
non-electrical machinery and furniture, showed a negative contribution

- 66 -
T*bl« 21
CONSTANT MARKET SHARE ANALYSIS OF THE
SOURCES OF CHANGE IN COLOMBIA'S MANUFACTURED EXPORTS 1960 - 1969
( t h . US-£, percentage change in brackets)
1960 - 1965 1965 - 1969 1960 - 1969
Actual Increase inColombia's export ofmanufactures
Effect of increase inworld trade ofmanuf ac tu re
26,246(100.00)
5,954( 22.69)
Net d i f ference .
Commodity compositioneffect
Market d i s t r i b u t i o neffect
Competitiveness ef fect .
5,890( 22.44)
-6.772(-25.80)
21.173( 80.68)
25,644(100.00)
25,675(100.47)
- 31
-2,989(-11.66)
-4.075(-15.89)
6.943( 27.08)
51,890(100.00)
15,677(30.21)
36,213
15,061( 29.02)
-17.376(-33.49)
38.528( 74.25)
Source: Evaldo A Cabarrouy, James J, Spillane, S.J., "La Experienola de Colombiaen materia de Exportaciones de Manufacturas en el periodo de 1960 a 1969",Revista de Planeacion y Desarrollo, 6.1 (January/March 1974), p. 68-73.

- 67 -
of internal factors to export growth. In general, the contribution of
the more traditional industries was above the same figure for the newer
and dynamic industries.
In addition to the above mentioned importance of lower wages, the
alleged rise of Colombia's competitiveness in world manufacture markets
could be caused by at least two other factors: (1) the improved
efficiency of Colombian industry, which should be reflected in higher
value-added / per worker figures and the output of better quality
products at lower prices, or (2) the increasing promotional efforts of
the public sector, which subsidized industries through fiscal, monetary
customs and foreign exchange policies.
The evidence with respect to productivity changes is mixed. The
shift from intermediate to traditional consumer goods in the export
structure was not accompanied by a similar shift in productivity
changes. Although the leading export industry textiles experienced a
43 % increase in productivity between 1967 and 1972 and the machine-
making industries raised their output per man-hour by 52 percent during
the same time period, annual productivity changes only amounted to 1 %
for shoes and furniture and were declining slightly for leather goods.
The question if the exchange rate matters, and by this is meant
the "real effective" exchange, rate, has been discussed widely in the59context of the analysis of non-traditional exports. In spite of
fairly high correlation coefficients many of the attempted regressions
are marred by serial correlation, since it can be expected that both
Colombian supply of and world demand for most manufactured goods
experienced outward shifts quite independently from price changes.
Due to several short-run fluctuations it becomes mandatory to use
quarterly data, but this may be critical for some manufacturing
branches which are only exporting a small share of their products to
other countries, and which suffer from large random fluctuations.

- 68 -
Finally, in hoping to increase the regression coefficients researchers
found that additional explanatory variables were not quite as indepen-
dent from the other variables as was desirable to avoid multicollinearity.
The following equation which regresses quarterly manufactured
exports (ESMAN) between 1966 and 1971 with the real effective exchange/ ER \
rate (-=yl and the benefit of belonging to the Latin American Free Trade
Association (LAFTA), seems to suffer from the latter problem.
ESMAN = 0.513 + 5.428 ^~ + 0.302 LAFTA R - 0.741(0.352) (4.771) F (1.183) DW = 2.039
Clearly, the real effective exchange rate played a significant role in
fostering manufactured exports in Colombia since 1967. This seems to
be less evident in the case of LAFTA, in spite of the previous
discussion of LAFTA's importance for Colombia's manufactured exports.
Besides the multicollinearity problem there may also be the problem
of the unavailability of quantum indices for manufactured exports.
5. The External Sector and its Impact on Price Stability
The most important aim of the export promotion policies had been to
close the foreign exchange gap which had jeopardized industrial develop-
ment in the Sixties. Colombia's capacity to import rose by 50 % and the
total value of imports increased from $ 500 mill, in 1967 to over $ 1
bill, in 1974. Considering the world inflationary situationjthe 60 % rise
of the "real" value of these imports should have been sufficient to
satisfy the rapidly increasing demand for raw materials and especially
capital goods needed by Colombian industry.
In spite of the rapid rise in imports, foreign exchange reserves
were accumulated, because a large amount of the non-traditional exports
were financed by foreign credits taken from the Eurodollar market.
Together with other short- and long-run capital inflows total foreign
exchange reserves rose to nearly $ 600 mill, in the first quarter of

- 69 -
1974. Desirable as it seemed for a country which had suffered from.an,
acute shortage of foreign reserves, their sudden inflow proved to be
rather inflationary in 1973 and 1974, i.e. their contribution to the
expansion of high-powered money amounted to 64.2 % and 55.1 % respec-
tively. Since the rather close links between increases in money supply
and increases in the price level have also been demonstrated to hold
true for Colombia, it is not difficult to blame at least part of the62
inflationary upsurge on the financing of the nontraditional exports.
Another cost of the export promotion program effected the aggregate
demand through the liberal granting of fiscal incentives. The direct
costs of the various programs are computed in Table 22. They have been
estimated to reach jS 2 bill, pesos in 1974, increasing their share of
total tax revenue from 3.5 % to 7.5 % within the last seven years. A
comparison with public investment shows that 12.8 % of these expenditures
could have been financed out of tax revenue instead of using the credits
from the central, bank, had it not been for the tax incentives and the' 63
exemptions fromscustom duties of the Plan Vallejo.
On the supply side the export diversification contributed in at
least two ways to raise prices. First, the policy of the "sliding peg"
increased the prices of imports continuously. The influence of a
father constant devaluation is reflected in the last-row .of Table 23
which shows the rate of inflation for capital goods, most of which were
still imported in the early 1970s. Compared to price increases of the
other goods, the inflationary rate was not accelerating but followed
father closely the rate of devaluation.
The second problem arose out of the conflict between supplying
domestic and foreign markets simultaneously. This was particularly
seridus for agricultural products, where the differences between inter-64nal and world market prices widened considerably. The government
attempted to solve the issue by decreeing restrictions on 30 %
of agricultural exports and 8 % of industrial exports, which ranged

- 70 -
Table 22
FISCAL COSTS OF EXPORT INCENTIVES 1961-1974
Year
1961
1962
1963
1964
1965
1966
1967
1968
1969
1970
1971
1972
1973
1974a
a The
Income tax
exemptions
24
36
63
54
78
148
133
-
-
—
-
-
-
data for 1974
Taxes paid
with CAT
Customsdutiesforegoneunder
Plan Vallejo
in mill, pesos
-
-
-
-
—
-
138
331
424
545
1,080
1,438
1,930
-
-
3
7
19
38
54
56
48
98
125
160
264
403
are preliminary.
in
nope
1
1
2
mill
Srt CoUi>
24
36
69
61
97
186
187
194
379
522
670
,240
,702
,333
Total fiscal costs
As percent
of total
tax revenue
1.1
1.7
2.3
1.6
2.3
3.0
2.7
2.3
3.5
4.2
4.2
7.3
7.5
7.5
As percent•
of public
investment
1.6
2.9
5.3
3.9
6.4
9.0
7.0
4.5
6.6
7.4
6.9
13.0
12.6
12.8
Source: Computed from Revista del Banco de la Republica and unpublished databy the same institution.

- 71 -
Tabl« 23
RATES OF INFLATION IN COLOMBIA 1970-74
(Changes in wholesale and export prices in %)
All Economic Sectors
Exports
Exports without coffee
Agricultural products
Industrial products
Food products
Beverages
Clothing and shoes
Textiles
Paper and cardboard
Chemicals
Metal products
Petrol and coal derivates
Capital goods
1971
11.5
2.6
11.0
18.4
9.5
6.3
12.0
10.5
15.6
10.0
8.0
-5.5
30.8
17.2
1972
18.3
22.9
20.5
15.2
15.1
15.8
20.5
11.2
14.4
12.5
7.0
15.4
24.9
19.3
1973
27.9
36.2
39.1
33.4
23.2
29.8
12.1
25.0
28.0
16.3
22.5
23.8
9.8
24.4
1974
35.9
48.0
82.2
33.5
38.5
35.2
23.5
36.8
61.2
46.6
43.2
74.4
43.1
27.8
Source; Revista del Banco de la Republica, April and December, 1974.
- 72 -
from construction materials like cement, steel and glass to chemicals
like fertilizers and pesticides. That these measures did not stop
prices from increasing can be seen from Table 23, where non-traditional
exports are shown to have experienced the most rapid inflation rates
since 1972.
6. Export Expansion, and its Effects on Growth, Employment and Efficiency
Simultaneously with solving the foreign exchange bottleneck it was
hoped that export diversification would stimulate industrial growth and
employment. Table 13 has shown that industrial output increased much
more rapidly between 1967 and 1973 than in the previous periods and
that the contribution of the export sector was at the order of 15 %.
Even more spectacular was the increase of labor absorption into the
secondary sector which rose from 1.5 % to 8.3 %.
A more detailed calculation of the export multiplier effects are
shown in Table 24. The expansionary effects of industrial exports on
aggregate demand, imports,and employment are the product of the change
in industrial exports converted into constant purchasing-power pesos and
the various multipliers which are estimated from an inverted input-
output table of 1968. Although not all industries experienced
increases of the real value of their exports, the net impact of the
export expansion should have been substantial and accelerating as
columns 2 and 3 demonstrate. Taken as a percent of total industrial
growth the rates were 18.2 % and 24.6 % for the 1967/70 and 1970/73
periods. It is also interesting to note that the real value of
imports should have remained rather constant during the two periods,
confirming the above made observations that there has been a struc-
tural change within the industrial export sector from more capital-
intensive and import dependent intermediate goods industries to the
more traditional non-durable consumer goods industries, which are both
using more domestic inputs and labor.

- 73 -
Table 24
MULTIPLIER EFFECTS OF EXPORTS 1967-73
(in 1968 mill. Pesos)
Industries
Food Products
Beverages
Tobacco
Textiles
Clothing and Footwear
Wood and Cork Products
Furniture
Paper and Paper Products
Printing and Publications
Leather and Leather Products
Rubber Products
Chemicals
Petroleum and Coal Products
Other Non-metallic MineralProducts
Basic Metals
Fabricated Metal Products
Non-electrical Machinery
Electrical Machinery
Transport Equipment
Miscellaneous
T O T A L
ChangesIndustrial
1967-70
111.5
0.6
0
210.0
48.9
101.5
14.8
-25.4
43.7
35.1
-10.6
87,6
7.6
71.4
16.7
18.8
45.7
217.5
38.8
156.4
1,190.6
inExports
1970-73
-97.3
0.7
1.8
467.4
480.9
68.0
128.1
-24.3
42.0
187.8
9.6
216.9
-7.8
29.6
156.8
69.0
73.3
-198.6
-8.8
583.0
2,178.1
ResultingAggregate Demand
1967-70
225.3
1.0
0
388.5
117.7
187.6
17.0
-51.2
69.2
78.8
-16.3
124.2
15.1
124.0
39.0
32.0
76,8
346.3
58.1
235.7
2,068.8
1970-73
-196.6
1.1
2.4
864.7
1.157.5
125.7
147.1
-48.9
66.5
421.4
14.7
307.6
-15.5
51.4
366.0
119.1
123.2
-316.2
13.2
878.6
4,083.0
Changes inEmployment (in 1000)
1967-70
3.79
0.01
0
3.96
1.78
3.03
0.35
-0.30
0.79
0.71
-0.14
0.85
0.10
2.04
0.24
0.35
0.98
3.05
0.84
1.85
24.3
1970-73
-3.31
0.01
- 0.02
8.82
17.53
2.03
3.06
-0.29
0.76
3.83
0.12
2.10
-0.10
0.85
2.22
1.27
1.57
-2.79
-0.19
6.90
44.4
Changes inImports
1967-70
10.7
0
0
20.4
1.9
2.7
0.1
-4.7
9.3
4.9
-2.5
21.7
I.I
7.4
3.1
3.5
11.7
63.8
13.5
19.9
188.5
1970-73
-9.4
O.I
0.1
45.4
19.0
1.8
0.8
-4.5
8.9
26.1
2.3
53,7
-1.1
3.1
28.8
13.0
18.8
-58.2
-3.1
74.1
219.7
Source: Computed from Departamento Nacional der Planeacion, Aspectos cuantitativos del plan de desarrolo,Bogota 1973 and INCOMEX data. : "

- 74 -
Similar to the experience in other Latin American countries
Colombia's import substitution policies have not been able to provide
many employment opportunities for the rapidly rising population. The
annual labor absorption rate of 3*5% had already been modest during
the first phase of post-war industrialization in Colombia; the 1.5 %
increase during the Sixties became completely insufficient to contribute
in any way to solving the unemployment problem. Consequently a massive
redistribution program was proposed to enlarge the domestic market and
stimulate the demand for labor-intensive goods. Colombia chose,
however, to follow the "leading sector" approach, which hoped to raise
employment by concentrating resources in the construction and export68sector.
The employment effects of the latter are shown for the industrial
sector in Columns 6 and 7 of Table 24; The estimated increase of new
jobs created by industrial exports was nearly 70 thousand between 1967
and 1970. This may not be much for a country where a population of 23
mill, is still increasing by over 3 % a year, but if one relates that
figure to total employment increases in the manufacturing sector which
was 156 thousand during the same period, it becomes evident that the
acceleration of the industrial employment rate from less than 2 to over
8 % owes the export expansion drive a good part of its improved perfor-
mance. Table 24 also shows the significance of the textile as well as
the clothing and shoe manufacturing sector, the exports of which contri-
buted 45 % to total employment increases.
Orthodox economists have concentrated their criticism of the import
substitution strategy on the issue of efficiency, maintaining that
highly protectionist policies have led to serious misallocation of
resources in the economies of many LDCs. Is it possible to evaluate
the effects of export diversification1on micro- and macro-economic
efficiency more favorably? The previous analysis of increasing the
labor-intensity of Colombia's export industries
seems to give a positive answer. Export diversification has led to

- 75 -
using the comparative advantage of Colombia to produce goods based on
rich natural resources and relatively cheap labor. Two other indicators
for measuring economic efficiency would be the rate of capacity utiliz-
ation and the change of the effective rate of protection.
Several recent studies agree that capacity utilization has been
relatively high in Colombian industry in the last year. The average
number of working hours per day increased from 13.7 in 1961 to 16.8 in
1970. It is, however, interesting to note that there has been no
increase during the years of the export boom between 1970 and 1974. The
major reason seems to be the fact that the export-intensive industries
like clothing and shoes, leather goods, as well as furniture and wood
are seldomly working more than one shift. Although there are some
problems regarding night work due to government regulations, the major
reason for the unwillingness of the entrepreneurs of small and medium
sized firms to engage in multiple shift production seems to lie in the
lack of supervisory personnel and the inability to delegate decision-
making to employees.
It: is then not surprising to find rising expenditure for plant
equipment in Colombian industry. Capital goods imports increased from
an annual average of $ 230 mill, in 1966 and 1967 to $ 350 mill, per
year between 1968 and 1973. At the same time the share of capital
formation in gross domestic product rose from 18.3 to 20.2 %.
With respect to the second indicator of economic efficiency,
effective protection of Colombian industry has rather increased in the
last few years. The overall rate rose from 29.2 % in 1969 to 35.2 %7?
in 1972 and 38.9 % for 1974. The changes in normal and effective
rates of protection are similar: small decreases of the rates for
intermediate goods are more than compensated for by increasing rates
for traditional consumer goods (especially beverages and tobacco),
and some capital goods (electrical machinery and household goods).

- 76 -
The possible misallocation of resources which result from a mixture
of protection and export incentives can be demonstrated with the73following example, which seems to fit the Colombian case. Assumed
the world market price for a good equals $ 100 and the tax subsidy is
18 %. If imported inputs amount to $ 40, value-added at world market
prices will be $ 60, whereas value-added in Colombian prices will be
$ 78, i.e. effective protection reaches 30 % (18/60). If imported
inputs are increased to 50 - a case which has actually occurred due to
the provision of the Plan Vallejo - effective protection rises to 36 %
(18/50). If, in addition, the manufactured product is exported to a
protected market, where the price of the product is 50 % over its world
market quotation, effective protection will become 154 % (77/50). It
is interesting to note in this context that import intensity and prices
of most industrial products going to other Latin American countries
(LAFTA and Andean group) are indeed above the values for those goods
going to the industrialized world.
In short, the "comparative advantage" improvements which seem to
have resulted from Colombia's industrialization strategy of export
promotion and diversification has neither been supported by better
capacity utilization nor by lower effective protection. There are,
however, indications that the government is attempting to remedy this
situation. The rationale behind the decrease in the tax certificate
from 15 % to 5 % for industrial exports was not primarily to lighten
the fiscal burden but to "expose the Colombian industrial entrepreneur74
to the strong winds of international competition'.1 The growing
significance of trading companies in furthering manufactured exports
is another sign of a division of labor which should lead to higher
efficiency of the whole foreign trade sector, although the high degree
of concentration in Colombian exports would seem to have negative
implications for income distribution.

- 77 -
7. Problems and Possibilities of Increasing Manufactured Exports in
Colombia
The growth and diversification of Colombia's industrial exports
within a period of less than ten years prove that a determined strategy
can lead to favorable results, especially in times where world markets
are expanding rapidly. It has, however, become clear that besides the
positive effects on the balance of payments as well as on industrial
output and employment, the export expansion drive led to shortages of
certain domestic supplies and contributed to inflate the price level
through excess demand for money. Moreover, the far reaching incentives
have been granted rather liberally without any major concern of
improving efficiency or income distribution which had already become
more unequal during the period of import substitution industrialization.
It was therefore only logical that the new government which cameto combine
to power in the fall of 1974 tried#an anti-inflationary policy with
attempts to improve the incentive system and with it further the
efficiency of Colombian export industry. Unfortunately, world
recession with increasing tendencies to protect endangered industries
in advanced countries added another problem to many Colombian exporters
to expand their sales abroad. In addition, there are still a number
of obstacles, such as lack of credit, insufficient supply of inputs and
bad transport conditions which had been pointed out by a great number
of exporting firms during a 1973 survey. The first two problems are
directly related to the rapid rise of both Colombian and world exports
in the past few years, both of which have slowed down considerably
since the end of 1974. In addition, more credit has been channelled
to exporters since the beginning of 1975, partly to compensate for the
loss of the tax subsidies. On the other hand, the transport problem
cannot be solved in the short-run, because the infrastructure of
Colombia's mountainous territory is still insufficiently developed.
In addition, maritime transport is characterized by a lack of organiz-
ation. This is especially serious in the major ports of Bueneventura,

- 78 -
Barranquilla, Cartagena and Santa Marta where the estimated loss of
export and import goods amounts to over $ 2 mill, annually.
In spite of these difficulties which Colombian exporters are
currently facing the prospects for the medium and long run would seem
favorable. With regard to the traditional industrial goods Colombia's
share in total world exports is still very small, reaching 10 % for
leather good imports and hardly 1 % for clothing and shoe imports by78
the United States. Competition in world markets of these labor-
intensive goods is, however, stiff and a sudden rise in labor costs
can signify a substantial loss in sales.
The prospects of increasing industrial exports to other countries
in the Andean market are more assured and offer the possibility to
diversify industrial production of capital goods. This is true for
agricultural machinery, which Colombia has been already exporting for
a number of years in increasing amounts as well as new industries, such
as the production of cutlery and medical equipment, in which import
substitution and export diversification will have to take place
simultaneously. The estimated demand for these selected groups of
products for 1980 amount to % 286.8 mill., part of which ($170 mill.) will be
provided by similar industries in Chile, Peru and Colombia. Even then,
the productive capcities which are planned to be in operation in
Colombia by that time amount to only 0 75 mill, worth of production.
This would mean that the major flow of industrial exports should be
in the direction of Latin American markets. If one considers the
higher income elasticity of demand for engineering products and
the rapidly rising income of Colombia's oil-rich neighbors Venezuela
and Ecuador,it should become obvious that the structure of the indus-
trial exports will continue to reove away from traditional goods
and markets.
- 79 -
F o o t n o t e s
1. For Brazil see for example, J. Bergsman, Brazil. Industrializationand Trade Policies, (London: Oxford University Press, 1970); andWilliam Tyler, "Manufactured Export Expansion and Industrialization inBrazil", mimeo., (Kiel 1974). For Mexico the OECD country study waswritten by Timothy King, Mexico, Industrialization and Trade PoliciesSince 1940, (London: Oxford University Press, 1970). See also LotteMuller-Ohlsen, Importsubstitution und Exportdiversifizierung im Indus~trialisierungsprozess Mexikos - Strategien, Ergebnisse, Perspektiven,(Tubingen: J.C.B. Mohr, 1974). Both countries are also discussed inB. Balassa, The Structure of Protection in Developing Countries,(Baltimore: The Johns Hopkins Press, 1971). Argentina was included inthe general OECD survey by I. Little, T. Scitovsky and M. Scott, Industryand Trade in Some Developing Countries. A Comparative Study, (London,New York, Toronto: Oxford University Press, 1970). See also Jorge M.Katz, Production Functions, Foreign Investment and Growth - A Study Basedon the Argentine Manufacturing Sector 1946-1961, (Amsterdam - London:North-Holland Publishing Co., 1969).
2. These percentages are computed according to the SITC classificationof industrial goods (groups 5 - 8 , except 68). The ISIC classificationleads to a 25 % participation of industrial goods in total exportsduring 1973 and nearly 30 % in 1974.
3. This theme was first discussed by Raul Prebisch, The EconomicDevelopment of Latin America and its Principal Problems (New York:United Nations, 1950).
4. For a discussion of 19th century economic policies and their effecton the Colombian economy see William Paul McGreevy, An Economic Historyof Colombia (Cambridge University Press, 1971). See also, FrankSafford, "Foreign and National Enterprise in Nineteenth CenturyColombia", Business History Review, Vol. 39, No. 4 (Winter 1965),pp. 503-527.
5. These data are recorded and commented by P.C. Bell, Colombia, ACommercial and Industrial Handbook, US Department of Commerce, Bureauof Foreign and Domestic Commerce, Special Agent Series No. 206,Washington, D.C.: Government Printing Office, 1921, p. 180.
6. United Nations, Economic Commission for Latin America, Analysesand Projections of Economic Development, III, The Economic Developmentof Colombia, New York: United Nations, 1955.
7. Celso Furtado, The Economic Growth of Brazil (Berkeley andLos Angeles: University of California Press, 1963); Alexandre Kafka,"The Theoretical Interpretation of Latin American Economic Development",in Howard S. Ellis, ed., Economic Development for Latin America(London: Macrnillan, 1961), pp. 1-28.

- 80 -
8. In a recent article on Colombia's economic development processParra Pena speaks of non-intentional industrialization, maintaining thatfiscal and other policy measures were implemented to equilibrate thebalance of payments and the public budget. See, Isisdro Parra Pena,"Colombia: Crecimiento y Desequilios", El Trimestre Economico,Vol. 39, No. 2 (April-June, 1972), pp. 295-316.
9. Recovery was only possible through the rapid increase of thevolume of exports.
10. Exchange rate policies were to play a crucial role in Colombia'sattempt to stabilize the balance-of-payments problems it faced aftercoffee prices fell from over 70 cents per pound in 1954 to less than 38cents per pound in 1963. Since the aim of exchange rate manipulationswere mainly to compensate for the fluctuations in foreign trade andnot provide protection for domestic industry, this policy tool will bediscussed in the context of export promotion policies.
11. T.L. Hutcheson, "Incentives for Industrialization in Colombia",dissertation, Department of Economics, University of Michigan, Ann Arbor,1973.
12. C. Diaz-Alejandro, "Foreign Trade Regimes and Economic Development.Volume IXs Colombia", mimeographed, National Bureau for Economic Research,1975, p. 229.
International Bank for Reconstruction and Development13. /(IBRD),Economic Growth of Colombia: Problems and Prospects, Reportof a mission sent to Colombia in 1970 headed by D. Avramovic, (Baltimoreand London; The Johns Hopkins Press, 1972), ch. 7.
14. These bottlenecks, particularly in spare parts for machinery andequipment, were partly met by smuggling, which plays a rather importantrole in Colombian foreign trade.
15. Diaz-Alejandro, op.cit., ch. III.
16. Manuel M. Roba, Obstaculos al desarrollo de exportaciones manu-facturadas (Bogota, FEDESARROLLO, 1974).

- 81 -
17. M. Nitsch, Entwicklungsfinanzierung in Lateinamerika - dargestelltam Beispiel Kolumbiens (Stuttgart: Ernst Klett Verlag, 1970), p. 32.
18. Ibid., ch. IV.
19. The tax subsidies for non-traditional exporters will be discussedin chapter III.
20. R. Bird, Taxation and Development, Lessons from ColombianExperience (Cambridge/Mass: Harvard University Press, 1970), p. 135.
21. Joint Tax Program of the Organization of American States and theInter-American Development Bank, M.C. Taylor, mission chief, FiscalSurvey of Colombia (Baltimore: The Johns Hopkins Press, 1965); Commissionon Tax Reform, Richard R. Musgrave, President, Tax Reform for Colombia(Harvard University Press, 1972).
22. IBRD, op.cit., p. 116.
23. Colombia, Banco de la Republica, Sintesiss Cuentas Nacionales deColombia, 1950-1967, 1967-1970 (Bogota, 1969 and 1972); United Nations,Economic Commission for Latin America, "Public Enterprises;: theirpresent signifixahce and their potential in development", EconomicBulletin for Latin America, 16.1 (1971), pp. 1-70.
24. L. Whitehead, "Public Sector Activities in Latin America", inKeith Griffiths, ed., Financing Development in Latin America (London:MacMillan, 1971).
25. L. Currie, "The Colombian Plan 1971-1974: A Test of the LeadingSector Strategy", World Development, 2, 10-12 (October/December 1974),pp. 69-72.
26. See for example, S.A. Mbrley and G,W. Smith, "Oh the Measurementof Import Substitution", American Economic Review, 60 (1970),pp. 728-735.
- 82 -
27. Bernard E. Munk, "The Colombian Automotive Industry1,' Economicand Business Bulletin Vol. 23, Mo. 1 (Fall 1973), p. 6.
28. Lauchlin Currie, Accelerating Economic Development, the Necessityand the Means (New York: McGraw Hill, 1966); the results of the 1961survey are discussed by Francisco Thoumi, "Industrial Capacity Utiliz-ation in Colombia", mimeographed, Washington, 1974.
29. International Labor Office, Tovrards Full Employment, A Programmefor Colombia, prepared by an inter-agency team organized by theInternational Labor Office. Geneva: International Labour Office, 1970,p. 18.
30. International agencies have lent long-term capital at 15 %;interest and principal were to be repaid in local currency. Consideringthat the average devaluation of the peso was around 10 % and the dollarvalue fell by nearly 5 %, the real interest was probably zero.
31. International Labour Office, op.cit., p. 205. On the other hand,real wages increased very little between 1964 and 1969.
32. Departamento Nacional de Planeacion, "Breve Esquema sobre elProblema del Desempleo en Colombia", U.P.G. - 02 (June 1970).
33. Centro de Investigaciones Econondcas (C.l.'E.), Universidad deAntioquia, Contribuicion al Estudio del Desempleo en Colombia(Bogota: Departamento Administrativo Nacional de Estadistica, 1971),pp. 140-152.
34. David Morawetz, "Import Substitution, Employment and ForeignExchange in Colombia: No Cheers for Petrochemicals", Research ReportNo. 47, The Hebrew University of Jerusalem, 1973, p. 6.
35. Departamento Nacional de Planeacion, Aspectos cuantitativos delplan de desarrollo (Bogota, Canal Ramirez, 1973).
36. International Bank for Reconstruction and Development, op.cit.,p. 185.
37. The current account deficit is computed in constant dollars of1958 and takes the "terms-of-trade effect" into account.
- 83 -
38. Munk, op.cit., p. 6.
39. Morawetz, op.cit., p. 9; and Carlos F. Diaz-Alejandro, "Nota sobreuna Metodologie para evaluar Proyectos Relacionados con e SectorExterno", (mimeo.), Bogota: FEDESARROLLO, 1972.
40. Hutcheson, op.cit., p. 19.
41. Departamento Administrativo Nacional de Estadistica (DANE),"Concentration en la industria Colombiana", Boletin Mensual deEstadistica, 266 (September 1973), pp. 99-152.
42. Ibid., pp. 124-26.
43. Morawetz, op.cit., pp. 4-5.
44. Leonard Dudley, "Learning and Productivity Change in Metal Products",American Economic Review, Vol. 62, No. 4 (September 1972), pp. 662-669.
45. Luis Ospina Vasquez, Industria y Proteccion en Colombia 1810-1930(Medellin: Editorial Santa Fe, 1955).
46. Before 1962 bananas and precious stones were occasionally includedin traditional exports.
47. S. Heldt, "Exportforderung in den Landern der Andengruppe mitbesonderer Bariicksichtigung Kolumbiens", Die Weltwirtschaft, Tubingen,1973, 1; J.D. Teigeiro and R.A. Elson, "The Export Promotion Systemand the Growth of Minor Exports in Colombia", International MonetaryFund, Staff Papers, Vol. 20, No. 2 (July 1973), pp. 419-470.
48. This assumes that relative prices for export products remained thesame and that the rise in Colombian over U.S. prices reflected both theincrease of production costs in Colombia and the actual increase inproduction costs of Colombia's trading partners. For an attempt tocompute production costs in Colombia see Richard T. Nelson, et al.,Structural Change in a Developing Economy, Colombia's Problems andProspects (Princeton, N.J.: Princeton University Press, 1971),pp. 208-9.
49. FEDESARROLLO, "Encuestra Industrial, Situacion y Perspectivas dela Industria, Conyuntura Economica, Vol. 2, No. 4 (December 1972),p. 11.

- 84 -
50. M. Bernhart and M. Martinez, Canales de Inforroacion para losExportadores Colombianos (Bogota: FEDESARROLLO: 1973).
51. Heldt, op.cit., pp. 35-36.
52. The factor-intensities have been computed following the Larymethod. See Hal B. Lary, Imports of Manufactures from Less DevelopedCountries (New York:, National Bureau of Economic Research 1968).
53. It should also be remembered that the chemical industry comprisesa large number of products including Pharmaceuticals and plasticproducts, both of which showed above average export performance andbelow average capital intensities.
54. Data are taken from Gabriel Turbay, "Una Politica Industrial paraestimular las exportaciones y fomentar el empleo", mimeo. (Bogota:FEDESARROLLO, 1972).
55. How sensitive these exports are to wage changes can be surmised bythe 40 % decrease in output and employment in 1974, after minimum wageshad been increased by %. It should also be remembered that the slackin world demand beginning in 1973 also affected Colombian textile exportsnegatively.
56. Evaldo A. Cabarrouy and James J. Spillane, "La Experiencia deColombia en materia de Exportaciones de Manufacturas en el periodo de1960 a 1969", Revista de Planeacion y Desarrollo, Vol. 6, No. 1 (January/March, 1974), pp. 51-86.
57. Latin America's participation in world trade fell during most ofthe Fifties and Sixties and even during the export drive in the earlySeventies the export share in total world exports fell from 5.6 to5.0 % and the import share from 5.8 to 5.6 %.
58. Cabarrouy and Spillane, op.cit., pp. 70-71..
59. For the evidence in Colombia see for example: J. Sheahan and S.Clark, "The Response of Colombian Exports to Variations in EffectiveExchange Rates", Center for Economic Development, Research MemorandumNo. 11, Williams College, Williamstown, Mass., June 1967; Nelson,op.cit., ch. VI, Diaz-Alejandro, op.cit., ch. II, and A. Urdinola andR. Mallon, "Policies to Promote Colombian Exports of Manufactures",Center for International Affairs, Economic Development Report No. 75(Harvard University, September 1967).

- 85 -
60. If one assumes world demand for Colombia's non-traditionalproducts to be infinitely elastic, then only the problem of theshifting supply curve remains.
61. Teigeiro and Elson, op.cit., p. 450.
62. Alberto R. Musalem, Dinero, Inflacion y Balanza de Pagos: laExperiencia de Colombia en la Post-Guerne (Bogota: Banco de laRepublica, 1971); Asociacion Nacional de Instituciones Financieras(ANIF), Inflacion 1974 (Bogota: Ediciones Tercer Mundo 1974),pp. 219-228.
63. Besides the direct costs it is also possible to compute indirectcosts due to the exchange rate differential between manufactured exportsand the imports these exporters use as inputs. Teigeiro and Elsonhave estimated these subsidies to amount to 1.4 bill, pesos in 1972,which was slightly above the direct costs of 1.24 bill, pesos for thesame year. In the late Sixties the indirect costs' relation share wassubstantially higher.
64. A good example was the sugar price, which had reached 47 i perpound in world markets whereas the official domestic price in Colombiaremained at 7 i.
65. Departamento Nacional de Planeacion, Aspectos Cuantitativos delPlan de Desarrollo (Bogota: Canal Ramirez-Ant ares, 1972).
66, It should be remembered that these multiplier effects areestimating potential changes in total aggregate demand, which include- although to a much smaller degree - changes in agriculture andservices.
67. International Labour Office, op.cit., ch. 10.
68. Corporacion para el Fomento de Investigaciones Economicas,Controversig Sobre el Plan de Desarrollo (Bogota: Editorial laOveja Negra, T9~72) and Departamento Nacional de Planeacion, El Plande Desarrollo Colombiano en Marcha (Bogota: Ediciones Tercer Mundo,1974).

- 86 -
69. In addition "domestic resource costs" would be a suitable measureof allocative efficiency. As mentioned, above, however, we have onlya few rough estimates, which indicate that the more labor-intensiveproducts have substantially smaller DRCs than the newer more capital-intensive industries.
70. Thoumi, op.cit., p. 25 and FEDESARROLLO, Conyuntura Economica(April 1973).
71. Thoumi found the difference between corporate and non-corporateorganization of business to be the most important explanatory variablefor differences in utlization.
72. These rates have been computed according to the Corden conceptfor 1969 by Hutcheson, op.cit., p. 68 and for 1972 and 1974 byFEDESARROLLO, Conyuntura Economica (December 1974).
73. This example is taken in a slightly modified form from C. Diaz-Alejandro, op.cit., ch. II, p. 35.
74. Opening remarks by Finance Minister Rodrigo Botero at the NBERconference on "Foreign Trade Regimes and Economic Development" inBogota, April 26 to 28, 1975.
75. For 1970 it has been estimated that only 24 firms handled 62 % oftotal industrial exports. See C. Diaz-Alejandro, "Some Characteristicsof Recent Export Expansion in Latin America", in H. Giersch, ed.,The International Division of Labor, Problems and PerspectivesTubingen: J.C.B. Mohr, 1974). Our estimates for 1974 found thatconcentration had further increased. 14 firms had exports over $ 5mill., which amounted to 58 % of total industrial exports for 1974.A more detailed discussion of the concentration of Colombian industryin general and of manufactured exports particularly will be part of afuture working paper.
76. Manuel M. Roba, Obstaculos al desarrollo de exportaciones manu-facturadas (Bogota: FEDESARROLLO, 1974).
77. The problems of Colombian ports were discussed in a series ofarticles of the major daily paper of Bogota, El Tiempo in April 1975.
78. Jean Currie, La Exportacion de Productos Colombianos seleccionados(Bogota: FEDESARROLLO, 1974).
Kieler Arbeitspapiere - (Kiel Working Papers):
1. M. Girgis, Labor Absorptive Capacity of Export Expansion andImport Substitution in Egypt, 1954 to 1970. Kiel, July 197332 pp.
A.D. Neu, Adjustment in the Textile and Clothing Industry. TheCase of West Germany, Kiel, November 1973, 32 pp.
3. W. Koschorreck, Antidumpingrech't in Befeich der BundesrepublikDeutschland. Kiel, November 1973,26 S.
4. H.R. Kramer, The Changing Principles of International TradePolicy. Kiel, November 1973, 17 pp.
* S. Heldt, Exportforderung in Lateinamerika, insbesondere in denAndenlandern. Eine Bestandsaufnahme. Kiel, November 1973, 31 S.
6. U. Hiemenz und K.v. Rabenau, Effective Protection of West GermanIndustry. Kiel, December 1973, 47 S,
7. W. Koschorreck, Die paratarifaren Handelshemmnisse bei Einfuhrin die Bundesrepublik. Kiel, Dezember 1973, 24 S.
8. H.R. Kramer, "Technische Hemmnisse" bei Einfuhren in dieBundesrepublik Deutschland; Gesundheitsschutzbestimmungen,Sicherheitsvorschriften, Normen und Maflnahmen zum Schutz derUmwelt. Kiel, Dezember 1973, 44 S.
9. R.J. Langhammer, Der IntegrationsprozeB in Zentralafrika.Kiel, Dezember 1973, 31 S.
10. J.B. Donges, The Economic Integration of Spain with the E.E.C.Problems and Prospects. Kiel, December 1973, 28 pp.
11. W. Koschorreck, Nichttarifare Handelshemmnisse durch Pramien,Subventionen und Ausgleichszolle. Kiel, Januar 1974, 32 S.
Mit den Kieler Arbeitspapieren werden Manuskripte, die aus der Arbeitdes Instituts fur Weltwirtschaft hervorgegangen sind, von denVerfassern Interessenten in einer vorlaufigen Fassung zuganglichgemacht. Fur die Verteilung ist der Autor verantwortlich.

12. R.J. Langhammer, Common Industrialization Policy in SmallIntegration Schemes. The Central African Approach. Kiel,February 1974, 34 pp.
13. K. Bieda, Export Performance and Potential of Singapore. Kiel,March 1974, 78 pp.
14. G. Fels, Assistance to Industry in West Germany. Kiel, March1974, 42 pp.
15. H.R. Kramer, Nichttarifare Handelsschranken in offentlichenAuftragswesen der Bundesrepublik Deutschland. Kiel, Marz 1974,48 S.
16. A.D. Neu, Okonomische Implikationen einer Reform des Strafvoll-zuges. Kiel, April 1974, 27 S.
17. S. Heldt, Die zentralainerikanische Integrationsbewegung, einErfolg? Kiel, Mai 1974, 40 S.
18. R.J. Langhammer, Probleme und Perspektiven von Gemeinschafts-unternehmen in Rahmen einer regionalen Integration von "leastdeveloped countries". Kiel, Mai 1974, 29 S.
19. S. Heldt, Zur Messung von Integrationseffekten in zentral-amerikanischen gemeinsamen Markt. Kiel, Juni 1974, 40 S.
20. J. Riedel, Factor Proportions, Linkage and the Open DevelopingEconomy. Kiel, July 1974, 20 pp.
21. H.R. Kramer, The Principle of Non-Discrimination in Inter-national Commercial Policy. Kiel, July 1974, 68 pp.
22. R.W.T. Pomfret, Israeli Policies Towards Imports of ManufacturedGoods. Kiel, August 1974, 70 pp.
23. F. Weiss and F. Wolter, Machinery in the United States, Sweden,and Germany - An Assessment of Changes in Comparative Advantage.Kiel, September 1974, 56 pp.
24. J.B. Donges and R. Banerji, The Domestic Resource Cost Concept -Theory and an Empirical Application to the Case of Spain - .Kiel, November 1974, 38 pp.

25. H. Vogele, Die Entwicklung der Wirtschaftsstruktur und desArbeitsplatzeangebots in den Landern der BundesrepublikDeutschland bis 1985. Kiel, Januar 1975, 74 S.
26. C.R. Chittle, The Industrialization of Yugoslavia under theWorkers' Self-Management System: Institutional Change andRapid Growth. Kiel, January 1975, 71 pp.
27. R.W.T. Pomfret, Export Policies and Performance in Israel.Kiel, February 1975, 88 pp.
28. C.R. Chittle, Yugoslavia under the Workers' Self-ManagementSystem: Growth and Structural Change in the External Sector.Kiel, March 1975, 59 pp.
29. F. Wolter, Engineering Exports of Less Developed Countries.Kiel, March 1975, 50 pp.
30. R. Vaubel, Neglected Aspects of the Parallel-Currency Approachto European Monetary Unification. Kiel, March 1975, 66 pp.
31. J.P. Wogart, From Import Substitution to Export Diversificationin Colombia. Kiel, July 1975, 86 pp.