Understanding the Future Impacts of Electric Vehicles ... - MDPI
Upload
khangminh22Category
view
0download
0
1E
LE
CT
RIC
VE
HIC
LE
S: M
IR 2
022
2022 ELECTRIC VEHICLES MARKET INTELLIGENCE REPORT

IE
LE
CT
RIC
VE
HIC
LE
S: M
IR 2
022
GreenCapeGreenCape is a non-profit organisation that works at the interface of business,
government, and academia to identify and remove barriers to economically viable green economy infrastructure solutions. Working in developing countries, GreenCape catalyses the replication
and large-scale uptake of these solutions to enable each country and its citizens to prosper.
AcknowledgementsThis market intelligence report was produced in partnership with the Western Cape Government
Department of Economic Development and Tourism. We thank Wilberforce Chege and Jack Radmore for the time and effort that they have put into compiling this market intelligence report. We also
thank Hiten Parmar, Director at uYilo e-Mobility Programme for his external review of this document.
DisclaimerWhile every attempt has been made to ensure that the information published in this
report is accurate, no responsibility is accepted for any loss or damage to any person or entity relying on any of the information contained in this report.
Copyright © GreenCape 2022
Cover image courtesy of Unsplash.
This document may be downloaded at no charge from www.greencape.co.za. All rights reserved.
Subscribe to receive e-mail alerts or GreenCape news, events, and publications by registering as a member on our website: www.greencape.co.za
42 Hans Strijdom Ave, Foreshore, Cape Town, 8001
Author: Wilberforce W. Chege Editorial and review: Jack Radmore, Cilnette Pienaar, Lauren Basson, Nicholas Fordyce and Prian Reddy Images: BMW South Africa, Unsplash and District Watch Group Layout and design: Tamlin Lockhart

ELE
CT
RIC
VE
HIC
LES
: MIR
20
22II
431
0 2
South African industry overview 223.1. South African automotive market supply 223.2. The impact of COVID-19 293.3. South Africa and the Western Cape automotive market demand 30 3.3.1. Commuter behaviour and travel patterns in South Africa and the Western Cape 303.4. An overview of the development of SA’s EV industry 313.5. The South African EV value chain 38 3.5.1. Skills development in the Western Cape 393.6. Other disruptors to the automotive value chain and the skills requirements 413.7. Potential impacts of EV market growth on the ICE value chain and economy 44 3.7.1. The effect of EVs on oil imports, the balance of
trade and Government revenue 453.8. Market sizing and dynamics 47 3.8.1. The EV passenger vehicle market 47 3.8.2. The public and industrial EV market 50 3.8.3. Charging infrastructure and network 513.9. Market drivers: EV and charging infrastructure 57 3.9.1. Macroeconomic drivers 57 3.9.2. Local demand drivers 613.10.Market barriers 65 3.10.1. Products that are not fit for the South African market 65 3.10.2. High import duties 66 3.10.3. Lack of policy certainty and support for EVs 67 3.10.4. Lack of local skills throughout the value chain to facilitate market growth 67
Executive summary 1What’s new? 7
Policy and regulation 694.1. Automotive Production and Development Programme (APDP) (2013-2021) 714.2. The South African Automotive Masterplan (SAAM) 2021 – 2035 714.3. Green Transport Strategy (GTS) for South Africa: (2018 – 2050) 734.4. Procurement Policy Framework Act (PPPFA) of 2000 734.5. The National Climate Change Response Policy (NCCRP) (2011) 744.6. The Carbon Tax Act 15 of 2019 734.7. Nationally Determined Contributions 744.8. City of Cape Town Climate Change Strategy 75
Global industry overview 19
Introduction and purpose 13
CONTENTS
GreenCape’s support to businesses and investors 97
Market opportunities 775.1. Local manufacturing and electrification of public transport 795.2. Lithium-ion battery production 815.3. Passenger vehicle manufacturing 855.4. EV use in construction, retail, and underground mining 87
Funding and incentives 896.1. General database web page 91 6.1.1. Green Finance Database 91 6.1.2. Government funding and incentives database 91 6.1.3. Finfind database 93 6.1.4. AlliedCrowds database 93
References 99
The Western Cape: Africa’s growing greentech hub 93
6 875 9
IIIE
LE
CT
RIC
VE
HIC
LE
S: M
IR 2
022
ELE
CT
RIC
VE
HIC
LES
: MIR
20
22IV
Figure 1: Investment opportunities ranked according to growth potential and ability to overcome market entry barriers 5Figure 2: Global EV sales in recent years 12Figure 3: Leading countries with the highest proportion of EVs in new passenger car sales 13Figure 4: South Africa’s total final consumption (TFC) of Energy by sector, 1990-2018 15Figure 5: Leading EV markets globally in terms of total EV stock 19Figure 6: Plug-in electric vehicle sales market share by producer 2021 (source Statista 2021) 21Figure 7: Forecast of global EV sales 22Figure 8: Manufacturing hubs in South Africa 27Figure 9: Commuter travel patterns in the Western Cape indicated by the number of annual travel trips by trip type 31Figure 10: EV value chain in SA 39Figure 11: Illustration of gains and losses in the ICE value chain due to EV uptake 44Figure 12: Petrol and diesel consumption from 2007 to 2018 45Figure 13: Fuel levy collected in South Africa between 2008 and 2020 46Figure 14: ICE and EV Passenger car sales in South Africa since 2010 49Figure 15: Active and incoming charging infrastructure stations in SA 52Figure 16: Active and incoming charging infrastructure stations in Western Cape 53Figure 17: Projected uptake of EVs in Cape Town 54Figure 18: Projected increase in energy consumption in Cape Town 54Figure 19: Proportion of ICE light vehicles exported and imported over the last decade 58Figure 20: Year-on-year fuel (unleaded) prices in South Africa 62Figure 21: LIB price/kWh over time 63Figure 22: Graphite price over time 63Figure 23: How much respondents were willing to spend in purchasing an EV 65Figure 24: EV global market share forecast 58Figure 25: Reserves of EV minerals in the Southern Africa region 62Figure 26: LIB manufacturing value chain 63Figure 27: Passenger EV sales in South Africa 65
LIST OF FIGURES

VE
LE
CT
RIC
VE
HIC
LE
S: M
IR 2
022
LIST OF TABLES
Table 1: Overview of the market opportunities, drivers, and barriers within the EV Market 3Table 2: Key market segment definitions and vehicle types 16Table 3: Private transport representation in SA 28Table 4: South Africa’s market share of global vehicle production 28Table 5: Vehicle Production Market share of the top OEMs in South Africa 24Table 6: The impact of COVID-19 on South Africa’s vehicle production, exports, sales, and imports 29Table 7: Main mode of transport used by household members in the Western Cape, 2020 32Table 8: The history of the EV market development in South Africa: 1970s to 2020 32Table 9: Recent EV developments and near-future plans by EV sector role players in South Africa 33Table 10: Automotive global value chain (value chain disruptors) and skills implications 41Table 11: Benefits and drawbacks to South Africa of EV market growth and fewer oil imports 46Table 12: Overview of South Africa’s conventional ICE vehicle market: July 2021 47Table 13: OEMs, industry, and distributors’ DC charging technology 56Table 14: ICE restriction status for South Africa’s top vehicle export markets 59Table 15: Import taxes and total cost of importing a Tesla Model X Performance All-Wheel Drive from the UK to South Africa 67Table 16: Availability of Raw materials in the sub-Saharan region for lithium-ion battery production 82Table 17: Live heavy vehicle load population in South Africa: July 2021 88
ELE
CT
RIC
VE
HIC
LES
: MIR
20
22V
I
LIST OF ABBREVIATIONS AND ACRONYMS
AASA Automobile Association of South AfricaAC Alternating current AEM Automotive Export ManualAfCFTA African Continental Free Trade Area AIS Automotive Investment Scheme Al AluminiumAPDP Automotive Production and Development Programme AU African UnionAV Autonomous vehiclesBEV Battery electric vehicle BFP Basic fuel price BMS Battery Management SystemBRT Bus Rapid Transit SystemCaF2 Calcium fluorideCCS Combined Charging SystemCHAdeMO CHArge de MOveCO2 Carbon dioxide Co CobaltCCT City of Cape TownCPUT Cape Peninsula University of TechnologyCSIR Council for Scientific and Industrial ResearchCu CopperDC Direct current DMEA Department of Mineral and Energy AffairsDMRE Department of Mineral Resources and EnergyDoT Department of Transport DST/DSI Department of Science and Technology/ Department of Science and Innovation
dti Department of Trade and Industrydtic Department of Trade, Industry and CompetitionE-buses Electric buses EC Eastern CapeE-mobility Electric mobilityES Energy storage EU European Union EV Electric vehicleFe IronGDP Gross domestic productGERPISA Le Réseau International de l’Automobile (International Automobile Network)GHG Greenhouse gasGMA Gautrain Management AgencyGP Gauteng ProvinceGTS Green Transport StrategyHEV Hybrid electric vehicleHySA Hydrogen South AfricaICE Internal combustion engine IDC Industrial Development CorporationIPP Independent Power ProducerITAC International Trade Administration Commission I & F Infrastructure and facilitiesKWh Kilowatt-hourKZN KwaZulu-Natal LFP Lithium iron phosphate LIB Lithium-ion batteryMaaS Mobility-as-a-ServiceMBT Minibus taxi

VII
EL
EC
TR
IC V
EH
ICL
ES
: MIR
20
22
LIST OF ABBREVIATIONS AND ACRONYMS MIR Market intelligence report NAAMSA National Association of Automobile Manufacturers of South AfricaNCA Lithium nickel cobalt aluminium oxide NEC Nippon Electric CompanyNHTS National Household Travel SurveyNi NickelNMC Nickel manganese cobalt oxide OEM Original equipment manufacturer OES Original equipment supplierOPEC Organization of the Petroleum Exporting CountriesPAYD Pay-as-you-drivePAYS Pay-as-you-savePHEV Plug-in hybrid electric vehiclePI Production incentivesPJ/a Petajoules per annumPPPFA Preferential Procurement Policy Framework ActPRCC Production Rebate Credit Certificate PV Photovoltaic RAF Road Accident Fund RE Renewable energy REIPPPP Renewable Energy Independent Power Producers Procurement Programme SA South Africa SAAM South African Automotive Masterplan SADC Southern African Development Community SEZ Special Economic Zone SOV Single occupancy vehicleSSA Sub-Saharan AfricaTIA Technology Innovation Agency UNIDO United Nations Industrial Development OrganizationUS United StatesUWC University of the Western Cape V2G Vehicle-to-gridV2H Vehicle-to-homeV2X Vehicle-to-everything
VAA Vehicle assembly allowanceVALA Volume assembly localisation allowanceWC Western Cape YTD Year to date
Exchange rate conversion: An exchange rate of 1 USD = R15
2E
LE
CT
RIC
VE
HIC
LE
S: M
IR 2
022
ELE
CT
RIC
VE
HIC
LES
: MIR
20
221
Globally, the momentum for electric mobility has increased exponentially, as evidenced by the number of sales from 2013 to 2021. This global shift has primarily been driven by national emission reduction commitments stemming from the Paris Agreement on climate change, growing urban air pollution concerns, and continued crude oil price volatility.
1 For example, the Green Transport Strategy.
The International Energy Agency (IEA) has published the Global EV Outlook annually since 2013, with the 2021 report estimating 10 million electric cars on the world’s roads at the end of 2020. A highlight of the 2021 report is that EV sales jumped by 41% in 2020 despite the pandemic- related worldwide downturn in car sales in which global car sales dropped 16% – and this trajectory is expected to continue with many countries worldwide now shifting their policies towards accelerating EV uptake.
South Africa (SA) has an early-stage policy landscape1 but does not have subsidies or incentives to accelerate the development of the EV market. SA has thus not yet joined the ranks of those countries experiencing a steep rise in EV uptake and the development of the ecosystem and value chain around EVs. However, this is likely to change as lithium-ion battery (LIB) prices continue to fall.
February 2021 saw that battery-electric vehicle (BEV) registrations overtake those of plug-in hybrid electric vehicle (PHEV) registrations locally. This milestone marks the advancements of battery technology in the EV space and growing local consumer confidence in the range offered in newer generation BEVs with less reliance on internal combustion engine (ICE) hybrid technology.
EXECUTIVE SUMMARY
This market intelligence report is written for investors, original equipment manufacturers (OEMs), equipment suppliers, project developers, and technical advisers. It highlights current investment opportunities in the electric vehicles (EV) market in South Africa and the Western Cape.
2E
LE
CT
RIC
VE
HIC
LE
S: M
IR 2
022
ELE
CT
RIC
VE
HIC
LES
: MIR
20
221
SA already has a strong market for the assembly of ICE vehicles. The automotive sector is a key player in the country’s economic landscape, contributing 4.9% of gross domestic product (GDP) (2020) and 27.6% of manufacturing output. Total revenue from this sector was more than R500 billion ($35.6 billion) in 2019, with the industry employing up to 900 000 people directly and indirectly including downstream in wholesale, retail trade, and maintenance. South Africa is considered a second-tier market, having produced over 600 000 ICE vehicles, predominantly for export. SA is, therefore, a net exporter of vehicles.
When the COVID-19 case rate increased in SA, the national government implemented national restrictions (“lockdown regulations”) to reduce the spread of the virus. This included limiting active business activity, including for the automotive industry.
This “lockdown” coupled with reduced international trade, saw the South African GDP shrink by 51% in quarter two of 2020. The total domestic production by the automotive sector decreased by 32% by November 2020. Total vehicle exports from SA by the end of November 2020 had decreased by 33% National Association of Automobile Manufacturers of South Africa (NAAMSA), 2020.
For SA, a thriving EV market supported by local manufacturing holds the promise of sustainable economic development and job creation and an advance in the development of the local green economy. It will also increase economic resilience to some of the economic impacts of climate change mitigation measures by counteracting the inevitable decline in demand for ICE vehicles globally.
There are substantial environmental, economic, and social opportunities for SA to transition to a low-carbon trajectory enabled by a green energy transition. There are several emerging opportunities in SA’s nascent EV market:
• Local manufacturing and electrification of public transport: Public transport presents the best business case for electrification and manufacturing in the EV sector. This is especially true for the bus market that already produces buses mainly for the domestic market. Buses are designated in SA and are subject to ~80% local content requirements by the Department of Trade, Industry and Competition (dtic) for public procurement. The assembly of buses further benefits from duty-free importation of all driveline components. While this is a flat market in SA, there is scope to revitalise this space. Incorporating e-bus manufacturing for public transportation is more economically viable to achieve this revitalisation than manufacturing of private vehicles.
• LIB production: SA is an attractive assembly and possibly future manufacturing destination for LIBs because of its existing battery assembly and recycling industry.
This is coupled with SA’s mining sector’s ability to provide some of the raw materials required for the nickel manganese cobalt oxide cathode battery chemistry – especially manganese, as SA holds about 78% of the world’s manganese reserves. The logistical advantages of closer geographical proximity coupled with improved regional free trade policy, such as the African Continental Free Trade Area (AfCFTA) and the African Union (AU) Agenda 63, could provide a range of advantages in accessing and utilising these raw materials.
• Local passenger vehicle manufacturing: There is a medium- to long-term opportunity building on SA’s existing significant automotive manufacturing capability to develop a manufacturing hub for electric passenger vehicles for the export market. Manufacturing for the domestic market is a longer-term opportunity as local demand increases and a more supportive policy environment is developed.
4E
LE
CT
RIC
VE
HIC
LE
S: M
IR 2
022
ELE
CT
RIC
VE
HIC
LES
: MIR
20
223
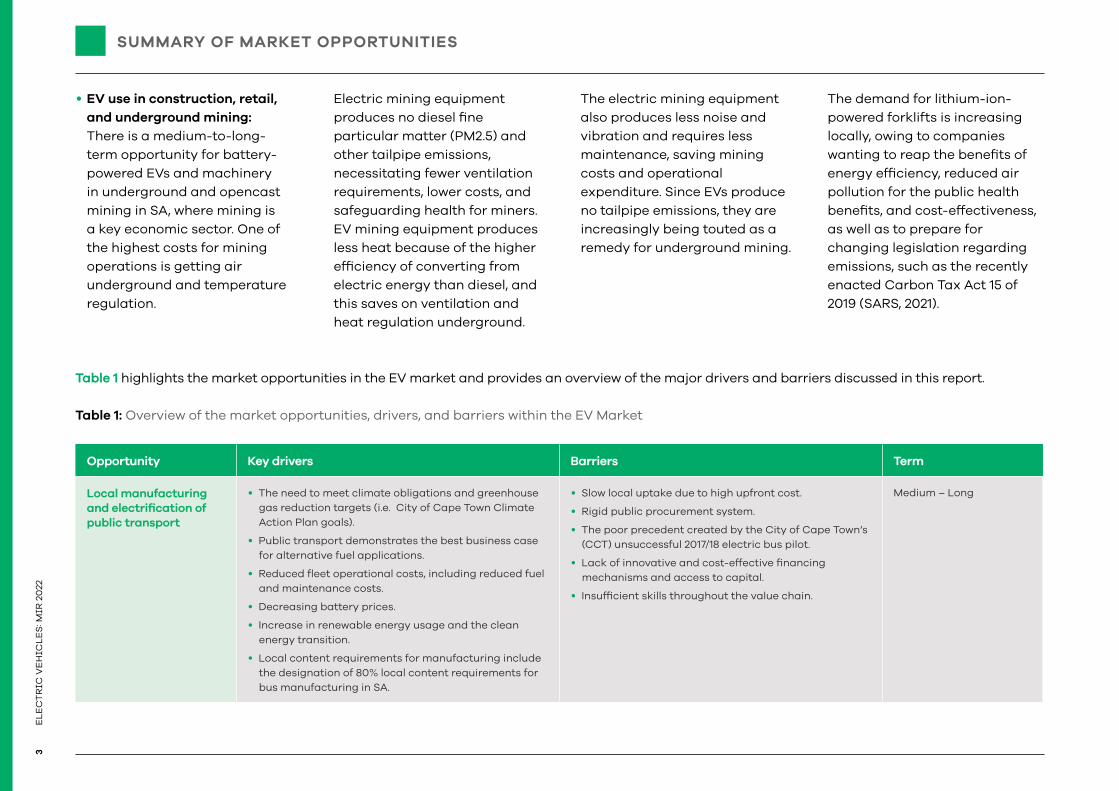
• EV use in construction, retail, and underground mining: There is a medium-to-long- term opportunity for battery-powered EVs and machinery in underground and opencast mining in SA, where mining is a key economic sector. One of the highest costs for mining operations is getting air underground and temperature regulation.
Electric mining equipment produces no diesel fine particular matter (PM2.5) and other tailpipe emissions, necessitating fewer ventilation requirements, lower costs, and safeguarding health for miners. EV mining equipment produces less heat because of the higher efficiency of converting from electric energy than diesel, and this saves on ventilation and heat regulation underground.
The electric mining equipment also produces less noise and vibration and requires less maintenance, saving mining costs and operational expenditure. Since EVs produce no tailpipe emissions, they are increasingly being touted as a remedy for underground mining.
The demand for lithium-ion-powered forklifts is increasing locally, owing to companies wanting to reap the benefits of energy efficiency, reduced air pollution for the public health benefits, and cost-effectiveness, as well as to prepare for changing legislation regarding emissions, such as the recently enacted Carbon Tax Act 15 of 2019 (SARS, 2021).
Table 1 highlights the market opportunities in the EV market and provides an overview of the major drivers and barriers discussed in this report.
Table 1: Overview of the market opportunities, drivers, and barriers within the EV Market
Opportunity Key drivers Barriers Term
Local manufacturing and electrification of public transport
• The need to meet climate obligations and greenhouse gas reduction targets (i.e. City of Cape Town Climate Action Plan goals).
• Public transport demonstrates the best business case for alternative fuel applications.
• Reduced fleet operational costs, including reduced fuel and maintenance costs.
• Decreasing battery prices.
• Increase in renewable energy usage and the clean energy transition.
• Local content requirements for manufacturing include the designation of 80% local content requirements for bus manufacturing in SA.
• Slow local uptake due to high upfront cost.
• Rigid public procurement system.
• The poor precedent created by the City of Cape Town’s (CCT) unsuccessful 2017/18 electric bus pilot.
• Lack of innovative and cost-effective financing mechanisms and access to capital.
• Insufficient skills throughout the value chain.
Medium – Long
SUMMARY OF MARKET OPPORTUNITIES

4E
LE
CT
RIC
VE
HIC
LE
S: M
IR 2
022
ELE
CT
RIC
VE
HIC
LES
: MIR
20
223
Opportunity Key drivers Barriers Term
Lithium-Ion battery (LIB) production
• There is an increasing need for lithium-ion batteries (LIB) in renewable energy and stationary storage, EVs, consumer electronics, and other sectors, both in SA and globally.
• Availability and relative ease of access to lithium, cobalt, nickel, manganese and other critical raw materials in SA and the Sub-Saharan Africa region.
• The emerging need for Mn-rich electrodes can compete with ‘in vogue’ Nickel-rich compositions (security of supply).
• Local content requirements for the procurement of utility-scale renewable energy and energy storage (ES) facilities from Independent Power Producers (IPPs) in the Renewable Energy Independent Power Producers Procurement Programme (REIPPPP).
• Establishing strong public-private partnerships that extend beyond SA.
• A better understanding of global manganese-oxide demand.
• Policy support.
• Lack of existing local supply chain.
• Falling LIB prices may diminish the feasibility of local manufacturing of LIBs.
Medium – Long
Local manufacturing of passenger vehicles
• Government efforts to increase local content, volume outputs, and jobs in SA’s automotive manufacturing industry.
• The potential loss of existing trade markets through the planned phasing out of ICE vehicles in many of SA’s current export markets for ICE vehicles.
• Increasing international demand for EVs.
• South Africa already has a robust automotive industry that could potentially pivot to EV manufacturing.
• Insufficient local demand for EVs.
• Lack of innovative and cost-effective financing mechanisms and access to capital.
• Insufficient skills throughout the value chain.
Medium – Long
EV use in construction, retail, and underground mining
• Cost-saving since one of the highest costs in underground mining operations is getting air underground. EVs produce no tailpipe emissions and less heat than emissions from ICE vehicles underground.
• Demand for lithium-ion-powered forklifts increases locally, owing to companies wanting to reap the benefits of energy efficiency and cost-effectiveness and preparing for changing legislation regarding emissions, such as the recently enacted Carbon tax regulation.
• Lack of local manufacturing industry for construction, retail, and mining vehicles.
• Lack of innovative and cost-effective financing mechanisms and access to capital.
• Insufficient skills throughout the value chain.
Medium – Long.
Table 1 continued...
6E
LE
CT
RIC
VE
HIC
LE
S: M
IR 2
022
ELE
CT
RIC
VE
HIC
LES
: MIR
20
225
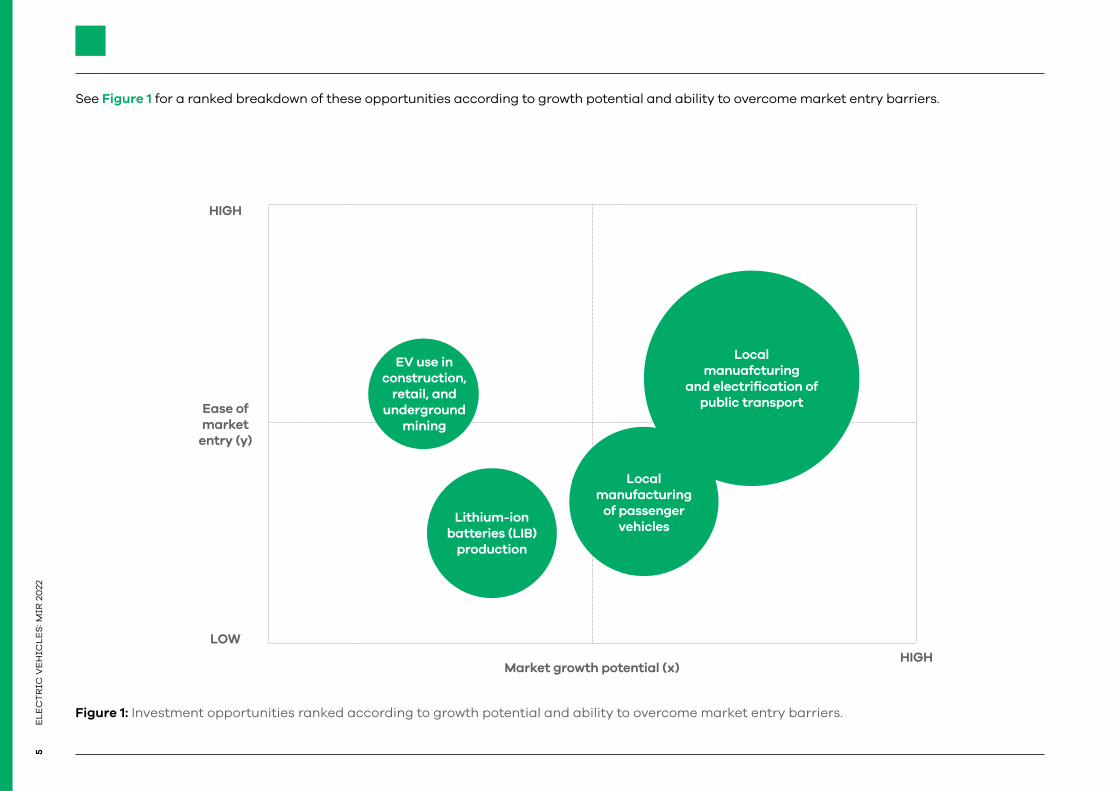
See Figure 1 for a ranked breakdown of these opportunities according to growth potential and ability to overcome market entry barriers.
Figure 1: Investment opportunities ranked according to growth potential and ability to overcome market entry barriers.
Ease of market
entry (y)
HIGH
LOWHIGH
Market growth potential (x)
EV use in construction,
retail, and underground
mining
Lithium-ion batteries (LIB)
production
Local manufacturing
of passenger vehicles
Local manuafcturing
and electrification of public transport

6E
LE
CT
RIC
VE
HIC
LE
S: M
IR 2
022
ELE
CT
RIC
VE
HIC
LES
: MIR
20
225 ©Unsplash
8E
LE
CT
RIC
VE
HIC
LE
S: M
IR 2
022
ELE
CT
RIC
VE
HIC
LES
: MIR
20
227
WHAT’S NEW?
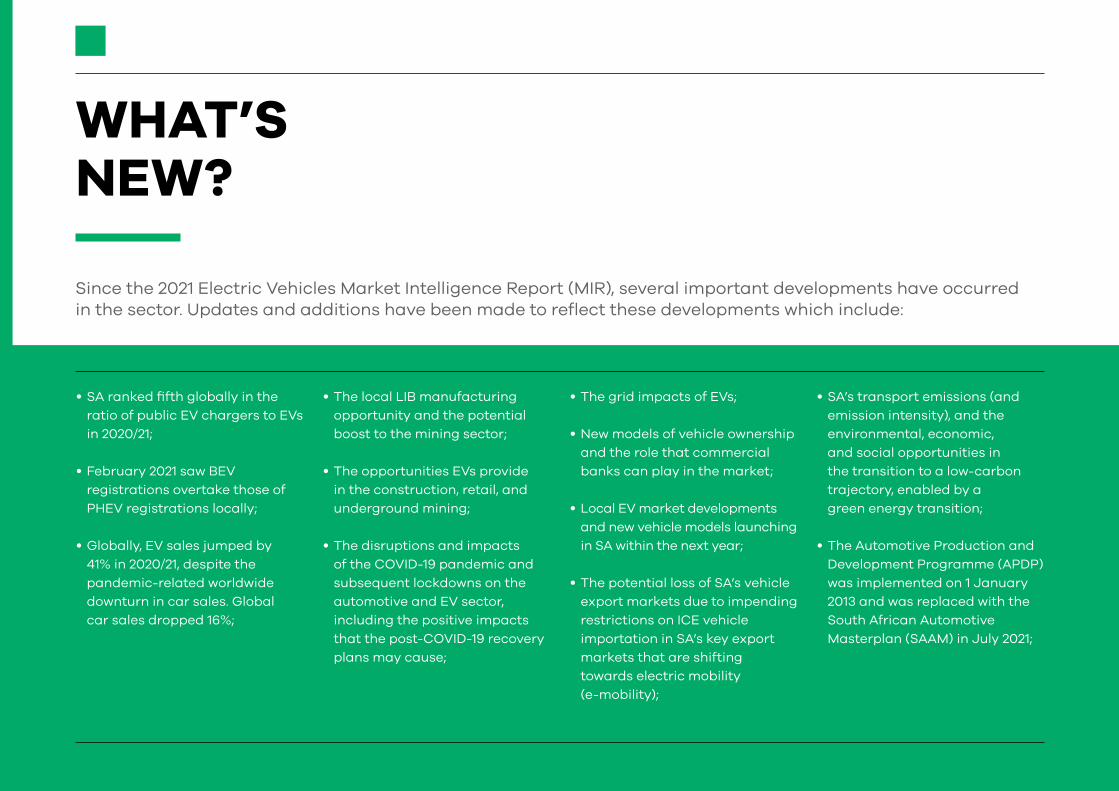
Since the 2021 Electric Vehicles Market Intelligence Report (MIR), several important developments have occurred in the sector. Updates and additions have been made to reflect these developments which include:
• SA ranked fifth globally in the ratio of public EV chargers to EVs in 2020/21;
• February 2021 saw BEV registrations overtake those of PHEV registrations locally;
• Globally, EV sales jumped by 41% in 2020/21, despite the pandemic-related worldwide downturn in car sales. Global car sales dropped 16%;
• The local LIB manufacturing opportunity and the potential boost to the mining sector;
• The opportunities EVs provide in the construction, retail, and underground mining;
• The disruptions and impacts of the COVID-19 pandemic and subsequent lockdowns on the automotive and EV sector, including the positive impacts that the post-COVID-19 recovery plans may cause;
• The grid impacts of EVs;
• New models of vehicle ownership and the role that commercial banks can play in the market;
• Local EV market developments and new vehicle models launching in SA within the next year;
• The potential loss of SA’s vehicle export markets due to impending restrictions on ICE vehicle importation in SA’s key export markets that are shifting towards electric mobility (e-mobility);
• SA’s transport emissions (and emission intensity), and the environmental, economic, and social opportunities in the transition to a low-carbon trajectory, enabled by a green energy transition;
• The Automotive Production and Development Programme (APDP) was implemented on 1 January 2013 and was replaced with the South African Automotive Masterplan (SAAM) in July 2021;
8E
LE
CT
RIC
VE
HIC
LE
S: M
IR 2
022
ELE
CT
RIC
VE
HIC
LES
: MIR
20
227
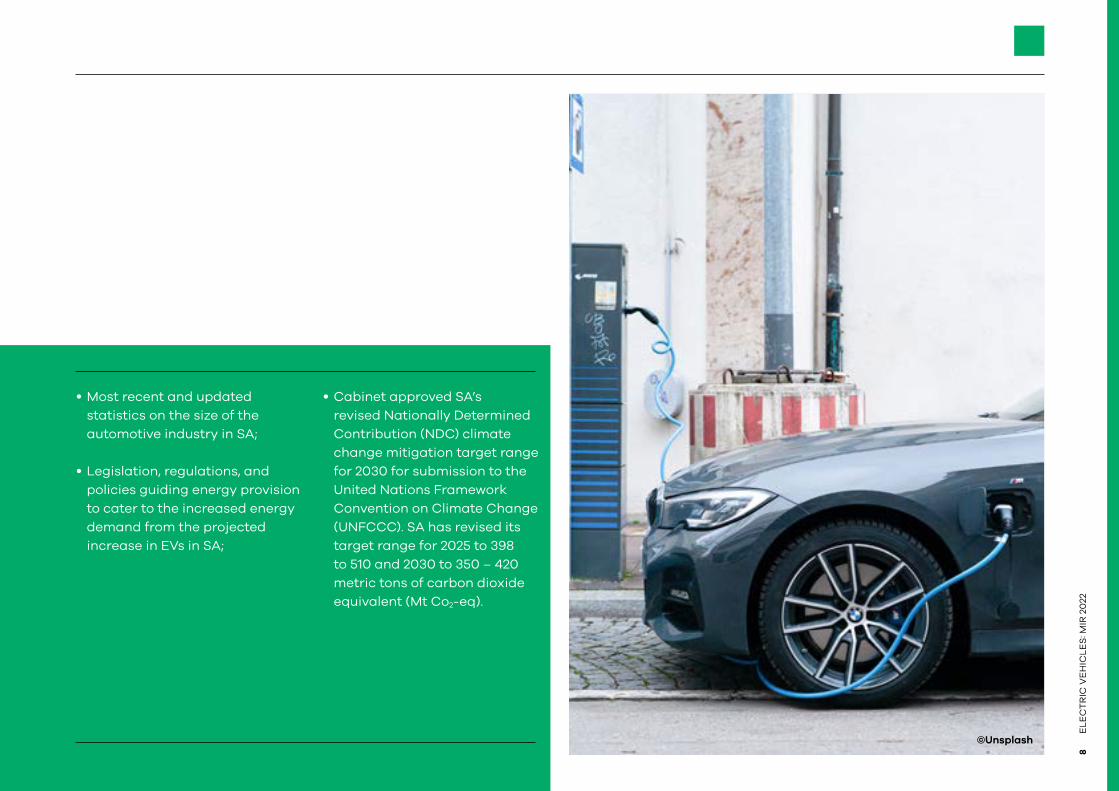
• Most recent and updated statistics on the size of the automotive industry in SA;
• Legislation, regulations, and policies guiding energy provision to cater to the increased energy demand from the projected increase in EVs in SA;
• Cabinet approved SA’s revised Nationally Determined Contribution (NDC) climate change mitigation target range for 2030 for submission to the United Nations Framework Convention on Climate Change (UNFCCC). SA has revised its target range for 2025 to 398 to 510 and 2030 to 350 – 420 metric tons of carbon dioxide equivalent (Mt Co2-eq).
©Unsplash
ELE
CT
RIC
VE
HIC
LES
: MIR
20
229
ELE
CT
RIC
VE
HIC
LES
: MIR
20
229
This market intelligence report is written for investors, original equipment manufacturers (OEMs), equipment suppliers, project developers, and technical advisers.
It highlights investment opportunities in the EV market in South Africa.
INTRODUCTION AND PURPOSE
10E
LE
CT
RIC
VE
HIC
LE
S: M
IR 2
022
©Unsplash

ELE
CT
RIC
VE
HIC
LES
: MIR
20
2211
Globally, the EV market has grown steadily since 2010, supported by financial and non-financial incentives to make EVs an attractive purchase for private consumers. According to IEA 2021, there were 10 million electric cars on the world’s roads at the end of 2020, following a decade of rapid growth. Global electric car registrations increased by 41% in 2020/21, despite the pandemic-related worldwide downturn in car sales, which dropped by 16%.
2 Despite COVID-19 challenges there is been a marked increase in sales in 2021 due to the announcement that the subsidies and tax exemptions, which were initially scheduled to terminate in 2020, have now been extended to 2022 but will be subject to a further 20% cut in 2021 and 30% in 2022. Global EV sale volumes were drastically affected by the COVID-19 pandemic and subsequent lockdowns.
Around 3 million electric cars were sold globally in 2020/21, with Europe overtaking the People’s Republic of China (China) as the world’s largest annual EV market for the first time. Electric bus and truck registrations also expanded in major markets, reaching global stocks of 600 000 and 31 000, respectively. It is projected that by 2030, 40% of all new car sales in the European Union (EU) will be electric, and this is projected to grow to 80% by 2040 (European Commission, 2020).
Despite this market growth, based mainly on consumer awareness and policy, government support and subsidies are vital for allowing EVs to compete with the internal combustion engine (ICE) market. This is because the upfront capital cost of purchasing an EV remains high, primarily driven by the cost of batteries. Still, the total cost of ownership over the lifecycle of the EV is significantly less than for ICE vehicles.
The importance of support and subsidies was shown in 2019, when China’s reductions in subsidies for new energy vehicles (NEVs) caused the first disruption in the trend of continuous growth in EV sales, as can be seen in the change in 2019 sales after June 2019, shown in Figure 2. The knock-on effect of this decision2 is evident by Europe overtaking China as the world’s largest EV market for the first time.
©Unsplash

12E
LE
CT
RIC
VE
HIC
LE
S: M
IR 2
022
600K
Figure 2 shows that during the first five months of 2021, plug-in sales stood at almost 2 million, while the market share increased to 5.8% (3.8% BEVs), compared to 4% at the same time in 2020. The expectation is that the total sales market will reach 5 million in 2021.
Figure 3 illustrates the countries with the highest share of plug-in electric vehicles (PEV) in new passenger car sales 2020/21. As many as 13 countries pushed EVs past 10% of new light-vehicle sales in 2020/21. Norway continued to stay on the top spot with a ~75% share of PEV, and Norway has more EVs per capita than any other country.
According to IMF 2021 analytics, Norway maintains the highest share of PEVs based on strong policies like carbon tax exemptions, toll exemptions, and other incentives.
EV
sa
les
‘00
0
500K
400K
300K
200K
100K
KJan Feb Mar Apr May Jun Jul Aug Sep Oct Nov Dec
2016 2017 2018 2019 2020 2021
Figure 2: Global EV sales in recent years Source: InsideEVs, 2021

ELE
CT
RIC
VE
HIC
LES
: MIR
20
2213
Figure 3: Leading countries with the highest proportion of EVs in new passenger car salesSource: Statistica, 2021
Norway 74,8
Iceland 45
Sweden 32,2
Netherlands 24,9
Finland 18,1
Denmark 16,4
Switzerland 14,3
Portugal 13,5
Germany 13,5
Luxembourg 11,4
France 11,3
Belgium 10,7
UK 10,7
Austria 9,5
Ireland 7,4
China 6,2
US 2,3
0 10 20 30 40 50 60 70 80
4 500 000
3 200 000
1 622 000
China
Europe
USA
Top 3 markets by total EV stock

14E
LE
CT
RIC
VE
HIC
LE
S: M
IR 2
022
There are various reasons governments across these markets have supported the EV market. These include:
• Air quality concerns in cities: Increasing motorisation in cities has increased air pollution, which has a knock-on effect on health, visibility, and the natural environment. Because EVs produce zero direct emissions, they can improve air quality in cities.
• Emission reduction commitments (see note on Nationally Determined Contributions in section 4.8): The transport sector has been identified as a key contributor to global greenhouse gas emissions because it relies on fossil fuels. 15% of global greenhouse gas emissions are attributed to the transport sector.
3 With a few exceptions where certain countries have been given allowances to increase
It is the fastest-growing source of greenhouse gas (GHG) emissions in SA, accounting for 91.2% of the increases over the past decade (NAAMSA, 2020). SA contributes about 1.1% of overall global emissions according to the Department of Transport’s Green Transport strategy (GTS); the transport sector contributes 10.8% of the country’s total GHG emissions and road transport accounts for 91% of direct emissions across the transport sector, primarily from the combustion of fossil fuel and the fuel quality in SA that is at a Euro 2 level.
As of November 2021, the Paris Agreement, committing signatories to reduce their emissions3, has been signed by 194 countries (including SA) and the EU and ratified by 192 countries and the EU. EVs provide an alternative to traditional ICE vehicles, as they can be powered by renewable energy.
According to the Climate Transparency Organisation, SA has the highest emission intensity in the G20 group of industrialised and developing countries as of 2019 (Cunliffe et al., 2018). The transport sector is the second-largest source of GHG emissions, at about 10.8%; second only to the energy sector, making the economy one of the most carbon and energy-intensive globally.
According to the Department of Transport (DoT), at 92%, fossil fuels are the largest primary energy source in SA (DoT, 2018). This is the highest in the G20, and SA’s emission intensity is almost double the average of the G20 countries. At the local level, the transport sector, which relies almost exclusively on petrol and diesel, accounts for 62% of Cape Town’s total final energy demand.
To achieve its current environmental and climate commitments and targets, SA has to reduce emissions by at least 32% in the next ten years, and reductions in energy generation and supply alone are not enough to achieve this.
The climate targets set for the automotive sector by 2030 cannot be met without low carbon vehicles such as EVs being incorporated into the transport system. ICE improvements alone do not achieve these targets. EVs are only as green as the energy source used to charge them, i.e., upstream emissions. Powering EVs using electricity from coal or other fossil fuel sources is counterproductive. Renewable energy sources like wind and solar are ideal and in line with the global clean energy transition.
ELE
CT
RIC
VE
HIC
LES
: MIR
20
2215
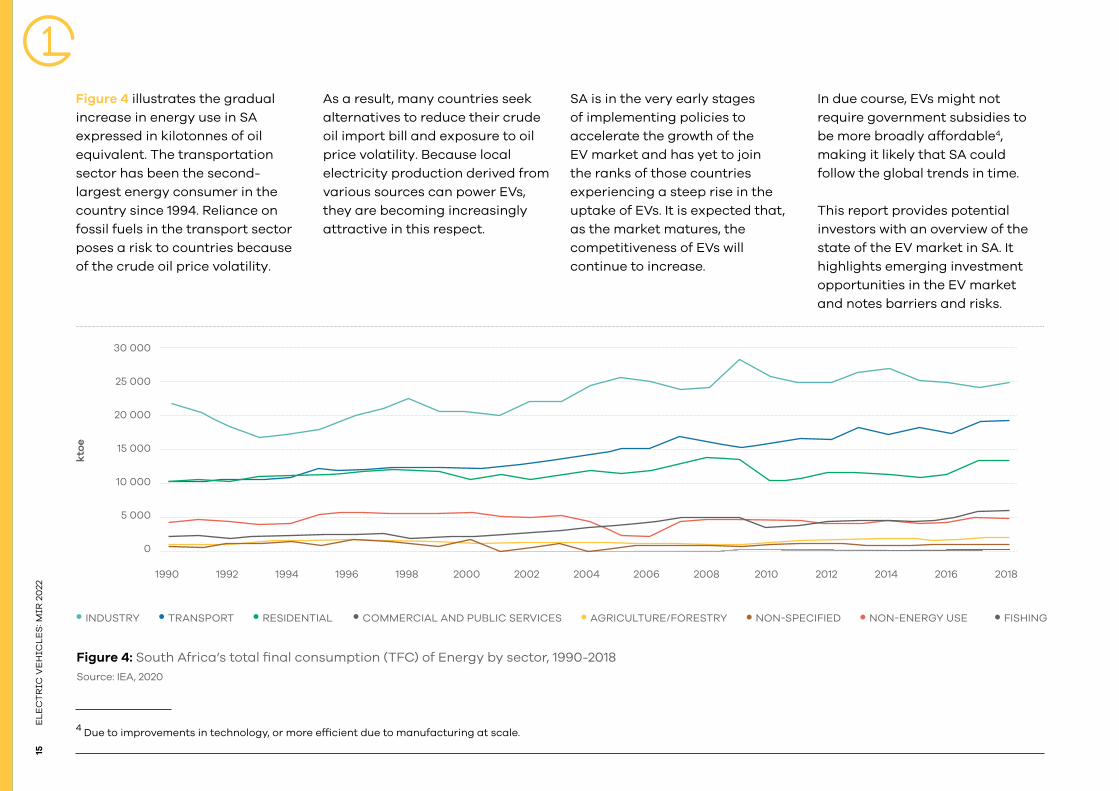
Figure 4 illustrates the gradual increase in energy use in SA expressed in kilotonnes of oil equivalent. The transportation sector has been the second-largest energy consumer in the country since 1994. Reliance on fossil fuels in the transport sector poses a risk to countries because of the crude oil price volatility.
4 Due to improvements in technology, or more efficient due to manufacturing at scale.
As a result, many countries seek alternatives to reduce their crude oil import bill and exposure to oil price volatility. Because local electricity production derived from various sources can power EVs, they are becoming increasingly attractive in this respect.
SA is in the very early stages of implementing policies to accelerate the growth of the EV market and has yet to join the ranks of those countries experiencing a steep rise in the uptake of EVs. It is expected that, as the market matures, the competitiveness of EVs will continue to increase.
In due course, EVs might not require government subsidies to be more broadly affordable4, making it likely that SA could follow the global trends in time.
This report provides potential investors with an overview of the state of the EV market in SA. It highlights emerging investment opportunities in the EV market and notes barriers and risks.
Figure 4: South Africa’s total final consumption (TFC) of Energy by sector, 1990-2018Source: IEA, 2020
5 000
0
10 000
15 000
20 000
25 000
30 000
kto
e
19921990 1994 1996 1998 2000 2002 2004 2006 2008 2010 2012 2014 2016 2018
INDUSTRY TRANSPORT RESIDENTIAL COMMERCIAL AND PUBLIC SERVICES AGRICULTURE/FORESTRY NON-SPECIFIED NON-ENERGY USE FISHING

16E
LE
CT
RIC
VE
HIC
LE
S: M
IR 2
022
Although the market can be segmented in several ways, based on the context of the South African market, the key market segments discussed in this report are private, public, and industrial. A definition for each segment is provided in Table 2, along with the types of vehicles included in each category.
Table 2: Key market segment definitions and vehicle types
Market segment Definition Vehicle types
Private transport It refers to privately owned and operated vehicles. These vehicles are predominately used for personal travel and daily commuting.
• Single occupancy vehicles (SOV)
• Micromobility e.g., scooters and bikes
Public transport It refers to the transportation of passengers by group travel systems available for use by the public. They are typically scheduled, have dedicated routes, and charge a fee for each trip.
• City/Municipal bus services
• Commuter buses
• Minibus taxis (MBT)
• Metered taxis
• Ride-hailing services
Industrial transport
This refers to vehicles used to move heavy goods and materials in the commercial industry.
• Forklifts
• Trucks / Vans
• Mining vehicles
While there are a few vehicle segments where the application of electric mobility is plausible, this report will focus on four key investment opportunities:
• Local manufacturing and electrification of public transport; • Local LIB manufacturing; • Local passenger vehicle
manufacturing; and• EV use in construction, retail,
and underground mining.
Additional markets that are affected (directly or indirectly) by the emerging market for EVs, but are not discussed in this report, include:
• The impact of EVs on liquid fuel dynamics; • Policy mechanisms for
incentivising investment in EVs and EV infrastructure;• The role of EVs in energy
ancillary services (V2G, V2H, and V2X)5; and• Autonomous EVs;
5 *V2G – vehicle-to-grid, V2H – vehicle-to-home, V2X – vehicle-to-everything
In what follows:
Section 2 summarizes the global EV market and describes the market size. Section 3 provides potential investors and businesses with an overview of the state of the South African EV market. Section 4 outlines the relevant policies and regulations. Section 5 highlights emergent opportunities, barriers, and market uncertainties that may affect the growth of the EV industry in SA. Section 6 focuses on funding and incentives.Section 7 summarises the Western Cape (WC) as Africa’s growing Greentech hub.Section 8 focuses on the services that GreenCape provides to its members.
ELE
CT
RIC
VE
HIC
LES
: MIR
20
2217
This section provides an overview of the global EV industry to provide context for the South African industry.
GLOBAL INDUSTRY OVERVIEW

18E
LE
CT
RIC
VE
HIC
LE
S: M
IR 2
022
©Unsplash
ELE
CT
RIC
VE
HIC
LES
: MIR
20
2219
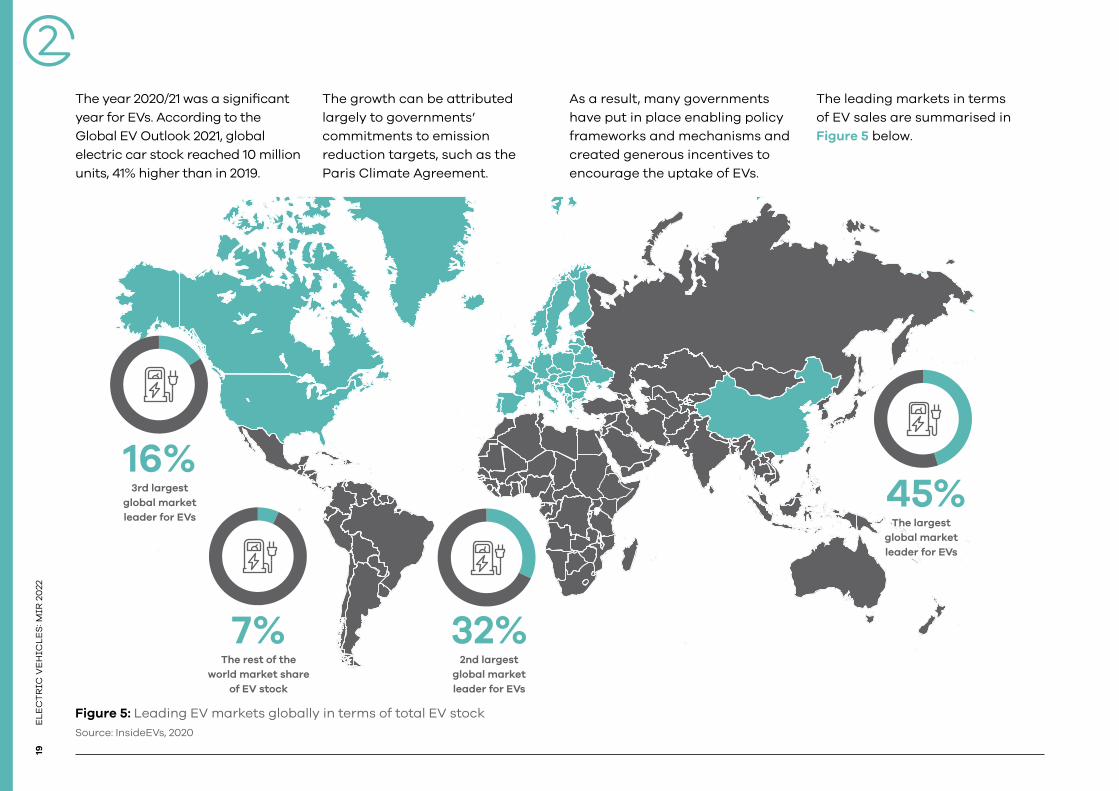
The year 2020/21 was a significant year for EVs. According to the Global EV Outlook 2021, global electric car stock reached 10 million units, 41% higher than in 2019.
The growth can be attributed largely to governments’ commitments to emission reduction targets, such as the Paris Climate Agreement.
As a result, many governments have put in place enabling policy frameworks and mechanisms and created generous incentives to encourage the uptake of EVs.
The leading markets in terms of EV sales are summarised in Figure 5 below.
16+84+L32+68+L
45+55+L16%
32%
45%3rd largest global market leader for EVs
7+93+L7%
The rest of the world market share
of EV stock
2nd largest global market leader for EVs
The largest global market leader for EVs
Figure 5: Leading EV markets globally in terms of total EV stockSource: InsideEVs, 2020
20E
LE
CT
RIC
VE
HIC
LE
S: M
IR 2
022
45+55+L
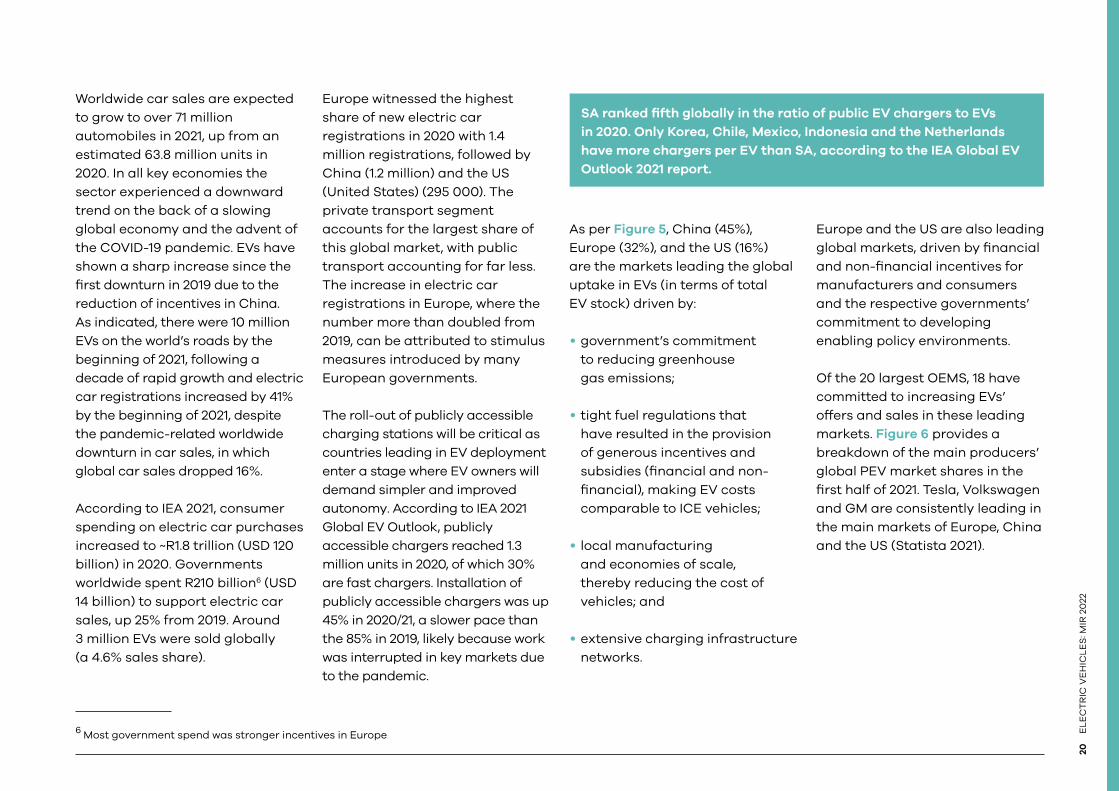
Worldwide car sales are expected to grow to over 71 million automobiles in 2021, up from an estimated 63.8 million units in 2020. In all key economies the sector experienced a downward trend on the back of a slowing global economy and the advent of the COVID-19 pandemic. EVs have shown a sharp increase since the first downturn in 2019 due to the reduction of incentives in China. As indicated, there were 10 million EVs on the world’s roads by the beginning of 2021, following a decade of rapid growth and electric car registrations increased by 41% by the beginning of 2021, despite the pandemic-related worldwide downturn in car sales, in which global car sales dropped 16%.
According to IEA 2021, consumer spending on electric car purchases increased to ~R1.8 trillion (USD 120 billion) in 2020. Governments worldwide spent R210 billion6 (USD 14 billion) to support electric car sales, up 25% from 2019. Around 3 million EVs were sold globally (a 4.6% sales share).
6 Most government spend was stronger incentives in Europe
Europe witnessed the highest share of new electric car registrations in 2020 with 1.4 million registrations, followed by China (1.2 million) and the US (United States) (295 000). The private transport segment accounts for the largest share of this global market, with public transport accounting for far less. The increase in electric car registrations in Europe, where the number more than doubled from 2019, can be attributed to stimulus measures introduced by many European governments.
The roll-out of publicly accessible charging stations will be critical as countries leading in EV deployment enter a stage where EV owners will demand simpler and improved autonomy. According to IEA 2021 Global EV Outlook, publicly accessible chargers reached 1.3 million units in 2020, of which 30% are fast chargers. Installation of publicly accessible chargers was up 45% in 2020/21, a slower pace than the 85% in 2019, likely because work was interrupted in key markets due to the pandemic.
As per Figure 5, China (45%), Europe (32%), and the US (16%) are the markets leading the global uptake in EVs (in terms of total EV stock) driven by:
• government’s commitment to reducing greenhouse gas emissions;
• tight fuel regulations that have resulted in the provision of generous incentives and subsidies (financial and non-financial), making EV costs comparable to ICE vehicles;
• local manufacturing and economies of scale, thereby reducing the cost of vehicles; and
• extensive charging infrastructure networks.
Europe and the US are also leading global markets, driven by financial and non-financial incentives for manufacturers and consumers and the respective governments’ commitment to developing enabling policy environments.
Of the 20 largest OEMS, 18 have committed to increasing EVs’ offers and sales in these leading markets. Figure 6 provides a breakdown of the main producers’ global PEV market shares in the first half of 2021. Tesla, Volkswagen and GM are consistently leading in the main markets of Europe, China and the US (Statista 2021).
SA ranked fifth globally in the ratio of public EV chargers to EVs in 2020. Only Korea, Chile, Mexico, Indonesia and the Netherlands have more chargers per EV than SA, according to the IEA Global EV Outlook 2021 report.

ELE
CT
RIC
VE
HIC
LES
: MIR
20
2221
Figure 6: Plug-in electric vehicle sales market share by producer 2021 Source: Statista 2021
SAIC
Geely-Volvo Car Group
Renault-Nissan-Mitsubishi Alliance
Daimler AG
Hyundai Motor
BYD
BMW Group
Stellantis
GM
VW Group
Tesla Inc.
0 0,02 0,04 0,06 0,08 0,1 0,12 0,14 0,16
Although the market continues to see rapid growth, key factors could slow down the development of the EV market. These include:
• battery prices not decreasing as expected;
• an absent or insufficient enabling policy environmentt;
• China’s reduction and elimination of some EV incentives;
• oil prices decreasing further instead of increasing due to lower demand for oil in Europe and China, coupled with a steady supply of oil from OPEC; and
• limited range and charging infrastructure networks.
The barriers would delay EV and ICE vehicle cost parity without incentives and subsidies, thereby limiting rapid adoption. However, Bloomberg forecasts that EV passenger vehicle sales will exceed ICE vehicle sales around 2037, as shown in Figure 7.
22E
LE
CT
RIC
VE
HIC
LE
S: M
IR 2
022
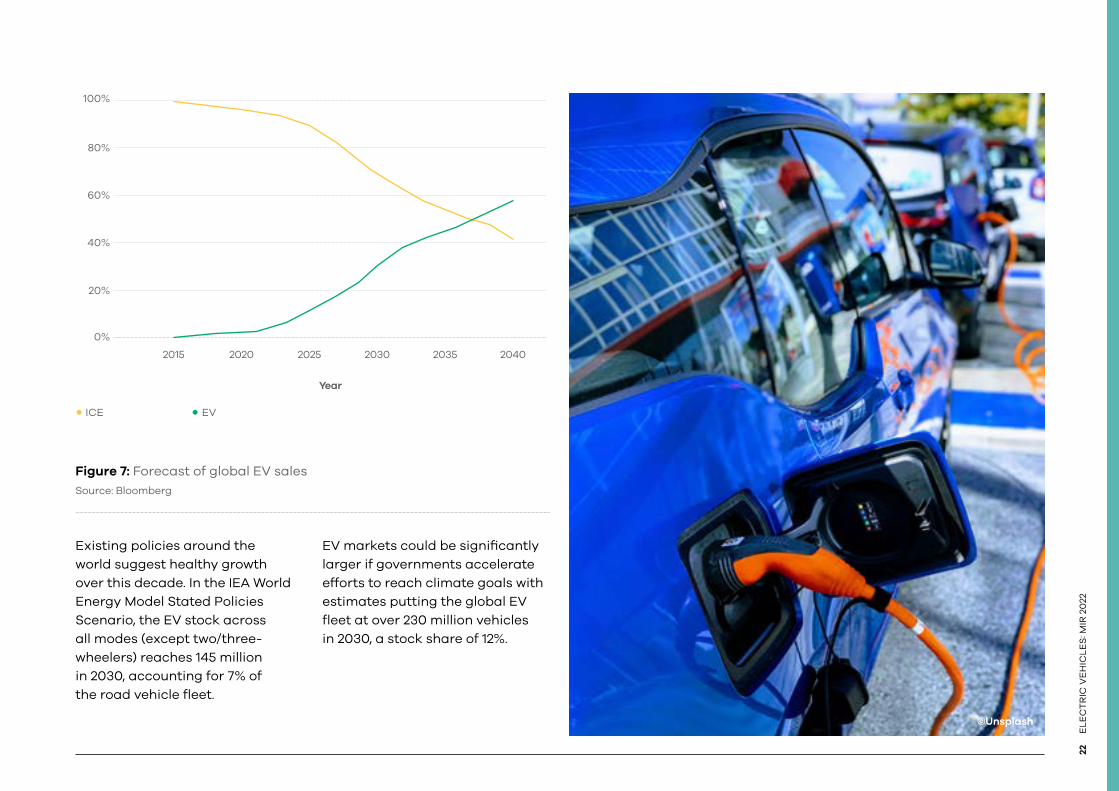
Figure 7: Forecast of global EV sales Source: Bloomberg
0%
20%
40%
60%
100%
80%
2015 2020 2025
Year
2030 2035 2040
ICE EV
Existing policies around the world suggest healthy growth over this decade. In the IEA World Energy Model Stated Policies Scenario, the EV stock across all modes (except two/three-wheelers) reaches 145 million in 2030, accounting for 7% of the road vehicle fleet.
EV markets could be significantly larger if governments accelerate efforts to reach climate goals with estimates putting the global EV fleet at over 230 million vehicles in 2030, a stock share of 12%.
©Unsplash
The emerging EV market represents a small share of the SA automotive industry but presents substantial opportunities for
businesses and investors active and interested in the sector.
SOUTH AFRICAN INDUSTRY OVERVIEW
©Unsplash
ELE
CT
RIC
VE
HIC
LES
: MIR
20
2225
This section will discuss how the EV market has unfolded within the South African context, highlighting implications for the Western Cape.
3.1. South African automotive market supply
SA already has a strong market for assembly of ICE vehicles. The automotive sector is a key player in the country’s economic landscape, contributing a substantial 18.7% of value-addition within the domestic manufacturing output in 2020/21 (U.S. Trade. 2021).
7 Projected estimate
In 2020, the broader South African automotive industry’s contribution to the GDP stood at 4.9% (2.8% manufacturing and 2.1% retail), down from 6.4% in 2019, reflecting the severe impact of COVID-19 on automotive manufacturing and retail because of the country’s lockdown restrictions during the year (U.S. Trade. 2021).
According to the Automotive Export Manual (AEM), the total market size of the automotive sector in SA was more than R522 billion ($34.8 billion) in 2021, with the industry employing ~900 000 skilled, semi-skilled and unskilled employees – including in wholesale, retail trade, and maintenance.
Approximately 525 000 ICE vehicles were assembled in 2021 7, predominantly for the export market. When the COVID-19 case rate increased in SA, the national government implemented national restrictions (“lockdown regulations”) to reduce the spread of the virus. This included the limiting of business activity, including for the automotive industry. This lockdown, coupled with reduced international trade, saw the South African GDP shrink by 51% in quarter two of 2020.
There has been a 32% reduction in total domestic vehicle production and a 33% reduction in vehicle exports as of 2020/21, attributable to the COVID-19 pandemic and associated lockdowns. Local vehicle sales also decreased by 31% by the beginning of 2021 compared to the same time in the previous year (NAAMSA, 2020).
This is detailed in Table 6 later in this report.
Table 3 provides an overview of known original equipment manufacturers (OEMs), importers, and distributors in each private transport market segment in SA.

26E
LE
CT
RIC
VE
HIC
LE
S: M
IR 2
022
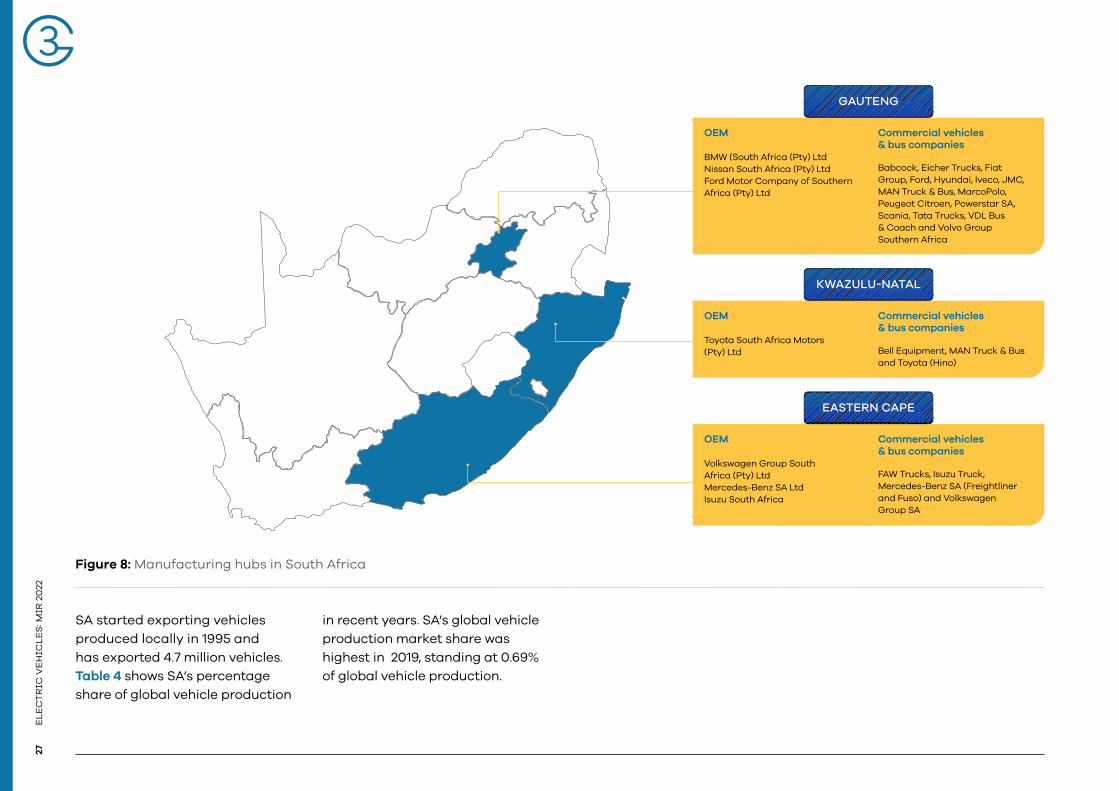
Figure 8 highlights that SA has three key automotive manufacturing hubs located in the Eastern Cape (EC), KwaZulu-Natal (KZN) and Gauteng (GP). Although the EC does not experience high commuter patterns like the WC, KZN and GP, the EC has been an attractive manufacturing destination because of the East London and Coega Industrial Development Zones (IDZs). All three transport hubs have commonalities in that they all harbour private, public, and industrial transport manufacturing industries and component companies that support them. There is an opportunity to unlock developments in other provinces as OEMs establish new production lines. Incentives like the Atlantis Special Economic Zone in the WC is expected to play a key role in future opportunities (see section 5).
Table 3: Private transport representation in SA
Original equipment manufacturers (OEMs) Importers and distributors
BMW South Africa (Pty) Ltd Audi (VW Group)
Ford Motor Company of Southern Africa (Pty) Ltd European Automotive Imports South Africa (EAISA) (Pty) Ltd (Maserati)
Mercedes-Benz SA Ltd FCA South Africa (Pty) Ltd (Fiat Chrysler Automobiles Group)
Volkswagen Group South Africa (Pty) Ltd Jaguar Land Rover
Nissan South Africa (Pty) Ltd Mini South Africa
Toyota South Africa Motors (Pty) Ltd Porsche
Isuzu South Africa (Pty) Ltd Volvo Car South Africa
Honda
Mahindra and Mahindra South Africa (Pty) Ltd
Mazda Southern Africa (Pty) Ltd
Mitsubishi Motors South Africa (MMSA)
Peugeot SA (Pty) Ltd
Renault South Africa (Pty) Ltd
Subaru
Suzuki Auto South Africa
Hyundai Auto South Africa Pty Ltd (MOTUS Group)
KIA Motors South Africa (Pty) Ltd
HAVAL Motors South Africa (Pty) Ltd (HMSA)
TATA Motors South Africa
ELE
CT
RIC
VE
HIC
LES
: MIR
20
2227
Figure 8: Manufacturing hubs in South Africa
SA started exporting vehicles produced locally in 1995 and has exported 4.7 million vehicles. Table 4 shows SA’s percentage share of global vehicle production
in recent years. SA’s global vehicle production market share was highest in 2019, standing at 0.69% of global vehicle production.
OEM
BMW (South Africa (Pty) LtdNissan South Africa (Pty) Ltd Ford Motor Company of Southern Africa (Pty) Ltd
Commercial vehicles & bus companies
Babcock, Eicher Trucks, Fiat Group, Ford, Hyundai, Iveco, JMC, MAN Truck & Bus, MarcoPolo, Peugeot Citroen, Powerstar SA, Scania, Tata Trucks, VDL Bus & Coach and Volvo Group Southern Africa
GAUTENG
OEM
Volkswagen Group South Africa (Pty) LtdMercedes-Benz SA LtdIsuzu South Africa
Commercial vehicles & bus companies
FAW Trucks, Isuzu Truck, Mercedes-Benz SA (Freightliner and Fuso) and Volkswagen Group SA
EASTERN CAPE
OEM
Toyota South Africa Motors (Pty) Ltd
Commercial vehicles & bus companies
Bell Equipment, MAN Truck & Bus and Toyota (Hino)
KWAZULU-NATAL
28E
LE
CT
RIC
VE
HIC
LE
S: M
IR 2
022
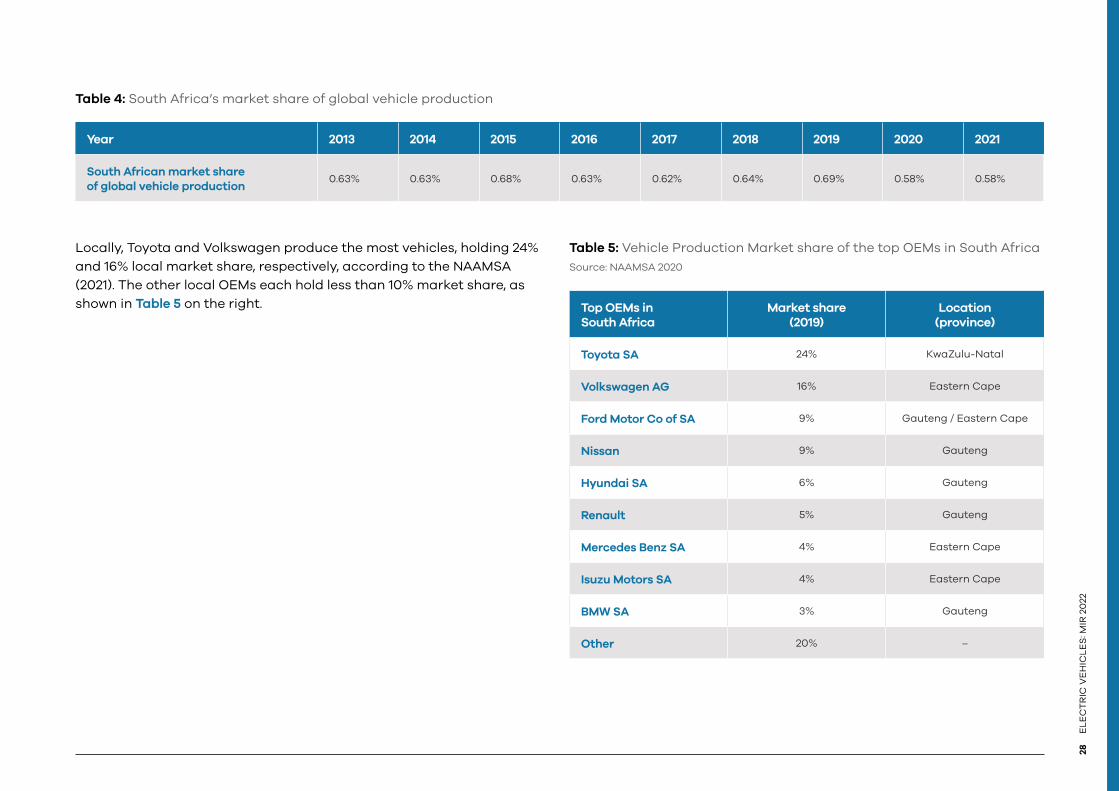
Table 4: South Africa’s market share of global vehicle production
Year 2013 2014 2015 2016 2017 2018 2019 2020 2021
South African market share of global vehicle production
0.63% 0.63% 0.68% 0.63% 0.62% 0.64% 0.69% 0.58% 0.58%
Locally, Toyota and Volkswagen produce the most vehicles, holding 24% and 16% local market share, respectively, according to the NAAMSA (2021). The other local OEMs each hold less than 10% market share, as shown in Table 5 on the right.
Table 5: Vehicle Production Market share of the top OEMs in South AfricaSource: NAAMSA 2020
Top OEMs in South Africa
Market share (2019)
Location (province)
Toyota SA 24% KwaZulu-Natal
Volkswagen AG 16% Eastern Cape
Ford Motor Co of SA 9% Gauteng / Eastern Cape
Nissan 9% Gauteng
Hyundai SA 6% Gauteng
Renault 5% Gauteng
Mercedes Benz SA 4% Eastern Cape
Isuzu Motors SA 4% Eastern Cape
BMW SA 3% Gauteng
Other 20% –

ELE
CT
RIC
VE
HIC
LES
: MIR
20
2229
3.2. The impact of COVID-19
By July 2021, the South African automotive market started growing again after losing 9.6% in the previous month, reporting 32 949 units sold (+9.7%), leading Year-to-Date (YTD) sales at 261 617 units, a 29.3% increase in sales compared to midyear 2020.
Compared to pre-pandemic levels, the market is still not growing. In fact, concerning 2021, sales were down 24.6% by mid-year.
As illustrated in Table 6, there has been a 23% reduction in total vehicle exports in 2021, compared with a similar period in 2019 (pre-pandemic).
Local vehicles sales stand at an estimated 345 172 as of November 2021, which is a 43% reduction compared with the 494 929 vehicles sold locally by November 2019. Vehicle imports have decreased by 25% as well. Asset finance was greatly affected as sales slumped. 42% of consumers asked for vehicle payment relief for three months at least.
Table 6: The impact of COVID-19 on South Africa’s vehicle production, exports, sales, and imports
2022 (projected ) 2021 2020 2019 % Change (2019 - 2021)
Total market size (USD billion)
35 34 36 32 6%
Total domestic production (units)
570 000 525 000 447 218 631 921 -20%
Total vehicle exports (USD billion)
11.6 11.2 11 14 -23%
Total local sales (units) 347 307 345 172 343 037 494 929 -43%
Total vehicle imports (USD billion)
11.32 9.62 8 12 -25%
30E
LE
CT
RIC
VE
HIC
LE
S: M
IR 2
022
SA’s car dealerships were also affected by the pandemic. These are very asset-intensive businesses with a lot of debt and are heavily reliant on sales. During the “hard” lockdown, dealerships could not re-open (hence vehicles could not be sold) even when automakers were permitted to resume operations.
NAAMSA anticipates that while the outlook is more positive, 2021/22 will continue to be a challenging year for the automotive sector. If the local vehicle and parts manufacturers are unable to deliver their products, in that case, their international customers may take their business elsewhere – opening the way for upcoming rivals such as Morocco and more established centres like Thailand to take global vehicle export market share from SA.
3.3. South Africa and the Western Cape automotive market demand
Commuter behaviour, travel patterns, and consumer preference play an important role in shaping the automotive market demand in SA, particularly in the WC.
3.3.1. Commuter behaviour and travel patterns in South Africa and the Western Cape
More than 12 million vehicles are currently on SA’s road networks. Gauteng, KZN and the WC have the highest vehicle sales and ownership. Uptake for EVs is expected to grow in a similar geographic pattern as the incumbent vehicle market, based on a higher purchasing power in these provinces. This growth pattern can change if a province can differentiate itself through infrastructure, subsidies, etc.
The National Household Travel Survey (NHTS) conducted in 2020 revealed that 45 million South Africans travelled daily in 2020. Of the 45 million people who took trips across all provinces, Gauteng (28.2%) had the largest number of individuals who undertook trips during the seven days before the survey interviews, followed by KZN (16.9%), WC (11.2%) and Limpopo (11.2%). The NC had the least number of persons who undertook trips (2.2%).
Nationally, travelling to an educational institution was the primary purpose of undertaking a trip by household members. KZN (49.4%) and EC (48.6%) had the highest proportions of persons who cited travelling to an educational institution as their primary purpose for travel.
Trips to the usual workplace were the second most common purpose for household members to travel. These trips were most prominent in the WC (37.4%), Gauteng (31.1%), and KZN (28.3%). Also, these proportions were much higher than the national proportion of 26.3%. Figure 9 provides a breakdown of the Western Cape Main Purpose of Travel By Household Members.
ELE
CT
RIC
VE
HIC
LES
: MIR
20
2231
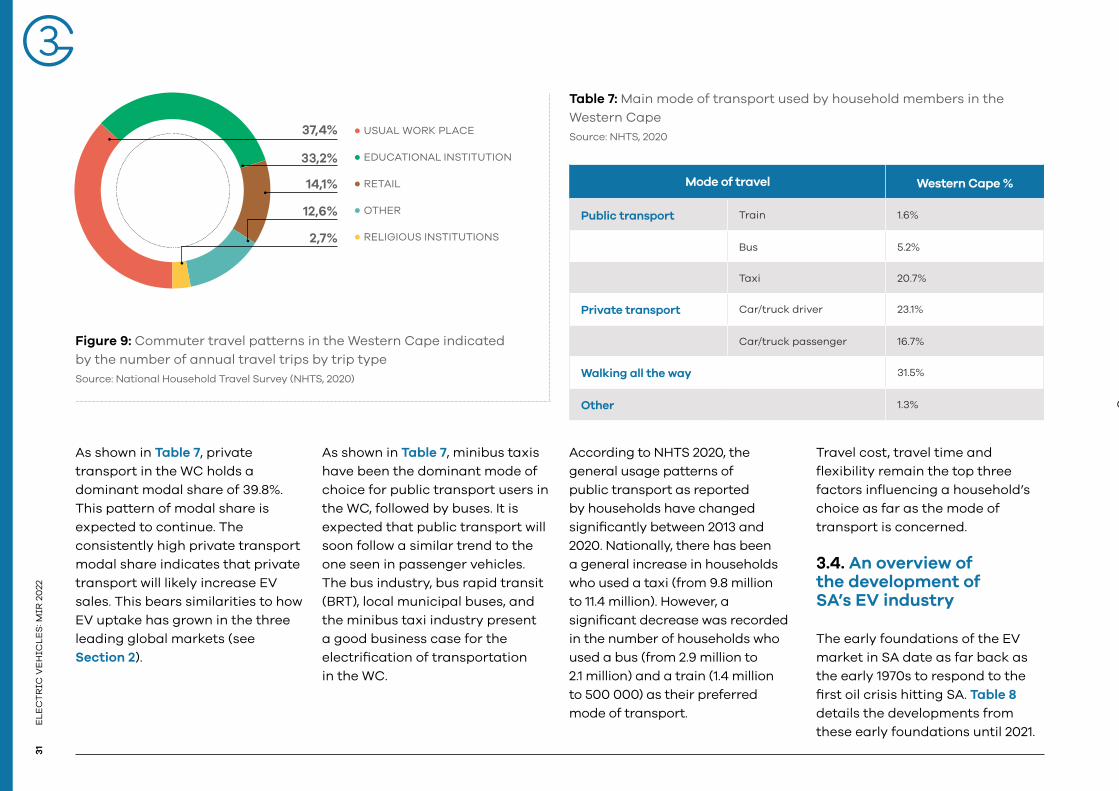
Figure 9: Commuter travel patterns in the Western Cape indicated by the number of annual travel trips by trip type Source: National Household Travel Survey (NHTS, 2020)
37+33+14+13+3+L
14,1%
12,6%
2,7%
33,2%
USUAL WORK PLACE
EDUCATIONAL INSTITUTION
RETAIL
OTHER
RELIGIOUS INSTITUTIONS
37,4%
As shown in Table 7, private transport in the WC holds a dominant modal share of 39.8%. This pattern of modal share is expected to continue. The consistently high private transport modal share indicates that private transport will likely increase EV sales. This bears similarities to how EV uptake has grown in the three leading global markets (see Section 2).
Table 7: Main mode of transport used by household members in the Western Cape Source: NHTS, 2020
Mode of travel Western Cape %
Public transport Train 1.6%
Bus 5.2%
Taxi 20.7%
Private transport Car/truck driver 23.1%
Car/truck passenger 16.7%
Walking all the way 31.5%
Other 1.3%
As shown in Table 7, minibus taxis have been the dominant mode of choice for public transport users in the WC, followed by buses. It is expected that public transport will soon follow a similar trend to the one seen in passenger vehicles. The bus industry, bus rapid transit (BRT), local municipal buses, and the minibus taxi industry present a good business case for the electrification of transportation in the WC.
According to NHTS 2020, the general usage patterns of public transport as reported by households have changed significantly between 2013 and 2020. Nationally, there has been a general increase in households who used a taxi (from 9.8 million to 11.4 million). However, a significant decrease was recorded in the number of households who used a bus (from 2.9 million to 2.1 million) and a train (1.4 million to 500 000) as their preferred mode of transport.
Travel cost, travel time and flexibility remain the top three factors influencing a household’s choice as far as the mode of transport is concerned.
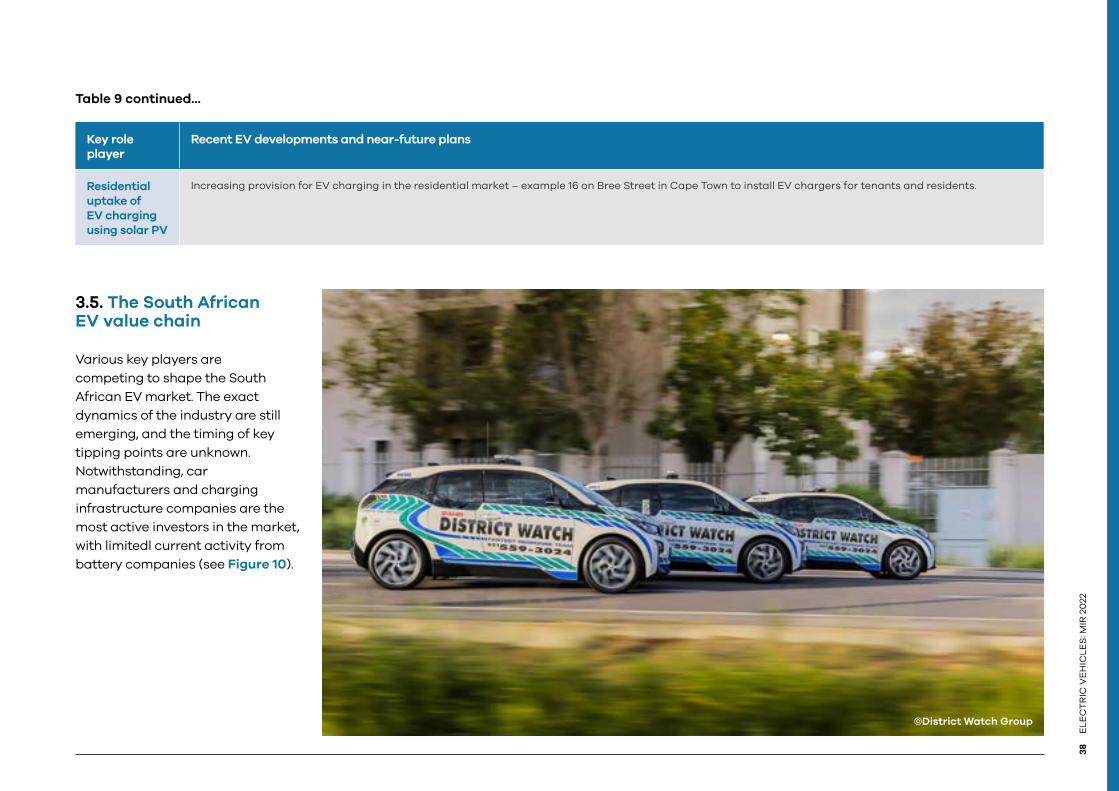
3.4. An overview of the development of SA’s EV industry
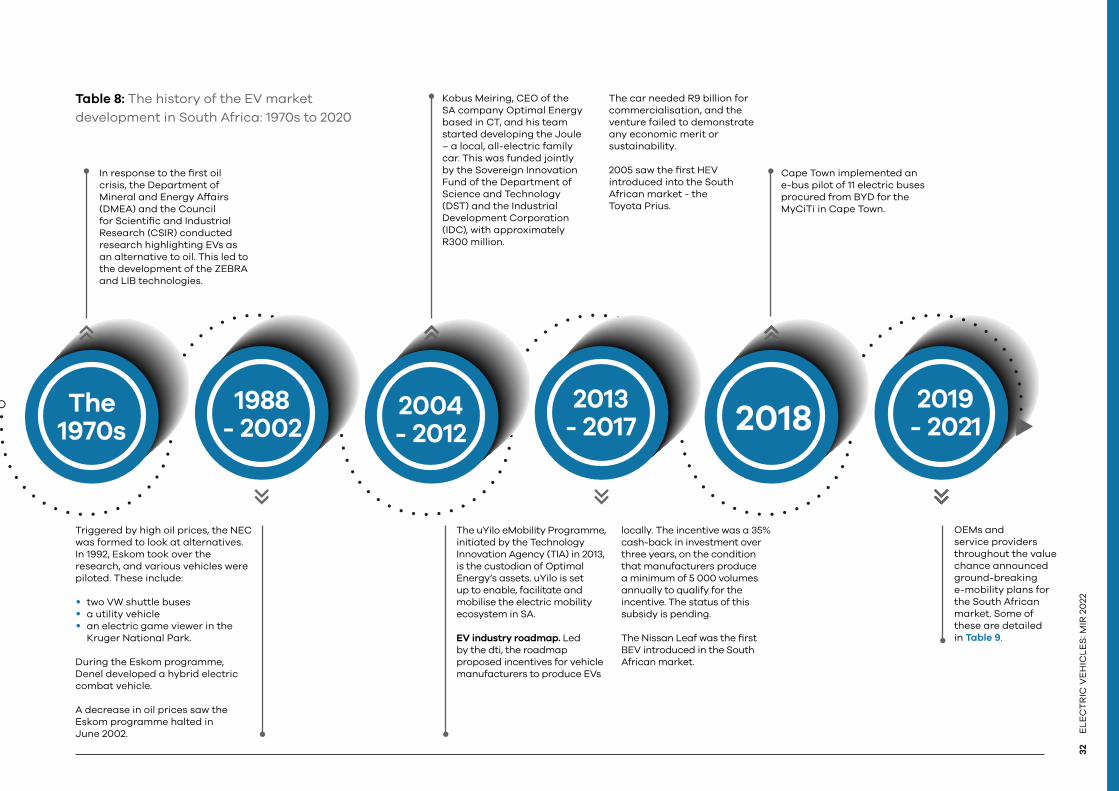
The early foundations of the EV market in SA date as far back as the early 1970s to respond to the first oil crisis hitting SA. Table 8 details the developments from these early foundations until 2021.
32E
LE
CT
RIC
VE
HIC
LE
S: M
IR 2
022
Table 8: The history of the EV market development in South Africa: 1970s to 2020
20182019
- 2021
In response to the first oil crisis, the Department of Mineral and Energy Affairs (DMEA) and the Council for Scientific and Industrial Research (CSIR) conducted research highlighting EVs as an alternative to oil. This led to the development of the ZEBRA and LIB technologies.
Kobus Meiring, CEO of the SA company Optimal Energy based in CT, and his team started developing the Joule – a local, all-electric family car. This was funded jointly by the Sovereign Innovation Fund of the Department of Science and Technology (DST) and the Industrial Development Corporation (IDC), with approximately R300 million.
The car needed R9 billion for commercialisation, and the venture failed to demonstrate any economic merit or sustainability.
2005 saw the first HEV introduced into the South African market - the Toyota Prius.
Cape Town implemented an e-bus pilot of 11 electric buses procured from BYD for the MyCiTi in Cape Town.
Triggered by high oil prices, the NEC was formed to look at alternatives. In 1992, Eskom took over the research, and various vehicles were piloted. These include:
• two VW shuttle buses• a utility vehicle• an electric game viewer in the
Kruger National Park.
During the Eskom programme, Denel developed a hybrid electric combat vehicle.
A decrease in oil prices saw the Eskom programme halted in June 2002.
OEMs and service providers throughout the value chance announced ground-breaking e-mobility plans for the South African market. Some of these are detailed in Table 9.
The uYilo eMobility Programme, initiated by the Technology Innovation Agency (TIA) in 2013, is the custodian of Optimal Energy’s assets. uYilo is set up to enable, facilitate and mobilise the electric mobility ecosystem in SA.
EV industry roadmap. Led by the dti, the roadmap proposed incentives for vehicle manufacturers to produce EVs
locally. The incentive was a 35% cash-back in investment over three years, on the condition that manufacturers produce a minimum of 5 000 volumes annually to qualify for the incentive. The status of this subsidy is pending.
The Nissan Leaf was the first BEV introduced in the South African market.
1988 - 2002
2004 - 2012
2013 - 2017
The 1970s

ELE
CT
RIC
VE
HIC
LES
: MIR
20
2233
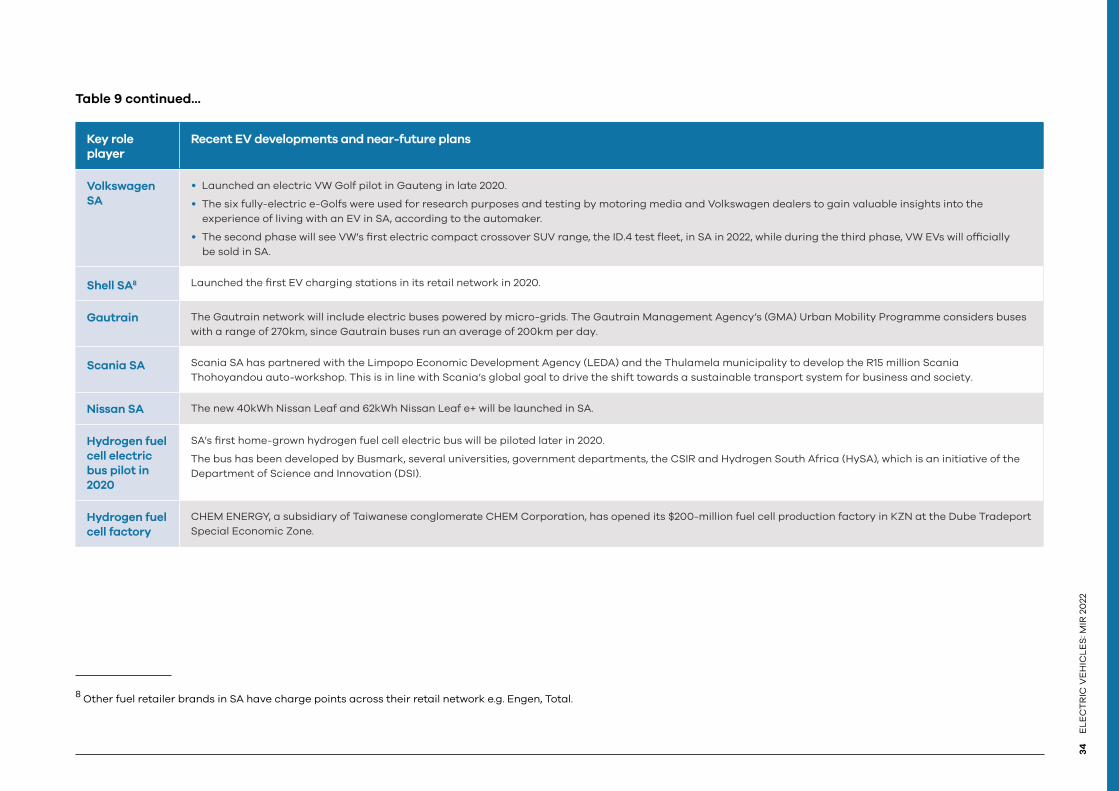
With the development and anticipated growth of the EV industry in SA, industry players, including the OEMs and vehicle service providers throughout the value chain, have announced new developments in the next few months. Table 9 below summarises some of these developments and plans..
Table 9: Recent EV developments and near-future plans by EV sector role players in South Africa
Key role player
Recent EV developments and near-future plans
Toyota SA • Producing Toyota’s first hybrid vehicle in 2021 at the Automotive Supplier Park KZN SEZ (Special Economic Zone). The vehicle will be sold locally and be exported to 43 countries in Africa. This R4.28billion investment is projected to generate about R2.85bn in additional component purchases and create 1 500 new jobs - about 500 of these at Toyota’s Prospection plant in Durban and 1 000 in the wider supply chain.
• 36% of Lexus vehicles sold in SA are hybrids.
BMW SA • Launched an electric MINI Cooper in Jan 2021. The Mini SE will be an affordable battery electric vehicle (BEV) in the local market, with pricing starting at R642 000, moving up to R722 000 for the top-spec model. It was available for SA from the first quarter of 2021.
• First EV fleet sharing scheme launched with Mini-e in Sandton
• The BMW battery-powered – iX Sports Activity Vehicle has been announced to arrive in the South African market in 2022. The vehicle will have a 100kWh high-voltage battery allowing for a range of more than 600km between charges - powered by two electric motors producing a combined output of 370kW that is sufficient to accelerate from 0-100km/h in less than five seconds. When plugged into a DC fast charger, the battery could be charged from 10% - 80% in under 40 minutes. When plugged into a normal wall box, it will take less than 11 hours to charge from 0 to 100% capacity.
• BMW is working on a new fifth-generation electric drivetrain, due in 2021/2022, that does not require any rare earth metals and plans to double the energy density of its battery cells for an increased range.
Daimler /Mercedes Benz SA
• Already offers two plug-in hybrid models in South Africa.
• Unveiled South African-made C-Class plug-in hybrid EV. The vehicle will be produced at the Daimler facility in East London.
• Mercedes EQ battery EV to be launched in SA in 2022.
• Daimler will bring electric trucks to the South African market when the local infrastructure can accommodate the new technology. Daimler anticipates this happening within the next five years.
• Investments have secured the longer-term future of Mercedes-Benz’s production plant in East London to ensure its flexibility in producing vehicles with different powertrains. The global automotive industry transition is driving the move to electromobility. Mercedes-Benz used some investments it made in SA (to produce the new C-Class) to introduce flexibility in terms of powertrain technology. Mercedes-Benz announced in June that it had invested a further R3bn in SA to boost its investment in the country to R13bn for the production of the new-generation C-Class at its plant in East London. The South African plant could produce 100% hybrids, which is extremely important since the South African plant is export-focussed. The plant is one of the cornerstones of Mercedes-Benz’s global production network.
34
EL
EC
TR
IC V
EH
ICL
ES
: MIR
20
22
Key role player
Recent EV developments and near-future plans
Volkswagen SA
• Launched an electric VW Golf pilot in Gauteng in late 2020.
• The six fully-electric e-Golfs were used for research purposes and testing by motoring media and Volkswagen dealers to gain valuable insights into the experience of living with an EV in SA, according to the automaker.
• The second phase will see VW’s first electric compact crossover SUV range, the ID.4 test fleet, in SA in 2022, while during the third phase, VW EVs will officially be sold in SA.
Shell SA8 Launched the first EV charging stations in its retail network in 2020.
Gautrain The Gautrain network will include electric buses powered by micro-grids. The Gautrain Management Agency’s (GMA) Urban Mobility Programme considers buses with a range of 270km, since Gautrain buses run an average of 200km per day.
Scania SA Scania SA has partnered with the Limpopo Economic Development Agency (LEDA) and the Thulamela municipality to develop the R15 million Scania Thohoyandou auto-workshop. This is in line with Scania’s global goal to drive the shift towards a sustainable transport system for business and society.
Nissan SA The new 40kWh Nissan Leaf and 62kWh Nissan Leaf e+ will be launched in SA.
Hydrogen fuel cell electric bus pilot in 2020
SA’s first home-grown hydrogen fuel cell electric bus will be piloted later in 2020.
The bus has been developed by Busmark, several universities, government departments, the CSIR and Hydrogen South Africa (HySA), which is an initiative of the Department of Science and Innovation (DSI).
Hydrogen fuel cell factory
CHEM ENERGY, a subsidiary of Taiwanese conglomerate CHEM Corporation, has opened its $200-million fuel cell production factory in KZN at the Dube Tradeport Special Economic Zone.
8 Other fuel retailer brands in SA have charge points across their retail network e.g. Engen, Total.
Table 9 continued...
ELE
CT
RIC
VE
HIC
LES
: MIR
20
2235
Key role player
Recent EV developments and near-future plans
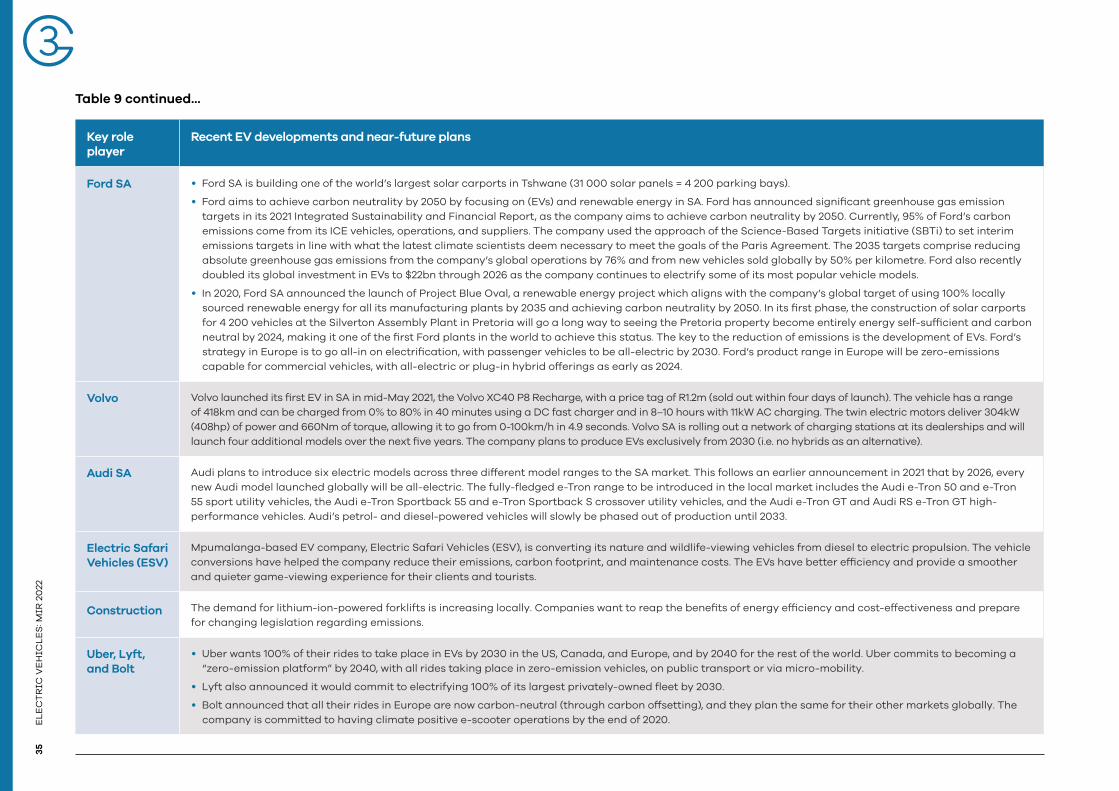
Ford SA • Ford SA is building one of the world’s largest solar carports in Tshwane (31 000 solar panels = 4 200 parking bays).
• Ford aims to achieve carbon neutrality by 2050 by focusing on (EVs) and renewable energy in SA. Ford has announced significant greenhouse gas emission targets in its 2021 Integrated Sustainability and Financial Report, as the company aims to achieve carbon neutrality by 2050. Currently, 95% of Ford’s carbon emissions come from its ICE vehicles, operations, and suppliers. The company used the approach of the Science-Based Targets initiative (SBTi) to set interim emissions targets in line with what the latest climate scientists deem necessary to meet the goals of the Paris Agreement. The 2035 targets comprise reducing absolute greenhouse gas emissions from the company’s global operations by 76% and from new vehicles sold globally by 50% per kilometre. Ford also recently doubled its global investment in EVs to $22bn through 2026 as the company continues to electrify some of its most popular vehicle models.
• In 2020, Ford SA announced the launch of Project Blue Oval, a renewable energy project which aligns with the company’s global target of using 100% locally sourced renewable energy for all its manufacturing plants by 2035 and achieving carbon neutrality by 2050. In its first phase, the construction of solar carports for 4 200 vehicles at the Silverton Assembly Plant in Pretoria will go a long way to seeing the Pretoria property become entirely energy self-sufficient and carbon neutral by 2024, making it one of the first Ford plants in the world to achieve this status. The key to the reduction of emissions is the development of EVs. Ford’s strategy in Europe is to go all-in on electrification, with passenger vehicles to be all-electric by 2030. Ford’s product range in Europe will be zero-emissions capable for commercial vehicles, with all-electric or plug-in hybrid offerings as early as 2024.
Volvo Volvo launched its first EV in SA in mid-May 2021, the Volvo XC40 P8 Recharge, with a price tag of R1.2m (sold out within four days of launch). The vehicle has a range of 418km and can be charged from 0% to 80% in 40 minutes using a DC fast charger and in 8–10 hours with 11kW AC charging. The twin electric motors deliver 304kW (408hp) of power and 660Nm of torque, allowing it to go from 0-100km/h in 4.9 seconds. Volvo SA is rolling out a network of charging stations at its dealerships and will launch four additional models over the next five years. The company plans to produce EVs exclusively from 2030 (i.e. no hybrids as an alternative).
Audi SA Audi plans to introduce six electric models across three different model ranges to the SA market. This follows an earlier announcement in 2021 that by 2026, every new Audi model launched globally will be all-electric. The fully-fledged e-Tron range to be introduced in the local market includes the Audi e-Tron 50 and e-Tron 55 sport utility vehicles, the Audi e-Tron Sportback 55 and e-Tron Sportback S crossover utility vehicles, and the Audi e-Tron GT and Audi RS e-Tron GT high-performance vehicles. Audi’s petrol- and diesel-powered vehicles will slowly be phased out of production until 2033.
Electric Safari Vehicles (ESV)
Mpumalanga-based EV company, Electric Safari Vehicles (ESV), is converting its nature and wildlife-viewing vehicles from diesel to electric propulsion. The vehicle conversions have helped the company reduce their emissions, carbon footprint, and maintenance costs. The EVs have better efficiency and provide a smoother and quieter game-viewing experience for their clients and tourists.
Construction The demand for lithium-ion-powered forklifts is increasing locally. Companies want to reap the benefits of energy efficiency and cost-effectiveness and prepare for changing legislation regarding emissions.
Uber, Lyft, and Bolt
• Uber wants 100% of their rides to take place in EVs by 2030 in the US, Canada, and Europe, and by 2040 for the rest of the world. Uber commits to becoming a “zero-emission platform” by 2040, with all rides taking place in zero-emission vehicles, on public transport or via micro-mobility.
• Lyft also announced it would commit to electrifying 100% of its largest privately-owned fleet by 2030.
• Bolt announced that all their rides in Europe are now carbon-neutral (through carbon offsetting), and they plan the same for their other markets globally. The company is committed to having climate positive e-scooter operations by the end of 2020.
Table 9 continued...
36E
LE
CT
RIC
VE
HIC
LE
S: M
IR 2
022
Key role player
Recent EV developments and near-future plans
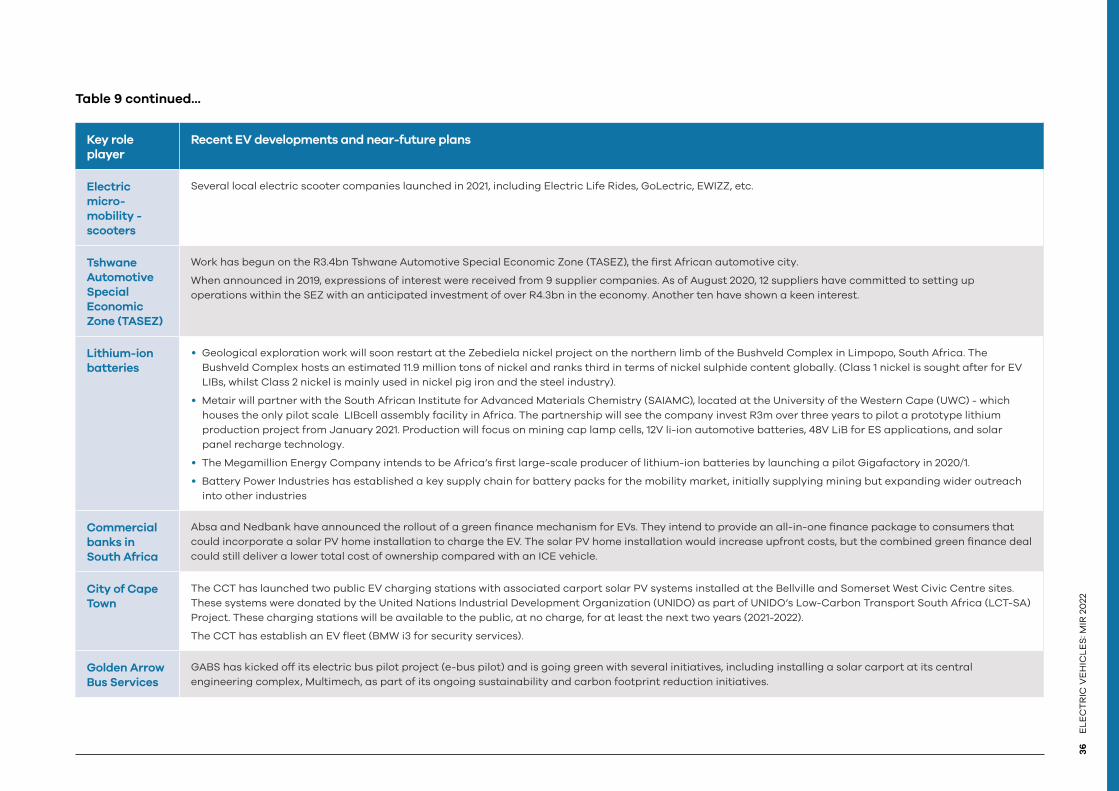
Electric micro-mobility - scooters
Several local electric scooter companies launched in 2021, including Electric Life Rides, GoLectric, EWIZZ, etc.
Tshwane Automotive Special Economic Zone (TASEZ)
Work has begun on the R3.4bn Tshwane Automotive Special Economic Zone (TASEZ), the first African automotive city.
When announced in 2019, expressions of interest were received from 9 supplier companies. As of August 2020, 12 suppliers have committed to setting up operations within the SEZ with an anticipated investment of over R4.3bn in the economy. Another ten have shown a keen interest.
Lithium-ion batteries
• Geological exploration work will soon restart at the Zebediela nickel project on the northern limb of the Bushveld Complex in Limpopo, South Africa. The Bushveld Complex hosts an estimated 11.9 million tons of nickel and ranks third in terms of nickel sulphide content globally. (Class 1 nickel is sought after for EV LIBs, whilst Class 2 nickel is mainly used in nickel pig iron and the steel industry).
• Metair will partner with the South African Institute for Advanced Materials Chemistry (SAIAMC), located at the University of the Western Cape (UWC) - which houses the only pilot scale LIBcell assembly facility in Africa. The partnership will see the company invest R3m over three years to pilot a prototype lithium production project from January 2021. Production will focus on mining cap lamp cells, 12V li-ion automotive batteries, 48V LiB for ES applications, and solar panel recharge technology.
• The Megamillion Energy Company intends to be Africa’s first large-scale producer of lithium-ion batteries by launching a pilot Gigafactory in 2020/1.
• Battery Power Industries has established a key supply chain for battery packs for the mobility market, initially supplying mining but expanding wider outreach into other industries
Commercial banks in South Africa
Absa and Nedbank have announced the rollout of a green finance mechanism for EVs. They intend to provide an all-in-one finance package to consumers that could incorporate a solar PV home installation to charge the EV. The solar PV home installation would increase upfront costs, but the combined green finance deal could still deliver a lower total cost of ownership compared with an ICE vehicle.
City of Cape Town
The CCT has launched two public EV charging stations with associated carport solar PV systems installed at the Bellville and Somerset West Civic Centre sites. These systems were donated by the United Nations Industrial Development Organization (UNIDO) as part of UNIDO’s Low-Carbon Transport South Africa (LCT-SA) Project. These charging stations will be available to the public, at no charge, for at least the next two years (2021-2022).
The CCT has establish an EV fleet (BMW i3 for security services).
Golden Arrow Bus Services
GABS has kicked off its electric bus pilot project (e-bus pilot) and is going green with several initiatives, including installing a solar carport at its central engineering complex, Multimech, as part of its ongoing sustainability and carbon footprint reduction initiatives.
Table 9 continued...
ELE
CT
RIC
VE
HIC
LES
: MIR
20
2237
Key role player
Recent EV developments and near-future plans
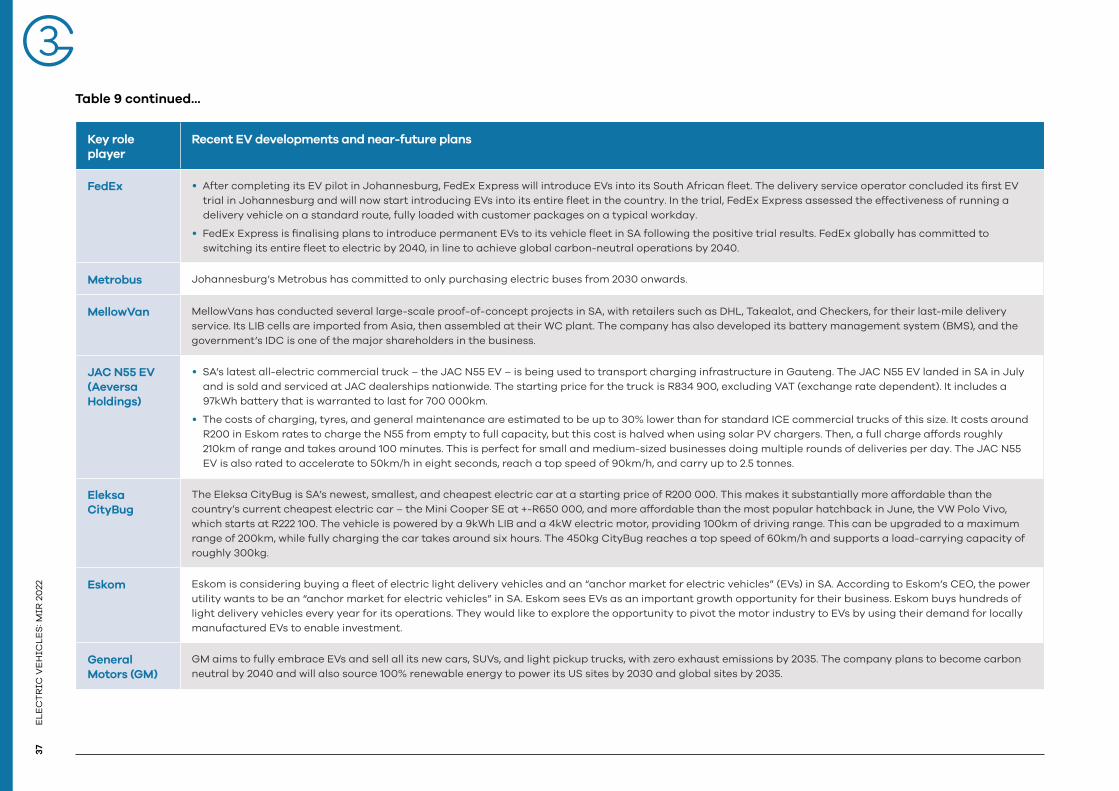
FedEx • After completing its EV pilot in Johannesburg, FedEx Express will introduce EVs into its South African fleet. The delivery service operator concluded its first EV trial in Johannesburg and will now start introducing EVs into its entire fleet in the country. In the trial, FedEx Express assessed the effectiveness of running a delivery vehicle on a standard route, fully loaded with customer packages on a typical workday.
• FedEx Express is finalising plans to introduce permanent EVs to its vehicle fleet in SA following the positive trial results. FedEx globally has committed to switching its entire fleet to electric by 2040, in line to achieve global carbon-neutral operations by 2040.
Metrobus Johannesburg’s Metrobus has committed to only purchasing electric buses from 2030 onwards.
MellowVan MellowVans has conducted several large-scale proof-of-concept projects in SA, with retailers such as DHL, Takealot, and Checkers, for their last-mile delivery service. Its LIB cells are imported from Asia, then assembled at their WC plant. The company has also developed its battery management system (BMS), and the government’s IDC is one of the major shareholders in the business.
JAC N55 EV (Aeversa Holdings)
• SA’s latest all-electric commercial truck – the JAC N55 EV – is being used to transport charging infrastructure in Gauteng. The JAC N55 EV landed in SA in July and is sold and serviced at JAC dealerships nationwide. The starting price for the truck is R834 900, excluding VAT (exchange rate dependent). It includes a 97kWh battery that is warranted to last for 700 000km.
• The costs of charging, tyres, and general maintenance are estimated to be up to 30% lower than for standard ICE commercial trucks of this size. It costs around R200 in Eskom rates to charge the N55 from empty to full capacity, but this cost is halved when using solar PV chargers. Then, a full charge affords roughly 210km of range and takes around 100 minutes. This is perfect for small and medium-sized businesses doing multiple rounds of deliveries per day. The JAC N55 EV is also rated to accelerate to 50km/h in eight seconds, reach a top speed of 90km/h, and carry up to 2.5 tonnes.
Eleksa CityBug
The Eleksa CityBug is SA’s newest, smallest, and cheapest electric car at a starting price of R200 000. This makes it substantially more affordable than the country’s current cheapest electric car – the Mini Cooper SE at +-R650 000, and more affordable than the most popular hatchback in June, the VW Polo Vivo, which starts at R222 100. The vehicle is powered by a 9kWh LIB and a 4kW electric motor, providing 100km of driving range. This can be upgraded to a maximum range of 200km, while fully charging the car takes around six hours. The 450kg CityBug reaches a top speed of 60km/h and supports a load-carrying capacity of roughly 300kg.
Eskom Eskom is considering buying a fleet of electric light delivery vehicles and an “anchor market for electric vehicles” (EVs) in SA. According to Eskom’s CEO, the power utility wants to be an “anchor market for electric vehicles” in SA. Eskom sees EVs as an important growth opportunity for their business. Eskom buys hundreds of light delivery vehicles every year for its operations. They would like to explore the opportunity to pivot the motor industry to EVs by using their demand for locally manufactured EVs to enable investment.
General Motors (GM)
GM aims to fully embrace EVs and sell all its new cars, SUVs, and light pickup trucks, with zero exhaust emissions by 2035. The company plans to become carbon neutral by 2040 and will also source 100% renewable energy to power its US sites by 2030 and global sites by 2035.
Table 9 continued...
38E
LE
CT
RIC
VE
HIC
LE
S: M
IR 2
022
Key role player
Recent EV developments and near-future plans
Residential uptake of EV charging using solar PV
Increasing provision for EV charging in the residential market – example 16 on Bree Street in Cape Town to install EV chargers for tenants and residents.
3.5. The South African EV value chain
Various key players are competing to shape the South African EV market. The exact dynamics of the industry are still emerging, and the timing of key tipping points are unknown. Notwithstanding, car manufacturers and charging infrastructure companies are the most active investors in the market, with limitedl current activity from battery companies (see Figure 10).
Table 9 continued...
©District Watch Group
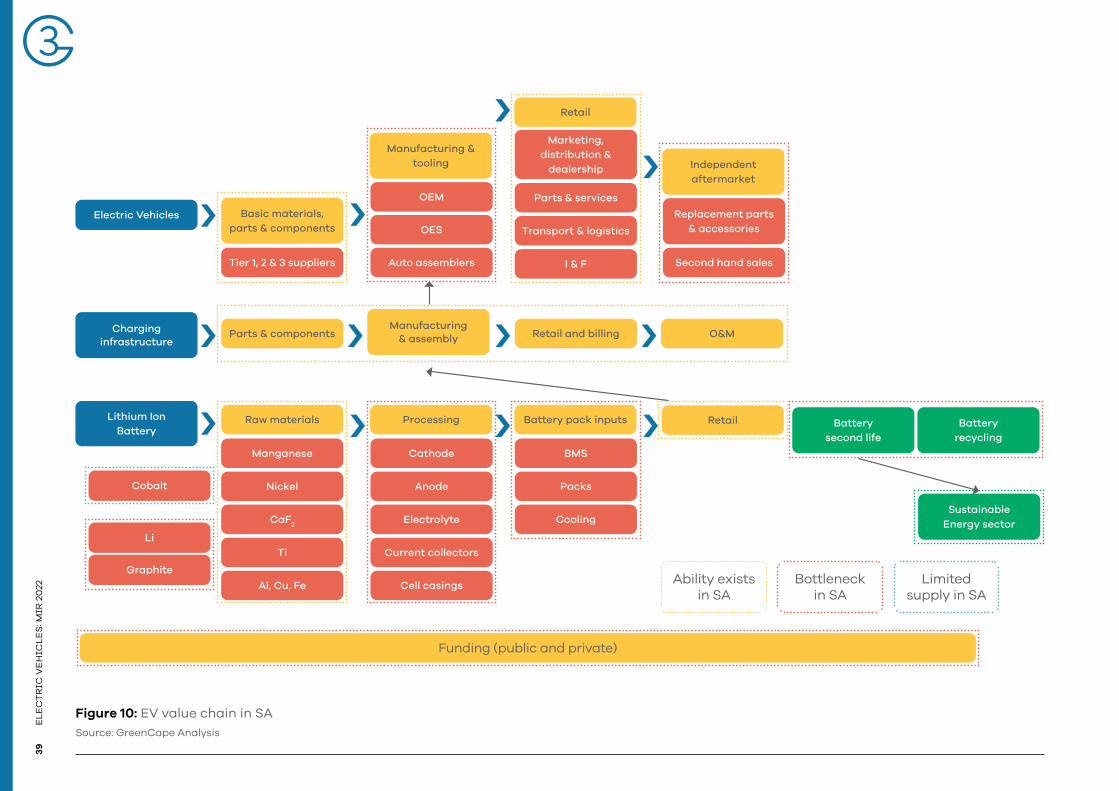
ELE
CT
RIC
VE
HIC
LES
: MIR
20
2239
Figure 10: EV value chain in SA Source: GreenCape Analysis
Tier 1, 2 & 3 suppliers
Basic materials, parts & components
Auto assemblers
Retail
Parts & services
Transport & logistics
I & F
Marketing, distribution &
dealership Independent aftermarket
Second hand sales
Replacement parts & accessories
OEM
OES
Manufacturing & tooling
Funding (public and private)
Manufacturing & assembly
Electric Vehicles
Charging infrastructure
Cobalt
Li
Graphite
Manganese
Nickel
CaF2
Ti
Al, Cu, Fe
Cathode
Anode
Electrolyte
Current collectors
Cell casings
Packs
BMS
CoolingSustainable
Energy sector
Battery recycling
Battery second life
RetailProcessing Battery pack inputs
Ability exists in SA
Bottleneck in SA
Limited supply in SA
Lithium Ion Battery
Raw materials
Parts & components Retail and billing O&M
40
EL
EC
TR
IC V
EH
ICL
ES
: MIR
20
22
Although there are valid reasons for South Africa’s transition towards electric mobility, it will not occur without potential gains and losses through the value chain, as outlined below. As the EV market grows and local manufacturing is established, the traditional ICE value chain will be impacted. Unlike ICE vehicles with over 1 000 moving parts, EVs are much more straightforward with fewer parts.
3.5.1. Skills development in the Western Cape
The WC is establishing itself as a hub for the EV industry in SA, specifically from a skills development perspective. The following organisations are also involved in the skills development value chain in the EV industry as the industry prepares for the impending transition.
• PAVE| PTRC-ZA Automotive Service Mechatronics - Salesian Institute, Cape Town, Western Cape: The Porsche Aftersales Vocational Education (PAVE) Porsche Training and Recruitment Centre (PTRC-ZA) at Salesian Institute Youth Projects, a WC focussed non-profit organisation, was launched in March 2017 in Cape Town. The programme was jointly implemented by the Salesian Institute Youth Projects and the local Porsche importer, LSM Distributors (Pty.) Ltd. The international flagship program, officially called the Porsche PTRC-ZA Automotive Mechatronics Programme, addresses the increasing importance of digitalisation, electrification, and connectivity across the automotive industry. The PAVE-PTRC program prepares a capable workforce to service alternative engine technologies highlighted as a technological disruptor for SA. This skills workforce will service the OEMs, and independent dealership and aftermarket services underscored as a priority skill for the value chain.
• Retail Motor Industry Organisation (RMI) – The Retail Motor Industry Organisation (RMI) is a member-driven South African organisation with over 8 200 members (formal and informal industries). RMI is committed to sustainable development by transforming the economy, business, and job opportunities. RMI is also a major employer representative on the Motor Industry Bargaining Council, thus playing a crucial role in labour negotiations, benefits schemes, dispute resolution processes and exemption procedures. The RMI Training Department assists its members in relevant awareness-raising and training interventions. The training. RMI Training Department also serves on various forums like merSETA to provide input and technical expertise.
RMI has eight industry associations under its umbrella, namely:
• ARA – Automotive Remanufacturers’ Association• MIWA – Motor Industry Workshop
Association• NADA – National Automobile
Dealers’ Association• SAMBRA – South African Motor
Body Repairers Association• SAPRA – South African
Petroleum Retailers Association• SAVABA – South African Vehicle
and Bodybuilders’ Association• TEPA – Tyre Equipment Parts
Association• VTA – Vehicle Testing Association
RMI is establishing a professional body for the retail motor industry. The professional body will allow student members and designated members to accumulate CPD (Continuous Professional Development) points. The professional body will register designations, recommend best practices that will professionalise the sector, participate in SETAs as a Qualification Development partner, and be involved in the retail motor industry curriculum and learning material development.

ELE
CT
RIC
VE
HIC
LES
: MIR
20
224
1
The South African Renewable Energy Technology Centre (SARETEC) – Cape Town, Western Cape: The South African Renewable Energy Technology Centre (SARETEC) is the first national renewable energy technology centre in SA and was established at the Cape Peninsula University of Technology (CPUT).
SARETEC provides specialised industry-related and accredited training for the renewable energy industry, including short courses and workshops. The training SARETEC offers plays a critical part in skills development for renewable energy charging infrastructure value chain for EVs. The EV charging infrastructure market is projected to grow substantially as more people switch to EVs.
3.6. Disruptors to the global automotive value chain and the skills requirements
The transition to electric mobility will disrupt existing ICE value chains and create new skills requirements. Table 10 below summarises these disruptors to the automotive industry (GreenCape, 2021).
Table 10: Automotive global value chain (value chain disruptors) and skills implications
Technical disruptors Drivers of change: 2021 - 2035 Skills implications globally Skills implications for South Africa
1 Alternative engine technologies
The move to PHEVs and BEVs as the price of batteries falls and environmental regulations tighten globally.
More electrical engineering and mechatronics skills will be required.
New maintenance and aftermarket service capabilities will also be needed.
Future Challenge: The lower levels of componentry of EV could impact the number of jobs in the value chain.
Skills needs: SA’s academic institutions need to produce qualified electrical engineers and mechatronics for the workforce.
New maintenance and aftermarket service capabilities for battery repair and replacement services.
2 Green manufacturing
Regulatory and consumer demand for carbon-neutral production processes, recycled material, and reduced emissions. What are the compliance cost implications?
Regulatory compliance knowledge and enforcement capabilities.
Future Challenges: Complying to (local and) international green production standards.
Skills needs: South African automakers need to develop regulatory compliance capabilities to conform to standards in international countries/developed country markets.
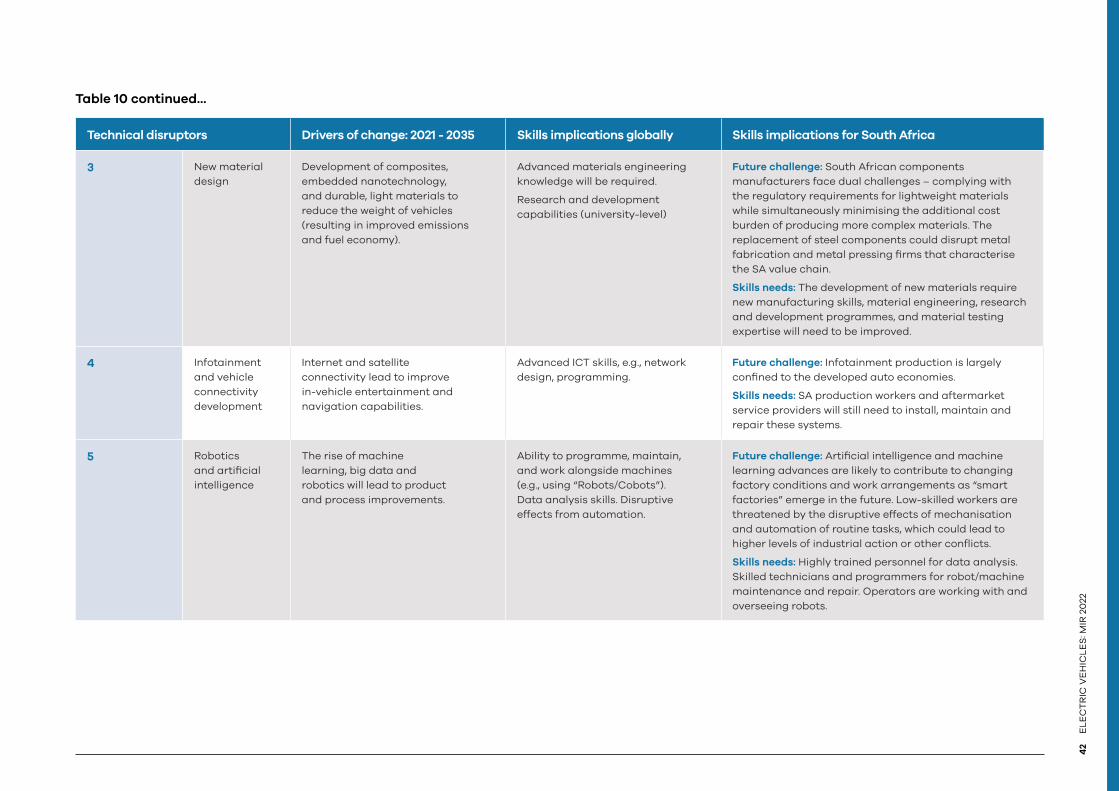
42
EL
EC
TR
IC V
EH
ICL
ES
: MIR
20
22
Technical disruptors Drivers of change: 2021 - 2035 Skills implications globally Skills implications for South Africa
3 New material design
Development of composites, embedded nanotechnology, and durable, light materials to reduce the weight of vehicles (resulting in improved emissions and fuel economy).
Advanced materials engineering knowledge will be required.
Research and development capabilities (university-level)
Future challenge: South African components manufacturers face dual challenges – complying with the regulatory requirements for lightweight materials while simultaneously minimising the additional cost burden of producing more complex materials. The replacement of steel components could disrupt metal fabrication and metal pressing firms that characterise the SA value chain.
Skills needs: The development of new materials require new manufacturing skills, material engineering, research and development programmes, and material testing expertise will need to be improved.
4 Infotainment and vehicle connectivity development
Internet and satellite connectivity lead to improve in-vehicle entertainment and navigation capabilities.
Advanced ICT skills, e.g., network design, programming.
Future challenge: Infotainment production is largely confined to the developed auto economies.
Skills needs: SA production workers and aftermarket service providers will still need to install, maintain and repair these systems.
5 Robotics and artificial intelligence
The rise of machine learning, big data and robotics will lead to product and process improvements.
Ability to programme, maintain, and work alongside machines (e.g., using “Robots/Cobots”). Data analysis skills. Disruptive effects from automation.
Future challenge: Artificial intelligence and machine learning advances are likely to contribute to changing factory conditions and work arrangements as “smart factories” emerge in the future. Low-skilled workers are threatened by the disruptive effects of mechanisation and automation of routine tasks, which could lead to higher levels of industrial action or other conflicts.
Skills needs: Highly trained personnel for data analysis. Skilled technicians and programmers for robot/machine maintenance and repair. Operators are working with and overseeing robots.
Table 10 continued...

ELE
CT
RIC
VE
HIC
LES
: MIR
20
224
3
Technical disruptors Drivers of change: 2021 - 2035 Skills implications globally Skills implications for South Africa
6 Passive and active vehicle safety advances
The introduction of new safety features will reduce collisions and road casualties but lead to a bifurcation of consumer markets as costs rise.
Familiarity with safety standards. Greater vehicle maintenance and repair skills.
Future Challenge: Developments are positive for the global automotive industry in reducing road casualties; in the short term, the benefits accrue exclusively to those consumers who can afford the cost of these features. This bifurcation (affluent and value-driven consumers) challenges local OEMs selling to the SA market, and it dilutes the economies of scale needed to justify investing in new models.
Skills needs: More formal training around new vehicle safety standards. Managers of local production firms should ensure that new technologies are identified in advance, that adequate funding is set aside, and that the appropriate process improvements are implemented. In terms of aftermarket support, and investment in more advanced vehicle maintenance and repair skills will also be needed.
7 Mobility services and autonomous vehicles (AV)
Alternative transport solutions (e.g., autonomous fleets of on-demand EVs) can potentially displace private vehicle ownership.
Potential for mass redundancy and skills migration.
Future Challenge:Under this forecast, autonomous shared-use vehicles will replace existing human-driven shared and hailed cars starting in 2030. This is likely to negatively impact vehicle sales and increase the average distance travelled per vehicle. The primary disruptive effect of AV will be transport and logistics sector jobs, and many low-skilled driver jobs are at risk of being phased out altogether.
Skills needs: Uncertain at this stage due to uncertainty in the roll-out of such technologies in the SA context.
Table 10 continued...
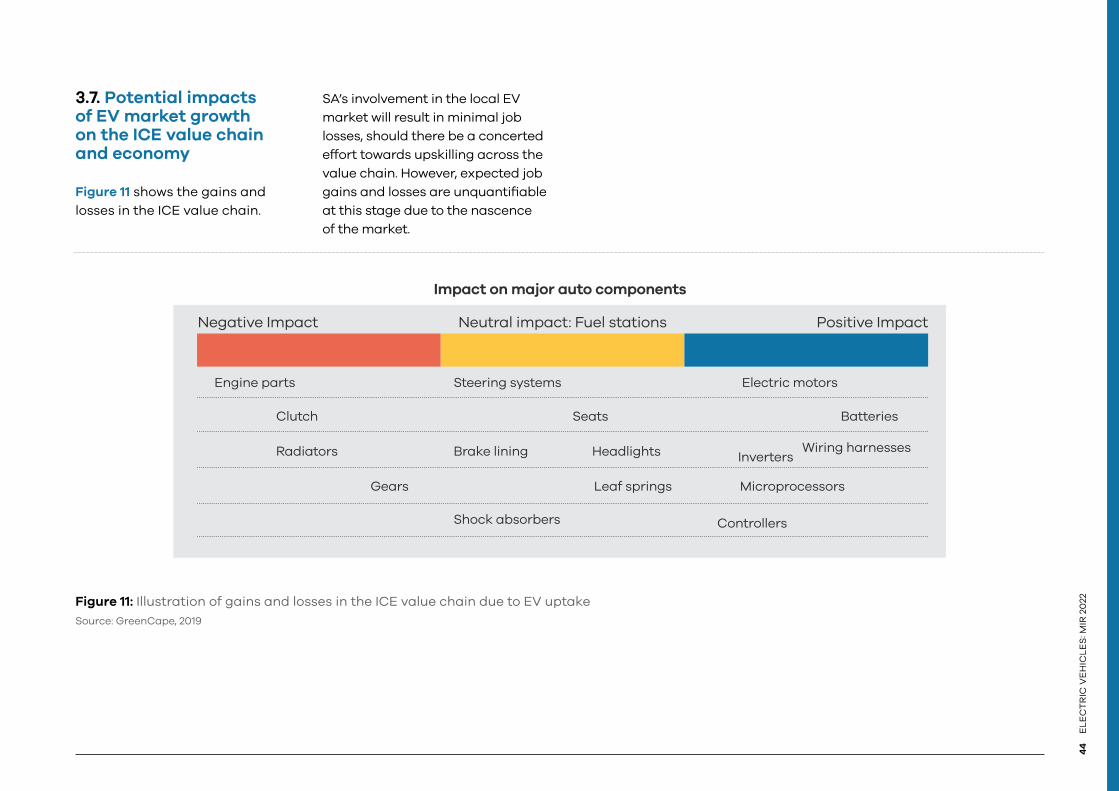
44
EL
EC
TR
IC V
EH
ICL
ES
: MIR
20
22
3.7. Potential impacts of EV market growth on the ICE value chain and economy
Figure 11 shows the gains and losses in the ICE value chain.
SA’s involvement in the local EV market will result in minimal job losses, should there be a concerted effort towards upskilling across the value chain. However, expected job gains and losses are unquantifiable at this stage due to the nascence of the market.
Negative Impact
Engine parts Steering systems
Shock absorbers
Electric motors
Controllers
Clutch Seats Batteries
Radiators Brake lining
Gears Leaf springs Microprocessors
Headlights InvertersWiring harnesses
Neutral impact: Fuel stations
Impact on major auto components
Positive Impact
Figure 11: Illustration of gains and losses in the ICE value chain due to EV uptake Source: GreenCape, 2019

ELE
CT
RIC
VE
HIC
LES
: MIR
20
224
5
Where there will be a notable impact is on fuel levies. Fuel levies are the government’s fourth biggest and most efficiently collected revenue stream. At present, a fuel tax is levied on petrol, diesel, and biodiesel, with the policy silent on electricity as a fuel for mobility.
Under the current fuel levy structure, EV uptake would significantly impact the fiscus over time. However, this revenue loss can be offset in various ways, including the potential expansion of the current carbon tax regime, which has much potential for expansion in its current form and with its limited scope.
3.7.1. The effect of EVs on oil imports, the balance of trade and Government revenue
According to the Department of Mineral Resources and Energy (DMRE), the South African transport sector consumes ~26 billion litres of liquid fuels per year, with additional oil used in the chemicals sector (for non-energy uses).
60% of SA’s liquid fuels consumption is met through crude oil imports, with an additional eight billion litres per year produced from coal and natural gas. Figure 12 below illustrates SA’s petrol and diesel consumption (DMRE 2017).
Figure 12: Petrol and diesel consumption from 2007 to 2018 Source: DMRE, 2017
2009 2010 2011 2012 2013 2014 2015 2016 2017 2018
Vo
lum
e (K
L)
2 000 000
4 000 000
6 000 000
8 000 000
10 000 000
12 000 000
14 000 000
16 000 000
02007 2008
PETROL DIESEL

46
EL
EC
TR
IC V
EH
ICL
ES
: MIR
20
22
If SA were to introduce one million EVs that drive 20 000km/yr, it would collectively reduce oil importation by 58PJ/a (Petajoules per annum). An oil import reduction of more than 6% represents a potential R8.1 billion ($580 million per year) balance of trade saving for the South African economy.
South African consumers pay a pre-determined fuel levy on all liquid fuels consumed. According to the Road Accident Fund (RAF) in 2018, the RAF Fuel Levy represented 12% of the total fuel price at the pump. The levy increased in 2019 by R0.29 and R0.30 per litre for petrol and diesel, respectively (RAF, 2020), further improving the case for switching to EVs.
Ra
nd
s 0
00
10 000
20 000
30 000
40 000
50 000
60 000
70 000
80 000
90 000
0
2008/0
9
2018
/19
2017/
18
2016
/17
2015
/16
2014
/15
2013
/14
2012
/13
2011/
12
2010
/11
2009/10
2019
/20
However, the fuel levy represents an essential and efficient revenue stream for the national government. The yearly fuel levy income is shown in Figure 13 below. Falling liquid fuel sales on the back of increased EV uptake could put this revenue stream at risk.
Table 11: Benefits and drawbacks to South Africa of EV market growth and fewer oil imports
Figure 13: Fuel levy collected in South Africa between 2008 and 2020Source: Road Accident Fund
Benefits Disadvantages
• The country has an increased ability to meet emission reduction targets.
• Decreased expenditure on oil imports.
• Mitigating against the economic risk for the SA automotive sector posed by planned reductions in ICE demand by importers of SA ICE vehicles.
• Better price control on electricity than oil.
• Job creation opportunities across a potential local EV manufacturing value chain.
• Balance of trade saving on reducing spending on oil importation is not proportional to the revenue generated through the fuel levy.
• There is a high likelihood of a reduction in contributions to the Road Accident Fund (RAF).
Table 11 summarises the macroeconomic benefits and drawbacks of a growing EV market considering the potential impact on the fuel levy.

ELE
CT
RIC
VE
HIC
LES
: MIR
20
224
7
Vehicle ClassProvince
Total% of total self-propelledGP KZ WC EC FS MP NW L NC
Motor cars and station wagons
3 152 270 1 046 242 1 308 350 484 651 325 642 455 758 339 678 365 221 134 236 7 612 048 65,36%
Minibuses 130 788 58 582 37 577 26 494 13 088 26 370 21 187 26 931 6 231 347 248 2,98%
Buses, bus trains, midibuses 20 242 8 111 6 928 4 835 3 309 8 392 4 140 7 021 1 870 64 848 0,56%
Motorcycles, quadrucycles, tricycles
142 723 30 658 85 818 21 341 17 601 17 316 12 482 8 648 7 486 344 073 2,95%
LDV’s, panel vans, other light load veh’s GVM <= 3500kg
868 491 379 283 344 087 211 799 134 706 230 358 160 736 247 277 82 957 2 659 694 22,84%
Trucks (Heavy load vehicles GVM > 3500kg)
141 892 51 353 46 455 22 836 23 049 43 827 17 731 27 444 9 252 383 840 3,30%
Other self-propelled vehicles 35 857 32 227 40 504 17 003 34 628 27 309 20 783 17 549 9 571 235 431 2,02%
Total self-propelled vehicles 4 492 263 1 606 456 1 869 719 788 959 552 023 809 330 576 737 700 091 251 604 11 647 182 % of total tow vehiclesProvincial % of total 38,57% 13,79% 16,05% 6,77% 4,74% 6,95% 4,95% 6,01% 2,16% 100,00%
3.8. Market sizing and dynamics
3.8.1. The EV passenger vehicle market
Table 12 below shows the live vehicle population in SA broken down by province and the vehicle class for July 2021. The EV penetration rate in each vehicle class currently stands at less than 1% as of 2021.
Table 12: Overview of South Africa’s conventional ICE vehicle market: July 2021Source: eNaTIS. 2021
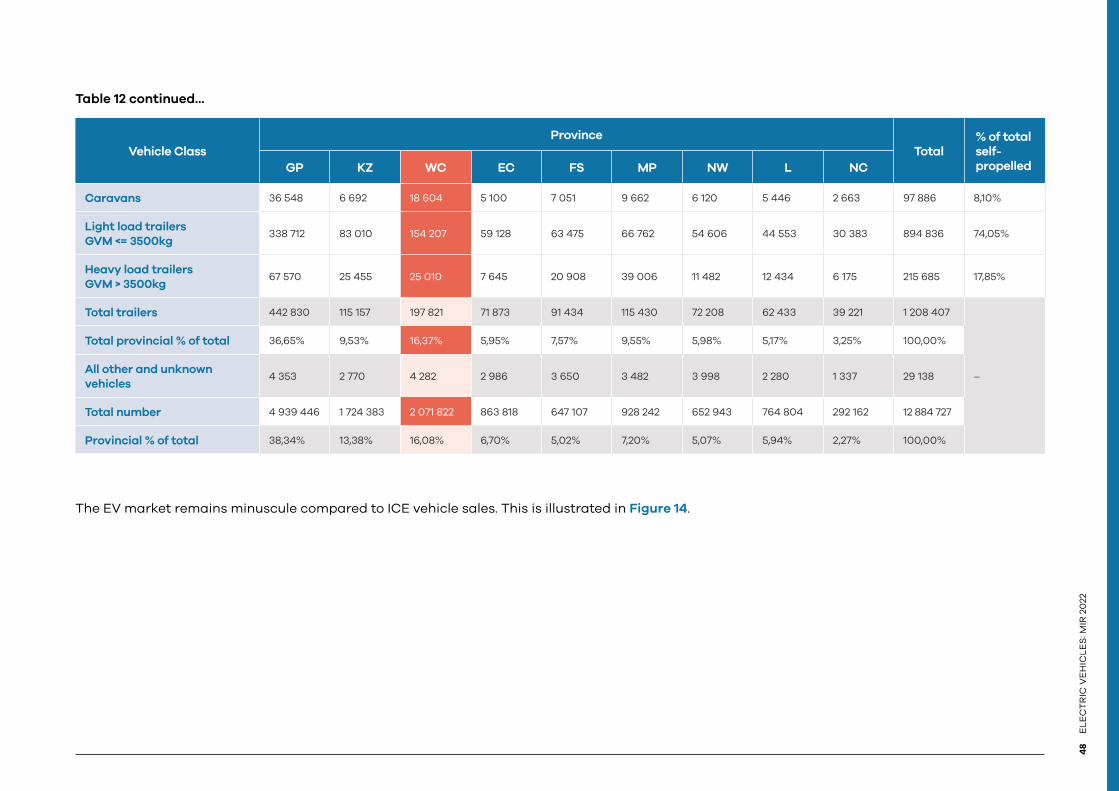
48
EL
EC
TR
IC V
EH
ICL
ES
: MIR
20
22
Vehicle ClassProvince
Total% of total self-propelledGP KZ WC EC FS MP NW L NC
Caravans 36 548 6 692 18 604 5 100 7 051 9 662 6 120 5 446 2 663 97 886 8,10%
Light load trailers GVM <= 3500kg
338 712 83 010 154 207 59 128 63 475 66 762 54 606 44 553 30 383 894 836 74,05%
Heavy load trailers GVM > 3500kg
67 570 25 455 25 010 7 645 20 908 39 006 11 482 12 434 6 175 215 685 17,85%
Total trailers 442 830 115 157 197 821 71 873 91 434 115 430 72 208 62 433 39 221 1 208 407
–
Total provincial % of total 36,65% 9,53% 16,37% 5,95% 7,57% 9,55% 5,98% 5,17% 3,25% 100,00%
All other and unknown vehicles
4 353 2 770 4 282 2 986 3 650 3 482 3 998 2 280 1 337 29 138
Total number 4 939 446 1 724 383 2 071 822 863 818 647 107 928 242 652 943 764 804 292 162 12 884 727
Provincial % of total 38,34% 13,38% 16,08% 6,70% 5,02% 7,20% 5,07% 5,94% 2,27% 100,00%
The EV market remains minuscule compared to ICE vehicle sales. This is illustrated in Figure 14.
Table 12 continued...

ELE
CT
RIC
VE
HIC
LES
: MIR
20
224
9
50 000
100 000
150 000
200 000
250 000
300 000
350 000
400 000
450 000
LEGEND: HEV- HYBRID EV; BEV – BATTERY EV; PHEV – PLUG-IN HYBRID EV
2010 2011 2012 2013 2014 2015 2016 2017 2018 2019
Petrol 289 911 343 489 373 022 370 392 360 122 340 982 297 019 302 227 302 440 299 408
Diesel 48 598 56 317 68 260 79 357 78 155 70 908 63 765 65 516 62 605 55 563
PHEV – – – – – 124 168 121 89 72
BEV – – – 34 14 117 100 68 58 154
HEV 430 627 766 513 646 266 213 182 55 181
0
HEV- HYBRID EV BEV – BATTERY EV PETROL DIESELPHEV – PLUG-IN HYBRID EV
Figure 14: ICE and EV Passenger car sales in South Africa since 2010Source: TIPS, 2020

50E
LE
CT
RIC
VE
HIC
LE
S: M
IR 2
022
On a national scale, assuming 0.5% of passenger cars currently registered can be replaced by EVs by 2030, we could see a local market of more than R76bn.
Electric micromobility such as electric scooters (e-scooter) have witnessed high growth over the past year. As outlined in Table 8, several local electric scooter companies have launched in 2021. Last-mile delivery LDV is similarly experiencing a surge in market demand, particularly during the COVID-19 lockdown periods. While the SA car industry suffered a 29% drop in sales in 2020, motorcycles weathered the COVID-19 pandemic much better and declined just 1%.
The WC has more than 1.3 million passenger cars registered in the province. Assuming that 1% of these can be replaced by EVs, at an estimated cost of R2 million per vehicle (see section 3.9.2), by 2030. This presents a local market of more than R26bn.
Assuming 50% of the total 85 818 motorcycles, tricycles and quad bikes in the WC are commercial vehicles. This could represent a potential market value of R3bn, assuming an R75 000-unit cost. This unit cost would cover a 3.0kW commercial scooter with a range of 80km – 150km.
In the WC, there are 37 577 minibuses and 6 928 buses, minibuses and bustrains This adds up to 44 505 public transport vehicles in the province, representing 2.38% of the total self-propelled vehicles in the province. This represents the potential market for public transport electrification in the WC. Assuming a cost of R5m for an electric minibus (15 seaters) and R10m for an electric bus (33 seaters), the market potential in the WC would be R64bn if 25% of this fleet was transitioned to EVs by 2030.
3.8.2. The public and industrial EV market
The bus industry, bus rapid transit (BRT), local municipal buses, and the minibus taxi industry present a good business case for the electrification of transportation in South Africa (See Section 5 for details on this opportunity).
As shown in Table 12, as of July 2021, there are 347 248 minibuses and 64 848 buses, minibuses and bustrains in SA. This adds up to 412 096 public transport vehicles in the country, representing 3.54% of the total self-propelled vehicles in the country. This represents the potential market for public transport electrification. Assuming a cost of R5m for an electric minibus (15 seaters) and R10m for an electric bus (33 seaters), the market potential in SA would be R596bn if 25% of this fleet were transitioned to EVs by 2030.
On a national scale, assuming 5% of the minibuses, buses, minibuses and bustrains currently registered can be replaced by EVs by 2030, we could see a local market of more than R120bn.
ELE
CT
RIC
VE
HIC
LES
: MIR
20
2251
This potential business case is driven by:
• Peak travel patterns (when and where people travel).• Long-standing/idle times
that coincide with current AC charging times. • Reduced operational and
maintenance costs across bus/minibus fleets over ICE technology.
The challenge in this market, as is the case with all EVs in SA at present, is financing for the significant capital price difference between ICE vehicles and EVs, and charging infrastructure investment.
Electrification of the forklift market is also expected to improve based on “fit for purpose” technology improvements where heavy-duty vehicles are concerned. The push for freight to rail is a more immediate need and is expected to take precedence over electrification. The 19C-1E excavator in the UK is the world’s first volume-produced fully electric digger that has shown it is possible to make powerful construction machinery without an ICE.
The current fleet has saved the equivalent of 15 100kg in CO2 emissions across 5 616 hours of work.
3.8.3. Charging infrastructure and network
It is widely accepted that having charging stations in locations that commuters can easily access is key to the adoption and growth of the EV market. In SA, the network currently consists of ~316 publicly accessible charging stations. This means that there is one public charging station for four EVs. According to the IEA Global EV Outlook 2021 report, SA ranked fifth globally in the ratio of public EV chargers to electric vehicles in 2020. Only Korea, Chile, Mexico, Indonesia and the Netherlands have more chargers per EV than SA. Thus the charging infrastructure is ahead of the EV demand. South Africa also has a vast fuel station network that could potentially be modified to integrate EV charging; they then become hybrid fuel/ charging stations. .
Many of these charging stations are found in Gauteng. They are largely AC charging stations that take up to six hours to arrive at full charge. Figure 15 shows active and incoming charging infrastructure stations in the country. The number and coverage of EV charging station infrastructure in SA have both grown significantly, such that the major highways and national roads have charge points spaced within ~300km of each other. In the metropolitan cities of Cape Town, Johannesburg, and Durban, EV drivers would more than likely be able to locate a charge point within ~20km.

52E
LE
CT
RIC
VE
HIC
LE
S: M
IR 2
022
Figure 15: Active and incoming charging infrastructure stations in SA Source: PlugShare, 2021
DC FAST-CHARGING STATIONS AC CHARGING STATIONS
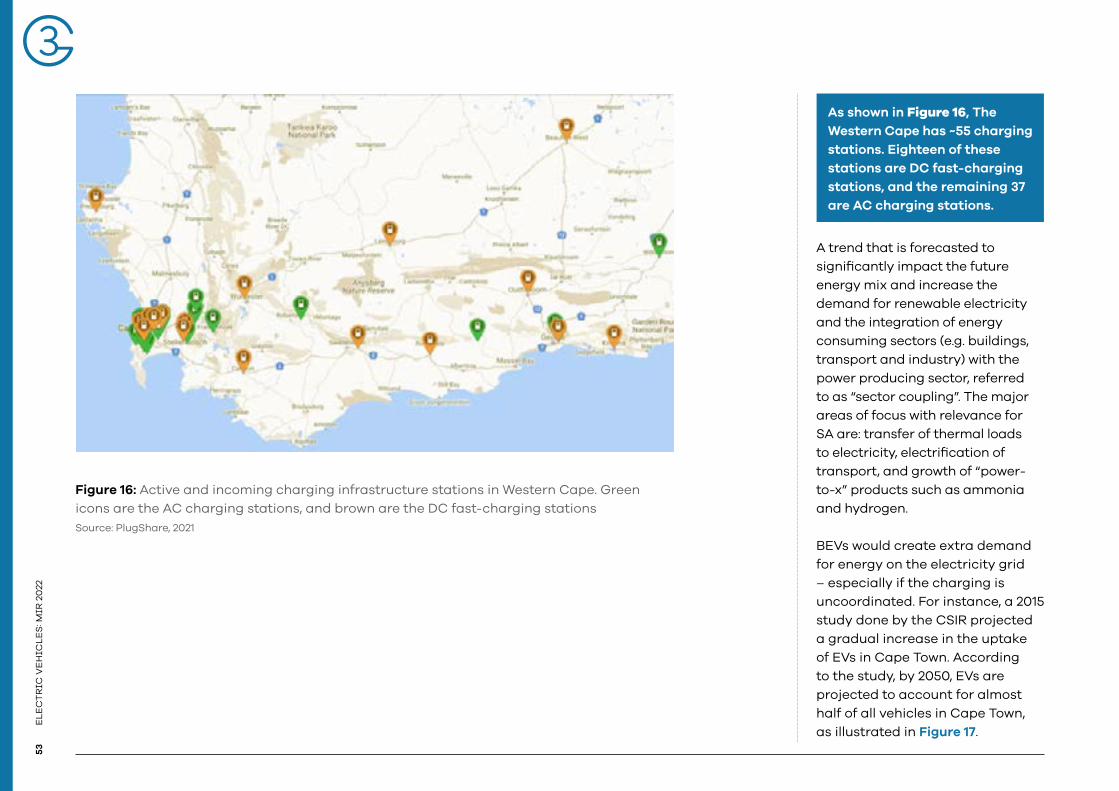
ELE
CT
RIC
VE
HIC
LES
: MIR
20
2253
A trend that is forecasted to significantly impact the future energy mix and increase the demand for renewable electricity and the integration of energy consuming sectors (e.g. buildings, transport and industry) with the power producing sector, referred to as “sector coupling”. The major areas of focus with relevance for SA are: transfer of thermal loads to electricity, electrification of transport, and growth of “power-to-x” products such as ammonia and hydrogen.
BEVs would create extra demand for energy on the electricity grid – especially if the charging is uncoordinated. For instance, a 2015 study done by the CSIR projected a gradual increase in the uptake of EVs in Cape Town. According to the study, by 2050, EVs are projected to account for almost half of all vehicles in Cape Town, as illustrated in Figure 17.
Figure 16: Active and incoming charging infrastructure stations in Western Cape. Green icons are the AC charging stations, and brown are the DC fast-charging stations Source: PlugShare, 2021
As shown in Figure 16, The Western Cape has ~55 charging stations. Eighteen of these stations are DC fast-charging stations, and the remaining 37 are AC charging stations.

54E
LE
CT
RIC
VE
HIC
LE
S: M
IR 2
022
The study found that this projected uptake in EVs would lead to an 11% increase in the total energy consumption in the CCT Town by 2050, as shown in Figure 18 (CSIR, 2015).
This creates a new opportunity for increased uptake of renewable energy to meet the increased demand. Given that the City of Cape Town accounts for ~70% of the Western Cape’s demand, projected uptake in EVs would lead to an 8% increase in the total electricity demand in the Western Cape.
Figure 17: Projected uptake of EVs in Cape TownSource: CSIR, 2015
Nu
mb
er o
f lig
ht
pa
ssen
ger
veh
icle
s
500 000
1 000 000
1 500 000
2 000 000
2 500 000
3 000 000
02012 2020 2025 2030 2035 2040 2045 2050
ELECTRIC VEHICLES ICE VEHICLES
Figure 18: Projected increase in energy consumption in Cape Town Source: CSIR, 2015
En
erg
y [M
Wh
/yr]
2012 2020 2025 2030 2035 2040 2045 2050
30 000
40 000
50 000
60 000
10 000
20 000
0
11%
ELE
CT
RIC
VE
HIC
LES
: MIR
20
2255
Most EV charging in other countries typically occurs at night and during the weekends, when passenger vehicles are often not used. However, public transport would need to charge during the day and even during peak demand periods, which could strain the electricity system. Therefore, special planning and interventions must be ready for this additional demand, especially if the energy is drawn from renewable sources.
The main challenge is that it is difficult to plan for such additional generation, distribution, transmission capacity, utility services, and investment into grids with the uncertainty and limited projections of the pace of EV uptake in the next few years in SA.
To supplement this, smart grid and distributed storage technology might need to be adopted by installing distributed energy resources (DERs), including embedded generation and storage downstream from the identified congestion points, to serve the added on-peak demand.
This distributed storage can then be recharged at night when demand is low, benefiting by smoothening demand and lowering peaks in the electricity demand profile. GreenCape’s 2022 Energy Services Market Intelligence report explores DERs in great detail.
The charging market is segmented on the connector type: CHArge de MOve (CHAdeMO), China’s Guo Bio (GB/T) and Combined Charging System (CCS).
• SANS 62196-2: National Foreword: ‘In South Africa, the allowed configuration for all AC conductive charging on domestic, industrial, commercial and public access charging stations shall be of Type 2 socket only’ SANS 62196-2 preview.
• SANS 62196-3: ‘In South Africa, the allowed configuration for DC conductive charging for domestic, industrial, commercial and public access charging station shall be configuration type AA (CHAdeMO) and configuration type FF (COMBO 2)’ SANS 62196-3 preview.
A broader breakdown of the charging standards employed by automotive companies in SA is shown in Table 13.
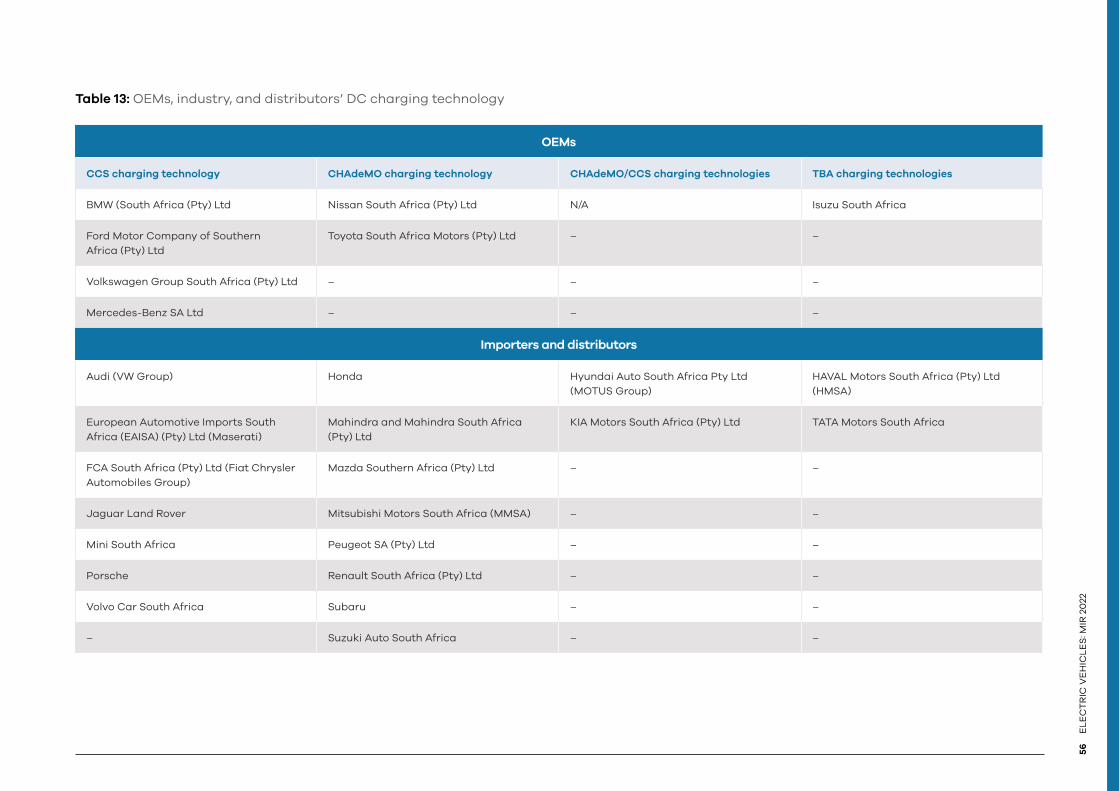
56E
LE
CT
RIC
VE
HIC
LE
S: M
IR 2
022
Table 13: OEMs, industry, and distributors’ DC charging technology
OEMs
CCS charging technology CHAdeMO charging technology CHAdeMO/CCS charging technologies TBA charging technologies
BMW (South Africa (Pty) Ltd Nissan South Africa (Pty) Ltd N/A Isuzu South Africa
Ford Motor Company of Southern Africa (Pty) Ltd
Toyota South Africa Motors (Pty) Ltd – –
Volkswagen Group South Africa (Pty) Ltd – – –
Mercedes-Benz SA Ltd – – –
Importers and distributors
Audi (VW Group) Honda Hyundai Auto South Africa Pty Ltd (MOTUS Group)
HAVAL Motors South Africa (Pty) Ltd (HMSA)
European Automotive Imports South Africa (EAISA) (Pty) Ltd (Maserati)
Mahindra and Mahindra South Africa (Pty) Ltd
KIA Motors South Africa (Pty) Ltd TATA Motors South Africa
FCA South Africa (Pty) Ltd (Fiat Chrysler Automobiles Group)
Mazda Southern Africa (Pty) Ltd – –
Jaguar Land Rover Mitsubishi Motors South Africa (MMSA) – –
Mini South Africa Peugeot SA (Pty) Ltd – –
Porsche Renault South Africa (Pty) Ltd – –
Volvo Car South Africa Subaru – –
– Suzuki Auto South Africa – –

ELE
CT
RIC
VE
HIC
LES
: MIR
20
2257
Globally, however, as of October 2021, the number of EVs sold equipped with the international CHAdeMO charging standard crossed the one million mark. This makes CHAdeMO the second-most- popular DC fast-charging system globally, after China’s GB/T system. A third of every EV sold in Europe is fitted with the CHAdeMO technology. It is available in 90 countries, with 20 EV manufacturers worldwide producing CHAdeMO-equipped and capable vehicles (uYilo, 2020).
The private sector has, until now, been driving the roll-out of charging infrastructure in SA with limited support from the government. It is also foreseeable that, with the increasing uptake of EVs, landlords could seize the opportunity to install EV chargers at residential properties to attract tenants.
Alternating current (AC) chargers are expected to hold a significant market share. This is qualified by the potential increase in demand from the residential (multi-dwelling units), and to a larger extent, the retail (shopping malls, dealerships) and fuel (filling stations) sectors.
Growth for direct current (DC) fast chargers is also expected to increase over time, driven by the growth of commercial vehicles for use in the public transport segment and a limited group of consumers looking to travel further than 400km. Metropolitan cities, where there is a noticeable uptake in EVs, are expected to drive much of the initial infrastructure growth, followed by major highways.
GreenCape’s engagements highlight that potential investors in this space are adopting a ‘wait and see’ approach because they believe the market is still too small and does not yet merit investment. The market for charging infrastructure is expected to grow as the market for EVs grows, but the timing of this is speculative. What remains unclear is who incurs the high costs of rolling out charging infrastructure – which intersects both the transportation and energy sectors. It could be the national government, EV manufacturers, local governments or road and transportation agencies.
3.9. Market drivers: EV and charging infrastructure
3.9.1. Macroeconomic drivers
The potential loss of automotive trade markets if manufacturing does not adapt
SA’s automotive sector is the largest manufacturing sector classified as a priority industry under the Industrial Policy Action Plan.
According to the NAAMSA – in 2020, which is the first year of the COVID-19 lockdown, 63.9% of the vehicles produced in SA were exported to the UK (25% of total production), Europe (28% of total production), Japan, Australia, the US, and 131 other destinations. Light vehicle exports from SA have increased steadily over the last decade, as shown in Figure 19. Until 2020 when the COVID-19 pandemic impacted both production and total exports.

58E
LE
CT
RIC
VE
HIC
LE
S: M
IR 2
022
Figure 19: Proportion of ICE light vehicles exported and imported over the last decade Source: NAAMSA 2020
2017 2018 202020192010 2012 2013 2014 2015 20162011
Light weight vehicles imported:
258 943
Total light vehicle market:472 358
Light weight vehicles imported:
293 089
Total light vehicle market:529 268
Light weight vehicles imported:
358 537
Total light vehicle market:594 715
Light weight vehicles imported:
290 244
Total light vehicle market:
503 659
Light weight vehicles imported:
355 691
Total light vehicle market:
608 943
Light weight vehicles imported:
295 935
Total light vehicle market:520 732
Light weight vehicles imported:
310 163
Total light vehicle market:552 033
Light weight vehicles imported:
293 089
Total light vehicle market:523 577
Light weight vehicles imported:
378 455
Total light vehicle market:614 634
Light weight vehicles imported:
332 927
Total light vehicle market:
589 024
Light weight vehicles imported:
203 570
Total light vehicle market:357 453
Light weight vehicles exported:
236 179
Total light vehicle production:446 748
Light weight vehicles exported:
335 772
Total light vehicle production:
571 951
Light weight vehicles exported:
276 016
Total light vehicle production:
515 041
Light weight vehicles exported:
384 146
Total light vehicle production:
597 561
Light weight vehicles exported:
278 862
Total light vehicle production:
529 268
Light weight vehicles exported:
341 463
Total light vehicle production:
569 106
Light weight vehicles exported:
270 325
Total light vehicle production:503 659
Light weight vehicles exported:
347 154
Total light vehicle production:580 488
Light weight vehicles exported:
273 171
Total light vehicle production:509 350
Light weight vehicles exported:
330 081
Total light vehicle production:580 488
Light weight vehicles exported:
270 730
Total light vehicle production:
423 907
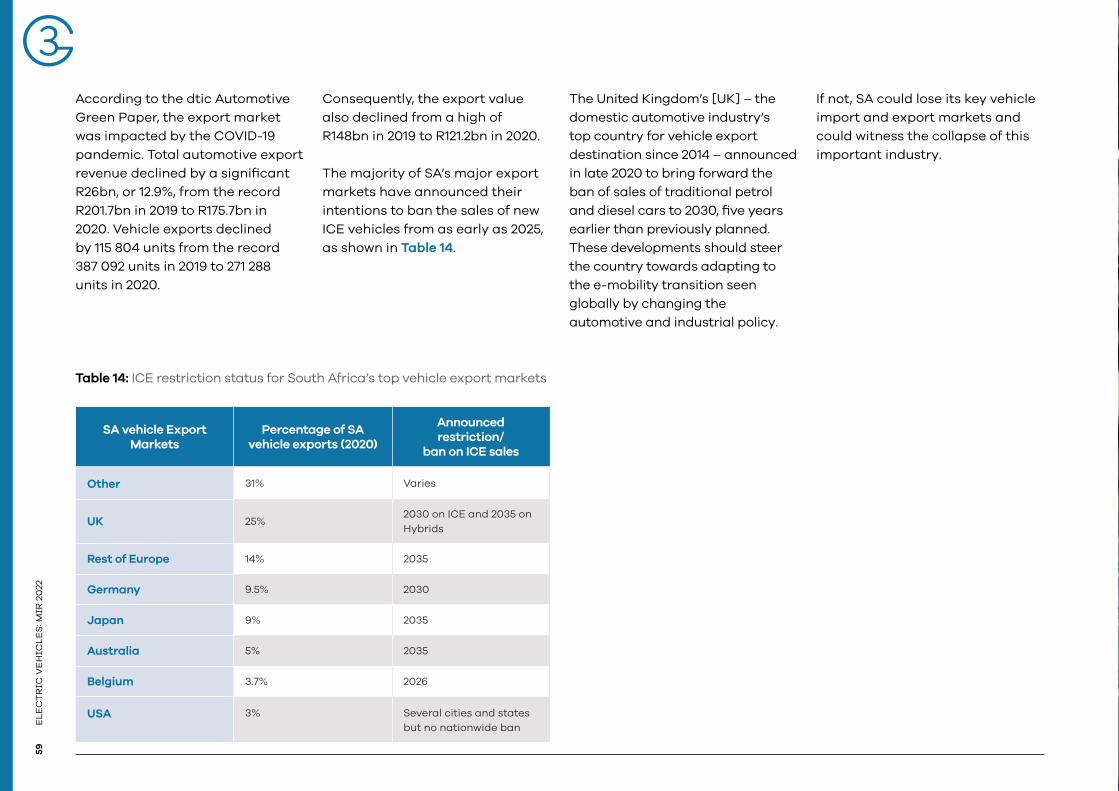
ELE
CT
RIC
VE
HIC
LES
: MIR
20
2259
According to the dtic Automotive Green Paper, the export market was impacted by the COVID-19 pandemic. Total automotive export revenue declined by a significant R26bn, or 12.9%, from the record R201.7bn in 2019 to R175.7bn in 2020. Vehicle exports declined by 115 804 units from the record 387 092 units in 2019 to 271 288 units in 2020.
Consequently, the export value also declined from a high of R148bn in 2019 to R121.2bn in 2020.
The majority of SA’s major export markets have announced their intentions to ban the sales of new ICE vehicles from as early as 2025, as shown in Table 14.
The United Kingdom’s [UK] – the domestic automotive industry’s top country for vehicle export destination since 2014 – announced in late 2020 to bring forward the ban of sales of traditional petrol and diesel cars to 2030, five years earlier than previously planned. These developments should steer the country towards adapting to the e-mobility transition seen globally by changing the automotive and industrial policy.
If not, SA could lose its key vehicle import and export markets and could witness the collapse of this important industry.
Table 14: ICE restriction status for South Africa’s top vehicle export markets
SA vehicle Export Markets
Percentage of SA vehicle exports (2020)
Announced restriction/
ban on ICE sales
Other 31% Varies
UK 25%2030 on ICE and 2035 on Hybrids
Rest of Europe 14% 2035
Germany 9.5% 2030
Japan 9% 2035
Australia 5% 2035
Belgium 3.7% 2026
USA 3% Several cities and states but no nationwide ban

60
EL
EC
TR
IC V
EH
ICL
ES
: MIR
20
22
©Unsplash
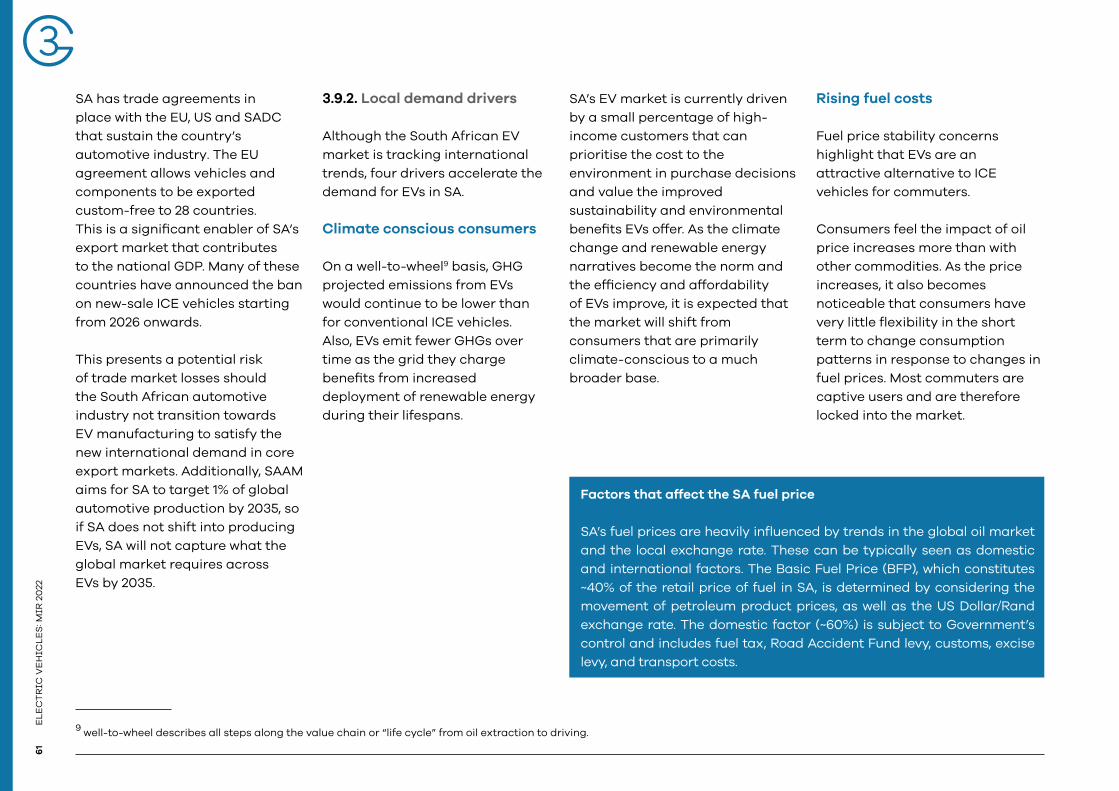
ELE
CT
RIC
VE
HIC
LES
: MIR
20
226
1
SA has trade agreements in place with the EU, US and SADC that sustain the country’s automotive industry. The EU agreement allows vehicles and components to be exported custom-free to 28 countries. This is a significant enabler of SA’s export market that contributes to the national GDP. Many of these countries have announced the ban on new-sale ICE vehicles starting from 2026 onwards.
This presents a potential risk of trade market losses should the South African automotive industry not transition towards EV manufacturing to satisfy the new international demand in core export markets. Additionally, SAAM aims for SA to target 1% of global automotive production by 2035, so if SA does not shift into producing EVs, SA will not capture what the global market requires across EVs by 2035.
9 well-to-wheel describes all steps along the value chain or “life cycle” from oil extraction to driving.
3.9.2. Local demand drivers
Although the South African EV market is tracking international trends, four drivers accelerate the demand for EVs in SA.
Climate conscious consumers
On a well-to-wheel9 basis, GHG projected emissions from EVs would continue to be lower than for conventional ICE vehicles. Also, EVs emit fewer GHGs over time as the grid they charge benefits from increased deployment of renewable energy during their lifespans.
SA’s EV market is currently driven by a small percentage of high-income customers that can prioritise the cost to the environment in purchase decisions and value the improved sustainability and environmental benefits EVs offer. As the climate change and renewable energy narratives become the norm and the efficiency and affordability of EVs improve, it is expected that the market will shift from consumers that are primarily climate-conscious to a much broader base.
Rising fuel costs
Fuel price stability concerns highlight that EVs are an attractive alternative to ICE vehicles for commuters.
Consumers feel the impact of oil price increases more than with other commodities. As the price increases, it also becomes noticeable that consumers have very little flexibility in the short term to change consumption patterns in response to changes in fuel prices. Most commuters are captive users and are therefore locked into the market.
Factors that affect the SA fuel price
SA’s fuel prices are heavily influenced by trends in the global oil market and the local exchange rate. These can be typically seen as domestic and international factors. The Basic Fuel Price (BFP), which constitutes ~40% of the retail price of fuel in SA, is determined by considering the movement of petroleum product prices, as well as the US Dollar/Rand exchange rate. The domestic factor (~60%) is subject to Government’s control and includes fuel tax, Road Accident Fund levy, customs, excise levy, and transport costs.
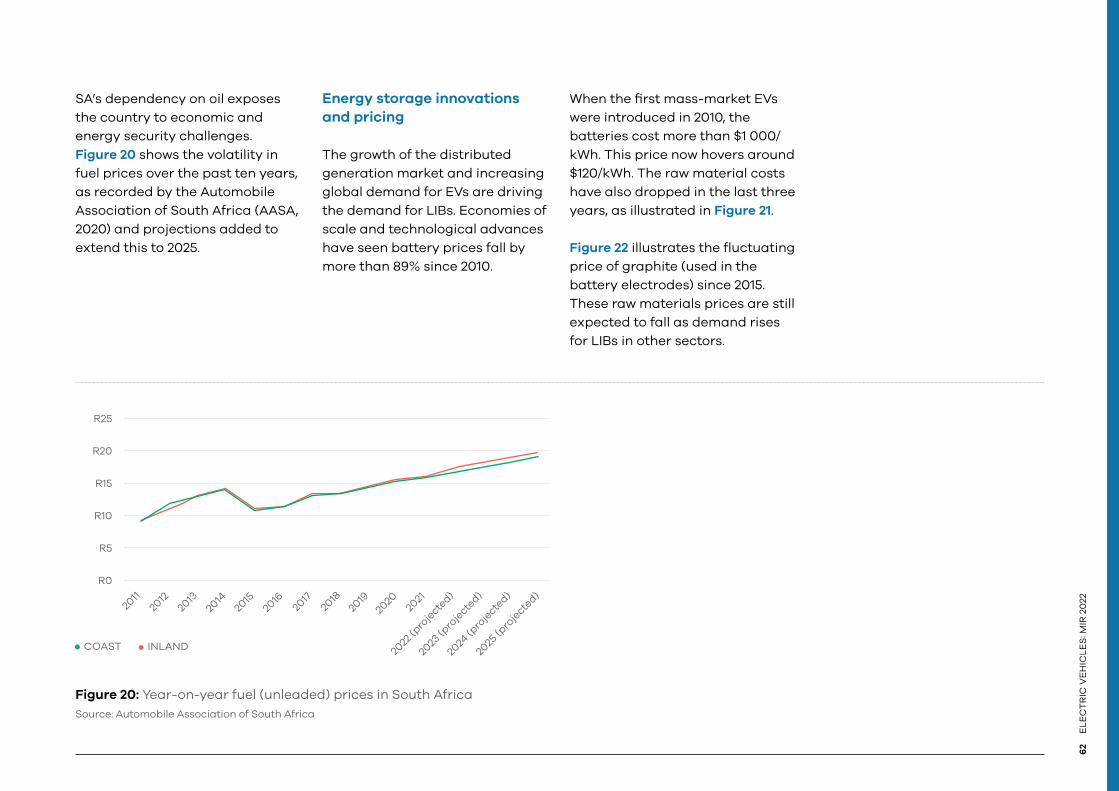
62
EL
EC
TR
IC V
EH
ICL
ES
: MIR
20
22
SA’s dependency on oil exposes the country to economic and energy security challenges. Figure 20 shows the volatility in fuel prices over the past ten years, as recorded by the Automobile Association of South Africa (AASA, 2020) and projections added to extend this to 2025.
R0
R5
R15
R20
R25
R10
2011
2012
2013
2014
2015
2016
2017
2018
2019
2020
2021
2022
(pro
jecte
d)
2023
(pro
jecte
d)
2024
(pro
jecte
d)
2025
(pro
jecte
d)
COAST INLAND
Figure 20: Year-on-year fuel (unleaded) prices in South AfricaSource: Automobile Association of South Africa
Energy storage innovations and pricing
The growth of the distributed generation market and increasing global demand for EVs are driving the demand for LIBs. Economies of scale and technological advances have seen battery prices fall by more than 89% since 2010.
When the first mass-market EVs were introduced in 2010, the batteries cost more than $1 000/kWh. This price now hovers around $120/kWh. The raw material costs have also dropped in the last three years, as illustrated in Figure 21.
Figure 22 illustrates the fluctuating price of graphite (used in the battery electrodes) since 2015. These raw materials prices are still expected to fall as demand rises for LIBs in other sectors.
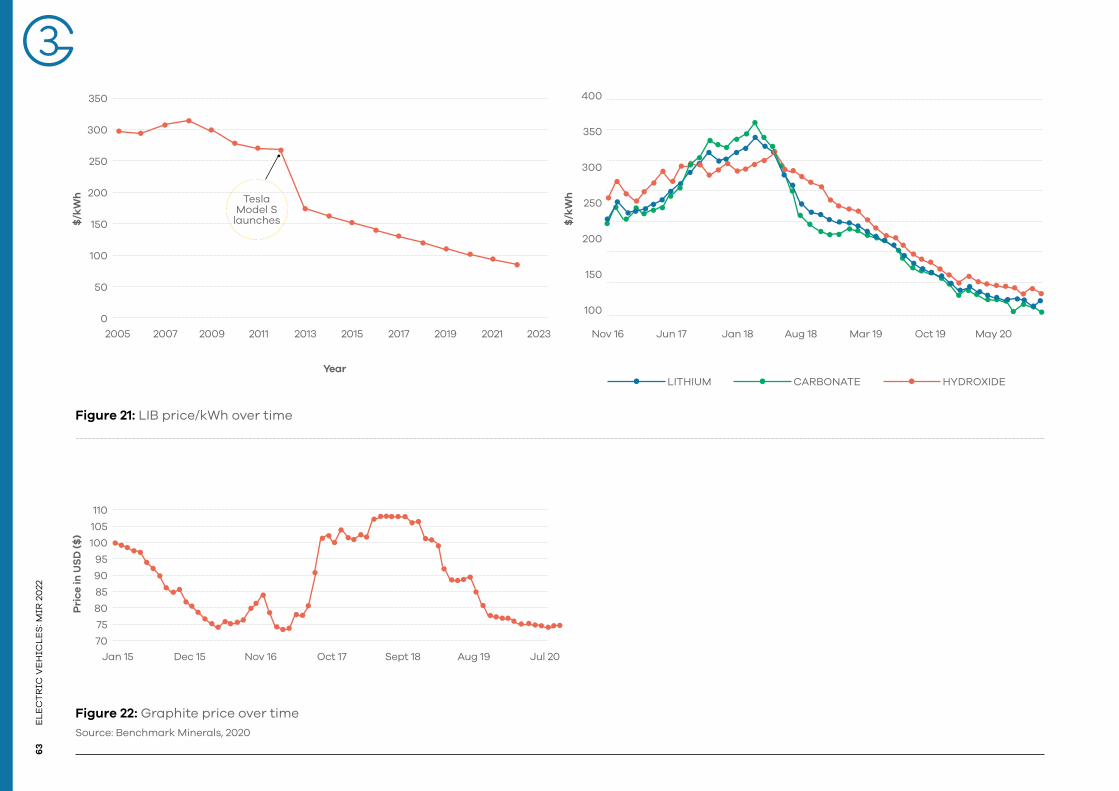
ELE
CT
RIC
VE
HIC
LES
: MIR
20
226
3
0
50
100
150
200
250
300
350
2005 2007 2009 2011 2013 2015 2017 2019 2021 2023
Year
$/k
Wh
Pri
ce in
US
D (
$)
$/k
WhTesla
Model S launches
70
75
80
85
90
95
100
105
110
Jan 15 Dec 15 Nov 16 Oct 17 Sept 18 Aug 19 Jul 20
Nov 16 Jun 17 Jan 18 Aug 18 Mar 19 Oct 19 May 20
100
150
200
250
300
350
400
LITHIUM HYDROXIDECARBONATE
Figure 21: LIB price/kWh over time
Figure 22: Graphite price over timeSource: Benchmark Minerals, 2020
64
EL
EC
TR
IC V
EH
ICL
ES
: MIR
20
22
Falling cost of EVs
Currently, batteries make up between 40% and 50% of the total cost of an EV. Falling battery prices, as discussed above, means that EVs may be cost-comparable with ICE vehicles by the middle of the decade. At this point, the business case for owning EVs moves from operational cost savings to include capital price savings.
Reduced range anxiety
The limited driving range of EVs is one of the key reasons for prospective buyers not buying them. While most of the charging happens at home for private vehicles, consumers want the comfort of knowing they can safely travel on a single charge. Improvements in BMSs have resulted in batteries with a significantly higher driving range, approximately 150km to 400km.
As the South African EV market continues to develop, the following will have to be considered with a view to growing the EV industry:
• Technology advances are delivering substantial cost cuts. Key enablers are battery chemistry developments and production capacity expansion in assembly and manufacturing plants, locally and internationally.
• Policies play a critical role. Leading countries in electric mobility use a variety of economic measures to bridge the cost gap between electric and conventional vehicles and support the deployment of charging infrastructure.
• Renewed focus on raw materials supply. The EV uptake and related battery production requirements imply a bigger demand for new materials in the automotive sector.
• Changes to the tax revenue base derived from vehicle and fuel taxes.
2020 & 2021 National EV Perception Survey
A 2020 and 2021 national EV perception survey conducted on over 3 000 car buyers on SA’s biggest automotive marketplace over 12 months found that 1.8% of the respondents have owned an EV, 13% have driven one, while 68% would want to own one in the future. Most of the respondents, 86%, would be open to using an EV as their primary vehicle rather than a second vehicle.
The unavailability of public and home charging infrastructure (61%), charging times (59.6%), and cost (55%) were cited by the respondents as the biggest barriers to EV ownership in South Africa.
Reduced emissions (80.5%), reduced noise pollution (63.9%), and cheaper running costs (54.7%) were the top-three cited advantages of EVs.
An interesting finding was that majority of the respondents aged 18-34 said they were more likely to purchase an EV in the next five years, while those aged 55+ were thinking of buying an EV within the next three years.
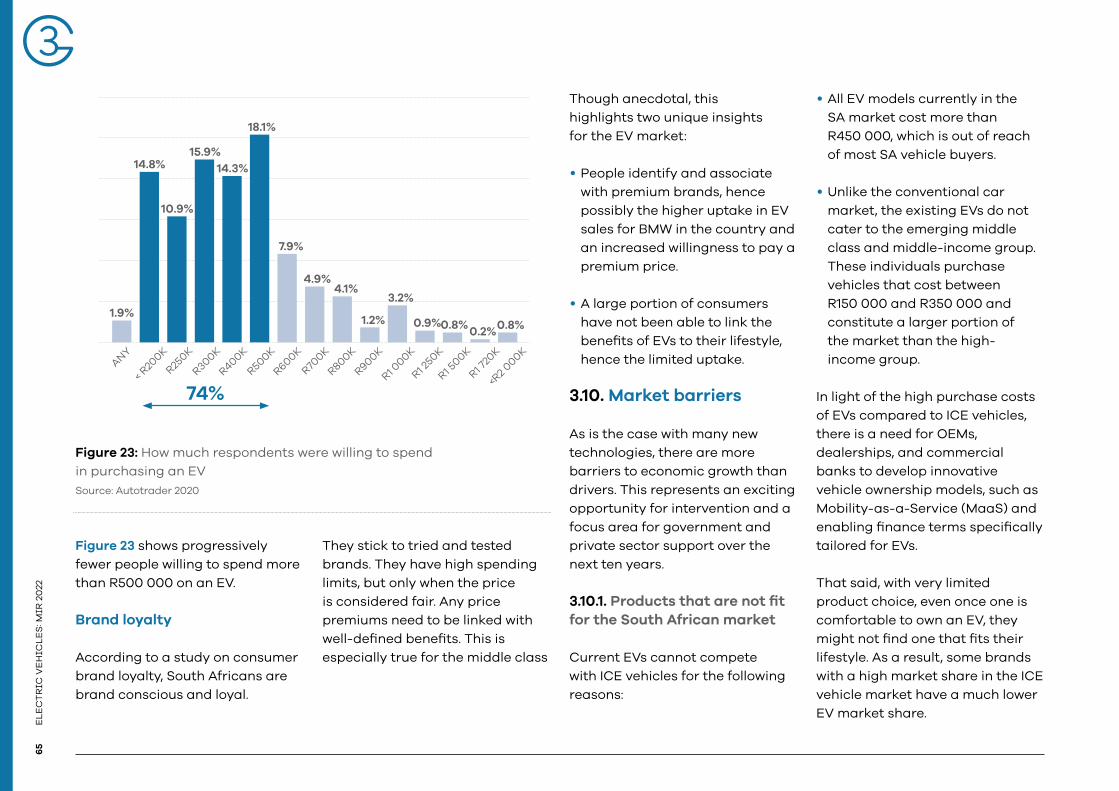
ELE
CT
RIC
VE
HIC
LES
: MIR
20
226
5
ANY
< R20
0K
R250K
R300K
R400K
R500K
R600K
R700K
R800K
R900K
R1 000K
R1 250K
R1 500K
R1 720
K
<R2 0
00K
1.9%
14.8%
10.9%
15.9%14.3%
18.1%
74%
7.9%
4.9%4.1%
1.2%
3.2%
0.9%0.8%0.2%0.8%
Figure 23: How much respondents were willing to spend in purchasing an EVSource: Autotrader 2020
Figure 23 shows progressively fewer people willing to spend more than R500 000 on an EV.
Brand loyalty
According to a study on consumer brand loyalty, South Africans are brand conscious and loyal.
They stick to tried and tested brands. They have high spending limits, but only when the price is considered fair. Any price premiums need to be linked with well-defined benefits. This is especially true for the middle class
Though anecdotal, this highlights two unique insights for the EV market:
• People identify and associate with premium brands, hence possibly the higher uptake in EV sales for BMW in the country and an increased willingness to pay a premium price.
• A large portion of consumers have not been able to link the benefits of EVs to their lifestyle, hence the limited uptake.
3.10. Market barriers
As is the case with many new technologies, there are more barriers to economic growth than drivers. This represents an exciting opportunity for intervention and a focus area for government and private sector support over the next ten years.
3.10.1. Products that are not fit for the South African market
Current EVs cannot compete with ICE vehicles for the following reasons:
• All EV models currently in the SA market cost more than R450 000, which is out of reach of most SA vehicle buyers.
• Unlike the conventional car market, the existing EVs do not cater to the emerging middle class and middle-income group. These individuals purchase vehicles that cost between R150 000 and R350 000 and constitute a larger portion of the market than the high- income group.
In light of the high purchase costs of EVs compared to ICE vehicles, there is a need for OEMs, dealerships, and commercial banks to develop innovative vehicle ownership models, such as Mobility-as-a-Service (MaaS) and enabling finance terms specifically tailored for EVs.
That said, with very limited product choice, even once one is comfortable to own an EV, they might not find one that fits their lifestyle. As a result, some brands with a high market share in the ICE vehicle market have a much lower EV market share.

66
EL
EC
TR
IC V
EH
ICL
ES
: MIR
20
22
Ultimately, the production cost of EVs would reduce significantly with economies of scale volume increases. For this increased production to happen, there is a need to facilitate local demand for EVs.
3.10.2. High import duties
Even with the overall cost of the EVs falling due to decreasing battery prices, the cost of EVs remains high relative to ICE vehicles. In SA, one of the key reasons for this is the high import duties imposed on EVs.
10 An ad valorem tax is a tax whose amount is based on the value of a transaction or of property.
Currently, EVs are subjected to 25% customs excise import duties, while buses and trucks carry 20%. In comparison, ICE vehicles incur 18% import duties. EVs incur ad valorem10 tax based on their retail price classified into luxury goods. At the same time, their high price tag contributes to ad valorem being a large amount of money. Ad valorem tax ranges up to a maximum of 30%, based on the vehicle price (SARS, 2020) (current EV products on average work out at around 17%). This means that the total taxes on EVs and hybrids average around 42% in practice.
In 2018, the International Trade Administration Commission of South Africa (ITAC) rejected an application to reduce the general rate of customs duty applicable to EVs.
The rationale was that this supported local manufacturing of EVs, and vehicle manufacturers could already offset customs duty through the APDP.
The dtic is negotiating with the EU to reduce the import tariff on EVs down from 25%. In return, SA will increase the import tariff on vehicles with an engine size smaller than 1 000 cc, which stands at 0% to 18%. These vehicles hold a large segment of the new vehicle market and are not produced in SA.
The timelines of an outcome from these negotiations are yet unknown.
BMW has also applied to the ITAC to reduce import duties to stimulate sales. The application reduced duties on imported EVs to 0% for three years, subsequent to 10%. The outcome of this application was unsuccessful.

ELE
CT
RIC
VE
HIC
LES
: MIR
20
226
7
Table 15: Import taxes and total cost of importing a Tesla Model X Performance All-Wheel Drive from the UK to South AfricaSource: My Broadband, 2021
Individual costs Total in Rand (Exchange rate
€1 = R20.87)
Purchase price of Tesla Model X Performance All-Wheel Drive in the UK
€ 96 900 R 2 022 303
+ 15% VAT of 10% mark-up
R 333 680 R 2 355 983
+ 25% duty tax R 588 996 R 2 944 979
+ 30% Ad Valorem tax R 883 494 R 3 828 472
To reduce the upfront cost of EVs, among other options are to either reduce VAT or the ad valorem excise duty – which is a tax based on the price of the product. It is, however, a complex balancing act to justify reducing ad valorem on EVs, which still carry the perception of being targeted at middle and higher-income segments of the population, on account of the high cost of EVs. One must also consider the opportunity cost of a reduction on ad valorem, which would have been used for alternative purposes.
3.10.3. Lack of policy certainty and support for EVs
The incumbent automotive sector works effectively because investors are comfortable with longstanding policy certainty and government support, as outlined in the APDP.
While enabling policy frameworks to support ICE vehicle manufacturing, those policies have not been adapted to incorporate EV manufacturing. The current lack of policy directives on local EV manufacturing presents an investment risk.
3.10.4. Lack of local skills throughout the value chain to facilitate market growth
There are currently insufficient skills in the automotive market and ancillary services to adapt to the growth of the EV manufacturing industry (as discussed in Section 3.6). There is a need to upskill existing technicians to facilitate the transition towards electric mobility. This training is also essential for first-level emergency responders, dealerships, and aftermarket services, as these sectors also play an important role in a functioning transport sector.

68
EL
EC
TR
IC V
EH
ICL
ES
: MIR
20
22
©Unsplash

This section focuses on the policy and legislative framework relevant to the SA transport sector. It also highlights policies and strategies that speak to alternative transport.
POLICY AND REGULATION

©Unsplash
ELE
CT
RIC
VE
HIC
LES
: MIR
20
2271
The regulatory framework for transport is governed by the DoT in SA. The dtic is key to ensuring the policy environment is conducive to investment, assembly, manufacturing, and trade. Several policies apply to the automotive industry:
4.1. Automotive Production and Development Programme (APDP) (2013-2021)
The APDP was implemented on 1 January 2013 and a second revised APDP was approved in 2021 to support the SAAM which runs until 2035:
The initial APDP (2013-2020) consisted of four pillars that drove the programme:
• Import duty (tax) – these tariffs are meant to protect and support domestic vehicle manufacturing.
• Production Incentives (rebate mechanism) – this is to encourage increasing levels of local value addition along the automotive value chain, with positive spin-offs for employment creation. A higher Production Incentive valuation allows for a greater duty account reduction.
• Volume Assembly Allowance (VAA) (rebate mechanism) is targeted at doubling domestic vehicle production lines by providing lower tax rates for domestic vehicle manufacturers.
• Automotive Investment Scheme (cash grant) – effective from 2009, this support is available to encourage investments by OEMs and component manufacturers in a manner that supports productive capacity upgrading.
The APDP applied only to light vehicles (passenger cars and commercial vehicles). However, components produced for heavy commercial vehicles also qualify for the Production Incentive (PI).
While the automotive industry has not declined since introducing the APDP in 2013, it has not shifted SA’s global position as a second-tier player. Aggregated vehicle sales have increased, but local and regional markets have declined. The local market is far from having sufficient demand to attract local assembly exclusively for domestic market supply.
This policy does not make provision for EV manufacturing but outlined taxes, rebate mechanisms, and incentives in the traditional automotive industry.
4.2. The South African Automotive Masterplan 2035 and post 2020 APDP
The SAAM guides policy on growing and supporting the domestic automotive industry from July 2021 to 2035. It addresses some of the APDP 2013-2020’s shortcomings. This master plan came into effect in 2021 has adapted the VAA to the Volume Assembly Localisation Allowance (VALA).
The difference is that VAA was based on the wholesale selling price of the vehicle produced in SA, irrespective of local content (whether parts were locally produced or imported). On the other hand, VALA has changed this, so the incentive is no longer based solely on the wholesale selling price. Rather, OEMs must deduct the value of imported content from the vehicle’s wholesale selling price. The figure is then multiplied by the applicable VALA percentage specified in the updated APDP (this VALA percentage starts at 40% in 2021 and progressively drops to 35%).
Developed by the government and the automotive industry, the SAAM covers car and light commercial vehicle manufacturing, medium, heavy, and extra-heavy trucks, bus production (potentially including off-highway vehicles), motorcycles, and the South African components supplier industry. Vehicle importers and distributors are also covered. The Masterplan creates a framework for securing even higher levels of investments and production (Barnes, 2017).
72E
LE
CT
RIC
VE
HIC
LE
S: M
IR 2
022
SAAM’s goals include:
• growing SA’s vehicle production to 1% of global output (projected to reach 140 million units annually by 2035);
• increasing local content of vehicles assembled in South Africa to 60%, from a 38.7% base;
• doubling total employment in the automotive value chain from 112 000 to 224 000 jobs;
• improving automotive industry competitiveness levels to that of leading international competitors, such as Turkey and Thailand;
• achieving the transformation of the South African automotive industry by employing black South Africans, upskilling black employees, empowering dealerships and authorised repair facilities, and substantially increasing the contribution of black-owned automotive component manufacturers within the automotive supply chain; and
• deepening value addition within South African automotive value chains across selected commodities/technologies.
Notable changes in the SAAM and post-2020 APDP:
• VAA one of the four legs of the APDP, is phased out and replaced by VALA. VALA will be phased between 2021 and 2026 to ensure no disruptions to existing OEM investment models.
• By 2026, the VALA is set at 35% of local value-add for OEM volumes above 10 000 units, but in 2021 it is set at 40%. This differs from the VAA, which gave vehicle manufacturers component import allowances of 20% (2013) of the ex-factory vehicle price. This was reduced to 19% and 18% in 2014 and 2015, respectively, for all light motor vehicles (LMVs) produced domestically. In short, the VALA advocates using local content in the components that manufacturers use by removing credits for imported content.
• The Production Incentives (PI) benefit has been increased to 25% on components. The production rebate credit certificates (PRCCs) will be replaced by duty credits tied to local value addition. This is expected to help mop the current surplus of PRCCs used by OEMs and importers to bring new vehicles into SA duty-free.
• The Automotive Investment Scheme (AIS) cash grant for capital investments has been retained. Still, it will be reduced by 5% from current levels in those instances where non-South African tooling and machinery is employed. Incentives for investment into new technologies such as EVs and hybrids, will be covered under this scheme. These incentives are, however, still subject to approval by National Treasury.
• SA is seeking a one-tariff regime across all light vehicles, including EVs, and this will potentially address the high import duty challenge.
• Previously, the APDP only applied to light vehicles (passenger cars and LCVs). The SAAM, however, now also includes medium and heavy commercial vehicles and motorcycles, but the VALA formula would not be applied in either category.
Incentives for investment into new technologies such as EVs and hybrids are expected to be covered under the AIS.
ELE
CT
RIC
VE
HIC
LES
: MIR
20
2273
4.3. Green Transport Strategy (GTS) for South Africa: (2018 – 2050)
To address the significant contribution of transport to national GHG emissions, the DoT has developed a GTS. The GTS, based on sustainable development principles, aims to minimise the impact of transport on the environment and meet current and future transport demands. It promotes green mobility and is the first national government-led strategy that provides sustainable transport.
To radically grow the uptake of EVs in South Africa, in conjunction with dti (now Department of Trade, Industry and Competition – dtic)11 and National Treasury, the DoT will: • offer producers of EVs
manufacturing incentives to both produce and sell affordable EVs in South Africa, for both the local and export markets;
• work with local research institutions to research EV batteries;
11 The dtic was established in June 2019 by the incorporation of the Department of Economic Development (EDD) into the Department of Trade and Industry (the dti) (dtic, 2019).
• Work with national, provincial and local government departments and authorities. Government purchase in 2019 accounted for 2.9% (15 423 vehicles) of total vehicle sales in the country, while corporate industry fleets accounted for 3.5% (18 695 vehicles), which could be two areas to start the EV transition;
• introduce the conversion of old technology vehicles with higher emission factors to be retrofitted with EV technology – this is, however, an expensive exercise;
• consider providing incentives related to the beneficiation of using local resources in the manufacturing of key machinery and components (e.g., hydrogen fuel cell EVs; and
• assist in establishing and developing local EV OEMs.
4.4. Procurement Policy Framework Act (PPPFA) of 2000
The revised regulations came into effect on 7 December 2011 to empower the dtic to designate industries, sectors, and sub-sectors for local production at a specified level of local content. Buses are one of the industries that have been designated for local production with minimum local content thresholds.
As such, the Preferential Procurement Regulations under the Preferential Procurement Policy Framework Act 5 of 2000 prescribe ~80% local content of the bus body for city and commuter buses (dtic, 2016).
In the case of EVs, the regulations do not exclude the battery from the bodywork, thereby creating an import barrier as there is no local manufacturing of EV batteries.
4.5. The National Climate Change Response Policy (NCCRP) (2011)
This policy is the key policy document guiding climate change response across all government departments and recognises response should be departmental, cost-effective, and integrated. As discussed previously, EVs have a role in climate change mitigation, particularly in mitigating the emissions from the transportation sector.
The plan aims to address both mitigation and adaptation in the short, medium, and long term (up to 2050), with strategies covering the following areas:
• Carbon Pricing• Water• Agriculture and commercial
forestry• Health• Biodiversity and ecosystems• Human settlements• Disaster risk reduction and
management

74E
LE
CT
RIC
VE
HIC
LE
S: M
IR 2
022
4.6. The Carbon Tax Act 15 of 2019
The Carbon Tax Act No 15 of 2019 was gazetted in May 2019 and came into effect on 1 June 2019. The carbon tax will be applied over two phases: Phase 1 will be from 1 June 2019 to 31 December 2022, and phase 2 will be from 2023 to 2030. Phase 1 will not have an impact on electricity prices. The carbon tax rate will be imposed at R120 per tonne of carbon dioxide equivalent (tCO2e) emitted.
However, taking the tax-free thresholds into account, this rate will range closer to R6 and R48 per tCO2e. This rate will increase by inflation +2% per year by 31 December 2022.
The Act has assumed a ‘polluter pays’ principle to the tax. This relatively low tax rate and range of tax-free allowances in Phase 1 are designed to incentivise large emitters to transit to a low carbon profile before Phase 2. Once the tax results have been reviewed at the end of Phase 1, changes to rates and tax-free thresholds will be applied before the next phase begins. This would significantly affect businesses with high fuel and electricity consumption.
The impact of the carbon tax on the uptake of solar and other renewable forms of energy (whichpresent an opportunity to meet the energy demand from broad EV uptake in the country) is still to be determined and will be monitored.
4.7. Nationally Determined Contributions
SA submitted its first NDC on 1 November 2016, outlining the country’s pledge to transition to a lower-carbon economy. The NDC covers adaptation, mitigation, and finance and investment requirements based on equity. In 2021, Cabinet approved South Africa’s revised Nationally Determined Contribution (NDC) climate change mitigation target range for 2030 for submission to the United Nations Framework Convention on Climate Change (UNFCCC). SA has revised its target range for 2025 to 398 to 510 and for 2030 to 350 – 420 metric tonnes of carbon dioxide equivalent (Mt Co2-eq).

ELE
CT
RIC
VE
HIC
LES
: MIR
20
2275
4.8. City of Cape Town Climate Change Strategy
Several local strategic policies are driving change on a metro level. The City of Cape Town Climate Change Strategy provides high-level strategic guidance for decision making, planning, and programme and project development and implementation regarding climate change. This strategy should be read in conjunction with the City’s Climate Change Action Plan, which provides a higher level of detail in specific actions that will be implemented to achieve the vision, desired outcomes and goals of this strategy.
Having a clear climate change strategy in place enables the City to take action to reduce and prepare for these risks (adaptation) and to take action to pursue high ambition in reducing GHG emissions (mitigation) to approach carbon neutrality by 2050.
Within the Climate Change Strategy, the transport mitigation strategy will be to continue to build an efficient and ultimately electric transport network through the best practice EASIA framework (Enable, Avoid, Shift, Improve, Adapt). This entails promoting efficiencies in transport governance, land use, multimodal transport systems, road space usage and vehicles, and that infrastructure is adapted to climate hazards. In the local context, EASIA involves enabling a shift to walking and cycling, while switching to EVs in the transport sector off the back of clean energy, and continuing the longstanding national and local efforts to achieve better public transport and, in particular, be proactive on the rail system so that its future role in the system is clear.
Within the transport mitigation strategy, the City commits to working towards achieving the following goals:
• Through the City’s role as the transport planning authority and the contracting authority for bus rapid transport (BRT) services, support the restoration, rehabilitation and expansion of the rail system to a carrying capacity of 30% above 2010 levels by 2030, and put in place a contingency for alternative mass transit infrastructure if the rail system does not recover or ceases to be functional altogether.
• Integrate transport modes to improve efficiency and fast track a modal shift from passenger kilometres by private vehicles to other modes (decreasing from 58% in 2016 to 23% in 2050.
• Prepare for a scenario of a complete transition to electric or alternative fuel-powered freight, bus, taxi and passenger vehicles by 2050.
• Develop and maintain indicators for GHG and local air pollutants from the transport sector, both citywide and for city operations, ensuring that they inform city transport planning, procurement and regulation.

76E
LE
CT
RIC
VE
HIC
LE
S: M
IR 2
022
©Unsplash
There are several emerging opportunities in the South African EV market are for local investors and investors looking to enter the South African electric mobility market.
MARKET OPPORTUNITIES
78E
LE
CT
RIC
VE
HIC
LE
S: M
IR 2
022
©Unsplash
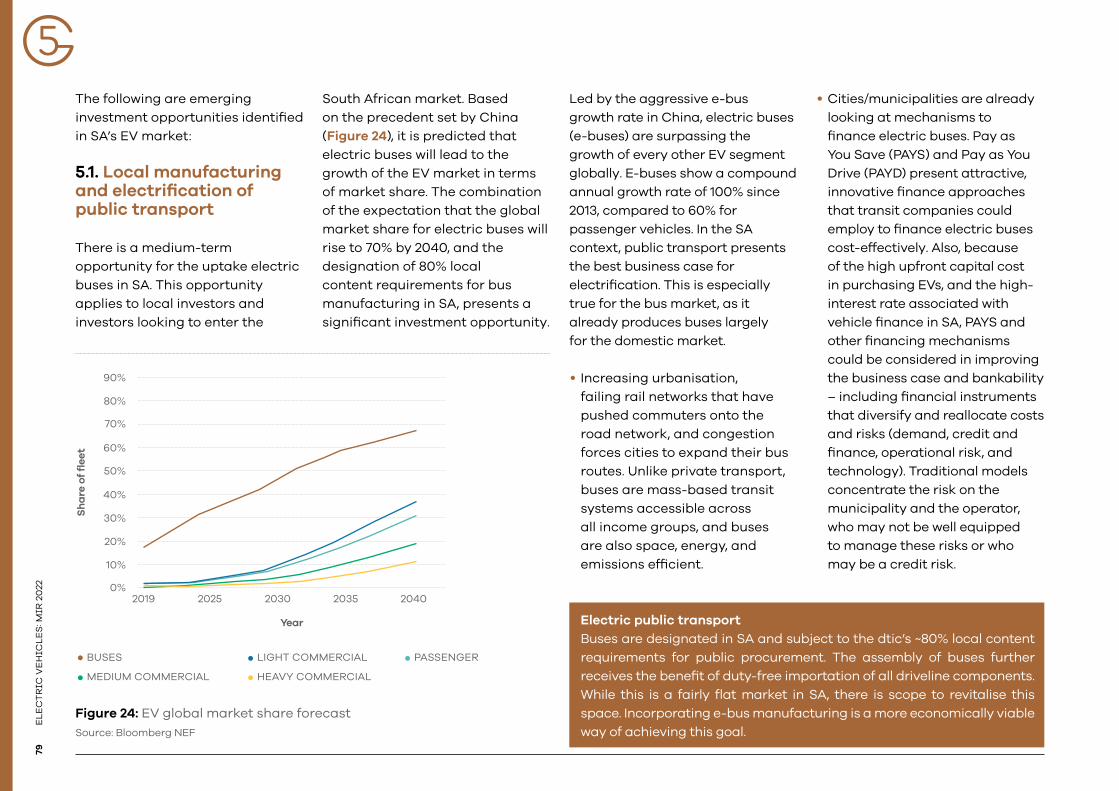
ELE
CT
RIC
VE
HIC
LES
: MIR
20
2279
03
The following are emerging investment opportunities identified in SA’s EV market:
5.1. Local manufacturing and electrification of public transport There is a medium-term opportunity for the uptake electric buses in SA. This opportunity applies to local investors and investors looking to enter the
South African market. Based on the precedent set by China (Figure 24), it is predicted that electric buses will lead to the growth of the EV market in terms of market share. The combination of the expectation that the global market share for electric buses will rise to 70% by 2040, and the designation of 80% local content requirements for bus manufacturing in SA, presents a significant investment opportunity.
Figure 24: EV global market share forecastSource: Bloomberg NEF
Led by the aggressive e-bus growth rate in China, electric buses (e-buses) are surpassing the growth of every other EV segment globally. E-buses show a compound annual growth rate of 100% since 2013, compared to 60% for passenger vehicles. In the SA context, public transport presents the best business case for electrification. This is especially true for the bus market, as it already produces buses largely for the domestic market. • Increasing urbanisation,
failing rail networks that have pushed commuters onto the road network, and congestion forces cities to expand their bus routes. Unlike private transport, buses are mass-based transit systems accessible across all income groups, and buses are also space, energy, and emissions efficient.
• Cities/municipalities are already looking at mechanisms to finance electric buses. Pay as You Save (PAYS) and Pay as You Drive (PAYD) present attractive, innovative finance approaches that transit companies could employ to finance electric buses cost-effectively. Also, because of the high upfront capital cost in purchasing EVs, and the high-interest rate associated with vehicle finance in SA, PAYS and other financing mechanisms could be considered in improving the business case and bankability – including financial instruments that diversify and reallocate costs and risks (demand, credit and finance, operational risk, and technology). Traditional models concentrate the risk on the municipality and the operator, who may not be well equipped to manage these risks or who may be a credit risk.
BUSES LIGHT COMMERCIAL PASSENGER
MEDIUM COMMERCIAL HEAVY COMMERCIAL
0%
10%
20%
30%
60%
70%
80%
90%
40%
50%
2019 2025 2030 2035 2040
Sh
are
of
flee
t
Year Electric public transport Buses are designated in SA and subject to the dtic’s ~80% local content requirements for public procurement. The assembly of buses further receives the benefit of duty-free importation of all driveline components. While this is a fairly flat market in SA, there is scope to revitalise this space. Incorporating e-bus manufacturing is a more economically viable way of achieving this goal.
80E
LE
CT
RIC
VE
HIC
LE
S: M
IR 2
022
Newer alternative models try to separate the asset owner from the operator through unbundling and the separation of responsibilities (C40 Cities, 2018).
The manufacturing of EVs is correlated with their demand, and it is unlikely to materialise domestically until the demand for EVs increases significantly. Fleets, both public and private, account for about 40% of the energy use in the transport sector. From a life cycle assessment perspective through the entire value chain, it is more efficient to electrify public transport than single occupancy vehicles (SOV). According to the United Nations Environmental Programme (UNEP), most African countries, including SA, will face massive vehicle fleet growth in the next ten years. Thus there is an opportunity to do it right and channel that growth into low emission transport and avoid air pollution in the process.
When renewing bus contracts, the Municipalities could propose to or require operators to progressively start incorporating electric fleets, at least partially, or replacing ageing fleets with electric variants when their useful life is complete.
Renewable energy sources, either procured from IPPs on a larger scale or distributed embedded generation on a smaller scale by municipalities, the energy utility, Eskom, bus company operators or others, could support the increased energy demand ensuring the grid and the transport that relies on it is more sustainable and lower carbon.
The DoT’s relaunched Taxi Recapitalisation Programme (TRP) could provide an opportunity to transition the local transport industry towards e-mobility. There is potential to align that taxi-scrapping allowance with a shift from ICE minibus taxis to electric variants. There is still no e-MBT (electric minibus taxi) currently available in SA, even though the maintenance cost of MBT in SA is very high due to the distances travelled and the driving style. The taxi market share represents 67% of all daily trips in SA, and it is rising.
The CCT, followed by several other large metros, through its role as the transport planning authority and the contracting authority for bus rapid transport (BRT) services, support the restoration, rehabilitation and expansion of the rail system to a carrying capacity of 30% above 2010 levels by 2030, and has put in place a contingency for alternative mass transit infrastructure if the rail system does not recover or ceases to be functional altogether.
It also aims to integrate transport modes to improve efficiency and fast track a modal shift from passenger kilometres by private vehicles to other modes (decreasing from 58% in 2016 to 23% in 2050.
The CCT is also looking to prepare for a scenario of a complete transition to electric or alternative fuel-powered freight, bus, taxi and passenger vehicles by 2050 while developing and maintaining indicators for GHG and local air pollutants from the transport sector, both citywide and for city operations, ensuring that they inform city transport planning, procurement and regulation.
Transitioning this manufacturing to EVs, powered by renewable energy sources, is buoyed by the fact that there are many similarities and overlaps between EV and ICE drivetrains and components. Local OEMs have gone from barely registering EVs’ possibilities just a few years ago to fully embracing them. Almost all the major manufacturers now have an EV strategy, and the shift is accelerating rapidly.

ELE
CT
RIC
VE
HIC
LES
: MIR
20
2281
03
5.2. Lithium-ion battery (LIB) production
SA is an attractive assembly and possible future manufacturing destination for LIBs because of its existing battery assembly and recycling industry. This is coupled with the SA mining sector’s ability to provide some of the raw materials required for the nickel manganese cobalt oxide cathode battery chemistry, especially manganese. SA holds about 78% of the world’s manganese. Also, other raw materials required in the cathode are mined in sub-saharan Africa (SSA).
The logistical advantages of closer geographical proximity coupled with improved regional free trade policy, such as the AfCFTA and the AU Agenda 63, could provide a range of advantages in accessing and utilising these raw materials. This remains a medium- to long-term opportunity for the global LIB market (including SA’s domestic market), based on the diversification of the LIB market and increasing demand from the EV industry. LIB manufacturing can create jobs throughout the value chain as it is very labour-intensive.As indicated in Section 3.9.2, EVs have a high upfront capital cost directly linked to the high production cost of batteries. These batteries still account for between 30% and 50% of the cost of the EV. As most people make their vehicle purchase decision based on price, this remains one of the biggest barriers to the uptake of EVs in the country.
The increased demand for LIBs from consumer electronics, stationary storage, and EVs, together with improved technology, has reduced the price of LIBs by 89% since 2010. This is because the costs depend much less on raw material cost than on economies of scale in terms of the production volumes of the batteries.
Besides powering the vehicle, EV batteries have two other potentially useful applications: (1) mobile storage while installed in the vehicle and (2) as second-life storage after the vehicle batteries are retired.
EV manufacturers use several different chemistries in batteries. Lithium iron phosphate (LFP), lithium nickel cobalt aluminium oxide (NCA), and nickel manganese cobalt oxide (NMC) are the three leading cathode chemistry types. Of the three, NMC is the most prevalent and the fastest growing for the EV industry, and this is due to its high specific energy and low internal resistance. NMC cathodes account for about 28% of global EV sales, expected to grow to 53% by 2027.
The Southern Africa region is fortunate enough to possess various mineral ores, which can be useful in the local production of LIBs, as shown in Table 16 and Figure 25. The AfCFTA and the SADC Programme on Climate Change Adaptation and Mitigation could thus aid in accessing these raw materials. AfCFTA, enacted in May 2019, is the world’s largest free trade area and aims to create a single market for easy movement of capital and goods, eliminate tariffs, and create a customs union.
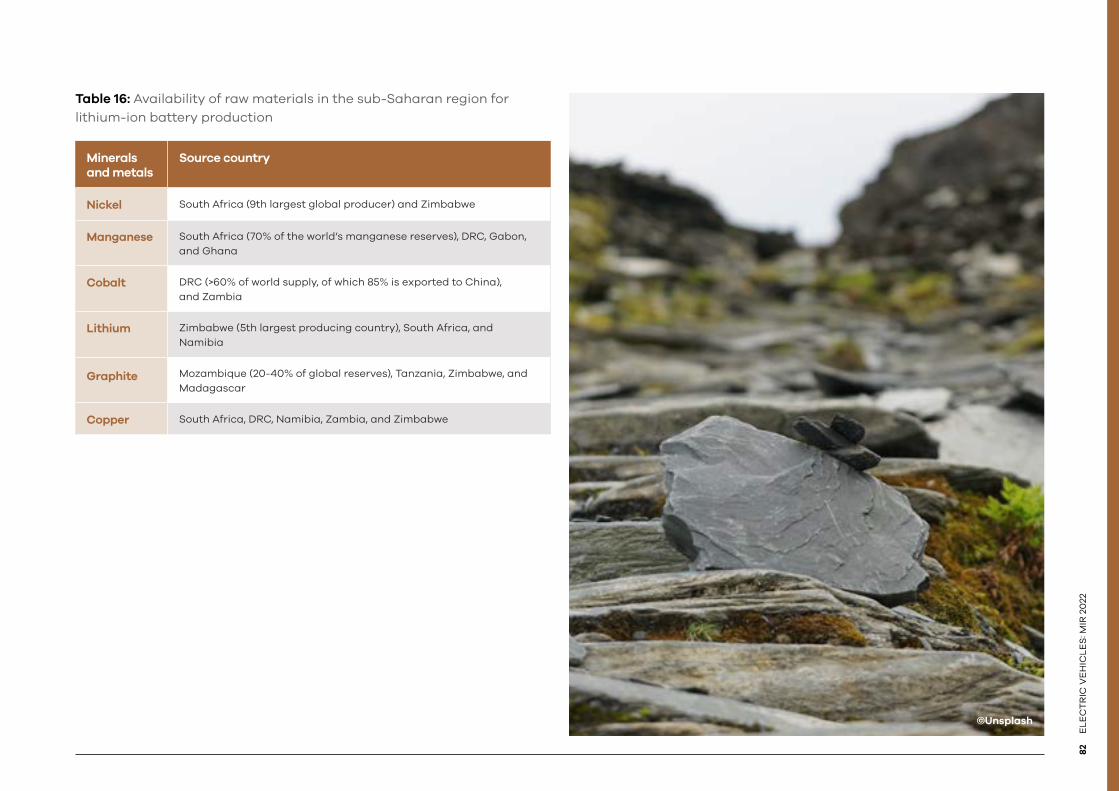
82E
LE
CT
RIC
VE
HIC
LE
S: M
IR 2
022
Table 16: Availability of raw materials in the sub-Saharan region for lithium-ion battery production
Minerals and metals
Source country
Nickel South Africa (9th largest global producer) and Zimbabwe
Manganese South Africa (70% of the world’s manganese reserves), DRC, Gabon, and Ghana
Cobalt DRC (>60% of world supply, of which 85% is exported to China), and Zambia
Lithium Zimbabwe (5th largest producing country), South Africa, and Namibia
Graphite Mozambique (20-40% of global reserves), Tanzania, Zimbabwe, and Madagascar
Copper South Africa, DRC, Namibia, Zambia, and Zimbabwe
©Unsplash
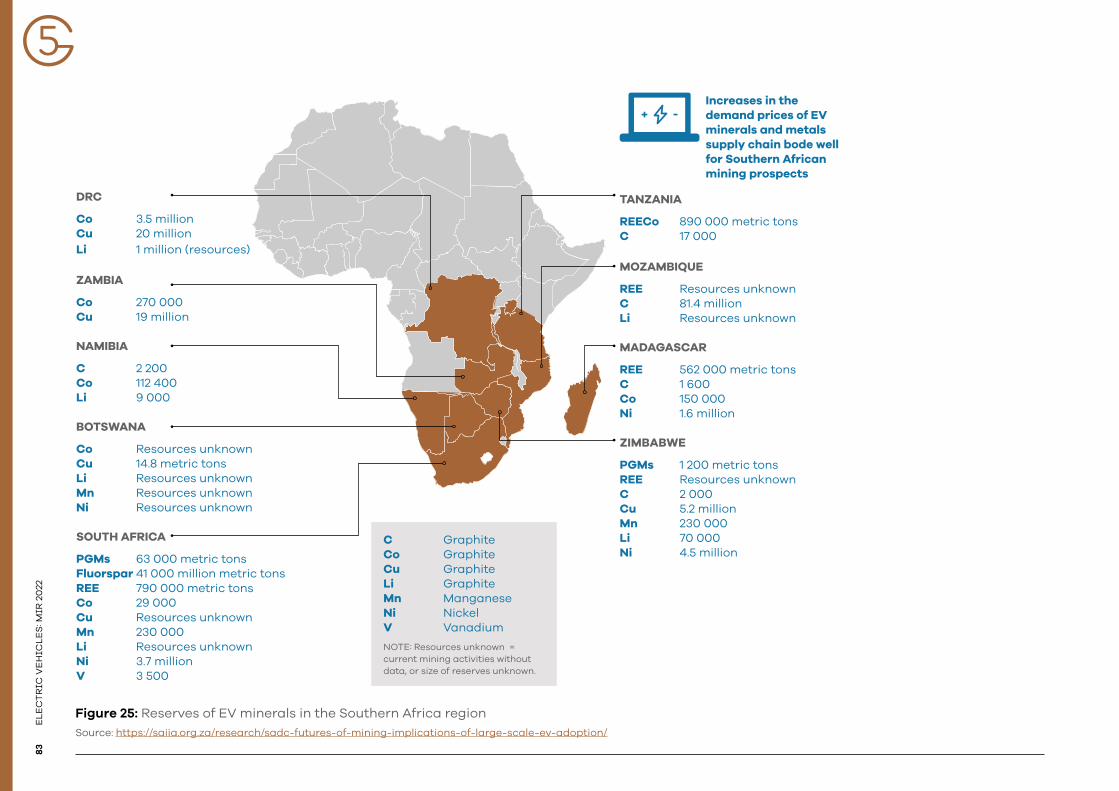
ELE
CT
RIC
VE
HIC
LES
: MIR
20
2283
03
DRC
Co 3.5 millionCu 20 millionLi 1 million (resources)
ZAMBIA
Co 270 000Cu 19 million
NAMIBIA
C 2 200Co 112 400Li 9 000
BOTSWANA
Co Resources unknownCu 14.8 metric tonsLi Resources unknownMn Resources unknownNi Resources unknown
SOUTH AFRICA
PGMs 63 000 metric tonsFluorspar 41 000 million metric tonsREE 790 000 metric tonsCo 29 000Cu Resources unknownMn 230 000Li Resources unknownNi 3.7 millionV 3 500
TANZANIA
REECo 890 000 metric tonsC 17 000
MOZAMBIQUE
REE Resources unknownC 81.4 millionLi Resources unknown
MADAGASCAR
REE 562 000 metric tonsC 1 600Co 150 000Ni 1.6 million
ZIMBABWE
PGMs 1 200 metric tonsREE Resources unknownC 2 000Cu 5.2 millionMn 230 000Li 70 000Ni 4.5 million
C GraphiteCo GraphiteCu GraphiteLi GraphiteMn ManganeseNi NickelV Vanadium
NOTE: Resources unknown = current mining activities without data, or size of reserves unknown.
Increases in the demand prices of EV minerals and metals supply chain bode well for Southern African mining prospects
Figure 25: Reserves of EV minerals in the Southern Africa regionSource: https://saiia.org.za/research/sadc-futures-of-mining-implications-of-large-scale-ev-adoption/
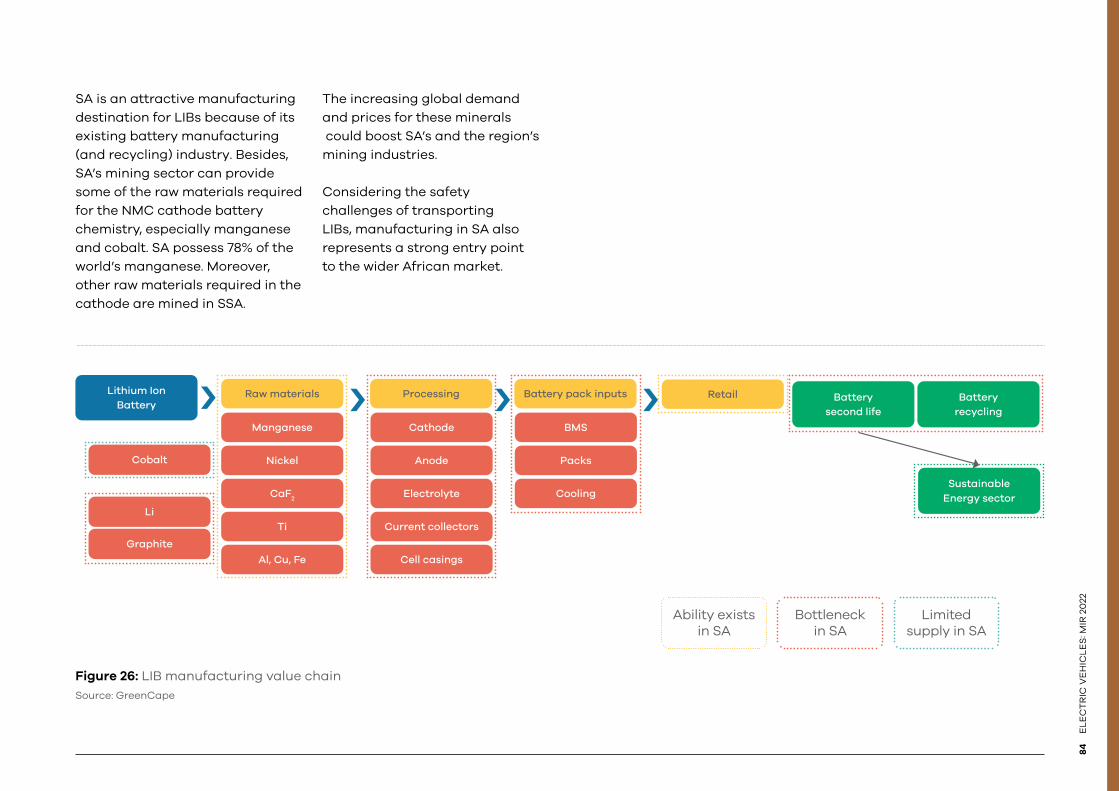
84E
LE
CT
RIC
VE
HIC
LE
S: M
IR 2
022
SA is an attractive manufacturing destination for LIBs because of its existing battery manufacturing (and recycling) industry. Besides, SA’s mining sector can provide some of the raw materials required for the NMC cathode battery chemistry, especially manganese and cobalt. SA possess 78% of the world’s manganese. Moreover, other raw materials required in the cathode are mined in SSA.
The increasing global demand and prices for these minerals could boost SA’s and the region’s mining industries.
Considering the safety challenges of transporting LIBs, manufacturing in SA also represents a strong entry point to the wider African market.
Cobalt
Li
Graphite
Manganese
Nickel
CaF2
Ti
Al, Cu, Fe
Cathode
Anode
Electrolyte
Current collectors
Cell casings
Packs
BMS
CoolingSustainable
Energy sector
Battery recycling
Battery second life
RetailProcessing Battery pack inputs
Ability exists in SA
Bottleneck in SA
Limited supply in SA
Lithium Ion Battery
Raw materials
Figure 26: LIB manufacturing value chain Source: GreenCape
ELE
CT
RIC
VE
HIC
LES
: MIR
20
2285
03
The fire risk of LiBs is quite high due to the high heat occasioned by overcharging, excessive currents, or faults in the assembly process leading to short circuits. That is why solid-state batteries could provide an additional opportunity for local use and production due to their reduced fire risk. These solid-state batteries can even be integrated into the structure of the vehicle. They do not use a liquid/pasty electrolyte but instead use solid glass, ceramic, or another solid material, reducing the explosive risks and allowing for thinner and smaller battery packs. They also typically have higher energy densities.
Be that as it may, the lead-acid battery is the current dominant player in the country’s battery market. This battery is typically used in motor vehicles as starting, lighting and ignition (SLI), and stationary backup power.
With the uptake of EVs expected to happen at a slow but steady pace due to the absence of incentives and subsidies, the lead-acid battery market is expected to continue dominating the motor vehicle market for the next three to five years. In terms of activity in the country, the organisations listed below are partners in the Technology and Human Resources for Industry Programme (THRIP) of the dti – since restructured as the dtic – that is looking at SA’s potential in the LIB manufacturing space:
• University of the Western Cape (UWC) is responsible for the lithium-ion cell manufacturing facility with the best available lithium-ion cell assembly process conditions and human resource skills, quality control protocols and processes to support the assembly of lithium-ion cells in partnership with Zellow.
• uYilo e-mobility programme is responsible for defining the lithium-ion cell testing protocol for the programme and for executing testing under international standards for lithium-ion cell testing. It is the only battery testing laboratory in Southern Africa accredited to test lithium-ion cells and batteries.
• CSIR is responsible for providing cathode material manufactured, using South African intellectual property and raw materials, to be utilised in the lithium-ion assembly process.
• Zellow Technology is responsible for developing a local lithium-ion cell manufacturing competency, driving the commercialisation of the final product by identifying customers and using cases through off-take agreements.
• Metair is responsible for providing a consumer use case for the final product and agreeing to utilise the product once all safety and quality standards have been met.
5.3. Passenger vehicle manufacturing
There is a medium- to long-term opportunity for SA to be used as a manufacturing hub for electric passenger vehicles in the export market. As discussed in Section 3, this is imperative if SA maintains its vehicle export markets and the revenues drawn from the automotive industry. Manufacturing for the domestic market is a longer-term opportunity as demand increases. SA has a very strong automotive market. It is a dominant industry in its manufacturing sector, backed by a relatively cheap labour force. The automotive industry has overtaken the mining industry in SA in terms of contribution to the GDP. The automotive sector could also support the mining sector in creating demand for Platinum Group Metals (PGM), nickel, manganese, etc. The SA government is faced with securing higher investments and increasing vehicle production volumes to stimulate the local market and remain internationally competitive.
86E
LE
CT
RIC
VE
HIC
LE
S: M
IR 2
022
This manufacturing base, combined with the significant tax incentives offered, contributes to cheaper manufacturing costs. SA’s trade agreements with the EU (which allow vehicles and parts to be exported custom-free to 28 countries) and SADC, coupled with cheaper manufacturing, position SA as a suitable manufacturing destination for companies targeting Africa, the US, and countries in the EU.
As shown in Table 11 previously, as of July 2021, there are 7 612 048 passenger vehicles in SA, representing 65% of the total self-propelled vehicles in the country. This represents the potential market for passenger vehicle electrification.
Figure 27 provides a breakdown of battery electric passenger vehicle sales by vehicle model over the last decade. This market has seen a slow growth path since Nissan entered the market in 2013, with BMW and Jaguar following in 2015 and 2018 and Mini and Porsche in 2020. There is a notable decrease in sales from 2015 onwards. This speaks to the need for a market step change towards creating an enabling environment for any significant growth to be recognised.
EVs accounted for a meagre 0.04% of vehicle sales in SA in 2019. Hybrid EV sales comprise the largest EV sales in SA, followed by PHEV and BEV.
Battery and E-waste Landfill Bans:
The national norms and standards for the disposal of waste to landfill (R.636 of 2013), as provided for by the National Environmental Management: Waste Act (Act 59 of 2008), provides directives for the disposal of waste to landfill. Included in these norms and standards is a list of waste streams that are prohibited from disposal to landfill. Of particular interest to the electric vehicles value chain are:
• As of 23 August 2013, lead acid batteries are banned from all landfills.• As of 23 August 2021 other batteries are banned from all landfills. • As of 23 August 2021 e-waste deemed hazardous will be banned from
all landfills.
The lead acid battery market has seen an increase in recycling capabilities (29 016 t) thanks largely to private sector commitments, and the national norms and standards mentioned above. However, the recycling of LIBs has been limited, with no recycling happening within South Africa. The norms and standards are key drivers for the incorporation of LIB reuse and recycling by LIB manufacturing companies looking to set up in South Africa. This will largely be driven by the promulgation of the Extended Producer Responsibility (EPR) regulations.
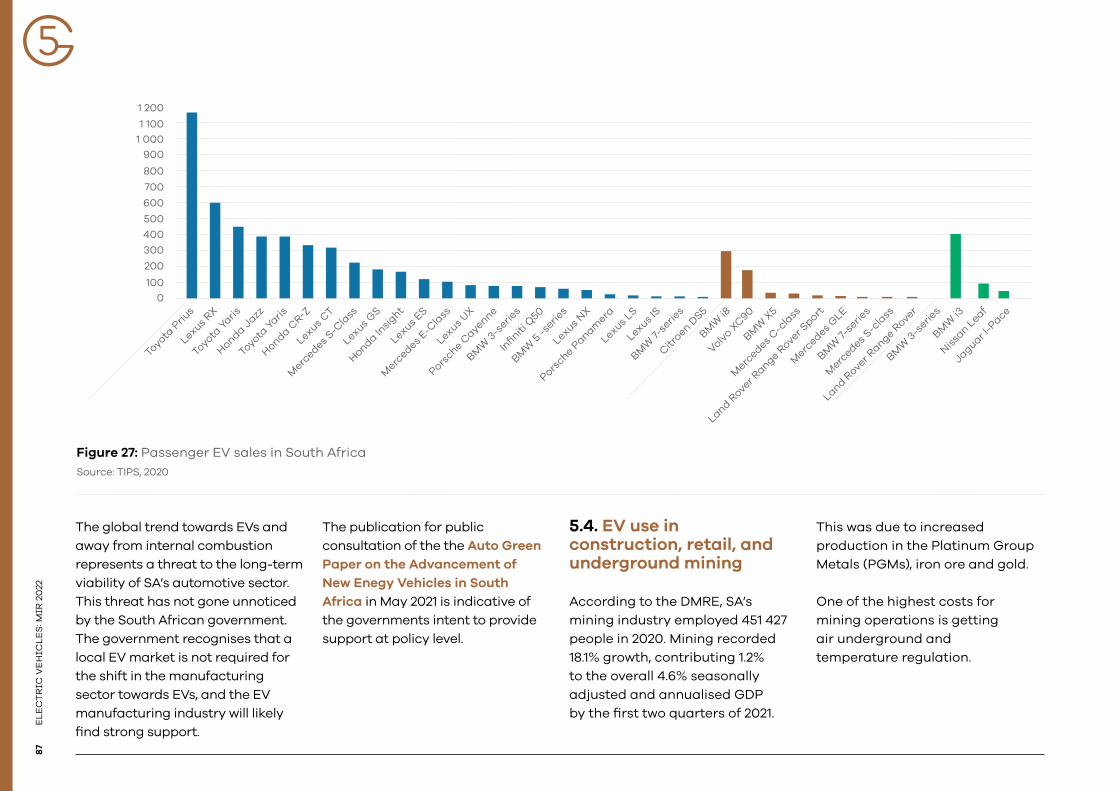
ELE
CT
RIC
VE
HIC
LES
: MIR
20
2287
03
400
500
600
700
800
900
1 000
1 100
1 200
300
200
100
0
Toyota P
rius
Lexus RX
Toyota Yaris
Honda Jazz
Toyota Yaris
Honda CR-Z
Lexus CT
Merc
edes S-C
lass
Lexus GS
Honda Insig
ht
Lexus ES
Merc
edes E-C
lass
Lexus UX
Porsche C
ayenne
BMW
3-s
eries
Infiniti
Q50
BMW
5 -s
eries
Lexus NX
Porsche P
anamera
Lexus LS
Lexus IS
BMW
7-se
ries
Citroen D
S5
BMW
i8
Volvo XC90
BMW
X5
Merc
edes C-c
lass
Land Rover R
ange Rover S
port
Merc
edes GLE
BMW
7-se
ries
Merc
edes S-c
lass
Land Rover R
ange Rover
BMW
3-s
eries
BMW
i3
Nissan L
eaf
Jaguar l-P
ace
Figure 27: Passenger EV sales in South Africa Source: TIPS, 2020
The global trend towards EVs and away from internal combustion represents a threat to the long-term viability of SA’s automotive sector. This threat has not gone unnoticed by the South African government. The government recognises that a local EV market is not required for the shift in the manufacturing sector towards EVs, and the EV manufacturing industry will likely find strong support.
The publication for public consultation of the the Auto Green Paper on the Advancement of New Enegy Vehicles in South Africa in May 2021 is indicative of the governments intent to provide support at policy level.
5.4. EV use in construction, retail, and underground mining
According to the DMRE, SA’s mining industry employed 451 427 people in 2020. Mining recorded 18.1% growth, contributing 1.2% to the overall 4.6% seasonally adjusted and annualised GDP by the first two quarters of 2021.
This was due to increased production in the Platinum Group Metals (PGMs), iron ore and gold.
One of the highest costs for mining operations is getting air underground and temperature regulation.
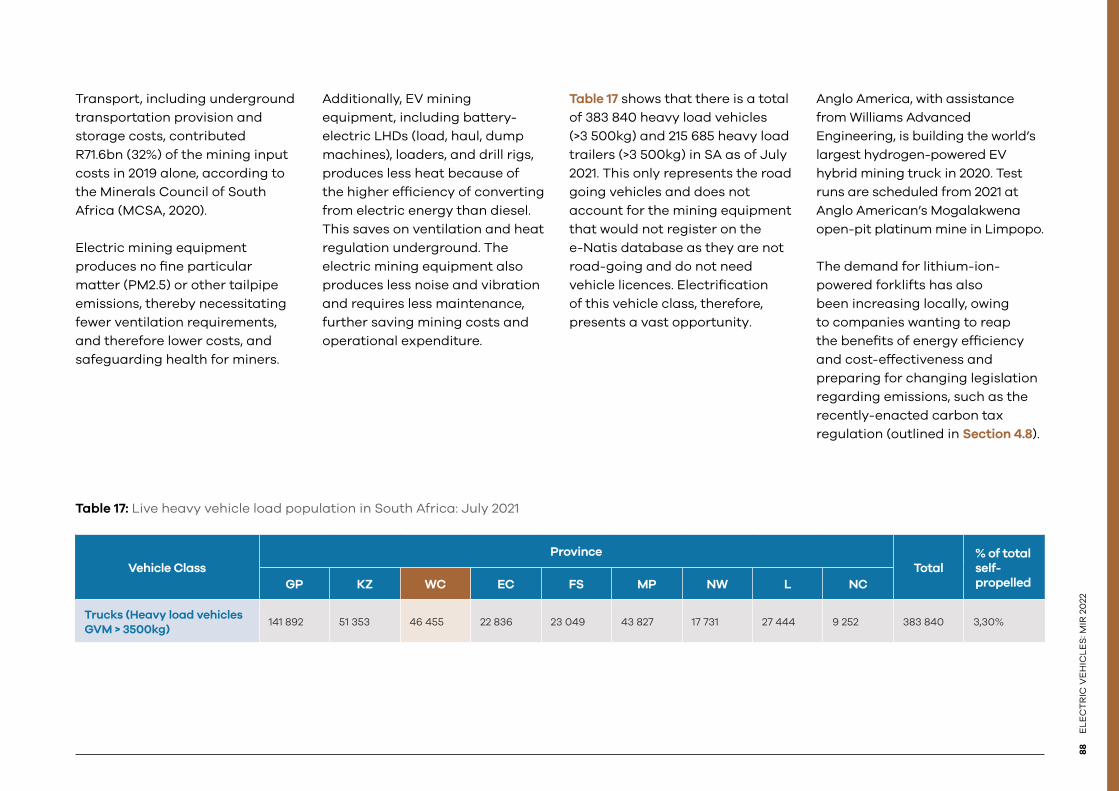
88E
LE
CT
RIC
VE
HIC
LE
S: M
IR 2
022
Transport, including underground transportation provision and storage costs, contributed R71.6bn (32%) of the mining input costs in 2019 alone, according to the Minerals Council of South Africa (MCSA, 2020).
Electric mining equipment produces no fine particular matter (PM2.5) or other tailpipe emissions, thereby necessitating fewer ventilation requirements, and therefore lower costs, and safeguarding health for miners.
Additionally, EV mining equipment, including battery-electric LHDs (load, haul, dump machines), loaders, and drill rigs, produces less heat because of the higher efficiency of converting from electric energy than diesel. This saves on ventilation and heat regulation underground. The electric mining equipment also produces less noise and vibration and requires less maintenance, further saving mining costs and operational expenditure.
Table 17: Live heavy vehicle load population in South Africa: July 2021
Vehicle ClassProvince
Total% of total self-propelledGP KZ WC EC FS MP NW L NC
Trucks (Heavy load vehicles GVM > 3500kg)
141 892 51 353 46 455 22 836 23 049 43 827 17 731 27 444 9 252 383 840 3,30%
Table 17 shows that there is a total of 383 840 heavy load vehicles (>3 500kg) and 215 685 heavy load trailers (>3 500kg) in SA as of July 2021. This only represents the road going vehicles and does not account for the mining equipment that would not register on the e-Natis database as they are not road-going and do not need vehicle licences. Electrification of this vehicle class, therefore, presents a vast opportunity.
Anglo America, with assistance from Williams Advanced Engineering, is building the world’s largest hydrogen-powered EV hybrid mining truck in 2020. Test runs are scheduled from 2021 at Anglo American’s Mogalakwena open-pit platinum mine in Limpopo.
The demand for lithium-ion-powered forklifts has also been increasing locally, owing to companies wanting to reap the benefits of energy efficiency and cost-effectiveness and preparing for changing legislation regarding emissions, such as the recently-enacted carbon tax regulation (outlined in Section 4.8).
FUNDING AND INCENTIVES
A range of general and sector-specific funding solutions and incentives is available to investors, manufacturers, and service companies in the green economy.
It covers Development Finance Institutions (DFIs), local public and private sector financiers and investors, and a considerable range of tax incentives.
90
EL
EC
TR
IC V
EH
ICL
ES
: MIR
20
229
0E
LE
CT
RIC
VE
HIC
LE
S: M
IR 2
021
©Unsplash
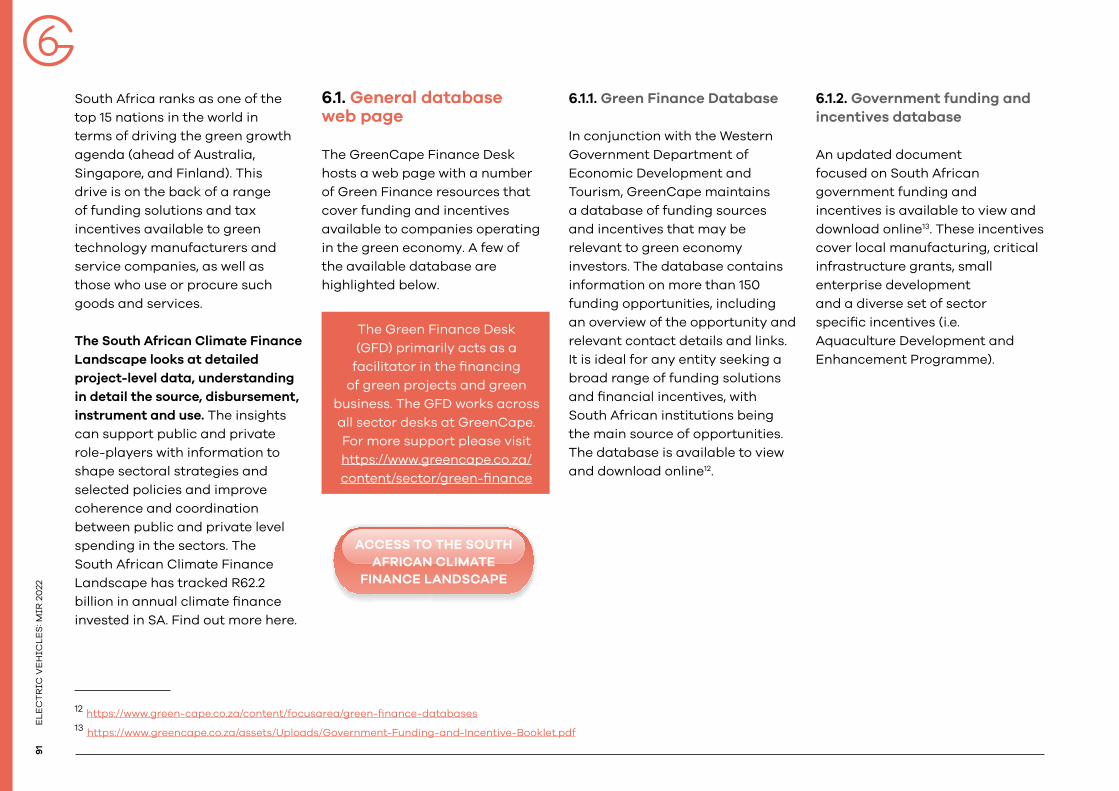
ELE
CT
RIC
VE
HIC
LES
: MIR
20
229
1
South Africa ranks as one of the top 15 nations in the world in terms of driving the green growth agenda (ahead of Australia, Singapore, and Finland). This drive is on the back of a range of funding solutions and tax incentives available to green technology manufacturers and service companies, as well as those who use or procure such goods and services.
The South African Climate Finance Landscape looks at detailed project-level data, understanding in detail the source, disbursement, instrument and use. The insights can support public and private role-players with information to shape sectoral strategies and selected policies and improve coherence and coordination between public and private level spending in the sectors. The South African Climate Finance Landscape has tracked R62.2 billion in annual climate finance invested in SA. Find out more here.
12 https://www.green-cape.co.za/content/focusarea/green-finance-databases13 https://www.greencape.co.za/assets/Uploads/Government-Funding-and-Incentive-Booklet.pdf
6.1. General database web page
The GreenCape Finance Desk hosts a web page with a number of Green Finance resources that cover funding and incentives available to companies operating in the green economy. A few of the available database are highlighted below.
6.1.1. Green Finance Database
In conjunction with the Western Government Department of Economic Development and Tourism, GreenCape maintains a database of funding sources and incentives that may be relevant to green economy investors. The database contains information on more than 150 funding opportunities, including an overview of the opportunity and relevant contact details and links. It is ideal for any entity seeking a broad range of funding solutions and financial incentives, with South African institutions being the main source of opportunities. The database is available to view and download online12.
6.1.2. Government funding and incentives database
An updated document focused on South African government funding and incentives is available to view and download online13. These incentives cover local manufacturing, critical infrastructure grants, small enterprise development and a diverse set of sector specific incentives (i.e. Aquaculture Development and Enhancement Programme).
The Green Finance Desk (GFD) primarily acts as a
facilitator in the financing of green projects and green
business. The GFD works across all sector desks at GreenCape. For more support please visit https://www.greencape.co.za/content/sector/green-finance
ACCESS TO THE SOUTH AFRICAN CLIMATE
FINANCE LANDSCAPE

92
EL
EC
TR
IC V
EH
ICL
ES
: MIR
20
22
6.1.3. Finfind database
Finfind14 is an innovative online finance solution that brings together SMME finance providers and finance seekers. With a focus on finance readiness, Finfind has more than 200 lenders and over 350 loan products available to SMEs. The database is ideal for South African SMMEs who are seeking funding and/or business advisory services, and those who want to improve their understanding of finance.
Wesgro has partnered with Finfind to assist local companies seeking finance for their business. See more here: https://wesgro.finfind.co.za/quiz/disclaimer/wesgro
14 https://www.finfindeasy.co.za/ 15 https://alliedcrowds.com/
6.1.4. AlliedCrowds database
AlliedCrowds15 is the first complete aggregator and directory of alternative finance providers inthe developing world. Sign-up is free and allows users to access a global database where one can filter for sector (including greentech, agriculture and social impact), type of capital (equity, lending, grant), and type of funding (crowdfunding, angel investing, venture capital, impact investing). In addition:
• Themed databases around the Sustainable Development Goals (SDGs) and the World Green Economy Organisation (WGEO) are available.
• Reports, including a number specifically about African funding sources, can also be downloaded for free.
• Businesses / organisations can also contact Allied Crowds to create a customised funding database. This resource is ideal for any entity seeking a broad range of financial solutions on a global scale.
Click the buttons below to access the relevant content
ALLIED CROWDS WEBSITE
FINFIND WEBSITE
GOVERNMENT FUNDING AND INCENTIVE BOOKLET
GREEN FINANCE DATABASE
GREENCAPE’S GREEN FINANCE WEB-PAGE
Rising electricity prices, national energy insecurity, dropping technology costs, supportive energy policies, and incentives are prompting consumers to explore
alternative energy options driving the growth of the Energy Services (ES) market in South Africa, and creating a thriving value chain.
SECTOROVERVIEW
The Western Cape is a world-class investment destination.
THE WESTERN CAPE: AFRICA’S GROWING GREENTECH HUB
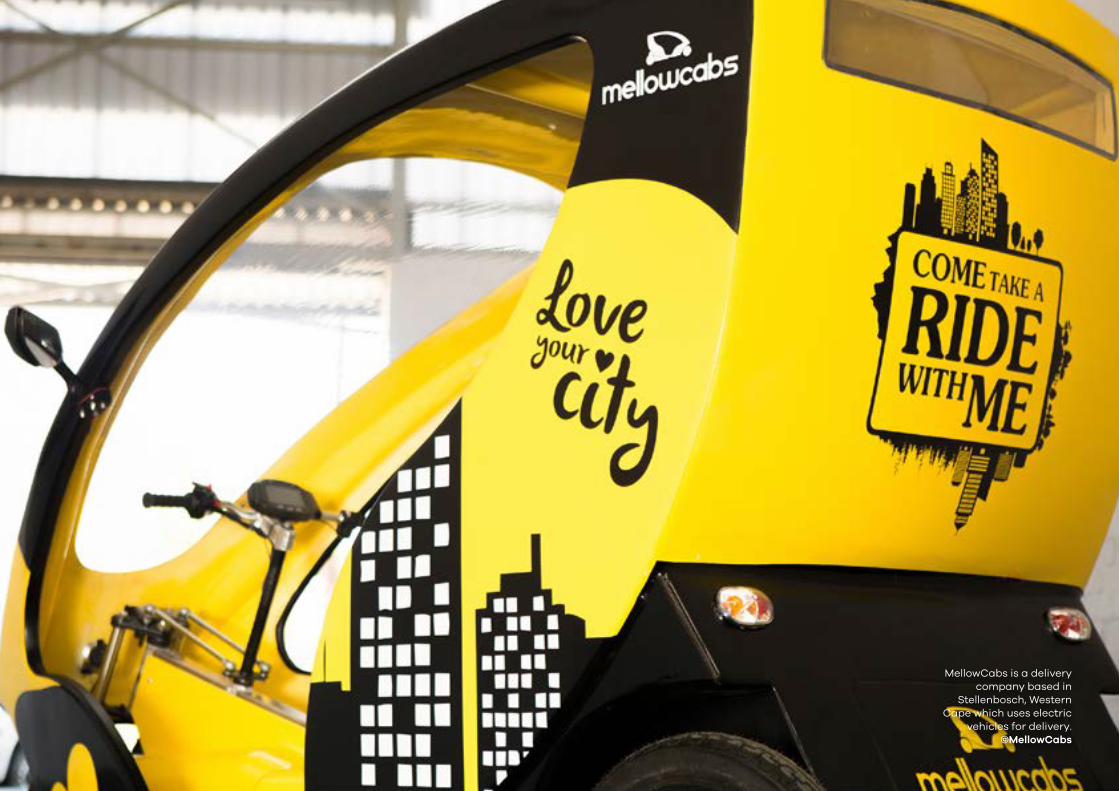
MellowCabs is a delivery company based in
Stellenbosch, Western Cape which uses electric
vehicles for delivery.©MellowCabs

ELE
CT
RIC
VE
HIC
LES
: MIR
20
229
5
The province provides businesses and investors with prime locations, modern infrastructure, a skilled workforce, low operational costs and an abundance of natural resources. It is also a sought-after place to live, with unrivalled natural beauty, vibrant culture, excellent schools and universities, and an outstanding quality of life.
In 2017, Cape Town was ranked among the top 21 global investment destinations by Foreign Direct Investment (fDi) Intelligence, a division of the Financial Times.
A great place for green business
There are compelling reasons why the Western Cape Province is viewed by many as Africa’s green economy hub. Coupled with a strong and rapidly growing market for green technology and services in South Africa and beyond, the Western Cape offers:
• Africa’s renewable energy and cleantech hub, with a critical mass of leading companies present.
• Local presence of major professional services and financiers.
• Significant market opportunities for businesses and investors in agriculture, energy services, utility scale solar and wind, waste, water, bioeconomy and resource efficiency.
• A supportive government that has made ease of doing business and the green economy key priorities.
• Five universities with comprehensive R&D capabilities and dedicated green economy skills programmes.
• A range of investment incentives in the Atlantis Special Economic Zone (SEZ) for Green Technologies.
Supporting businesses and investors
The province also offers dedicated support for businesses and investors focusing on greentech and services, including:
Western Cape Department of Economic Development & Tourism: Driving the green economy policy landscape in the Province.InvestSA One Stop Shop: Offers convenient investor support on permits, licensing and registrations - all under one roof.
City of Cape Town Enterprise and Investment: Creates an enabling environment to attract investment that generates economic growth and job creation in Cape TownGreenCape: Provides dedicated support and market intelligence to green economy sectors.Wesgro: The official investment and trade promotion agency for the Western Cape.SAREBI: A business incubator providing nonfinancial support to green entrepreneurs.SARETEC: Offers specialised industry-related and accredited training for the wind and solar industries.
Market opportunities in the province and South Africa
Some of the major market opportunity areas in the province and South Africa in the next fiveyears are outlined in the graphic on the next page (see individual MIRs and the GreenCapewebsite for more information).
R&D capabilities and skills
The region’s five universities – University of Cape Town, Stellenbosch University, University of the Western Cape, the Cape Peninsula University of Technology and the George campus of the Nelson Mandela Metropolitan University – underpin all of this with comprehensive research and development (R&D) capabilities and dedicated green economy skills programmes.

96
EL
EC
TR
IC V
EH
ICL
ES
: MIR
20
22
ATLANTIS SPECIAL ECONOMIC ZONE FOR GREEN TECHNOLOGIES
The Atlantis SEZ is a zone dedicated to the manufacturing and provision of services in the green technology space - technologies that reduce or reverse the impact of people on the planet. Wind turbines, solar panels, insulation, biofuels, electric vehicles, materials recycling and green building materials are all examples of green technologies that will be welcomed to the zone.
The zone welcomes manufacturers, service providers, suppliers and other players in the value chains of different green technologies. The SEZ is situated in the Atlantis industrial area north of Cape Town, south of Wesfleur, east of Dassenberg Road, and west of the Witsand community.
Why invest in the Atlantis SEZ?
There are strong and growing South African and African markets for greentech. The South African greentech manufacturing market is worth at least R30bn; with a growing greentech market in the neighbouring countries. South Africa has opportunities in energy, waste, agriculture, transport and other sectors and is a great entry point for the whole of Africa, in particular the SADC region.
Atlantis is a great location and development ready. 94 hectares of zoned development-ready land is available for leasing to investors. Bulk infrastructure is in place and Atlantis has new public transport and shipping links, whilst boasting fibre connectivity too. Atlantis is also close to major ports, roads, universities and greentech markets.
Investors have access to extensive investment support through the One Stop Shop for investor support and the rest of the investor support ecosystem, which includes InvestSA, GreenCape, the City of Cape Town, and Wesgro. Together the ecosystem provides information and advocacy; market intelligence; facilitated access to permits and licenses, planning and development approval; and skills training.
Investors and tenants are accessing attractive incentives in the form of tax relief and allowances, employment tax incentives, fast-tracked development approvals, fee exemptions and subsidies.
There is an attractive, wide-ranging skills base to recruit from with 5 universities and many more colleges in the province, and a large range of unskilled, semi-skilled, technical andprofessional candidates.
FOR MORE INFO, CLICK TO EMAIL THE ATLANTIS SEZ
BUSINESS DEVELOPMENT EXECUTIVE
CLICK TO VIEW THE ATLANTIS SEZ WEBSITE
Rising electricity prices, national energy insecurity, dropping technology costs, supportive energy policies, and incentives are prompting consumers to explore
alternative energy options driving the growth of the Energy Services (ES) market in South Africa, and creating a thriving value chain.
SECTOROVERVIEW
GreenCape is a non-profit organisation that works at the interface of business, government and academia to identify and remove barriers
to economically viable green economy infrastructure solutions. Our vision is a thriving prosperous Africa, mobilised by the green economy
GREENCAPE’S SUPPORT TO BUSINESSES AND INVESTORS

98
EN
ER
GY
SE
RV
ICE
S: M
IR 2
021
©Unsplash

ELE
CT
RIC
VE
HIC
LES
: MIR
20
229
9 ©Unsplash

100
EL
EC
TR
IC V
EH
ICL
ES
: MIR
20
22
GreenCape is a non-profit organisation that works at the interface of business, government and academia to identify and remove barriers to economically viable green economy infrastructure solutions. Our vision is a thriving prosperous Africa, mobilised by the green economy
Working in developing countries, GreenCape catalyses the replication and large-scale uptake of green economy solutions to enable each country and its citizens to prosper. We work with businesses, investors, academia and government to help unlock the investment and employment potential of greentech and services, and to support a transition to a resilient green economy.
We assist businesses by removing barriers to their establishment and growth and provide our members with:
• free, credible and impartial market information and insights
• access to networks of key players in government, industry, finance and academia
• an advocacy platform to help create an enabling policy and regulatory environment for green business
We assist local, provincial and national government to build a resilient green economy by providing:
• support on the development of standards, regulations, tools and policies
• expert technical knowledge on key sectors in the green economy
• access to networks of key players across business, academia, and internationally
Since inception in 2010, GreenCape has grown to a multi-disciplinary team of over 40 staff members, representing backgrounds in finance, engineering, environmental science and economics.
Our market intelligence reports form part of a working body of information generated by sector desks and projects within GreenCape’s three main programmes – energy, circular economy and resources.
Benefits of becoming a GreenCape member
We currently have over 2 500 members, and offer free membership. Becoming a member of GreenCape will give you access to the latest information regarding developments in the various sectors; access to tools, reports, and project information; and offer you the opportunity – through our networking events – to meet and interact with various stakeholdersin the green economy.
CLICK HERE TO BECOME
A GREENCAPE MEMBER
We have facilitated and supported ~R42bn of investments in renewable energy projects and manufacturing. From these investments, more than 19 000 jobs have been created. Through our WISP (industrial symbiosis) programme, by connecting businesses with waste / under-used resources:
435 000 fossil GHG emissions saved (equivalent to the electrical usage of
117 840 households in SA);
Over R150 million in financial benefits (additional revenue, cost savings and
private investments);
398 economy wide jobs.

REFERENCES

©Unsplash

ELE
CT
RIC
VE
HIC
LES
: MIR
20
2210
3
AASA 2020. Road Accident Fund. Available from <https://www.aa.co.za/fuel-pricing>. [Accessed November 2020].
Autotrader 2020. Electric Vehicle buyers survey. Available: https://reports.autotrader.co.za/industry/2020-EV-buyers-survey/. [Accessed November 2020].
Barnes, Black, Anthony and Justine, 2017. Developing a South African Automotive Masterplan to 2035 in the context of Global Value Chain drivers: Lessons for second-tier automotive economies. Paper prepared for the GERPISA Colloquium, 14 to 16 June 2017, Paris, France.
Benchmark Mineral Intelligence 2020. Price reporting agency & Market intelligence for lithium-ion battery, electric vehicle & energy storage supply chains. Available: https://www.benchmarkminerals.com/. [Accessed November 2020].
Bloomberg New Energy Finance (BNEF). 2018. Cumulative Global EV sales hit 4 million. Available from: < https://about.bnef.com/blog/cumulative-global-ev-sales-hit-4-million/> [Accessed 29 January 2019].
Businesstech 2017. How fuel prices have changed in South Africa over the past 10 years. Available from: < https://businesstech.co.za/news/energy/176603/how-fuel-prices-have-changed-in-south-africa-over-the-past-10-years/> [Accessed 11 February 2019].
BusinessWire 2018. Electric Vehicle Market by Type, and Vehicle Type – Global Opportunity Analysis and Industry Forecast, 2018-2025. Available from <https://www.businesswire.com/news/home/20180827005257/en/Global-Electric-Vehicle-Market-2018-2025-567.3-Billion> [Accessed 11 February 2019].
C40 Cities 2018. How the FSCI is Helping Cities Rethink Bus Procurement. Available: https://www.c40.org/blog_posts/how-the-fsci-is-helping-cities-rethink-bus-procurement. [Accessed November 2020].
CSIR 2015. Cape Town: State of Energy Report. p11-95.
Cision PR Newswire. 2019 Study of the South African Motor Vehicle Industry – Size and State of the Industry, Key Influencing Factors, Competitive Analysis and Outlook. 27 December 2019. Available from <https://www.prnewswire.com/news-releases/2019-study-of-the-south-african-motor-vehicle-industry---size-and-state-of-the-industry-key-influencing-factors-competitive-analysis-and-outlook-300979519.html> [Accessed February 2020]
Cunliffe, G; et. al. 2018. Brown to Green. Available: https://www.climate-transparency.org/g20-climate-performance/g20report2018#1531904263713-04b62b8d-e708. [Accessed November 2020].
Department of Mineral Resources and Energy (DMRE) 2017. Overview of the Petrol and Diesel Market in South Africa between 2007 and 2016. Pretoria, South African Government.
Department of Environmental Affairs (DEA) 2018. South Africa State of Waste. A report on the state of the environment. First draft report. Pretoria, South African Government.
Department of Trade and Industry (dti). Industrial Procurement 2011. Available from: < http://www.dti.gov.za/industrial_development/ip.jsp> [Accessed November 2018].
Department of Trade, Industry and Competition (dtic). 2019. Technology and Human Resources for Industry Programme (THRIP). Available from: <https://nationalgovernment.co.za/units/view/46/department-of-trade-industry-and-competition-the-dtic>
Department of Transport (DoT) 2018. Green Transport Strategy for South Africa: (2018-2050). Available from: <http://www.transport.gov.za/documents/11623/89294/Green_Transport_Strategy_2018_2050_onlineversion.pdf/71e19f1d-259e-4c55-9b27-30db418f105a> Pretoria, South African Government.

104
EL
EC
TR
IC V
EH
ICL
ES
: MIR
20
22
eNaTIS 2020. Live vehicle population as per the National Traffic Information System. Available: http://www.enatis.com/. [Accessed November 2020].
European Commission 2020. A European Green Deal. Available: https://ec.europa.eu/info/strategy/priorities-2019-2024/european-green-deal_en. [Accessed November 2020].
IEA 2019. Global EV Outlook 2019. 20 May. Scaling up the transition to electric mobility. Available from: <https://www.iea.org/reports/global-ev-outlook-2019> [Accessed November 2019].
IEA 2020. Data and statistics. Available: https://www.iea.org/data-and-statistics?country= SOUTHAFRIC&fuel=Energy%20 consumption&indicator=TFCShare BySector. [Accessed November 2021].
IEA 2021. Global EV Outlook 2021. Available: https://www.iea.org/reports/global-ev-outlook-2021 [Accessed November 2021].
IMF 2021. Electric Vehicles, Tax incentives and Emissions: Evidence from Norway. Available: https://www.imf.org/-/media/Files/Publications/WP/2021/English/wpiea2021162-print-pdf.ashx [Accessed November 2021].
InsideEVs 2020. Global Plug-In Electric Car Sales August 2020: Close To 241,000. Available: https://insideevs.com/news/446657/global-plugin-electric-car-sales-august-2020/. [Accessed November 2020].
Lamprecht, Norman 2018. Automotive Export Manual 2017. Available from: <http://www.aiec.co.za/Reports/AutomotiveExport Manual.pdf> [Accessed 20 January 2019].
Labuschagne, H., 2021. How much it costs to import a Tesla to South Africa. [online] Mybroadband.co.za. Available at: <https://mybroadband.co.za/news/motoring/388258-how-much-it-costs-to-import-a-tesla-to-south-africa.html> [Accessed 6 March 2021].
Mineral Council of South Africa (2019). Fact and Figures 2019. Pretoria: MCSA. p4-43.
National Association of Automobile Manufacturers of South Africa (2020). Auto Dashboard. Available: https://NAAMSA.net/. [Accessed November 2020].
National Household Travel Survey (NHTS) 2020. Statistics South Africa. Available from http://www.statssa.gov.za/publications/P0320/P03202020.pdf. [Accessed 7 October 2021].
National Treasury 2012. Invitation and Evaluation of Bids Based on a Stipulated Minimum Threshold for Local Production and Content for the Bus Sector. Available from: < http://ocpo.treasury.gov.za/Resource_Centre/Legislation/INote%20on%20a%20stipulated%20minimum%20threshold%20for%20the%20bus%20sector.pdf> Pretoria, South African Government. [Accessed 7 October 2021].
National Treasury. 2019 Budget Report. Available from <http://www.treasury.gov.za/documents/national%20budget/2019/review/Chapter%204.pdf>
PlugShare 2021. Available from: <https://www.plugshare.com/> [Accessed 7 October 2021].
Preferential Procurement Policy Framework Act 5 of 2000. Preferential Procurement Regulations, 2017.
Randall, Tom 2016. Here’s How Electric Cars Will Cause the Next Oil Crisis. Bloomberg New Energy Finance, 25 February. Available from: < https://www.bloomberg.com/features/2016-ev-oil-crisis/> [Accessed November 2018].
Road Accident Fund 2020. Fuel Levy. Available: www.raf.co.za. [Accessed November 2020].
Rodrigue, JP 2017. The Environmental Impacts of Transportation. Available from: < https://transportgeography.org/?page_id=5711> [Accessed March 2019].
ELE
CT
RIC
VE
HIC
LES
: MIR
20
2210
5
Santander Trade Portal 2019. South Africa: Reaching the consumer. Available from: < https://en.portal.santandertrade.com/analyse-markets/south-africa/reaching-the-consumers> [Accessed November 2018].
SARS 2021. Carbon Tax. Available: https://www.sars.gov.za/ClientSegments/Customs-Excise/Excise/Environmental-Levy-Products/Pages/Carbon-Tax.aspx. [Accessed November 2021].
Statistica 2020. Electric Mobility: Norway Races Ahead. Available: https://www.statista.com/chart/17344/electric-vehicle-share/. [Accessed November 2020].
Statistica 2020. Global plug-in electric vehicle market share in the first half of 2021, by main producer. Available: https://www.statista.com/statistics/541390/global-sales-of-plug-in-electric-vehicle-manufacturers/. [Accessed November 2021].
TIPS. 2020. Harnessing electric vehicles for industrial development in South Africa. Available: https://www.tips.org.za/research-archive/sustainable-growth/green-economy/item/3876-harnessing-electric-vehicles-for-industrial-development-in-south-africa. [Accessed November 2020].
UNCC. 2020. The Paris Agreement. Available: https://unfccc.int/process-and-meetings/the-paris-agreement/the-paris-agreement. [Accessed November 2020].
UNIDO Low Carbon Transport Project in South Africa (LCT-SA). Unity in Sustainable Mobility: Roadmap towards building a unified electromobility industry in South Africa. Available from: < http://www.evia.org.za/EVIA2016Booklet.pdf > [Accessed January 2019].
USGS 2020. Mineral Commodity Summaries 2020. Available: https://pubs.usgs.gov/periodicals/mcs2020/mcs2020.pdf. [Accessed November 2020].
U.S. Trade. 2021. South Africa – Country Commercial Guide – Automotive. Available: https://www.trade.gov/country-commercial-guides/south-africa-automotive. [Accessed November 2021].
uYilo E-mobility Programme 2017. Sustainable Transport and Mobility for Cities Workshop -eThekwini Municipality. Available from: < https://www.sanedi.org.za/Cleaner%20Mobility/images/Presentations/uYilo_UNIDO_Sustainable_Tra nsport_and_Mobility_for_Cities_workshop_HitenParmar_320170330.pdf> [Accessed 6 February 2019].
Venter, I., 2021. Volvo to launch its first electric car in South Africa. [online] Engineering News. Available at: <https://www.engineeringnews.co.za/article/volvo-to-launch-its-first-electric-car-in-south-africa-2021-03-09/rep_id:4136> [Accessed 9 March 2021].

The writing of this MIR was made possible with the generous support of the
Western Cape Government’s Department of Economic Development and Tourism.
Copyright © 2022 FDOKUMEN