Benefits and costs of electric vehicles for the public finances: integrated valuation model and...
20
ATEC ITS Conference France 2012: Smart mobility: from research to practice ATEC Conference 2012. Versailles, 1-2 February 2012. Workshop A1: Electromobility 1/20 Benefits and costs of electric vehicles for the public finances: integrated valuation model and application to France Fabien Leurent ( 1 ), Elisabeth Windisch Paris-East University, City, Transport and Mobility Laboratory, Ecole des Ponts ParisTech Abstract The development of electro-mobility, with electric motors replacing the internal combustion engine, raises issues relating to the environment, energy and industry. Within a given country, it would have an economic and social impact in many areas, in particular on governments. Our objective is to quantify the respective impacts on the public finances of an electrically powered or petrol fuelled private car. In order to do this, we establish an integrated method of valuation, covering both manufacture and use of the vehicle, which locates these stages within or outside the country concerned. From a “depth” perspective, it incorporates the economic proceeds from the different activities and what they consume, and from a “breadth” perspective it incorporates the fiscal effects (VAT, fuel and energy taxes, tax on production, etc.) and the social effects (social contributions, unemployment benefits). The valuation method is based on an input-output model of the productive economy within a country, combined with mechanisms of fiscal and social transfer. We postulate the existence of an activity for the Manufacture of electric vehicles, and we include this within the consumption matrix associated with production. We apply this method to France, and to a diverse range of scenarios regarding the place in which the vehicle is manufactured and used. From this assessment it emerges that the impact of a vehicle on the public finances is substantial: manufacture contributes approximately the purchase price excluding VAT, and usage adds an amount of the same order of magnitude. The vast majority of the revenues arise from the social contributions associated with production (approximately 70%); VAT accounts for almost 20%, tax on production around 5%, and energy surcharge 9% for an internal combustion vehicle or 1% for an electric vehicle. If it is both manufactured and used inside the country, then an electric vehicle might contribute very slightly more to the public finances than an internal combustion vehicle, before any purchase incentive bonus, which would markedly reverse the outcome. The worst scenario would be the use of an imported electric vehicle instead of a domestically manufactured internal combustion vehicle. At the other end of the scale, as an export product, an electric vehicle contributes substantially more to the public purse than an internal combustion vehicle. Key words Input-output model. Taxation. Social transfers. Life-cycle analysis. 1 Contact author: [email protected] . Ecole des Ponts ParisTech, Laboratoire Ville Mobilité Transport, 6-8 avenue Blaise Pascal, Champs sur Marne 77455 Marne la Vallée Cedex hal-00680987, version 1 - 20 Mar 2012 Author manuscript, published in "ATEC, Versailles : France (2012)"
-
Upload
univ-paris12 -
Category
Documents
-
view
1 -
download
0
Transcript of Benefits and costs of electric vehicles for the public finances: integrated valuation model and...

ATEC ITS Conference France 2012: Smart mobility: from research to practice
ATEC Conference 2012. Versailles, 1-2 February 2012. Workshop A1: Electromobility 1/20
Benefits and costs of electric vehicles for the public
finances: integrated valuation model and application
to France
Fabien Leurent (1), Elisabeth Windisch
Paris-East University, City, Transport and Mobility Laboratory, Ecole des Ponts ParisTech
Abstract
The development of electro-mobility, with electric motors replacing the internal combustion
engine, raises issues relating to the environment, energy and industry. Within a given country,
it would have an economic and social impact in many areas, in particular on governments.
Our objective is to quantify the respective impacts on the public finances of an electrically
powered or petrol fuelled private car.
In order to do this, we establish an integrated method of valuation, covering both manufacture
and use of the vehicle, which locates these stages within or outside the country concerned.
From a “depth” perspective, it incorporates the economic proceeds from the different
activities and what they consume, and from a “breadth” perspective it incorporates the fiscal
effects (VAT, fuel and energy taxes, tax on production, etc.) and the social effects (social
contributions, unemployment benefits). The valuation method is based on an input-output
model of the productive economy within a country, combined with mechanisms of fiscal and
social transfer. We postulate the existence of an activity for the Manufacture of electric
vehicles, and we include this within the consumption matrix associated with production.
We apply this method to France, and to a diverse range of scenarios regarding the place in
which the vehicle is manufactured and used. From this assessment it emerges that the impact
of a vehicle on the public finances is substantial: manufacture contributes approximately the
purchase price excluding VAT, and usage adds an amount of the same order of magnitude.
The vast majority of the revenues arise from the social contributions associated with
production (approximately 70%); VAT accounts for almost 20%, tax on production around
5%, and energy surcharge 9% for an internal combustion vehicle or 1% for an electric vehicle.
If it is both manufactured and used inside the country, then an electric vehicle might
contribute very slightly more to the public finances than an internal combustion vehicle,
before any purchase incentive bonus, which would markedly reverse the outcome. The worst
scenario would be the use of an imported electric vehicle instead of a domestically
manufactured internal combustion vehicle. At the other end of the scale, as an export product,
an electric vehicle contributes substantially more to the public purse than an internal
combustion vehicle.
Key words
Input-output model. Taxation. Social transfers. Life-cycle analysis.
1 Contact author: [email protected]. Ecole des Ponts ParisTech, Laboratoire Ville Mobilité Transport, 6-8
avenue Blaise Pascal, Champs sur Marne 77455 Marne la Vallée Cedex
hal-0
0680
987,
ver
sion
1 -
20 M
ar 2
012
Author manuscript, published in "ATEC, Versailles : France (2012)"

Costs and Benefits of the Electric Car ATEC Conference, 1-2 February 2012. Versailles
Leurent, Windisch, Paris East University, LVMT 2/20
1. Introduction
1.1 Background
Plans for the industrial development and distribution of electric vehicles (EV) have recently
come to the forefront of transport policies both in developed countries(2) and in fast
developing countries (China, India). The reason for this is the reduced environmental impact
of such vehicles compared with internal combustion engine vehicles (ICV): at global level,
fewer greenhouse gas emissions if the electricity comes from low carbon sources, and at local
level reductions in traffic pollution and noise for improved quality of life. In a recent
international journal (Leurent and Windisch, 2011), we showed that national policies to
promote the use of electric vehicles are uniform in terms of the environmental claims they
make and their scenarios for the diffusion of the electric car, entailing a three stage process:
first, mass orders for large corporate fleets, then an extension to taxi fleets and public
transport services, and finally a general spread to private households. There are some
differences between national policies depending on their specific industrial and energy
priorities, which affect the composition of the “policy package”, between policies focusing on
supply (R&D, industrial support) and those focusing on demand (subsidies for ownership and
use, rollout of a battery charging infrastructure); the procurement consortium is a hybrid
approach which aims to generate economies of scale on the supply side and reduce prices on
the demand side.
The handful of economic studies of electro-mobility have focused on costs to the user, as a
means of deciding which target target group to concentrate on.(3) As far as we know, there
has been no analysis so far of the national economic costs and benefits, although life-cycle
analyses have demonstrated a reduction in environmental impact provided that certain
electricity production conditions are met. In order to shift from the economic impact on the
user to that on the nation, the economic impacts on the other parties concerned – in particular
transport providers and central government – need to be considered. A socio-economic
assessment of the overall impact has been attempted for France (CGDD, 2011), but it did not
take into account industrial effects or social transfers.
1.2 Objective
Our objective is to evaluate the financial consequences, for the public purse, of replacing an
internal combustion vehicle (ICV) with an electric vehicle (EV). These financial
consequences are of different kinds: a specific policy to promote electric cars is only the tip of
the iceberg; we want to show the hidden part, which includes industrial, fiscal and social
factors. Industrial factors are here taken in their broad sense, referring to the various activities
involved in economic production, in particular manufacturing and energy production, both in
the construction of a vehicle and in the provision of products and services throughout its
operating life.
The industrial aspects have economic and social implications for employment, and therefore
for salaries, for social contributions by employers and employees and for workers’ incomes.
We include these social accounts, along with unemployment benefits, in the accounts of the
government that sustains them. Moreover, the value added by economic production is taxable
2 United States, Japan, Germany, France, United Kingdom, Italy, Spain, Denmark, etc.
3 Cf. BCG 2009. CGDD 2011. CE Delft 2011. Deutsche Bank 2009. Draper 2009. Deutsche Bank 2011. ESMT
2011. Nemry 2011
hal-0
0680
987,
ver
sion
1 -
20 M
ar 2
012

Costs and Benefits of the Electric Car ATEC Conference, 1-2 February 2012. Versailles
Leurent, Windisch, Paris East University, LVMT 3/20
and generates tax revenues, both on the consumption side (VAT) and on the production side
(various taxes on production). Finally, energy (in particular fuel, but also electricity) is subject
to specific taxes, similar in nature to public subsidies for electric vehicles, although the
direction of the financial transfers is the opposite.
Obviously, all these effects relate to a particular country, with its own system of production
and economic, social and fiscal arrangements at any given time, and also its own local form of
vehicle use. Slightly less obvious but equally real, in geographical terms the territory defines a
domestic authority, by contrast with the space beyond. Location is important: in principle,
local production is more favourable to domestic governments than imports; the use of the
vehicle, whether domestic or external, also needs to be spatially defined.
We provide generally applicable principles and a methodology of financial valuation, and we
apply them to the specific case of the private car in France, taking the year 2007 as our
baseline.
1.3 Method:vertical economic valuation
We evaluate the replacement of an ICV by an EV over their whole life-cycle, considering first
the manufacture and then the use of the vehicle and the associated consumption. Usage is
quantified by vehicle type (segment B) and annual mileage, which determine the
attractiveness of the EV for a buyer (Windisch, 2011). We evaluate the industrial aspects for
each type of vehicle using an input-output model for economic production in the country.
This model describes production, external trade and consumption for each type of activity.
For consumption, we make a distinction between final demand by households and public
bodies, final demand by companies for capital goods (capital and depreciation) and
intermediate consumption arising from production, specified for each production activity. We
adapt the input-output model to the composition and specific consumption requirements of an
EV. We also use the production accounts and employment statistics for each type of activity,
in order to evaluate the fiscal and social effects.
Our evaluation is therefore situated within the general framework of economic and social
activity, incorporating direct and indirect economic effects. We go beyond the conventional
context of transport economics (e.g. Quinet, 1998), which focuses exclusively on transport
service, by including the industrial and social aspects: the major effect is to refine the notion
of cost to a consumer, by identifying the part of this cost that constitutes revenue for a
supplier and is therefore not a dead loss – a pure cost element – in a wider system. Finally,
our evaluation is sensitive to space and even more so to place: the “public authority” is an
actor located within a geographical space, which determines its situation with respect to
social, economic, industrial and energy factors.
1.4 Article plan
The rest of the article is structured into three main parts and a conclusion. First, we describe
the evaluation method, setting out the principles – in particular the differentiation of
manufacture and usage – and specifying an accounting model for the different effects (section
2). Then we describe in detail our sources and assumptions, for each type of vehicle, for
metropolitan France in 2007 (section 3). We can then evaluate scenarios for the location
where manufacture and usage take place, identifying the main elements and ordering them
with respect to industrial, fiscal and social criteria (section 4).
In conclusion, we describe the scope and limitations of our method, and suggest further
avenues of research (section 5).
hal-0
0680
987,
ver
sion
1 -
20 M
ar 2
012

Costs and Benefits of the Electric Car ATEC Conference, 1-2 February 2012. Versailles
Leurent, Windisch, Paris East University, LVMT 4/20
2. Methodology: principles and valuation model
Step-by-step, we describe the calculation by vehicle and life-cycle (para 2.1), the input-output
model of economic production (para 2.2), the taxation model for the activity, for trading and
for energy (para 2.3), together with the social model (para 2.4), before going over the
valuation formulas (para 2.5).
2.1 Calculation by vehicle and by life-cycle
In order to evaluate the economic effects of a type of vehicle – EV or ICV – we calculate the
unit costs and revenues for the manufacture and then use of a car. This means that our
calculation is marginalist and does not depend on the size of the vehicle stock, nor the annual
volume of vehicle sales.
We distinguish two essential phases in the life-cycle of a car: first, the manufacturing phase,
and second use of the vehicle by the consumer during its operating lifespan – without taking
into account vehicle transfers between successive users.(4) We use an annual basis for both
manufacture and usage over the whole life-cycle: two perspectives are possible in this respect,
either that of the manufacturer, who counts the vehicles built and sold per annum, or that of
the vehicle owner, who spreads the purchase over the life-cycle of the vehicle and thinks in
terms of annual operating costs. We choose to work with the vehicle sales flow, counting all
the costs associated with manufacture in a single year and allocating all the running costs over
the lifespan of the vehicle to that year.(5) When thinking in terms of a stock of vehicles owned
and used, the above values need to be divided by the lifespan in years.
We postulate that the total cost of ownership and usage for the user is sufficiently alike
between EV and ICV for the difference to have no more than a negligible impact on the
decision to buy, on the annual mileage covered by the user and on the length of ownership
and therefore the economic lifespan of the vehicle.
In formal terms, ]:[ JjY tj
tJ
Y is the annual consumption vector associated with vehicle
type E}{C,t , for the set J of production activities j .
2.2 Input-output model of economic production
The main activities associated with production include car construction, the manufacture of
electrical equipment, metal products, textiles, the supply of car-related services and
consumables, etc. We will identify the relevant items in the next section: for methodological
purposes, we simply need to specify a set of activity types, J .
By activity type j , let jX be the value produced annually within the study area, jI the value
of imports, jE the value of exports, jK the intermediate product consumption required by
the various activities, and jY the final demand of households and public institutions (and
firms in the case of capital goods). The result for the activity over a financial year within the
geographical area is as follows:
4 In this article, we ignore the disassembly phase of a vehicle. This phase cannot be ignored in absolute terms,
but we think that with regard to the differential between EV and ICV its impact is very minimal. 5 We therefore assume a rolling system. The purchase year should be seen more as a Renewal event which, in
terms of a total fleet under ownership, is spread out in the same way as the usage phase. So there is no need to
include any kind of interest rate.
hal-0
0680
987,
ver
sion
1 -
20 M
ar 2
012

Costs and Benefits of the Electric Car ATEC Conference, 1-2 February 2012. Versailles
Leurent, Windisch, Paris East University, LVMT 5/20
jjjjj EYKXI . (1)
Intermediate consumption arises from the volumes iX of the various activities. We assume a
linear dependence, giving the following breakdown:
Ji jij KK and ijiji XaK . (2)
We call the technical coefficients matrix ],:[ Jija ji A . In matrix form, therefore, the
total for all the activities is expressed as follows:
JJJJJ EYXAXI . . (3)
Assuming that final demand and foreign trade are known, domestic production is deduced
from it as follows, where U is the identity matrix:
).()( 1JJJJ IEYAUX . (4)
Replacing an ICV with an EV entails a change from JY to CEJJJJ YYYY . From
here, we can use the accounting model to draw the consequences regarding JX , which
becomes JJJ XXX . By linearity,
JJ YAUX .)( 1 , where CEJJJ YYY . (5)
So far, this is a standard national accounting procedure. However, it is not enough to take
account of a change in production and the associated technologies. Makign electric vehicles is
a different industrial activity from making internal combustion vehicles, because both the
distribution and use of the inputs are different. To reflect this specificity, we model an
additional type of activity, with its own notation *j and specific technical coefficients both
for output from the different sectors ( *ija for each Ji ) and for input ( ija * for each Ji ).
In formal terms, J should strictly speaking be adjusted to }*{* jJJ , the vectors JV to
**JV etc. We will content ourselves with mentioning the conversion of matrix A into *A , to
use formulas (3), (4) and (5).
2.3 Fiscal model of activity, exchanges and energies
A country’s government is able to find as many taxation sources as there are types of activity
and economic processes… For our problem, we differentiate between general taxes on
consumption (VAT) written YT , taxes on production XT , import taxes IT and export taxes ET .
We assume that each tax is proportional to the nature of the activity, with a specific
coefficient. To stick with the French case, tax on production corresponds to various specific
levies, including the Cotisation Economique Territoriale (national economic contribution)
and corporation tax. We assume that it is proportional to Gross Operating Surplus (GOS,
value added minus labour costs), if this is a positive figure. In addition, we first consider GOS
proportionally to added value, and therefore ultimately to final demand. One proportionality
leading to another, for each activity we take final domestic demand jY as the tax base for tax
XjT .
In addition, we consider specific taxes on energy sources, expressed CT with index an C for
Carbon, because in France this notably includes TIPP (domestic tax on petroleum products).
hal-0
0680
987,
ver
sion
1 -
20 M
ar 2
012

Costs and Benefits of the Electric Car ATEC Conference, 1-2 February 2012. Versailles
Leurent, Windisch, Paris East University, LVMT 6/20
We link them proportionally and specifically to each activity, to final demand, including
consumption and specific energy sources.
In all, exogenous variations ),,( JJJ EIY and endogenous variations JX cause tax
revenues to vary by
JE
JI
JCXYR ETITYTTT ..).( . (6)
Finally, the tax element needs to incorporate specific policies relating to car ownership and
usage, let us say a value of depending on which base year is chosen: in particular a subsidy
for the purchase of an electric vehicle, or local exemptions from car parking fees, or the free
supply of electricity on the public highway… Then
RF . (7)
2.4 Social model
The social factors include return on investment, labour remuneration (including salaries and
social contributions), together with unemployment benefits. We incorporate social revenues
and expenditure into the national accounts, whilst retaining the possibility of isolating them if
necessary.
Let us begin by expressing the value added per activity, jV , as a function of production jX
and of the intermediate consumption that constitute an input into that production, ijK :
jjj KXV , where jJi ijJi ijj XaKK )( . (8)
In matrix form, if the unit row vector by type of activity is expressed ]:1[ JjJ u , the
product *.Au J is a row vector ]:[ JjaJi ij
. These elements are used as diagonal terms in
the square matrix *].diag[ Au J whose non-diagonal terms are zero. Let us posit
*].diag[ AuUB J to summarise the linear relationship between the added value vector and
the production vector. Formally,
JJ XBUK ).( and JJ XBV . . (9)
Then, still by activity type, we assume that the number of people employed j is
proportional to the value added, with an inverse factor of “individual productivity” j (i.e.
the average individual salary charged):
jjj V / . (10)
We then express the average wage per employee as )()( s
j
i
jj www , where )(i
jw is the net
wage and )( s
jw the employee’s and employer’s social contributions. For each activity, the
social contributions are js
jjjs
j wVw /)()(
.
The row vector of sectoral coefficients ]:/[)(
Jjw js
j , multiplied on the right by matrix B ,
gives us the vector of sectoral coefficients for social contributions:
BW ].:/[)(
Jjw js
jJ . (11)
From this, we can deduce the variation in social contributions associated with a variation in
production JX :
hal-0
0680
987,
ver
sion
1 -
20 M
ar 2
012

Costs and Benefits of the Electric Car ATEC Conference, 1-2 February 2012. Versailles
Leurent, Windisch, Paris East University, LVMT 7/20
JJS XW . . (12)
If the government pays unemployment benefit at a net rate of jz per unemployed worker in
activity j (neutralising the social security contributions paid for the unemployed person),
then the variation in social transfers associated with the variation in employment arising from
a variation in production is the sum of social security contributions plus unemployment
benefit,(6) i.e.
JJS XW . , where BW ].:/)[(
)(Jjzw jj
s
jJ . (13)
2.5 Provisional result
For the government, the balance of revenues net of expenditure for an exogenous variation
),,( JJJ EIY in final domestic demand and in foreign trade is
SRSFB . (14)
To put values on the terms, we need first to establish the different proportionality coefficients
that characterise the territory’s production system and socio-economic circuit, then deduce the
variation in production that arises from exogenous variations.
Formula (14) sums up the model. This is linear by nature, so that it can be applied to any
number of private vehicles that may be affected by the internal combustion engine being
replaced by the electric motor within a given territory.
We have limited the sequence of impacts by ignoring the effects on household demand of a
variation in income (from capital or from work), and the effects of the spatial distribution of
households (if the residential zone is outside the employment zone, then the ripple effects of
consumption occur outside). We also ignore the income tax levied on individuals, apart from
social contributions based on salary. In principle, the effects on driver consumption should be
very small, since our comparison is based on two products that are equivalent in terms of total
ownership cost. The effects on worker revenues are less clear, especially if there is a shift in
employment between the main activities concerned (cars, electrical equipment, energy).
3. Data and assumptions
As of the end of 2011, we have annual statistics up to 2010 for the production accounts for
each industrial sector in France, as well as for the number of people employed, salaries and
social contributions (Insee, 2011). We also have an economic and social chart for 38 activity
groups in base year 2009, in which car manufacturing is part of Transport Equipment
Manufacturing, along with the rail and aerospace industries. A more detailed chart,
identifying car manufacturing, is available in base 2007 and is our main source for the input-
output model.
Within this model, we have situated final demand for the manufacture (para 3.1) and use of a
car (para 3.2); in the process, we have modelled the construction of an electric car as an
activity, deduced from recent information from the carmakers Renault and Nissan. We have
kept base 2007 to evaluate the physical effects and social effects in terms of volume of
6 Because the direction of transfer for the government needs to be taken into account: the government earns
social contributions from a worker in employment, and also saves unemployment benefit, and therefore receives
the sum of the two.
hal-0
0680
987,
ver
sion
1 -
20 M
ar 2
012

Costs and Benefits of the Electric Car ATEC Conference, 1-2 February 2012. Versailles
Leurent, Windisch, Paris East University, LVMT 8/20
activity, but have as far as possible used 2011 values for the shift from volumes to values
(para 3.3).
3.1 Composition of a car
The French new car market continues to be primarily supplied by carmakers of French origin,
but vehicles imported by those carmakers and their foreign competitors account for more than
40% of the market (CCFA, 2011). In the 2007 national accounts, French production in “Car
Manufacturing” was €67 billion, imports €38 billion and exports €47 billion, all exclusive of
tax. The breakdown of domestic demand was 60% for households and public institutions, and
40% for businesses. Final household demand reflects the number of private cars sold and the
average unit price recorded in recent years (approximately 2.3 million cars per year and
€16.000 per car excluding VAT).
By relating intermediate consumption in the activity of “Car Manufacturing” to its production
value, we obtained the technical coefficients for this activity, which reflect the typical
composition of an ICV – though admittedly the large majority of the components are
produced domestically.(7) The main items are shown in Table 1 and covered below:
- Automobile construction, probably the engine: 30%.
- Metallurgy and metal processing: 12%.
- Automotive equipment manufacture: 9%.
- Chemicals, rubber, plastics: 7%.
- Financial, real estate and rental activities: 7%.
- Machinery: 5%.
- Business services, including research and development: 6%.
- Electrical and electronic equipment and components: 4%.
- Other intermediate consumption: 10%.
- Value added: only 10%.
This breakdown relates to intermediate consumption ]:[ Jiaij in activity j – “Automobile
Construction” – and to its added value.
On the output side of this activity, intermediate consumption jiK is low compared with
production iX in activities i , because a car is a finished product which companies acquire as
capital goods, not for their own production processes.
Let us move onto the modelling of an EV. We treat the vehicle body and the battery as
separate entities. Our assumptions about vehicle composition are set out in Table 1: we have
assigned hypothetical values per car, deduced from those of the ICV for most fittings, but
reduced by €1000 excluding tax for self-provision (electric motor easier to build). For the
battery, we have counted €10.000 excluding tax under “Electrical and electronic equipment
and components”.(8) Finally, having assumed the same added value for an EV as for an ICV,
we obtained a total production cost per EV (before tax), to which we applied the cost of each
material supplied in order to obtain the technical coefficient of that material for column *j of
activity “EV Construction”, in technical coefficient matrix *A . In addition, this activity row
7 Which is increasingly less the case of France, although the foreign trade balances for the activities concerned
are fairly equal. 8 Our decision to allocate the manufacture of the battery to this activity, rather than to vehicle construction, is a
deliberate one intended to take better account of probable intermediate consumption. A sensitivity test suggests
that the impact of this decision on the scenario evaluation is minimal.
hal-0
0680
987,
ver
sion
1 -
20 M
ar 2
012

Costs and Benefits of the Electric Car ATEC Conference, 1-2 February 2012. Versailles
Leurent, Windisch, Paris East University, LVMT 9/20
in the matrix was specified as zero apart from the diagonal self-provision term (engines,
chassis).
Table 1: Production aspects of vehicle manufacture.
3.2 Use of a car
The standard running of a car entails the consumption of goods and services: in principle, this
consumption can be tackled simply in an input-output model, on a final demand basis. We
specify this for an electric or internal combustion vehicle, for a technical and economic
lifespan of 10 years with annual mileage of 15,000 km. It should be recalled that the average
age of a vehicle in France’s automobile stock has increased from 7 to more than 8 years, and
annual mileage, which rose in the 1990s, fell from 14,000 km in 2000 to 13,000 km in 2007
(CCFA, 2011). The parameters chosen describe conditions favourable to electric vehicles, i.e.
sufficient daily travel to amortize the cost of the battery, but not too much to exceed battery
range: we assume 15,000 km a year for 200 or 220 working days with a commuting distance
of 30 or 40 km. Over 10 years, 150,000 km is compatible with 1000 recharge cycles for a
battery with a range of 160 km, which meets the targets stated by the carmakers (CAS, 2011).
Let us reiterate our accounting convention laid out in section 2.1: we count each year in terms
of vehicles sold, so for this year we need to count the use of the vehicle over its entire life
cycle. In all, usage cost exceeds acquisition cost by a factor of around 1.4 for an ICV
(excluding road toll or parking costs).
Internal combustion vehicle Electric vehicle Activity € HT % € HT %
Electric Vehicle Construction 0 0.0% 3350 14.2% Farming, Agri-food Industry 9 0.1% 9 0.0% Consumer Goods 433 3.0% 433 1.8% Manufacture of IC Vehicle 4350 29.8% 0 0.0% Automotive Equipment 1341 9.2% 1341 5.7% Ship, Aircraft Rail Construction 8 0.1% 8 0.0% Machinery 770 5.3% 770 3.3% Electrical and Electronic Equipment 321 2.2% 10321 43.7% Mineral Products 170 1.2% 170 0.7% Textiles 174 1.2% 174 0.7% Wood and paper 42 0.3% 42 0.2% Chemicals, Rubber, Plastics 1084 7.4% 1084 4.6% Metals and Metalworking 1742 11.9% 1742 7.4% Electrical and Electronic Components 271 1.9% 271 1.1% Fuels 84 0.6% 84 0.4% Water, Gas, Electricity 87 0.6% 87 0.4% Construction 18 0.1% 18 0.1% Car Dealing and Repair 9 0.1% 9 0.0% Wholesale and Intermediate Trade 99 0.7% 99 0.4% Transport 50 0.3% 50 0.2% Financial, Real Estate, Rental Activities 1105 7.6% 1105 4.7% Services to Companies 823 5.6% 823 3.5% Services to Individuals 34 0.2% 34 0.1% Education, Health, Social Care 92 0.6% 92 0.4% Administration 2 0.0% 2 0.0% ADDED VALUE 1481 10.1% 1481 6.3% TOTAL 14600 100.0% 23600 100.0%
hal-0
0680
987,
ver
sion
1 -
20 M
ar 2
012
Costs and Benefits of the Electric Car ATEC Conference, 1-2 February 2012. Versailles
Leurent, Windisch, Paris East University, LVMT 10/20
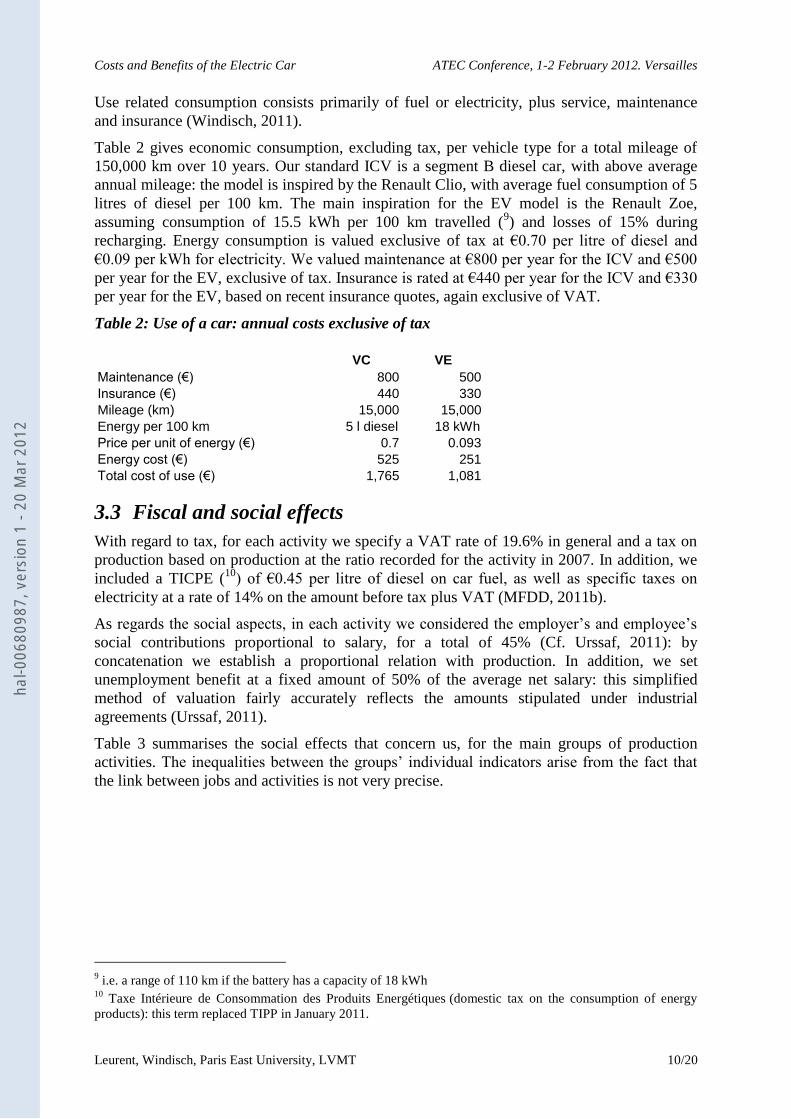
Use related consumption consists primarily of fuel or electricity, plus service, maintenance
and insurance (Windisch, 2011).
Table 2 gives economic consumption, excluding tax, per vehicle type for a total mileage of
150,000 km over 10 years. Our standard ICV is a segment B diesel car, with above average
annual mileage: the model is inspired by the Renault Clio, with average fuel consumption of 5
litres of diesel per 100 km. The main inspiration for the EV model is the Renault Zoe,
assuming consumption of 15.5 kWh per 100 km travelled (9) and losses of 15% during
recharging. Energy consumption is valued exclusive of tax at €0.70 per litre of diesel and
€0.09 per kWh for electricity. We valued maintenance at €800 per year for the ICV and €500
per year for the EV, exclusive of tax. Insurance is rated at €440 per year for the ICV and €330
per year for the EV, based on recent insurance quotes, again exclusive of VAT.
Table 2: Use of a car: annual costs exclusive of tax
3.3 Fiscal and social effects
With regard to tax, for each activity we specify a VAT rate of 19.6% in general and a tax on
production based on production at the ratio recorded for the activity in 2007. In addition, we
included a TICPE (10
) of €0.45 per litre of diesel on car fuel, as well as specific taxes on
electricity at a rate of 14% on the amount before tax plus VAT (MFDD, 2011b).
As regards the social aspects, in each activity we considered the employer’s and employee’s
social contributions proportional to salary, for a total of 45% (Cf. Urssaf, 2011): by
concatenation we establish a proportional relation with production. In addition, we set
unemployment benefit at a fixed amount of 50% of the average net salary: this simplified
method of valuation fairly accurately reflects the amounts stipulated under industrial
agreements (Urssaf, 2011).
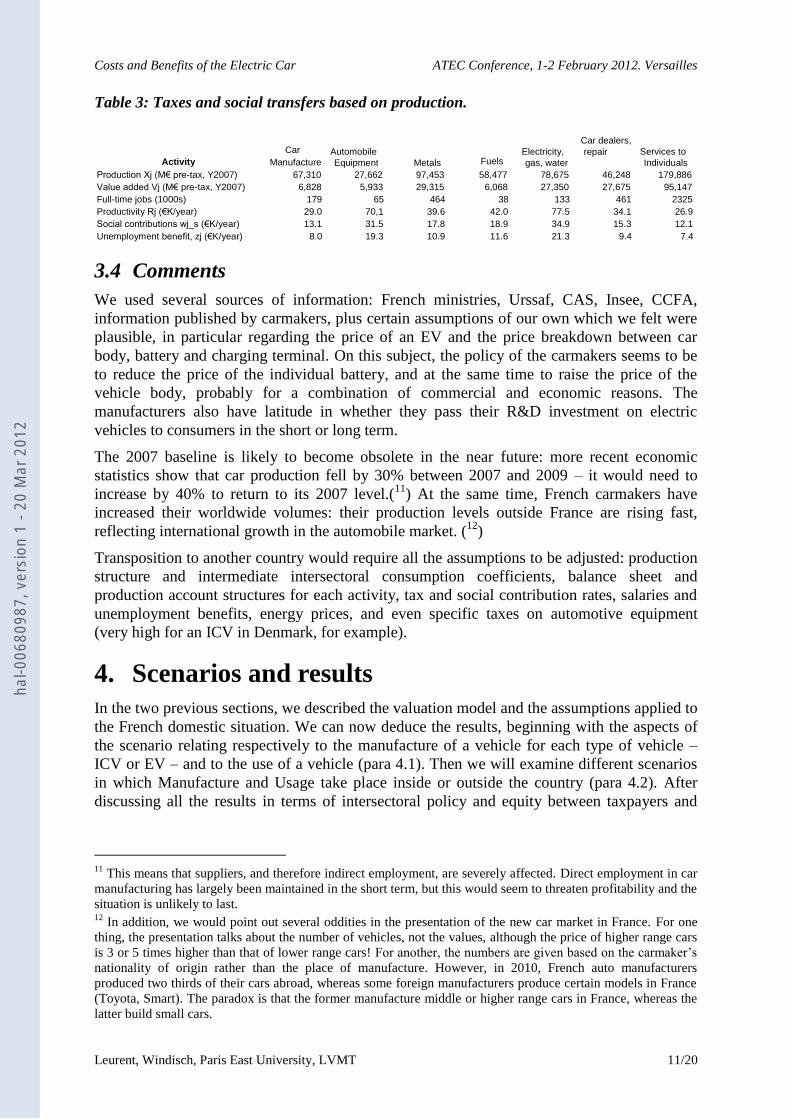
Table 3 summarises the social effects that concern us, for the main groups of production
activities. The inequalities between the groups’ individual indicators arise from the fact that
the link between jobs and activities is not very precise.
9 i.e. a range of 110 km if the battery has a capacity of 18 kWh
10 Taxe Intérieure de Consommation des Produits Energétiques (domestic tax on the consumption of energy
products): this term replaced TIPP in January 2011.
VC VE Maintenance (€) 800 500 Insurance (€) 440 330 Mileage (km) 15,000 15,000 Energy per 100 km 5 l diesel 18 kWh Price per unit of energy (€) 0.7 0.093 Energy cost (€) 525 251 Total cost of use (€) 1,765 1,081
hal-0
0680
987,
ver
sion
1 -
20 M
ar 2
012
Costs and Benefits of the Electric Car ATEC Conference, 1-2 February 2012. Versailles
Leurent, Windisch, Paris East University, LVMT 11/20
Table 3: Taxes and social transfers based on production.
3.4 Comments
We used several sources of information: French ministries, Urssaf, CAS, Insee, CCFA,
information published by carmakers, plus certain assumptions of our own which we felt were
plausible, in particular regarding the price of an EV and the price breakdown between car
body, battery and charging terminal. On this subject, the policy of the carmakers seems to be
to reduce the price of the individual battery, and at the same time to raise the price of the
vehicle body, probably for a combination of commercial and economic reasons. The
manufacturers also have latitude in whether they pass their R&D investment on electric
vehicles to consumers in the short or long term.
The 2007 baseline is likely to become obsolete in the near future: more recent economic
statistics show that car production fell by 30% between 2007 and 2009 – it would need to
increase by 40% to return to its 2007 level.(11
) At the same time, French carmakers have
increased their worldwide volumes: their production levels outside France are rising fast,
reflecting international growth in the automobile market. (12
)
Transposition to another country would require all the assumptions to be adjusted: production
structure and intermediate intersectoral consumption coefficients, balance sheet and
production account structures for each activity, tax and social contribution rates, salaries and
unemployment benefits, energy prices, and even specific taxes on automotive equipment
(very high for an ICV in Denmark, for example).
4. Scenarios and results
In the two previous sections, we described the valuation model and the assumptions applied to
the French domestic situation. We can now deduce the results, beginning with the aspects of
the scenario relating respectively to the manufacture of a vehicle for each type of vehicle –
ICV or EV – and to the use of a vehicle (para 4.1). Then we will examine different scenarios
in which Manufacture and Usage take place inside or outside the country (para 4.2). After
discussing all the results in terms of intersectoral policy and equity between taxpayers and
11
This means that suppliers, and therefore indirect employment, are severely affected. Direct employment in car
manufacturing has largely been maintained in the short term, but this would seem to threaten profitability and the
situation is unlikely to last. 12
In addition, we would point out several oddities in the presentation of the new car market in France. For one
thing, the presentation talks about the number of vehicles, not the values, although the price of higher range cars
is 3 or 5 times higher than that of lower range cars! For another, the numbers are given based on the carmaker’s
nationality of origin rather than the place of manufacture. However, in 2010, French auto manufacturers
produced two thirds of their cars abroad, whereas some foreign manufacturers produce certain models in France
(Toyota, Smart). The paradox is that the former manufacture middle or higher range cars in France, whereas the
latter build small cars.
Activity Car
Manufacture Automobile Equipment Metals Fuels
Electricity, gas, water
Car dealers, repair Services to
Individuals Production Xj (M€ pre-tax, Y2007) 67,310 27,662 97,453 58,477 78,675 46,248 179,886 Value added Vj (M€ pre-tax, Y2007) 6,828 5,933 29,315 6,068 27,350 27,675 95,147 Full-time jobs (1000s) 179 65 464 38 133 461 2325 Productivity Rj (€K/year) 29.0 70,1 39.6 42.0 77.5 34.1 26.9 Social contributions wj_s (€K/year) 13.1 31.5 17.8 18.9 34.9 15.3 12.1 Unemployment benefit, zj (€K/year) 8.0 19.3 10.9 11.6 21.3 9.4 7.4
hal-0
0680
987,
ver
sion
1 -
20 M
ar 2
012

Costs and Benefits of the Electric Car ATEC Conference, 1-2 February 2012. Versailles
Leurent, Windisch, Paris East University, LVMT 12/20
users (para 4.3), we will comment on the method of valuation in the light of the quantitative
results (para 4.4).
4.1 Evaluation of the scenario elements
A scenario is a combination of manufacturing elements (code M) or usage elements (code U),
per vehicle type. As our valuation method is linear, all that is needed is to combine the results
of the individual elements to find the result of a scenario. Four elements are of fundamental
importance: the domestic manufacture of an ICV (code CM, C for Combustion and M for
manufacture) and its usage (code CU), the domestic manufacture of an EV (code EM) and its
usage (code EU). Each element, code ab, is characterised by an elementary vector of end
consumption per activity, abY , established in section 3, from which we deduce sectoral
production abX using formula (4) provided in section 2, then the fiscal and social effects.
In the annex, Table A1 gives the consumption for each element, whilst Table A2 specifies the
associated production. Worth noting are:
The substantial size of the values involved, both for production and for the public
finances (Table 4). This reflects the large ripple effect of manufacture, with a
multiplier factor of around 4, whereas usage represents a multiplier of 3 for the ICV
and 2.5 for the EV.
For a single ICV, the total productive effect from manufacture and from usage are
similar, around €56K and €51K respectively, excluding tax. The sectoral distribution
is very different, focused on car construction and its inputs on the one hand, and on
fuels, trade and insurance services on the other.
For a single EV, manufacture has a much greater total productive effect than usage:
the ratio between them is almost 4:1. The sectoral distribution differs markedly, for
the same reasons as with an ICV, except that the Electricity Production activity
replaces the Fuels activity.
Between ICV and EV, the sum of the respective productive effects (M+U) is quite
similar, around €107K and €116K respectively, i.e. within 10%. The underlying
reason is that we chose a type of usagee in which the two vehicle types represent fairly
similar costs for a user, and this similarity carries over to production, without being
excessively affected either by the production system or by the tax regime.
The financial proceeds for the government are given in Table 4. They are substantial: over the
life cycle of a vehicle, the financial proceeds amount to €36K both for an ICV and an EV,
with a tiny difference excluding purchase incentive bonus. The proceeds from manufacture
are almost equivalent to the vehicle’s selling price before tax, while the proceeds from usage
amount to 2/3 or 3/4 of the final cost excluding tax!
Replacing an ICV with an EV would be very slightly beneficial to the public purse, provided
that it is manufactured and used within the country. A tax bonus of €5000 before VAT would
reduce the financial proceeds from an EV by 16%, taking them markedly below those from an
ICV.
Within the financial proceeds, social effects are very substantial and paramount: 65% for the
ICV and 73% for the EV, let’s say 70% for the sake of clarity. This provides retrospective
justification for stating and evaluating them. Their distribution between manufacture and
usage varies according to vehicle type: 45%-55% for an ICV compared with 71%-29% for an
EV. Broken down by item, unemployment benefit represents around 38% of social
hal-0
0680
987,
ver
sion
1 -
20 M
ar 2
012

Costs and Benefits of the Electric Car ATEC Conference, 1-2 February 2012. Versailles
Leurent, Windisch, Paris East University, LVMT 13/20
contributions paid to the government: we incorporated into the accounts to reflect labour
market conditions, which are currently difficult in France.(13
)
VAT has an important role, representing 19% of proceeds. Additional energy taxes produce
9% of the proceeds for an ICV, but only 1% for an EV. Finally, taxes on production represent
a not insignificant, though proportionally small amount, around €1000 per element, i.e. 5 or
6%.
On the tax side, the proceeds from one ICV would be €12.4K as compared with €9.5K for an
EV before bonus, and €3.5K after bonus. These figures flesh out the results of CAS (2011) by
including tax on production on both the manufacturing and usage sides.
Table 4: Values of the scenario elements (€ per car).
4.2 Definition and analysis of scenarios
In the baseline scenario, the manufacture and use of the vehicle take place within the territory
under consideration.
We establish the following alternative scenarios:
1) Import: for a vehicle manufactured outside the territory but used inside it.
2) Export: the vehicle is manufactured within the territory but is not used there.
3) Replacing a domestically produced ICV with an imported EV.
In the Import scenario, the tax treatment of consumption is the same as in the base scenario.
However, the tax on production in the manufacturing phase is lost to the territory, as are the
social effects in manufacture. In this case, the EV loses its main revenue-generating elements.
The financial loss to the domestic government is in excess of €8K per vehicle before bonus,
and €14K after bonus!
However, the worst scenario is the “Competing Import”, in other words replacing a
domestically produced ICV with an imported EV, where a foreign-based carmaker offers a
domestic consumer an attractive vehicle that persuades them to switch type. Indeed, excluding
bonus and for the manufacturing phase, an imported EV would attract financial revenues of
13
This inclusion is particularly important for a job retained “on the margin” of production, directly linked with
business volumes. Since our model is linear, applying an assumption to the margin means that it applies to the
entire volume of activity. As each of our scenarios is differential, this should not generate distortions.
Internal Combustion Vehicle Electric Vehicle Manufacture Usage Manufacture Usage
Final expenditure 14,600 17,650 24,400 10,814 TVA 2,862 4,121 4,782 2,119 Energy surcharge 3,375 420 Tax on production 1,002 1,031 1,648 618
Gross social contributions 6,576 7,968 11,486 4,840
Unemployment benefit 4,018 4,869 7,019 2,958 Net social contributions 10,594 12,837 18,505 7,798 TOTAL excluding VE bonus 14,457 21,364 24,936 10,956 TOTAL with VE bonus 14,457 21,364 18,956 10,956
hal-0
0680
987,
ver
sion
1 -
20 M
ar 2
012

Costs and Benefits of the Electric Car ATEC Conference, 1-2 February 2012. Versailles
Leurent, Windisch, Paris East University, LVMT 14/20
€5K (VAT), whereas a domestically produced ICV brings in €14.5K, making a loss of €9.5K.
Including usage, the loss would rise to €20K without bonus, and €26K with bonus!
The Export scenario contributes neither VAT (on manufacture or use), nor social effects and
energy surcharges during use (ignoring the supply of spare parts). Its effects are restricted to
the manufacturing phase, and in this respect an EV is almost twice as productive as an ICV,
provided that no bonus is applied at export, i.e. that the bonus is only allocated for domestic
use of the vehicle.
Out of all the scenarios, substitution for export is the most beneficial to the public purse,
whereas replacing a domestically manufactured ICV with an imported EV is the most
damaging. In the intermediate position, the baseline scenario with manufacture and usage
occurring domestically is slightly positive without bonus, but markedly negative with. It is
less unfavourable than the Competing Import scenario.
Table 5: Evaluation by scenario (€ per car).
4.3 Discussion
The financial outcome is very sensitive to the place where the vehicle is manufactured and
used. The domestic authority needs to adjust its policy finely, to reflect inherent national
conditions.
The outcome of the baseline scenario is slightly favourable to electric vehicles: the loss on
fuel surcharges would be more than offset by the gains in social contributions. (14
) To bring in
these gains, the industrial operators need to keep industrial employment within the country
and increase it in proportion with activity. This kind of cooperation with the general interest is
less easy for governments to control than taxes on energy: herein lies a significant risk in the
implementation of a policy in favour of electric vehicles.
Other specific tax arrangements can distort the results. In France, notably, fuel used by taxis is
exempt from specific taxes (up to an annual quota), which would improve the financial
outcome of the baseline scenario before bonus, and would similarly improve the outcome of
the import scenario.
The results of the different scenarios cover a very wide scope, from the highly negative to the
broadly positive: in other words, the development of electric vehicles is a risky undertaking
for the public finances of a country, depending on its industrial competitiveness.
The bonus for purchasing an EV constitutes a government incentive, which reverses the
outcome of the baseline scenario from slightly positive to markedly negative. It is difficult to
14
In fact, the two items would be almost equal if along with TICPE we included the VAT that it generates.
E-C, MI-UI Import Export Competitive import Net final domestic spend 2,964 -4,916 9,800 -16,654 VAT -81 -81 0 -81 Energy surcharge -2,955 -2,955 0 -2,955 Taxes on production 234 -413 647 -1,415 Gross social contributions 1,782 -3,128 4,910 -9,703 Unemployment benefit 1,089 -1,911 3,001 -5,930 Net social contributions 2,872 -5,039 7,911 -15,633 TOTAL without VE bonus 70 -8,487 8,557 -20,083 TOTAL with VE bonus -5,910 -14,467 3,557 -26,063
hal-0
0680
987,
ver
sion
1 -
20 M
ar 2
012
Costs and Benefits of the Electric Car ATEC Conference, 1-2 February 2012. Versailles
Leurent, Windisch, Paris East University, LVMT 15/20
justify on the grounds of the long-term goal of protecting the climate by reducing greenhouse
gas emissions, because the advantage of the EV over the ICV in the usage phase, under our
assumptions regarding mileage and unit consumption, only represents the equivalent of 21
tonnes of CO2 for the energy mix of electricity production in France.(15
) The cost to the
government of saving one tonne of CO2 by replacing an ICV with an EV, in the baseline
scenario, would be almost €300 after bonus; in the Import scenario, €400 before bonus and
€700 after; in the worst-case scenario, €950 before bonus and €1200 after! All these costs are
much higher than the costs of reduction in other sectors, in the short and medium term.
It is therefore worth asking whether a nationwide tax bonus is appropriate as an economic
instrument. The climate benefit is insufficient, at least in the short and medium term. The
same is true for energy factors, which are also part of the carbon economy. Local
environmental priorities – improving air quality and reducing noise – should rather be tackled
by local methods, obviously including a local bonus for using vehicles in town centres. As
regards encouraging local manufacture, this gains no benefit from a bonus on purchases,
which applies to any vehicle whereever it is made. By the same account, this is also true of
the social aim of maintaining domestic employment. So all that remains for government are
strategic questions of energy independence, which are relevant both to foreign trade and to
very long-term risk management: the bonus is a very high price to pay for these under current
conditions… Ultimately, the bonus would seem primarily to be an instrument of coordination,
providing an incentive for consumers and reducing risks for carmakers. It is important that it
should be applied only to vehicles that are used and manufactured domestically.
Looking further forward, let us imagine a radical change in fuel prices, resulting in the
government having to remove the surcharge on consumption, which in turn would improve
the financial outcome, before bonus, of replacing an ICV with an EV. This would nonetheless
not justify the bonus, since in these circumstances it would be in drivers’ personal interests to
use an EV… In this eventuality, acting early to develop efficient EVs and effective industrial
systems would seem to be a wise precaution in planning for the long-term. Facilitating
research and development efforts is certainly a good economic instrument in this respect, not
only for the EV but also for “smart” charging terminals which would be adaptable to the
country’s energy production systems. We would also recommend promoting local renewable
energy production and encouraging local networks to manufacture equipment for this kind of
production. This might be expected to have the indirect effect of stimulating the spread of
electric vehicles, which would become more attractive for individuals who produce their own
electricity. Reducing energy consumption would also seem to go without saying as an
objective: nevertheless, its impact on the public finances remains to be considered, by
comparing the revenues lost in the consumption phase with the potential gains in the
production phase.
In summary, this discussion is about fairness between the taxpayer represented by
government and the car user exposed to specific policies. It is also about geographical
fairness between places where the use of EVs might develop, and places which would fund
the public subsidies for this development through taxation. And it is also about fairness
between the industrial operators in different sectors, as potential beneficiaries of public
subsidies.
15
If, for the usage phase, we count 3.1 tonnes CO2 emitted per cubic metre of diesel consumed, and 0.085 tonnes
CO2 emitted per MWh produced in France, a lifetime mileage of 150,000 km emits 21 tonnes more CO2 in ICV
than in EV.
hal-0
0680
987,
ver
sion
1 -
20 M
ar 2
012

Costs and Benefits of the Electric Car ATEC Conference, 1-2 February 2012. Versailles
Leurent, Windisch, Paris East University, LVMT 16/20
4.4 Methodological comments
The quantitative treatment provides retrospective evidence of the need for a sufficiently
sensitive valuation model, in other words one that incorporates enough vertical and horizontal
aspects. Both vehicle manufacture and use need to be taken into account, from a life-cycle
analysis perspective, otherwise there is a risk of twofold or even three or fourfold errors on
certain items. Location within or outside the country must also be covered, to avoid
comprehensive errors both of sign and order of magnitude! Ripple effects also need to be
included: different production activities, in particular automobile construction, are highly
interdependent, and the values propagate within a complex system of production: here again,
there is a risk of large-scale errors… And finally, the social accounts need to be taken into
account, and not only the taxation aspects, again at the risk of substantial errors.
All these sensitivities greatly enrich the traditional framework of transport economics. At the
conceptual level, they are affiliated in drawing their inspiration from economic and social
analyses with a general economic equilibrium model of transport (e.g. Bröcker, 2004).
However, we only look at the movements of the values, not price behaviour nor the behaviour
of the microeconomic actors; on the other hand, we include vehicle manufacture and usage,
which to the best of our knowledge is absent from existing economic equilibrium models in
transport economics.
One limitiation of our model is its linear approach. The social aspects are based on a number
of jobs per activity, assuming proportionality, in other words a constant level of efficiency.
However, a significant priority for any company is to look for economies of scale, and
therefore increasing efficiency for all resources, including human. The linearity of the model
entails the risk that an application may overestimate the effects. Nonetheless, we believe that
this risk is moderate for an emerging industrial activity such as EV production, because any
emerging activity requires investments and therefore calls on the various activities at a more
sustained rate than in standard running mode.
Here, we reach another limitation inherent to input-output models: a transformation in the
system of production is difficult to fit into the model in its rapid development phase. We
postulated a new industrial activity, with its consumption in normal running mode, but
without its specific investments. Their omission undoubtedly leads us to underestimate the
short-term economic and financial impacts, which would counterbalance the risk of
overestimation caused by linearity.
5. Conclusion
From a factual perspective, we have shown that the manufacture and use of an automobile has
a significant impact on the public finances. The French case has several salient features: an
industrial infrastructure that allows local manufacture, a surcharge on end consumption of
fuel, high rates of social contributions and benefits. In these circumstances, the return per
vehicle for the public finances is slightly favourable to the VE compared with the ICV, before
the EV purchase bonus, which would markedly reverse the comparative outcome. As part of
an export strategy, the EV is more profitable to the public purse than the ICV. The worst
scenario is the import of a foreign manufactured EV for domestic use, in preference to a
locally manufactured ICV.
From a methodological perspectives, our valuation model has strengths and weaknesses. Its
strengths are firstly that it deals with monetary values, whereas the traditional socio-economic
evaluation in transport economics is very largely based on user well-being; secondly, that in
hal-0
0680
987,
ver
sion
1 -
20 M
ar 2
012

Costs and Benefits of the Electric Car ATEC Conference, 1-2 February 2012. Versailles
Leurent, Windisch, Paris East University, LVMT 17/20
“vertical” terms, it takes account of the activities of economic production, their relations
through intermediate consumption between customer and supplier, and therefore the ripple
effects; thirdly, that in “horizontal” terms it includes the economic and social effects of the
different sources of taxation, and the social transfers based on working activity; and fourth,
that it sets spatial limits on the public authority, by distinguishing between domestic and
foreign territory All these strengths greatly enrich the traditional framework of transport
economics.
The weaknesses relate to the input-output model on which the valuation is based. Firstly, we
only know the intermediate consumption between economic activities for trade within the
country, not foreign trade. Secondly, our model of an industrial infrastructure for the
manufacture of the EV is of our own creation, and needs to be compared with reality in order
to improve.
Despite these weaknesses, our valuation method is powerful in its breadth and its depth, and
undoubtedly more robust than less integrated methods. Within the framework of the
FORWARD E2 (Electromobility in Europe) European research project, it will be applied to
several models, whether to differentiate between vehicle models for (16
) or between national
or regional areas, and to assess different political instruments, not only incentive bonuses but
also European or national standards and local measures in favour of electromobility.
Thanks. This research was partly financed by the Renault group, which we thank for its
support: in particular Jean Grébert for the stimulating discussions within the framework of
the Sustainable Mobility Institute in partnership with ParisTech. We are also grateful to our
colleague Virginie Boutueil for her wise remarks and careful proofreading.
6. References
BCG (2009) The Comeback of the Electric Car? – How Real, How Soon, and What Must
Happen Next. The Boston Consulting Group, authored by Book M., Groll M., Mosquet X.,
Rizoulis D., Sticher G., BCG Focus: online accessible via www.bcg.com/publications.
Bröcker J (2004) Computable General Equilibrium Analysis in Transportation Economics.
Chapter 16 in Hensher D.A. et al, Handbook of Transport Geography and Spatial Systems,
pp. 269-289. Elsevier.
CAS Centre d’Analyse Stratégique (2011) La voiture de demain : carburants et électricité.
Rapport de la mission présidée par Jean Syrota. La Documentation Française, Paris.
http://www.strategie.gouv.fr/content/rapport-la-voiture-de-demain-carburants-et-electricite-0
CCFA (2011) L’industrie automobile française : analyse et statistiques. Rapport sur l’année
2010. http://www.ccfa.fr/IMG/pdf/ccfa_anastated2010-2.pdf
CE Delft (2011). Impacts of Electric Vehicles – Deliverable 4: Economic analysis and
business models, April, www.cedelft.eu, accessed on 2011-20-09.
CGDD (2011). Les véhicules électriques en perspective : Analyse coûts-avantages et
demande potentielle, Rapport #41 du Commissariat Général au Développement Durable.
Deutsche Bank (2009), Lache R., Galves D., Nolan P., Global Market Research, Electric
Cars : Plugged In - A mega theme gains momentum, November 3.
16
cf. la gamme du constructeur américain Tesla Motors qui cible le segment sportif de luxe
hal-0
0680
987,
ver
sion
1 -
20 M
ar 2
012

Costs and Benefits of the Electric Car ATEC Conference, 1-2 February 2012. Versailles
Leurent, Windisch, Paris East University, LVMT 18/20
Deutsche Bank Research (2011). Electromobility – Falling costs are a must, published in
collaboration with the Institut der Deutschen Wirtschaft, Koeln. Online accessible via
www.dbresearch.com.
Draper, M., Rodriguez E., Kaminsky P., Sidhu, I., Tenderich, B. (2009). Economic Impact of
Electric Vehicle Adoption in the United States, Technical Brief, Global Venture Lab, Center
for Entrepreneurship and Technology, U.C. Berkeley.
ESMT (2011), MMEM – Marktmodell Elektromobilitaet, online accessible via
http://mmem.eu/abschlussbericht (accessed on 2011-30-11).
Gregoir S (2008) L’élaboration des données de comptabilité nationale et l’analyse
économique. 12ème colloque de l’Association de comptabilité nationale Paris, 4-6 juin.
Insee (2011) Tableau Economique et Social de 2009 en 38 branches. Available on-line at
http://www.insee.fr/fr/indicateurs/cnat_annu/base_2005/donnees/xls/tes_38_2009.xls
Leurent F, Windisch E (2011) Triggering the development of electric mobility: a review of
public policies. Eur. Transp. Res. Rev. Vol. 3. pp. 221–235. DOI 10.1007/s12544-011-0064-
3. Available on-line at http://www.springerlink.com/content/ghq570268853q546/fulltext.pdf
MFDD Ministère français chargé du développement durable (2011a). Prix et marges des
produits pétroliers en France et dans l’Union Européenne. Document d’information,
http://www.developpement-durable.gouv.fr/Cours-prix-et-marges-en-France-et,14648.html
MFDD (2011b) Principes généraux de construction des tarifs réglementés d’électricité. 11
décembre 2009 (mis à jour le 10 mars 2011) – Direction Énergies et climat.
http://www.developpement-durable.gouv.fr/Principes-generaux-de-construction.html
MFDD (2011c) La fiscalité des hydrocarbures applicable au 1er janvier 2011.
http://www.developpement-durable.gouv.fr/La-fiscalite-des-hydrocarbures,11221.html
Nemry F., Brons M. (2011), Market penetration scenarios of electric drive vehicles.
Proceedings of the European Transport Conference 2011. 10-12 October, Glasgow, Scotland.
Quinet, E (1998) Principes d’économie du transport. Economica, Paris.
Ursaaf Unions de recouvrement des cotisations de sécurité sociale et d’allocations familiales
(2011). Taux des cotisations du régime général de sécurité sociale. Information sur site web
http://www.urssaf.fr/employeurs/baremes/baremes/taux_des_cotisations_du_regime_general_
01.html
Windisch E (2011) The uptake of electric vehicles in the Paris region : a financial impact
analysis of policy measures, market development and user characteristics on total costs of
ownership. Proceedings of the European Transport Conference 2011. 10-12 October,
Glasgow, Scotland.
hal-0
0680
987,
ver
sion
1 -
20 M
ar 2
012

Costs and Benefits of the Electric Car ATEC Conference, 1-2 February 2012. Versailles
Leurent, Windisch, Paris East University, LVMT 19/20
7. Annex
Table A1: Final demand per car (€ excluding tax).
Internal Combustion Vehicle Electric Vehicle Manufacture Usage Manufacture Usage DeltaY_CM DeltaY_CU DeltaY_EM DeltaY_EU
Electric Vehicle Manufacture 0 0 23,600 0 Agriculture, Agri-food Industry 0 0 0 0 Consumer Good s 0 0 0 0 Car Manufacture ICV 14,600 0 0 0 Car Equipment 0 0 0 0 Ship, Aircraft, Rail Construction 0 0 0 0 Machinery 0 0 0 0 Electrical and Electronic Equipment 0 0 500 0 Mineral Products 0 0 0 0 Textiles 0 0 0 0 Wood and Paper 0 0 0 0 Chemicals, Rubber, Plastics 0 0 0 0 Metallurgy and Metal Processing 0 0 0 0 Electrical and Electronic Components 0 0 0 0 Fuels 0 5,250 0 0 Water, Gas, Electricity 0 0 0 2,511 Construction 0 0 0 0 Car Dealing and Repair 0 8,000 0 5,000 Wholesale and Intermediate Trading 0 0 0 0 Transport 0 0 0 0 Financial, Real Estate, Rental Activities 0 4,400 0 3,303 Services to Businesses 0 0 0 0 Services to Individuals 0 0 300 0 Education, Health, Social Care 0 0 0 0 Administration 0 0 0 0 TOTAL 14,600 17,650 24,400 10,814 ha
l-006
8098
7, v
ersi
on 1
- 20
Mar
201
2

Costs and Benefits of the Electric Car ATEC Conference, 1-2 February 2012. Versailles
Leurent, Windisch, Paris East University, LVMT 20/20
Table A2: Domestic production per car (€ excluding tax).
Internal Combustion Vehicle Electric vehicle Manufacture Usage Manufacture Usage DeltaX_CM DeltaX_CU DeltaX_EM DeltaX_EU
Electric Vehicle Construction 0 0 27,505 0 Agriculture, Agri-food Industry 486 364 802 198 Consumer Goods 1,193 454 1,548 251 VC Automobile Construction 20,876 760 105 469 Automotive Equipment 2,255 464 1,887 277 Ship, Aircraft, Rail Construction 156 61 220 29 Machinery 2,078 666 2,693 307 Electrical and Electronic Equipment 1,011 302 15,505 153 Mineral Products 977 335 1 398 176 Textiles 502 82 568 42 Wood and Paper 574 319 915 163 Chemicals, Rubber, Plastics 3,995 1,887 4,961 630 Metallurgy and Metal Processing 6,603 1,451 8,899 684 Electrical and Electronic Components 949 351 2,191 193 Fuels 3,257 20,464 4,421 3,118 Water, Gas, Electricity 878 646 1,244 3,589 Construction 311 530 464 333 Automobile Dealing and Repair 39 8,073 48 5,041 Wholesale and Intermediate Trading 445 289 694 129 Transport 636 974 1,050 419 Financial, Real Estate, Rental Activities 6,910 11,818 10,775 7,488 Services to Businesses 1 712 283 2,510 126 Services to Individuals 322 334 851 183 Education, Health, Social Care 282 183 410 99 Administration 38 130 62 57 TOTAL 56,485 51,222 91
.725
24,155
hal-0
0680
987,
ver
sion
1 -
20 M
ar 2
012