Impact of Electric Vehicles and Solar PV on Future Generation Portfolio Investment
10
Thisarticlehasbeenacceptedforinclusioninafutureissueofthisjournal.Contentisfinalaspresented,withtheexceptionofpagination. IEEE TRANSACTIONS ON SUSTAINABLE ENERGY 1 Impact of Electric Vehicles and Solar PV on Future Generation Portfolio Investment Peerapat Vithayasrichareon, Member, IEEE, Graham Mills, Member, IEEE, and Iain F. MacGill, Member, IEEE Abstract—This study assesses the impact of electric vehicle (EV) uptake and large-scale photovoltaic (PV) investment on the eco- nomics of future electricity-generation portfolios. A Monte-Carlo- based portfolio modeling tool was used to assess the expected overall industry cost, associated cost uncertainty, and CO2 emis- sions of future generation portfolios, where both EVs and PV generation have achieved major deployment. The Australian National Electricity Market (NEM) was used as a case study under uncertain future fuel and carbon prices, electricity demand, and plant capital costs. Two EV charging scenarios were considered: 1) unmanaged charging which commences immediately as the EVs arrive at suitable charging infrastructure and 2) managed charg- ing where EV charging loads are managed so that they better align with PV output. Results show that there are potentially valu- able synergies between PV generation and EV charging demand in minimizing future electricity industry costs, cost uncertainties, and emissions, particularly when EV charging loads can be man- aged. The value of PV generation and managed EV charging is greater for higher EV fleet size and moderate carbon prices. Index Terms—Electric vehicles (EVs), electricity generation portfolio, integration between EV and PV, solar PV. I. I NTRODUCTION P LUG-IN electric vehicles (EVs) and solar photovoltaics (PV) are highly promising new technologies and are widely expected to play a major role in the electricity industry in the coming decade. EVs are emerging as a potentially sig- nificant element of the future transport vehicle fleet with their uptake being driven by questions over future oil availability and pricing, as well as growing concerns over climate change. On the supply side, solar PV has been one of the fastest growing renewable technologies worldwide over the past decade due to its potential contribution toward addressing security of electric- ity supply and environmental challenges. With its falling costs, PV deployment seems certain to continue growing rapidly. From the perspective of the electricity industry, EV uptake will result in increased demand along with an increase in absolute electricity industry CO 2 emissions [1], unless the elec- tricity used to recharge EVs is sourced from renewable energy. Manuscript received September 30, 2014; revised February 01, 2015; accepted March 23, 2015. This work was supported in part by the ARC Linkage Grant on maximizing the economic value of EV integration and by the Australian Renewable Energy Agency (ARENA). Paper no. TSTE-00534- 2014. The authors are with the Centre for Energy and Environmental Markets and School of Electrical Engineering and Telecommunications, UNSW Australia, Sydney 2052, Australia (e-mail: [email protected]). Color versions of one or more of the figures in this paper are available online at http://ieeexplore.ieee.org. Digital Object Identifier 10.1109/TSTE.2015.2418338 At the same time, variable renewable generation such as PV could greatly benefit from the presence of EVs in the power system as a result of the flexibility of EV charging loads, and therefore, the large aggregated storage capacity associated with significant uptake. In this regard, there may be valuable syner- gies between PV and EVs in a future electricity system which has higher penetrations of both technologies. While the interaction between PV and EVs might offer value, estimating and maximizing these benefits is a challenge for existing electricity industry planning and operational tools. Both technologies have rather different technical and economic characteristics from conventional generation technologies and end-user equipment. PV generation is cyclic over daily and seasonal time frames, somewhat uncertain, and hence, only partly dispatchable with its output not always coinciding well with demand patterns. EV charging is also cyclic, variable, and somewhat unpredictable, although EVs can offer significant energy-storage potential. High penetrations of variable renewable generation such as PV can have long-term implications on capacity mix and con- ventional generating plant investments, as electricity industry planning has generally been based around dispatchable gener- ation resources [2]. The charging of a large EV fleet, on the other hand, may significantly change the overall load profile, which can also have major implications on electricity indus- try operation and planning [3], [4]. Importantly, the potentially adverse economic and emission impacts of EV charging can be mitigated if there are effective measures for managing EV charging demand in ways that help defer or avoid investment in new generation capacity [5]. Given the potential for benefits yet also adverse impacts and interactions, there is a valuable role for tools that help us better understand the implications and opportunities of EV and PV integration. Such tools can guide decision-making on policy measures and electricity gen- eration investments that will best facilitate high uptake of both technologies. Generation investment and planning is increasingly mov- ing beyond cost minimization toward more complex assess- ments incorporating risks and uncertainties and multiple criteria including greenhouse gas emissions [6]. This study explicitly incorporates these aspects when assessing future generation portfolio investment where large-scale PV is one of the main generation options, and EV represents a significant demand- side technology. Previous studies related to EV integration have primarily focused on the impact of EV uptake on power system operation and planning [7]–[9]. The implications of “managed” 1949-3029 © 2015 IEEE. Personal use is permitted, but republication/redistribution requires IEEE permission. See http://www.ieee.org/publications_standards/publications/rights/index.html for more information.
Transcript of Impact of Electric Vehicles and Solar PV on Future Generation Portfolio Investment
This article has been accepted for inclusion in a future issue of this journal. Content is final as presented, with the exception of pagination.
IEEE TRANSACTIONS ON SUSTAINABLE ENERGY 1
Impact of Electric Vehicles and Solar PV on FutureGeneration Portfolio Investment
Peerapat Vithayasrichareon, Member, IEEE, Graham Mills, Member, IEEE,and Iain F. MacGill, Member, IEEE
Abstract—This study assesses the impact of electric vehicle (EV)uptake and large-scale photovoltaic (PV) investment on the eco-nomics of future electricity-generation portfolios. A Monte-Carlo-based portfolio modeling tool was used to assess the expectedoverall industry cost, associated cost uncertainty, and CO2 emis-sions of future generation portfolios, where both EVs and PVgeneration have achieved major deployment. The AustralianNational Electricity Market (NEM) was used as a case study underuncertain future fuel and carbon prices, electricity demand, andplant capital costs. Two EV charging scenarios were considered:1) unmanaged charging which commences immediately as the EVsarrive at suitable charging infrastructure and 2) managed charg-ing where EV charging loads are managed so that they betteralign with PV output. Results show that there are potentially valu-able synergies between PV generation and EV charging demandin minimizing future electricity industry costs, cost uncertainties,and emissions, particularly when EV charging loads can be man-aged. The value of PV generation and managed EV charging isgreater for higher EV fleet size and moderate carbon prices.
Index Terms—Electric vehicles (EVs), electricity generationportfolio, integration between EV and PV, solar PV.
I. INTRODUCTION
P LUG-IN electric vehicles (EVs) and solar photovoltaics(PV) are highly promising new technologies and are
widely expected to play a major role in the electricity industryin the coming decade. EVs are emerging as a potentially sig-nificant element of the future transport vehicle fleet with theiruptake being driven by questions over future oil availability andpricing, as well as growing concerns over climate change. Onthe supply side, solar PV has been one of the fastest growingrenewable technologies worldwide over the past decade due toits potential contribution toward addressing security of electric-ity supply and environmental challenges. With its falling costs,PV deployment seems certain to continue growing rapidly.
From the perspective of the electricity industry, EV uptakewill result in increased demand along with an increase inabsolute electricity industry CO2 emissions [1], unless the elec-tricity used to recharge EVs is sourced from renewable energy.
Manuscript received September 30, 2014; revised February 01, 2015;accepted March 23, 2015. This work was supported in part by the ARCLinkage Grant on maximizing the economic value of EV integration and bythe Australian Renewable Energy Agency (ARENA). Paper no. TSTE-00534-2014.
The authors are with the Centre for Energy and Environmental Markets andSchool of Electrical Engineering and Telecommunications, UNSW Australia,Sydney 2052, Australia (e-mail: [email protected]).
Color versions of one or more of the figures in this paper are available onlineat http://ieeexplore.ieee.org.
Digital Object Identifier 10.1109/TSTE.2015.2418338
At the same time, variable renewable generation such as PVcould greatly benefit from the presence of EVs in the powersystem as a result of the flexibility of EV charging loads, andtherefore, the large aggregated storage capacity associated withsignificant uptake. In this regard, there may be valuable syner-gies between PV and EVs in a future electricity system whichhas higher penetrations of both technologies.
While the interaction between PV and EVs might offer value,estimating and maximizing these benefits is a challenge forexisting electricity industry planning and operational tools.Both technologies have rather different technical and economiccharacteristics from conventional generation technologies andend-user equipment. PV generation is cyclic over daily andseasonal time frames, somewhat uncertain, and hence, onlypartly dispatchable with its output not always coinciding wellwith demand patterns. EV charging is also cyclic, variable,and somewhat unpredictable, although EVs can offer significantenergy-storage potential.
High penetrations of variable renewable generation such asPV can have long-term implications on capacity mix and con-ventional generating plant investments, as electricity industryplanning has generally been based around dispatchable gener-ation resources [2]. The charging of a large EV fleet, on theother hand, may significantly change the overall load profile,which can also have major implications on electricity indus-try operation and planning [3], [4]. Importantly, the potentiallyadverse economic and emission impacts of EV charging canbe mitigated if there are effective measures for managing EVcharging demand in ways that help defer or avoid investmentin new generation capacity [5]. Given the potential for benefitsyet also adverse impacts and interactions, there is a valuablerole for tools that help us better understand the implicationsand opportunities of EV and PV integration. Such tools canguide decision-making on policy measures and electricity gen-eration investments that will best facilitate high uptake of bothtechnologies.
Generation investment and planning is increasingly mov-ing beyond cost minimization toward more complex assess-ments incorporating risks and uncertainties and multiple criteriaincluding greenhouse gas emissions [6]. This study explicitlyincorporates these aspects when assessing future generationportfolio investment where large-scale PV is one of the maingeneration options, and EV represents a significant demand-side technology. Previous studies related to EV integration haveprimarily focused on the impact of EV uptake on power systemoperation and planning [7]–[9]. The implications of “managed”
1949-3029 © 2015 IEEE. Personal use is permitted, but republication/redistribution requires IEEE permission.See http://www.ieee.org/publications_standards/publications/rights/index.html for more information.

This article has been accepted for inclusion in a future issue of this journal. Content is final as presented, with the exception of pagination.
2 IEEE TRANSACTIONS ON SUSTAINABLE ENERGY
(or “smart”) and “unmanaged” (or “dumb”) charging of EVsusing pricing and control mechanisms have also been analyzed[10], [11]. The synergies between EV charging and solar PVin reducing the net demand variability have also been assessedto some extent in previous literature, although they are in thecontext of small-scale systems such as urban, commercial, orindustrial systems [12]–[14]. Cobenefits of EV and large-scalePV deployment have been assessed in [5], and it was suggestedthat mid-day charging can provide economic benefits to EVusers by maximizing the PV output during the day. Despitethese research efforts, the implications of high EV uptake andlarge-scale PV in the context of generation planning and invest-ment have not been a focus of previous literature, particularlyfrom the societal welfare perspective with respect to overallelectricity industry costs and benefits.
The study described in this paper is intended to help addressthis current gap. In particular, it assesses the potential impactsand cobenefits of parallel EV and PV uptake within differ-ent possible future generation portfolios. These impacts areexplored in the context of uncertain future fossil-fuel prices,carbon price, electricity demand, and plant capital costs. Theimpacts of different EV charging scenarios (managed andunmanaged), EV fleet sizes, PV penetrations, and carbon pric-ing are all investigated.
II. MODELING METHODOLOGY
The methodology employed for this study consists of twomain components: Monte Carlo generation portfolio modelingand EV modeling. The EV modeling simulates temporal EVcharging profiles based on actual travel patterns seen with con-ventional vehicles. In this study, two possible futures of EVcharging infrastructure provision are considered: “residential”and “universal.” Beyond unmanaged EV charging, measures tomanage EV charging so that it aligns with PV generation outputare also modeled. Hourly PV generation over the year and thesimulated hourly EV charging profiles are inputs into a Monte-Carlo-based generation modeling tool described in detail in thenext section.
A. Monte-Carlo-Based Generation Portfolio Modeling Tool
The modeling tool used in this paper extends conventionalload duration curve (LDC)-based optimal generation mix tech-niques by using Monte Carlo simulation (MCS) to formallyincorporate key uncertainties which directly impact overall gen-eration costs into the assessment. The tool produces outputswhich include the complete probability distribution of annualgeneration costs and CO2 emissions for each possible gener-ation portfolio comprising some mix of different generationoptions. These probability distributions can be represented asan expected annual cost and associated standard deviation (SD).While this paper refers to the SD as the “cost uncertainty,” it canbe taken to have a similar meaning to “cost risk” as used in theeconomic and financial context. The complete range of possiblegeneration portfolios is considered by varying the share of eachtechnology in the portfolios from 0% to 100% of total installedsystem capacity.
The tool then applies financial portfolio methods to deter-mine an efficient frontier (EF) of expected (i.e., mean) costs andthe associated cost uncertainty (i.e., SD) [15] for each of thedifferent generation portfolios. EF techniques provide a basisfor explicitly analyzing cost and risk tradeoffs among differ-ent generation portfolios. In particular, the EF is made up ofthose generation portfolios which offer the lowest expected costfor some level of cost uncertainty. Other EFs can also be con-structed to represent other tradeoffs between objectives such asexpected costs against CO2 emissions.
Inputs into the modeling tool consist of economic and oper-ating parameters of each generation options and probability ofkey uncertainties which are plant capital costs, fuel prices, car-bon price, and electricity demand. Correlations between fueland carbon prices are also accounted in the modeling sincetheir prices have exhibited a considerable historical correlationin many markets such as the EU, UK, and US [16], [17]. Forexample, ambitious climate policies might involve high car-bon prices that would increase the use, and hence, the price ofgas in relation to coal [18]. The techniques for sampling theseuncertain parameters are explained in Section III. A graphi-cal description of the modeling tool is shown in Fig. 1. Thedetails of this modeling including mathematical formulation aredescribed in detail in [19].
For each Monte Carlo run, the total annual generation costof each generation portfolio consists of total annual fixed costsand variable costs. The fixed cost is made up of annualizedplant capital cost, fixed operation and maintenance (O&M), andannualized transmission costs associated with newly built solarPV plants for particular generation portfolios using (1)
FCn = (APCn + FOMn)× In +ATC (1)
where APCn is the annualized plant capital cost, FOMn isthe annual fixed O&M cost ($/MW), and In is the installedcapacity (MW) of technology n in the portfolio, and ATC isthe annualized transmission costs ($) (described in Section III).
The annual variable cost is calculated based on annual energy(MWh) generated by each technology in the portfolio for agiven LDC. The variable cost comprises variable O&M, fuelcosts, and carbon costs as shown in (2)–(4)
VCn = (VOMn + Fuel costn +Carbon costn)×T∑
t=1
Pt,n
(2)
Fuel costn ($/MWh) = Fuel pricen ($/GJ)×HRn (3)
Carbon costn ($/MWh) = EFn × Carbon price ($/tCO2)(4)
where VOMn is the variable O&M cost ($/MWh), HRn is theaverage heat rate (GJ/MWh), and EFn is the emission factor(tCO2/MWh) of generation technology n, and Pt,n is the gen-eration output of technology n in the portfolio in each hour t ofthe LDC as determined from the merit-order dispatch.
PV generation and EV charging loads are incorporated byvarying the time series of electricity demand. As a result ofPV’s low-operating costs compared to fossil-fuel generation,

This article has been accepted for inclusion in a future issue of this journal. Content is final as presented, with the exception of pagination.
VITHAYASRICHAREON et al.: IMPACT OF EVs AND SOLAR PV ON FUTURE GENERATION PORTFOLIO INVESTMENT 3
Fig. 1. Monte-Carlo-based generation portfolio modeling for each case combination of PV penetration and EV fleet size.
PV is allowed priority dispatch. Hence, simulated hourly PVgeneration is subtracted from hourly native demand over a rep-resentative year. In contrast, hourly EV charging load is addedto native demand in each period. With this approach, the tem-poral match of PV generation and EV charging with electricitydemand is captured. The resulting net demand in each period,after accounting of PV generation and EV charging load, is thenrearranged in descending order of magnitude to obtain a resid-ual (net) load duration curve (RLDC). This curve is to be servedby thermal generation technologies in the portfolio.
The modeling focuses on long-term generation planning andinvestment, and therefore, does not give detailed considerationto power system operational issues beyond economic dispatch.
B. Modeling EV Charging Profiles
1) Simulating EV Charging Patterns: In this study, EVdemand profiles were obtained from simulation of charging inresponse to actual vehicle usage behavior obtained from theHousehold Transport Survey in the Australian State of NewSouth Wales (NSW HTS).1 The NSW HTS includes vehicletrip data between 2002 and 2012 with respect to 51 800 indi-vidual vehicles and 2 16 566 vehicle trips. This data was pooledand weighted to represent statistically valid vehicle travel inthe Sydney Greater Metropolitan Area. Assuming each sur-veyed vehicle to be an EV, a time-based simulation method wasapplied to establish the battery state of charge (SOC), chargingload, and fuel consumption for each vehicle across the course ofthe simulated day (weekend or working weekday) as a functionof recharging infrastructure availability. A minimum 10-mindwell-time constraint is imposed such that a vehicle must beparked at a location with charging infrastructure for over 10 minin order to recharge. Recharging commences immediately upon
1The NSW HTS is a rolling survey of 5000 households a year which tracksthe trips made by each vehicle in a day during the working week and weekend.It includes details of trip distance, trip departure and arrival times, trip purpose,and parking location at the point of arrival for each vehicle.
arrival as long as this requirement is met. Full details of thissimulation tool are provided in [20].
Two boundary infrastructure cases (residential and univer-sal) are considered in order to capture the potential variation inEV charging demand due to different levels of infrastructureavailability. Residential charging involves a vehicle chargingwhen parked at any location denoted as being residential in theNSW HTS. Universal charging, however, allows a vehicle alsoto recharge at other parking locations, such as work, shopping,and education facilities.
The simulation model implements a medium-sized passen-ger plug-in hybrid EV with a series drivetrain and a petrolinternal combustion engine for range extension (modeled usingbinary charge depletion/charge sustaining modes of operation)intended to broadly represent a GM Volt. The model wasimplemented using the Simulink and Stateflow packages inte-grated into MATLAB with state logic adapted from the frame-work for the operation of EVs in a power system describedin [21]. Charge-depletion mode electricity consumption forthe modeled PHEV was then established through the use ofADVISOR, the vehicle drivetrain simulation software releasedby the National Renewable Energy Laboratory (NREL) [22].Gasoline consumption while in charge-sustaining mode is takento be 15.7 km/L corresponding to the premium gasoline fuelefficiency reported for the Volt [23].
Results obtained for each vehicle within the simulated pas-senger vehicle fleet were then statistically weighted, aggre-gated, and scaled to represent the passenger car fleet sizemaking up the footprint of the Australian National ElectricityMarket (NEM) of 11 193 000 [24].
2) “Managed” EV Charging: This study has implementedan approach to control EV charging in such a way that it betteraligns with PV output, referred to here as “managed” charging.This approach requires the scheduling of EV charging acrossthe simulated EV fleet. Each vehicle is subject to a chargingcontrol signal which prevents recharging outside a specified3-h window. Specifically, the first vehicle commences its 3-h

This article has been accepted for inclusion in a future issue of this journal. Content is final as presented, with the exception of pagination.
4 IEEE TRANSACTIONS ON SUSTAINABLE ENERGY
Fig. 2. Average normalized hourly PV outputs based on 1-MW fixed flat plateacross different locations (PV), the proportion of the simulated EV fleet whichcommences charging at each point of the day.
charging window at 8 A.M. with groups of subsequent vehiclescommencing at 1-min increments afterward. The percentage offleet vehicles in a charging group is determined from the PVenergy production in that time increment, as a percentage ofthe total energy produced over the course of the day. Fig. 2compares the proportion of the EV fleet allowed to rechargeacross the day with the normalized hourly PV output showingthe extent of the match between charging opportunity and PVoutput.2
In order to ensure that the charging management scheme doesnot increase liquid fuel usage (hence reducing electricity indus-try costs but requiring greater liquid fuel purchases), a transportenergy requirement (TER) constraint is applied which reservessufficient energy within the vehicle battery to meet upcomingtransport requirements. The TER constraint represents the min-imum EV battery SOC profile which satisfies transport needs(without any surplus), and for which charging commences atthe latest possible time prior to departure. The TER constraintis specific to the travel patterns and recharging opportunitiesavailable to each individual vehicle and is established througha method presented in [25]. The EV charging characteristicspresented here were obtained by applying the TER to the sim-ulation of each individual vehicle so as to impose a minimumbattery SOC across the day. If the vehicle battery SOC fallsto this minimum level, charging is commenced immediatelyirrespective of the charging control signal.
Note that the ability to better align EV charging with solar PVoutputs relies on EVs having access to charging infrastructureduring hours in which the sun is shining. Such a requirementis contrary to the commonly held notion that EV rechargingwill occur primarily at residential locations since “residentialcharging” results in a limited ability to shape load through-out the day to match PV output without increasing vehicle fuelconsumption. Therefore, this study will focus on the “universalcharging” infrastructure when considering the management ofEV charging to better align with PV output.
III. TEST CASE DESCRIPTIONS
The case study of EV and PV in this paper is based on theAustralian National Electricity Market (NEM) in 2030 underhighly uncertain future fuel prices, carbon prices, electricity
2Note that this approach is at the fleet level and does not account for thesituation of a particular vehicle with respect to their ability to charge. As such,the results obtained are suboptimal and should be interpreted as a first-orderapproximation of possible outcomes.
demand, and plant capital costs. Four new generation optionswere assumed: coal, combined cycle gas turbine (CCGT), opencycle gas turbine (OCGT), and PV generating plants.
Three EV charging scenarios are considered: “residentialcharging (RESI) unmanaged,” “universal charging (UNIV)unmanaged,” and “universal charging (UNIV) managed.” Theimplications for future generation portfolios in terms of costs,cost uncertainty, and CO2 emissions are then explored for thesedifferent scenarios. In order to capture the impacts of differentPV deployment and EV uptake levels, this study also consid-ers a range of PV penetration and EV fleet sizes for each of theEV charging scenarios. Five PV penetrations range from 0% to20% and two different EV fleet sizes of 20% and 50% of totalresidential vehicles are examined.
A. Electricity Demand, PV Outputs, and EV Charging Profiles
Hourly electricity demand was obtained based on the actualdemand in the NEM in 2010. Note that actual wind genera-tion (5% of total generation) was also incorporated. Simulatedhourly PV generation was also based on 2010 weather data.
Hourly PV outputs were simulated across different loca-tions in major cities and regional areas using System AdvisorModel (SAM) software released by NREL [26]. This enablesthe value of geographic diversity of PV to be captured. Thehourly PV output was simulated based on 1-MW fixed flat-plated solar PV plant, with north-facing array, using hourlysatellite solar data and ground station weather data over 2010.Additional transmission costs for new centralized PV plantsin regional areas were also taken into consideration. Theseadditional costs were determined based on their maximum PVcapacities and distances to the nearest load centers or majortransmission hubs using transmission cost estimates providedby the Australian Energy Market Operator (AEMO) [27]. Theindicative transmission cost estimates for high-voltage ac linesis $700/MW/km. Total transmission costs for each regionallocation were determined for each of the PV penetration levelsconsidered in this study.
Fig. 3 illustrates hourly PV output and EV charging profilesfor a typical week for different EV fleet sizes and PV penetra-tions under each of the three EV charging scenarios. For theunmanaged charging case, EV charging load is at its highestunder both of the charging infrastructure provision cases dur-ing evening peak periods. Although the universal infrastructure(unmanaged) case sees some load shifted from the dominantevening peak, there is still significant potential to further redis-tribute the EV charging to better align with PV output. Underthe managed charging scenario, therefore, EV charging can bemade much better correlated with the PV output. The resultingresidual (net) demand (after deducting PV output and addingEV load) for each PV penetration and EV scenario is rearrangedinto the RLDC shown in Fig. 4.
B. Generator Data
New entrant generator data and cost parameters for eachtechnology were based upon the 2030 cost estimates obtainedfrom the 2012 Australian Energy Technology Assessment

This article has been accepted for inclusion in a future issue of this journal. Content is final as presented, with the exception of pagination.
VITHAYASRICHAREON et al.: IMPACT OF EVs AND SOLAR PV ON FUTURE GENERATION PORTFOLIO INVESTMENT 5
Fig. 3. Typical hourly PV outputs and EV charging load for managed and unmanaged charging (for 20% and 50% EV fleet size and 5% and 10% PV).
Fig. 4. Examples of RLDCs for different PV penetrations and EV charging scenarios.
TABLE IGENERATOR DATA
(AETA) [28], and are shown in Table I. All monetary valuesare in Australian dollars.
C. Modeling Key Uncertainties
Key parameters for which uncertainty is explicitly modeledin this study include future fuel prices, carbon prices, electric-ity demand, and plant capital costs. Lognormal distributions
were applied to estimated fuel and carbon prices, and capitalcosts in 2030 to reflect the asymmetric downside risks associ-ated with their future values. Demand uncertainty was modeledby assuming a normal distribution of residual peak demand foreach EV scenario and PV penetration.
Both lognormal and normal distributions are characterizedby their mean and SD. The central projections (mean) and SDsof the uncertain parameters were obtained based upon the esti-mates by AEMO and the Australian Government [28], [29].Correlated samples of fuel and carbon prices were generatedfrom their marginal distributions using multivariate MCS tech-niques, which reproduce random variables while preservingtheir marginal distribution properties and correlation structure.3
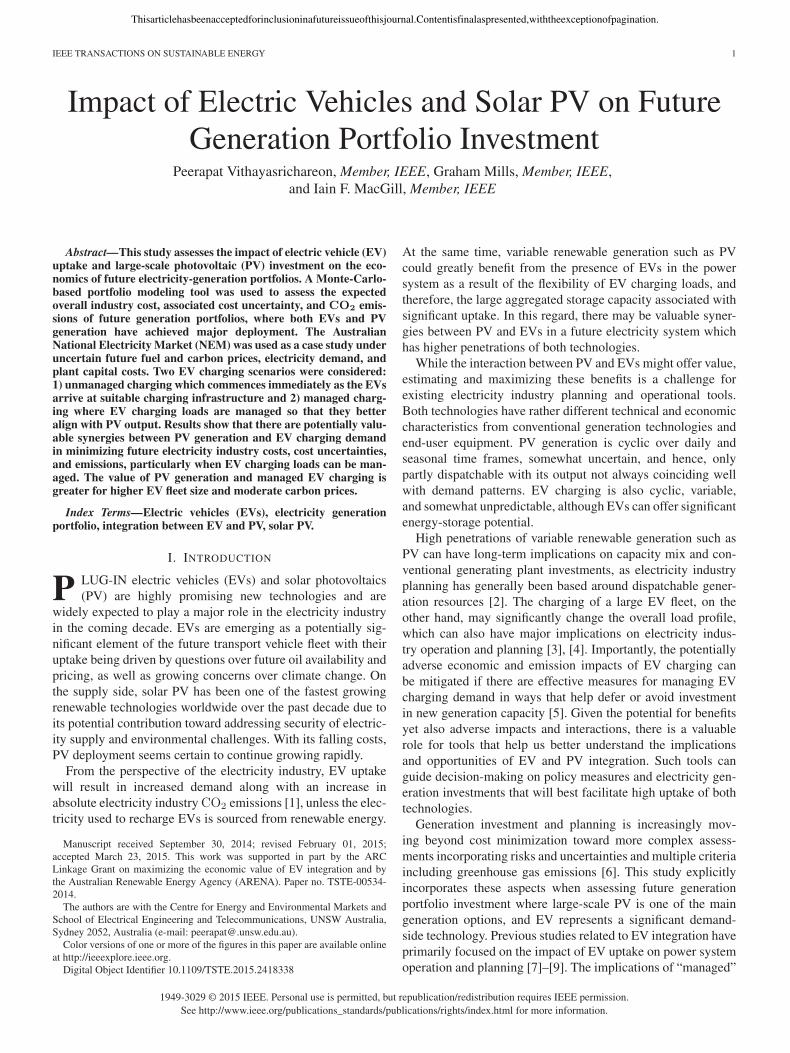
Probability distributions of 10 000 simulated gas price, plantcapital costs, and demand are illustrated in Fig. 5. Demand
3The correlation between gas and coal prices was estimated based upon his-torical gas and coal prices in OCED countries. The correlations between fueland carbon prices were approximated from historical data in EU and U.K.markets as well as a number of previous studies [18], [30], [31].
This article has been accepted for inclusion in a future issue of this journal. Content is final as presented, with the exception of pagination.
6 IEEE TRANSACTIONS ON SUSTAINABLE ENERGY
Fig. 5. Probability distributions of plant capital costs, gas price, demand, anddifferent carbon prices over 10 000 Monte Carlo simulations.
uncertainty is modeled as the uncertainties in the RLDC foreach EV charging scenario and PV penetration level.
The baseline results are simulated without a carbon price(hence no carbon price uncertainty). However, a sensitivityanalysis with different expected carbon prices was also con-ducted. These include low ($50/tCO2) and moderate carbonprices ($80/tCO2), with their probability distributions shownin the lower right graph of Fig. 5. These carbon prices are inline with the low and medium projections of carbon prices in2030 modeled by the Australian Treasury [29].
IV. SIMULATION RESULTS
For each of the three EV charging scenarios considered(RESI unmanaged, UNIV unmanaged, and UNIV managed),the costs and CO2 emissions of each possible generation port-folio mix for each EV fleet size and PV penetration werecalculated for 10 000 simulated coal and gas prices, electricitydemand, and plant capital costs (according to the distributionsshown in Fig. 5). Two EV fleet sizes (corresponding to 20%and 50% of current NEM state passenger vehicle fleet penetra-tion levels) and six PV penetration levels (0%, 5%, 10%, 15%,20%, and 25%) were considered. For each PV penetration leveland EV charging scenario, the proportions of coal, CCGT, andOCGT were then altered from 0% to 100% in 10% incrementsof total installed fossil-fuel capacity.
A. Impacts of PV Generation and EV Charging Measure
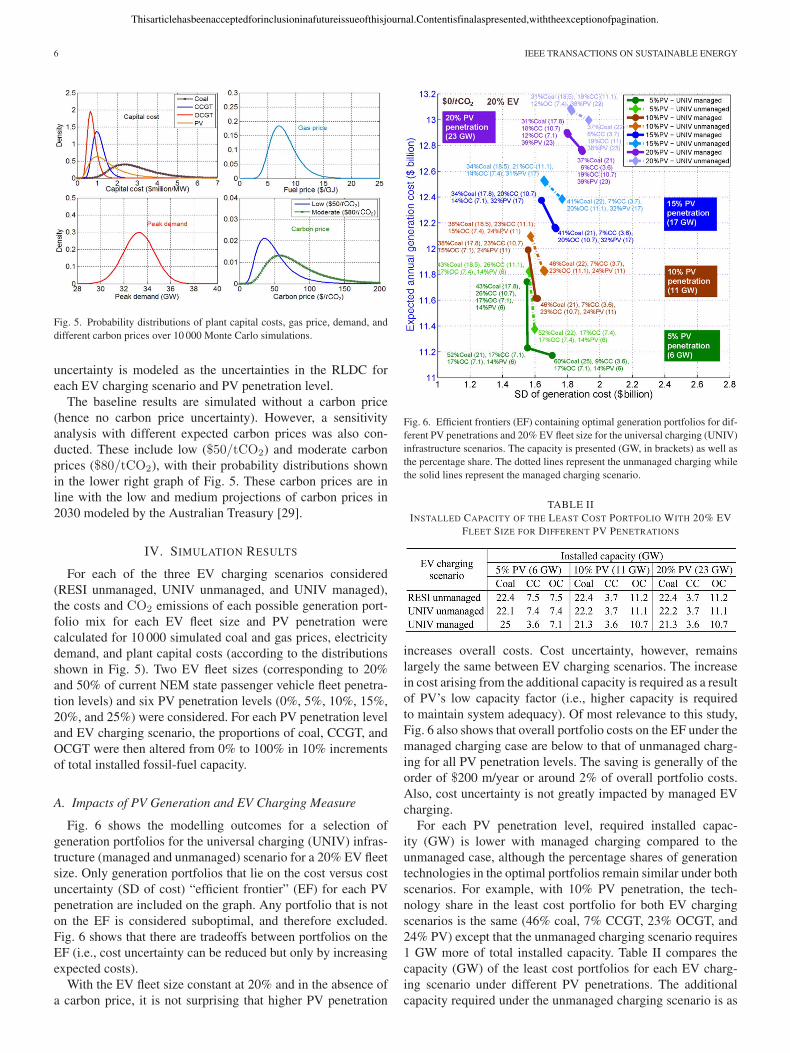
Fig. 6 shows the modelling outcomes for a selection ofgeneration portfolios for the universal charging (UNIV) infras-tructure (managed and unmanaged) scenario for a 20% EV fleetsize. Only generation portfolios that lie on the cost versus costuncertainty (SD of cost) “efficient frontier” (EF) for each PVpenetration are included on the graph. Any portfolio that is noton the EF is considered suboptimal, and therefore excluded.Fig. 6 shows that there are tradeoffs between portfolios on theEF (i.e., cost uncertainty can be reduced but only by increasingexpected costs).
With the EV fleet size constant at 20% and in the absence ofa carbon price, it is not surprising that higher PV penetration
Fig. 6. Efficient frontiers (EF) containing optimal generation portfolios for dif-ferent PV penetrations and 20% EV fleet size for the universal charging (UNIV)infrastructure scenarios. The capacity is presented (GW, in brackets) as well asthe percentage share. The dotted lines represent the unmanaged charging whilethe solid lines represent the managed charging scenario.
TABLE IIINSTALLED CAPACITY OF THE LEAST COST PORTFOLIO WITH 20% EV
FLEET SIZE FOR DIFFERENT PV PENETRATIONS
increases overall costs. Cost uncertainty, however, remainslargely the same between EV charging scenarios. The increasein cost arising from the additional capacity is required as a resultof PV’s low capacity factor (i.e., higher capacity is requiredto maintain system adequacy). Of most relevance to this study,Fig. 6 also shows that overall portfolio costs on the EF under themanaged charging case are below to that of unmanaged charg-ing for all PV penetration levels. The saving is generally of theorder of $200 m/year or around 2% of overall portfolio costs.Also, cost uncertainty is not greatly impacted by managed EVcharging.
For each PV penetration level, required installed capac-ity (GW) is lower with managed charging compared to theunmanaged case, although the percentage shares of generationtechnologies in the optimal portfolios remain similar under bothscenarios. For example, with 10% PV penetration, the tech-nology share in the least cost portfolio for both EV chargingscenarios is the same (46% coal, 7% CCGT, 23% OCGT, and24% PV) except that the unmanaged charging scenario requires1 GW more of total installed capacity. Table II compares thecapacity (GW) of the least cost portfolios for each EV charg-ing scenario under different PV penetrations. The additionalcapacity required under the unmanaged charging scenario is as
This article has been accepted for inclusion in a future issue of this journal. Content is final as presented, with the exception of pagination.
VITHAYASRICHAREON et al.: IMPACT OF EVs AND SOLAR PV ON FUTURE GENERATION PORTFOLIO INVESTMENT 7
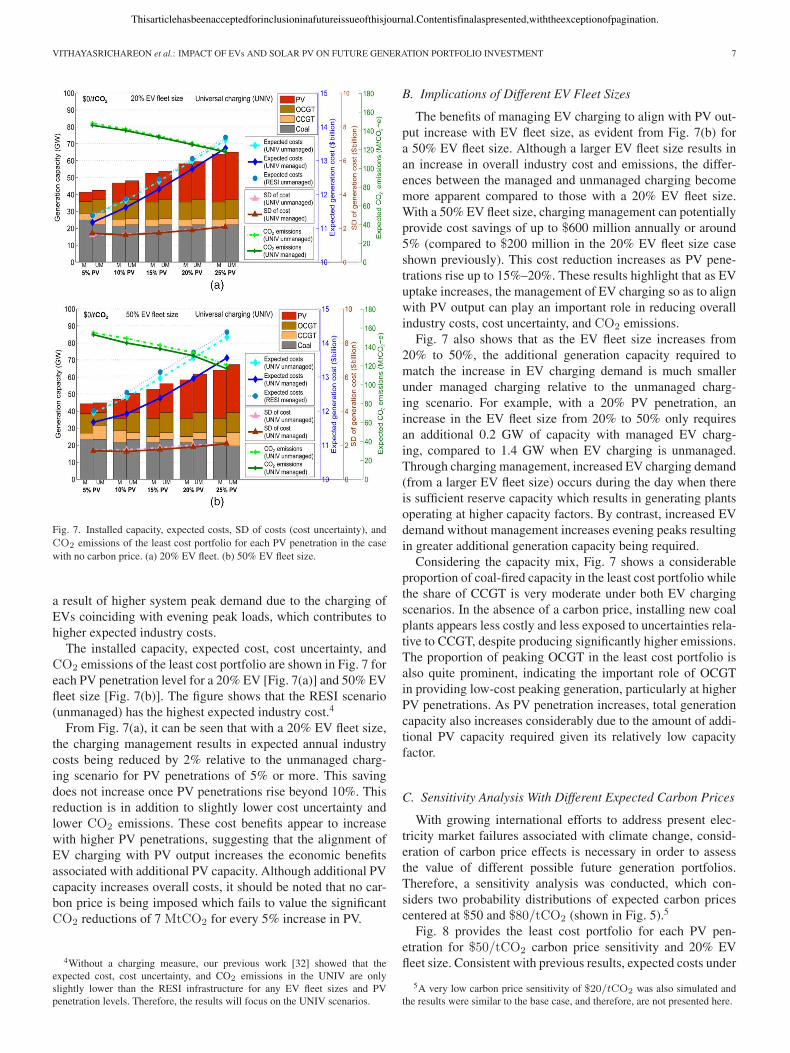
Fig. 7. Installed capacity, expected costs, SD of costs (cost uncertainty), andCO2 emissions of the least cost portfolio for each PV penetration in the casewith no carbon price. (a) 20% EV fleet. (b) 50% EV fleet size.
a result of higher system peak demand due to the charging ofEVs coinciding with evening peak loads, which contributes tohigher expected industry costs.
The installed capacity, expected cost, cost uncertainty, andCO2 emissions of the least cost portfolio are shown in Fig. 7 foreach PV penetration level for a 20% EV [Fig. 7(a)] and 50% EVfleet size [Fig. 7(b)]. The figure shows that the RESI scenario(unmanaged) has the highest expected industry cost.4
From Fig. 7(a), it can be seen that with a 20% EV fleet size,the charging management results in expected annual industrycosts being reduced by 2% relative to the unmanaged charg-ing scenario for PV penetrations of 5% or more. This savingdoes not increase once PV penetrations rise beyond 10%. Thisreduction is in addition to slightly lower cost uncertainty andlower CO2 emissions. These cost benefits appear to increasewith higher PV penetrations, suggesting that the alignment ofEV charging with PV output increases the economic benefitsassociated with additional PV capacity. Although additional PVcapacity increases overall costs, it should be noted that no car-bon price is being imposed which fails to value the significantCO2 reductions of 7 MtCO2 for every 5% increase in PV.
4Without a charging measure, our previous work [32] showed that theexpected cost, cost uncertainty, and CO2 emissions in the UNIV are onlyslightly lower than the RESI infrastructure for any EV fleet sizes and PVpenetration levels. Therefore, the results will focus on the UNIV scenarios.
B. Implications of Different EV Fleet Sizes
The benefits of managing EV charging to align with PV out-put increase with EV fleet size, as evident from Fig. 7(b) fora 50% EV fleet size. Although a larger EV fleet size results inan increase in overall industry cost and emissions, the differ-ences between the managed and unmanaged charging becomemore apparent compared to those with a 20% EV fleet size.With a 50% EV fleet size, charging management can potentiallyprovide cost savings of up to $600 million annually or around5% (compared to $200 million in the 20% EV fleet size caseshown previously). This cost reduction increases as PV pene-trations rise up to 15%–20%. These results highlight that as EVuptake increases, the management of EV charging so as to alignwith PV output can play an important role in reducing overallindustry costs, cost uncertainty, and CO2 emissions.
Fig. 7 also shows that as the EV fleet size increases from20% to 50%, the additional generation capacity required tomatch the increase in EV charging demand is much smallerunder managed charging relative to the unmanaged charg-ing scenario. For example, with a 20% PV penetration, anincrease in the EV fleet size from 20% to 50% only requiresan additional 0.2 GW of capacity with managed EV charg-ing, compared to 1.4 GW when EV charging is unmanaged.Through charging management, increased EV charging demand(from a larger EV fleet size) occurs during the day when thereis sufficient reserve capacity which results in generating plantsoperating at higher capacity factors. By contrast, increased EVdemand without management increases evening peaks resultingin greater additional generation capacity being required.
Considering the capacity mix, Fig. 7 shows a considerableproportion of coal-fired capacity in the least cost portfolio whilethe share of CCGT is very moderate under both EV chargingscenarios. In the absence of a carbon price, installing new coalplants appears less costly and less exposed to uncertainties rela-tive to CCGT, despite producing significantly higher emissions.The proportion of peaking OCGT in the least cost portfolio isalso quite prominent, indicating the important role of OCGTin providing low-cost peaking generation, particularly at higherPV penetrations. As PV penetration increases, total generationcapacity also increases considerably due to the amount of addi-tional PV capacity required given its relatively low capacityfactor.
C. Sensitivity Analysis With Different Expected Carbon Prices
With growing international efforts to address present elec-tricity market failures associated with climate change, consid-eration of carbon price effects is necessary in order to assessthe value of different possible future generation portfolios.Therefore, a sensitivity analysis was conducted, which con-siders two probability distributions of expected carbon pricescentered at $50 and $80/tCO2 (shown in Fig. 5).5
Fig. 8 provides the least cost portfolio for each PV pen-etration for $50/tCO2 carbon price sensitivity and 20% EVfleet size. Consistent with previous results, expected costs under
5A very low carbon price sensitivity of $20/tCO2 was also simulated andthe results were similar to the base case, and therefore, are not presented here.

This article has been accepted for inclusion in a future issue of this journal. Content is final as presented, with the exception of pagination.
8 IEEE TRANSACTIONS ON SUSTAINABLE ENERGY
Fig. 8. Installed capacity, expected costs, SD of costs (cost uncertainty), andCO2 emissions of the least cost portfolio for each PV penetration level for a$50/tCO2 of carbon price. (a) 20% EV. (b) 50% EV fleet size.
managed charging are lower than the unmanaged chargingscenario. However, there are economic benefits observed fromhaving additional PV at this carbon price (recall that withouta carbon price, additional PV would result in an increase inoverall cost for any EV charging scenarios). For the 20% EVfleet size shown in Fig. 8(a), a reduction in cost is observed asPV increases from 0% to 5%. This cost reduction is more pro-nounced in the managed charging scenario ($100 million or 1%compared with $40 million or 0.2% in the unmanaged chargingcase). This cost reduction occurs as a result of variable gener-ation costs offset by PV decreasing more than the increase infixed costs associated with additional PV. For a carbon price of$50/tCO2 and a 20% EV fleet, these results suggest that aneconomic optimum level of PV penetration is at around 5%,although penetrations up to 15% still have lower expected coststhan the case without PV.
With a larger EV fleet size of 50%, shown in Fig. 8(b),industry costs are further minimized at a 10% PV penetrationlevel for all of the EV charging scenarios. This suggests thatthe economic benefits of PV generation under managed EVcharging increase with larger EV fleet sizes in the same man-ner as for the case without a carbon price. For a carbon priceof $50/tCO2, increasing PV penetration is also seen to con-siderably reduce the generation cost uncertainty (SD of costs)for any of the EV charging scenarios. These results suggest
Fig. 9. Efficient frontiers (EF) containing optimal portfolios for an expectedcarbon price of $80/tCO2 and 20% EV fleet. The dotted lines represent theunmanaged charging and the solid lines represent the managed charging case.
that cost uncertainty is reduced by around 5% with every 5%increase in PV penetration.
For the $80/tCO2 carbon price sensitivity (with 20% EVfleet size), there are four optimal generation portfolios onthe EF for each PV penetration level as shown in Fig. 9.The downward movement in the EFs for each charging sce-nario indicates reductions in both the expected cost and costuncertainty as PV penetration increases (in contrast to the casewithout a carbon price shown in Fig. 6). For this carbon pricesensitivity, the cost uncertainty of generation portfolio is rel-atively large as a result of high carbon price uncertainty. Thespread of generation cost (i.e., SD) of the corresponding opti-mal generation portfolios is illustrated by Box-Whisker plots inFig. 10.
Details of the least cost generation portfolio for each PV pen-etration are shown in Fig. 11. At this carbon price, the cost ofcoal generation, due to its high emissions, is significantly higherthan both CCGT and OCGT. Hence, no coal is observed inthe least cost generation portfolio for any PV penetration level.Fig. 11 also suggests that increasing PV generation would fur-ther reduce the overall cost, which is minimized at 25% PVpenetration (highest penetration considered) compared to 5%PV in the $50/tCO2 carbon price sensitivity. As with the lowercarbon price sensitivities, EV charging management is seen toreduce both the cost and emission impacts from the EV charg-ing. The benefits of PV and the EV charging management alsoincrease with higher EV fleet sizes.
Results from the sensitivity analysis suggest that carbonpricing provides economic benefits for PV, and subsequently,enhances the value of the EV charging management. With amoderate carbon price, additional PV can lead to reductions inoverall costs in addition to cost uncertainty and emissions.

This article has been accepted for inclusion in a future issue of this journal. Content is final as presented, with the exception of pagination.
VITHAYASRICHAREON et al.: IMPACT OF EVs AND SOLAR PV ON FUTURE GENERATION PORTFOLIO INVESTMENT 9
Fig. 10. Whisker plots showing the spread of generation costs of optimal port-folios for an expected carbon price of $80/tCO2 and 20% EV fleet size.(a) Managed charging. (b) Unmanaged charging.
V. CONCLUSION
This study has examined the potential impacts of EVs and PVdeployment on the future overall industry costs, associated costuncertainties, and CO2 emissions of different generation port-folios. In particular, potential synergies between PV generationand managed EV charging have been assessed.
Results show that EV charging management to better alignEV charging demand with PV output is valuable as a means tomaximize benefits and minimize costs associated with high EVand PV penetrations in future electricity industries. AlthoughEV charging is found to increase overall costs and emissions forthe electricity industry, such increases can be reduced throughPV generation, particularly when EV charging is managed toalign with PV output. With such EV charging management, thesystem can accommodate higher EV uptake without significantadditional conventional generation capacity, as EV chargingdemand can be satisfied by day-time PV output. In addition, thecapacity factors of conventional generators that were operatingat part load can be improved as a result of day-time EV charg-ing. By contrast, unmanaged EV charging demand is highestduring evening peak-demand periods, resulting in higher sys-tem peak demand. This leads to higher industry costs andemissions due to the considerable amount of additional capac-ity required and increased output from conventional generatingplants. The value of PV in the presence of managed day-timeEV charging becomes more apparent as EV fleet size increases.
Fig. 11. Installed capacity, expected costs, SD of costs (cost uncertainty), andCO2 emissions of the least cost portfolio for each PV penetration level for a$80/tCO2 of carbon price.
These results also highlight the important role of carbonpricing in improving the economic merit of PV, and subse-quently, the value of EV uptake in the presence of manageddaytime charging. Without a carbon price, adding more PV islikely to increase overall industry costs due to its high capi-tal cost, despite significantly reducing CO2 emissions and costuncertainty. With moderate carbon prices starting from around$50/tCO2, however, increasing PV penetration results in costreductions, particularly for larger EV fleet sizes. As the carbonprice increases, the share of coal in the optimal portfolios is alsoreduced as a result of its high carbon costs.
While the EV modeling indicates that sufficient load flexibil-ity exists to significantly align EV charging with PV output,examining the issues associated with such an arrangement(including direct control and tariff measures) represents an areaof future work. Note that while the use of LDC techniqueshas many advantages in generation planning, the chronologyof demand, solar generation, and EV charging load is only par-tially captured. As such, the simulation tool used in this study isbest suited to assess long-run societal investment costs and risksunder high uncertainty, rather than problems requiring detailedoperational modeling. Addressing these limitations representsanother possible area for future work.
REFERENCES
[1] J. Wang et al., “Impact of plug-in hybrid electric vehicles on power sys-tems with demand response and wind power,” Energy Policy, vol. 39,no. 7, pp. 4016–4021, 2011.
[2] C. Batlle and P. Rodilla, “An enhanced screening curves method forconsidering thermal cycling operation costs in generation expansion plan-ning,” IEEE Trans. Power Syst., vol. 28, no. 4, pp. 3683–3691, Nov.2013.
[3] M. E. Khodayar, W. Lei, and M. Shahidehpour, “Hourly coordination ofelectric vehicle operation and volatile wind power generation in SCUC,”IEEE Trans. Smart Grid, vol. 3, no. 3, pp. 1271–1279, Sep. 2012.
[4] M. Takagi et al., “Economic value of PV energy storage using batteriesof battery-switch stations,” IEEE Trans. Sustain. Energy, vol. 4, no. 1,pp. 164–173, Jan. 2013.
[5] P. Denholm, M. Kuss, and R. M. Margolis, “Co-benefits of large scaleplug-in hybrid electric vehicle and solar PV deployment,” J. PowerSources, vol. 236, pp. 350–356, 2013.
[6] J. C. Jansen and L. W. M. Beurskens, “Portfolio analysis of the futureDutch generating mix,” in Analytical Methods for Energy Diversity andSecurity: A Tribute to Shimon Awerbuch, M. Bazilian and F. Roques, Eds.Amsterdam, The Netherlands: Elsevier, 2008, pp. 117–138.

This article has been accepted for inclusion in a future issue of this journal. Content is final as presented, with the exception of pagination.
10 IEEE TRANSACTIONS ON SUSTAINABLE ENERGY
[7] L. Wagner and L. Reedman, “Modeling the deployment of plug-in hybridand electric vehicles and their effects on the Australian national electricitymarket,” in Proc. IEEE Conf. Innovative Technol. Efficient Reliable Elect.Supply, 2010, pp. 165–170.
[8] A. Foley, B. Tyther, P. Calnan, and B. Ó. Gallachóir, “Impacts of elec-tric vehicle charging under electricity market operations,” Appl. Energy,vol. 101, pp. 93–102, 2013.
[9] A. Shortt and M. O’Malley, “Quantifying the long-term impact of electricvehicles on the generation portfolio,” IEEE Trans. Smart Grid, vol. 5,no. 1, pp. 71–83, Jan. 2014.
[10] L. Poch, M. Mahalik, J. Wang, and A. Vyas, “Impacts of plug-in hybridelectric vehicles on the electric power system in the western UnitedStates,” in Proc. IEEE Power Energy Soc. (PES) Gen. Meeting, 2010,pp. 1–7.
[11] J. Kiviluoma and P. Meibom, “Methodology for modelling plug-in elec-tric vehicles in the power system and cost estimates for a systemwith either smart or dumb electric vehicles,” Energy, vol. 36, no. 3,pp. 1758–1767, 2011.
[12] A. Mohamed, V. Salehi, M. Tan, and O. Mohammed, “Real-time energymanagement algorithm for plug-in hybrid electric vehicle charging parksinvolving sustainable energy,” IEEE Trans. Sustain. Energy, vol. 5, no. 2,pp. 577–586, Apr. 2014.
[13] M. Brenna, A. Dolara, F. Foiadelli, S. Leva, and M. Longo, “Urban scalephotovoltaic charging stations for electric vehicles,” IEEE Trans. Sustain.Energy, vol. 5, no. 4, pp. 1234–1241, Oct. 2014.
[14] J. Van Roy et al., “Electric vehicle charging in an office building micro-grid with distributed energy resources,” IEEE Trans. Sustain. Energy,vol. 5, no. 4, pp. 1389–1396, Oct. 2014.
[15] H. Markowitz, “Portfolio selection,” J. Finance, vol. 7, no. 1, pp. 77–91,1952.
[16] S. Macmillan, A. Antonyuk, and H. Schwind, Gas to Coal Competitionin the U.S. Power Sector, Int. Energy Agency, Paris, France, 2013.
[17] P. Koenig, Modelling Correlation in Carbon and Energy Markets, Elect.Policy Res. Group, Univ. Cambridge, Cambridge, U.K., 2011.
[18] R. Green, “Carbon tax or carbon permits: The impact on generators’risks,” Energy J., vol. 29, no. 3, pp. 67–89, 2008.
[19] P. Vithayasrichareon and I. F. MacGill, “A Monte Carlo based decision-support tool for assessing generation portfolios in future carbon con-strained electricity industries,” Energy Policy, vol. 41, pp. 374–392,2012.
[20] G. Mills and I. MacGill, “Potential power system and fuel consumptionimpacts of plug in hybrid vehicle charging using Australian national elec-tricity market load profiles and transportation survey data,” Elect. PowerSyst. Res., vol. 116, pp. 1–11, 2014.
[21] M. D. Galus, M. Zima, and G. Andersson, “On integration of plug-inhybrid electric vehicles into existing power system structures,” EnergyPolicy, vol. 38, no. 11, pp. 6736–6745, 2010.
[22] T. Markel and K. Wipke, “Modeling grid-connected hybrid electric vehi-cles using ADVISOR,” in Proc. 16th Annu. Battery Conf. Appl. Adv.,2001, pp. 23–29.
[23] U.S. Department of Energy. (2013). Chevrolet Volt Fuel Economy[Online]. Available: http://www.fueleconomy.gov/feg/Find.do?action=sbs&id=32655
[24] Australian Bureau of Statistics. (2012). Motor Vehicle Census–93090.[25] G. Mills and I. MacGill, “Assessing electric vehicle distributed energy
resource potential and transport energy requirement constraints,” in Proc.IEEE Power Energy Soc. (PES) Gen. Meeting, Washington, DC, USA,2014, pp. 1–5.
[26] NREL. (2012). System Advisor Model (SAM) [Online]. Available:http://sam.nrel.gov/, accessed on Jul. 4, 2012.
[27] AEMO, 2011 National Transmission Network Development Plan,Australian Energy Market Operator, Melbourne, Australia, 2011.
[28] BREE, Australian Energy Technology Assessment 2012, AustralianGovernment, Canberra, Australia, 2012.
[29] Australian Treasury, Strong Growth, Low Pollution: Modelling a CarbonPrice, Australian Government, Canberra, Australia, 2011.
[30] IEA, Electricity Information 2013, OECD/IEA, Paris, France, 2013.[31] F. A. Roques, D. M. Newbery, and W. J. Nuttall, “Fuel mix diversification
incentives in liberalized electricity markets: A mean-variance portfoliotheory approach,” Energy Econ., vol. 30, no. 4, pp. 1831–1849, 2008.
[32] P. Vithayasrichareon, G. Mills, and I. MacGill, “Assessing the poten-tial role of large-scale PV generation and electric vehicles in futurelow-carbon electricity industries,” in Proc. 3rd Solar Integr. Workshop,London, UK, 2013, pp. 1–8.
Peerapat Vithayasrichareon (S’09–M’11) receivedthe B.Eng. (Elec.) degree with Honours from theUniversity of Melbourne, Australia, the M.E. degreein energy economics and planning from the AsianInstitute of Technology, Thailand, and the Ph.D.degree in electrical engineering from the Universityof New South Wales, Sydney, Australia.
He is a Research Fellow with the School ofElectrical Engineering and Telecommunications andCentre for Energy and Environmental Markets at theUniversity of New South Wales, Sydney, Australia.
His research interests include generation planning and investment under uncer-tainty and multiple objectives, risk analysis, and renewable energy integration.
Graham Mills (S’11–M’14) received the B.Eng.(first class, Hons.) degree from the AustralianNational University, Canberra, Australia, in 2006. Heis currently pursuing the Ph.D. degree at the Schoolof Electrical Engineering and Telecommunications,University of New South Wales, Sydney, Australia.
His research interests include electric vehicles,photovoltaics, energy economics, and environmen-tal/regulatory markets.
Iain F. MacGill (M’91) received the B.Eng. (Elec.)degree with Honours and the M.Eng.Sci. (Biomed.)degree from the University of Melbourne, Australia,in 1987 and 1990, respectively, and the Ph.D. degreein electrical engineering from the University of NewSouth Wales, Australia, in 1999. He is an AssociateProfessor with the School of Electrical Engineeringand Telecommunications, University of New SouthWales, Sydney, Australia, and Joint Director for theuniversity’s interdisciplinary Centre for Energy andEnvironmental Markets. His teaching and research
interests include electricity industry restructuring and sustainable energy tech-nologies, with a particular focus on distributed resources and energy policy.