Electric Vehicles Report Part 2 (11_08_2021).cdr
112
-
Upload
khangminh22 -
Category
Documents
-
view
5 -
download
0
Transcript of Electric Vehicles Report Part 2 (11_08_2021).cdr

Title EV Landscape: Opportunities for India's Auto Component Industry
Year July, 2021
Authors Corporate & Government Advisory, YES BANK and Automotive Component Manufacturers Association of India (ACMA)
Disclaimer
This report is a publication of YES BANK Ltd. and ACMA, and so YES BANK and ACMA have editorial control over the content, including opinions, advice, statements, services, offers etc. that is represented in this report. However, YES BANK and ACMA will not be liable for any loss or damage caused by the reader's reliance on information obtained through this report. This report may contain third party contents and third-party resources. YES BANK and ACMA take no responsibility for third party content, advertisements or third party applications that are printed on or through this report, nor does it take any responsibility for the goods or services provided by its advertisers or for any error, omission, deletion, defect, theft or destruction or unauthorised access to, or alteration of, any user communication. Further, YES BANK and ACMA do not assume any responsibility or liability for any loss or damage, including personal injury or death, resulting from use of this report or from any content for communications or materials available on this report. The contents are provided for your reference only.
The reader/ buyer understands that except for the information, products and services clearly identified as being supplied by YES BANK and ACMA, it does not operate, control or endorse any information, products, or services appearing in the report in any way. All other information, products and services offered through the report are offered by third parties, which are not affiliated in any manner to YES BANK and ACMA.
The reader/ buyer hereby disclaims and waives any right and/ or claim, they may have against YES BANK and ACMA with respect to third party products and services. All materials provided in the report is provided on “As- is-where-is” basis and YES BANK and ACMA make no representation or warranty, express or implied, including, but not limited to, warranties of merchantability, fitness for a particular purpose, title or non – infringement. As to documents, content, graphics published in the report, YES BANK and ACMA make no representation or warranty that the contents of such documents, articles are free from error or suitable for any purpose; nor that the implementation of such contents will not infringe any third party patents, copyrights, trademarks or other rights. Maps depicted or reproduced in the report are only for the purpose of graphical representation and do not purport or intend to be the political map of any nation or state or region and the same has not been drawn to scale. All third party names, logos or trademarks (whether registered or not), which have been used in the report are just for representation purposes and ease of understanding or navigation for the readers and are not intended for any other purpose. The logos, graphic advertisements, plan images and maps, used in the report are trademarks of their respective owners. Neither YES Bank nor the ACMA is or claims to be the owner of any of such content. Usage of such logos, graphic advertisements, plan images and maps does not imply any affiliation with or endorsement by YES Bank or the ACMA.
In no event shall YES BANK or ACMA or their content providers be liable for any damages whatsoever, whether direct, indirect, special, consequential and/or incidental, including without limitation, damages arising from loss of data or information, loss of profits, business interruption, or arising from the access and/or use or inability to access and/or use content and/or any service available in this report, even if YES BANK and ACMA are advised of the possibility of such loss.
Contacts
YES BANK Ltd.
Corporate Headquarters
YES BANK House, Off Western Express Highway, Santacruz (East), Mumbai - 400 055
Northern Regional Corporate Office
Max Towers, Level 4,5 & 14A, Sector 16B, Noida, Uttar Pradesh - 201 301
Email: [email protected]
Website: www.yesbank.in
Automotive Component Manufacturers Association of IndiathThe Capital Court, 6 Floor, Olof Palme Marg,
Munirka, New Delhi - 110 067
Tel: +91 11 26160315Email: [email protected]: www.acma.in


Table of Contents1. EV Market Overview 07
1.1 Global Perspective 07
1.2 India Perspective 21
2. E-Vehicle Segment Opportunity Overview 27
2.1 E-Two Wheeler 27
2.2 E-Three Wheeler and E-LCV 35
2.3 E-Four Wheeler 41
2.4 E-Bus 45
2.5 Other EV Segments 49
2.6 Segmental Opportunity Mapping 51
3. EV Component Opportunity Overview 53
3.1 Introduction 53
3.2 Component Segments 57
3.2.1 Powertrain & Power Electronics 57
3.2.2 Battery & Associated Components 69
3.2.3 Connectivity & Control Systems 81
3.2.4 Other Components 91
4. Recommendations 95
5. EV Manufacturing: Policy Overview 101
6. Abbreviations 105

EV Market Overview
01
1.1 Global Perspective
1.2 India Perspective
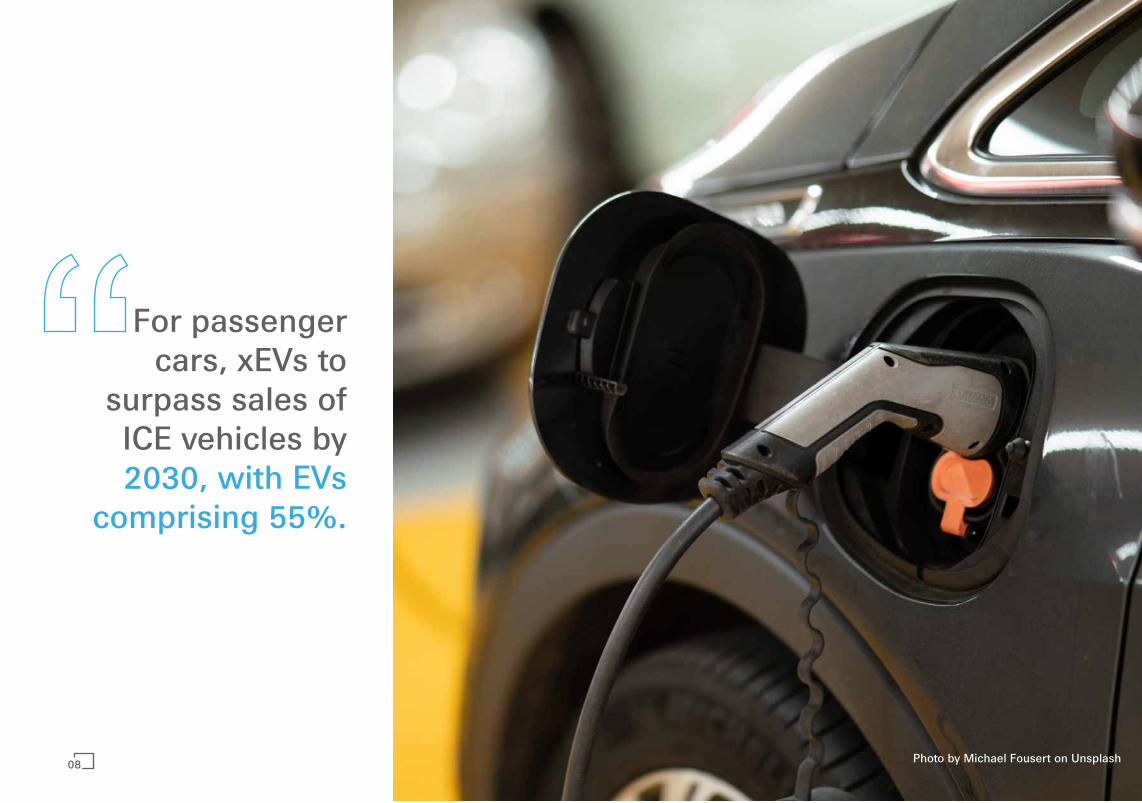
For passenger cars, xEVs to
surpass sales of ICE vehicles by 2030, with EVs
comprising 55%.
Photo by Michael Fousert on Unsplash08

Passenger Car Sales
Source: Bloomberg New Energy Finance
Peak Car for global ICE passenger cars & HCV sales has been reached in 2017, though upside exists in LCV & MCV sales.
Recovery to pre-Covid levels is expected by 2023 with growth driven by alternative powertrains
Electric powertrains are expected to extend overall passenger vehicle peak sales to 2036. Beyond 2030, EVs would drive growth.
ICE Vehicle Sales Peaking, Electrification is set to Drive Growth100
9080706050403020100
Internalcombustion
Hybrid
Fuel cell
Plug-inhybrid
Battery electric
2015 2020 2025 2030 2035 2040
mn
25
20
15
10
5
0
2.5
2.0
1.5
1.0
0.5
0.0
4.54.03.52.52.01.00.50.0
2015 2020 2025 2030 2035 2040 2015 2020 2025 2030 2035 2040
Light-duty Medium-duty Heavy-duty
Diesel and gaoline Electric Fuel cell Natural gas
mn mn mn
2015 2020 2025 2030 2035 2040
Commercial Vehicle Sales
09
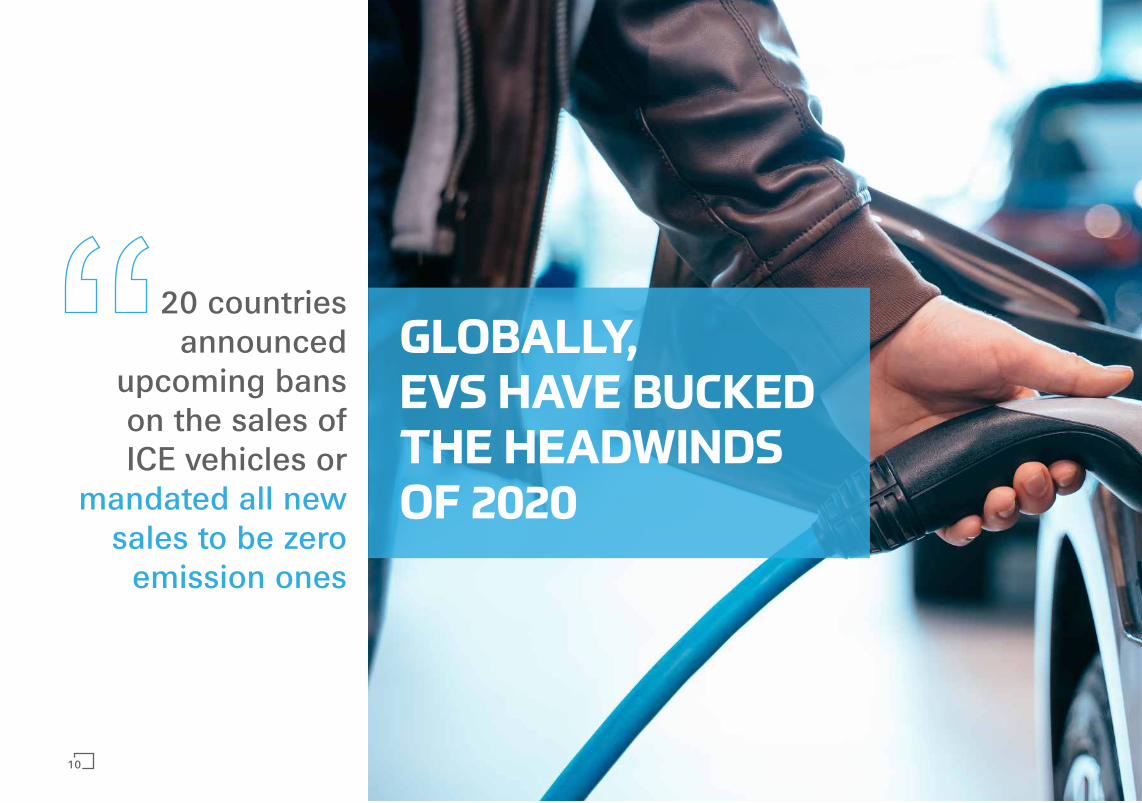
20 countries announced
upcoming bans on the sales of ICE vehicles or
mandated all new sales to be zero
emission ones
GLOBALLY, EVS HAVE BUCKED THE HEADWINDS OF 2020
10
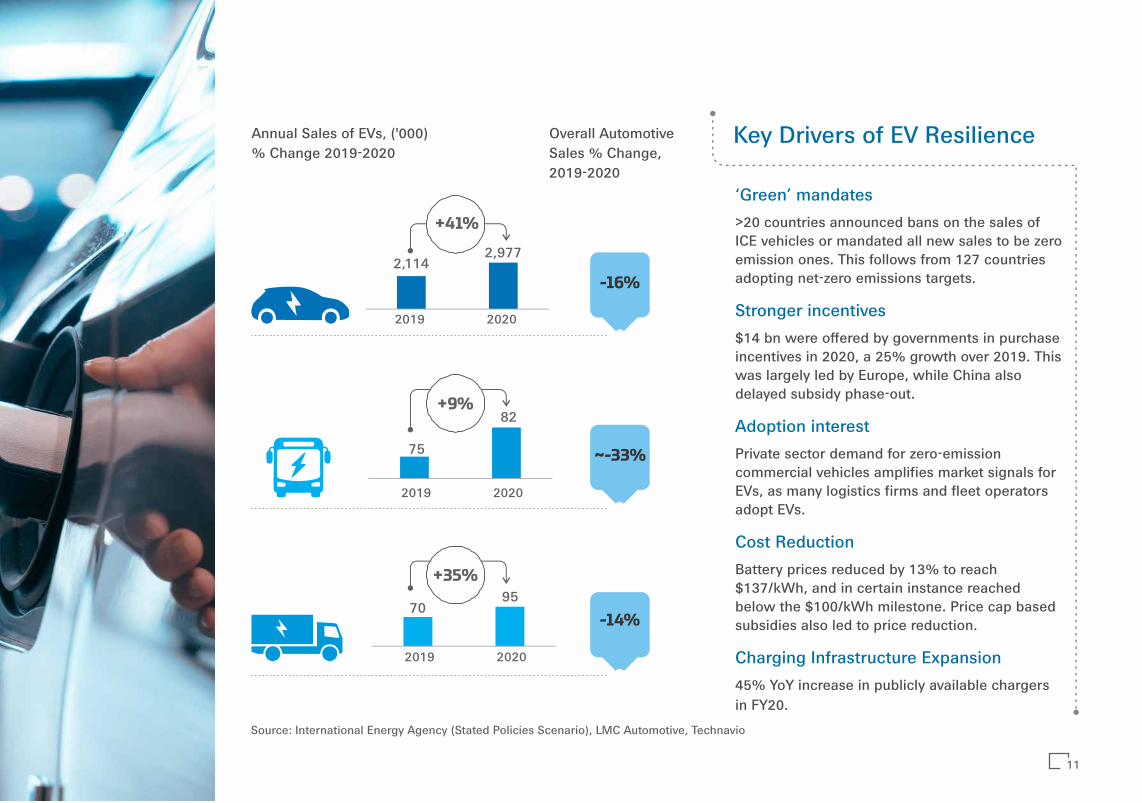
-16%2,114
2,977
2019 2020
Annual Sales of EVs, ('000)% Change 2019-2020
75
2019 2020
70 95
2019 2020
Overall Automotive Sales % Change, 2019-2020
+41%
82 +9%
+35%
Source: International Energy Agency (Stated Policies Scenario), LMC Automotive, Technavio
‘Green’ mandates
>20 countries announced bans on the sales of ICE vehicles or mandated all new sales to be zero emission ones. This follows from 127 countries adopting net-zero emissions targets.
Stronger incentives
$14 bn were offered by governments in purchase incentives in 2020, a 25% growth over 2019. This was largely led by Europe, while China also delayed subsidy phase-out.
Adoption interest
Private sector demand for zero-emission commercial vehicles amplifies market signals for EVs, as many logistics firms and fleet operators adopt EVs.
Cost Reduction
Battery prices reduced by 13% to reach $137/kWh, and in certain instance reached below the $100/kWh milestone. Price cap based subsidies also led to price reduction.
Charging Infrastructure Expansion
45% YoY increase in publicly available chargers in FY20.
Key Drivers of EV Resilience
-14%
~-33%
11

Source: International Energy Agency, BCG
0 20 40 60 80
BAIC
Mazda
Maruti Suzuki
Volvo
Dongfeng
Toyota
Renault-Nissan
BMW
Kia
SAIC
Ford
Daimler
GM
Volkswagen
2021 2022 2023 2024 2025 2029 2030
6 72 49 1 183 6 72 =
# of new EV models plan to be launched
* Europe only** US & China only
~400 new xEV Models
As per BCG, the top 29 OEMs plan to invest more than $300 bn over the next 10 years for xEV production
% of sales to be xEV
10%, 70%* (2025) | 50%**(2030)
25% (2025), 50% (2030)
100%* (2026)
30% (2025)
15-25% (2025)
20% (2022)
30% (2022)
50% (2025), 100%* (2030)
5% (2030)
50% (2030)
Strong OEM interest, EV Volume Sales setto rise 2.7X by 2030over 2020
Stellantis aims for 70% e-cars sales in Europe and 35% in the US üby 2030
FAW aims for 40% e-cars sales by 2025 & 60% by 2030ü
Honda aims at 40% e-car sales by 2030ü
Toyota to have 2 mn BEV and FCEVs sold annually by 2030, xEVs 8 ümn
Other Recent Announcements
Photo by Markus Spiske on UnsplashPhoto by Markus Spiske on UnsplashPhoto by Markus Spiske on Unsplash

2020 penetration 2025-F penetration 2030-F penetration
572 k
2.7%
19.8%
16.3%
17.3%
50.0%
1.9%
17.7%
9.0%
10.4%
4.6%
20.0%
e-trucks
e-bus
eLCVs
e-car
e2/3Wheelers
EV penetration to rise across segments, annual sales to reach from present 28 mn to 76 mn by 2030*
25 mn
50 mn
3 mn
22 mn
3 mn
296 k
EV-ICE price gap narrows with proliferation of EVs, increasing R&D
spends, standardization of technology and reduction in battery
costs. Additionally, incentives and charging infrastructure expansion
spur initial adoption.
*Projections of EVs vary between sources, but were consistently revised upwards anywhere from 25% to 260% since 2015. As per IEA, OEM declarations continue to outpace the projections displayed here
95 k
82 k
7 k
Source: International Energy Agency (Stated Policies Scenario)
13
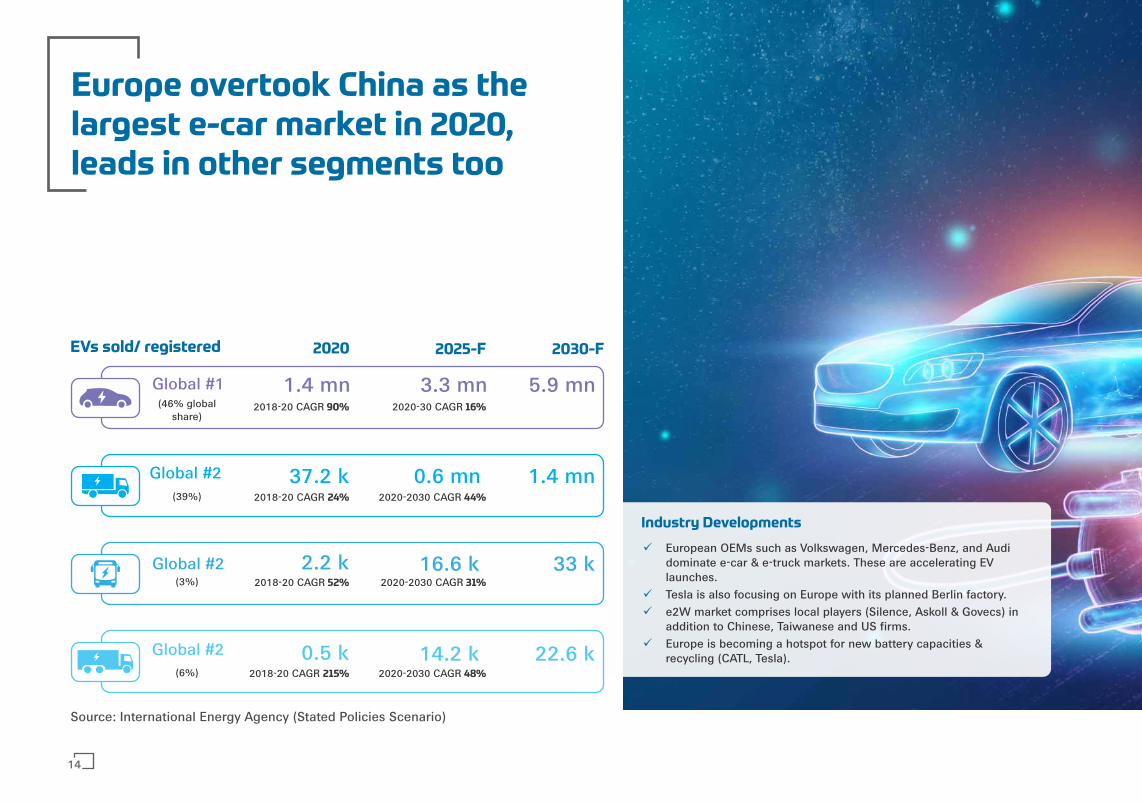
Europe overtook China as thelargest e-car market in 2020,leads in other segments too
2025-F 2030-F
Global #2 37.2 k 0.6 mn 1.4 mn
Global #2 2.2 k 16.6 k 33 k
0.5 k 14.2 k 22.6 k
2020
Global #1 (46% global
share)
1.4 mn 3.3 mn 5.9 mn
Global #2
2018-20 CAGR 90% 2020-30 CAGR 16%
(39%) 2018-20 CAGR 24% 2020-2030 CAGR 44%
(3%) 2018-20 CAGR 52% 2020-2030 CAGR 31%
(6%) 2018-20 CAGR 215% 2020-2030 CAGR 48%
European OEMs such as Volkswagen, Mercedes-Benz, and Audi üdominate e-car & e-truck markets. These are accelerating EV launches.
Tesla is also focusing on Europe with its planned Berlin factory. ü
e2W market comprises local players (Silence, Askoll & Govecs) in üaddition to Chinese, Taiwanese and US firms.
Europe is becoming a hotspot for new battery capacities & ürecycling (CATL, Tesla).
Industry Developments
EVs sold/ registered
Source: International Energy Agency (Stated Policies Scenario)
14

15
Pandemic-driven economic stimulus included a 45-57% increase in the xEV purchase incentives being provided by the largest EV markets in Europe - Germany, Spain, Italy and France - since 2017.
ü This led to a 140% boost in e-car sales in 2020, despite 22% decline in overall car market.
ü ~40% growth in eLCV sales was seen, while e-truck & e-bus sales increased by 23% and 9% respectively.
The new EU emission standard had already set the momentum previously with a 44% ecar market growth in 2019.
Policy and Incentives - Key Drivers
ICE bans/electrification targets have been announced in 13 European countries including Norway, Sweden, Netherlands, apart from Germany, France & UK.
European Clean Bus Deployment Initiative is expected to drive e-bus market.
For 2Ws, emission compliance makes ICE more expensive; e2W more attractive
Public charger deployment is being driven by the Alternative Fuel Infrastructure Directive. Fast chargers grew 55% to 38,000 in 2020.

Total $2.25 trn spend
announced for zero emissions,
clean and efficient energy
till 2050
Though US' EV marketshare slipped with soer regulatory support, forthcoming policies & OEM plans augur turnaround
16
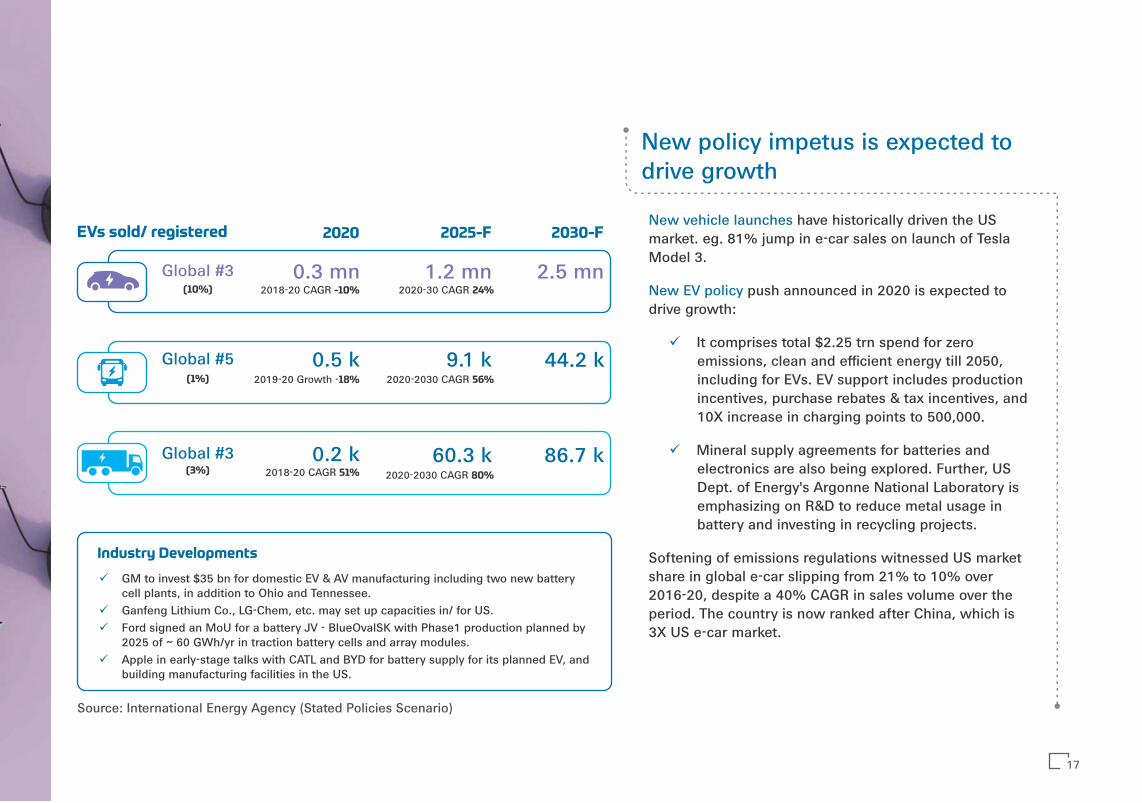
New vehicle launches have historically driven the US market. eg. 81% jump in e-car sales on launch of Tesla Model 3.
New EV policy push announced in 2020 is expected to drive growth:
It comprises total $2.25 trn spend for zero ü
emissions, clean and efficient energy till 2050, including for EVs. EV support includes production incentives, purchase rebates & tax incentives, and 10X increase in charging points to 500,000.
Mineral supply agreements for batteries and ü
electronics are also being explored. Further, US Dept. of Energy's Argonne National Laboratory is emphasizing on R&D to reduce metal usage in battery and investing in recycling projects.
Softening of emissions regulations witnessed US market share in global e-car slipping from 21% to 10% over 2016-20, despite a 40% CAGR in sales volume over the period. The country is now ranked after China, which is 3X US e-car market.
New policy impetus is expected to drive growth
Global #3 0.3 mn 1.2 mn 2.5 mn
Global #5 0.5 k 9.1 k 44.2 k
Global #3 0.2 k 60.3 k 86.7 k
(10%)
2025-F 2030-FEVs sold/ registered 2020
2018-20 CAGR -10% 2020-30 CAGR 24%
2019-20 Growth -18% 2020-2030 CAGR 56%
2018-20 CAGR 51% 2020-2030 CAGR 80%
GM to invest $35 bn for domestic EV & AV manufacturing including two new battery ücell plants, in addition to Ohio and Tennessee.
Ganfeng Lithium Co., LG-Chem, etc. may set up capacities in/ for US.ü
Ford signed an MoU for a battery JV - BlueOvalSK with Phase1 production planned by ü2025 of ~ 60 GWh/yr in traction battery cells and array modules.
Apple in early-stage talks with CATL and BYD for battery supply for its planned EV, and übuilding manufacturing facilities in the US.
Industry Developments
(1%)
(3%)
Source: International Energy Agency (Stated Policies Scenario)
17
Source: International Energy Agency (Stated Policies Scenario)
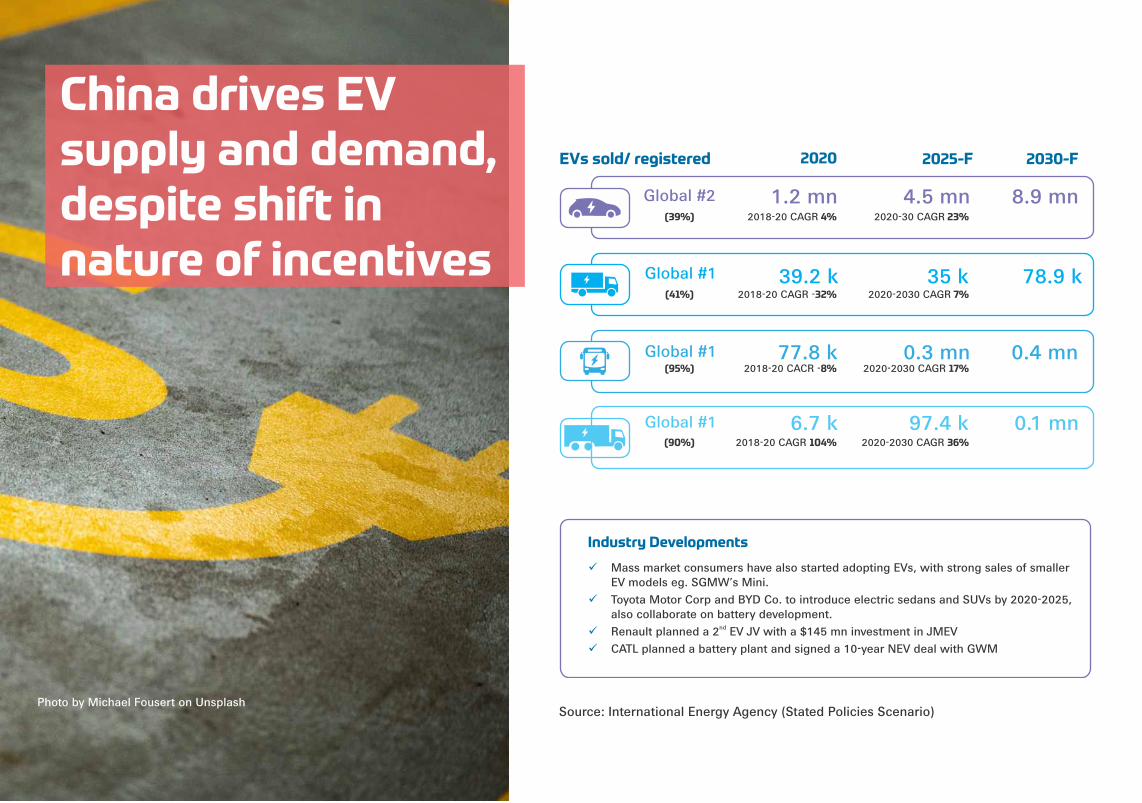
Mass market consumers have also started adopting EVs, with strong sales of smaller üEV models eg. SGMW’s Mini.
Toyota Motor Corp and BYD Co. to introduce electric sedans and SUVs by 2020-2025, üalso collaborate on battery development.
nd Renault planned a 2 EV JV with a $145 mn investment in JMEVü
CATL planned a battery plant and signed a 10-year NEV deal with GWMü
Industry Developments
2025-F 2030-F2020
Global #2 1.2 mn 4.5 mn 8.9 mn
Global #1 39.2 k 35 k 78.9 k
Global #1 77.8 k 0.3 mn 0.4 mn
Global #1 6.7 k 97.4 k 0.1 mn
(39%) 2018-20 CAGR 4% 2020-30 CAGR 23%
(41%) 2018-20 CAGR -32% 2020-2030 CAGR 7%
(95%) 2018-20 CACR -8% 2020-2030 CAGR 17%
(90%) 2018-20 CAGR 104% 2020-2030 CAGR 36%
EVs sold/ registered
China drives EV supply and demand, despite shi in nature of incentives
Photo by Michael Fousert on Unsplash
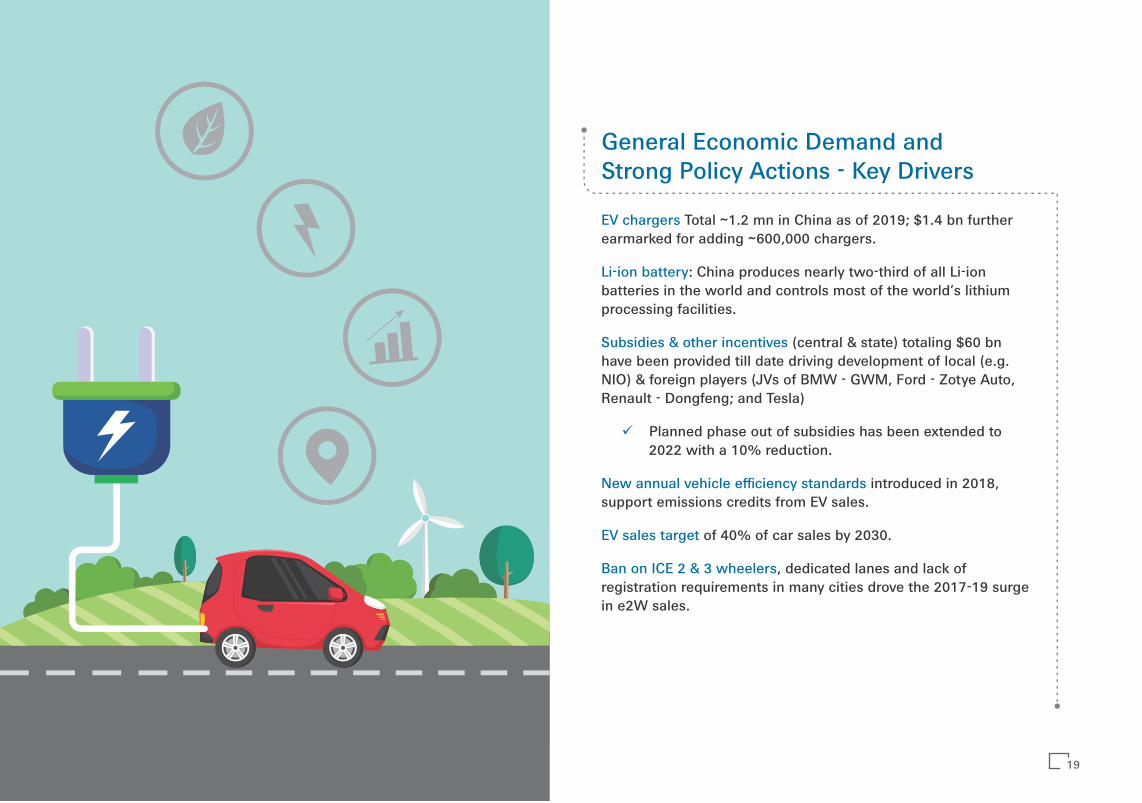
General Economic Demand and Strong Policy Actions - Key Drivers
EV chargers Total ~1.2 mn in China as of 2019; $1.4 bn further earmarked for adding ~600,000 chargers.
Li-ion battery: China produces nearly two-third of all Li-ion batteries in the world and controls most of the world’s lithium processing facilities.
Subsidies & other incentives (central & state) totaling $60 bn have been provided till date driving development of local (e.g. NIO) & foreign players (JVs of BMW - GWM, Ford - Zotye Auto, Renault - Dongfeng; and Tesla)
Planned phase out of subsidies has been extended to ü
2022 with a 10% reduction.
New annual vehicle efficiency standards introduced in 2018, support emissions credits from EV sales.
EV sales target of 40% of car sales by 2030.
Ban on ICE 2 & 3 wheelers, dedicated lanes and lack of registration requirements in many cities drove the 2017-19 surge in e2W sales.
19
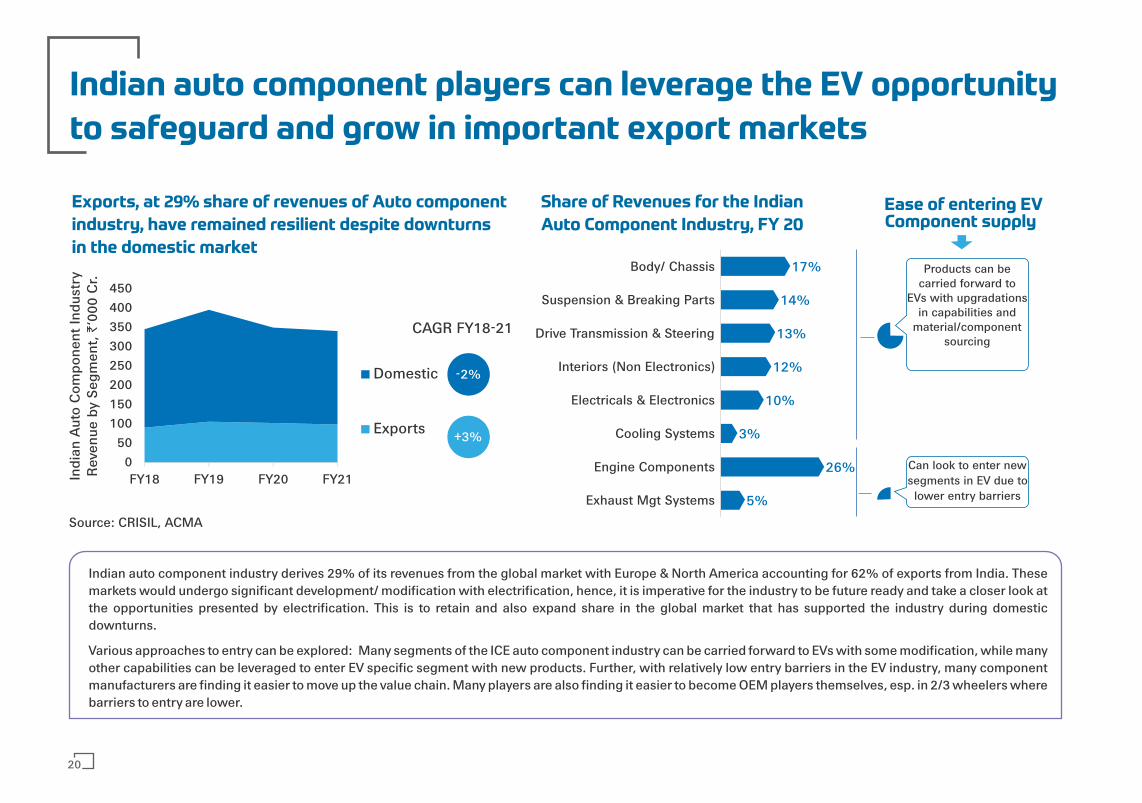
Indian auto component players can leverage the EV opportunity
to safeguard and grow in important export markets
5%
26%
3%
10%
12%
13%
14%
17%
Exhaust Mgt Systems
Engine Components
Cooling Systems
Electricals & Electronics
Interiors (Non Electronics)
Drive Transmission & Steering
Suspension & Breaking Parts
Body/ Chassis Products can be carried forward to
EVs with upgradationsin capabilities and
material/componentsourcing
Ease of entering EV Component supply
Exports, at 29% share of revenues of Auto component
industry, have remained resilient despite downturns
in the domestic market
Share of Revenues for the Indian
Auto Component Industry, FY 20
Indi
an A
uto
Com
pone
nt In
dust
ryR
even
ue b
y Se
gmen
t, `
‘000
Cr.
Can look to enter new segments in EV due to lower entry barriers
Indian auto component industry derives 29% of its revenues from the global market with Europe & North America accounting for 62% of exports from India. These markets would undergo significant development/ modification with electrification, hence, it is imperative for the industry to be future ready and take a closer look at the opportunities presented by electrification. This is to retain and also expand share in the global market that has supported the industry during domestic downturns.
Various approaches to entry can be explored: Many segments of the ICE auto component industry can be carried forward to EVs with some modification, while many other capabilities can be leveraged to enter EV specific segment with new products. Further, with relatively low entry barriers in the EV industry, many component manufacturers are finding it easier to move up the value chain. Many players are also finding it easier to become OEM players themselves, esp. in 2/3 wheelers where barriers to entry are lower.
Source: CRISIL, ACMA
20
050
100150200250300350400450
FY18 FY19 FY20 FY21
Domestic
Exports
CAGR FY18-21
-2%
+3%

EV Market Overview
01
1.1 Global Perspective
1.2 India Perspective
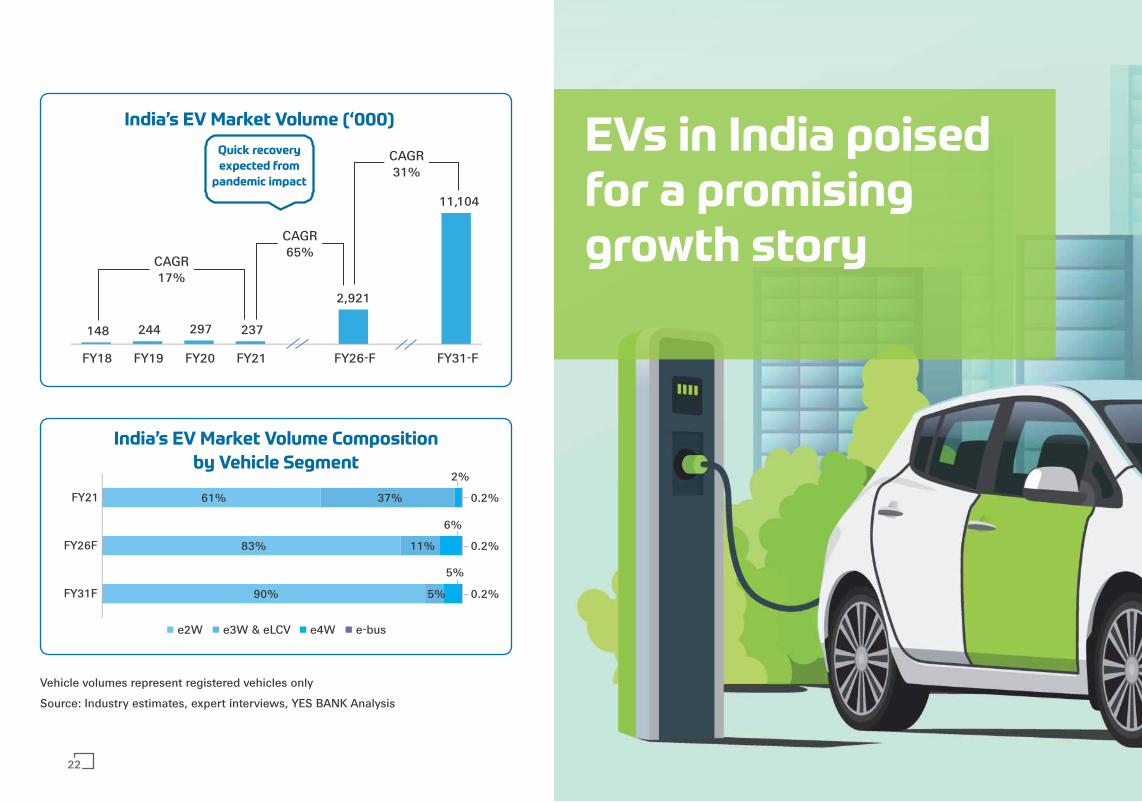
EVs in India poisedfor a promisinggrowth story
61%
83%
90%
37%
11%
5%
2%
6%
5%
0.2%
0.2%
0.2%
FY21
FY26F
FY31F
e2W e3W & eLCV e4W e-bus
India’s EV Market Volume Composition
by Vehicle Segment
Vehicle volumes represent registered vehicles only
Source: Industry estimates, expert interviews, YES BANK Analysis
148 244 297 237
2,921
11,104
FY18 FY19 FY20 FY21 FY26-F FY31-F
India’s EV Market Volume (‘000)
CAGR31%
CAGR65%
CAGR17%
Quick recovery
expected from
pandemic impact
22

...continued
ü EV adoption in India is starting to see traction, aligned with global trends but with a different segmental mix.
ü Growth in e2W and e3W segments is driven by favorable TCO narrative but growth in e4W and e-bus segments is driven majorly by Government push for clean mobility.
ü Clean mobility has emerged as a focus area as the Government endeavors to meet its Paris Climate Change Agreement (2015) to cut Green House Gas emissions intensity of its GDP by 33-35%.
ü Central Government initiatives (FAME II, MoRTH’s regulations around EV) are being complemented by State EV Policies.
ü Dual objectives of CAFE regulation and reducing India’s oil imports are also expected to provide impetus to e-mobility.
23
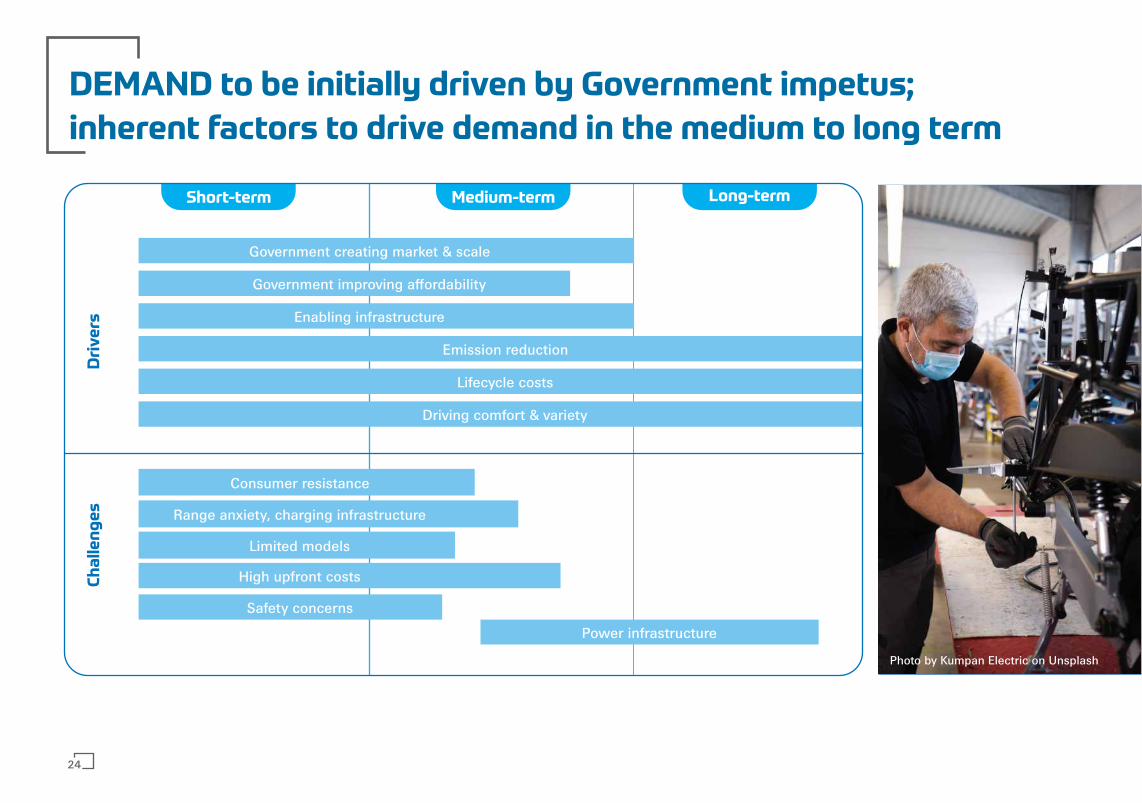
DEMAND to be initially driven by Government impetus;
inherent factors to drive demand in the medium to long term
Short-term Medium-term Long-term
Ch
all
en
ge
s
Government creating market & scale
Government improving affordability
Enabling infrastructure
Emission reduction
Lifecycle costs
Driving comfort & variety
Dri
ve
rs
Consumer resistance
Range anxiety, charging infrastructure
Power infrastructure
Limited models
High upfront costs
Safety concerns
Photo by Kumpan Electric on Unsplash
24
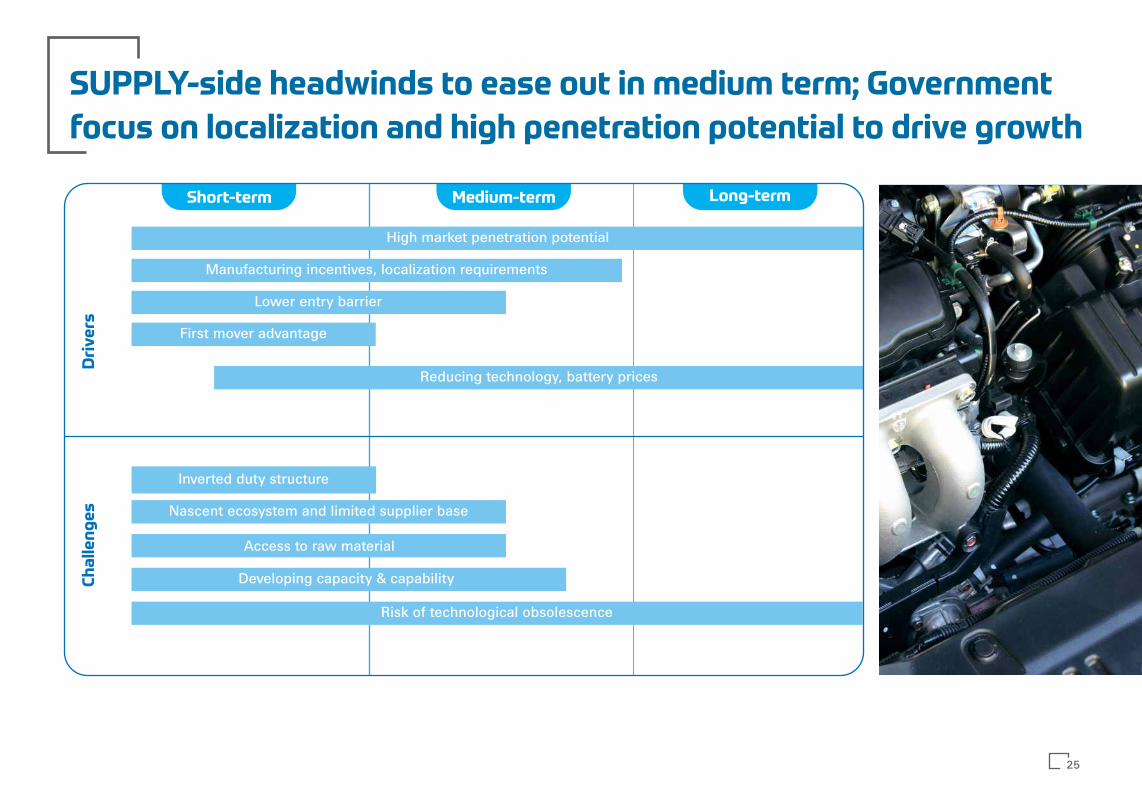
SUPPLY-side headwinds to ease out in medium term; Government
focus on localization and high penetration potential to drive growth
Short-term Medium-term Long-term
Ch
all
en
ge
sD
riv
ers
High market penetration potential
Manufacturing incentives, localization requirements
Inverted duty structure
Lower entry barrier
First mover advantage
Reducing technology, battery prices
Access to raw material
Developing capacity & capability
Risk of technological obsolescence
Nascent ecosystem and limited supplier base
25
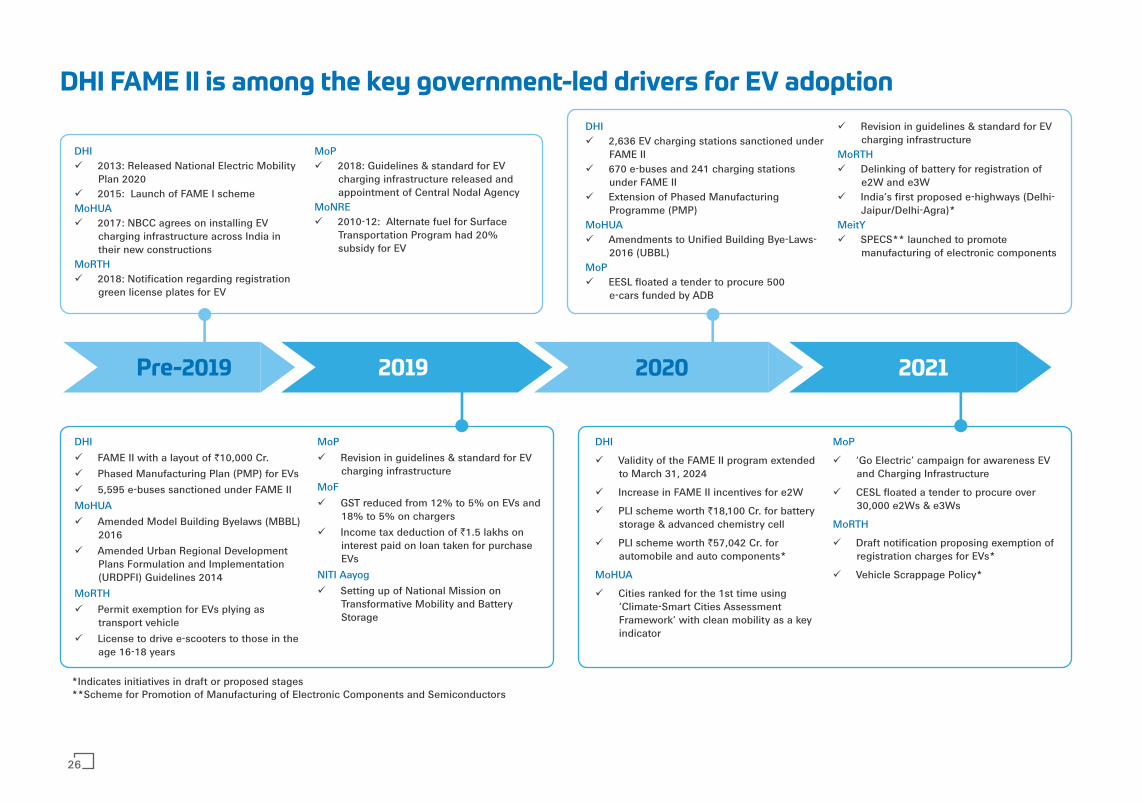
*Indicates initiatives in draft or proposed stages**Scheme for Promotion of Manufacturing of Electronic Components and Semiconductors
Pre-2019 2019 2020 2021
DHI ü 2013: Released National Electric Mobility
Plan 2020ü 2015: Launch of FAME I schemeMoHUAü 2017: NBCC agrees on installing EV
charging infrastructure across India in their new constructions
MoRTHü 2018: Notification regarding registration
green license plates for EV
DHIü 2,636 EV charging stations sanctioned under
FAME IIü 670 e-buses and 241 charging stations
under FAME II ü Extension of Phased Manufacturing
Programme (PMP)MoHUAü Amendments to Unified Building Bye-Laws-
2016 (UBBL)MoPü EESL floated a tender to procure 500
e-cars funded by ADB
ü Revision in guidelines & standard for EV charging infrastructure
MoRTHü Delinking of battery for registration of
e2W and e3Wü India’s first proposed e-highways (Delhi-
Jaipur/Delhi-Agra)*MeitYü SPECS** launched to promote
manufacturing of electronic components
MoPü 2018: Guidelines & standard for EV
charging infrastructure released and appointment of Central Nodal Agency
MoNRE ü 2010-12: Alternate fuel for Surface
Transportation Program had 20% subsidy for EV
DHIü FAME II with a layout of `10,000 Cr. ü Phased Manufacturing Plan (PMP) for EVsü 5,595 e-buses sanctioned under FAME II MoHUAü Amended Model Building Byelaws (MBBL)
2016 ü Amended Urban Regional Development
Plans Formulation and Implementation (URDPFI) Guidelines 2014
MoRTHü Permit exemption for EVs plying as
transport vehicle ü License to drive e-scooters to those in the
age 16-18 years
MoP ü Revision in guidelines & standard for EV
charging infrastructureMoFü GST reduced from 12% to 5% on EVs and
18% to 5% on chargersü Income tax deduction of `1.5 lakhs on
interest paid on loan taken for purchase EVs
NITI Aayogü Setting up of National Mission on
Transformative Mobility and Battery Storage
DHI
ü Validity of the FAME II program extended to March 31, 2024
ü Increase in FAME II incentives for e2W
ü PLI scheme worth `18,100 Cr. for battery storage & advanced chemistry cell
ü PLI scheme worth `57,042 Cr. for automobile and auto components*
MoHUA
ü Cities ranked for the 1st time using ‘Climate-Smart Cities Assessment Framework’ with clean mobility as a key indicator
MoP
ü ‘Go Electric’ campaign for awareness EV and Charging Infrastructure
ü CESL floated a tender to procure over 30,000 e2Ws & e3Ws
MoRTH
ü Draft notification proposing exemption of registration charges for EVs*
ü Vehicle Scrappage Policy*
DHI FAME II is among the key government-led drivers for EV adoption
26
E-Vehicle Segment Opportunity Overview
02
2.1 E-Two Wheeler
2.2 E-Three Wheeler and E-LCV
2.3 E-Four Wheeler
2.4 E-Bus
2.5 Other EV Segments
2.6 Segmental Opportunity Mapping
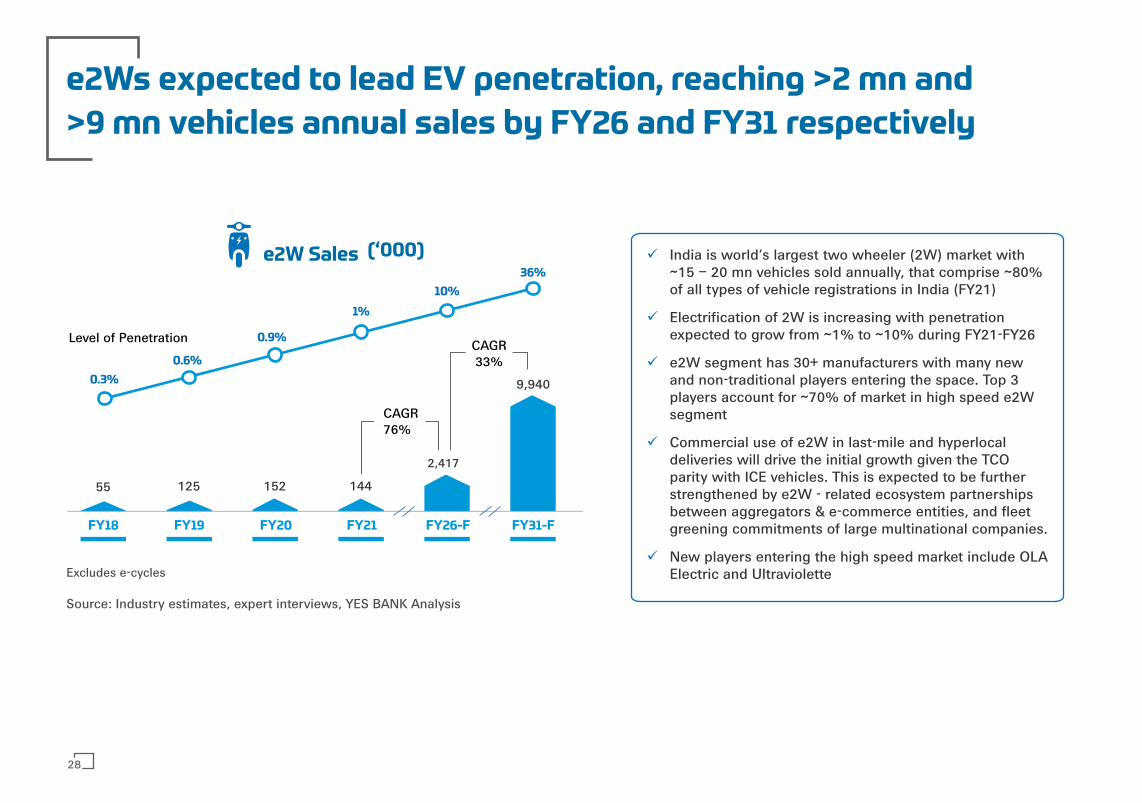
e2Ws expected to lead EV penetration, reaching >2 mn and
>9 mn vehicles annual sales by FY26 and FY31 respectively
Excludes e-cycles
55 125 152 144
2,417
9,940
FY18 FY19 FY20 FY21 FY26-F FY31-F
0.9%
1%
10%
36%
0.6%
0.3%
CAGR76%
CAGR 33%
ü India is world’s largest two wheeler (2W) market with ~15 – 20 mn vehicles sold annually, that comprise ~80% of all types of vehicle registrations in India (FY21)
ü Electrification of 2W is increasing with penetration expected to grow from ~1% to ~10% during FY21-FY26
ü e2W segment has 30+ manufacturers with many new and non-traditional players entering the space. Top 3 players account for ~70% of market in high speed e2W segment
ü Commercial use of e2W in last-mile and hyperlocal deliveries will drive the initial growth given the TCO parity with ICE vehicles. This is expected to be further strengthened by e2W - related ecosystem partnerships between aggregators & e-commerce entities, and fleet greening commitments of large multinational companies.
ü New players entering the high speed market include OLA Electric and Ultraviolette
e2W Sales (‘000)
Level of Penetration
Source: Industry estimates, expert interviews, YES BANK Analysis
28
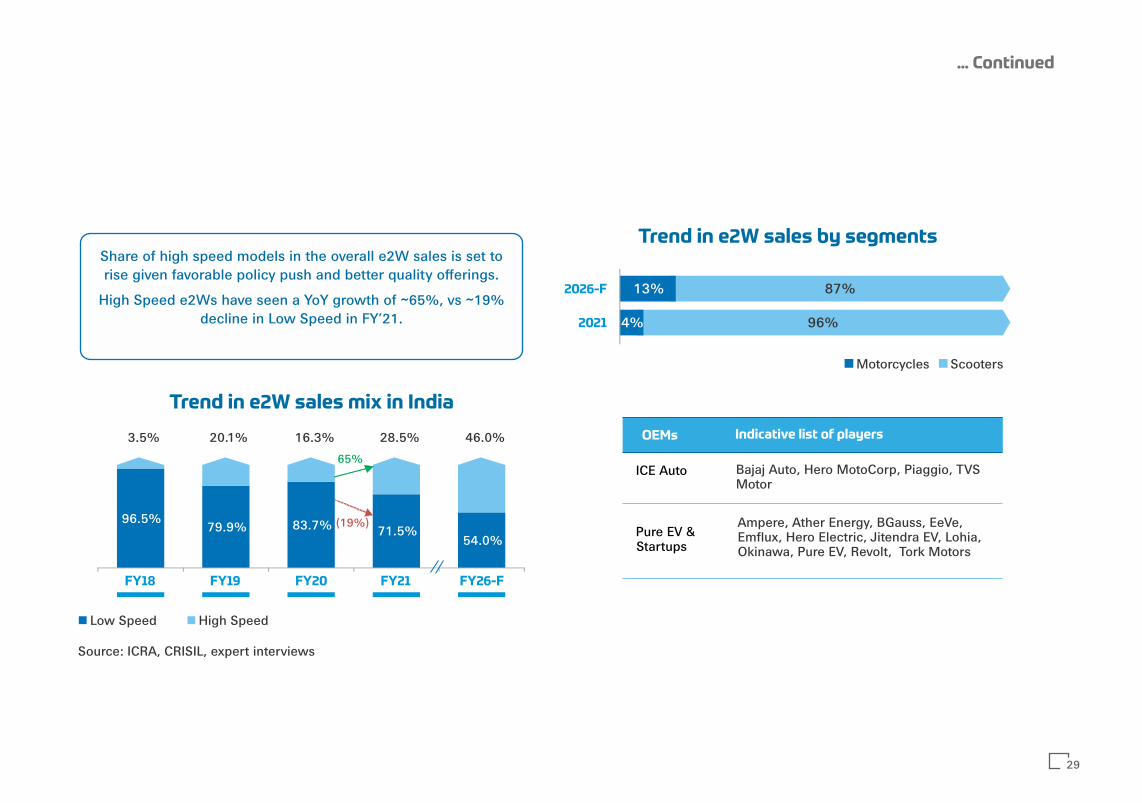
Trend in e2W sales by segments
4%
13%
96%
87%
2021
2026-F
Motorcycles Scooters
OEMs Indicative list of players
ICE Auto
Pure EV & Startups
Bajaj Auto, Hero MotoCorp, Piaggio, TVS Motor
Ampere, Ather Energy, BGauss, EeVe, Emflux, Hero Electric, Jitendra EV, Lohia, Okinawa, Pure EV, Revolt, Tork Motors
96.5%79.9% 83.7% 71.5%
54.0%
3.5% 20.1% 16.3% 28.5% 46.0%
FY18 FY19 FY20 FY21 FY26-F
Low Speed High Speed
Trend in e2W sales mix in India
Source: ICRA, CRISIL, expert interviews
(19%)
65%
Share of high speed models in the overall e2W sales is set to rise given favorable policy push and better quality offerings.
High Speed e2Ws have seen a YoY growth of ~65%, vs ~19% decline in Low Speed in FY’21.
... Continued
29
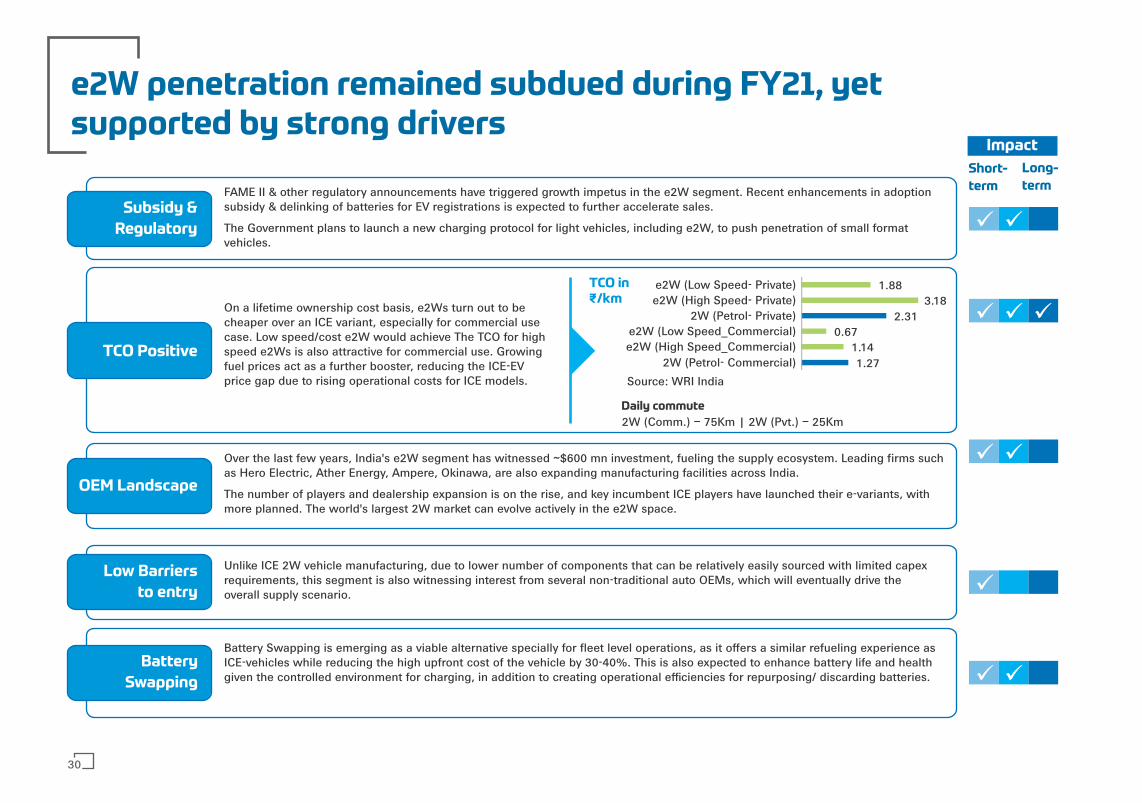
e2W penetration remained subdued during FY21, yet supported by strong drivers
FAME II & other regulatory announcements have triggered growth impetus in the e2W segment. Recent enhancements in adoption subsidy & delinking of batteries for EV registrations is expected to further accelerate sales.
The Government plans to launch a new charging protocol for light vehicles, including e2W, to push penetration of small format vehicles.
On a lifetime ownership cost basis, e2Ws turn out to be cheaper over an ICE variant, especially for commercial use case. Low speed/cost e2W would achieve The TCO for high speed e2Ws is also attractive for commercial use. Growing fuel prices act as a further booster, reducing the ICE-EV price gap due to rising operational costs for ICE models.
Unlike ICE 2W vehicle manufacturing, due to lower number of components that can be relatively easily sourced with limited capex requirements, this segment is also witnessing interest from several non-traditional auto OEMs, which will eventually drive the overall supply scenario.
Battery Swapping is emerging as a viable alternative specially for fleet level operations, as it offers a similar refueling experience as ICE-vehicles while reducing the high upfront cost of the vehicle by 30-40%. This is also expected to enhance battery life and health given the controlled environment for charging, in addition to creating operational efficiencies for repurposing/ discarding batteries.
Subsidy &
Regulatory
TCO Positive
Low Barriers
to entry
Battery
Swapping
ü ü
ü ü ü
ü ü
ü
ü ü
1.271.14
0.672.31
3.181.88
2W (Petrol- Commercial)e2W (High Speed_Commercial)e2W (Low Speed_Commercial)
2W (Petrol- Private)e2W (High Speed- Private)e2W (Low Speed- Private)
Source: WRI India
Daily commute
2W (Comm.) – 75Km | 2W (Pvt.) – 25Km
Over the last few years, India's e2W segment has witnessed ~$600 mn investment, fueling the supply ecosystem. Leading firms such as Hero Electric, Ather Energy, Ampere, Okinawa, are also expanding manufacturing facilities across India.
The number of players and dealership expansion is on the rise, and key incumbent ICE players have launched their e-variants, with more planned. The world's largest 2W market can evolve actively in the e2W space.
Short-
term
Long-
term
OEM Landscape
Impact
TCO in₹/km
30
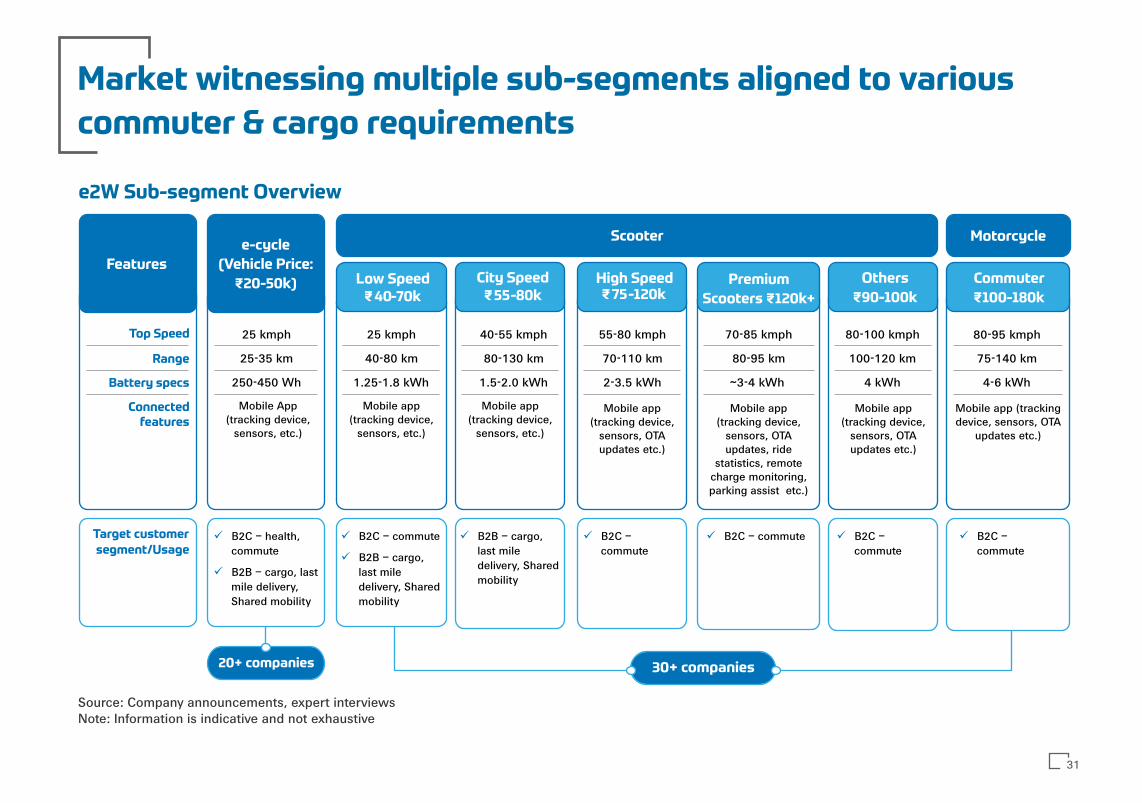
Market witnessing multiple sub-segments aligned to various
commuter & cargo requirements
e2W Sub-segment Overview
Top Speed
Range
Battery specs
Connected features
Target customer
segment/Usage
25 kmph
25-35 km
250-450 Wh
Mobile App (tracking device,
sensors, etc.)
e-cycle
(Vehicle Price:
₹20-50k)
Scooter Motorcycle
Features
25 kmph 40-55 kmph 55-80 kmph 70-85 kmph 80-100 kmph 80-95 kmph
40-80 km 80-130 km 70-110 km 80-95 km 100-120 km 75-140 km
1.25-1.8 kWh 1.5-2.0 kWh 2-3.5 kWh ~3-4 kWh 4 kWh 4-6 kWh
Low Speed₹40-70k
Others
₹90-100k
Commuter
₹100-180k
City Speed₹55-80k
High Speed₹75-120k
Premium
Scooters ₹120k+
Mobile app (tracking device,
sensors, etc.)
Mobile app (tracking device,
sensors, etc.)
Mobile app (tracking device,
sensors, OTA updates etc.)
Mobile app (tracking device,
sensors, OTA updates, ride
statistics, remote charge monitoring, parking assist etc.)
Mobile app (tracking device,
sensors, OTA updates etc.)
Mobile app (tracking device, sensors, OTA
updates etc.)
ü B2C – health, commute
ü B2B – cargo, last mile delivery, Shared mobility
ü B2C – commute
ü B2B – cargo, last mile delivery, Shared mobility
ü B2B – cargo, last mile delivery, Shared mobility
ü B2C – commute
ü B2C – commute ü B2C – commute
ü B2C – commute
20+ companies 30+ companies
Source: Company announcements, expert interviewsNote: Information is indicative and not exhaustive
31
9%
Others (Eg.)
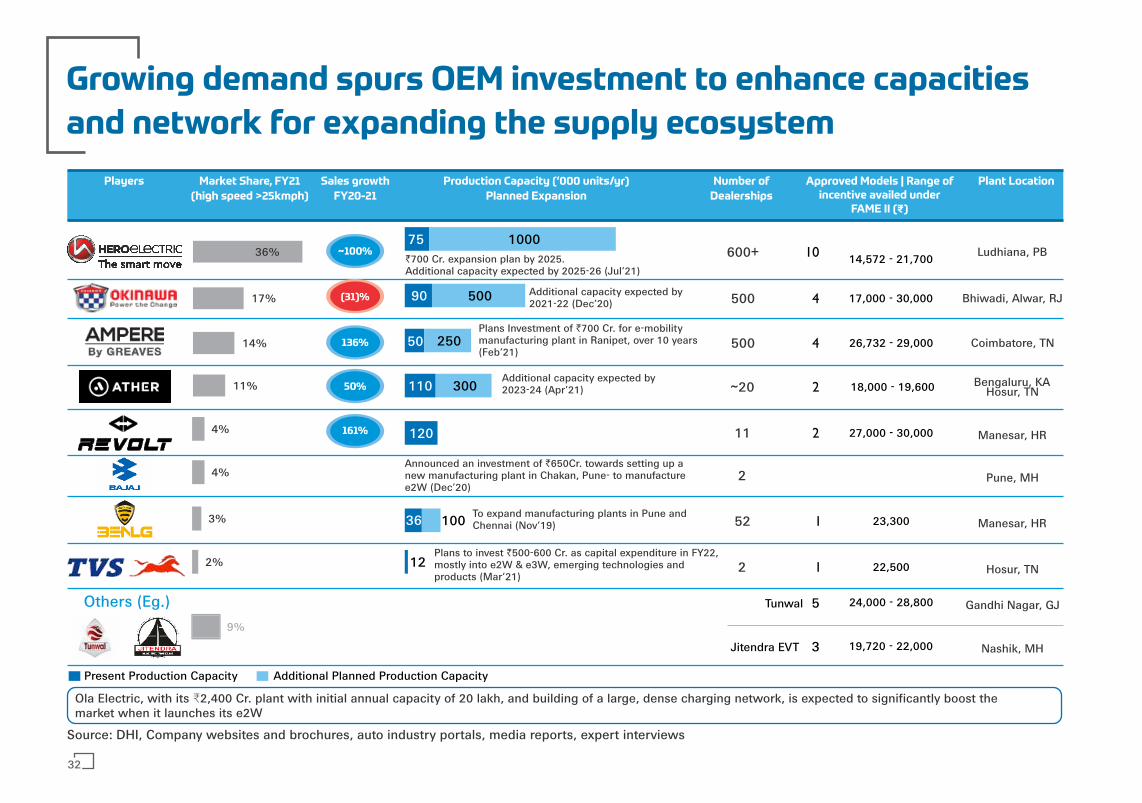
Growing demand spurs OEM investment to enhance capacities
and network for expanding the supply ecosystem
Players Market Share, FY21
(high speed >25kmph)
Production Capacity (‘000 units/yr)
Planned Expansion
Number of
Dealerships
Approved Models | Range of incentive availed under
FAME II (₹)
Plant Location
600+ 10 14,572 - 21,700 Ludhiana, PB
500 4 17,000 - 30,000 Bhiwadi, Alwar, RJ
500 4 26,732 - 29,000 Coimbatore, TN
~20 2 18,000 - 19,600 Bengaluru, KAHosur, TN
11 2 27,000 - 30,000 Manesar, HR
2 Pune, MH
52 1 23,300 Manesar, HR
2 1 22,500 Hosur, TN
5
3
24,000 - 28,800
19,720 - 22,000
Gandhi Nagar, GJ
Nashik, MH
12
36
120
110
50
75
100
300
250
1000
Present Production Capacity Additional Planned Production Capacity
2%
3%
4%
4%
11%
14%
17%
36%
Tunwal
Jitendra EVT
50090
`700 Cr. expansion plan by 2025. Additional capacity expected by 2025-26 (Jul’21)
Additional capacity expected by 2021-22 (Dec’20)
Plans Investment of `700 Cr. for e-mobility manufacturing plant in Ranipet, over 10 years (Feb’21)
Additional capacity expected by 2023-24 (Apr’21)
Announced an investment of `650Cr. towards setting up a new manufacturing plant in Chakan, Pune- to manufacture e2W ( Dec’20)
To expand manufacturing plants in Pune and Chennai (Nov’19)
Plans to invest `500-600 Cr. as capital expenditure in FY22, mostly into e2W & e3W, emerging technologies and products (Mar’21)
~100%
(31)%
136%
50%
161%
Sales growth
FY20-21
Source: DHI, Company websites and brochures, auto industry portals, media reports, expert interviews
Ola Electric, with its ₹2,400 Cr. plant with initial annual capacity of 20 lakh, and building of a large, dense charging network, is expected to significantly boost themarket when it launches its e2W
32

Value Chain Partnerships
Batteries and Charging
Infrastructure
Sales Support Partnership
ü CredR – Hero Electric (exchange of 2W with e2W)
ü cKers Finance -OTO Capital (e2W leasing)
ü Hero Electric – EV Motors (battery & charging)
ü Hero – Gogoro(manufacturing and swapping network)
OEM
Acquisitions
Fleet
Partnerships
ü
ü
Ampere Electric – Bounce (bike rental)Hero Electric – eBikego (fleet scooters)
Traditional Auto & Business House
Investmentsü Hero MotoCorp –
Ather (investment)
ü RR Global – BGauss(launched e2W brand)
ü Ola Electric – Etergo(acquisition)
ü KTM – Bajaj (platform sharing, manufacturing)
ü Voltup – HPCL (swapping stations)
ü Honda, KTM, Piaggio, Yamaha (battery consortium alliance)
ü TVS – CESL (charging infrastructure)
ü Greeves Cotton –Ampere (acquisition)
ü Bharat Forge - TorkMotor (investment)
Segment witnessing strong activity and investment, with several
new entrants, partnerships & funding
33
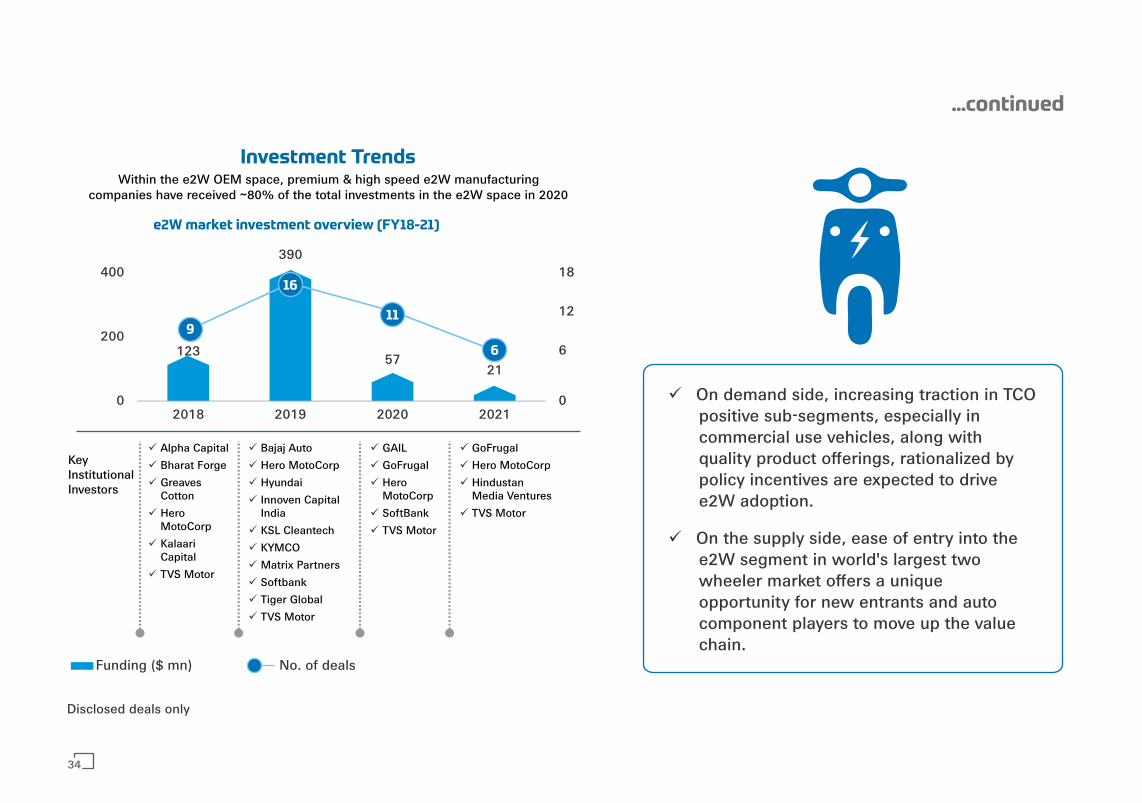
Funding ($ mn)
ü On demand side, increasing traction in TCO positive sub-segments, especially in commercial use vehicles, along with quality product offerings, rationalized by policy incentives are expected to drive e2W adoption.
ü On the supply side, ease of entry into the e2W segment in world's largest two wheeler market offers a unique opportunity for new entrants and auto component players to move up the value chain.
...continued
No. of deals
e2W market investment overview (FY18-21)
Investment Trends
KeyInstitutionalInvestors
123
390
5721
0
6
12
18
0
200
400
2018 2019 2020 2021
Within the e2W OEM space, premium & high speed e2W manufacturing companies have received ~80% of the total investments in the e2W space in 2020
ü Alpha Capital
ü Bharat Forge
ü Greaves Cotton
ü Hero MotoCorp
ü Kalaari Capital
ü TVS Motor
16
911
6
ü Bajaj Auto
ü Hero MotoCorp
ü Hyundai
ü Innoven Capital India
ü KSL Cleantech
ü KYMCO
ü Matrix Partners
ü Softbank
ü Tiger Global
ü TVS Motor
ü GAIL
ü GoFrugal
ü Hero MotoCorp
ü SoftBank
ü TVS Motor
ü GoFrugal
ü Hero MotoCorp
ü Hindustan Media Ventures
ü TVS Motor
Disclosed deals only
34
E-Vehicle Segment Opportunity Overview
02
2.1 E-Two Wheeler
2.2 E-Three Wheeler and E-LCV
2.3 E-Four Wheeler
2.4 E-Bus
2.5 Other EV Segments
2.6 Segmental Opportunity Mapping
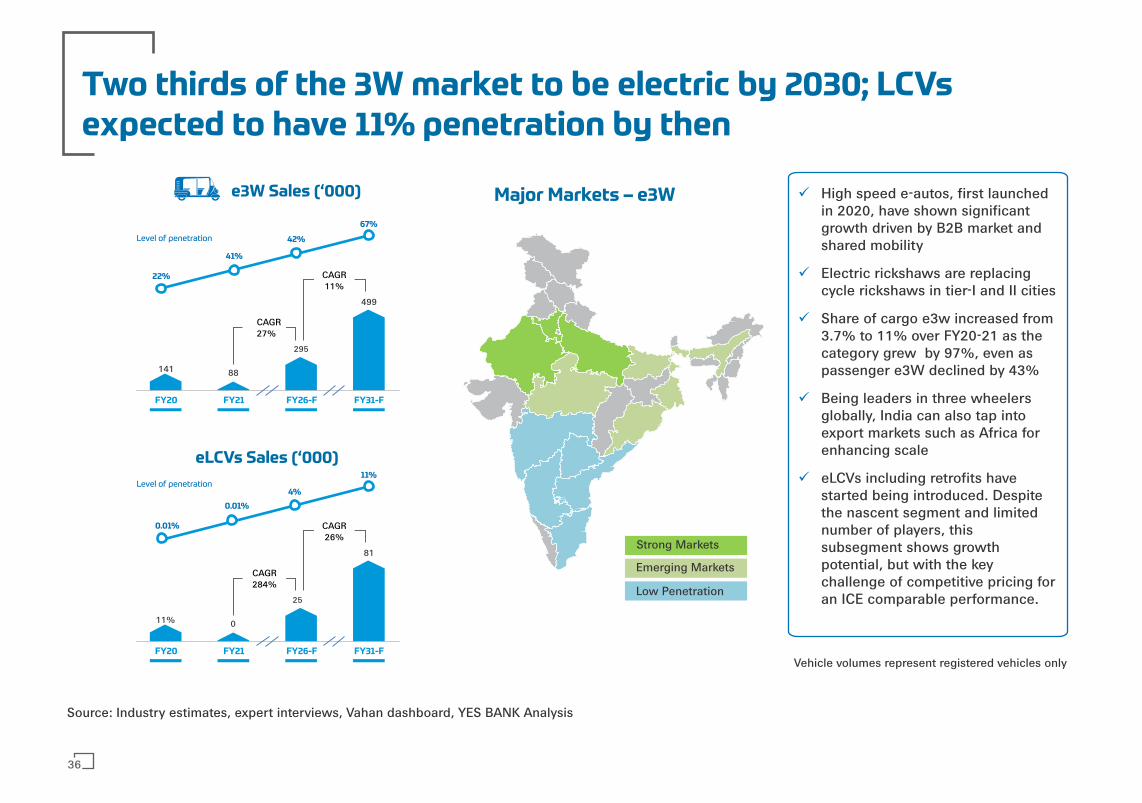
141 88
295
499
FY20 FY21 FY26-F FY31-F
22%
41%
42%
67%
CAGR27%
CAGR11%
ü High speed e-autos, first launched in 2020, have shown significant growth driven by B2B market and shared mobility
ü Electric rickshaws are replacing cycle rickshaws in tier-I and II cities
ü Share of cargo e3w increased from 3.7% to 11% over FY20-21 as the category grew by 97%, even as passenger e3W declined by 43%
ü Being leaders in three wheelers globally, India can also tap into export markets such as Africa for enhancing scale
ü eLCVs including retrofits have started being introduced. Despite the nascent segment and limited number of players, this subsegment shows growth potential, but with the key challenge of competitive pricing for an ICE comparable performance.
Two thirds of the 3W market to be electric by 2030; LCVsexpected to have 11% penetration by then
eLCVs Sales (‘000)
11% 0
25
81
FY20 FY21 FY26-F FY31-F
0.01%
0.01%
4%
11%
CAGR284%
CAGR26%
Major Markets – e3We3W Sales (‘000)
Strong Markets
Level of penetration
Level of penetration
Source: Industry estimates, expert interviews, Vahan dashboard, YES BANK Analysis
Vehicle volumes represent registered vehicles only
Emerging Markets
Low Penetration
36
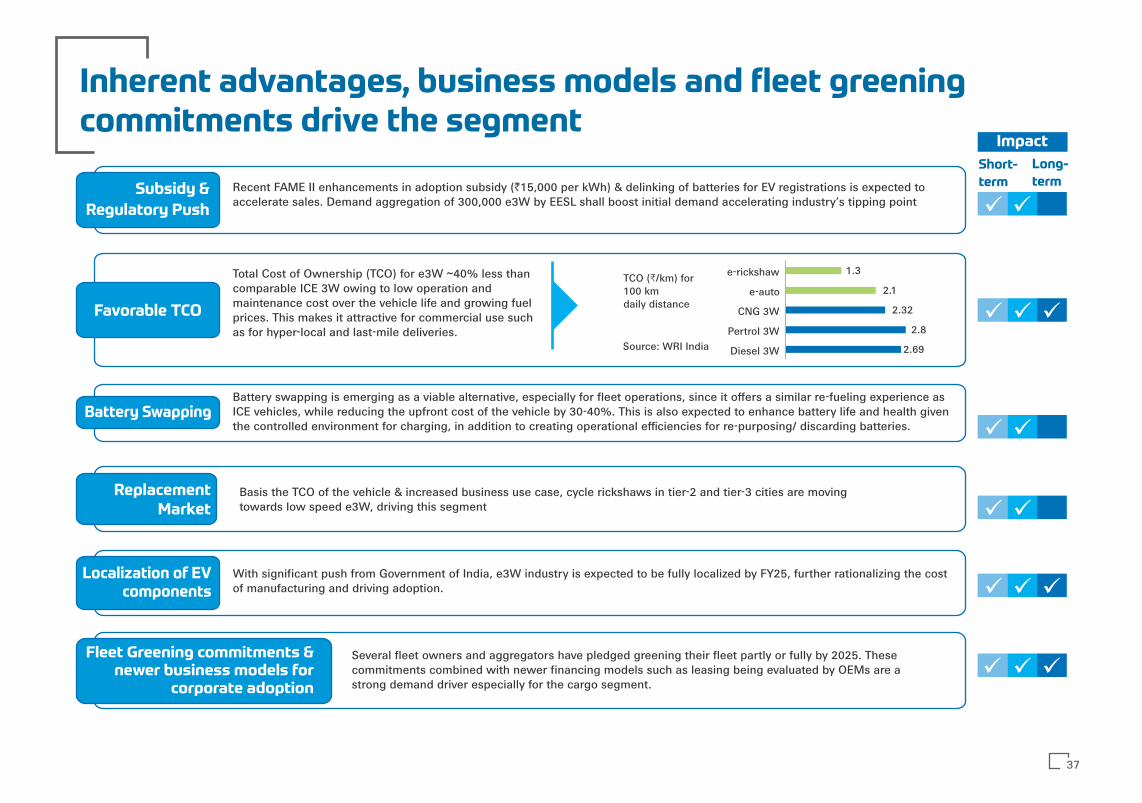
Inherent advantages, business models and fleet greeningcommitments drive the segment
Recent FAME II enhancements in adoption subsidy (`15,000 per kWh) & delinking of batteries for EV registrations is expected to accelerate sales. Demand aggregation of 300,000 e3W by EESL shall boost initial demand accelerating industry’s tipping point
Subsidy &
Regulatory Push ü
ü ü
ü
ü
ü
ü
ü
ü
Total Cost of Ownership (TCO) for e3W ~40% less than comparable ICE 3W owing to low operation and maintenance cost over the vehicle life and growing fuel prices. This makes it attractive for commercial use such as for hyper-local and last-mile deliveries.
Favorable TCO
Source: WRI India
TCO (₹/km) for100 kmdaily distance
Battery swapping is emerging as a viable alternative, especially for fleet operations, since it offers a similar re-fueling experience as ICE vehicles, while reducing the upfront cost of the vehicle by 30-40%. This is also expected to enhance battery life and health given the controlled environment for charging, in addition to creating operational efficiencies for re-purposing/ discarding batteries.
Battery Swapping
Basis the TCO of the vehicle & increased business use case, cycle rickshaws in tier-2 and tier-3 cities are moving towards low speed e3W, driving this segment
ReplacementMarket
With significant push from Government of India, e3W industry is expected to be fully localized by FY25, further rationalizing the cost of manufacturing and driving adoption.
Localization of EVcomponents
2.69
2.8
2.32
2.1
1.3
Diesel 3W
Pertrol 3W
CNG 3W
e-auto
e-rickshaw
ü
üSeveral fleet owners and aggregators have pledged greening their fleet partly or fully by 2025. These commitments combined with newer financing models such as leasing being evaluated by OEMs are a strong demand driver especially for the cargo segment.
Fleet Greening commitments &newer business models for
corporate adoption ü ü
ü
ü
Short-
term
Long-
term
Impact
37
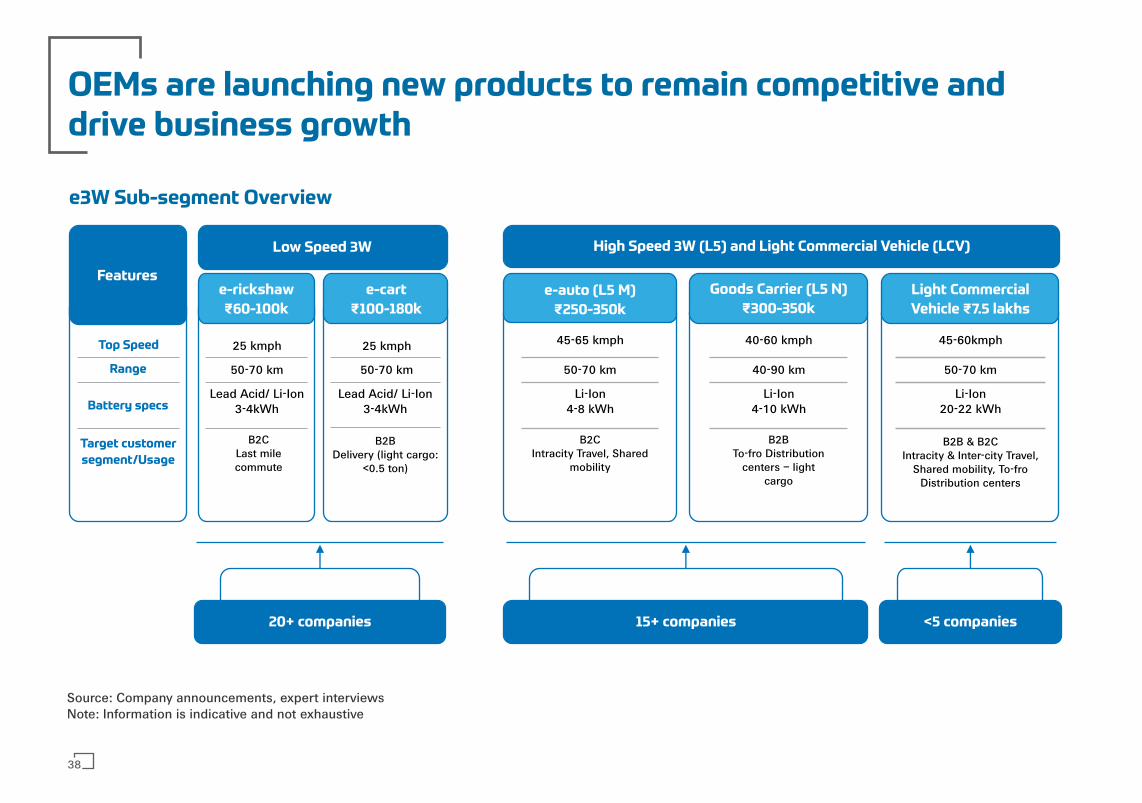
45-65 kmph 40-60 kmph 45-60kmph
50-70 km 40-90 km 50-70 km
Li-Ion4-8 kWh
Li-Ion4-10 kWh
Li-Ion20-22 kWh
e-auto (L5 M)
₹250-350k
Goods Carrier (L5 N)
₹300-350k
Light Commercial
Vehicle ₹7.5 lakhs
B2CIntracity Travel, Shared
mobility
B2BTo-fro Distribution
centers – light cargo
B2B & B2CIntracity & Inter-city Travel,
Shared mobility, To-fro Distribution centers
OEMs are launching new products to remain competitive anddrive business growth
e3W Sub-segment Overview
Top Speed
Range
Battery specs
Target customer
segment/Usage
25 kmph
50-70 km
Lead Acid/ Li-Ion3-4kWh
B2CLast milecommute
Low Speed 3W High Speed 3W (L5) and Light Commercial Vehicle (LCV)
Features
25 kmph
50-70 km
Lead Acid/ Li-Ion3-4kWh
e-cart
₹100-180k
B2BDelivery (light cargo:
<0.5 ton)
e-rickshaw
₹60-100k
20+ companies 15+ companies <5 companies
Source: Company announcements, expert interviewsNote: Information is indicative and not exhaustive
38

Though unorganized players abound; higher end e3W are
dominated by a few start-ups, and large OEMs
Top Player Present OEM Production
capacity ('000 units/yr) Approved Models Plant Location
Pune , MH
Pune, MH
Mumbai , MH
New Delhi
New Delhi
Jhajjar, HR
Rajkot, GJ
New Delhi
Hyderabad
12
25
72
350Ape E city, Ape E city fx, Ape E-xtra Fx PU, Ape ExtraFx, Ape ExtraLx, Ape E-Xtra LX PU, Ape E-xtra LX DAC, Ape E-xtra fx DAU
725
60
43
NA
100+
No of dealers
85
18
45
NA
8
5
7
1
3
4
2
3
3
Safar Smart LFP, Safar Shakti, Safar Smart, Safar Star, Safar Jumbo
Treo Yaari HRT, Treo HRT, Treo SFT, Treo Yaari SFT, Treo Zor, Treo Zor FB, Treo Zor DV
Rage +
Narain I, Narain iCE, Humafar iB
Victory Vikrant, Victory+, Victory Bhim, Victory Bhim Cleaner
Atul Elite + , Atul Elite Cargo
Saarthi Shavak Auto, Saarthi Shavak DLX E, Saarthi F2
Touro Max Loader, Touro Mini Loader, Touro Mini Passenger
42k - 78k
34k - 82k
34k - 74k
38k - 42k
42k
37k - 66k
38k - 73k
Established players such as Piaggio and Mahindra along with new entrants such as Etrio are availing subsidies by Government of India to push newer e3W models
Number of
FAME II approved
Models
Range of incentive
availed under FAME II (`)
Source: DHI, Company websites and brochures, auto industry portals, media reports, expert interviews
39
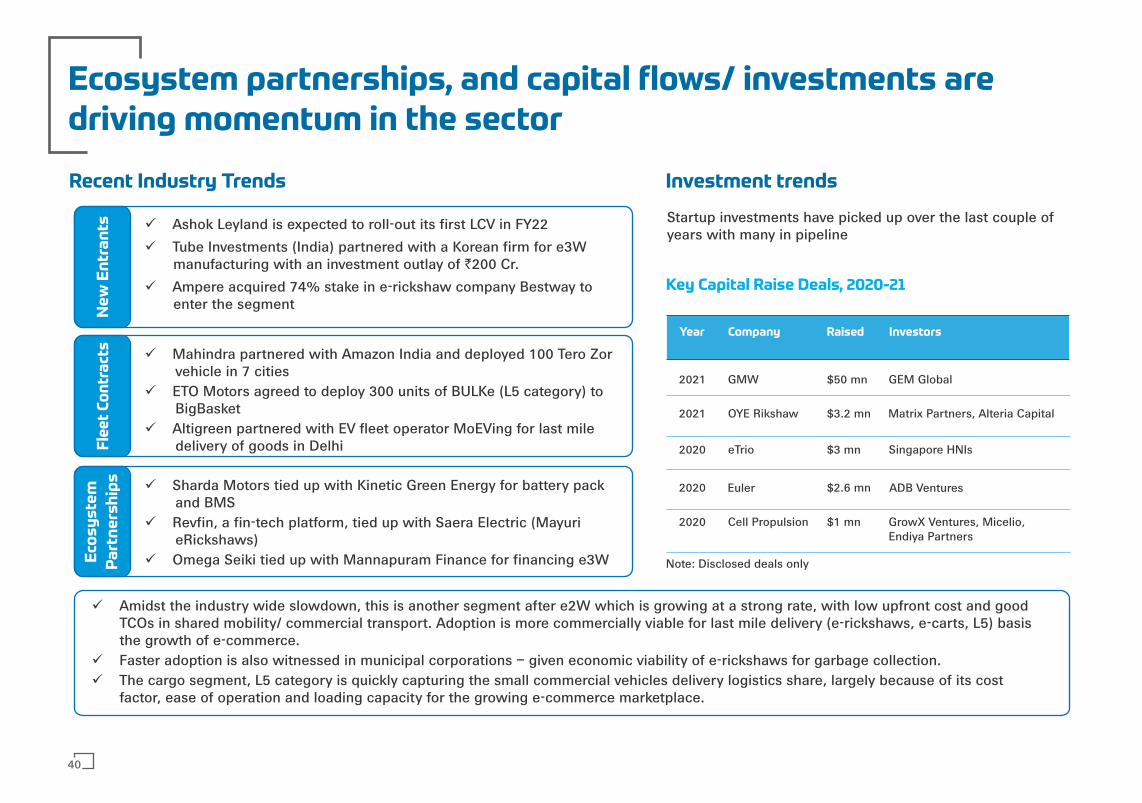
Ecosystem partnerships, and capital flows/ investments aredriving momentum in the sector
Recent Industry Trends
ü Amidst the industry wide slowdown, this is another segment after e2W which is growing at a strong rate, with low upfront cost and good TCOs in shared mobility/ commercial transport. Adoption is more commercially viable for last mile delivery (e-rickshaws, e-carts, L5) basis the growth of e-commerce.
ü Faster adoption is also witnessed in municipal corporations – given economic viability of e-rickshaws for garbage collection.ü The cargo segment, L5 category is quickly capturing the small commercial vehicles delivery logistics share, largely because of its cost
factor, ease of operation and loading capacity for the growing e-commerce marketplace.
Investment trends
Startup investments have picked up over the last couple of years with many in pipeline
Key Capital Raise Deals, 2020-21
Year Company Raised Investors
2021 GMW $50 mn GEM Global
2021 OYE Rikshaw $3.2 mn Matrix Partners, Alteria Capital
2020 eTrio $3 mn Singapore HNIs
2020 Euler $2.6 mn ADB Ventures
2020 Cell Propulsion $1 mn GrowX Ventures, Micelio,Endiya Partners
Ne
w E
ntr
an
ts ü Ashok Leyland is expected to roll-out its first LCV in FY22
ü Tube Investments (India) partnered with a Korean firm for e3W manufacturing with an investment outlay of `200 Cr.
ü Ampere acquired 74% stake in e-rickshaw company Bestway to enter the segment
Fle
et
Co
ntr
act
s
ü Mahindra partnered with Amazon India and deployed 100 Tero Zor vehicle in 7 cities
ü ETO Motors agreed to deploy 300 units of BULKe (L5 category) to BigBasket
ü Altigreen partnered with EV fleet operator MoEVing for last mile delivery of goods in Delhi
Eco
sy
ste
m
Pa
rtn
ers
hip
s
ü Sharda Motors tied up with Kinetic Green Energy for battery pack and BMS
ü Revfin, a fin-tech platform, tied up with Saera Electric (Mayuri eRickshaws)
ü Omega Seiki tied up with Mannapuram Finance for financing e3W Note: Disclosed deals only
40

E-Vehicle Segment Opportunity Overview
02
2.1 E-Two Wheeler
2.2 E-Three Wheeler and E-LCV
2.3 E-Four Wheeler
2.4 E-Bus
2.5 Other EV Segments
2.6 Segmental Opportunity Mapping
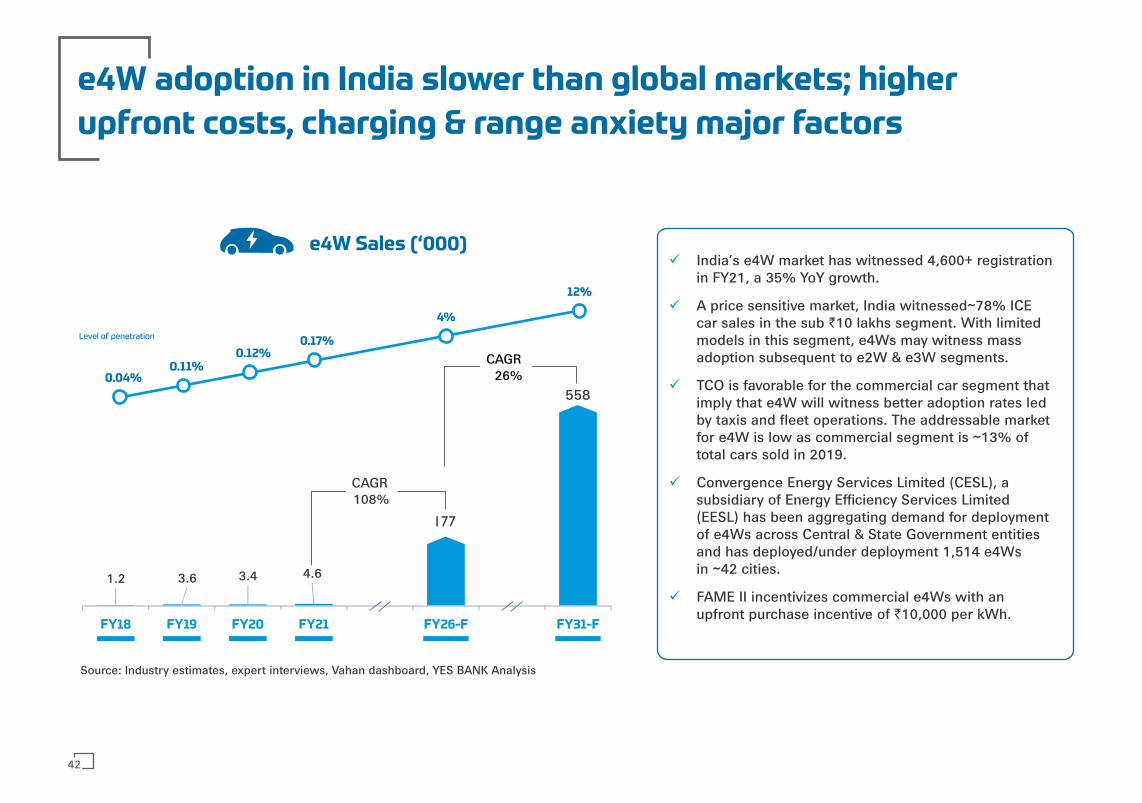
e4W adoption in India slower than global markets; higher
upfront costs, charging & range anxiety major factors
e4W Sales (‘000)ü India’s e4W market has witnessed 4,600+ registration
in FY21, a 35% YoY growth.
ü A price sensitive market, India witnessed~78% ICE car sales in the sub `10 lakhs segment. With limited models in this segment, e4Ws may witness mass adoption subsequent to e2W & e3W segments.
ü TCO is favorable for the commercial car segment that imply that e4W will witness better adoption rates led by taxis and fleet operations. The addressable market for e4W is low as commercial segment is ~13% of total cars sold in 2019.
ü Convergence Energy Services Limited (CESL), a subsidiary of Energy Efficiency Services Limited (EESL) has been aggregating demand for deployment of e4Ws across Central & State Government entities and has deployed/under deployment 1,514 e4Ws in ~42 cities.
ü FAME II incentivizes commercial e4Ws with an upfront purchase incentive of `10,000 per kWh.
Source: Industry estimates, expert interviews, Vahan dashboard, YES BANK Analysis
1.2 3.6 3.4 4.6
177
558
FY18 FY19 FY20 FY21 FY26-F FY31-F
0.04%0.11%
0.12%0.17%
4%
12%
CAGR 108%
CAGR 26%
Level of penetration
42
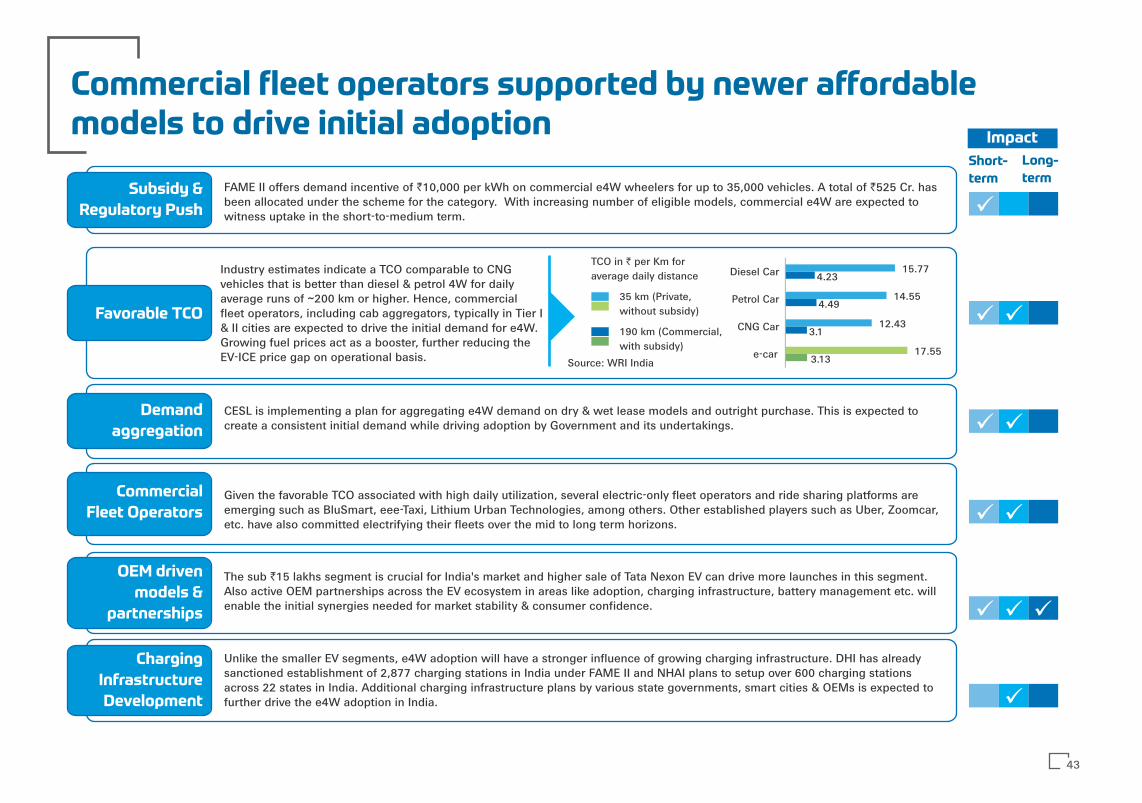
Commercial fleet operators supported by newer affordablemodels to drive initial adoption
FAME II offers demand incentive of `10,000 per kWh on commercial e4W wheelers for up to 35,000 vehicles. A total of `525 Cr. has been allocated under the scheme for the category. With increasing number of eligible models, commercial e4W are expected to witness uptake in the short-to-medium term.
Subsidy &
Regulatory Push ü
ü ü
ü
ü
ü
ü
ü
ü
ü
Industry estimates indicate a TCO comparable to CNG vehicles that is better than diesel & petrol 4W for daily average runs of ~200 km or higher. Hence, commercial fleet operators, including cab aggregators, typically in Tier I & II cities are expected to drive the initial demand for e4W.Growing fuel prices act as a booster, further reducing the EV-ICE price gap on operational basis.
Favorable TCO
3.13
3.1
4.49
4.23
17.55
12.43
14.55
15.77
e-car
CNG Car
Petrol Car
Diesel Car
Source: WRI India
TCO in ` per Km for average daily distance
35 km (Private, without subsidy)
190 km (Commercial, with subsidy)
CESL is implementing a plan for aggregating e4W demand on dry & wet lease models and outright purchase. This is expected to create a consistent initial demand while driving adoption by Government and its undertakings.
Demand
aggregation
Given the favorable TCO associated with high daily utilization, several electric-only fleet operators and ride sharing platforms are emerging such as BluSmart, eee-Taxi, Lithium Urban Technologies, among others. Other established players such as Uber, Zoomcar, etc. have also committed electrifying their fleets over the mid to long term horizons.
Commercial
Fleet Operators
The sub `15 lakhs segment is crucial for India's market and higher sale of Tata Nexon EV can drive more launches in this segment. Also active OEM partnerships across the EV ecosystem in areas like adoption, charging infrastructure, battery management etc. will enable the initial synergies needed for market stability & consumer confidence.
OEM driven
models &
partnerships
Unlike the smaller EV segments, e4W adoption will have a stronger influence of growing charging infrastructure. DHI has already sanctioned establishment of 2,877 charging stations in India under FAME II and NHAI plans to setup over 600 charging stations across 22 states in India. Additional charging infrastructure plans by various state governments, smart cities & OEMs is expected to further drive the e4W adoption in India.
Charging
Infrastructure
Development
ü
Short-
term
Long-
term
Impact
43
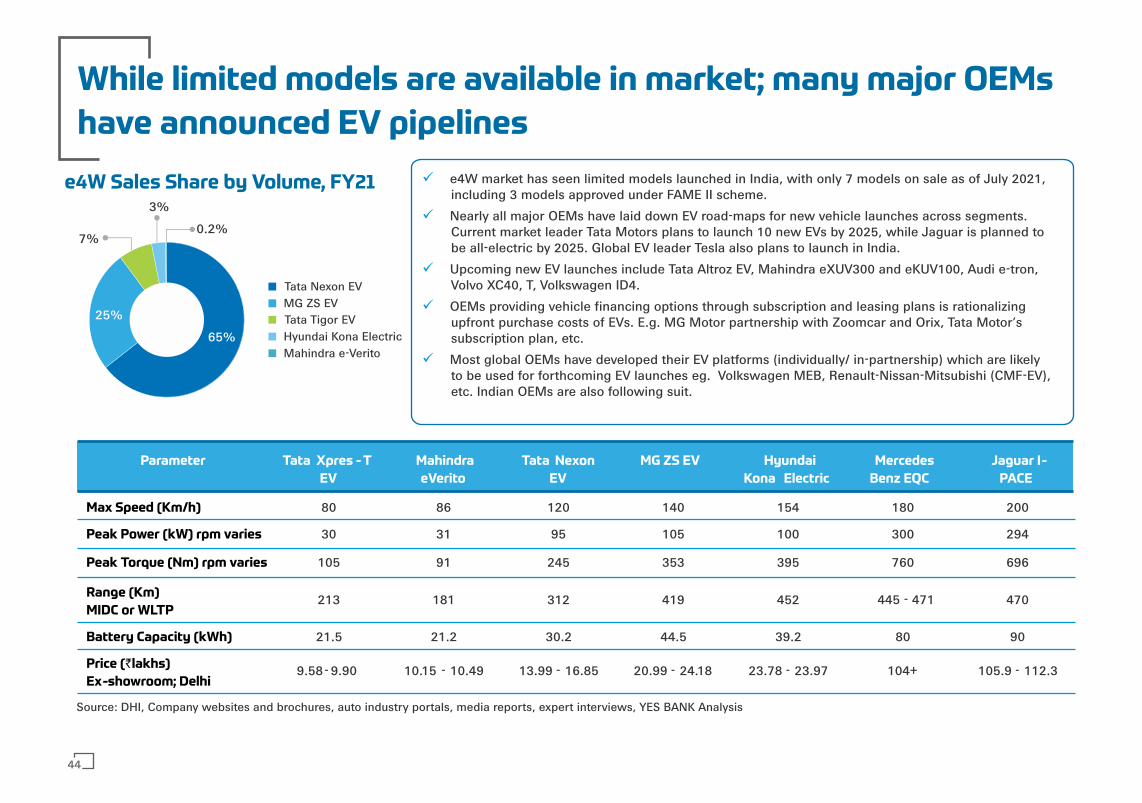
While limited models are available in market; many major OEMs
have announced EV pipelines
ü e4W market has seen limited models launched in India, with only 7 models on sale as of July 2021, including 3 models approved under FAME II scheme.
ü Nearly all major OEMs have laid down EV road-maps for new vehicle launches across segments. Current market leader Tata Motors plans to launch 10 new EVs by 2025, while Jaguar is planned to be all-electric by 2025. Global EV leader Tesla also plans to launch in India.
ü Upcoming new EV launches include Tata Altroz EV, Mahindra eXUV300 and eKUV100, Audi e-tron, Volvo XC40, T, Volkswagen ID4.
ü OEMs providing vehicle financing options through subscription and leasing plans is rationalizing upfront purchase costs of EVs. E.g. MG Motor partnership with Zoomcar and Orix, Tata Motor’s subscription plan, etc.
ü Most global OEMs have developed their EV platforms (individually/ in-partnership) which are likely to be used for forthcoming EV launches eg. Volkswagen MEB, Renault-Nissan-Mitsubishi (CMF-EV), etc. Indian OEMs are also following suit.
e4W Sales Share by Volume, FY21
Parameter Tata Xpres - T
EV
Mahindra
eVerito
Tata Nexon
EV
MG ZS EV Hyundai
Kona Electric
Mercedes
Benz EQC
Jaguar I-
PACE
Max Speed (Km/h) 80 86 120 140 154 180 200
Peak Power (kW) rpm varies 30 31 95 105 100 300 294
Peak Torque (Nm) rpm varies 105 91 245 353 395 760 696
Range (Km)
MIDC or WLTP213 181 312 419 452 445 - 471 470
Battery Capacity (kWh) 21.5 21.2 30.2 44.5 39.2 80 90
Price (`lakhs)
Ex-showroom; Delhi9.58 - 9.90 10.15 - 10.49 13.99 - 16.85 20.99 - 24.18 23.78 - 23.97 104+ 105.9 - 112.3
65%
25%
7%
3%
0.2%
Tata Nexon EVMG ZS EVTata Tigor EVHyundai Kona ElectricMahindra e-Verito
Source: DHI, Company websites and brochures, auto industry portals, media reports, expert interviews, YES BANK Analysis
44
E-Vehicle Segment Opportunity Overview
02
2.1 E-Two Wheeler
2.2 E-Three Wheeler and E-LCV
2.3 E-Four Wheeler
2.4 E-Bus
2.5 Other EV Segments
2.6 Segmental Opportunity Mapping
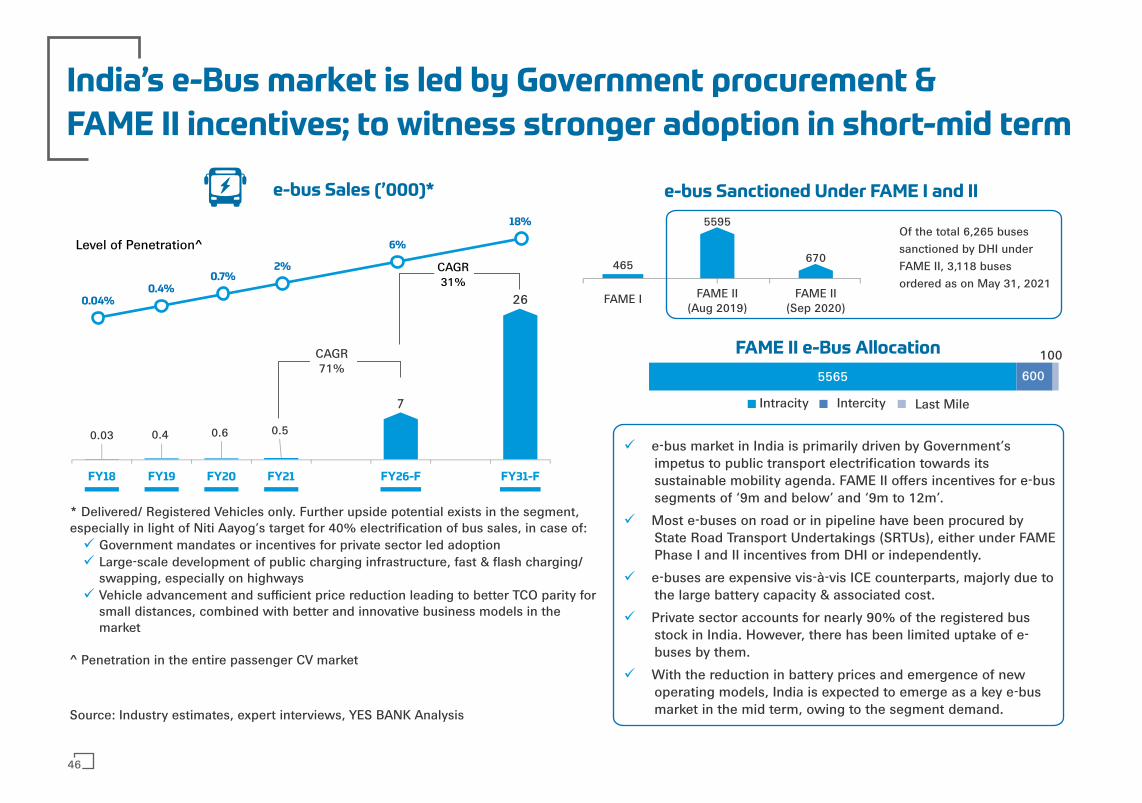
India’s e-Bus market is led by Government procurement &
FAME II incentives; to witness stronger adoption in short-mid term
e-bus Sales (’000)*
ü e-bus market in India is primarily driven by Government’s impetus to public transport electrification towards its sustainable mobility agenda. FAME II offers incentives for e-bus segments of ‘9m and below’ and ‘9m to 12m’.
ü Most e-buses on road or in pipeline have been procured by State Road Transport Undertakings (SRTUs), either under FAME Phase I and II incentives from DHI or independently.
ü e-buses are expensive vis-à-vis ICE counterparts, majorly due to the large battery capacity & associated cost.
ü Private sector accounts for nearly 90% of the registered bus stock in India. However, there has been limited uptake of e-buses by them.
ü With the reduction in battery prices and emergence of new operating models, India is expected to emerge as a key e-bus market in the mid term, owing to the segment demand.Source: Industry estimates, expert interviews, YES BANK Analysis
0.03 0.4 0.6 0.5
7
26
FY18 FY19 FY20 FY21 FY26-F FY31-F
0.04%0.4%
0.7%2%
6%
18%
CAGR 71%
CAGR 31%
5565 600
100
Intracity Intercity Last Mile
Level of Penetration^
FAME II e-Bus Allocation
* Delivered/ Registered Vehicles only. Further upside potential exists in the segment, especially in light of Niti Aayog’s target for 40% electrification of bus sales, in case of:ü Government mandates or incentives for private sector led adoptionü Large-scale development of public charging infrastructure, fast & flash charging/
swapping, especially on highwaysü Vehicle advancement and sufficient price reduction leading to better TCO parity for
small distances, combined with better and innovative business models in the market
^ Penetration in the entire passenger CV market
465
FAME I FAME II(Aug 2019)
FAME II(Sep 2020)
5595
670
Of the total 6,265 buses sanctioned by DHI under FAME II, 3,118 buses ordered as on May 31, 2021
e-bus Sanctioned Under FAME I and II
46
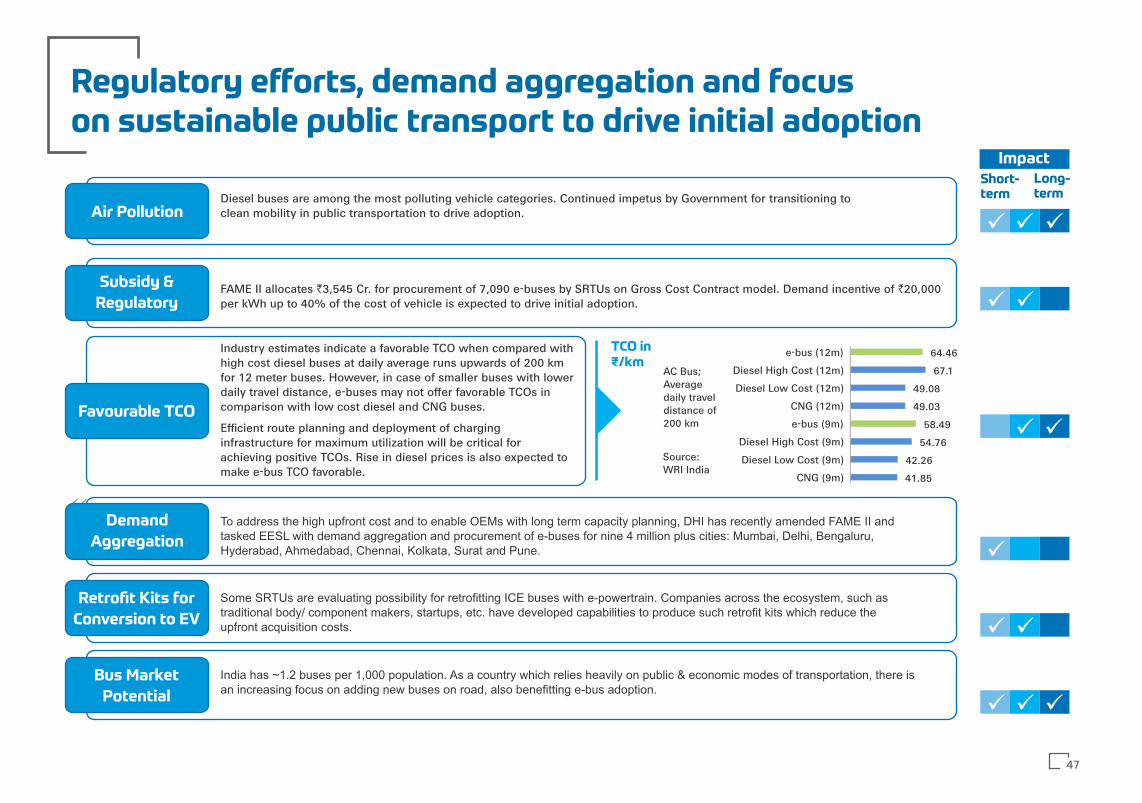
Regulatory efforts, demand aggregation and focuson sustainable public transport to drive initial adoption
Diesel buses are among the most polluting vehicle categories. Continued impetus by Government for transitioning to clean mobility in public transportation to drive adoption.
ü
ü üFAME II allocates `3,545 Cr. for procurement of 7,090 e-buses by SRTUs on Gross Cost Contract model. Demand incentive of `20,000 per kWh up to 40% of the cost of vehicle is expected to drive initial adoption.
Source:WRI India
AC Bus; Average daily travel distance of 200 km
Industry estimates indicate a favorable TCO when compared with high cost diesel buses at daily average runs upwards of 200 km for 12 meter buses. However, in case of smaller buses with lower daily travel distance, e-buses may not offer favorable TCOs in comparison with low cost diesel and CNG buses.
Efficient route planning and deployment of charging infrastructure for maximum utilization will be critical for achieving positive TCOs. Rise in diesel prices is also expected to make e-bus TCO favorable. 41.85
42.26
54.76
58.49
49.03
49.08
67.1
64.46
CNG (9m)
Diesel Low Cost (9m)
Diesel High Cost (9m)
e-bus (9m)
CNG (12m)
Diesel Low Cost (12m)
Diesel High Cost (12m)
e-bus (12m)
ü ü
ü
To address the high upfront cost and to enable OEMs with long term capacity planning, DHI has recently amended FAME II and tasked EESL with demand aggregation and procurement of e-buses for nine 4 million plus cities: Mumbai, Delhi, Bengaluru, Hyderabad, Ahmedabad, Chennai, Kolkata, Surat and Pune.
ü ü
Some SRTUs are evaluating possibility for retrotting ICE buses with e-powertrain. Companies across the ecosystem, such as traditional body/ component makers, startups, etc. have developed capabilities to produce such retrot kits which reduce the upfront acquisition costs.
ü ü
India has ~1.2 buses per 1,000 population. As a country which relies heavily on public & economic modes of transportation, there is an increasing focus on adding new buses on road, also benetting e-bus adoption.
ü ü
ü
Short-term
Long-term
Impact
TCO in₹/km
Air Pollution
Subsidy &
Regulatory
Favourable TCO
Demand
Aggregation
Retrofit Kits for
Conversion to EV
Bus Market
Potential
47

OEMs forging JVs and technical partnerships to develop
capabilities & product offerings
ü Most incumbent OEMs have formed JV/ technical partnerships to develop capabilities, esp.in powertrain, power electronics and battery space.
ü OEMs, such as JBM Auto, have developed dedicated platform for e-buses while others haveintegrated e-powertrain to their existing platforms, such as Tata Motors (Starbus Ultra) &VECV (Skyline Pro).
ü 'Green' funds are supporting this space - Mytrah Mobility received an investment of $1 bn in2019 from Green Climate Fund as a loan, GreenCell Mobility (EverSource Capital backed) haspartnered Mytrah Mobility & also invested in PMI Electro Mobility consortium to deploy e-buses in Rajasthan and Uttar Pradesh, respectively.
ü ICE to EV conversion through retrofit kits is also witnessing action. SRTUs from Telanganaand Andhra Pradesh are in the process of pilot projects. Players such as Sun Mobility,Precision Camshatfs (Emoss) have entered the conversion space.
OEM Partner 9m and below: Range | Top Speed
Ashok Leyland Sun Mobility, ABB
JBM AutoManufacturing Solaris
Mytrah Mobility (Mozev)Product specific partnerships
Low floor bus: Skywell
Olectra BYD
PMI Electro Mobility Solutions Foton
Tata Motors
Min. Range (km) AC/Non AC 120/140
Max. Electric EnergyConsumption(kWh/100 km)
9m and below: <100above 9m and up to12m: <140
Min. Max. Speed (km / hr)
2Min. Acceleration (m/s ) 0.8
Min. Gradeability (Degree) 9.7 (17%)
FAME II e-Bus Model Eligibility Criteria
70
9 - 12m: Range | Top Speed
VE Commercial Vehicles (VECV) KPIT
50 - 120 km | 75 kmph
150 - 200 km | 75 kmph
-
200 - 300 km | 70 - 80 kmph
168 km | -
> 150 km | 75 kmph
177 km | -
50 - 120 km | 75 kmph
150 - 200 km | 75 kmph
300 km | 100 kmph
144 km | -
150 - 200 km | 65 - 75 kmph
Manufacturing Location
Alwar, Viralimalai
Faridabad and Kosi
Jaipur
Hyderabad
Daruhera
Dharwad
Indore
Note: Information is indicative and not exhaustiveSource: Company announcements, expert interviews
48
E-Vehicle Segment Opportunity Overview
02
2.1 E-Two Wheeler
2.2 E-Three Wheeler and E-LCV
2.3 E-Four Wheeler
2.4 E-Bus
2.5 Other EV Segments
2.6 Segmental Opportunity Mapping

Tractors, agricultural equipment, heavy commercial vehicles
and boats to witness electrification in mid-to-long term
ü Sonalika Group launched an e-tractor 'Tiger Electric' in 2021
ü Escorts e-tractor Farmtrac (26E) received CMVR certificate in January 2021 - first for e-tractors in India; commercial launch expected soon
ü Cellestial e-mobility unveiled its e-tractor; Recently raised $35mn Pre-series A funding
Category Company
Tightening emission regulations and need for better fuel efficiencies has introduced a potential opportunity for electrifying heavy commercial vehicles, agricultural and off-highway vehicles in India. The segments are expected to benefit from increasing number of players and product offerings, combined with tapering prices due to declining battery costs & favourable TCOs.
Agricultural
Category
ü Launched a three-wheel electric variant of its Bravo Forklift Truck namely Bravo Forklift for the 1.6 to 2 tonne category
Material
Handling
ü Daimler India Commercial Vehicle (DICV) to launch of an electric truck in the Indian market in 2021
ü Triton to setup in Telangana with an investment of `2,100 Cr.; product launch is expected in Apr 2022
ü Tata Motors to launch own commercial electric truck, the Tata Ultra T.7
Heavy
Commercial
Vehicle
ü Cochin Shipyard launched its first electric ferry in March 2021, for which Siemens Energy is supplying drive and battery components.
ü Navalt Solar & Electric Boats manufactures Aditya- India’s first solar ferry/boat | Running cost for a day is `180 vs `8,000 per day for a diesel ferry
Electric
Boat
Key Developments
50
E-Vehicle Segment Opportunity Overview
02
2.1 E-Two Wheeler
2.2 E-Three Wheeler and E-LCV
2.3 E-Four Wheeler
2.4 E-Bus
2.5 Other EV Segments
2.6 Segmental Opportunity Mapping
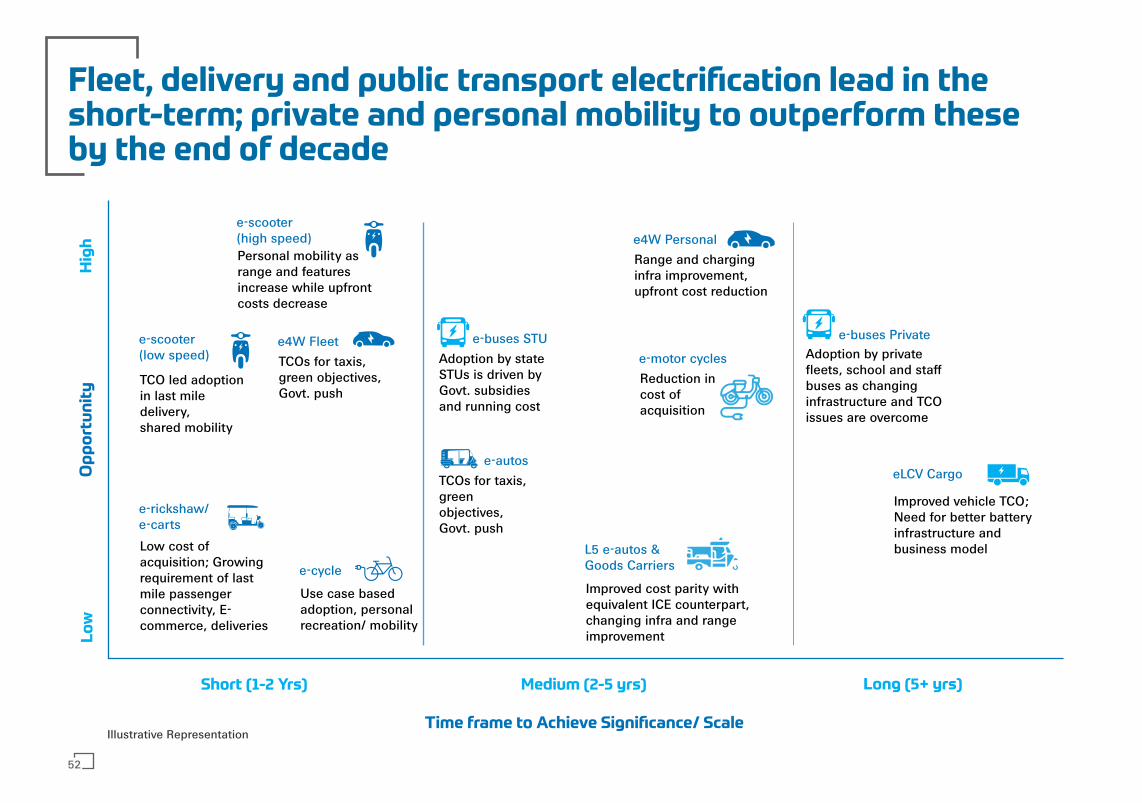
Fleet, delivery and public transport electrification lead in the short-term; private and personal mobility to outperform theseby the end of decade
Lo
wH
igh
e-scooter(high speed)
Op
po
rtu
nit
y
e-scooter(low speed)
TCO led adoption in last mile delivery, shared mobility
e4W Fleet
e-rickshaw/e-carts
Low cost of acquisition; Growing requirement of last mile passenger connectivity, E-commerce, deliveries
e-autosTCOs for taxis, green objectives, Govt. push
e-buses STUAdoption by state STUs is driven by Govt. subsidies and running cost
e-cycle
L5 e-autos &Goods Carriers
Improved cost parity with equivalent ICE counterpart, changing infra and range improvement
e4W PersonalRange and charging infra improvement, upfront cost reduction
e-motor cyclesReduction in cost of acquisition
e-buses PrivateAdoption by private fleets, school and staff buses as changing infrastructure and TCO issues are overcome
eLCV Cargo
Improved vehicle TCO; Need for better battery infrastructure and business model
Short (1-2 Yrs) Medium (2-5 yrs) Long (5+ yrs)
Time frame to Achieve Significance/ Scale
Personal mobility as range and features increase while upfront costs decrease
TCOs for taxis, green objectives, Govt. push
Use case based adoption, personal recreation/ mobility
Illustrative Representation
52

EV Component Opportunity Overview
03
3.1 Introduction
3.2 Component Segments
3.2.1 Powertrain & Power Electronics
3.2.2 Battery & Associated Components
3.2.3 Connectivity & Control Systems
3.2.4 Other Components
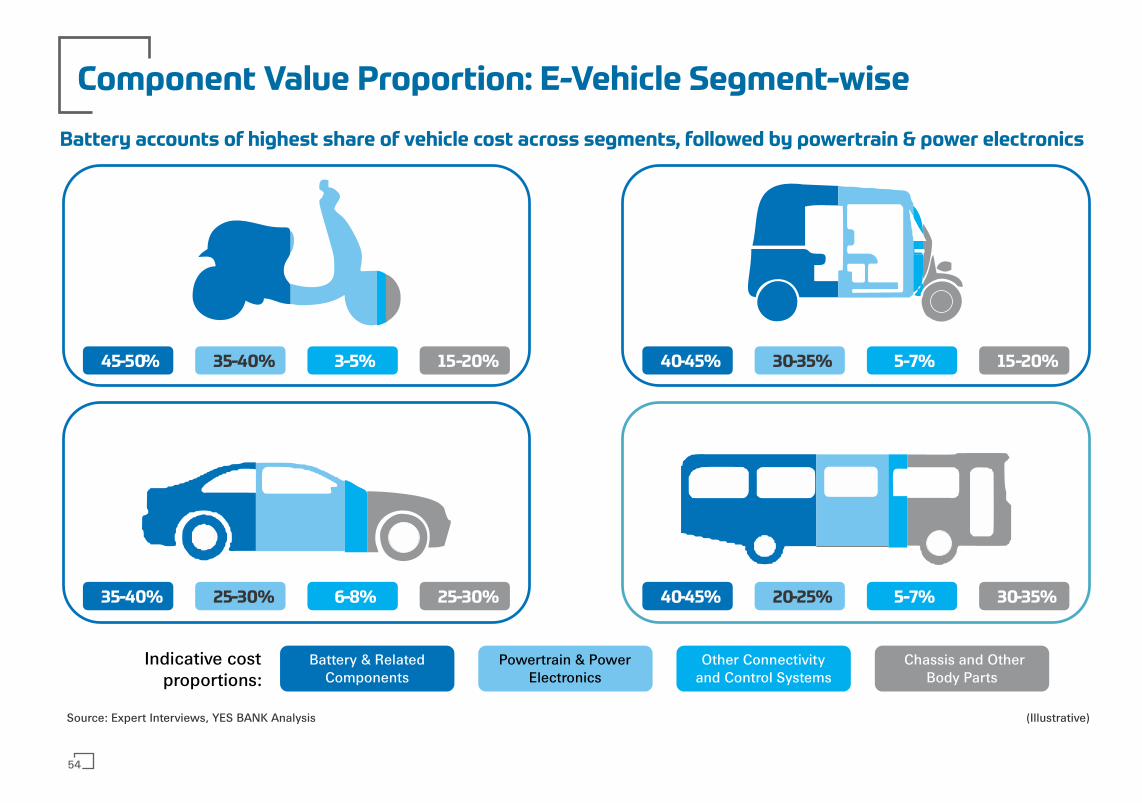
35-40% 25-30% 6-8% 25-30%
45-50% 35-40% 3-5% 15-20% 40-45% 30-35% 5-7% 15-20%
40-45% 20-25% 5-7% 30-35%
Battery & Related Components
Powertrain & Power Electronics
Other Connectivity and Control Systems
Chassis and Other Body Parts
Indicative cost proportions:
Component Value Proportion: E-Vehicle Segment-wise
Battery accounts of highest share of vehicle cost across segments, followed by powertrain & power electronics
Source: Expert Interviews, YES BANK Analysis (Illustrative)
54

55
Evolving Engagement Models
HighCOMPONENT SUPPLIER (CS) Led Focus
Chassis & Frame
Suspension
e-axle
Braking
Control Systems
Thermal Management
Controllers
Cell
Motors
Battery
TyreAssembly
Wiring Harness
Power Electronics
OEM &/or CS Led Development
OEM Led Development
CS Led Development
Relatively Low Development Focus
Matrix Technology
Product Development
Low
Hig
h
Collaborative Approach
ü With new components and technologies driving EVs (Cells, Powertrain & Electronics, Telematics etc.), various OEM - supplier engagement models are emerging with higher degree of collaboration over the traditional transactional approach.
ü OEMs have adopted diverse sourcing strategies – from insourcing key components to evolved supplier partnerships and agreements.
ü Besides existing parameters of cost, time and quality; other parameters such as technology strength, R&D capabilities, development and design validation, lifetime ownership of component performance, level of value chain integration, etc. will gain more importance in choosing suppliers.
Technology Development
ü Component suppliers into technology development & research for newer components introduced by EV, hold significant bargaining power over OEM technology adoption curve due to high development & commercialization cost and risk of technology redundancy.
Solution Approach
ü ‘System integrators’ or ‘Solution providers’ will increasingly play a key role in supplying to OEMs. Solutions such as ‘battery - BMS - thermal management - PDU - connectors’, ‘motorcontroller - transmission - convertors - control units’, etc. may come to the fore.
ü Component suppliers with solution/ system based approach & strong hold over technology development can ensure business consistency.
As the industry moves from ICE Vehicles to EVs, engagement models between OEMs &
Component Manufacturers can also evolve
OEM
Led
Foc
us
EV Component Opportunity Overview
03
3.1 Introduction
3.2 Component Segments
3.2.1 Powertrain & Power Electronics
3.2.2 Battery & Associated Components
3.2.3 Connectivity & Control Systems
3.2.4 Other Components
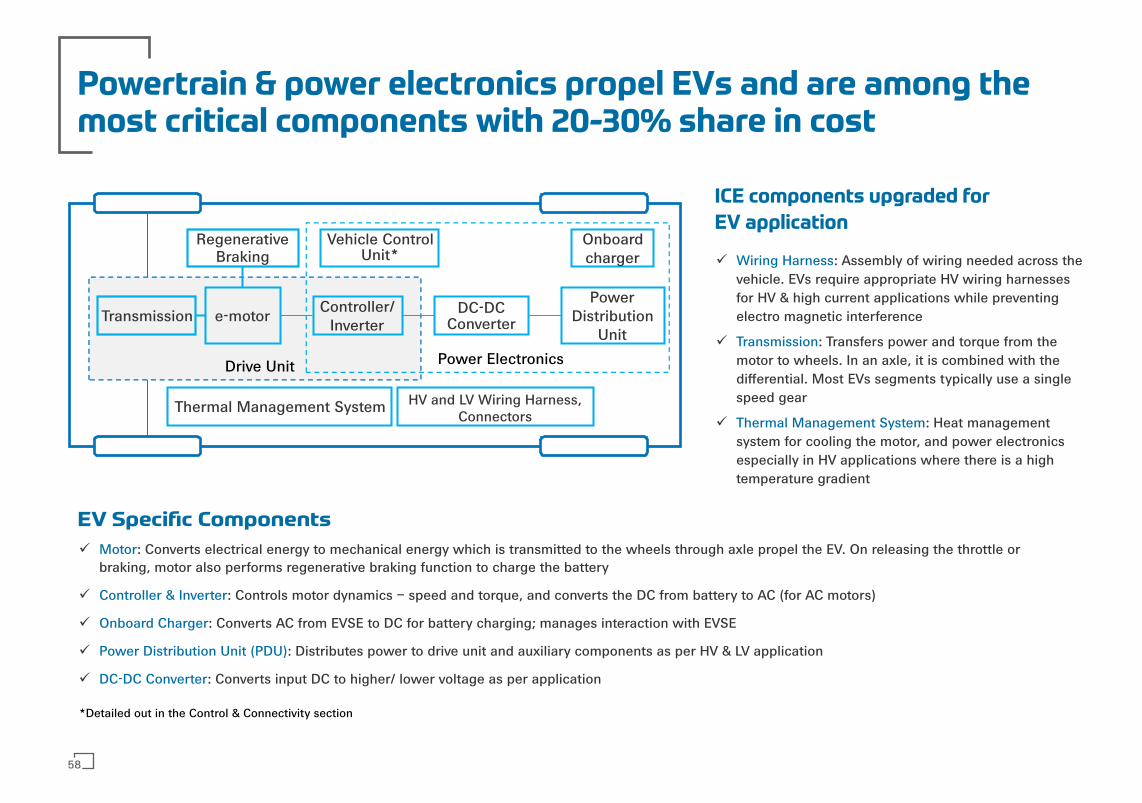
Powertrain & power electronics propel EVs and are among the most critical components with 20-30% share in cost
Drive Unit
Power Distribution
Unit
DC-DC Converter
Controller/ Invertere-motorTransmission
Onboard charger
Vehicle Control Unit*
Power Electronics
HV and LV Wiring Harness, Connectors
Thermal Management System
*Detailed out in the Control & Connectivity section
Regenerative Braking
EV Specific Components
ü : Converts electrical energy to mechanical energy which is transmitted to the wheels through axle propel the EV. On releasing the throttle or Motorbraking, motor also performs regenerative braking function to charge the battery
ü : Controls motor dynamics – speed and torque, and converts the DC from battery to AC (for AC motors)Controller & Inverter
ü : Converts AC from EVSE to DC for battery charging; manages interaction with EVSEOnboard Charger
ü : Distributes power to drive unit and auxiliary components as per HV & LV applicationPower Distribution Unit (PDU)
ü : Converts input DC to higher/ lower voltage as per applicationDC-DC Converter
ICE components upgraded for
EV application
ü : Assembly of wiring needed across the Wiring Harnessvehicle. EVs require appropriate HV wiring harnesses for HV & high current applications while preventing electro magnetic interference
ü : Transfers power and torque from the Transmissionmotor to wheels. In an axle, it is combined with the differential. Most EVs segments typically use a single speed gear
ü : Heat management Thermal Management Systemsystem for cooling the motor, and power electronics especially in HV applications where there is a high temperature gradient
58
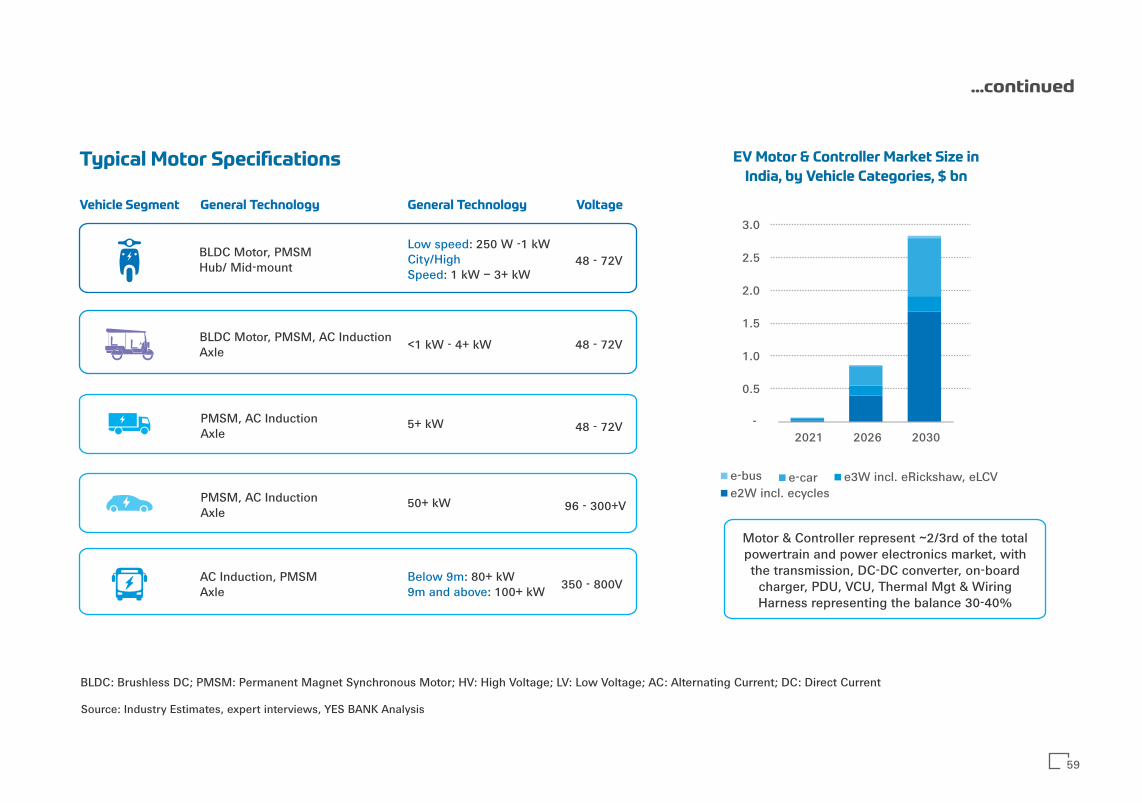
BLDC: Brushless DC; PMSM: Permanent Magnet Synchronous Motor; HV: High Voltage; LV: Low Voltage; AC: Alternating Current; DC: Direct Current
Typical Motor Specifications
Vehicle Segment General Technology General Technology Voltage
BLDC Motor, PMSMHub/ Mid-mount
Low speed: 250 W -1 kW City/High
: 1 kW – 3+ kWSpeed48 - 72V
BLDC Motor, PMSM, AC InductionAxle <1 kW - 4+ kW 48 - 72V
PMSM, AC Induction Axle
5+ kW 48 - 72V
PMSM, AC Induction Axle
50+ kW 96 - 300+V
AC Induction, PMSM Axle
Below 9m: 80+ kW 9m and above: 100+ kW 350 - 800V
...continued
EV Motor & Controller Market Size in
India, by Vehicle Categories, $ bn
Source: Industry Estimates, expert interviews, YES BANK Analysis
Motor & Controller represent ~2/3rd of the total powertrain and power electronics market, with the transmission, DC-DC converter, on-board
charger, PDU, VCU, Thermal Mgt & Wiring Harness representing the balance 30-40%
-
0.5
1.0
1.5
2.0
2.5
3.0
2021 2026 2030
e-bus e-car e3W incl. eRickshaw, eLCVe2W incl. ecycles
59

India-specific requirement and Government push for domestic value addition are driving the industry
Key Drivers
Crucial
Functionality
Powertrain & power electronics replaces the engine in EVs. Players impacted by this & OEMs who would want to retain competence of this crucial functionality, will drive development in this space.
Power train performance (power density) is key to EV product performance and impacts its competitive positioning & relative differentiation in the market. This will drive strong research & development in PT.
Drive for
Performance
India’s unique driving conditions w.r.t. driving patterns, ambient temperatures & cost consciousness calls for redesigning powertrain & components for optimal efficiencies to suit these requirements in finer budgets, driving the local product development & research.
driving
conditions
India’s unique
Supply chain
Stability
A strong local supply chain of essential functionality like powertrain is crucial both for manufacturing and after-sales market & servicing, further driving growth in local PT supply ecosystem.
Regulatory
support for
Localization
ü FAME II eligibility mandates localization of drivetrain components as per the Phased Manufacturing Program (e-motor, controller/ inverter, onboard charger, DC-DC converter, wheel rim with hub motor, MCB/ circuit breakers/ electric safety devices, power & control wiring harness and connectors).
ü Powertrain component imports (AC/DC Motor, Motor Controller/Inverter and Power Control Unit) were scheduled to attract BCD of 15% from Apr’21 onwards.
Supply Side
Incentives
MeitY’s SPECS scheme offers upto 25% capital subsidy on eligible capital expenditure for components such as BLDC motors, connectors and power electronics components such as PCB, discrete power & compound semiconductors and ICs.
ü ü ü
ü
ü
ü
ü
ü
ü
ü
ü
ü üü
Short-term
Long-term
Impact
60
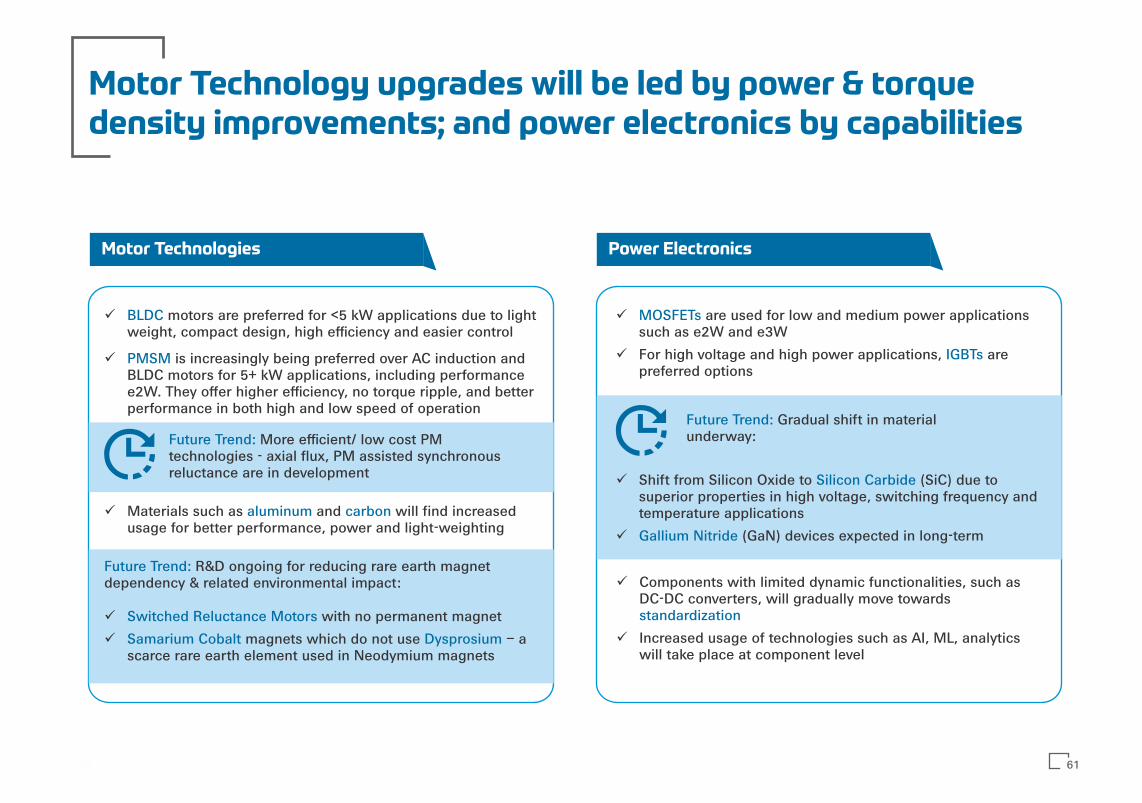
Motor Technology upgrades will be led by power & torque density improvements; and power electronics by capabilities
ü motors are preferred for <5 kW applications due to light BLDCweight, compact design, high efficiency and easier control
ü is increasingly being preferred over AC induction and PMSMBLDC motors for 5+ kW applications, including performance e2W. They offer higher efficiency, no torque ripple, and better performance in both high and low speed of operation
Future Trend: More efficient/ low cost PM technologies - axial flux, PM assisted synchronous reluctance are in development
ü with no permanent magnet Switched Reluctance Motors
ü magnets which do not use – a Samarium Cobalt Dysprosiumscarce rare earth element used in Neodymium magnets
Motor Technologies Power Electronics
ü Materials such as and will find increased aluminum carbonusage for better performance, power and light-weighting
Future Trend: R&D ongoing for reducing rare earth magnet dependency & related environmental impact:
ü are used for low and medium power applications MOSFETssuch as e2W and e3W
ü For high voltage and high power applications, are IGBTspreferred options
Future Trend: Gradual shift in material underway:
ü Shift from Silicon Oxide to (SiC) due to Silicon Carbidesuperior properties in high voltage, switching frequency and temperature applications
ü (GaN) devices expected in long-term Gallium Nitride
ü Components with limited dynamic functionalities, such as DC-DC converters, will gradually move towards standardization
ü Increased usage of technologies such as AI, ML, analytics will take place at component level
61

For All Power Electronics
e-motor
Rotor
Stator
Bearings & Support
Assembly
Bracket/End Plates
Housing
Feedback Systems
PDUDC -DC ConverterController Onboard
charger
Permanent Magnet*
Copper Windings
PCB
Microcontroller
MOSFET/ IGBT Switches
Housing: Plastic/ Composites
Circuit Protection, Safety Components**, (Fuse, Breakers Contactors)
Software/ Network Integration
PCBA
* for magnet based motors** especially in PDU and Onboard Charger*** for liquid cooled systems
Thermal Management
System
Wiring Harness,Connectors
Limited Domestic Manufacturing
E-Compressor
Coolant/ Fan
HV Wires/ cables
LV Wires/ cables
Passive/ Discrete components
HV Connectors
Pipes, Valves***
Motor is supplied with Controller integrated
Domestic Capabilities
E-Pumps
Heat Exchangers Ferrul/ Seal/ Terminals
LV Connectors
Import dependency
Opportunities exist across components at Tier1 & 2 levels, especially to strengthen local value chain
Note: Thermal management section has been detailed out in the Battery & Associated Components section
Tie
r II
an
d b
elo
w
62
PDUDC -DC ConverterController Onboard
charger
Thermal Management
System
Wiring Harness,Connectors
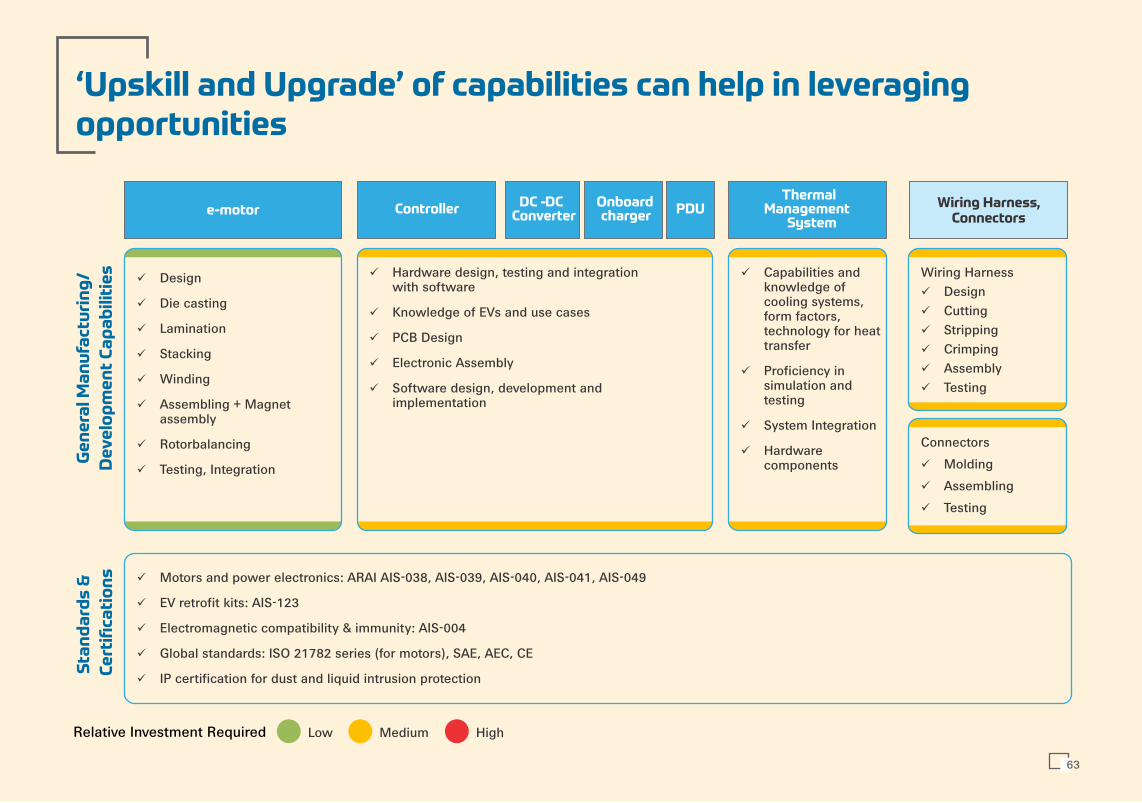
ü Design
ü Die casting
ü Lamination
ü Stacking
ü Winding
ü Assembling + Magnet assembly
ü Rotorbalancing
ü Testing, Integration
ü Hardware design, testing and integration with software
ü Knowledge of EVs and use cases
ü PCB Design
ü Electronic Assembly
ü Software design, development and implementation
Ge
ne
ral M
an
ufa
ctu
rin
g/
De
ve
lop
me
nt
Ca
pa
bil
itie
s
Low Medium HighRelative Investment Required
ü Capabilities and knowledge of cooling systems, form factors, technology for heat transfer
ü Proficiency in simulation and testing
ü System Integration
ü Hardware components
Sta
nd
ard
s &
Ce
rtifi
cati
on
s ü Motors and power electronics: ARAI AIS-038, AIS-039, AIS-040, AIS-041, AIS-049
ü EV retrofit kits: AIS-123
ü Electromagnetic compatibility & immunity: AIS-004
ü Global standards: ISO 21782 series (for motors), SAE, AEC, CE
ü IP certification for dust and liquid intrusion protection
‘Upskill and Upgrade’ of capabilities can help in leveraging opportunities
Connectors
ü Molding
ü Assembling
ü Testing
Wiring Harnessü Designü Cuttingü Strippingü Crimping ü Assemblyü Testing
e-motor
63
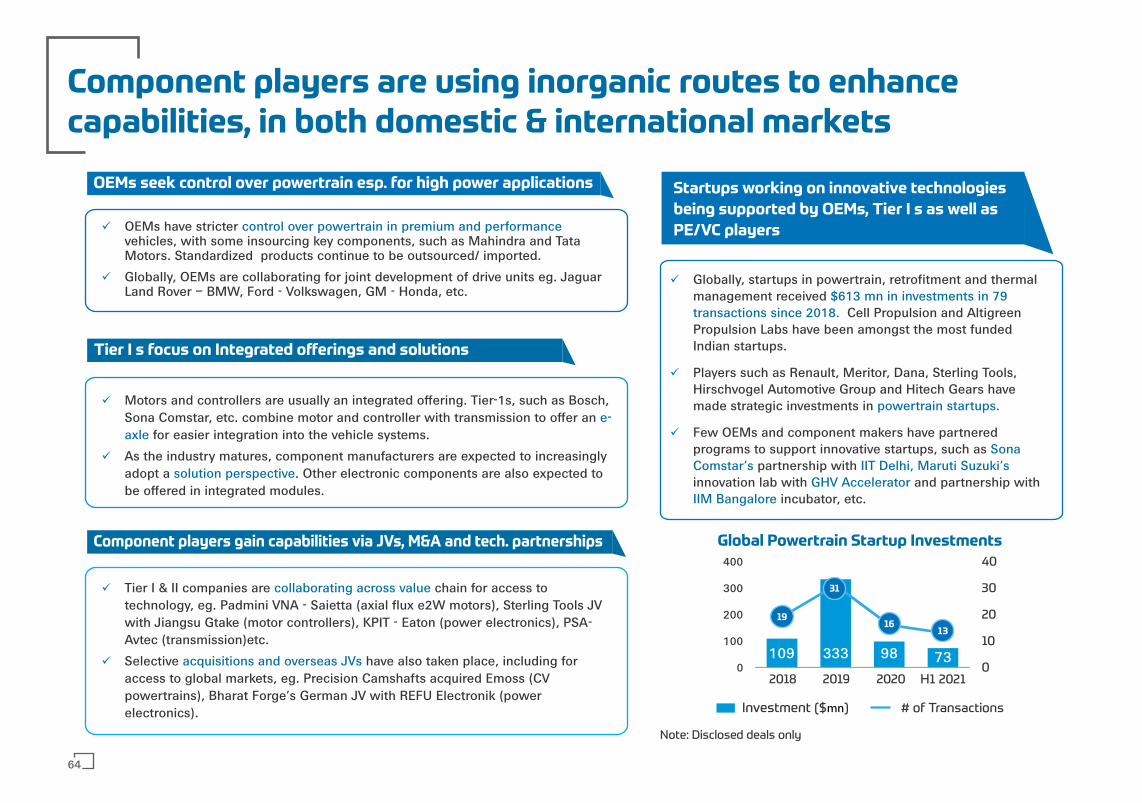
OEMs seek control over powertrain esp. for high power applications
Tier I s focus on Integrated offerings and solutions
Component players gain capabilities via JVs, M&A and tech. partnerships
Component players are using inorganic routes to enhance capabilities, in both domestic & international markets
ü OEMs have stricter control over powertrain in premium and performancevehicles, with some insourcing key components, such as Mahindra and Tata Motors. Standardized products continue to be outsourced/ imported.
ü Globally, OEMs are collaborating for joint development of drive units eg. Jaguar Land Rover – BMW, Ford - Volkswagen, GM - Honda, etc.
ü Motors and controllers are usually an integrated offering. Tier-1s, such as Bosch, Sona Comstar, etc. combine motor and controller with transmission to offer an e-axle for easier integration into the vehicle systems.
ü As the industry matures, component manufacturers are expected to increasingly adopt a . Other electronic components are also expected to solution perspectivebe offered in integrated modules.
ü Tier I & II companies are chain for access to collaborating across valuetechnology, eg. Padmini VNA - Saietta (axial flux e2W motors), Sterling Tools JV with Jiangsu Gtake (motor controllers), KPIT - Eaton (power electronics), PSA-Avtec (transmission)etc.
ü Selective have also taken place, including for acquisitions and overseas JVsaccess to global markets, eg. Precision Camshafts acquired Emoss (CV powertrains), Bharat Forge’s German JV with REFU Electronik (power electronics). Investment ($ ) mn # of Transactions
109 333 98 730
10
20
30
40
0
100
200
300
400
2018 2019 2020 H1 2021
Startups working on innovative technologies
being supported by OEMs, Tier I s as well as
PE/VC players
ü Globally, startups in powertrain, retrofitment and thermal management received $613 mn in investments in 79 transactions since 2018. Cell Propulsion and Altigreen Propulsion Labs have been amongst the most funded Indian startups.
ü Players such as Renault, Meritor, Dana, Sterling Tools, Hirschvogel Automotive Group and Hitech Gears have made strategic investments in powertrain startups.
ü Few OEMs and component makers have partnered programs to support innovative startups, such as Sona Comstar’s IIT Delhi, Maruti Suzuki’s partnership with innovation lab with and partnership with GHV AcceleratorIIM Bangalore incubator, etc.
Global Powertrain Startup Investments
Note: Disclosed deals only
19
31
1613
64
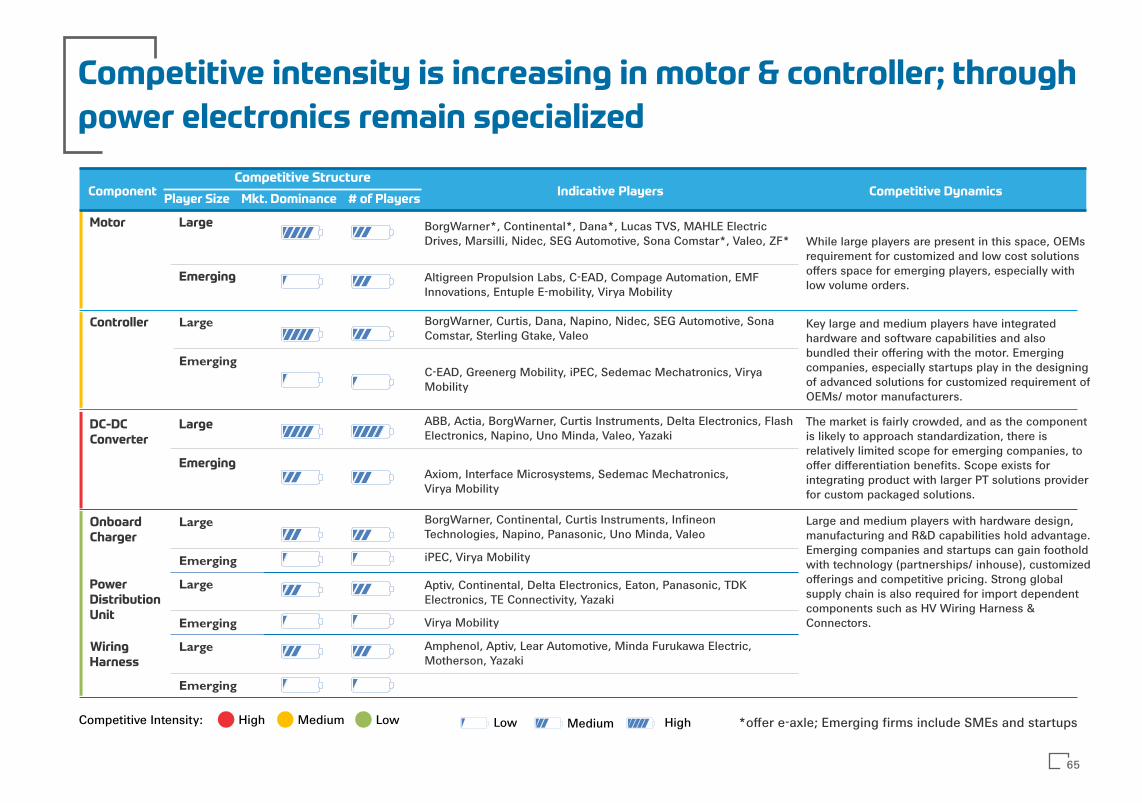
Competitive intensity is increasing in motor & controller; through
power electronics remain specialized
ComponentPlayer Size Mkt. Dominance # of Players
Indicative Players Competitive Dynamics
Motor Large BorgWarner*, Continental*, Dana*, Lucas TVS, MAHLE Electric Drives, Marsilli, Nidec, SEG Automotive, Sona Comstar*, Valeo, ZF*
Emerging
Onboard Charger
Large
Emerging
Power Distribution Unit
Large
Emerging
Wiring Harness
Large
Emerging
HighCompetitive Intensity: Medium Low Low Medium High
Altigreen Propulsion Labs, C-EAD, Compage Automation, EMF Innovations, Entuple E-mobility, Virya Mobility
BorgWarner, Curtis, Dana, Napino, Nidec, SEG Automotive, Sona Comstar, Sterling Gtake, Valeo
ABB, Actia, BorgWarner, Curtis Instruments, Delta Electronics, Flash Electronics, Napino, Uno Minda, Valeo, Yazaki
Axiom, Interface Microsystems, Sedemac Mechatronics, Virya Mobility
BorgWarner, Continental, Curtis Instruments, Infineon Technologies, Napino, Panasonic, Uno Minda, Valeo
iPEC, Virya Mobility
Aptiv, Continental, Delta Electronics, Eaton, Panasonic, TDK Electronics, TE Connectivity, Yazaki
Virya Mobility
Amphenol, Aptiv, Lear Automotive, Minda Furukawa Electric, Motherson, Yazaki
C-EAD, Greenerg Mobility, iPEC, Sedemac Mechatronics, Virya Mobility
While large players are present in this space, OEMs requirement for customized and low cost solutions offers space for emerging players, especially with low volume orders.
Controller Large
Emerging
DC-DCConverter
Large
Emerging
Key large and medium players have integrated hardware and software capabilities and also bundled their offering with the motor. Emerging companies, especially startups play in the designing of advanced solutions for customized requirement of OEMs/ motor manufacturers.
The market is fairly crowded, and as the component is likely to approach standardization, there is relatively limited scope for emerging companies, to offer differentiation benefits. Scope exists for integrating product with larger PT solutions provider for custom packaged solutions.
Large and medium players with hardware design, manufacturing and R&D capabilities hold advantage. Emerging companies and startups can gain foothold with technology (partnerships/ inhouse), customized offerings and competitive pricing. Strong global supply chain is also required for import dependent components such as HV Wiring Harness & Connectors.
*offer e-axle; Emerging firms include SMEs and startups
Competitive Structure
65

Partnerships & collaborations are the key for gradual
enhancement of capabilities and scale
ü their sub-components (rotors, BLDC and PMS Motors, stators, bearings, windings, etc.) and wiring harnesses are expected to offer initial scale, given their demand
ü MeitY SPECS scheme can be leveraged to invest in electronics component manufacturing. Passive components (resistors, capacitors), discrete semiconductors (transistors, diodes), power semiconductors (FETs, MOSFETs), BLDC motors, etc. have low investment threshold
ü Power electronics are design & software capabilitiescrucial, needs focus on building capability to differentiate
ü Evaluating/Investing in working in developing startupstechnology & customized products across PT segment – e-motors (low/no magnet), controller, Onboard charger etc. may reap benefits
ü Staggered investments in setups flexible manufacturing(eg: flexible lines, semi-automatic) can support the lower MOQs scenario expected initially
Short-term Medium-term
Long-term
ü Focus on as volumes increase to benefit from vertical integrationeconomies of scale. Partnerships/ JVs for localizing electronics hardware will be crucial
ü Target commercializing and new technologies materials
ü Develop for strong technology strength/ partnerships (local, global)& consistent product USPs with export focus
ü Collaborate especially power across component segments,electronics, for design and system integration capabilities; develop integrated solutions offerings to emerge as a solutions provider for OEMs
ü Develop with standard hardware and leverage modular solutionssoftware capabilities to offer feature differentiation
ü Increase for technology & solution development R&D expenditurefor stronger export positioning
66

*Controller is configured as per the motor and is an integrated offering
Illustrative Representation
EASE OF ENTRY(Basis Import Dependency, Competitive Intensity,
Investment & Skills Needed)
Low High
Opportunity Vs. Ease of Entry
Hig
hO
PPO
RTU
NIT
Y(B
asis
Indu
stry
Vol
ume
and
Mar
gin
Poss
ibili
ty)
Induction MotorSwitched
Reluctance Motor
Power Distribution Unit
Onboard Charger
Controller*
WiringHarness & Connectors
PMS Motor
BLDC Motor
ThermalManagement
DC-DC Converter
...continued
67
66
EV Component Opportunity Overview
03
3.1 Introduction
3.2 Component Segments
3.2.1 Powertrain & Power Electronics
3.2.2 Battery & Associated Components
3.2.3 Connectivity & Control Systems
3.2.4 Other Components
Photo by Kumpan
Electric on Unsplash
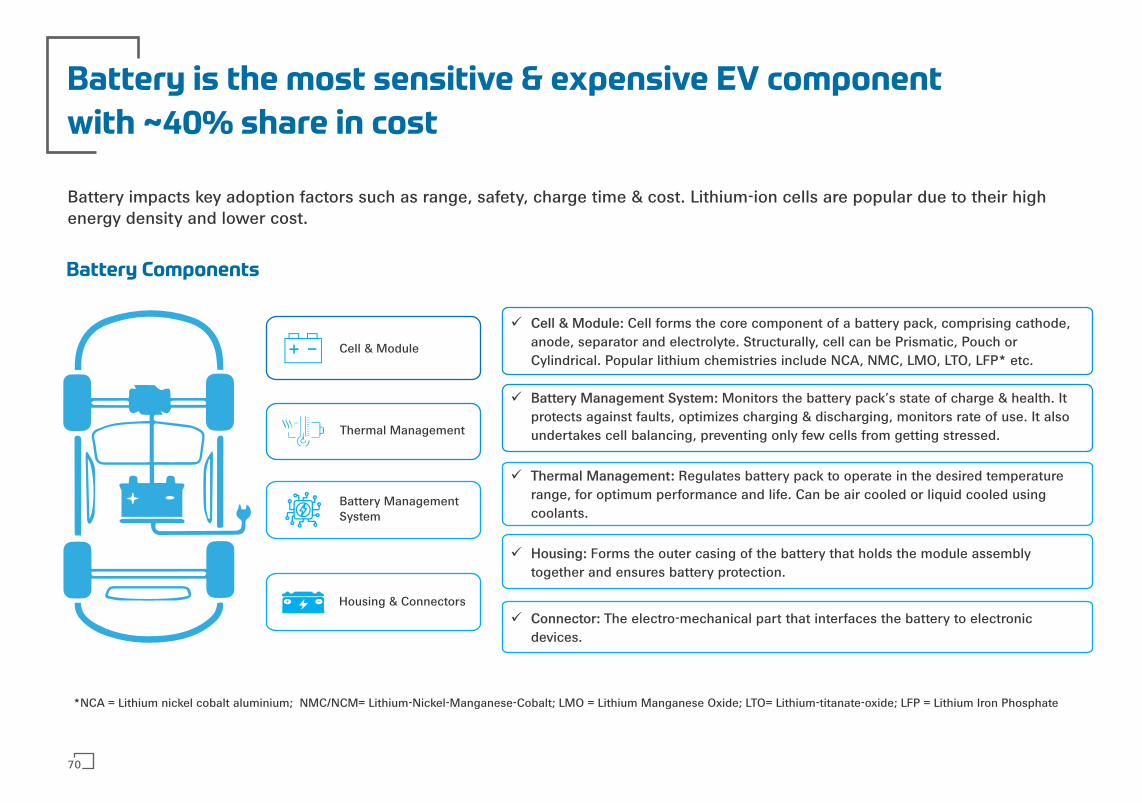
Battery is the most sensitive & expensive EV component
with ~40% share in cost
Battery impacts key adoption factors such as range, safety, charge time & cost. Lithium-ion cells are popular due to their high energy density and lower cost.
Battery Components
Cell & Module
Thermal Management
Battery ManagementSystem
Housing & Connectors
ü Cell forms the core component of a battery pack, comprising cathode, Cell & Module:anode, separator and electrolyte. Structurally, cell can be Prismatic, Pouch or Cylindrical. Popular lithium chemistries include NCA, NMC, LMO, LTO, LFP* etc.
*NCA = Lithium nickel cobalt aluminium; NMC/NCM= Lithium-Nickel-Manganese-Cobalt; LMO = Lithium Manganese Oxide; LTO= Lithium-titanate-oxide; LFP = Lithium Iron Phosphate
ü Monitors the battery pack’s state of charge & health. It Battery Management System:protects against faults, optimizes charging & discharging, monitors rate of use. It also undertakes cell balancing, preventing only few cells from getting stressed.
ü Regulates battery pack to operate in the desired temperature Thermal Management:range, for optimum performance and life. Can be air cooled or liquid cooled using coolants.
ü Forms the outer casing of the battery that holds the module assembly Housing:together and ensures battery protection.
ü The electro-mechanical part that interfaces the battery to electronic Connector:devices.
70

71
...continued
1 - 3 24 - 30
3 - 12 43 – 57
20 – 50 150 – 210
15 - 150 450 – 750
50 – 300 1,100 – 1,500
Category Capacity, kWh Energy Consumption, Wh/km
Battery SpecificationsEV Battery Market Size in India, by Vehicle Categories, GWh
Cell BMS Battery Aggregates, Thermal & Module MgmtHousing, Connectors, Cables & Consumables
0
10
20
30
40
50
2020 2025 2030
e-bus e-car eRickshaw, e3W & eLCV e2W & eCycles
- 1 2 3 4
2021
2026
2031
EV Battery Market Size in India, by Product Categories, $ bn
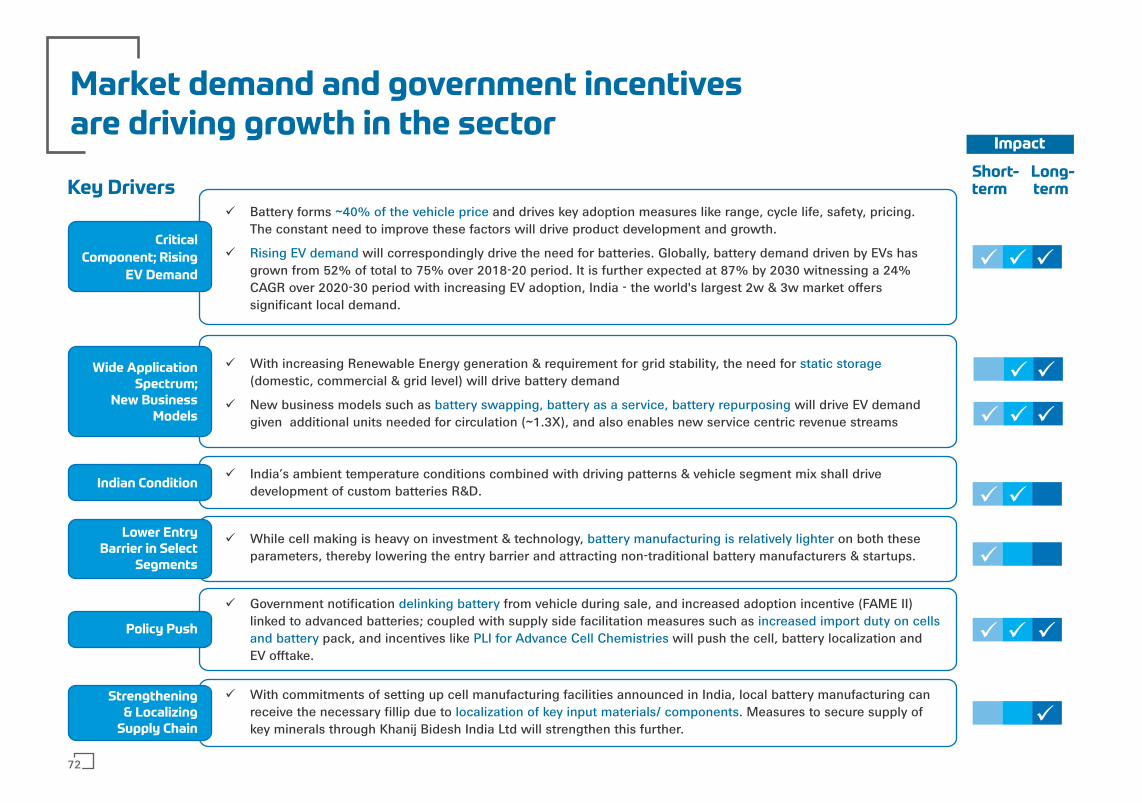
Market demand and government incentivesare driving growth in the sector
Short-term
Long-termKey Drivers
Critical
Component; Rising
EV Demand
ü Battery forms and drives key adoption measures like range, cycle life, safety, pricing. ~40% of the vehicle priceThe constant need to improve these factors will drive product development and growth.
ü will correspondingly drive the need for batteries. Globally, battery demand driven by EVs has Rising EV demandgrown from 52% of total to 75% over 2018-20 period. It is further expected at 87% by 2030 witnessing a 24% CAGR over 2020-30 period with increasing EV adoption, India - the world's largest 2w & 3w market offers significant local demand.
ü With increasing Renewable Energy generation & requirement for grid stability, the need for static storage (domestic, commercial & grid level) will drive battery demand
ü New business models such as will drive EV demand battery swapping, battery as a service, battery repurposinggiven additional units needed for circulation (~1.3X), and also enables new service centric revenue streams
Wide ApplicationSpectrum;
New BusinessModels
ü ü ü
ü ü
ü ü ü
Indian Conditionü India’s ambient temperature conditions combined with driving patterns & vehicle segment mix shall drive
development of custom batteries R&D. ü ü
ü While cell making is heavy on investment & technology, on both these battery manufacturing is relatively lighter parameters, thereby lowering the entry barrier and attracting non-traditional battery manufacturers & startups.
Lower EntryBarrier in Select
Segments
ü Government notification from vehicle during sale, and increased adoption incentive (FAME II) delinking battery linked to advanced batteries; coupled with supply side facilitation measures such as increased import duty on cells and battery PLI for Advance Cell Chemistries pack, and incentives like will push the cell, battery localization and EV offtake.
Policy Push ü
ü
ü With commitments of setting up cell manufacturing facilities announced in India, local battery manufacturing can receive the necessary fillip due to Measures to secure supply of localization of key input materials/ components. key minerals through Khanij Bidesh India Ltd will strengthen this further.
Strengthening& Localizing
Supply Chainü
ü ü
Impact
72

ü Continuous improvement in BMS algorithms, features & architecture to improve battery management & safety thus improving battery life
ü Future Trends - Wireless BMS
Battery Management Systems Thermal Management
Technology Trends
ü Swappable batteries are driving changes to pack design
ü Future Trends - Battery pack design is considered to have significant scope to create efficiency. Globally, pack cost is reducing faster than cell cost, (25% v/s 22% CAGR since 2015) implying improved efficiencies
Battery Pack Design Cell Chemistries – Lithium Ion
ü Advancement in liquid cooling - innovation in coolants, Piping Systems & Architectures basis battery design
ü Integration of all thermal management systems for increased efficiency
ü Future Trends - Immersion cooling where the battery is directly submerged in specialized coolants
BMS & other battery elements are expected to remain relatively
standard on technology, unlike in case of cell chemistry
ü R&D in Li-ion chemistries across cathode, anode and electrolyte material to improve energy density, costs, cycle life & reduce dependence on select minerals. Areas of focus include NMC and Nickel rich NMC, LTO chemistries
ü Future Trends - Li–S | Solid-state | Graphene
Non-Lithium IonEnergy Storage
Battery Recycling
ü Future Trends - To improve energy density, reduce dependence on select minerals and align with use cases: Ultra Capacitor | Fuel Cells | Metal-Air etc., are in focus
ü Future Trends - End of life battery material retrieval for reuse in new batteries for environmental considerations, reducing import & mining dependence
73
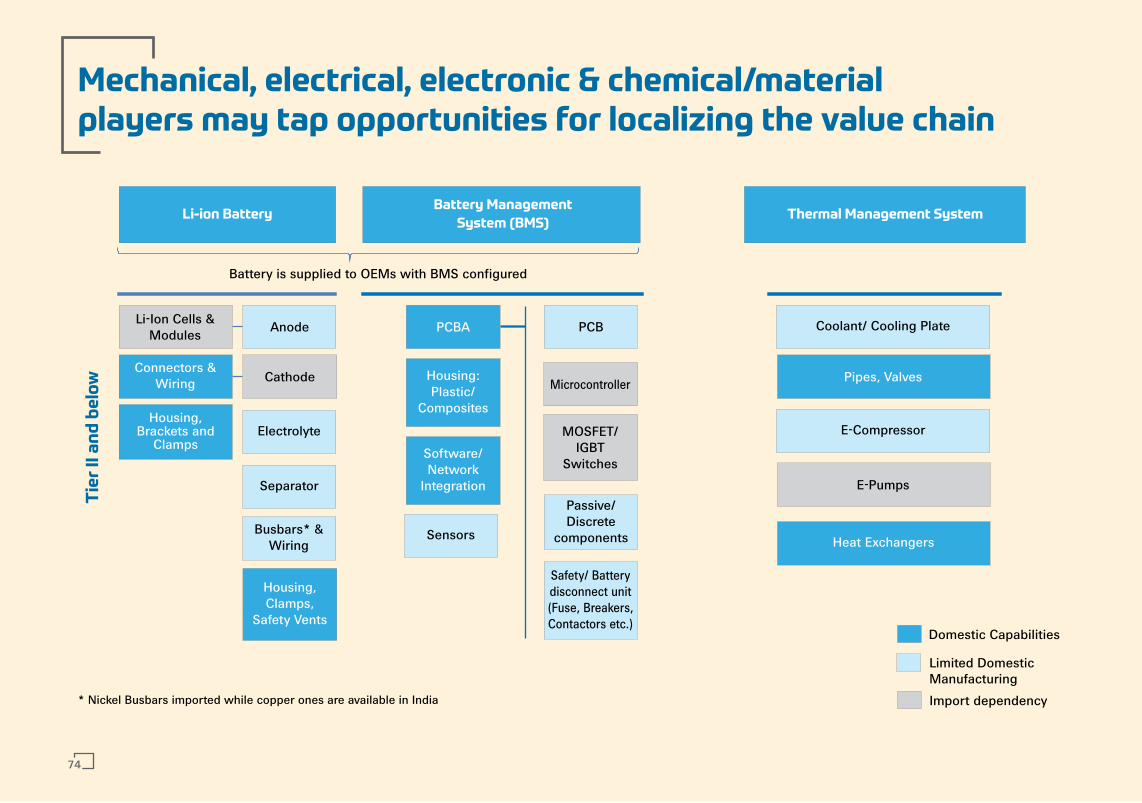
Li-ion Battery
Connectors &Wiring
Housing,Brackets and
Clamps
Battery Management
System (BMS)
Anode
* Nickel Busbars imported while copper ones are available in India
Limited Domestic Manufacturing
Battery is supplied to OEMs with BMS configured
Domestic Capabilities
Import dependency
Thermal Management System
Li-Ion Cells &Modules
Cathode
Electrolyte
Separator
Busbars* &Wiring
Housing,Clamps,
Safety Vents
PCBA
Housing:Plastic/
Composites
Software/Network
Integration
Sensors
PCB
Microcontroller
MOSFET/IGBT
Switches
Passive/Discrete
components
Safety/ Batterydisconnect unit(Fuse, Breakers,Contactors etc.)
Coolant/ Cooling Plate
Pipes, Valves
E-Compressor
E-Pumps
Heat Exchangers
Mechanical, electrical, electronic & chemical/materialplayers may tap opportunities for localizing the value chain
Tie
r II
an
d b
elo
w
74
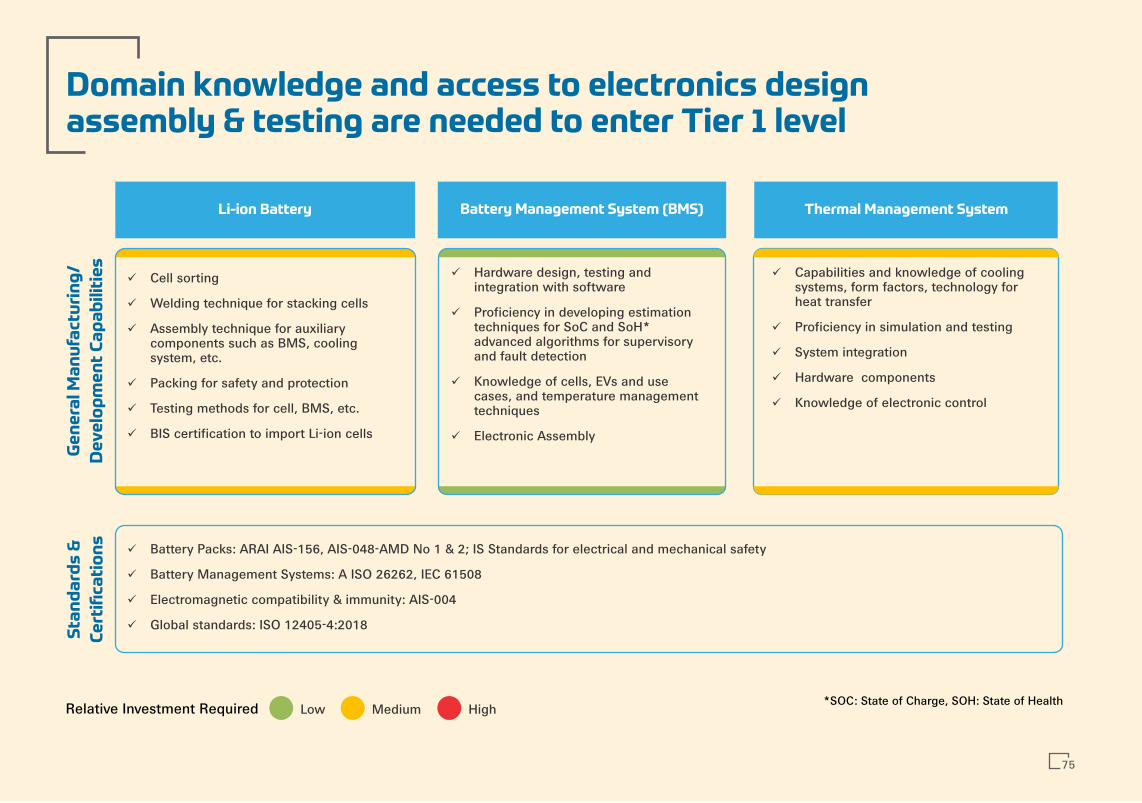
Li-ion Battery
Ge
ne
ral M
an
ufa
ctu
rin
g/
De
ve
lop
me
nt
Ca
pa
bil
itie
s
Low Medium HighRelative Investment Required
Sta
nd
ard
s &
Ce
rtifi
cati
on
s
ü Battery Packs: ARAI AIS-156, AIS-048-AMD No 1 & 2; IS Standards for electrical and mechanical safety
ü Battery Management Systems: A ISO 26262, IEC 61508
ü Electromagnetic compatibility & immunity: AIS-004
ü Global standards: ISO 12405-4:2018
Domain knowledge and access to electronics designassembly & testing are needed to enter Tier 1 level
ü Cell sorting
ü Welding technique for stacking cells
ü Assembly technique for auxiliary components such as BMS, cooling system, etc.
ü Packing for safety and protection
ü Testing methods for cell, BMS, etc.
ü BIS certification to import Li-ion cells
ü Hardware design, testing and integration with software
ü Proficiency in developing estimation techniques for SoC and SoH* advanced algorithms for supervisory and fault detection
ü Knowledge of cells, EVs and use cases, and temperature management techniques
ü Electronic Assembly
ü Capabilities and knowledge of cooling systems, form factors, technology for heat transfer
ü Proficiency in simulation and testing
ü System integration
ü Hardware components
ü Knowledge of electronic control
Battery Management System (BMS) Thermal Management System
*SOC: State of Charge, SOH: State of Health
75
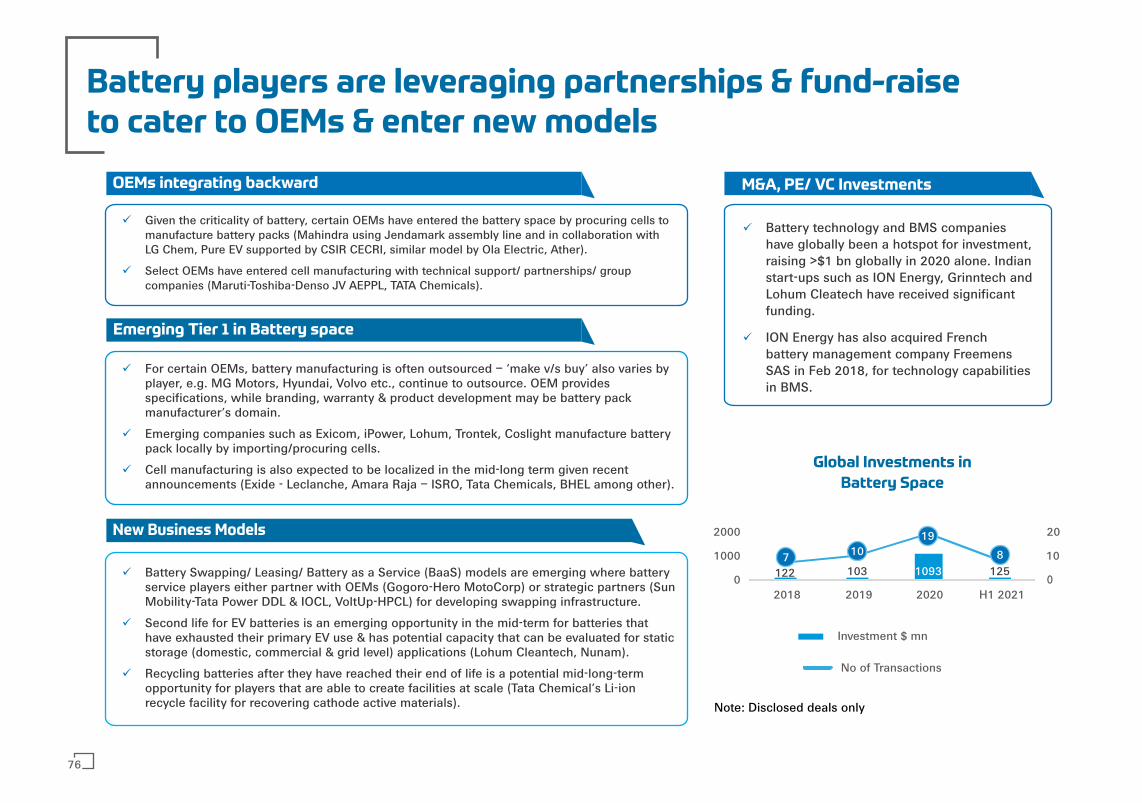
OEMs integrating backward
Emerging Tier 1 in Battery space
New Business Models
Battery players are leveraging partnerships & fund-raiseto cater to OEMs & enter new models
ü Given the criticality of battery, certain OEMs have entered the battery space by procuring cells to manufacture battery packs (Mahindra using Jendamark assembly line and in collaboration with LG Chem, Pure EV supported by CSIR CECRI, similar model by Ola Electric, Ather).
ü Select OEMs have entered cell manufacturing with technical support/ partnerships/ group companies (Maruti-Toshiba-Denso JV AEPPL, TATA Chemicals).
ü For certain OEMs, battery manufacturing is often outsourced – ‘make v/s buy’ also varies by player, e.g. MG Motors, Hyundai, Volvo etc., continue to outsource. OEM provides specifications, while branding, warranty & product development may be battery pack manufacturer’s domain.
ü Emerging companies such as Exicom, iPower, Lohum, Trontek, Coslight manufacture battery pack locally by importing/procuring cells.
ü Cell manufacturing is also expected to be localized in the mid-long term given recent announcements (Exide - Leclanche, Amara Raja – ISRO, Tata Chemicals, BHEL among other).
ü Battery Swapping/ Leasing/ Battery as a Service (BaaS) models are emerging where battery service players either partner with OEMs (Gogoro-Hero MotoCorp) or strategic partners (Sun Mobility-Tata Power DDL & IOCL, VoltUp-HPCL) for developing swapping infrastructure.
ü Second life for EV batteries is an emerging opportunity in the mid-term for batteries that have exhausted their primary EV use & has potential capacity that can be evaluated for static storage (domestic, commercial & grid level) applications (Lohum Cleantech, Nunam).
ü Recycling batteries after they have reached their end of life is a potential mid-long-term opportunity for players that are able to create facilities at scale (Tata Chemical’s Li-ion recycle facility for recovering cathode active materials).
M&A, PE/ VC Investments
ü Battery technology and BMS companies have globally been a hotspot for investment, raising >$1 bn globally in 2020 alone. Indian start-ups such as ION Energy, Grinntech and Lohum Cleatech have received significant funding.
ü ION Energy has also acquired French battery management company Freemens SAS in Feb 2018, for technology capabilities in BMS.
Global Investments in
Battery Space
122 103 1093 1250
10
20
0
1000
2000
2018 2019 2020 H1 2021
Investment $ mn
No of Transactions
Note: Disclosed deals only
7 1019
8
76
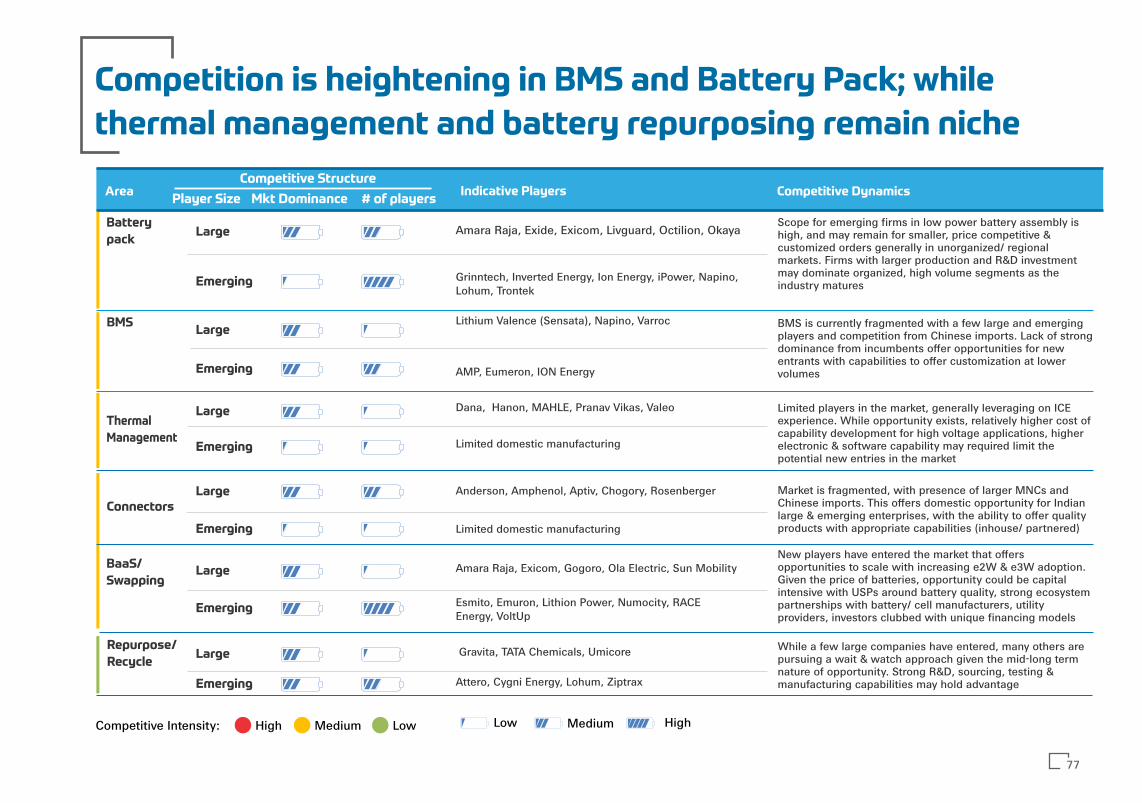
Competition is heightening in BMS and Battery Pack; while
thermal management and battery repurposing remain niche
Area Indicative Players Competitive Dynamics
Battery
packLarge Amara Raja, Exide, Exicom, Livguard, Octilion, Okaya
Emerging
ConnectorsLarge
Emerging
BaaS/
SwappingLarge
Emerging
Repurpose/
RecycleLarge
Emerging
HighCompetitive Intensity: Medium Low
Grinntech, Inverted Energy, Ion Energy, iPower, Napino, Lohum, Trontek
Lithium Valence (Sensata), Napino, Varroc
Dana, Hanon, MAHLE, Pranav Vikas, Valeo
Limited domestic manufacturing
Anderson, Amphenol, Aptiv, Chogory, Rosenberger
Limited domestic manufacturing
Amara Raja, Exicom, Gogoro, Ola Electric, Sun Mobility
Esmito, Emuron, Lithion Power, Numocity, RACE Energy, VoltUp
Gravita, TATA Chemicals, Umicore
AMP, Eumeron, ION Energy
Scope for emerging firms in low power battery assembly is high, and may remain for smaller, price competitive & customized orders generally in unorganized/ regional markets. Firms with larger production and R&D investment may dominate organized, high volume segments as the industry matures
BMSLarge
Emerging
Thermal
Management
Large
Emerging
BMS is currently fragmented with a few large and emerging players and competition from Chinese imports. Lack of strong dominance from incumbents offer opportunities for new entrants with capabilities to offer customization at lower volumes
Limited players in the market, generally leveraging on ICE experience. While opportunity exists, relatively higher cost of capability development for high voltage applications, higher electronic & software capability may required limit the potential new entries in the market
Market is fragmented, with presence of larger MNCs and Chinese imports. This offers domestic opportunity for Indian large & emerging enterprises, with the ability to offer quality products with appropriate capabilities (inhouse/ partnered)
Attero, Cygni Energy, Lohum, Ziptrax
New players have entered the market that offers opportunities to scale with increasing e2W & e3W adoption. Given the price of batteries, opportunity could be capital intensive with USPs around battery quality, strong ecosystem partnerships with battery/ cell manufacturers, utility providers, investors clubbed with unique financing models
While a few large companies have entered, many others are pursuing a wait & watch approach given the mid-long term nature of opportunity. Strong R&D, sourcing, testing & manufacturing capabilities may hold advantage
Low Medium High
# of players
Competitive Structure
Player Size Mkt Dominance
77
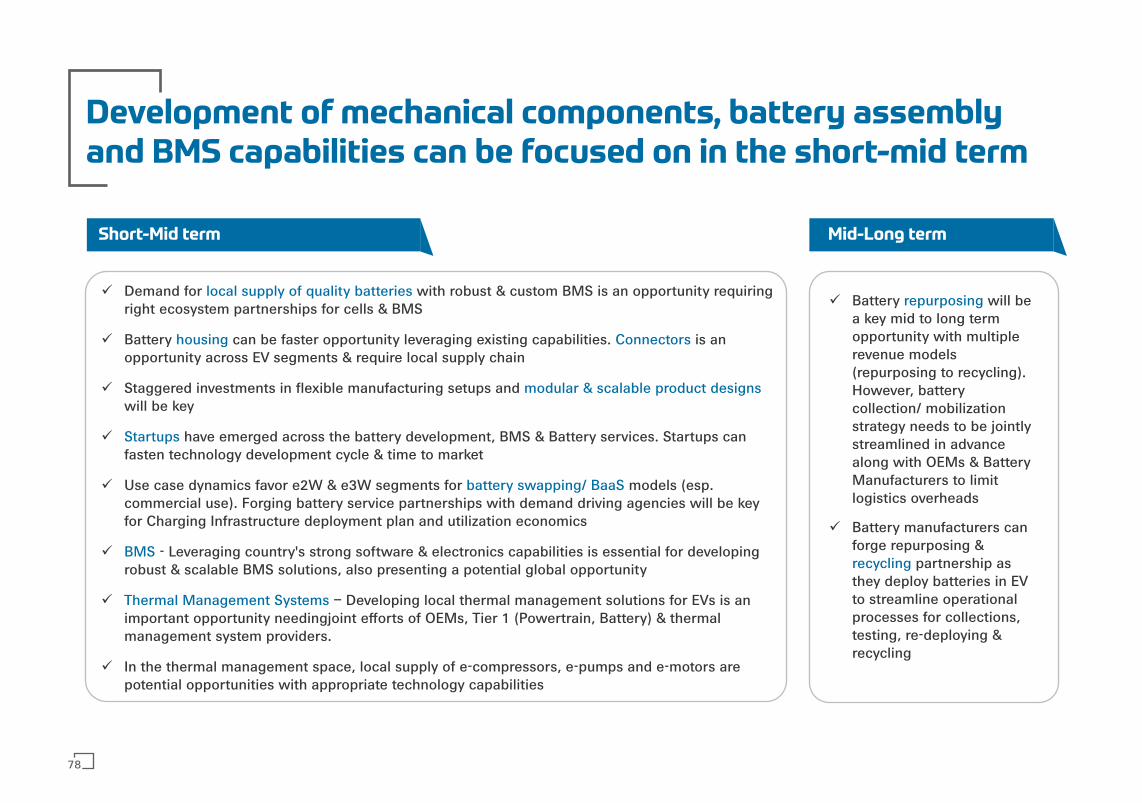
Development of mechanical components, battery assemblyand BMS capabilities can be focused on in the short-mid term
ü Demand for with robust & custom BMS is an opportunity requiring local supply of quality batteriesright ecosystem partnerships for cells & BMS
ü Battery can be faster opportunity leveraging existing capabilities. is an housing Connectors opportunity across EV segments & require local supply chain
ü Staggered investments in flexible manufacturing setups and modular & scalable product designs will be key
ü have emerged across the battery development, BMS & Battery services. Startups can Startupsfasten technology development cycle & time to market
ü Use case dynamics favor e2W & e3W segments for models (esp. battery swapping/ BaaScommercial use). Forging battery service partnerships with demand driving agencies will be key for Charging Infrastructure deployment plan and utilization economics
ü - Leveraging country's strong software & electronics capabilities is essential for developing BMSrobust & scalable BMS solutions, also presenting a potential global opportunity
ü – Developing local thermal management solutions for EVs is an Thermal Management Systems important opportunity needingjoint efforts of OEMs, Tier 1 (Powertrain, Battery) & thermal management system providers.
ü In the thermal management space, local supply of e-compressors, e-pumps and e-motors are potential opportunities with appropriate technology capabilities
Short-Mid term Mid-Long term
ü Battery will be repurposinga key mid to long term opportunity with multiple revenue models (repurposing to recycling). However, battery collection/ mobilization strategy needs to be jointly streamlined in advance along with OEMs & Battery Manufacturers to limit logistics overheads
ü Battery manufacturers can forge repurposing & recycling partnership as they deploy batteries in EV to streamline operational processes for collections, testing, re-deploying & recycling
78
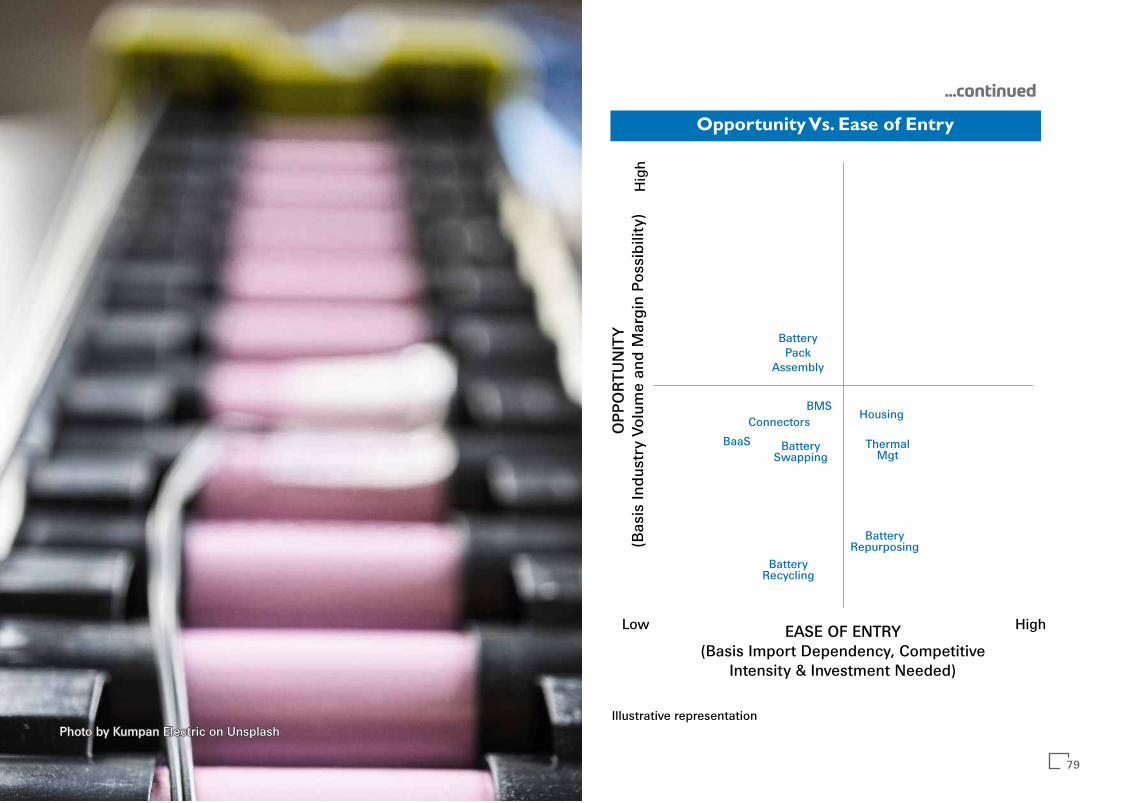
EASE OF ENTRY(Basis Import Dependency, Competitive
Intensity & Investment Needed)
Low HighH
igh
OPP
OR
TUN
ITY
(Bas
is In
dust
ry V
olum
e an
d M
argi
n Po
ssib
ility
)
BatteryPack
Assembly
BMSConnectors
BaaS BatterySwapping
Housing
ThermalMgt
BatteryRepurposing
BatteryRecycling
...continued
Illustrative representation
Opportunity Vs. Ease of Entry
Photo by Kumpan Electric on UnsplashPhoto by Kumpan Electric on UnsplashPhoto by Kumpan Electric on Unsplash
79

Specific Energy
SpecificPower
Safety
Performance
Life Span
Cost LFP
NMC
NCA
LMO
LTO
Low Medium High
Choice of Cell chemistry and form factors vary with use case;
Li-ion chemistries are commercialized while other technologies
under development
Cell Chemistry Commercialization Cell Chemistry Characteristics Comparison
Cell Form Factors
Cylindrical Prismatic Pouch
Electrode Arrangement Wound Wound Stacked
Mechanical Strength
Specific Energy
Energy Density
Commercialized& matured
1. Lead-acid
2. LFP
3. LCO
4. Li-Polymer
5. Ni-MH
6. Ni-Cd
7. ICRFB
Commercialized with continued R&D
1. NMC111, 422, 532, 622, 811
2. NCA
3. LMO
4. LTO
5. VRFB
6. ZNBR
Limited commercialization and R&D
1. NMC712
2. LNMO
3. Li-S
4. NaS
5. Li-metal
6. Metal-air
7. Solid State Batteries
Li: Lithium; LCO: Lithium cobalt oxide; Ni-MH: Nickel metal hydride; Ni-Cd: Nickel–cadmium; ICRFB: Iron-chromium redox flow battery; VRFB: Vanadium redox flow battery; ZNBR: Zinc–bromine flow battery; LNMO: Lithium Nickel Manganese Oxide; Li-S: Lithium–sulfur; NaS: Sodium–sulfur
Source: Deloitte, BCG
80

EV Component Opportunity Overview
03
3.1 Introduction
3.2 Component Segments
3.2.1 Powertrain & Power Electronics
3.2.2 Battery & Associated Components
3.2.3 Connectivity & Control Systems
3.2.4 Other Components
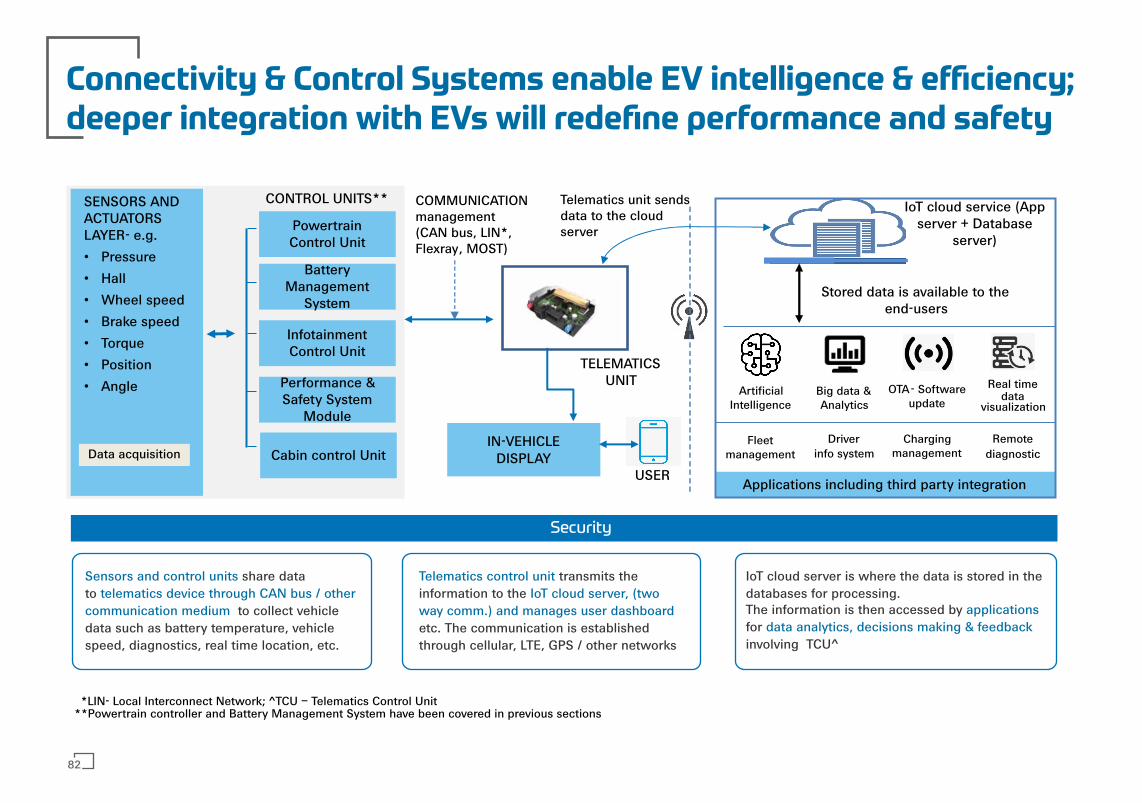
CONTROL UNITS**
Real time data
visualization
Powertrain Control Unit
Cabin control Unit
Infotainment Control Unit
Performance & Safety System
Module
IN-VEHICLEDISPLAY
USER
TELEMATICS UNIT
COMMUNICATION management (CAN bus, LIN*, Flexray, MOST)
Battery Management
System
IoT cloud service (App server + Database
server)
Big data & Analytics
ArtificialIntelligence
OTA- Software update
Applications including third party integration
Telematics unit sends data to the cloud server
Stored data is available to the end-users
Data acquisition
SENSORS AND ACTUATORS LAYER- e.g.
• Pressure
• Hall
• Wheel speed
• Brake speed
• Torque
• Position
• Angle
Fleet management
Remote diagnostic
Charging management
Driver info system
Security
Connectivity & Control Systems enable EV intelligence & efficiency;deeper integration with EVs will redefine performance and safety
Sensors and control units share data to telematics device through CAN bus / othercommunication medium to collect vehicle data such as battery temperature, vehicle speed, diagnostics, real time location, etc.
Telematics control unit transmits the information to the IoT cloud server, (two way comm.) and manages user dashboard etc. The communication is established through cellular, LTE, GPS / other networks
IoT cloud server is where the data is stored in the databases for processing.The information is then accessed by applications for data analytics, decisions making & feedback involving TCU^
*LIN- Local Interconnect Network; ^TCU – Telematics Control Unit
82
**Powertrain controller and Battery Management System have been covered in previous sections

83
This will be driven by need for safety, productimprovements & technological advancements
Increasing safety
and security
Connectivity & control systems increase passenger safety, vehicle safety & vehicle performance – all areas of especial focus in EVs. Eg. real time warnings, advance sharing of critical information, managing safety of charging, onboard & remote diagnostics and predictive maintenance etc.
Vehicle tracking & emergency buttons in public transport and commercial vehicles are mandated by the AIS-140 standard. MORTH has indicated possible ADAS mandate in all cars by 2022 & enabling GPS based toll collection by 2023.
Government
Mandates
Electrification and connectivity are reshaping customer expectations and driving OEMs to increasingly turn to software applications to address them. E.g. navigation systems & charging station proximity, intuitive dashboards, distance before next charge required, power utilization, geofencing, etc.
Personalizedexperience
for Customer
Data-driven
Business
Streams
Vehicle and driver behavior data supports not only manufacturers (vehicle performance & warranties) and application providers, but several stakeholders including fleet operators (optimize vehicle productivity & driver behavior), financial institutions (retail & institutional credit, asset monitoring), insurance agencies (refining insurance products), charging solution providers (charging solutions) etc in developing custom products and business models. IRDAI has also endorsed telematics-driven usage based motor insurance plans.
Technological
Advancement
ü ü ü
ü
ü
ü
ü
ü
ü
ü ü
Fast increasing capability to capture data accurately, transfer it on real-time basis, process it in split seconds andtake prompt/ proactive remedial action will drive the field of connected and control systems for better products. This combined with continuously decreasing hardware prices and improved network connectivity to 5G will drive economies.
ü üü
Apart from the OEM line fitment revenues, revenue from SaaS and data driven streams are multiplying the market value
Short-term
Long-term
Impact

*HMI may also be part of module specific to telematics^In India, GPS/GSM module are manufactured by limited players
Limited Domestic Manufacturing
Domestic Capabilities
Import dependency
Potential opportunities exist at both Tier 1and Component levels
Electronics Control Modules
PCB
Microcontroller
MOSFET/ IGBT Switches
Housing: Plastic/ Composites/ Aluminum
Circuit Protection, Safety Components
(Fuse, Breakers,Contactors)
Software/ Network
Integration
PCBA
Passive/ Discrete componentsI/O connectors
(HV and LV)CAN Interface, Wire Harness
Telematics Module
Auxiliary Battery
Applications Soware & Services
Software development (Firmware/UI/UX, API
Interface, Applications-Analytics, AI/ML)
Connectivity Platform
System Integration & Engineering (Design,
tools, Testing and Measurement)
Services (Operation & Maintenance, Hosted
services)
GPS / GSM module (GPRS)^
Micro processors & Memory
Microphone
In addition to all components of a typical Electronics Control Module:
Communication Interface
RS 485/ CAN/ UART
HMI*
Integrated WI-FI & Bluetooth module
Communication InterfaceRS 485/ CAN/ UART
84
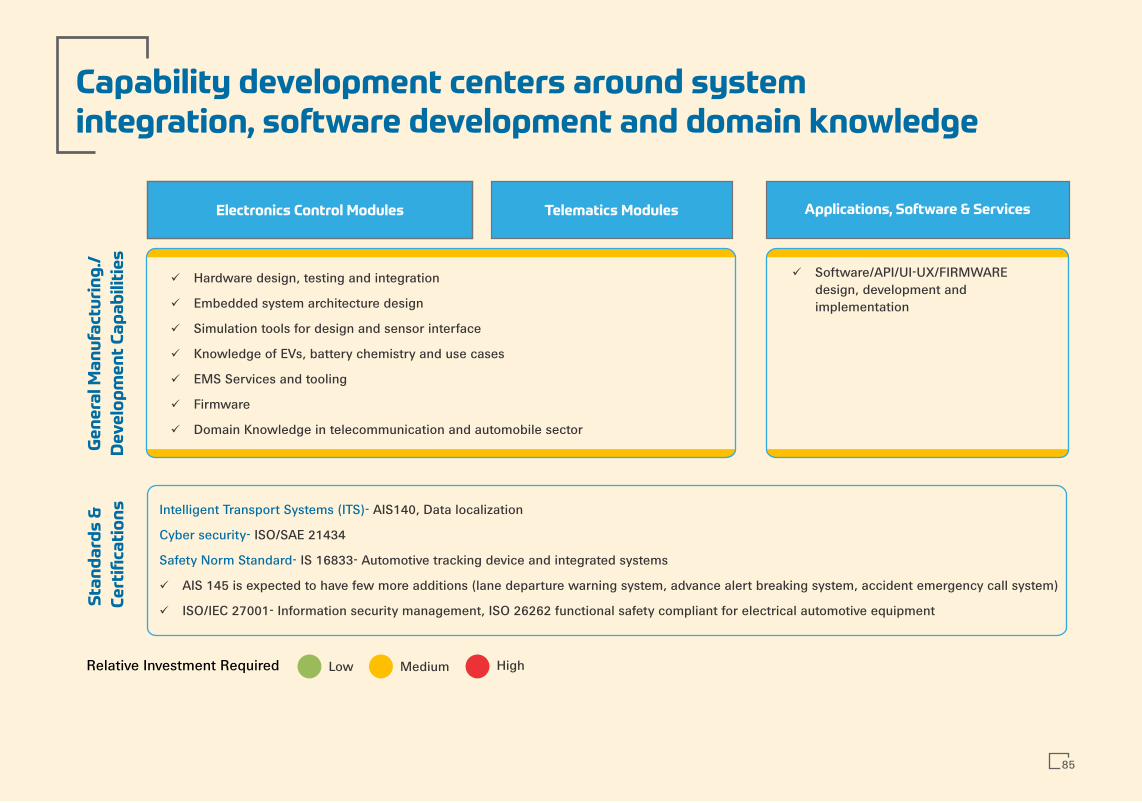
Electronics Control Modules Telematics Modules Applications, Soware & Services
Ge
ne
ral M
an
ufa
ctu
rin
g./
De
ve
lop
me
nt
Ca
pa
bil
itie
s
Low Medium HighRelative Investment Required
Sta
nd
ard
s &
Ce
rtifi
cati
on
s Intelligent Transport Systems (ITS)- AIS140, Data localization
Cyber security- ISO/SAE 21434
Safety Norm Standard- IS 16833- Automotive tracking device and integrated systems
ü AIS 145 is expected to have few more additions (lane departure warning system, advance alert breaking system, accident emergency call system)
ü ISO/IEC 27001- Information security management, ISO 26262 functional safety compliant for electrical automotive equipment
Capability development centers around systemintegration, soware development and domain knowledge
ü Hardware design, testing and integration
ü Embedded system architecture design
ü Simulation tools for design and sensor interface
ü Knowledge of EVs, battery chemistry and use cases
ü EMS Services and tooling
ü Firmware
ü Domain Knowledge in telecommunication and automobile sector
ü Software/API/UI-UX/FIRMWARE design, development and implementation
85

Telematics Modules Applications, Soware & ServicesElectronics Control Modules
The field requires continuous innovation andexpansion in functionalities to retain hold in the market
ü (intelligence based navigation, automated inspection of components etc.); Adoption of AI/MLOnboard diagnostics/ decision making; Real time predictive analytics & maintenance
ü Enhancement in featuressecurity
ü Subscription based services and aftermarket solutions
ü Increased functionality for multiple use cases
ü Firmware with ability to be updated over the air | Advancement in the software, power electronics and electrical/electronic (E/E) components
ü Domain Control Units (DCUs)/ Vehicle Control Units (VCUs) are the next level of evolution, consolidating the functionality of several individual control units with better cost-efficiencies
ü within Embedded IoT Telematics systems individual control modules, enabling direct connectivity with the cloud. E.g. IoT enabled BMS, IoT enabled VCU, eliminating need for a separate telematics device
Future Trends:
ü Connectivity enhancement: Enhancement of e-Sims & infrastructure | 5G enabled devices | Edge computing
ü V2X: From presently Vehicle to User, infrastructure and cloud network, V2X may expand to Vehicle to Vehicle, Pedestrian, and Power Grids
ü ADAS (Advanced driver-assistance systems) and DAS (Driver Assistance System), Voice enablement systems, PAS (Parking Assistance System)
ü Next-generation vehicle tracking systems
ü Prognostics
ü Digital TWIN
Future Trends:
ü Smart Edge Sensors
ü AI/ML integration
86
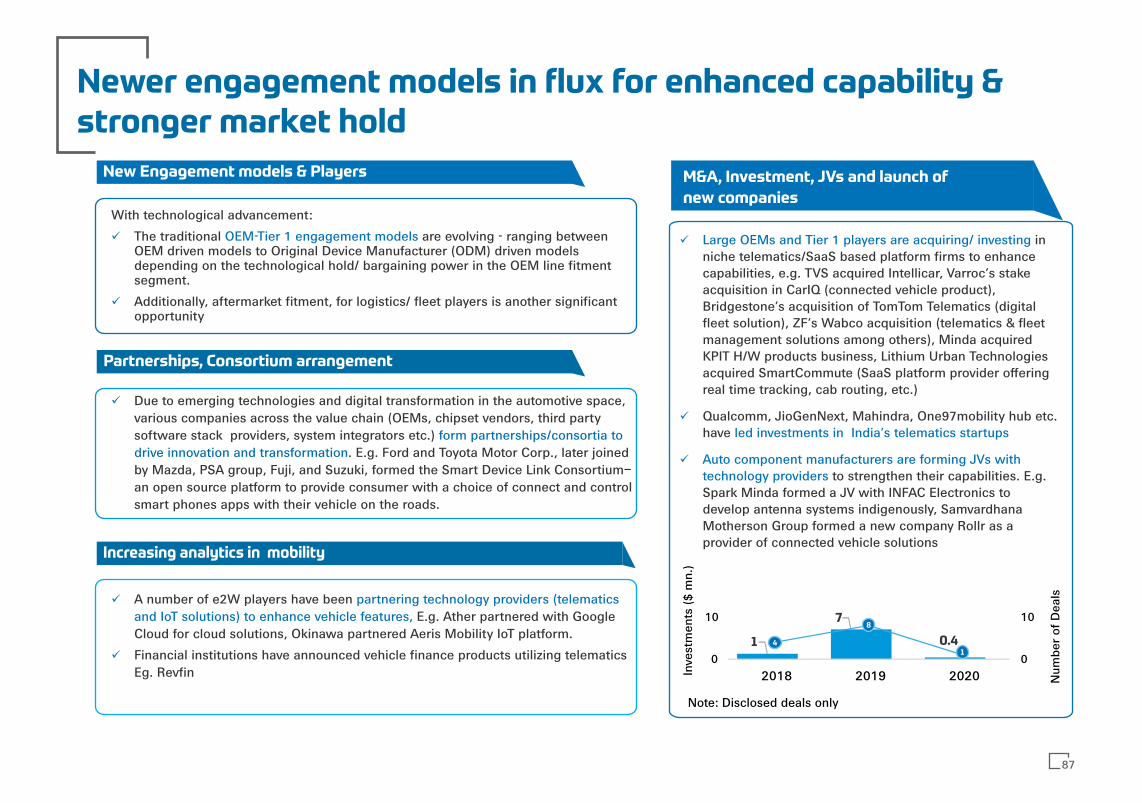
87
New Engagement models & Players
Partnerships, Consortium arrangement
Increasing analytics in mobility
Newer engagement models in flux for enhanced capability &stronger market hold
With technological advancement:
ü OEM-Tier 1 engagement modelsThe traditional are evolving - ranging between OEM driven models to Original Device Manufacturer (ODM) driven models depending on the technological hold/ bargaining power in the OEM line fitment segment.
ü Additionally, aftermarket fitment, for logistics/ fleet players is another significant opportunity
ü Due to emerging technologies and digital transformation in the automotive space, various companies across the value chain (OEMs, chipset vendors, third party software stack providers, system integrators etc.) form partnerships/consortia to drive innovation and transformation. E.g. Ford and Toyota Motor Corp., later joined by Mazda, PSA group, Fuji, and Suzuki, formed the Smart Device Link Consortium– an open source platform to provide consumer with a choice of connect and control smart phones apps with their vehicle on the roads.
ü partnering technology providers (telematics A number of e2W players have been and IoT solutions) to enhance vehicle features, E.g. Ather partnered with Google Cloud for cloud solutions, Okinawa partnered Aeris Mobility IoT platform.
ü Financial institutions have announced vehicle finance products utilizing telematics Eg. Revfin
M&A, Investment, JVs and launch of
new companies
ü Large OEMs and Tier 1 players are acquiring/ investing in niche telematics/SaaS based platform firms to enhance capabilities, e.g. TVS acquired Intellicar, Varroc’s stake acquisition in CarIQ (connected vehicle product), Bridgestone’s acquisition of TomTom Telematics (digital fleet solution), ZF’s Wabco acquisition (telematics & fleet management solutions among others), Minda acquired KPIT H/W products business, Lithium Urban Technologies acquired SmartCommute (SaaS platform provider offering real time tracking, cab routing, etc.)
ü Qualcomm, JioGenNext, Mahindra, One97mobility hub etc. have led investments in India’s telematics startups
ü Auto component manufacturers are forming JVs with technology providers to strengthen their capabilities. E.g. Spark Minda formed a JV with INFAC Electronics to develop antenna systems indigenously, Samvardhana Motherson Group formed a new company Rollr as a provider of connected vehicle solutions
7
0.4
8
10
10
0
10
2018 2019 2020 Num
ber
of D
eals
Inve
stm
ents
($
mn.
)
1 4
Note: Disclosed deals only
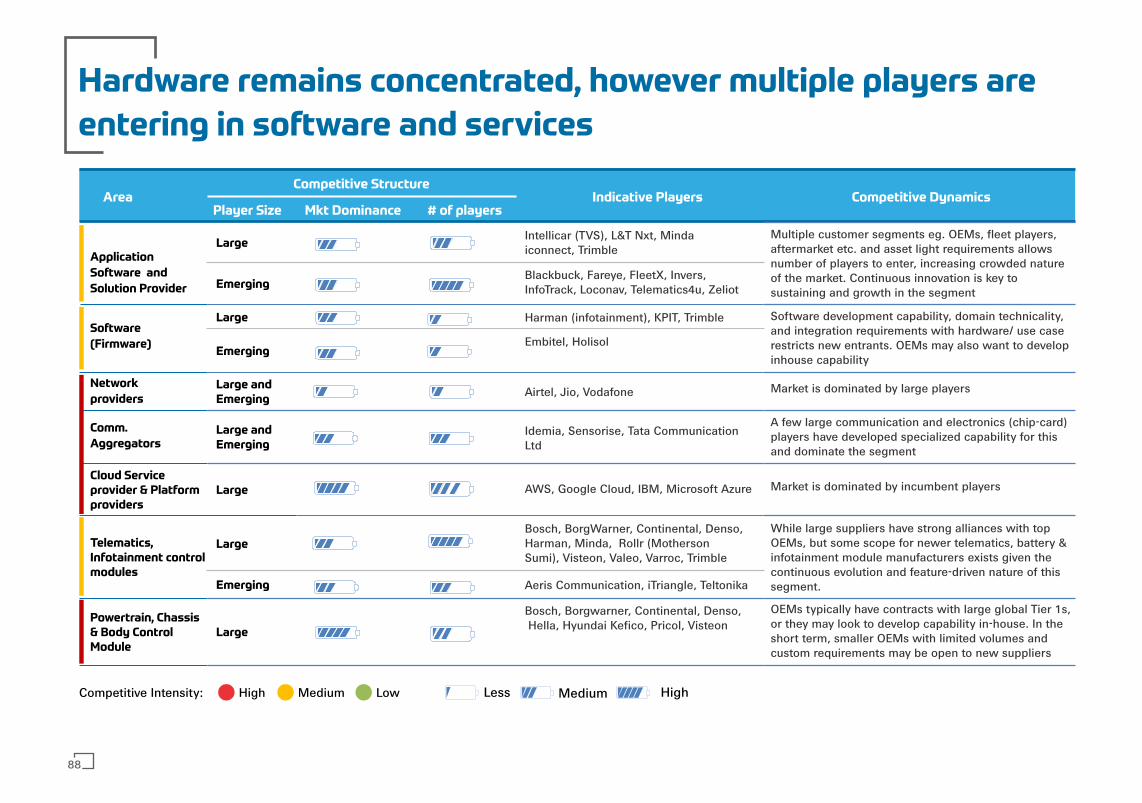
Hardware remains concentrated, however multiple players are
entering in soware and services
HighCompetitive Intensity: Medium Low Less Medium High
Application
Soware and
Solution Provider
Large Medium ManyIntellicar (TVS), L&T Nxt, Minda iconnect, Trimble
Emerging Medium ManyBlackbuck, Fareye, FleetX, Invers, InfoTrack, Loconav, Telematics4u, Zeliot
Soware
(Firmware)
Large Harman (infotainment), KPIT, Trimble
EmergingEmbitel, Holisol
Network
providersLarge and Emerging
Medium Many Airtel, Jio, Vodafone
Comm.
AggregatorsLarge and Emerging
Idemia, Sensorise, Tata Communication Ltd
Cloud Service provider & Platform providers
Large AWS, Google Cloud, IBM, Microsoft Azure
Telematics,Infotainment control modules
Large
Bosch, BorgWarner, Continental, Denso, Harman, Minda, Rollr (Motherson Sumi), Visteon, Valeo, Varroc, Trimble
Emerging Aeris Communication, iTriangle, Teltonika
Powertrain, Chassis & Body ControlModule
Large
Bosch, Borgwarner, Continental, Denso, Hella, Hyundai Kefico, Pricol, Visteon
AreaCompetitive Structure
Indicative Players Competitive DynamicsPlayer Size Mkt Dominance # of players
Multiple customer segments eg. OEMs, fleet players, aftermarket etc. and asset light requirements allows number of players to enter, increasing crowded nature of the market. Continuous innovation is key to sustaining and growth in the segment
Software development capability, domain technicality, and integration requirements with hardware/ use case restricts new entrants. OEMs may also want to develop inhouse capability
Market is dominated by large players
A few large communication and electronics (chip-card) players have developed specialized capability for this and dominate the segment
Market is dominated by incumbent players
While large suppliers have strong alliances with top OEMs, but some scope for newer telematics, battery & infotainment module manufacturers exists given the continuous evolution and feature-driven nature of this segment.
OEMs typically have contracts with large global Tier 1s, or they may look to develop capability in-house. In the short term, smaller OEMs with limited volumes and custom requirements may be open to new suppliers
88

89
Applications, soware and services with domain & development
capabilities offer scope for entry & growth
ü can Software Development capabilitiesbe leveraged along with building strong auto domain expertise for developing platforms & applications for specific use cases.
ü (hardware, System integrationsoftware & analytics) capability is key for provision of integrated solution & services
ü can Data driven business modelsbenefit stakeholders across EV, auto sector. It is imperative for enhancing functional analytics talent pools to develop such model in-house. through partnerships
ü Evaluating domain specific startup entities in the telematics, connectivity & analytics based solutions can provide a head start/ entry in the space, while working towards functionality improvements for larger customer wallet share/ tapping new segments
Short to Mid term
ü Software Development capabilities can be strengthened for developing full tack sservices
ü Consistent incremental value add through functionality improvement or new innovation solutions would be imperative for retaining market footprint in data driven business services
ü with Collaborationshardware providers and other value chain partners can be explored for a better localization & offering an integrated connectivity solution over specific modules
Mid to long term
EASE OF ENTRY(Basis Import Dependency, Competitive Intensity,
Investment & Skills Needed)
Low High1 3
Hig
hO
PPO
RTU
NIT
Y(B
asis
Indu
stry
Vol
ume
and
Mar
gin
Poss
ibili
ty)
Application Software
Solution Provider
Telematics, Infotainment
control modulesOther
Electronics Control
Modules
Software (Firmware)
Opportunity Vs. Ease of Entry
Illustrative Representation


EV Component Opportunity Overview
03
3.1 Introduction
3.2 Component Segments
3.2.1 Powertrain & Power Electronics
3.2.2 Battery & Associated Components
3.2.3 Connectivity & Control Systems
3.2.4 Other Components
Photo by Kumpan
Electric on Unsplash
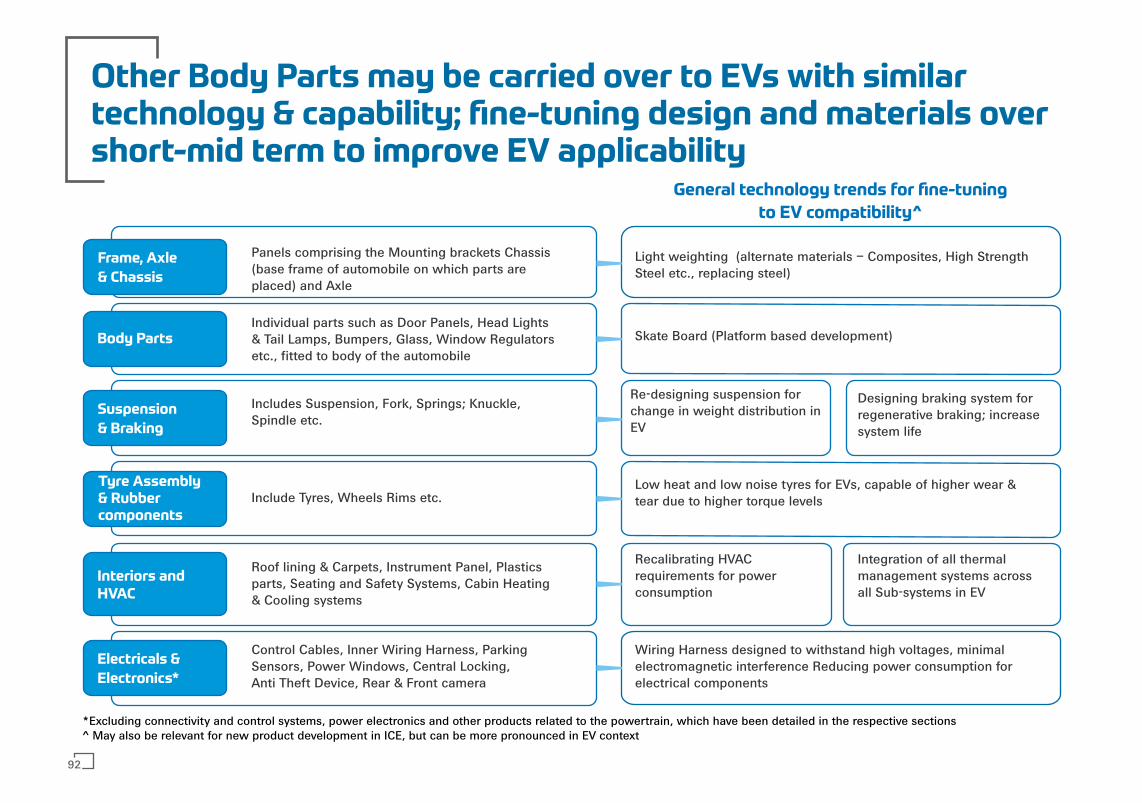
General technology trends for fine-tuning
to EV compatibility^
Other Body Parts may be carried over to EVs with similartechnology & capability; fine-tuning design and materials overshort-mid term to improve EV applicability
Frame, Axle
& Chassis
Wiring Harness designed to withstand high voltages, minimal electromagnetic interference Reducing power consumption for electrical components
Light weighting (alternate materials – Composites, High Strength Steel etc., replacing steel)
Skate Board (Platform based development)
Designing braking system for regenerative braking; increase system life
Low heat and low noise tyres for EVs, capable of higher wear & tear due to higher torque levels
Body Parts
Suspension
& Braking
Tyre Assembly& Rubbercomponents
Interiors andHVAC
Electricals &
Electronics*
Panels comprising the Mounting brackets Chassis (base frame of automobile on which parts are placed) and Axle
Control Cables, Inner Wiring Harness, Parking Sensors, Power Windows, Central Locking, Anti Theft Device, Rear & Front camera
Individual parts such as Door Panels, Head Lights & Tail Lamps, Bumpers, Glass, Window Regulators etc., fitted to body of the automobile
Includes Suspension, Fork, Springs; Knuckle, Spindle etc.
Include Tyres, Wheels Rims etc.
Roof lining & Carpets, Instrument Panel, Plastics parts, Seating and Safety Systems, Cabin Heating & Cooling systems
Integration of all thermal management systems across all Sub-systems in EV
Re-designing suspension for change in weight distribution in EV
*Excluding connectivity and control systems, power electronics and other products related to the powertrain, which have been detailed in the respective sections^ May also be relevant for new product development in ICE, but can be more pronounced in EV context
Recalibrating HVAC requirements for power consumption
92
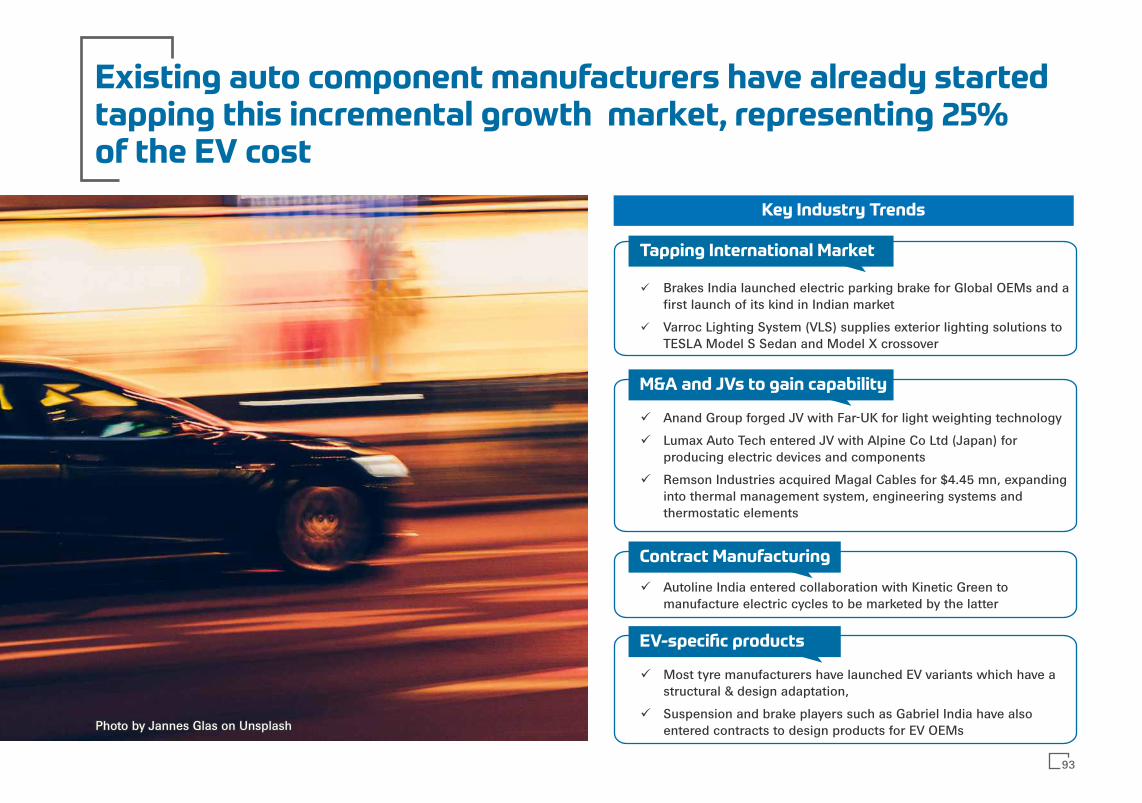
Existing auto component manufacturers have already startedtapping this incremental growth market, representing 25%of the EV cost
Key Industry Trends
Tapping International Market
ü Brakes India launched electric parking brake for Global OEMs and a first launch of its kind in Indian market
ü Varroc Lighting System (VLS) supplies exterior lighting solutions to TESLA Model S Sedan and Model X crossover
M&A and JVs to gain capability
ü Anand Group forged JV with Far-UK for light weighting technology
ü Lumax Auto Tech entered JV with Alpine Co Ltd (Japan) for producing electric devices and components
ü Remson Industries acquired Magal Cables for $4.45 mn, expanding into thermal management system, engineering systems and thermostatic elements
Contract Manufacturing
ü Autoline India entered collaboration with Kinetic Green to manufacture electric cycles to be marketed by the latter
EV-specific products
ü Most tyre manufacturers have launched EV variants which have a structural & design adaptation,
ü Suspension and brake players such as Gabriel India have also entered contracts to design products for EV OEMs
93
Photo by Jannes Glas on UnsplashPhoto by Jannes Glas on UnsplashPhoto by Jannes Glas on Unsplash
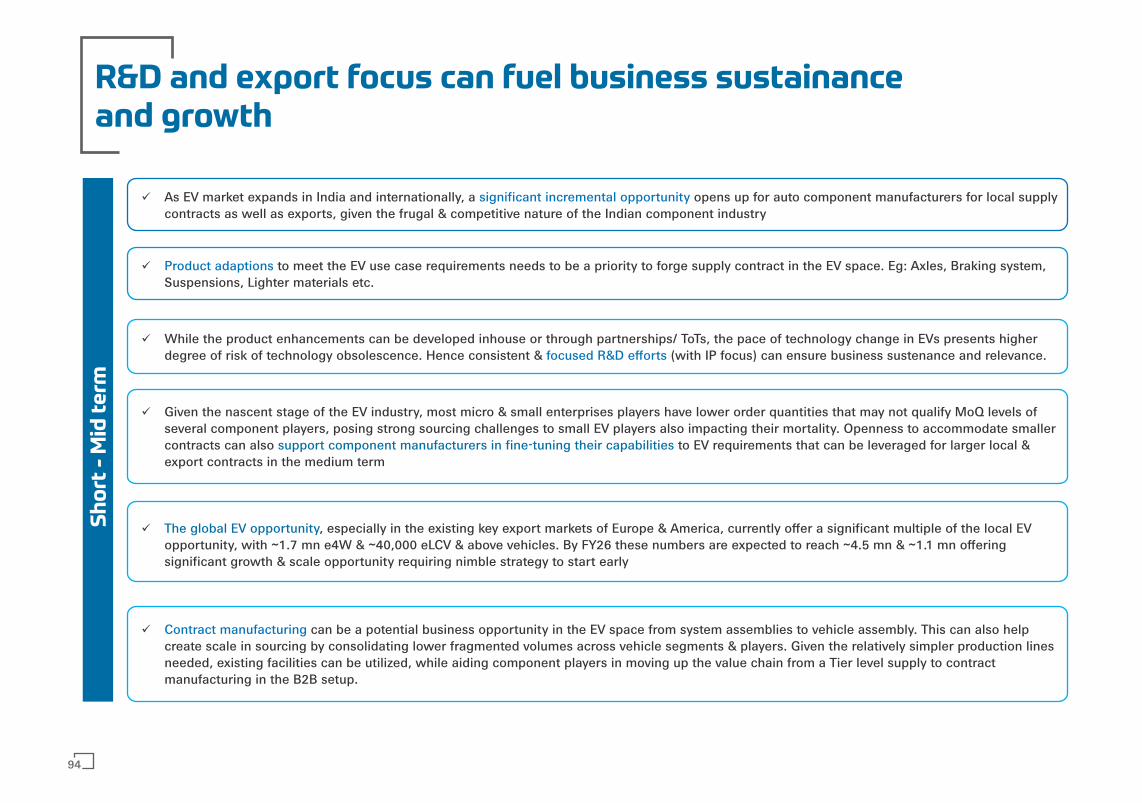
ü As EV market expands in India and internationally, a opens up for auto component manufacturers for local supply significant incremental opportunitycontracts as well as exports, given the frugal & competitive nature of the Indian component industry
ü to meet the EV use case requirements needs to be a priority to forge supply contract in the EV space. Eg: Axles, Braking system, Product adaptionsSuspensions, Lighter materials etc.
ü While the product enhancements can be developed inhouse or through partnerships/ ToTs, the pace of technology change in EVs presents higher degree of risk of technology obsolescence. Hence consistent & (with IP focus) can ensure business sustenance and relevance. focused R&D efforts
ü Given the nascent stage of the EV industry, most micro & small enterprises players have lower order quantities that may not qualify MoQ levels of several component players, posing strong sourcing challenges to small EV players also impacting their mortality. Openness to accommodate smaller contracts can also to EV requirements that can be leveraged for larger local & support component manufacturers in fine-tuning their capabilitiesexport contracts in the medium term
ü , especially in the existing key export markets of Europe & America, currently offer a significant multiple of the local EV The global EV opportunityopportunity, with ~1.7 mn e4W & ~40,000 eLCV & above vehicles. By FY26 these numbers are expected to reach ~4.5 mn & ~1.1 mn offering significant growth & scale opportunity requiring nimble strategy to start early
ü can be a potential business opportunity in the EV space from system assemblies to vehicle assembly. This can also help Contract manufacturingcreate scale in sourcing by consolidating lower fragmented volumes across vehicle segments & players. Given the relatively simpler production lines needed, existing facilities can be utilized, while aiding component players in moving up the value chain from a Tier level supply to contract manufacturing in the B2B setup.
R&D and export focus can fuel business sustainanceand growth
Sh
ort
- M
id t
erm
94
Recommendations
04
Photo by Kumpan
Electric on Unsplash
Central Government
Strategic Roadmap for EV and Component Manufacturing
Time-bound , aligned to vision of EV development in India & mapped against resources & capabilities, leading to action oriented planmid-long term demand & supply side policy interventions.
EV Component focused Segmental Committee
A platform with wide representation of to policy makers, EV component industry, technology research agencies, and startupsdeliberate on broad-based ecosystem development for enhancing competitiveness, driving standards and localization.
Convergence
Overarching framework for through target setting, sector & sub-sector focused schemes, channelizing policy and its implementationR&D and innovation led initiatives, startup facilitation, skill development efforts & associated incentivization.
Setting up of additional for technical guidance, designing, simulation testing of EV components, systems in ü test capacities/ labsaddition to the commendable ARAI EV CoE can create access to increasing startups and EV developers across India.
ü Channeling funding from various GoI schemes, multi-laterals, grants by development institutions, etc. in a coordinated manner for developing the ecosystem at large, including startups.
96
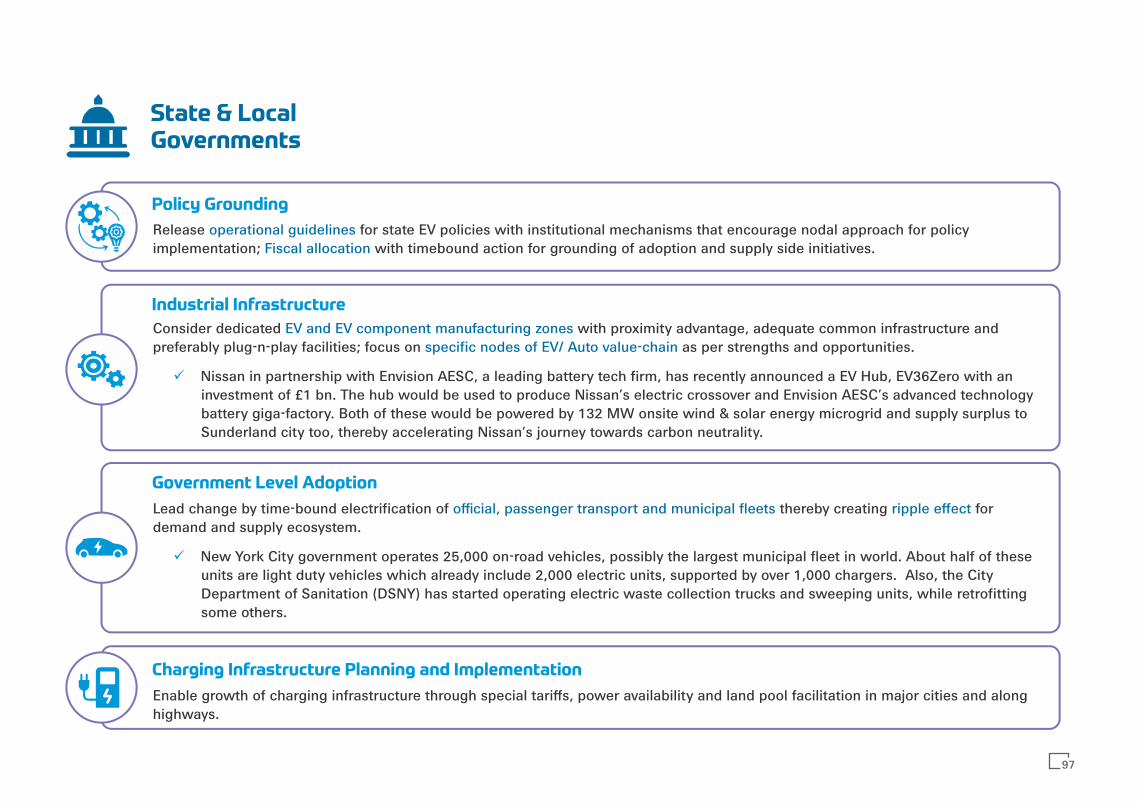
State & Local Governments
Policy Grounding
Release for state EV policies with institutional mechanisms that encourage nodal approach for policy operational guidelinesimplementation; with timebound action for grounding of adoption and supply side initiatives.Fiscal allocation
Industrial Infrastructure
Consider dedicated with proximity advantage, adequate common infrastructure and EV and EV component manufacturing zonespreferably plug-n-play facilities; focus on as per strengths and opportunities.specific nodes of EV/ Auto value-chain
Nissan in partnership with Envision AESC, a leading battery tech firm, has recently announced a EV Hub, EV36Zero with an ü
investment of £1 bn. The hub would be used to produce Nissan’s electric crossover and Envision AESC’s advanced technology battery giga-factory. Both of these would be powered by 132 MW onsite wind & solar energy microgrid and supply surplus to Sunderland city too, thereby accelerating Nissan’s journey towards carbon neutrality.
Government Level Adoption
Lead change by time-bound electrification of thereby creating for official, passenger transport and municipal fleets ripple effectdemand and supply ecosystem.
New York City government operates 25,000 on-road vehicles, possibly the largest municipal fleet in world. About half of these ü
units are light duty vehicles which already include 2,000 electric units, supported by over 1,000 chargers. Also, the City Department of Sanitation (DSNY) has started operating electric waste collection trucks and sweeping units, while retrofitting some others.
Charging Infrastructure Planning and Implementation
Enable growth of charging infrastructure through special tariffs, power availability and land pool facilitation in major cities and along highways.
97
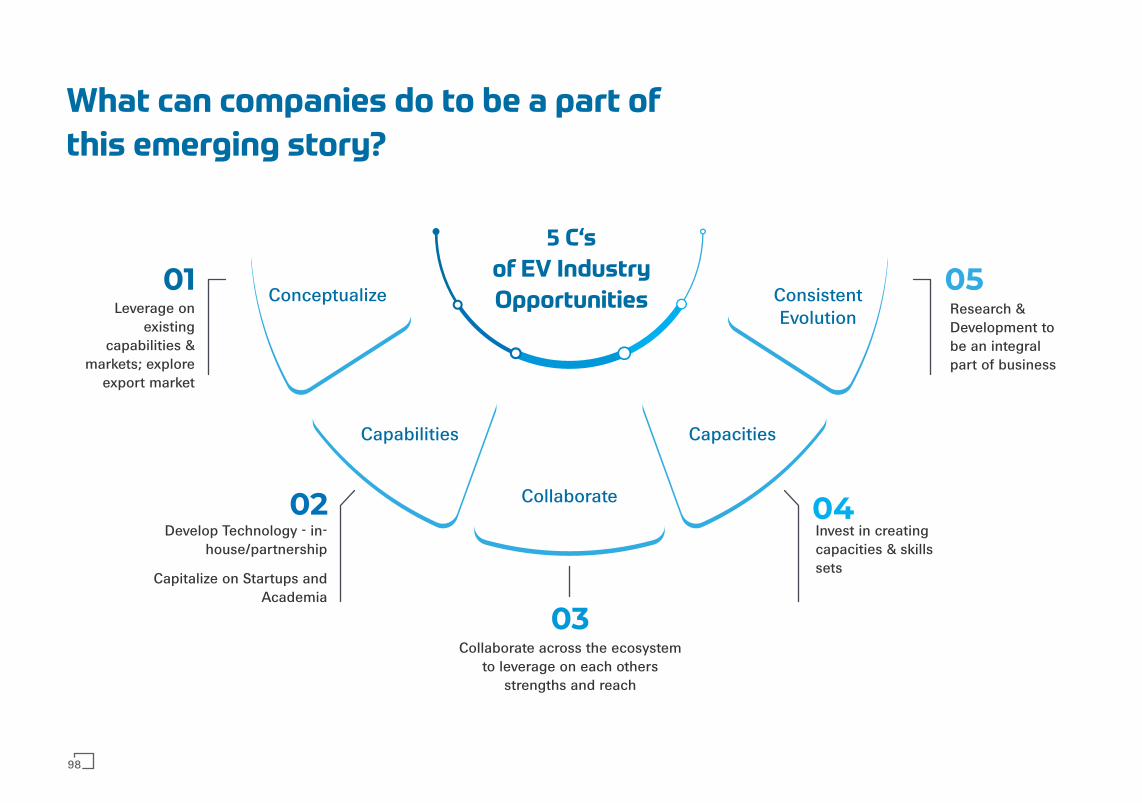
What can companies do to be a part of
this emerging story?
03
0402
01 05
5 C‘s
of EV Industry
OpportunitiesConceptualize
Capabilities
Collaborate
Capacities
ConsistentEvolutionLeverage on
existing capabilities &
markets; explore export market
Develop Technology - in-house/partnership
Capitalize on Startups and Academia
Collaborate across the ecosystem to leverage on each others
strengths and reach
Invest in creating capacities & skills sets
Research & Development to be an integral part of business
98
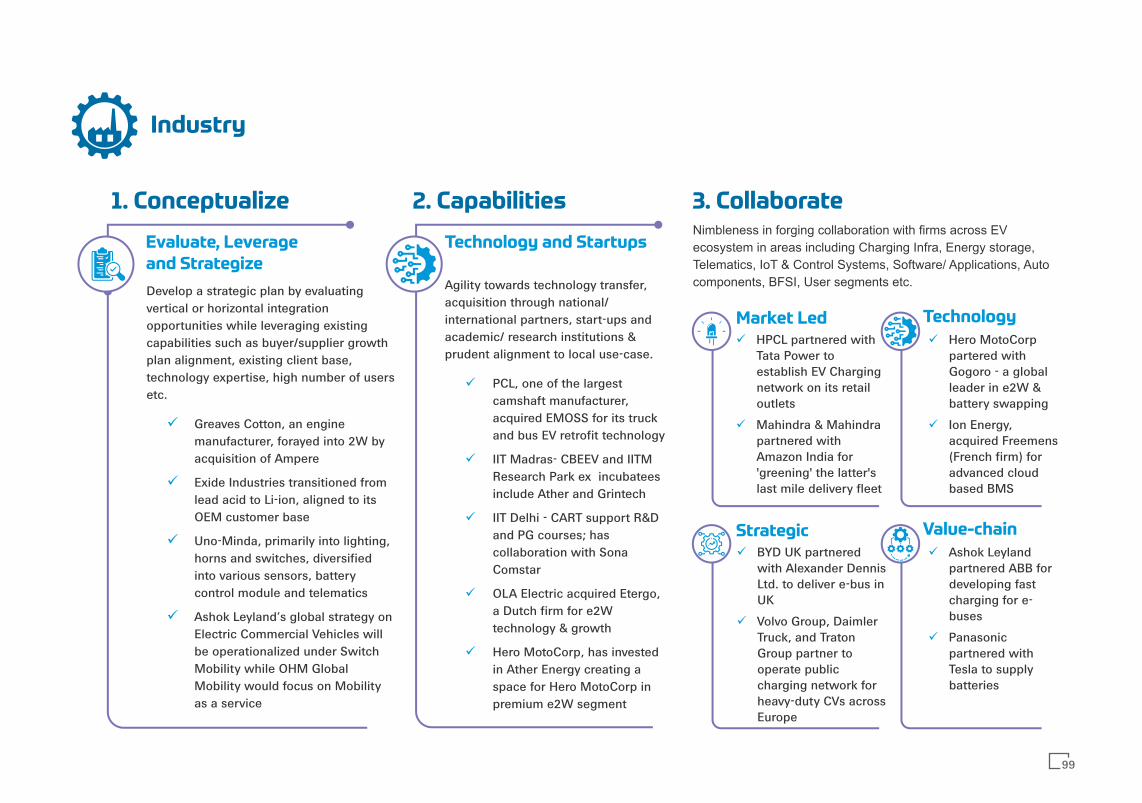
1. Conceptualize
Evaluate, Leverageand Strategize
Develop a strategic plan by evaluating vertical or horizontal integration opportunities while leveraging existing capabilities such as buyer/supplier growth plan alignment, existing client base, technology expertise, high number of users etc.
Greaves Cotton, an engine ümanufacturer, forayed into 2W by acquisition of Ampere
Exide Industries transitioned from ülead acid to Li-ion, aligned to its OEM customer base
Uno-Minda, primarily into lighting, ühorns and switches, diversified into various sensors, battery control module and telematics
Ashok Leyland’s global strategy on üElectric Commercial Vehicles will be operationalized under Switch Mobility while OHM Global Mobility would focus on Mobility as a service
2. Capabilities
Technology and Startups
Agility towards technology transfer, acquisition through national/ international partners, start-ups and academic/ research institutions & prudent alignment to local use-case.
PCL, one of the largest ü
camshaft manufacturer, acquired EMOSS for its truck and bus EV retrofit technology
IIT Madras- CBEEV and IITM ü
Research Park ex incubatees include Ather and Grintech
IIT Delhi - CART support R&D ü
and PG courses; has collaboration with Sona Comstar
OLA Electric acquired Etergo, ü
a Dutch firm for e2W technology & growth
Hero MotoCorp, has invested ü
in Ather Energy creating a space for Hero MotoCorp in premium e2W segment
Market Ledü HPCL partnered with
Tata Power to establish EV Charging network on its retail outlets
ü Mahindra & Mahindra partnered with Amazon India for 'greening' the latter's last mile delivery fleet
Technology
3. CollaborateNimbleness in forging collaboration with rms across EV ecosystem in areas including Charging Infra, Energy storage, Telematics, IoT & Control Systems, Software/ Applications, Auto components, BFSI, User segments etc.
ü Hero MotoCorp partered with Gogoro - a global leader in e2W & battery swapping
ü Ion Energy, acquired Freemens (French firm) for advanced cloud based BMS
Strategicü BYD UK partnered
with Alexander Dennis Ltd. to deliver e-bus in UK
ü Volvo Group, Daimler Truck, and Traton Group partner to operate public charging network for heavy-duty CVs across Europe
Value-chain
ü Ashok Leyland partnered ABB for developing fast charging for e-buses
ü Panasonic partnered with Tesla to supply batteries
Industry
99
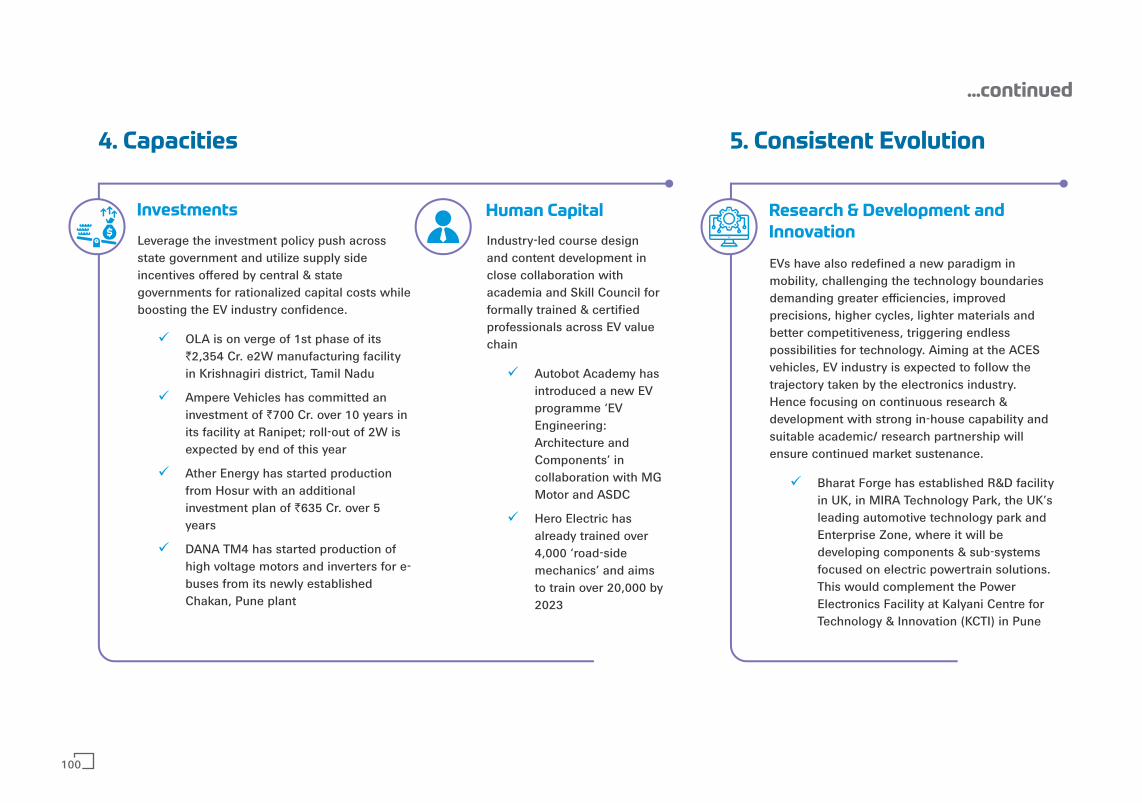
4. Capacities
Investments
Leverage the investment policy push across state government and utilize supply side incentives offered by central & state governments for rationalized capital costs while boosting the EV industry confidence.
OLA is on verge of 1st phase of itsü`2,354 Cr. e2W manufacturing facility in Krishnagiri district, Tamil Nadu
Ampere Vehicles has committed an üinvestment of `700 Cr. over 10 years in its facility at Ranipet; roll-out of 2W is expected by end of this year
Ather Energy has started production üfrom Hosur with an additional investment plan of `635 Cr. over 5 years
DANA TM4 has started production of ühigh voltage motors and inverters for e-buses from its newly established Chakan, Pune plant
Industry-led course design and content development in close collaboration with academia and Skill Council for formally trained & certified professionals across EV value chain
Autobot Academy has üintroduced a new EV programme ‘EV Engineering: Architecture and Components’ in collaboration with MG Motor and ASDC
Hero Electric has üalready trained over 4,000 ‘road-side mechanics’ and aims to train over 20,000 by 2023
Human Capital
5. Consistent Evolution
Research & Development andInnovation
EVs have also redefined a new paradigm in mobility, challenging the technology boundaries demanding greater efficiencies, improved precisions, higher cycles, lighter materials and better competitiveness, triggering endless possibilities for technology. Aiming at the ACES vehicles, EV industry is expected to follow the trajectory taken by the electronics industry. Hence focusing on continuous research & development with strong in-house capability and suitable academic/ research partnership will ensure continued market sustenance.
Bharat Forge has established R&D facility üin UK, in MIRA Technology Park, the UK’s leading automotive technology park and Enterprise Zone, where it will be developing components & sub-systems focused on electric powertrain solutions. This would complement the Power Electronics Facility at Kalyani Centre for Technology & Innovation (KCTI) in Pune
...continued
100

EV Manufacturing: Policy Overview
05
Photo by Kumpan
Electric on Unsplash
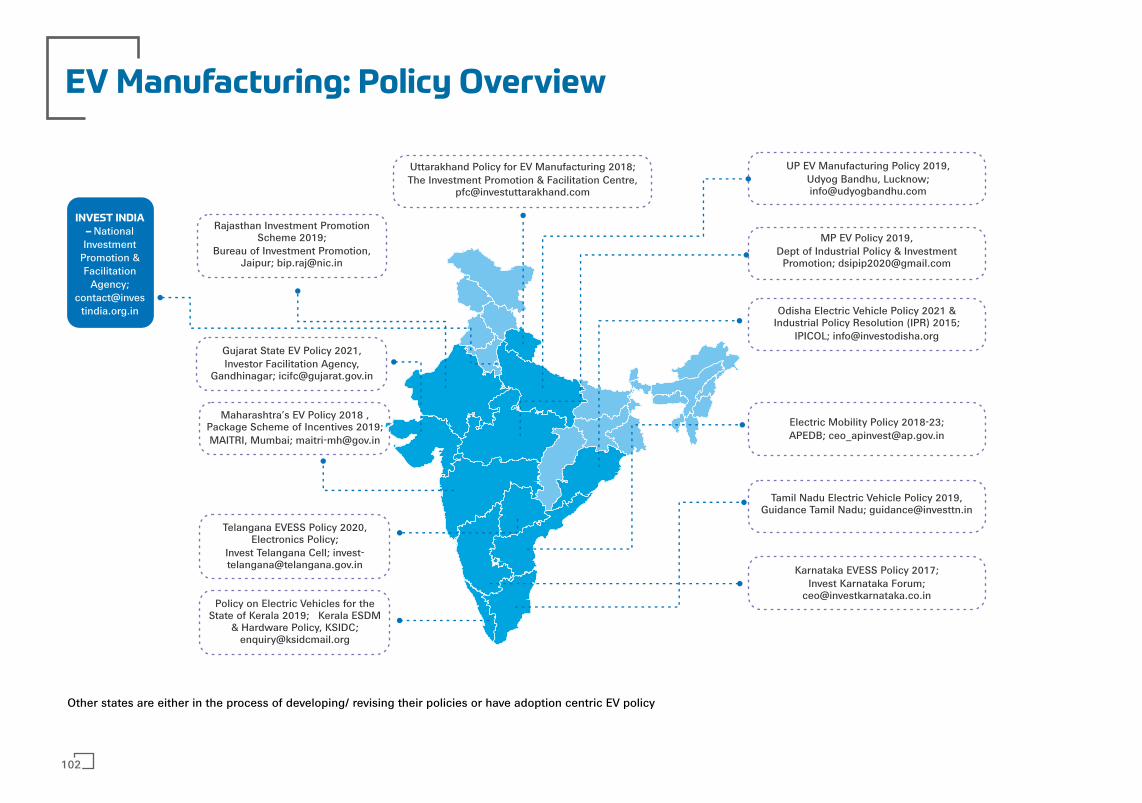
EV Manufacturing: Policy Overview
Other states are either in the process of developing/ revising their policies or have adoption centric EV policy
Uttarakhand Policy for EV Manufacturing 2018; The Investment Promotion & Facilitation Centre,
UP EV Manufacturing Policy 2019, Udyog Bandhu, Lucknow; [email protected]
Rajasthan Investment Promotion Scheme 2019;
Bureau of Investment Promotion, Jaipur; [email protected]
Gujarat State EV Policy 2021, Investor Facilitation Agency,
Gandhinagar; [email protected]
Odisha Electric Vehicle Policy 2021 & Industrial Policy Resolution (IPR) 2015;
IPICOL; [email protected]
Maharashtra’s EV Policy 2018 , Package Scheme of Incentives 2019; MAITRI, Mumbai; [email protected]
Telangana EVESS Policy 2020, Electronics Policy;
Invest Telangana Cell; [email protected]
Electric Mobility Policy 2018-23; APEDB; [email protected]
Tamil Nadu Electric Vehicle Policy 2019, Guidance Tamil Nadu; [email protected]
Karnataka EVESS Policy 2017; Invest Karnataka Forum;
[email protected] Policy on Electric Vehicles for the
State of Kerala 2019; Kerala ESDM & Hardware Policy, KSIDC;
INVEST INDIA – National Investment
Promotion & Facilitation
Agency; contact@inves
tindia.org.in
MP EV Policy 2019, Dept of Industrial Policy & Investment
Promotion; [email protected]
102
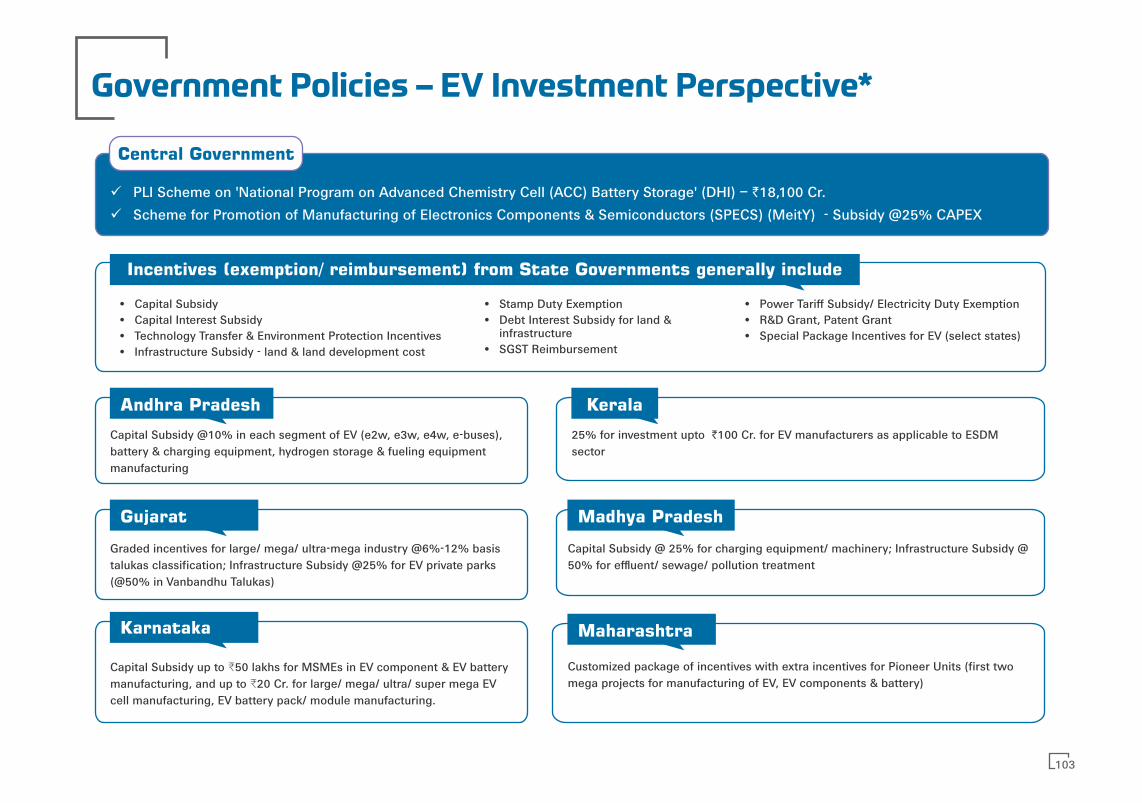
103
Government Policies – EV Investment Perspective*
ü PLI Scheme on 'National Program on Advanced Chemistry Cell (ACC) Battery Storage' (DHI) – `18,100 Cr.
ü Scheme for Promotion of Manufacturing of Electronics Components & Semiconductors (SPECS) (MeitY) - Subsidy @25% CAPEX
Andhra Pradesh
Capital Subsidy @10% in each segment of EV (e2w, e3w, e4w, e-buses), battery & charging equipment, hydrogen storage & fueling equipment manufacturing
Gujarat
Graded incentives for large/ mega/ ultra-mega industry @6%-12% basis talukas classification; Infrastructure Subsidy @25% for EV private parks (@50% in Vanbandhu Talukas)
Karnataka
Capital Subsidy up to ₹50 lakhs for MSMEs in EV component & EV battery manufacturing, and up to ₹20 Cr. for large/ mega/ ultra/ super mega EV cell manufacturing, EV battery pack/ module manufacturing.
25% for investment upto �`100 Cr. for EV manufacturers as applicable to ESDM sector
Madhya Pradesh
Capital Subsidy @ 25% for charging equipment/ machinery; Infrastructure Subsidy @ 50% for effluent/ sewage/ pollution treatment
Maharashtra
Customized package of incentives with extra incentives for Pioneer Units (first two mega projects for manufacturing of EV, EV components & battery)
Incentives (exemption/ reimbursement) from State Governments generally include
• Capital Subsidy• Capital Interest Subsidy• Technology Transfer & Environment Protection Incentives • Infrastructure Subsidy - land & land development cost
• Stamp Duty Exemption• Debt Interest Subsidy for land &
infrastructure• SGST Reimbursement
• Power Tariff Subsidy/ Electricity Duty Exemption• R&D Grant, Patent Grant• Special Package Incentives for EV (select states)
Kerala
Central Government

Odisha
Capital Subsidy @5% for new small & micro EV battery manufacturing unit (30% for SC-/ ST-/ women-led); Exemption from land premium
Rajasthan
Capital Subsidy @25% of investment (up to `50 lakhs) for unit investing `25 Cr. or more in EV manufacturing
Tamil Nadu
15% Capital Subsidy for intermediate products for manufacture of EV & charging infrastructure; higher capital subsidy of 20% of investment over 20 years for EV battery manufacturing units
Telangana
Capital Subsidy @20% capped at `30 Cr. for Mega Enterprises & `10 Cr. for electronics & subsidiaries
Uttar Pradesh
Capital Subsidy on fixed capital investment @25% for charging stations; @15% for ESDM units (additional 10% for EV & auto electronics); Capital Interest Subsidy for 5 years @50% for battery recycling plants
Uttarakhand
Land Concession in SIIDCUL Industrial area @ 5% for large industrial investment; @15% for large industry; @25% for mega industry & 30% for ultra mega industry
...continued
104

105
Abbreviations
$ US Dollar
AC Alternating Current
ADAS Advanced driver-assistance systems
AEC Automotive Electronics Council
AI Artificial Intelligence
AIS Automotive Industry Standards
API Application Programming Interface
ARAI Automotive Research Association of India
B2B Business-to-business
B2C Business-to-consumer
BaaS Battery-as-a-Service
BCD Basic Customs Duty
BHEL Bharat Heavy Electricals Limited
BLDC Brushless DC
BMS Battery management system
bn Billion
CAFE Corporate Average Fuel Economy
CAGR Compound Annual Growth Rate
CAN Bus Controller Area Network Bus
CECRI Central Electro Chemical Research Institute
CESL Convergence Energy Services Limited
CNG Compressed natural gas
CoE Center of Excellence
Cr. Crore
CSIR Council of Scientific & Industrial Research
DAS Driver Assistance System
DC Direct Current
DCU Domain Control Units
DHI Department of Heavy Industry, Ministry of Heavy Industries & Public Enterprises
EESL Energy Efficiency Services Limited
EMS Electronics Manufacturing Services
EV Electric Vehicle
EVSE Electric vehicle supply equipment
FAME Faster Adoption and Manufacturing of Electric Vehicles in India
FET Field-effect Transistor
GaN Gallium Nitride
GHG Greenhouse Gas
GoI Government of India
GPRS General Packet Radio Service
GPS Global Positioning System
GSM Global System for Mobile
H/W Hardware
HCV Heavy Commercial Vehicle
HMI Human-Machine Interface
HPCL Hindustan Petroleum Corporation Limited
HS High Speed
HV High Voltage
HVAC Heating, Ventilation, and Air Conditioning
I/O Input/Output
IC Integrated Circuit
ICE Internal Combustion Engine
ICRFB Iron-chromium redox flow battery
IEA International Energy Agency
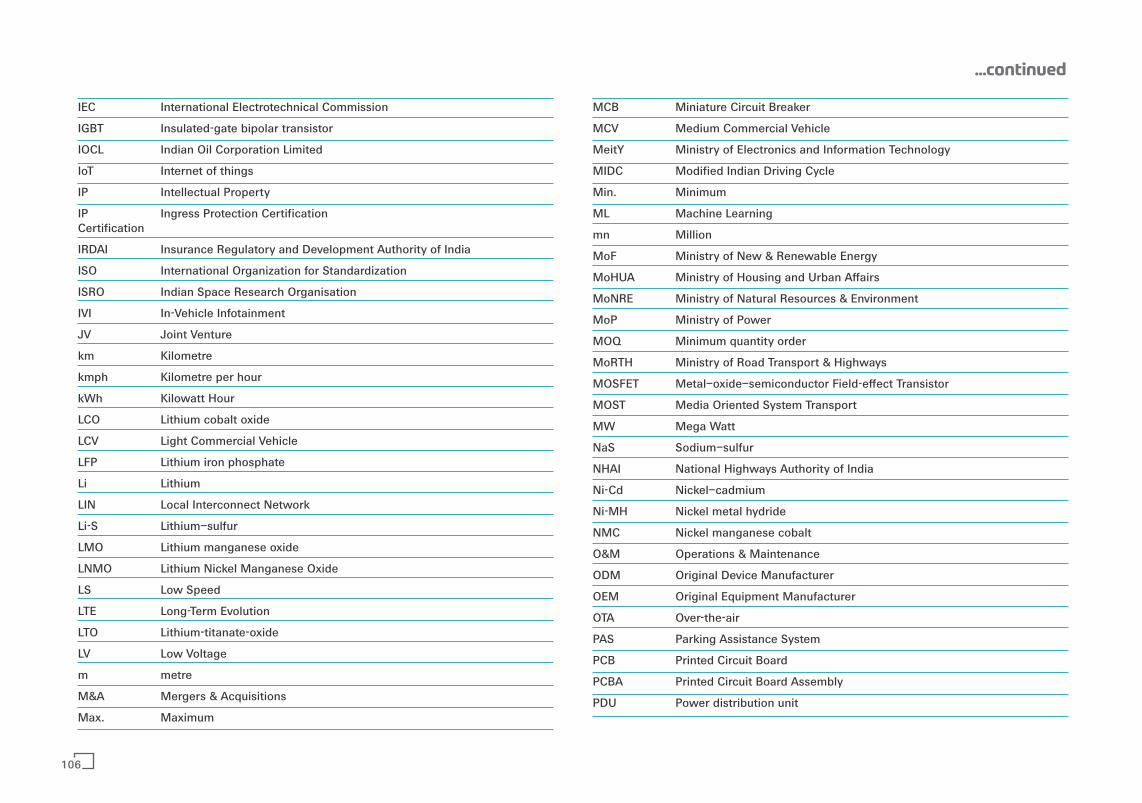
IEC International Electrotechnical Commission
IGBT Insulated-gate bipolar transistor
IOCL Indian Oil Corporation Limited
IoT Internet of things
IP Intellectual Property
IP Ingress Protection CertificationCertification
IRDAI Insurance Regulatory and Development Authority of India
ISO International Organization for Standardization
ISRO Indian Space Research Organisation
IVI In-Vehicle Infotainment
JV Joint Venture
km Kilometre
kmph Kilometre per hour
kWh Kilowatt Hour
LCO Lithium cobalt oxide
LCV Light Commercial Vehicle
LFP Lithium iron phosphate
Li Lithium
LIN Local Interconnect Network
Li-S Lithium–sulfur
LMO Lithium manganese oxide
LNMO Lithium Nickel Manganese Oxide
LS Low Speed
LTE Long-Term Evolution
LTO Lithium-titanate-oxide
LV Low Voltage
m metre
M&A Mergers & Acquisitions
Max. Maximum
MCB Miniature Circuit Breaker
MCV Medium Commercial Vehicle
MeitY Ministry of Electronics and Information Technology
MIDC Modified Indian Driving Cycle
Min. Minimum
ML Machine Learning
mn Million
MoF Ministry of New & Renewable Energy
MoHUA Ministry of Housing and Urban Affairs
MoNRE Ministry of Natural Resources & Environment
MoP Ministry of Power
MOQ Minimum quantity order
MoRTH Ministry of Road Transport & Highways
MOSFET Metal–oxide–semiconductor Field-effect Transistor
MOST Media Oriented System Transport
MW Mega Watt
NaS Sodium–sulfur
NHAI National Highways Authority of India
Ni-Cd Nickel–cadmium
Ni-MH Nickel metal hydride
NMC Nickel manganese cobalt
O&M Operations & Maintenance
ODM Original Device Manufacturer
OEM Original Equipment Manufacturer
OTA Over-the-air
PAS Parking Assistance System
PCB Printed Circuit Board
PCBA Printed Circuit Board Assembly
PDU Power distribution unit
...continued
106
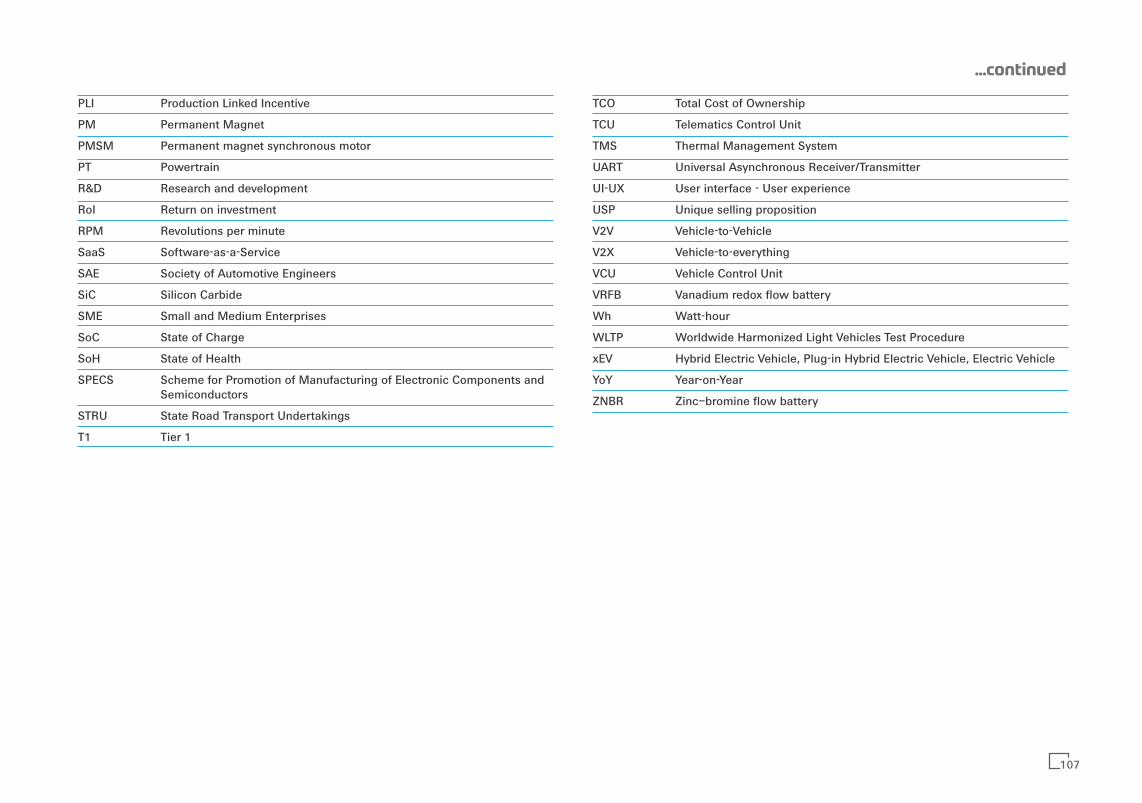
107
PLI Production Linked Incentive
PM Permanent Magnet
PMSM Permanent magnet synchronous motor
PT Powertrain
R&D Research and development
RoI Return on investment
RPM Revolutions per minute
SaaS Software-as-a-Service
SAE Society of Automotive Engineers
SiC Silicon Carbide
SME Small and Medium Enterprises
SoC State of Charge
SoH State of Health
SPECS Scheme for Promotion of Manufacturing of Electronic Components and Semiconductors
STRU State Road Transport Undertakings
T1 Tier 1
TCO Total Cost of Ownership
TCU Telematics Control Unit
TMS Thermal Management System
UART Universal Asynchronous Receiver/Transmitter
UI-UX User interface - User experience
USP Unique selling proposition
V2V Vehicle-to-Vehicle
V2X Vehicle-to-everything
VCU Vehicle Control Unit
VRFB Vanadium redox flow battery
Wh Watt-hour
WLTP Worldwide Harmonized Light Vehicles Test Procedure
xEV Hybrid Electric Vehicle, Plug-in Hybrid Electric Vehicle, Electric Vehicle
YoY Year-on-Year
ZNBR Zinc–bromine flow battery
...continued

The Automotive Component Manufacturers Association of India (ACMA) is the apex body representing the interest of the Indian Auto Component Industry. Its membership of over 850 manufacturers contributes to more than 85 per cent of the auto component industry's turnover in the organised sector. ACMA is an ISO 9001:2015 Certified Association.
ACMA's charter is to develop a globally competitive Indian Auto Component Industry & strengthen its role in national economic development as also promote business through international alliances. ACMA's active involvement in trade promotion, technology up-gradation, quality enhancement & collection and dissemination of information has made it a vital catalyst for the component industry's development in India. Its other activities include participation in international trade fairs, sending trade delegations overseas and bringing out publications on various subjects related to the automotive industry.
ACMA is represented on a number of panels, committees and councils of the Government of India through which it helps in the formulation of policies pertaining to the Indian automotive industry.
Further information and data on the Indian automotive industry is available on the ACMA Website: www.acma.in
YES BANK is a 'Full Service Commercial Bank' providing a complete range of products, services and technology driven digital offerings, catering to Retail, MSME as well as corporate clients.
YES BANK operates its Investment banking, Merchant banking & Brokerage businesses through YES SECURITIES and its Mutual Fund business through YES Asset Management (India) Limited, both wholly owned subsidiaries of the Bank. Headquartered in Mumbai, it has a pan-India presence across all 28 states and 8 Union Territories in India including an IBU at GIFT City, and a Representative Office in Abu Dhabi.
For more information, please visit the Bank's website at www.yesbank.in
Corporate & Government Advisory (CGA)
YES BANK is deeply committed to India’s transition towards sustainable mobility and development of a robust EV value chain in the country. The Corporate & Government Advisory (CGA) group has been engaging with Central & State Governments and industry players to offer policy, strategic and business advisory services. CGA is working with various State Governments for developing/ reviewing their State EV Policy and investment promotion initiatives for EV-led manufacturing. The group has also supported several STUs, CTUs, Smart Cities and ULBs for deployment of e-buses and creation of charging infrastructure. CGA is also advising various industry players in developing their EV plans, through tailored advisory & market entry services.
Automotive Component ManufacturersAssociation of India
108
Notes

Notes


Automotive Component ManufacturersAssociation of India