
Dynamic Traffic Feedback Data Enabled Energy Management in Plug-in Hybrid Electric Vehicles
12
IEEE TRANSACTIONS ON CONTROL SYSTEMS TECHNOLOGY, VOL. 23, NO. 3, MAY 2015 1075 Dynamic Traffic Feedback Data Enabled Energy Management in Plug-in Hybrid Electric Vehicles Chao Sun, Scott Jason Moura, Member, IEEE, Xiaosong Hu, Member, IEEE, J. Karl Hedrick, and Fengchun Sun Abstract— Recent advances in traffic monitoring systems have made real-time traffic velocity data ubiquitously accessible for drivers. This paper develops a traffic data-enabled predictive energy management framework for a power-split plug-in hybrid electric vehicle (PHEV). Compared with conventional model predictive control (MPC), an additional supervisory state of charge (SoC) planning level is constructed based on real-time traffic data. A power balance-based PHEV model is developed for this upper level to rapidly generate battery SoC trajectories that are utilized as final-state constraints in the MPC level. This PHEV energy management framework is evaluated under three different scenarios: 1) without traffic flow information; 2) with static traffic flow information; and 3) with dynamic traffic flow information. Numerical results using real-world traffic data illustrate that the proposed strategy successfully incorporates dynamic traffic flow data into the PHEV energy management algorithm to achieve enhanced fuel economy. Index Terms— Fuel economy, plug-in hybrid electric vehicle (PHEV), power balance model, supervised energy management, traffic velocity. I. I NTRODUCTION A. Motivation T RAFFIC monitoring systems are now ubiquitous components of modern intelligent transportation systems [1], [2]. Many types of sensors, such as loop detectors, pneumatic sensors, and cameras, are employed to monitor traffic conditions [3]. Several traffic monitoring projects, such as the Caltrans Performance Measurement System (PeMS) [4] and Houston TranStar [5], have been successfully implemented and currently provide real-time traffic data on the Internet. As such, access to real-time traffic data is now fairly ubiquitous. This information complements existing in-vehicle Manuscript received July 21, 2014; accepted September 14, 2014. Date of publication October 20, 2014; date of current version April 14, 2015. Manu- script received in final form September 27, 2014. This work was supported in part by the National High Technology Research and Development Program of China under Grant 2011AA11228 and in part by the National Science and Technology Support Plan under Grant 2013BAG05B00. Recommended by Associate Editor K. Butts. C. Sun is with the National Engineering Laboratory for Electric Vehicles, Beijing Institute of Technology, Beijing 100081, China, and also with the Department of Mechanical Engineering, University of California at Berkeley, Berkeley, CA 94720 USA (e-mail: [email protected]). S. J. Moura and X. Hu are with the Department of Civil and Environmental Engineering, University of California at Berkeley, Berkeley, CA 94720 USA (e-mail: [email protected]; [email protected]). J. K. Hedrick is with the Department of Mechanical Engineering, University of California at Berkeley, Berkeley, CA 94720 USA (e-mail: [email protected]). F. Sun is with the National Engineering Laboratory for Electric Vehicles, Beijing Institute of Technology, Beijing 100081, China (e-mail: [email protected]). Color versions of one or more of the figures in this paper are available online at http://ieeexplore.ieee.org. Digital Object Identifier 10.1109/TCST.2014.2361294 Fig. 1. SoC trajectories derived from the CDCS strategy and DP. navigation systems that include GPS [6] and 3-D terrain maps [7], [8]. These information systems provide the opportunity to incorporate more environmental information than ever before into plug-in hybrid electric vehicle (PHEV) energy management [9], [10]. This paper systematically integrates real-time traffic velocity data into the energy management of a power-split PHEV. In the energy management problem (EMP) of PHEVs, state of charge (SoC) is an important state in determin- ing the optimal power split ratio between the engine and battery [11]. If no future driving information is available, the charge depleting and charge sustaining (CDCS) strategy is commonly used [12], [13], as shown by the blue curve in Fig. 1. When the trip distance exceeds the all-electric range, CDCS is suboptimal [14]. As can be observed in Fig. 1, the optimal SoC trajectory solved by dynamic programming (DP) differs significantly from CDCS [15]. In particular, the CDCS strategy consumes 22.17% more fuel than DP. Given more information about the velocity profile—enabled from traffic data—we hypothesize that a near-optimal energy management strategy can be developed. Previous work has examined the EMP for preplanned driving tasks. Ambuhl and Guzzella [16] developed a SoC reference generator for hilly driving profiles and demonstrated improved fuel economy. In this paper, we consider a SoC preplanning approach under time-varying traffic conditions. Consider the traffic map in Fig. 2, which displays the instan- taneous traffic flow velocity in the San Francisco Bay Area according to Google Maps at 9:15 A. M. on 3 February 2014. Red road segments indicate slow traffic velocity from a congestion event. If a PHEV knows when and where the 1063-6536 © 2014 IEEE. Personal use is permitted, but republication/redistribution requires IEEE permission. See http://www.ieee.org/publications_standards/publications/rights/index.html for more information.
Transcript of Dynamic Traffic Feedback Data Enabled Energy Management in Plug-in Hybrid Electric Vehicles

IEEE TRANSACTIONS ON CONTROL SYSTEMS TECHNOLOGY, VOL. 23, NO. 3, MAY 2015 1075
Dynamic Traffic Feedback Data Enabled EnergyManagement in Plug-in Hybrid Electric Vehicles
Chao Sun, Scott Jason Moura, Member, IEEE, Xiaosong Hu, Member, IEEE,J. Karl Hedrick, and Fengchun Sun
Abstract— Recent advances in traffic monitoring systems havemade real-time traffic velocity data ubiquitously accessible fordrivers. This paper develops a traffic data-enabled predictiveenergy management framework for a power-split plug-in hybridelectric vehicle (PHEV). Compared with conventional modelpredictive control (MPC), an additional supervisory state ofcharge (SoC) planning level is constructed based on real-timetraffic data. A power balance-based PHEV model is developed forthis upper level to rapidly generate battery SoC trajectories thatare utilized as final-state constraints in the MPC level. This PHEVenergy management framework is evaluated under three differentscenarios: 1) without traffic flow information; 2) with static trafficflow information; and 3) with dynamic traffic flow information.Numerical results using real-world traffic data illustrate that theproposed strategy successfully incorporates dynamic traffic flowdata into the PHEV energy management algorithm to achieveenhanced fuel economy.
Index Terms— Fuel economy, plug-in hybrid electricvehicle (PHEV), power balance model, supervised energymanagement, traffic velocity.
I. INTRODUCTION
A. Motivation
TRAFFIC monitoring systems are now ubiquitouscomponents of modern intelligent transportation
systems [1], [2]. Many types of sensors, such as loop detectors,pneumatic sensors, and cameras, are employed to monitortraffic conditions [3]. Several traffic monitoring projects, suchas the Caltrans Performance Measurement System (PeMS) [4]and Houston TranStar [5], have been successfully implementedand currently provide real-time traffic data on the Internet.As such, access to real-time traffic data is now fairlyubiquitous. This information complements existing in-vehicle
Manuscript received July 21, 2014; accepted September 14, 2014. Date ofpublication October 20, 2014; date of current version April 14, 2015. Manu-script received in final form September 27, 2014. This work was supported inpart by the National High Technology Research and Development Programof China under Grant 2011AA11228 and in part by the National Scienceand Technology Support Plan under Grant 2013BAG05B00. Recommendedby Associate Editor K. Butts.
C. Sun is with the National Engineering Laboratory for Electric Vehicles,Beijing Institute of Technology, Beijing 100081, China, and also with theDepartment of Mechanical Engineering, University of California at Berkeley,Berkeley, CA 94720 USA (e-mail: [email protected]).
S. J. Moura and X. Hu are with the Department of Civil and EnvironmentalEngineering, University of California at Berkeley, Berkeley, CA 94720 USA(e-mail: [email protected]; [email protected]).
J. K. Hedrick is with the Department of Mechanical Engineering,University of California at Berkeley, Berkeley, CA 94720 USA (e-mail:[email protected]).
F. Sun is with the National Engineering Laboratory for ElectricVehicles, Beijing Institute of Technology, Beijing 100081, China (e-mail:[email protected]).
Color versions of one or more of the figures in this paper are availableonline at http://ieeexplore.ieee.org.
Digital Object Identifier 10.1109/TCST.2014.2361294
Fig. 1. SoC trajectories derived from the CDCS strategy and DP.
navigation systems that include GPS [6] and 3-D terrainmaps [7], [8]. These information systems provide theopportunity to incorporate more environmental informationthan ever before into plug-in hybrid electric vehicle (PHEV)energy management [9], [10]. This paper systematicallyintegrates real-time traffic velocity data into the energymanagement of a power-split PHEV.
In the energy management problem (EMP) of PHEVs,state of charge (SoC) is an important state in determin-ing the optimal power split ratio between the engine andbattery [11]. If no future driving information is available, thecharge depleting and charge sustaining (CDCS) strategy iscommonly used [12], [13], as shown by the blue curve inFig. 1. When the trip distance exceeds the all-electric range,CDCS is suboptimal [14]. As can be observed in Fig. 1, theoptimal SoC trajectory solved by dynamic programming (DP)differs significantly from CDCS [15]. In particular, the CDCSstrategy consumes 22.17% more fuel than DP. Given moreinformation about the velocity profile—enabled from trafficdata—we hypothesize that a near-optimal energy managementstrategy can be developed.
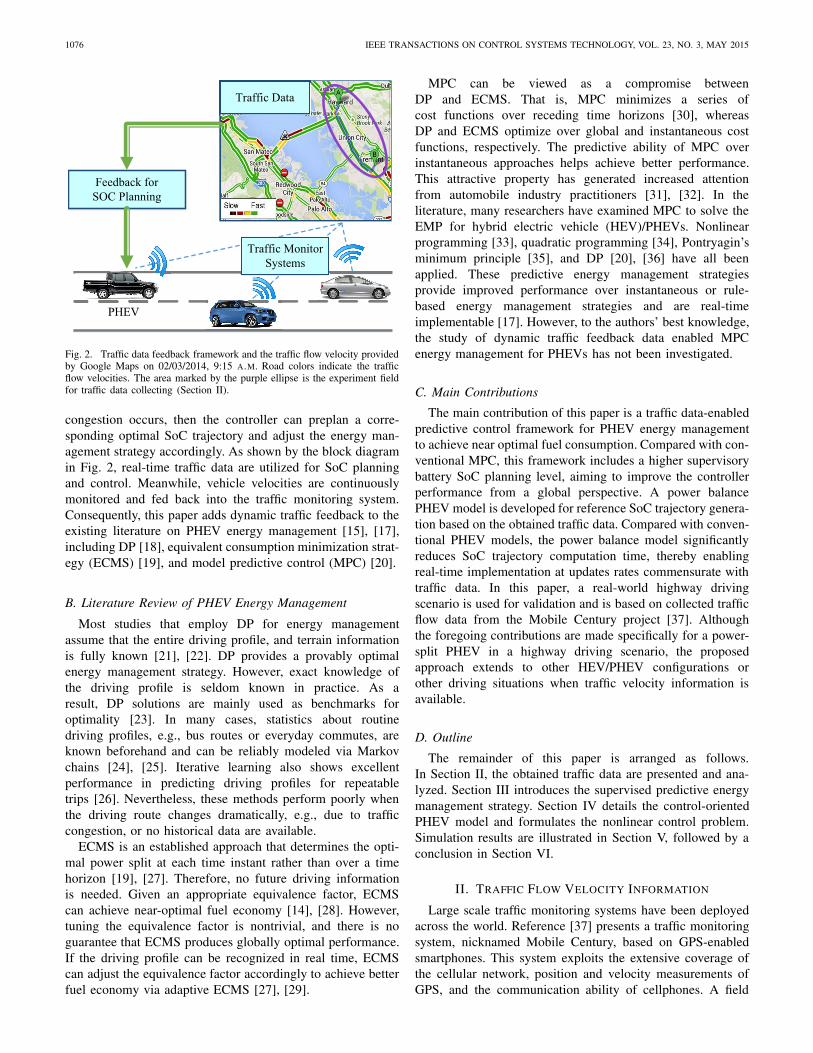
Previous work has examined the EMP for preplanneddriving tasks. Ambuhl and Guzzella [16] developed a SoCreference generator for hilly driving profiles and demonstratedimproved fuel economy. In this paper, we consider a SoCpreplanning approach under time-varying traffic conditions.Consider the traffic map in Fig. 2, which displays the instan-taneous traffic flow velocity in the San Francisco Bay Areaaccording to Google Maps at 9:15 A.M. on 3 February 2014.Red road segments indicate slow traffic velocity from acongestion event. If a PHEV knows when and where the
1063-6536 © 2014 IEEE. Personal use is permitted, but republication/redistribution requires IEEE permission.See http://www.ieee.org/publications_standards/publications/rights/index.html for more information.
1076 IEEE TRANSACTIONS ON CONTROL SYSTEMS TECHNOLOGY, VOL. 23, NO. 3, MAY 2015
Fig. 2. Traffic data feedback framework and the traffic flow velocity providedby Google Maps on 02/03/2014, 9:15 A.M. Road colors indicate the trafficflow velocities. The area marked by the purple ellipse is the experiment fieldfor traffic data collecting (Section II).
congestion occurs, then the controller can preplan a corre-sponding optimal SoC trajectory and adjust the energy man-agement strategy accordingly. As shown by the block diagramin Fig. 2, real-time traffic data are utilized for SoC planningand control. Meanwhile, vehicle velocities are continuouslymonitored and fed back into the traffic monitoring system.Consequently, this paper adds dynamic traffic feedback to theexisting literature on PHEV energy management [15], [17],including DP [18], equivalent consumption minimization strat-egy (ECMS) [19], and model predictive control (MPC) [20].
B. Literature Review of PHEV Energy Management
Most studies that employ DP for energy managementassume that the entire driving profile, and terrain informationis fully known [21], [22]. DP provides a provably optimalenergy management strategy. However, exact knowledge ofthe driving profile is seldom known in practice. As aresult, DP solutions are mainly used as benchmarks foroptimality [23]. In many cases, statistics about routinedriving profiles, e.g., bus routes or everyday commutes, areknown beforehand and can be reliably modeled via Markovchains [24], [25]. Iterative learning also shows excellentperformance in predicting driving profiles for repeatabletrips [26]. Nevertheless, these methods perform poorly whenthe driving route changes dramatically, e.g., due to trafficcongestion, or no historical data are available.
ECMS is an established approach that determines the opti-mal power split at each time instant rather than over a timehorizon [19], [27]. Therefore, no future driving informationis needed. Given an appropriate equivalence factor, ECMScan achieve near-optimal fuel economy [14], [28]. However,tuning the equivalence factor is nontrivial, and there is noguarantee that ECMS produces globally optimal performance.If the driving profile can be recognized in real time, ECMScan adjust the equivalence factor accordingly to achieve betterfuel economy via adaptive ECMS [27], [29].
MPC can be viewed as a compromise betweenDP and ECMS. That is, MPC minimizes a series ofcost functions over receding time horizons [30], whereasDP and ECMS optimize over global and instantaneous costfunctions, respectively. The predictive ability of MPC overinstantaneous approaches helps achieve better performance.This attractive property has generated increased attentionfrom automobile industry practitioners [31], [32]. In theliterature, many researchers have examined MPC to solve theEMP for hybrid electric vehicle (HEV)/PHEVs. Nonlinearprogramming [33], quadratic programming [34], Pontryagin’sminimum principle [35], and DP [20], [36] have all beenapplied. These predictive energy management strategiesprovide improved performance over instantaneous or rule-based energy management strategies and are real-timeimplementable [17]. However, to the authors’ best knowledge,the study of dynamic traffic feedback data enabled MPCenergy management for PHEVs has not been investigated.
C. Main Contributions
The main contribution of this paper is a traffic data-enabledpredictive control framework for PHEV energy managementto achieve near optimal fuel consumption. Compared with con-ventional MPC, this framework includes a higher supervisorybattery SoC planning level, aiming to improve the controllerperformance from a global perspective. A power balancePHEV model is developed for reference SoC trajectory genera-tion based on the obtained traffic data. Compared with conven-tional PHEV models, the power balance model significantlyreduces SoC trajectory computation time, thereby enablingreal-time implementation at updates rates commensurate withtraffic data. In this paper, a real-world highway drivingscenario is used for validation and is based on collected trafficflow data from the Mobile Century project [37]. Althoughthe foregoing contributions are made specifically for a power-split PHEV in a highway driving scenario, the proposedapproach extends to other HEV/PHEV configurations orother driving situations when traffic velocity information isavailable.
D. Outline
The remainder of this paper is arranged as follows.In Section II, the obtained traffic data are presented and ana-lyzed. Section III introduces the supervised predictive energymanagement strategy. Section IV details the control-orientedPHEV model and formulates the nonlinear control problem.Simulation results are illustrated in Section V, followed by aconclusion in Section VI.
II. TRAFFIC FLOW VELOCITY INFORMATION
Large scale traffic monitoring systems have been deployedacross the world. Reference [37] presents a traffic monitoringsystem, nicknamed Mobile Century, based on GPS-enabledsmartphones. This system exploits the extensive coverage ofthe cellular network, position and velocity measurements ofGPS, and the communication ability of cellphones. A field

SUN et al.: DYNAMIC TRAFFIC FEEDBACK DATA ENABLED ENERGY MANAGEMENT 1077
Fig. 3. Time-position trajectories of individual trips from the Mobile Centuryfield experiment on highway road I-880 from 16 to 28 mi north bound.
experiment was conducted to measure traffic velocities andflow on a 10-mi stretch of I-880 near Union City, Californiafor 8 h, as shown in Fig. 2 between points A and B.We leverage this data to study traffic-enabled PHEV energymanagement in this paper.
A. Traffic Flow Velocity Extraction
The Mobile Century vehicles were all equipped withGPS-enabled smartphones that produce time-stamped positionand velocity measurements every 3 s. A traffic estimationserver is used to collect all the GPS data and analyzetraffic flow dynamics. Fig. 3 plots the time-position trajectoryfor each trip in the field experiment. A traffic congestionevent can be identified within the red rectangle markedin the figure. All vehicles were forced to decelerate whendriving through the congestion area. Over time, the congestionattenuates and vehicles gradually accelerated back to normalspeeds. The propagation of a shock-wave can be observedclearly.
The traffic congestion period from 10:20 A.M. to 13:40 P.M.is selected deliberately as the object of study. This is becausea traffic congestion event can fully reflect the uncertaintyand complexity of the driving environment. Note that theflow velocity data received by the drivers are only a staticreflection of the traffic. The information is more valuable whenit updates in real time. In this paper, we assume the driver canobtain the traffic velocity data every 300 s, which is consistentwith the update rate of PeMS [4]. The road is split into120 segments for vehicle velocity sampling (160 m/segmentthat is approximately the length of a postmile interval inCalifornia). The average velocity of all vehicles that drivethrough a specific road segment is assumed to be the trafficflow velocity of this segment, which is calculated by
V SIavg(t) =
N∑
i=1V SI
i (t)
N, (SI = 1, 2, . . . , 120) (1)
where V SIavg(t) indicates the average velocity of the SIth
(segment index) road segment at time t , V SIi (t) is the velocity
of one individual vehicle, and N represents the total numberof vehicles driving through segment SI.
Fig. 4. Extracted traffic flow velocity distribution from 10:20 A.M. to13:40 P.M. Sampling time interval is 300 s, and the road resolution is 0.1mi.
Fig. 5. Extracted velocity profile example before and after filtering.
B. Trip Analysis and Processing
The extracted traffic velocity is shown in Fig. 4. Note thatthe velocity reduces from 70 mi/h to less than 10 mi/h near the24-mi position at 10:45 A.M., which is the beginning of thetraffic congestion event. The velocity of the congested segmentstarts to increase around 11:20 A.M., which is the end of thetraffic congestion event.
We assume the PHEV follows the same velocity profileas the traffic flow velocity. Due to low spatial resolution,the extracted traffic velocity profile is piecewise constant.We smooth Vavg with a Butterworth filter to produce a morerealistic and trackable velocity signal (Vflow in Section III-A).Fig. 5 shows an extracted and filtered velocity profile. We cansee that the extracted profile is piecewise constant (blue line).The red curve is the filtered result, which is smooth andfollows the original cycle reasonably well. Each time the trafficflow velocity information is received, the velocity profile isfiltered.
III. SUPERVISED PREDICTIVE ENERGY MANAGEMENT
A. Traffic Enabled Energy Management
The structure of the supervised predictive energy man-agement is demonstrated in Fig. 6. In the upper level, the

1078 IEEE TRANSACTIONS ON CONTROL SYSTEMS TECHNOLOGY, VOL. 23, NO. 3, MAY 2015
Fig. 6. Control structure for the supervised predictive energy managementscheme. The upper level uses real-time traffic flow velocity to compute aglobal SoC trajectory. The lower level applies a receding horizon control,using the SoC trajectory as a final state constraint and a short-term velocitypredictor.
traffic flow velocity Vflow obtained from real-time traffic datais utilized to calculate the optimal SoC trajectory. In thelower level, a horizon velocity predictor is employed toforecast the future driving velocities in each receding horizon.These two aspects correspond to the long-term and short-termdisturbances, respectively.
It is important to note that the acquired traffic flow velocitywill differ from the actual vehicle velocity. Thus, errors existin the generated SoC reference trajectory. The generated SoCtrajectory is introduced into the MPC level as a terminal SoCreference during each control horizon. This provides the lowerlevel MPC feedback loop with additional control flexibility tocompensate for SoC reference errors, denoted as
SoC = SoC∗ (2)
where SoC is the terminal SoC reference of each controlhorizon, and SoC∗ is the generated optimal SoC trajectory.The detailed control procedure is described as follows:
1) acquire real-time traffic data and route information, andcalculate the optimal battery SoC trajectory;
2) predict the short-term future velocity profile for thecurrent control horizon;
3) given the SoC reference and the predicted velocitysequence Vpredict, the MPC controller calculates theoptimal control policy;
4) apply the first time-step of the optimal control policy inthe quasi-static PHEV model;
5) feedback system states, update system constraints, andrepeat the computation procedure at the next timeinstant.
Note that step 1 of the control procedure is activated onlywhen the traffic and route information are updated. Also notethat the upper and lower levels utilize different PHEV modelsfor optimization. In the upper level, a simple power-basedmodel is utilized for SoC trajectory generation. In the lowerlevel, a higher fidelity PHEV model is used for MPC. Wedescribe each level in the following sections. The quasi-staticPHEV model is a detailed plant model furnished by the Quasisteady state-toolbox developed at ETH Zürich, which has beenvalidated against experiments (see [38] for details).
Fig. 7. Structure of the simplified power-split PHEV powertrain.
B. Long-Term SoC Trajectory Generation
The optimal SoC trajectory calculation must be fast enoughto follow the traffic flow dynamics. The commonly usedcontrol-oriented PHEV model [18], [21] is proficient forpowertrain control but excessively complex for SoC trajectorycalculation for this particular purpose. This paper introduces areduced power balance based PHEV model for this purpose.This model is much more computationally efficient yet suffi-ciently accurate for the purpose of SoC trajectory calculations.
The power balance model is based on a simplified power-split PHEV powertrain, as shown in Fig. 7. Instead of estab-lishing physical models for all the powertrain components,the power balance model only describes power flows andconversion efficiencies. The tank/engine converts chemicalenergy into mechanical energy with efficiency denoted by η1.The battery and two motor/generators (M/Gs) convert betweenchemical battery energy and mechanical energy with efficiencydenoted by η2. The sum of the engine and M/Gs’ mechanicalpowers must equal power demand Pdemand.
Mathematically, the simplified powertrain is governed bypower balance equation
η1 Ptank(t)+ η2 Pbatt(t) = Pdemand(t) (3)
where Ptank is the chemical energy supplied by the tank,Pbatt is the electro-chemical energy supplied by the battery,and Pdemand is the vehicle power demand. Positive Pbattdenotes discharging. Parameters η1 and η2 are synthetic energyconversion coefficients of the mechanical propulsion path(engine side) and the electrical propulsion path (M/G side),respectively. The power demand is provided by
Pdemand(t) =(
ma + Cr mg + 1
2ρACdv
2(t)
)
v(t) (4)
where m is the vehicle mass, a is the vehicle acceleration, gis gravitational acceleration, v(t) is the vehicle velocity, Cr
represents the rolling resistance coefficient, and (1/2)ρACd
is the aerodynamic drag resistance. The battery package ismodeled as an equivalent circuit [39]. The battery power andthe battery SoC are derived with
Pbatt(t) = V Ibatt(t)− I 2batt(t)R (5)
˙SoC(t) = − Ibatt(t)
Q(6)

SUN et al.: DYNAMIC TRAFFIC FEEDBACK DATA ENABLED ENERGY MANAGEMENT 1079
where V and R are the open-circuit voltage and internalresistance, respectively; Ibatt(t) and Q are the battery currentand capacity, respectively.
In this power balance PHEV model, the number ofcontrol variables is reduced from two to one compared withthe control-oriented model (to be presented in Section IV).Battery output power is selected as the control variable, whereu = Pbatt. Battery SoC and the engine ON/OFF state (denotedas O) are selected as state variables, where x = [SoC, O]T .O = 1 means the engine is ON, and O = 0 means the engineis OFF. Define switching of the engine state as
δO(k�t) = |O(k�t)− O((k − 1)�t)|. (7)
The cost function is formulated as
J =∫ T
0[Ptank(u(t))+wδO(t)]2 dt (8)
where Ptank(u(t)) penalizes fuel consumption, and w isthe penalty for engine state switching. The expression forPtank(u(t)) is derived as follows. From (3), we have
Ptank(t) = Pdemand(t)− η2 Pbatt(t)
η1. (9)
Note that u(t) = Pbatt(t). Moreover, consider the conversionefficiencies with the following arguments:
η1 = η1(Peng) (10)
η2 = η2(Pbatt) = η2(u). (11)
Note that Peng = Pdemand − η2 Pbatt = Pdemand − η2(u) · u.Consequently, we obtain
Ptank(t) = Pdemand(t)− η2(u(t)) · u(t)
η1(Peng(t))= Peng(t)
η1(Peng(t)). (12)
DP is used to minimize J , s.t.
SoCmin ≤ SoC ≤ SoCmax, Pmintank ≤ Ptank ≤ Pmax
tank
I minbatt ≤ Ibatt ≤ I max
batt , Pminbatt ≤ Pbatt ≤ Pmax
batt .
The energy conversion coefficients η1 and η2 are veryimportant in describing the nonlinearity of the powertrain.Efficiency η1 can be calculated by assuming the engine alwaysoperates on the optimum operating line (OOL). In contrast,η2 involves the combined operating efficiencies of both M/G1and M/G2, and it is therefore not possible to assume operationalong the individual OOLs. Thus, this paper proposes anempirical approach to determine η1 and η2 based on theoptimal operating behaviors yielded from the control-orientedmodel. The details are given as follows:
1) first, utilize DP to solve the EMP with the control-oriented PHEV model across a variety of driving cycles;
2) second, collect the optimal solutions for powertrainbehavior analysis. Coefficients η1 and η2 are calcu-lated by
η1 = ωeng · Teng
Ptank(13)
η2 = ωM/G1 · TM/G1 + ωM/G2 · TM/G2
Pbatt(14)
Fig. 8. Peng–η1 operating points and the curve fitting result, η1 = 0 when0 ≤ Peng < min.
Fig. 9. Pbatt–η2 operating points and the curve fitting result.
where ωeng, ωM/G1, ωM/G2, and Teng, TM/G1, TM/G2 arecorresponding rotation speeds and torques of the engine,M/G1 and M/G2 from the control-oriented model;
3) last but most important, formulate η1 and η2 by leastsquares curve fitting.
In step 1, four driving cycles, including both urban andhighway types, are used for the optimal energy manage-ment simulation: West Virginia University City, New YorkCity Cycle, Artemis highway, and Highway Fuel EconomyTest (HWFET) provided by the U.S. Environmental Protec-tion Agency and [40]. To cover as much of the operatingenvelope as possible, different battery discharging depths areinvestigated.
The operating points for functions η1 and η2 are plotted inFigs. 8 and 9. It can be observed that η1 and η2 are stronglycorrelated with Peng and Pbatt, respectively. Consequently, thehypotheses in (10) and (11) are verified. Interestingly, thefitting results for η1 prove to be consistent with the engineOOL approach. Piecewise functions are employed for curvefitting of η2, including polynomial functions and mixtureGaussian functions.
The complete power balance-based model is validated inSection V-A against a more detailed control-oriented model.

1080 IEEE TRANSACTIONS ON CONTROL SYSTEMS TECHNOLOGY, VOL. 23, NO. 3, MAY 2015
Fig. 10. Input/output pattern of the RBF-NN-based horizon velocity predictor.
Next, we consider the issue of velocity prediction in the MPClevel from Fig. 6.
C. Short-Term Velocity Prediction
Next, we develop a forecasting technique to predict short-term vehicle velocities. This paper employs a data drivenapproach to velocity prediction. Vehicles with forward radardevices can utilize lead vehicle measurements to improvevelocity prediction [41], but this is not considered in this paper.
In recent work on velocity prediction [42], artificial neuralnetworks (ANNs) have proven effective in terms of bothaccuracy and ease of use. Here, a radial basis function neuralnetwork (RBF-NN) [43] based velocity predictor is developedfor short-term velocity prediction. The predicted futurevelocity sequence is sent to the MPC controller as the vehiclespeed request in each receding horizon. Through learningfrom representative driving cycles, the predictor capturesthe highly nonlinear driving patterns in a comprehensivesense. Other velocity prediction methods, such as Gaussianmixture modeling or stochastic approaches, could also beimplemented [42], [44].
The input of the ANN-based predictor is a historical velocitysequence, and the output is short-term future velocity sequenceVpredict, as shown in Fig. 10. The length of the historicalvelocity sequence Hh and the length of the prediction horizonHp are all set as 10. Different tuning of the neural networkmay produce different performance. However, the trials areomitted here as this is not the focus of this paper. Interestedreaders may refer to [41] for more details.
Four standard driving cycles are used for the networktraining, including both highway and urban types: UrbanDynamometer Driving Schedule, HWFET, New EuropeanDriving Cycle, and US06. A real driving cycle is selectedfor validation from the highway driving data collected fromMobile Century. The predicted velocity sequences and theresultant root-mean-square errors (RMSEs) are shown inFig. 11. From the upper part of Fig. 11, we can observe thatthe RBF-NN-based velocity predictor predicts the microtripbehaviors effectively. The lower part of Fig. 11 demonstratesthe empirical cumulative distribution function (CDF) of theRMSE for all the prediction processes. Nearly 90% of the
Fig. 11. Predicted velocity sequences by the RBF-NN-based short-termvelocity predictor and the corresponding CDF of RMSE.
Fig. 12. Structure of the power-split PHEV configuration.
RMSEs are below 1.5 m/s. Considering that the predictionhorizon is 10, which is relatively long, we conclude that theRBF-NN velocity predictor is accurate enough for MPC-basedPHEV energy management.
IV. MPC LEVEL CONTROL FORMULATION
A. Control-Oriented PHEV Model
A control-oriented power-split PHEV powertrain model isused in the MPC level. A planetary gear set couples theengine, M/G1, and M/G2. As shown in Fig. 12, the engineand M/G1 are connected to the planet carrier and the sun gear,respectively. A torque coupler is used to connect the ring gearwith M/G2 to propel the final drive.
The schematic structure of the planetary gear set is shownin the left-hand side of Fig. 13. The right-hand side of Fig. 13shows a lever diagram, which is commonly used to describethe kinematic constraint on the ring, carrier, and sun gearangular velocities. This constraint is given mathematically by
ωs S + ωr R = ωc(S + R) (15)
where S and R are the radii of the sun gear and the ringgear, respectively. Angular speeds of the ring gear / M/G2, sungear / M/G1, and carrier gear / engine are denoted as ωM/G2,ωM/G1, and ωeng, respectively. They are represented by the

SUN et al.: DYNAMIC TRAFFIC FEEDBACK DATA ENABLED ENERGY MANAGEMENT 1081
Fig. 13. Planetary gear set (left) and the lever diagram (right).
three vectors in the lever diagram. The length and directionof the vectors denote the magnitude and direction of therespective rotational speeds. The node Carrier divides the leverinto two segments, defined by the relative ratio of S and R. Thedashed line connecting the three vector arrowheads signifiesthat the kinematic constraint in (15) must be verified.
By neglecting the inertia of the pinion gears and assumingthat all the powertrain shafts are rigid, the inertial dynamicsof the powertrain are derived as
JM/G1dωM/G1
dt= TM/G1 + FS (16)
Jengdωeng
dt= Teng − F(S + R) (17)
JM/G2dωM/G2
dt= TM/G2 − (Taxle/g f )+ F R (18)
where JM/G1, Jeng, and JM/G2 are the lumped inertiasof M/G1, engine, and M/G2, respectively; TM/G1 = Ts ,Teng = Tc, and TM/G2 = Tr are torques of M/G1, engine,and M/G2, respectively; F represents the internal force onpinion gears; g f is the gear ratio of the final drive; andTaxle is the torque produced from powertrain on the driveaxle. To reduce the control-oriented model’s complexity, wedisregard the inertial dynamicsand use the steady-state valuesof (16)–(18). The rotational speed of M/G2 and the axle torqueare given by
ωM/G2 = g f
RwheelV (19)
mdV
dt= Taxle+Tbrake
Rwheel+mg sin(θ)−1
2ρACd V 2−Cr mg cos(θ)
(20)
where Rwheel is the wheel radius, Tbrake is the friction braketorque, and θ denotes the road grade.
At each time instant, the MPC controller computes anoptimal split between the engine, M/G1, and M/G2 to min-imize fuel consumption. Fuel flow rate of the engine (mfuel)and power transfer efficiencies for M/G1 and M/G2 (ηM/G1and ηM/G2) are extracted from empirical maps. They are allfunctions of angular speed and torque
mfuel = ψ1(ωeng, Teng) (21)
ηM/G1 = ψ2(ωM/G1, TM/G1) (22)
ηM/G2 = ψ3(ωM/G2, TM/G2) (23)
where ψ1, ψ2, and ψ3 are empirical maps of the engine fuelflow and M/G efficiencies, respectively [45].
The equivalent circuit battery model is employed in thecontrol-oriented model and has been presented in (5) and (6).
The battery in a power-split PHEV is connected to abidirectional converter to supply power or recuperate energyfrom the electrical machines. Terminal battery power isdescribed by
Pbatt = PM/G1/(ηM/G1ηinv)kM/G1 + PM/G2/(ηM/G2ηinv)
kM/G2
(24)
where PM/G1 and PM/G2 are shaft powers of M/G1 and M/G2,respectively; ηinv is the inverter efficiency
ki ={
1, if Pi > 0−1, if Pi ≤ 0
, for i = {M/G1,M/G2}. (25)
A complete description of the battery SoC dynamics cantherefore be obtained. Equations (5), (6), and (15)–(25) sum-marize the control-oriented model used for MPC, and moredetails can be found in [25]. Throughout this paper, MPC isapplied to a detailed quasi-static PHEV plant [38].
B. MPC Level Nonlinear Control
The EMP in the MPC level is formulated as a constrainednonlinear optimization problem and solved by DP at eachtime instant [46]. Given the powertrain dynamics (15)–(25),we require two independent control inputs to render a causalsystem. In this paper, we choose ωeng and Teng. Denoting x asthe state variable, u as the control variable, d as the systemdisturbance, and y as the output, the proposed control-orientedpowertrain model can be represented as
x = f (x, u, d)
y = g(x, u, d) (26)
with x = [SoC, O]T , u = [ωeng, Teng]T, d = Vpredict, andy = [mfuel, Pbatt, TM/G2, ωM/G1, TM/G1]T. Consider a onesecond time step, �t = 1 s. At time step k, the costfunction Jk is formulated as
Jk =∫ (k+Hp)�t
k�t[mfuel(u(t))+ wδO(t)]2 dt (27)
where Hp is the prediction horizon length, which is hereinequal to the control horizon length for simplicity [20]. Thedisturbance d = Vpredict is predicted by the short-term velocitypredictor in Section III-C.
In addition, the following physical constraints must beenforced:
SoCmin ≤ SoC ≤ SoCmax
I minbatt ≤ Ibatt ≤ I max
batt , Pminbatt ≤ Pbatt ≤ Pmax
batt
T mineng ≤ Teng ≤ T max
eng , ωmineng ≤ ωeng ≤ ωmax
eng
T minM/G1 ≤ TM/G1 ≤ T max
M/G1, ωminM/G1 ≤ ωM/G1 ≤ ωmax
M/G1
T minM/G2 ≤ TM/G2 ≤ T max
M/G2, ωminM/G2 ≤ ωM/G2 ≤ ωmax
M/G2.
(28)
Special consideration is given to the terminal battery SoCconstraint in the MPC horizon, namely, the SoC trajectorygenerated from the traffic flow data in the upper level providesthe terminal SoC constraint. This approach guides the SoCtrajectory based on future traffic conditions without being

1082 IEEE TRANSACTIONS ON CONTROL SYSTEMS TECHNOLOGY, VOL. 23, NO. 3, MAY 2015
TABLE I
GENERAL PARAMETERS OF THE PHEV MODEL
restrictive in preventing deviations due to unknown distur-bances. It is important to note that the SoC reference canbe indexed in two ways: time-domain dependent and space-domain dependent. For time-domain-dependent SoC reference
SoC((k + Hp)�t) = SoC∗((k + Hp)�t). (29)
For space-domain-dependent SoC reference
SoC(nk�s) = SoC∗(nk�s) (30)
where �s is the space step, nk indicates the space stepnumber that the vehicle drives through by the end of timehorizon k. SoC∗ is the optimal SoC trajectory generated fromthe supervisory SoC planning level in Section III-B. Bothindexing methods are investigated in the following section.
V. SIMULATION RESULTS AND DISCUSSION
The proposed power balance model and predictive energymanagement framework are both evaluated in this section. Allthe simulations were performed on a personal computer withan Intel Corel i7-3630 QM CPU @2.4 GHz. The power-splitPHEV structure is adopted from [47], and general parametersof the model are provided in Table I. The empirical fuelconsumption map of the engine and the efficiency maps ofthe M/G are from ADVISOR [45]. Note that in the simulationand validation sections, we focus on trips that exceed theall-electric-range, and therefore require engine power at somepoint.
A. Power Balance Model Validation
The power balance model is validated by comparing thegenerated SoC trajectory with the control-oriented model.Based on the approximated η1 and η2 from Figs. 8 and 9,the optimization problem (8) can be solved by DP. The initialbattery SoC is set as 0.7, and terminal SoC is set as 0.3. Sixstandard driving cycles and two real-world cycles, highwayRealh and urban Realu (Fig. 14, bottom), are combinedarbitrarily to construct three longer trips for testing. Note thatthe validation driving cycles are different from those used toidentify η1 and η2. The details of the trips are shown in theupper part of Table II.
Fig. 14. Comparison of SoC trajectory in the 3/Mixed case. From top tobottom: SoC trajectories, the absolute SoC error |e|, and the driving profile.The average |e| is 0.0168 (1.68% of the battery SoC full scale).
TABLE II
TRIP DETAILS AND SOC TRAJECTORY COMPARISON
The computation time of DP highly depends on the grid res-olution of the control or state variables during discretization.For the control-oriented model, the authors carefully tunedthe grid numbers of the control variables (ωeng and Teng) andthe state variable (SoC) as 40, 30, and 30, respectively. Thisresolution is a compromise between the optimality and thecomputational complexity. For fair comparison, the controlvariable (Pbatt) and state variable (SoC) in the power balancemodel are also set as 40 and 30, respectively.
The bottom part of Table II demonstrates the comparisondetails of generating SoC trajectory from the two PHEVmodels. Symbol T is the computation time. As can be seen,for trips that exceed the all-electric-range, the control-orientedmodel requires 190–260 s to compute the optimal SoC trajec-tory. Considering that the traffic flow updating rate is 300 s, itmay be difficult for the control-oriented model to satisfy thereal-time traffic data updating requirement on an embeddedsystem. However, the computation time required by the powerbalance model is 80% less than the control-oriented model.

SUN et al.: DYNAMIC TRAFFIC FEEDBACK DATA ENABLED ENERGY MANAGEMENT 1083
Fig. 15. Six assembled driving cycles from 24 arbitrarily selected trips from10:20 A.M. to 13:40 P.M. of the Mobile Century experiment data.
This indicates that the power balance model facilitates optimalSoC trajectory generation, and is computationally sufficient forrapid SoC trajectory calculation.
Denote the SoC error as e(t), thus
e(t) = SoCp(t)− SoCc(t) (31)
where SoCp(t) and SoCc(t) are the SoC trajectories calculatedfrom the power balance model and the control-oriented model,respectively. It can be seen from Table II that both modelsguarantee the requested terminal SoC constraint. The averageand maximal SoC errors between the power balance model andcontrol-oriented model remain within 0.03 and 0.05, which are3% and 5% of the battery SoC full scale, respectively. Thissuggests that the power balance model is reasonably accuratefor the optimal SoC trajectory calculation, and therefore servesthe SoC planning purpose at the top level of Fig. 6. Theresultant battery SoC trajectories of the 3/Mixed driving triptesting are shown in Fig. 14. As can be observed, the SoCtrajectory of the power balance model follows the control-oriented model well.
B. Energy Management Strategy Evaluation
The congestion period from 10:20 A.M. to 13:40 P.M. in theobtained traffic flow data is chosen to evaluate the proposedenergy management strategy. Due to the experimental field’slimited size, most of the individual trips are no more than10-mi long, which is shorter than the all-electric-range. In thiscase, 24 arbitrarily selected individual driving trips are con-catenated into six longer cycles for testing, as shown in Fig. 15,and each testing cycle includes one or two traffic congestions.The corresponding traffic conditions are assumed to updatesequentially. The SoC reference is computed simultaneouslyby the controller. In practice, the system must access real-time traffic information from the cloud/Internet, and the SoCgeneration can therefore be performed in the cloud during thisprocess.
All of the real driving profiles are completely blind to allthe MPC simulations. The same RBF-NN velocity predictoris used for short-term velocity prediction. For simplicity, thecontrol and prediction horizons are both set as 10 steps, as
Fig. 16. Battery SoC trajectories of Trip 2. The Dynamic@T andDynamic@S cases produce nearly optimal SoC trajectories.
a compromise between control performance and the com-putation complexity. The average computation time of thesimulation process at each time instant (1 s) is 0.6–0.7 s.Therefore, the proposed energy management strategy is poten-tially implementable on an embedded system.
Based on different traffic data accessibility levels, fivesituations are considered to evaluate the proposed supervisedpredictive energy management strategy.
1) CDCS: When no traffic information is available, theCDCS strategy is used for battery SoC planning.
2) Static@T: Static traffic information is available, and thevehicle obtains the traffic velocity information only onceat the beginning of the trip. The first generated SoCreference is assumed to be relevant until the end of thetrip and is indexed by time.
3) Static@S: Static traffic information is available, and theSoC reference is indexed by space.
4) Dynamic@T: Dynamic traffic information is available,and the vehicle obtains the traffic velocity informationevery 300 s. The generated SoC reference is indexed bytime.
5) Dynamic@S: Dynamic traffic information is available,and the SoC reference is indexed by space.
The resultant SoC trajectories of these five situations fortesting Trip 2 (from Fig. 15) are demonstrated in Fig. 16,including deterministic DP as a benchmark. As can beobserved, the CDCS strategy consumes the battery energywithin 900 s, and then sustains SoC around 0.3 for theremainder of the trip. In the Static@T scenario, the batteryenergy is not completely consumed by the end of the trip.Thus, the terminal battery SoC constraint is not satisfied. If thegenerated SoC reference is indexed by space, such as in theStatic@S case, the terminal SoC constraint is satisfied. Thisis because the driving cycle extracted from the traffic data hasdifferent time length but the same spatial length with the realdriving cycle. On the other hand, if the traffic status updatescontinuously, the supervised predictive energy managementcan produce nearly optimal performance. The SoC trajectoryerrors caused from outdated traffic data can be corrected byupdated data. The terminal SoC requirement is satisfied in

1084 IEEE TRANSACTIONS ON CONTROL SYSTEMS TECHNOLOGY, VOL. 23, NO. 3, MAY 2015
TABLE III
SIMULATION RESULTS FOR TRIP 2
Fig. 17. Average fuel optimality and terminal SoC results for all the testingtrips. Dynamic traffic information allows the proposed energy managementstrategy to achieve nearly 95% fuel optimality while consistently ensuringthe terminal SoC value.
both the Dynamic@T and Dynamic@S cases. The resultantbattery SoC trajectory for the Dynamic@S approach is nearlyoptimal with respect to the DP benchmark, which can beclearly observed in Fig. 16.
The deviation between the final battery SoC and the desiredvalue has been compensated in the fuel consumption cal-culations, denoted as Fuelc. The detailed simulation resultsfor Trip 2 are shown in Table III. As expected, the fuelconsumption of predictive energy management with dynamictraffic information available is less than the CDCS strategyand the static traffic information approaches. Namely, theyachieve 95.1% (Dynamic@T) and 95.9% (Dynamic@S) fueleconomy optimality of the DP benchmark. It is also inter-esting to note that a space-domain-indexed SoC referenceconsistently consumes less fuel than the time-domain-indexedSoC reference in both the static and dynamic trafficinformation situations.
Simulation results for all six testing trips from Fig. 15 areshown in Fig. 17, including the average value and standarddeviation of the fuel optimality and the terminal SoC. DP, withfull knowledge of the trip, achieves 100% fuel optimality andabsolute 0.3 terminal SoC for all tests. The CDCS strategymaintains an average of 90% fuel optimality, and the terminalSoC is always restrained around 0.3. Due to the poor accuracyof the initial traffic flow velocity in estimating the actualdriving cycle, the Static@T approach performs worse thanthe CDCS approach on average. In particular, the terminalSoC has a relatively high variance around 0.3. By indexingthe SoC reference in space, Static@S guarantees the terminalSoC constraint is respected with low variance. As a result, theoverall fuel economy is improved by 5% on average.
In the Dynamic@T situation, the deviation of the terminalSoC is reduced by updating the traffic data every 300 scompared with the Static@T approach. The terminal SoC isrestricted within an acceptable range between 0.3 and 0.35.More importantly, Dynamic@T achieves an average of 94%fuel optimality using dynamic traffic data - a considerableimprovement given the uncertain driving cycles. By indexingthe SoC reference within the spatial domain, the terminalSoC constraint is better respected, and the fuel consumptionis further reduced in the Dynamic@S case. This phenomenonis consistent with the results derived from the static trafficsituations.
The demonstrated results are conducted from a high-way congestion-involved driving scenario constructed by theMobile Century experiment database. Different results couldbe observed with different driving trips or in different trafficconditions used. However, the proposed predictive energymanagement proves to be effective in achieving near optimalfuel economy with traffic feedback data.
VI. CONCLUSION
This paper presents a predictive PHEV energy managementstrategy that integrates real-time traffic flow velocity data. Thestrategy is composed of a two-tiered scheme. A supervisorySoC planning level rapidly generates an SoC trajectory fromtraffic data for the terminal SoC constraints in the MPC level.A power balance PHEV model is developed for this upperlevel. With this model, DP computes the optimal SoC tra-jectory in real time—at a rate commensurate with traffic dataupdate rates (300 s). Simulation results show that the predictiveenergy management strategy with dynamic traffic data canachieve 94%–96% fuel optimality of the deterministic DPbenchmark in a highway driving scenario, despite congestionevents. Future work involves validation of the proposed energymanagement strategy through a hardware-in-the-loop experi-ment, and considerations for battery health in the cost function.
ACKNOWLEDGMENT
The authors would like to thank Prof. A. M. Bayen at theUniversity of California, Berkeley, USA, for substantial helpin providing the traffic data.
REFERENCES
[1] A. R. Beresford and J. Bacon, “Intelligent transportation systems,” IEEEPervasive Comput., vol. 5, no. 4, pp. 63–67, Dec. 2006.
[2] C. N. E. Anagnostopoulos, I. E. Anagnostopoulos, V. Loumos, andE. Kayafas, “A license plate-recognition algorithm for intelligent trans-portation system applications,” IEEE Trans. Intell. Transp. Syst., vol. 7,no. 3, pp. 377–392, Sep. 2006.
[3] R. Cucchiara, M. Piccardi, and P. Mello, “Image analysis and rule-basedreasoning for a traffic monitoring system,” IEEE Trans. Intell. Transp.Syst., vol. 1, no. 2, pp. 119–130, Jan. 2000.
[4] C. Chen, K. Petty, A. Skabardonis, P. Varaiya, and Z. Jia, “Freewayperformance measurement system: Mining loop detector data,” Transp.Res. Rec., J. Transp. Res. Board, vol. 1748, no. 1, pp. 96–102, 2001.
[5] V. Briggs and K. Jasper, “Organizing for regional transportation opera-tions: Houston TranStar,” Booz-Allen and Hamilton Inc., McLean, VA,USA, Tech. Rep. 00819613, 2001.
[6] J. Miller, S.-I. Kim, M. Ali, and T. Menard, “Determining time totraverse road sections based on mapping discrete GPS vehicle data tocontinuous flows,” in Proc. IEEE Intell. Veh. Symp. (IV), Jun. 2010,pp. 615–620.

SUN et al.: DYNAMIC TRAFFIC FEEDBACK DATA ENABLED ENERGY MANAGEMENT 1085
[7] Y. Zhao, “Mobile phone location determination and its impact onintelligent transportation systems,” IEEE Trans. Intell. Transp. Syst.,vol. 1, no. 1, pp. 55–64, Mar. 2000.
[8] C. Zhang, A. Vahidi, P. Pisu, X. Li, and K. Tennant, “Role of terrainpreview in energy management of hybrid electric vehicles,” IEEE Trans.Veh. Technol., vol. 59, no. 3, pp. 1139–1147, Mar. 2010.
[9] Q. Gong, Y. Li, and Z.-R. Peng, “Trip-based optimal power managementof plug-in hybrid electric vehicles,” IEEE Trans. Veh. Technol., vol. 57,no. 6, pp. 3393–3401, Nov. 2008.
[10] H. Yu, M. Kuang, and R. McGee, “Trip-oriented energy managementcontrol strategy for plug-in hybrid electric vehicles,” in Proc. 50th IEEEConf. Decision Control Eur. Control Conf. (CDC-ECC), Dec. 2011,pp. 5805–5812.
[11] M. Ehsani, Y. Gao, and A. Emadi, Modern Electric, Hybrid Electric,and Fuel Cell Vehicles: Fundamentals, Theory, and Design. Boca Raton,FL, USA: CRC Press, 2009.
[12] P. B. Sharer, A. Rousseau, D. Karbowski, and S. Pagerit, “Plug-in hybridelectric vehicle control strategy: Comparison between EV and charge-depleting options,” in Proc. SAE, 2008.
[13] P. Tulpule, V. Marano, and G. Rizzoni, “Effects of different PHEVcontrol strategies on vehicle performance,” in Proc. Amer. ControlConf. (ACC), Jun. 2009, pp. 3950–3955.
[14] P. Pisu and G. Rizzoni, “A comparative study of supervisory controlstrategies for hybrid electric vehicles,” IEEE Trans. Control Syst. Tech-nol., vol. 15, no. 3, pp. 506–518, May 2007.
[15] S. G. Wirasingha and A. Emadi, “Classification and review of controlstrategies for plug-in hybrid electric vehicles,” IEEE Trans. Veh. Tech-nol., vol. 60, no. 1, pp. 111–122, Jan. 2011.
[16] D. Ambuhl and L. Guzzella, “Predictive reference signal generator forhybrid electric vehicles,” IEEE Trans. Veh. Technol., vol. 58, no. 9,pp. 4730–4740, Nov. 2009.
[17] A. Sciarretta and L. Guzzella, “Control of hybrid electric vehicles,” IEEEControl Syst., vol. 27, no. 2, pp. 60–70, Apr. 2007.
[18] C.-C. Lin, H. Peng, J. W. Grizzle, and J.-M. Kang, “Power managementstrategy for a parallel hybrid electric truck,” IEEE Trans. Control Syst.Technol., vol. 11, no. 6, pp. 839–849, Nov. 2003.
[19] L. Serrao, S. Onori, and G. Rizzoni, “ECMS as a realization ofPontryagin’s minimum principle for HEV control,” in Proc. Amer.Control Conf. (ACC), Jun. 2009, pp. 3964–3969.
[20] H. Borhan, A. Vahidi, A. M. Phillips, M. L. Kuang, I. V. Kolmanovsky,and S. Di Cairano, “MPC-based energy management of a power-splithybrid electric vehicle,” IEEE Trans. Control Syst. Technol., vol. 20,no. 3, pp. 593–603, May 2012.
[21] J. Liu and H. Peng, “Modeling and control of a power-splithybrid vehicle,” IEEE Trans. Control Syst. Technol., vol. 16, no. 6,pp. 1242–1251, Nov. 2008.
[22] K. Ç. Bayindir, M. A. Gözüküçük, and A. Teke, “A comprehensiveoverview of hybrid electric vehicle: Powertrain configurations, power-train control techniques and electronic control units,” Energy Convers.Manage., vol. 52, no. 2, pp. 1305–1313, Feb. 2011.
[23] L. V. Pérez, G. R. Bossio, D. Moitre, and G. O. García, “Optimizationof power management in an hybrid electric vehicle using dynamicprogramming,” Math. Comput. Simul., vol. 73, nos. 1–4, pp. 244–254,Nov. 2006.
[24] L. Johannesson, M. Asbogard, and B. Egardt, “Assessing the potentialof predictive control for hybrid vehicle powertrains using stochasticdynamic programming,” IEEE Trans. Intell. Transp. Syst., vol. 8, no. 1,pp. 71–83, Mar. 2007.
[25] S. J. Moura, H. K. Fathy, D. S. Callaway, and J. L. Stein, “A stochasticoptimal control approach for power management in plug-in hybridelectric vehicles,” IEEE Trans. Control Syst. Technol., vol. 19, no. 3,pp. 545–555, May 2011.
[26] F. A. Bender, M. Kaszynski, and O. Sawodny, “Drive cycle predictionand energy management optimization for hybrid hydraulic vehicles,”IEEE Trans. Veh. Technol., vol. 62, no. 8, pp. 3581–3592, Oct. 2013.
[27] C. Musardo, G. Rizzoni, Y. Guezennec, and B. Staccia, “A-ECMS:An adaptive algorithm for hybrid electric vehicle energy management,”Eur. J. Control, vol. 11, nos. 4–5, pp. 509–524, 2005.
[28] N. Kim, S. Cha, and H. Peng, “Optimal control of hybrid electric vehi-cles based on Pontryagin’s minimum principle,” IEEE Trans. ControlSyst. Technol., vol. 19, no. 5, pp. 1279–1287, Sep. 2011.
[29] B. Gu and G. Rizzoni, “An adaptive algorithm for hybrid electric vehicleenergy management based on driving pattern recognition,” in Proc.ASME Int. Mech. Eng. Congr. Expo., Jan. 2006, pp. 249–258.
[30] E. F. Camacho and C. Bordons, Model Predictive Control, vol. 2.London, U.K.: Springer-Verlag, 2004.
[31] P. Falcone, F. Borrelli, J. Asgari, H. E. Tseng, and D. Hrovat, “Predictiveactive steering control for autonomous vehicle systems,” IEEE Trans.Control Syst. Technol., vol. 15, no. 3, pp. 566–580, May 2007.
[32] B. Asadi and A. Vahidi, “Predictive cruise control: Utilizing upcomingtraffic signal information for improving fuel economy and reducing triptime,” IEEE Trans. Control Syst. Technol., vol. 19, no. 3, pp. 707–714,May 2011.
[33] K. Uthaichana, S. Bengea, R. DeCarlo, S. Pekarek, and M. Zefran,“Hybrid model predictive control tracking of a sawtooth driving pro-file for an HEV,” in Proc. Amer. Control Conf. (ACC), Jun. 2008,pp. 967–974.
[34] G. Ripaccioli, A. Bemporad, F. Assadian, C. Dextreit, S. Di Cairano,and I. V. Kolmanovsky, “Hybrid modeling, identification, and predictivecontrol: An application to hybrid electric vehicle energy manage-ment,” in Hybrid Systems: Computation and Control. Berlin, Germany:Springer-Verlag, 2009, pp. 321–335.
[35] V. Ngo, T. Hofman, M. Steinbuch, and A. Serrarens, “Predictive gearshift control for a parallel hybrid electric vehicle,” in Proc. IEEE Veh.Power Propuls. Conf. (VPPC), Sep. 2011, pp. 1–6.
[36] L. Johannesson and B. Egardt, “A novel algorithm for predictive controlof parallel hybrid powertrains based on dynamic programming,” in Proc.5th IFAC Symp. Adv. Autom. Control, 2007, vol. 5. no. 1, pp. 343–350.
[37] J. C. Herrera, D. B. Work, R. Herring, X. J. Ban, Q. Jacobson, andA. M. Bayen, “Evaluation of traffic data obtained via GPS-enabledmobile phones: The Mobile Century field experiment,” Transp. Res. C,Emerg. Technol., vol. 18, no. 4, pp. 568–583, Aug. 2010.
[38] L. Guzzella and A. Amstutz, “CAE tools for quasi-static modeling andoptimization of hybrid powertrains,” IEEE Trans. Veh. Technol., vol. 48,no. 6, pp. 1762–1769, Nov. 1999.
[39] X. Hu, S. Li, and H. Peng, “A comparative study of equivalent circuitmodels for Li-ion batteries,” J. Power Sour., vol. 198, pp. 359–367,Jan. 2012.
[40] M. André, “The ARTEMIS European driving cycles for measuring carpollutant emissions,” Sci. Total Environ., vol. 334, pp. 73–84, Dec. 2004.
[41] C. Sun, X. Hu, S. J. Moura, and F. Sun, “Comparison of velocityforecasting strategies for predictive control in HEVs,” in Proc. Dyn.Syst. Control Conf. (DSCC), 2014.
[42] S. Lefevre, C. Sun, R. Bajcsy, and C. Laugier, “Comparison of para-metric and non-parametric approaches for vehicle speed prediction,” inProc. Amer. Control Conf. (ACC), Jun. 2014, pp. 3494–3499.
[43] M. T. Hagan, H. B. Demuth, M. H. Beale, and O. De Jesús, NeuralNetwork Design. Boston, MA, USA: PWS Pub., 1996.
[44] G. Ripaccioli, D. Bernardini, S. Di Cairano, A. Bemporad, andI. V. Kolmanovsky, “A stochastic model predictive control approachfor series hybrid electric vehicle power management,” in Proc. Amer.Control Conf. (ACC), Jun./Jul. 2010, pp. 5844–5849.
[45] T. Markel et al., “ADVISOR: A systems analysis tool for advancedvehicle modeling,” J. Power Sour., vol. 110, no. 2, pp. 255–266,Aug. 2002.
[46] O. Sundstrom and L. Guzzella, “A generic dynamic programmingMATLAB function,” in Proc. IEEE Control Appl. (CCA) Intell. Con-trol (ISIC), Jul. 2009, pp. 1625–1630.
[47] K. Muta, M. Yamazaki, and J. Tokieda, “Development of new-generationhybrid system THS II—Drastic improvement of power performance andfuel economy,” in Proc. SAE, 2004, pp. 64–75.
Chao Sun received the B.S. degree in mechanicalengineering from Beihang University, Beijing, Chinain 2010. He is currently pursuing the Ph.D. degreein mechanical and automotive engineering with theBeijing Institute of Technology, Beijing.
He was a visiting student researcher withthe Departments of Mechanical Engineering, andCivil and Environmental Engineering, University ofCalifornia at Berkeley, Berkeley, CA, USA, from2012 to 2014. His current research interests includemodel predictive control for hybrid electric vehicles,
and predictive energy management of smart home nanogrids.

1086 IEEE TRANSACTIONS ON CONTROL SYSTEMS TECHNOLOGY, VOL. 23, NO. 3, MAY 2015
Scott Jason Moura (S’09–M’13) received the B.S.degree from the University of California at Berkeley,Berkeley, CA, USA, in 2006, and the M.S. andPh.D. degrees from the University of Michigan, AnnArbor, MI, USA, in 2008 and 2011, respectively, allin mechanical engineering.
He is currently an Assistant Professor and theDirector of the Energy, Controls, and ApplicationsLaboratory with the Department of Civil and Envi-ronmental Engineering, University of California atBerkeley, Berkeley, CA, USA. His current research
interests include optimal and adaptive controls, partial differential equationscontrol, smart grids, vehicle-to-grid systems, and batteries.
Dr. Moura was a recipient of the National Science Foundation Grad-uate Research Fellowship, the UC Presidential Post-Doctoral Fellowship,the University of Michigan Distinguished ProQuest Dissertation HonorableMention, and the University of Michigan Rackham Merit Fellowship andthe College of Engineering Distinguished Leadership Award. He has beennominated for the Best Student Paper Award from the American Society ofMechanical Engineers Dynamic Systems and Control Conference in 2009 andthe American Control Conference in 2011.
Xiaosong Hu (S’11–M’13) received the Ph.D.degree in automotive engineering from the BeijingInstitute of Technology, Beijing, China, in 2012.
He was involved in scientific research and com-pleted the Ph.D. dissertation from the Automo-tive Research Center, University of Michigan, AnnArbor, MI, USA, from 2010 to 2012. He was aPost-Doctoral Researcher with the Swedish HybridVehicle Center, Department of Signals and Systems,Chalmers University of Technology, Gothenburg,Sweden, from 2012 to 2014. He was also a Visiting
Post-Doctoral Researcher with the Institute for Dynamic Systems and Control,Swiss Federal Institute of Technology, Zurich, Switzerland, in 2014. He iscurrently a Post-Doctoral Scholar with the Energy, Controls, and ApplicationsLaboratory, University of California at Berkeley, Berkeley, CA, USA. Hiscurrent research interests include optimal control and dimensioning of electri-fied powertrains, and modeling and management of energy storage systems.
Dr. Hu was a recipient of the Beijing Best Ph.D. Dissertation Award in 2013.
J. Karl Hedrick received the bachelor’s degreein engineering mechanics from the University ofMichigan, Ann Arbor, MI, USA, in 1966, and theM.S. and Ph.D. degrees in aeronautical and astronau-tical engineering from Stanford University, Stanford,CA, USA, in 1970 and 1971, respectively.
He is currently the James Marshall Wells Professorof Mechanical Engineering with the University ofCalifornia at Berkeley, Berkeley, CA, USA, wherehe teaches graduate and undergraduate courses inautomatic control theory. He is also the Director of
the Vehicle Dynamics Laboratory and a Principal Investigator with the Centerfor Collaborative Control of Unmanned Vehicles, University of California atBerkeley.
Fengchun Sun received the M.E. and Ph.D. degreesin vehicle engineering from the Beijing Instituteof Technology, Beijing, China, in 1984 and 1989,respectively, and the Ph.D. degree from the Techni-cal University of Berlin, Berlin, Germany, in 1989.
He is currently a Professor and the Vice Presidentof the Beijing Institute of Technology, where heis also the Director of the National EngineeringLaboratory for Electric Vehicles. He has authoredover 150 papers and holds 19 patents. His currentresearch interests include electric vehicles, electric
drive systems, electric vehicle demonstration, and infrastructure.Dr. Sun was a recipient of the National Science and Technology
Progress Awards in 2008, the National Technological Innovation Awards in2004 and 2009, and the Industrial Innovation Award from the Ho Leung HoLee Foundation in 2007. He has been conferred the title of Cheung KongScholar from the Ministry of Education, China.