Efficiency Analysis of Drive Train Topologies Applied to Electric/Hybrid Vehicles
12
Φ Abstract—One of the most important research topics in drive train topologies applied to electric/hybrid vehicles is the efficiency analysis of the power train components, including the global drive efficiency. In this paper, two basic traction electric drive systems of electric/hybrid vehicles are presented and evaluated, with a special focus on the efficiency analysis. The first topology comprises a traditional pulse-width-modulation battery- powered inverter while in the second one, the battery is connected to a bidirectional dc-dc converter, which supplies the inverter. Furthermore, a variable voltage control technique applied to this second topology is presented, which allows to improve the drive overall performance. Some simulation results are presented considering both topologies and a permanent magnet synchronous motor. An even more detailed analysis is performed through the experimental validation. Particular attention is given to the evaluation of the main drive components efficiency, including the global drive efficiency, presented in the form of efficiency maps. Other parameters such as motor voltages distortion and power factor are also considered. In addition, the comparison of the two topologies takes into account the drive operation under motoring and regenerative braking modes. Index Terms—Electric vehicles, automotive applications, permanent magnet machines, energy efficiency, power conversion, voltage control, dc-dc power converters, bidirectional power flow, machine vector control. I. NOMENCLATURE v d , v q dq axes voltage components i d , i q dq axes current components i cd , i cq dq axes iron losses current components i md , i mq dq axes magnetizing current components R s Stator winding resistance ! Stator currents frequency L d , L q dq axes inductance components à P M Flux linkage due to the rotor magnets Copyright (c) 2012 IEEE. Personal use of this material is permitted. However, permission to use this material for any other purposes must be obtained from the IEEE by sending a request to [email protected]. This work was supported by the Portuguese Government through the Foundation for Science and Technology (FCT) under Project No. SFRH/BD/40286/2007 and Project No. PTDC/EEA-ELC/105282/2008. Jorge O. Estima is with the Department of Electrical and Computer Engineering, University of Coimbra, 3030-290 Coimbra, Portugal, and also with the Instituto de Telecomunicações, 3030-290 Coimbra, Portugal (email: [email protected]). A. J. Marques Cardoso is with the Dep of Electromechanical Engineering, University of Beira Interior, 6201-001 Covilhã, Portugal, and also with the Instituto de Telecomunicações, 3030-290 Coimbra, Portugal (email: [email protected]). ! r Rotor mechanical speed J Moment of inertia T e Electromagnetic torque D Damping coefficient T L Load torque μ Rotor electrical position p Pole pairs number P Cu Stator winding copper power losses P F e Stator iron power losses ´ Efficiency P in Input power P out Output power P lo Power losses X rms Waveform rms value X 1 Waveform fundamental component rms value II. INTRODUCTION ONSIDERING the high oil consumption rate of the transportation sector and due to the arising concerns about global warming and energy resource constraints, government agencies and organizations are imposing more stringent regulations for fuel consumption and emissions. With this increasing demand for environmentally friendlier and higher fuel economy vehicles, the automotive companies are focused on the development of new technologies such as hybrid electric vehicles, electric vehicles, fuel cell vehicles and plug-in vehicles [1]. Although electric and fuel cell vehicles represent a possible solution for this problem, presently, they have some limitations which make them a less attractive option than the others [2]. For these automotive traction systems, the electric motor is one of the most important key components. The major requirements for these applications include high torque and power density, high starting torque, high efficiency over wide torque and speed ranges, a very wide speed range, including constant torque and constant power regions, high intermittent overload capability and reasonable cost [3]-[7]. In this context, permanent magnet synchronous motors (PMSM) are becoming more and more attractive. These machines have inherent features such as high power density and high efficiency, which make them very suitable for these applications. Regarding the traction electric drive system, there are two basic configurations [8]-[10]. The first comprises a traditional PWM battery-powered inverter (Fig. 1a), while in the second Efficiency Analysis of Drive Train Topologies Applied to Electric/Hybrid Vehicles Jorge O. Estima, Member, IEEE, and A. J. Marques Cardoso, Senior Member, IEEE C
-
Upload
independent -
Category
Documents
-
view
0 -
download
0
Transcript of Efficiency Analysis of Drive Train Topologies Applied to Electric/Hybrid Vehicles

ΦΦΦΦAbstract—One of the most important research topics in drive
train topologies applied to electric/hybrid vehicles is the
efficiency analysis of the power train components, including the
global drive efficiency. In this paper, two basic traction electric
drive systems of electric/hybrid vehicles are presented and
evaluated, with a special focus on the efficiency analysis. The first
topology comprises a traditional pulse-width-modulation battery-
powered inverter while in the second one, the battery is
connected to a bidirectional dc-dc converter, which supplies the
inverter. Furthermore, a variable voltage control technique
applied to this second topology is presented, which allows to
improve the drive overall performance. Some simulation results
are presented considering both topologies and a permanent
magnet synchronous motor. An even more detailed analysis is
performed through the experimental validation. Particular
attention is given to the evaluation of the main drive components
efficiency, including the global drive efficiency, presented in the
form of efficiency maps. Other parameters such as motor
voltages distortion and power factor are also considered. In
addition, the comparison of the two topologies takes into account
the drive operation under motoring and regenerative braking
modes.
Index Terms—Electric vehicles, automotive applications,
permanent magnet machines, energy efficiency, power
conversion, voltage control, dc-dc power converters, bidirectional
power flow, machine vector control.
I. NOMENCLATURE
vd, vq dq axes voltage components
id, iq dq axes current components
icd, icq dq axes iron losses current components
imd, imq dq axes magnetizing current components
Rs Stator winding resistance
! Stator currents frequency
Ld, Lq dq axes inductance components
ÃPM Flux linkage due to the rotor magnets
Copyright (c) 2012 IEEE. Personal use of this material is permitted.
However, permission to use this material for any other purposes must be
obtained from the IEEE by sending a request to [email protected].
This work was supported by the Portuguese Government through the
Foundation for Science and Technology (FCT) under Project No.
SFRH/BD/40286/2007 and Project No. PTDC/EEA-ELC/105282/2008.
Jorge O. Estima is with the Department of Electrical and Computer
Engineering, University of Coimbra, 3030-290 Coimbra, Portugal, and also
with the Instituto de Telecomunicações, 3030-290 Coimbra, Portugal (email:
A. J. Marques Cardoso is with the Dep of Electromechanical Engineering,
University of Beira Interior, 6201-001 Covilhã, Portugal, and also with the
Instituto de Telecomunicações, 3030-290 Coimbra, Portugal (email:
!r Rotor mechanical speed
J Moment of inertia
Te Electromagnetic torque
D Damping coefficient
TL Load torque
µ Rotor electrical position
p Pole pairs number
PCu Stator winding copper power losses
PFe Stator iron power losses
´ Efficiency
Pin Input power
Pout Output power
Plo Power losses
Xrms Waveform rms value
X1 Waveform fundamental component rms value
II. INTRODUCTION
ONSIDERING the high oil consumption rate of the
transportation sector and due to the arising concerns
about global warming and energy resource constraints,
government agencies and organizations are imposing more
stringent regulations for fuel consumption and emissions.
With this increasing demand for environmentally friendlier
and higher fuel economy vehicles, the automotive companies
are focused on the development of new technologies such as
hybrid electric vehicles, electric vehicles, fuel cell vehicles
and plug-in vehicles [1]. Although electric and fuel cell
vehicles represent a possible solution for this problem,
presently, they have some limitations which make them a less
attractive option than the others [2].
For these automotive traction systems, the electric motor is
one of the most important key components. The major
requirements for these applications include high torque and
power density, high starting torque, high efficiency over wide
torque and speed ranges, a very wide speed range, including
constant torque and constant power regions, high intermittent
overload capability and reasonable cost [3]-[7]. In this
context, permanent magnet synchronous motors (PMSM) are
becoming more and more attractive. These machines have
inherent features such as high power density and high
efficiency, which make them very suitable for these
applications.
Regarding the traction electric drive system, there are two
basic configurations [8]-[10]. The first comprises a traditional
PWM battery-powered inverter (Fig. 1a), while in the second
Efficiency Analysis of Drive Train Topologies
Applied to Electric/Hybrid Vehicles
Jorge O. Estima, Member, IEEE, and A. J. Marques Cardoso, Senior Member, IEEE
C

one the battery is connected to a bidirectional dc-dc converter,
typically a boost converter, which supplies the inverter (Fig.
1b). The use of a bidirectional dc-dc converter, to connect the
battery and the inverter, has several advantages over the
configuration where the battery directly powers the inverter.
Beyond the possibility to minimize the stress of the inverter
with an extra dc stage, it is possible to improve the motor
output by increasing and controlling the inverter supply
voltage (system voltage) without increasing the battery cost
and size, due to the requirement of building up a higher cell
number, keeping simultaneously the same motor size [11].
This topology also permits to separately design the system
voltage and battery, allowing for flexible system designs for
vehicles with different output characteristics. System voltage
design can be based on motor output and withstanding voltage
of parts, and for battery voltage design the number of cells can
be altered to match the required battery output and capacity
[12]-[13]. However, this configuration has some
disadvantages such as power losses in the dc-dc converter and
the increase of system complexity and cost. This also arises
the concern about the power components physical dimensions.
Despite the battery size reduction, it must be taken into
account the additional inductor and power switches, which
may require the optimization and size reduction of the power
electronics components. The reliability issues due to the
introduction of an additional component must also be taken
into account.
An important aspect in the selection of these topologies is
the system cost versus the cost of use relation. The second
topology requires a smaller battery, and therefore its cost can
be reduced. Nevertheless, the cost regarding the extra power
components and more complex design issues can compensate
for the cheaper battery. Considering the cost of use, beyond
the drive system efficiency, it strongly depends on the
maintenance aspects. As a consequence, important issues such
as battery life-time, its corresponding cost and the reliability
levels associated to the topologies complexity must be taken
into account for an accurate analysis.
Other configurations can be obtained by combining these
topologies with different energy storage technologies. In [14]
and [15], a high voltage battery pack directly supplies the
inverter, supported by an ultracapacitor bank, connected to the
battery bus through bidirectional dc-dc converters. Parallel
converters were considered, which allow to reduce the
inductor current ripple and improve the global efficiency. The
same power sources can also be connected together to a dc-dc
converter, which supplies the high voltage bus [16].
The combination of batteries and fuel cells can also be used
for the drive train of hybrid/electric vehicles. In [17] it was
addressed the integration of these power sources with several
topologies of isolated and non-isolated dc-dc converters. This
subject, as well as other different configurations, were also
investigated in [18].
The advantages of fuel cells can also be combined with the
great dynamic response and power density of ultracapacitors
for these electric traction systems [19]-[21]. The presented
results allow to conclude that with an appropriate power
management control technique, this hybrid source is able to
provide any load demand. Furthermore, by using bidirectional
dc-dc converters, it is possible to achieve a better control over
the fuel cell voltage during transients. Considering the
combination of these hybrid sources and using several dc-dc
converters, an energy management strategy based on flatness
and fuzzy logic control techniques was presented in [22]. As a
main advantage, it is pointed out that the power management
is carried out with a single general control algorithm in
different operating modes.
Due to the great importance of bidirectional dc-dc
converters in advanced transportation systems, a novel
capacitor-switched regenerative snubber for dc-dc boost
converters was proposed in [23]. The resulting topology
allows to reduce the switching losses so that high switching
frequency operation can be achieved. As a consequence,
higher efficiency values can be obtained and the overall
converter mass can be significantly reduced.
The literature review shows that, despite of all the existing
work done by several authors concerning the study of electric
drive systems for electric/hybrid vehicles, there is a lack of
research regarding the detailed efficiency analysis of different
power train configurations for these specific applications.
Accordingly, and considering the work previously reported in
[24], this paper provides an in-depth analysis of two basic
electric drive topologies based on a PMSM (Fig. 1), with a
special focus on the efficiency analysis. Furthermore,
considering the topology T2 (Fig. 1b), an improved variable
voltage control technique for the dc-dc converter is described
and implemented, allowing to dynamically adjust the system
voltage, thus contributing to achieve higher efficiency values
and improve the drive overall performance. Some simulation
results are presented using a PMSM dynamic model which
takes the iron losses into account. An even more detailed
analysis is performed through the experimental validation
+
-
Inverter
PMSM
(a)
+
-
DC-DC Converter Inverter
PMSM
(b)
Fig. 1 – Basic traction electric drive topologies for electric/hybrid vehicles:
(a) topology T1; (b) topology T2.

where efficiency maps are obtained for each drive component,
including the efficiency maps of both topologies global
efficiency. In addition, motor voltages distortion and power
factor results are also evaluated. Finally, a comparison of the
two topologies is provided for the drive operation under
motoring and regenerative braking modes trough a drive cycle
analysis.
III. PMSM DYNAMIC MODEL WITH IRON LOSSES
Typical PMSM mathematical models found in the literature
do not take iron losses into account. For this reason, in order
to obtain a more accurate modeling, especially for the iron
losses, a dedicated parameter has been considered aimed at
accounting for the iron losses in the stator core, specifically
the eddy current losses. These are modeled by a resistor Rc
which is inserted in parallel with the magnetizing branch, so
that the power losses depend on the air-gap flux linkage [25]-
[30]. Thus, the dq axes currents (id, iq) are divided into the
iron loss currents (icd, icq) and the magnetizing currents (imd,
imq), as shown in Fig. 2.
Considering this, and assuming that the saturation is
neglected, the electromotive force is sinusoidal, and a cageless
rotor, the state equations of the dynamic model of the PMSM
in the synchronous reference frame, also taking into account
the iron losses, are given by:
dimd
dt=
1
Ld
(vd ¡Rsid + !Lqimq) (1)
dimq
dt=
1
Lq
(vq ¡Rsiq ¡ !Ldimd ¡ !ÃPM ) (2)
d!r
dt=
1
J(Te ¡D!r ¡ TL) (3)
dµ
dt= ! = !rp (4)
where
id =1
Rc
µ
Ld
dimd
dt¡ wLqimq +Rcimd
(5)
iq =1
Rc
µ
Lq
dimq
dt+ !Ldimd + !ÃPM +Rcimq
(6)
icd = id ¡ imd ; icq = iq ¡ imq (7)
Te =3
2p [ÃPM imq + (Ld ¡ Lq) imdimq] (8)
By referring equations (1), (2), (5) and (6) to a steady-state
condition, it is possible to define a mathematical expression
for the power losses in the stator windings. These can be
calculated according to following expression:
PCu =3
2Rs
¡
i2
d + i2
q
¢
(9)
In a similar way, the power losses that are caused by the
fundamental component of the total flux linkage in the iron
stack can be calculated as:
PFe =3
2Rc
¡
i2cd + i2cq¢
=3
2
!2
Rc
h
(Lqimq)2 + (ÃPM + Ldimd)
2
i (10)
Although not considered in this work, hysteresis losses can
also be taken into account. These losses are proportional to the
machine phase currents frequency. Therefore, in order to
include them into the machine model, the iron losses
resistance Rc is usually treated as a function of !.
IV. VARIABLE VOLTAGE CONTROL
Considering the topology T2, and by adjusting the inverter
supply voltage through a variable voltage control strategy
applied to the bidirectional dc-dc boost converter, the system
minimum losses can be achieved, according to the motor
operating conditions. When the motor is operating below its
base speed, the system voltage does not need to be equal to
the rated inverter supply voltage. Therefore, it can be
concluded that to minimize the overall system losses, the
system voltage must be proportional to the PMSM back-EMF.
Taking into account that the back-EMF generated by a PMSM
is typically proportional to its mechanical speed, the required
system voltage can be then obtained according to the curve
shown in Fig. 3.
When the motor speed is low, the inverter supply voltage
will be the lowest voltage of the boost converter, which is
Rs
!Lqimq
LdRc
id imd
icd
vd
(a)
Rs
!Ldimd
LqRc
iq imq
icq
vq
!ÃPM
(b)
Fig. 2 – dq axes equivalent circuits for the PMSM model taking iron losses
into account: (a) d-axis; (b) q-axis.

imposed by the battery. Above the motor base speed, in the
constant power zone, the dc-dc converter is controlled in
order to supply the inverter with the rated system voltage. For
the intermediate range, the system voltage changes
dynamically in accordance with the machine mechanical
speed.
The overall performance can be even more improved if the
system voltage also takes into account the PMSM load level.
These two fundamental goals can be simultaneously
considered if the system voltage is controlled according to the
modulation index m of the inverter space-vector pulse-width-
modulation (SV-PWM) technique. Since directly it depends
on the amplitude of the reference voltage vector and on the
inverter supplying voltage Vdc, the dc-dc converter can be
controlled in order to impose a system voltage that maintains
the inverter modulation index at a specific reference value, as
shown in Fig. 4. By doing this and assuming a large value for
the reference modulation index, it is possible to dynamically
adjust and optimize the system voltage according to the motor
mechanical operating conditions. Therefore, the overall drive
performance can be greatly improved by reducing the voltage
and currents distortion values and increasing the efficiency
levels.
V. SIMULATION RESULTS
The modeling and simulation of the PMSM drive systems
shown in Fig. 1, was carried out using the Matlab/Simulink
environment, in association with the Power System Blockset.
This software toolbox provides a great number of several
power electronics mathematical models that were used for the
simulation. The PMSM model described in Section III was
implemented in Simulink, as well as the battery model. This
last one is based on the work published in [31].
For both topologies, a rotor field oriented control strategy
employing PI current controllers and a SV-PWM technique
was applied to the inverter in order to control the PMSM
mechanical speed. The PMSM parameters are summarized in
Table VI, included in Appendix.
The switching frequency of the SV-PWM was chosen to be
equal to 6 kHz. Regarding the topology in Fig. 1a, the inverter
is directly supplied by the battery with a rated voltage of 384
V. Considering the other topology, the system voltage is
controlled by the bidirectional dc-dc converter within the
range of 168 V (corresponding to the battery rated voltage) to
384 V. Assuming that the rated system voltage is 384 V, the
battery voltage for topology T2 can be selected according to
several criteria. Beyond the size limitation, an important
aspect is the desired global drive maximum efficiency
operating point. Therefore, by choosing a battery voltage near
to the system rated voltage, allows to achieve maximum
efficiency at high speeds. On the other hand, a lower battery
voltage allows to achieve high efficiency at low speed values.
For both topologies, the same IGBT inverter and PMSM
were considered. The control system implemented is
described in Fig. 4. A value of 9 kHz was chosen for the
switching frequency of the PWM technique. Regarding the
modulation index control loop, it is controlled within the
linear range between 0 and 1 (over-modulation is not
considered). Therefore, and taking also into account that
lower harmonic distortion is obtained for a high modulation
index [32], a reference value of 0.93 was assumed.
Two distinct operating conditions were considered: when
the machine operates as a motor (motoring mode) and when it
operates as a generator (regenerative braking). For both cases,
several results are presented with the aim to establish a
performance comparison of both topologies.
In order to analyze all the considered cases, several
performance parameters are calculated. The efficiency values
of the main drive components, i.e. the dc-dc converter, the
inverter and the machine, are presented as well as the global
drive efficiency values. All the efficiency values and power
losses are calculated by the analysis of the drive power flow,
using the input and output power of each component:
´ =Pout
Pin
£ 100% (11)
Plo = Pin ¡ Pout (12)
Regarding the PMSM, beyond the analysis of its power
factor, the harmonic distortion values of its supplying voltages
are also investigated. In order to take into account the dc
component and all the sub-harmonics, the distortion of the
waveforms is more properly evaluated by calculating the Total
System
Voltage
Rated
Voltage
Battery
Voltage
Constant Torque Constant Power
Mechanical
Speed
Base
Speed
Variable Voltage
Control Range
Fig. 3 – Required system voltage with variable voltage control.
+-
dq
αβ
+-
+- SV-PWM
Speed
Controller
iq
!¤
r
i¤
d
id
v¤
q
v¤
d
v¤
®
v¤
¯
µ
!r
dq
abciaibic
+-
+-
m¤
+-
V¤
dc
m Modulation Index
Controller
Vdc
PMSM
DC
DCPWM
Fig. 4 – Block diagram of the control strategy for topology T2.

Waveform Distortion (TWD) defined as:
TWD =
p
X2rms
¡X2
1
X1
£ 100% (13)
Finally, for all the considered operating conditions, a
constant torque equivalent to 50% of the PMSM rated torque
is assumed, together with a reference speed of 600 revolutions
per minute. Considering these speed and load values, the dc-
dc converter variable voltage control adjusts the system
voltage to a reference value of approximately 177 V.
Table I and Table II present the efficiency results of the
drive system main components for topologies T1 and T2,
under motoring and regenerative braking operating modes,
respectively. These results clearly demonstrate that higher
global efficiency results can be achieved by the topology T2.
Furthermore, the results also show that the inverter is the
mostly affected device since its efficiency varies considerably
when comparing both topologies. Considering topology T1,
the inverter is supplied by its the rated voltage, corresponding
to the battery voltage. This means that, for the considered
operating conditions, the modulation index is relatively low
and, as a consequence, the inverter switching losses are larger
when compared to the ones obtained for the topology T2.
Regarding to the voltage distortion values, the results in
Table III show that for both motoring and regenerative
braking modes, with topology T2 the TWD values can be
approximately reduced by one-half. This also leads to the
reduction of the motor phase currents distortion, as shown in
Fig. 5. These lower TWD values are justified by the fact that
the system voltage imposed by the dc-dc converter is
controlled by taking into account the chosen reference
modulation index. This also leads to the improvement of the
machine power factor. By reducing the voltage TWD, their
corresponding rms values will also decrease, as well as the
PMSM apparent power, subsequently increasing its power
factor.
VI. EXPERIMENTAL RESULTS
The experimental setup basically comprises a battery pack,
two IGBT Semikron power modules SKiiP 132GD120-3DU,
one for the inverter and the other for the dc-dc converter, a
dSPACE DS1103 digital controller and a Yaskawa PMSM
coupled to a four-quadrant servomotor test system (Fig. 6).
TABLE I
EFFICIENCY RESULTS (%), UNDER MOTORING OPERATION, FOR 50% OF THE
PMSM RATED TORQUE
Topology T1 Topology T2
600
rpm
900
rpm
1200
rpm
600
rpm
900
rpm
1200
rpm
DC-DC
Converter − − − 98.1 97.4 96.6
Inverter 92.9 95.0 96.2 97.2 97.4 97.3
PMSM 85.8 86.9 87.2 88.6 88.8 88.9
Global 79.7 82.6 83.9 84.5 84.2 83.6
TABLE II
EFFICIENCY RESULTS (%), UNDER REGENERATIVE BRAKING OPERATION, FOR
50% OF THE PMSM RATED TORQUE
Topology T1 Topology T2
600
rpm
900
rpm
1200
rpm
600
rpm
900
rpm
1200
rpm
DC-DC
Converter − − − 97.9 97.6 96.7
Inverter 89.7 93.3 95.1 97.2 97.6 97.4
PMSM 83.7 84.7 85.1 86.9 87.4 88.0
Global 75.1 79.0 80.9 82.7 83.3 82.9
TABLE III
TWD AND POWER FACTOR RESULTS FOR 600 RPM AND 50% OF THE
PMSM RATED TORQUE
Topology T1 Topology T2
Motoring
Mode
TWD (%) 150.91 69.39
Power Factor 0.551 0.796
Regenerative
Braking Mode
TWD (%) 170.16 90.74
Power Factor 0.467 0.718
0.44 0.45 0.46 0.47 0.48 0.49 0.5−3
−2
−1
0
1
2
3
Time (s)
PM
SM
Ph
ase
Cu
rren
ts (
A)
0.44 0.45 0.46 0.47 0.48 0.49 0.5−3
−2
−1
0
1
2
3
Time (s)P
MS
M P
has
e C
urr
ents
(A
)
ia ib ic
ia ib ic
(b)
(a)
Fig. 5 – Time-domain waveforms of the PMSM phase currents for 600 rpm
and 25% of the motor rated torque: (a) topology T1; (b) topology T2.
Fig. 6 – General view of the experimental setup.

The PMSM parameters can be found in Appendix. For the
dc-dc converter, an inductor of 10 mH was used, together with
an output filter capacitor of 1100 µF. The battery pack
comprises several 12 V 12 Ah lead-acid batteries connected in
series (32 and 14 batteries for topologies T1 and T2,
respectively). Due to the limited number of dedicated PWM
outputs available at the controller, the modulation strategies
were implemented by software. The switching frequencies for
the inverter SV-PWM and the dc-dc converter PWM
techniques were therefore chosen to be of 6 kHz and 9 kHz,
respectively.
The real-time interface board library for the DS1103
controller is designed as a common Matlab/Simulink Blockset
that provides blocks to implement the I/O capabilities in
Simulink models. The dSPACE ControlDesk software
provides functions for real-time control and monitoring,
allowing simultaneously to capture data files that can be
plotted using the Matlab (Fig. 7).
The control system was implemented for the DS1103 board
using a sampling time of 25 µs. The voltage and current
signals as well as all the IGBTs gate commands are connected
to the dSPACE controller trough interface and isolation
boards (Fig. 8). Two digital power analyzers Yokogawa
WT3000 were connected in series in the power circuit in order
to obtain the required data such as power flow, power factor,
efficiency and rms values. The rotor position is obtained by an
incremental encoder with 1024 pulses per revolution, being
the PMSM mechanical speed obtained by filtering the
derivative of the rotor position.
For the topology T1, the inverter is directly supplied by a
rated system voltage of 384 V. On the other side, considering
the second topology, the drive system is supplied by a battery
pack with a rated voltage of 168 V. The system voltage is
dynamically adjusted by the dc-dc converter within the range
of 168 V to 384 V. For the modulation index control, a
reference value of 0.93 is assumed again. The same inverter
power module was also used for both topologies.
Experimental results are presented considering the drive
operation under motoring and regenerative braking modes. In
order to compare both topologies, a particular attention is
given to the efficiency analysis of the drive main components,
including the global efficiency values. The PMSM voltages
TWD and power factor results are also presented.
A. Motoring Operation
Fig. 9 presents an acceleration test for 50% of the PMSM
rated load torque, showing the behavior of the variable
voltage control for the topology T2. At t=1 s, a change of the
reference speed from 500 rpm to 800 rpm is introduced, with
an acceleration rate of 100 rpm/s. The system voltage is kept
constant and equal to 168 V when the motor operates below
550 rpm. Under these conditions, the modulation index is
lower than the imposed reference value and the dc-dc
converter will fed the inverter with the lowest voltage value,
corresponding to the battery voltage. When the machine
accelerates above 550 rpm, the modulation index becomes
equal to the reference value and the variable voltage control is
enabled. Then, the system voltage increases proportionally to
the PMSM speed until the new reference speed is reached.
The results in Fig. 10 to Fig. 15 present the efficiency maps
of the inverter and the PMSM, including the global drive
efficiency values for the topologies T1 and T2.
Comparing the inverter efficiency maps for both topologies in
Fig. 10 and in Fig. 11, it can be clearly seen that with the
Fig. 7 – General view of the real-time interface and measuring equipment.
Fig. 8 – Block diagram with the main components of the experimental setup.
0 1 2 3 4 5 6400
500
600
700
800
900
Time (s)
PM
SM
Mec
han
ical
Spee
d (
rpm
)
160
180
200
220
240
260
Syst
em V
olt
age
(V)
System Voltage
PMSM Speed
Fig. 9 – Time-domain waveforms of the PMSM mechanical speed and system
voltage for a change of the reference value from 500 rpm to 800 rpm.

topology T2, it is possible to obtain significantly higher
efficiency values for the inverter. Moreover, for the operating
points above 600 rpm, the inverter efficiency is relatively high
and constant when compared to the topology T1. This is
justified by the fact that the drive is operating in the variable
voltage control zone, and consequently the inverter losses,
especially the switching losses, are minimized. Below this
speed value, the inverter efficiency starts to decrease more
rapidly because the system voltage is imposed by the battery
and the modulation index control is no longer possible.
Nevertheless, the efficiency values in this zone are still
significantly higher for topology T2.
Regarding the PMSM, Fig. 12 and Fig. 13 present its
efficiency maps for the two considered topologies T1 and T2,
respectively. For high speed and load levels, the PMSM
presents similar efficiency values for both topologies since the
system voltage is practically the same. However, the most
important difference is observed for load levels below 50% of
the motor rated torque, where the PMSM efficiency for
topology T2 becomes higher than for topology T1. Once
more, thanks to the variable voltage control, the global
machine efficiency can be improved, particularly for low
speed and torque values. By adjusting the inverter supplying
voltage through the control of its modulation index, the
PMSM voltage rms values are minimized, reducing the
machine losses, namely the iron losses in the stator stack.
Fig. 14 and Fig. 15 present the efficiency maps of the
global drive efficiency for topologies T1 and T2, respectively.
Comparing these results, it can be concluded that, despite
of the higher efficiency values of the inverter and the motor
for topology T2, due to the dc-dc converter losses, the global
efficiency is negatively affected when the PMSM operates at
high speed and load levels. Under these conditions, the
modulation index for topology T1 is naturally high. Therefore,
and taking also into account that there are losses only in the
inverter and in the machine, the overall efficiency values will
be higher than for topology T2. However, for low speed
values or in particular for load levels below 50% of the motor
rated torque, the global drive efficiency for topology T2
becomes much higher than for topology T1. Under these
operating conditions, the modulation index control allows to
decrease the system voltage, resulting in lower losses in all
drive components and higher efficiency values.
From these tests, the maximum global drive efficiency was
68.5
69.8
71.1
72.4
73.7
75.1
76.4
79
79
80.3
80.3
81.6
81.6
82.9
82.9
84.2
84.2
85.5
85.5
86.9
86.9
88.2
88.2
89.5
89.5
90.8
90.8
92.2
Speed (rpm)
Lo
ad T
orq
ue
(Nm
)
300 400 500 600 700 800 900 1000 1100 12001
2
3
4
5
6
7
8
9
10
11
12
70
75
80
85
90
Fig. 12 – PMSM efficiency map for topology T1.
68.9
70.2
71.5
72.9
74.2 75.9
78.2
79.5
79.5
80.9
80.9
82.2
82.2
83.5
83.5
84.9
84.9
86.2
86.2
87.5
87.5
88.9
88.9
90.2
90.2
91.5
91.5
92.9
92.9
Speed (rpm)
Load
Torq
ue
(Nm
)
300 400 500 600 700 800 900 1000 1100 12001
2
3
4
5
6
7
8
9
10
11
12
70
75
80
85
90
Fig. 13 – PMSM efficiency map for topology T2.
75
77.4
78.6
79.8
81
82.2
83.4
84.6
85.8
87
88.2
89.4
90.6
91.8
93
94.2
95.4
96.6
Speed (rpm)
Lo
ad T
orq
ue
(Nm
)
300 400 500 600 700 800 900 1000 1100 12001
2
3
4
5
6
7
8
9
10
11
12
75
80
85
90
95
Fig. 10 – Inverter efficiency map for topology T1.
90
90.9
91.3
91.7
92.2
92.6
93
93.5
93.9
94.3
94.8
95.2
95.6
96.1
96.5 9
6.9
97.3
Speed (rpm)
Load
Torq
ue
(Nm
)
300 400 500 600 700 800 900 1000 1100 12001
2
3
4
5
6
7
8
9
10
11
12
75
80
85
90
95
Fig. 11 – Inverter efficiency map for topology T2.
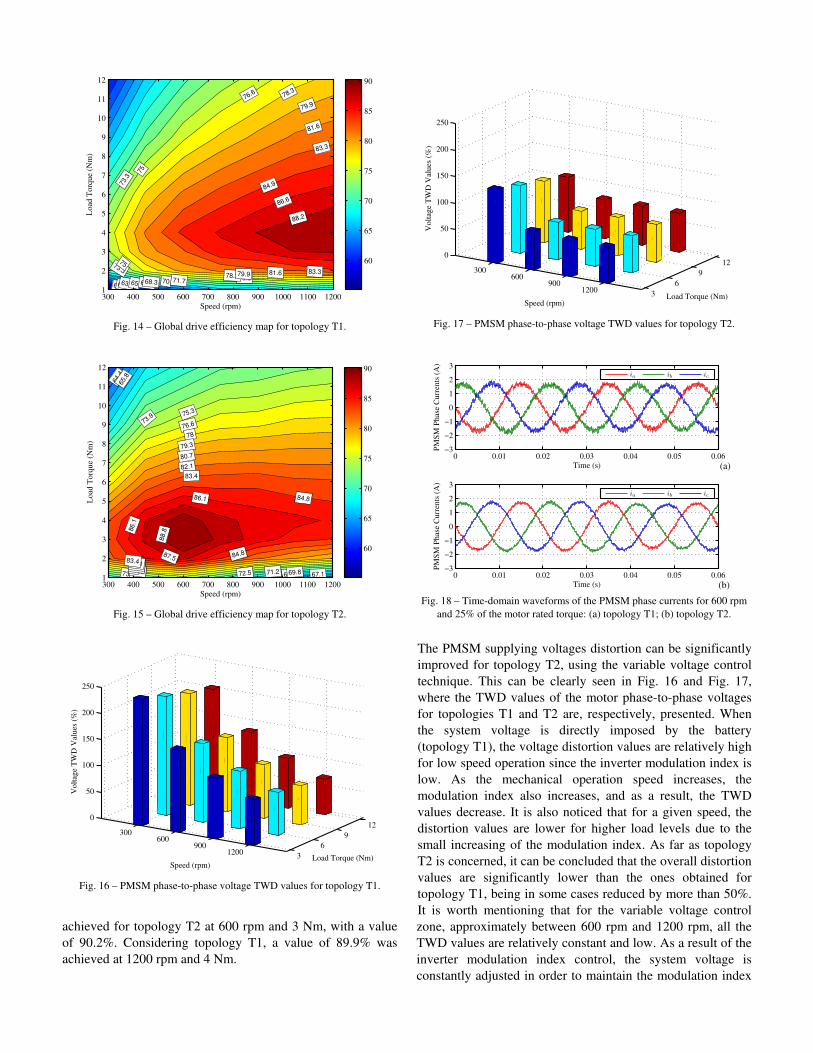
achieved for topology T2 at 600 rpm and 3 Nm, with a value
of 90.2%. Considering topology T1, a value of 89.9% was
achieved at 1200 rpm and 4 Nm.
The PMSM supplying voltages distortion can be significantly
improved for topology T2, using the variable voltage control
technique. This can be clearly seen in Fig. 16 and Fig. 17,
where the TWD values of the motor phase-to-phase voltages
for topologies T1 and T2 are, respectively, presented. When
the system voltage is directly imposed by the battery
(topology T1), the voltage distortion values are relatively high
for low speed operation since the inverter modulation index is
low. As the mechanical operation speed increases, the
modulation index also increases, and as a result, the TWD
values decrease. It is also noticed that for a given speed, the
distortion values are lower for higher load levels due to the
small increasing of the modulation index. As far as topology
T2 is concerned, it can be concluded that the overall distortion
values are significantly lower than the ones obtained for
topology T1, being in some cases reduced by more than 50%.
It is worth mentioning that for the variable voltage control
zone, approximately between 600 rpm and 1200 rpm, all the
TWD values are relatively constant and low. As a result of the
inverter modulation index control, the system voltage is
constantly adjusted in order to maintain the modulation index
60.161.763.465 66.7
68.3 70 71.7
73.3
73.3
75
75
76.6
76.6
78.3
78.3
79.9
79.9
81.6
81.6
83.3
83.3
84.9
86.6
88.2
Speed (rpm)
Lo
ad T
orq
ue
(Nm
)
300 400 500 600 700 800 900 1000 1100 12001
2
3
4
5
6
7
8
9
10
11
12
60
65
70
75
80
85
90
Fig. 14 – Global drive efficiency map for topology T1.
64.4
65.8
67.168.569.871.272.5
73.9
73.9
75.3
75.3
76.6
76.6
78
78
79.3
79.3
80.7
80.7
82.1
82.1
83.4
83.484.8
84.886.1
86.1
87.5
88.8
Speed (rpm)
Load
Torq
ue
(Nm
)
300 400 500 600 700 800 900 1000 1100 12001
2
3
4
5
6
7
8
9
10
11
12
60
65
70
75
80
85
90
Fig. 15 – Global drive efficiency map for topology T2.
3
6
9
12300
600900
1200
0
50
100
150
200
250
Load Torque (Nm)Speed (rpm)
Volt
age
TW
D V
alues
(%
)
Fig. 16 – PMSM phase-to-phase voltage TWD values for topology T1.
3
6
9
12300
600900
1200
0
50
100
150
200
250
Load Torque (Nm)Speed (rpm)
Volt
age
TW
D V
alues
(%
)
Fig. 17 – PMSM phase-to-phase voltage TWD values for topology T2.
0 0.01 0.02 0.03 0.04 0.05 0.06−3
−2
−1
0
1
2
3
Time (s)
PM
SM
Phas
e C
urr
ents
(A
)
0 0.01 0.02 0.03 0.04 0.05 0.06−3
−2
−1
0
1
2
3
Time (s)
PM
SM
Phas
e C
urr
ents
(A
)
ia ib ic
ia ib ic
(b)
(a)
Fig. 18 – Time-domain waveforms of the PMSM phase currents for 600 rpm
and 25% of the motor rated torque: (a) topology T1; (b) topology T2.

in its reference value. Thus, the voltage distortion is kept at
relatively low values, independently of the PMSM operating
conditions.
The voltage distortion also affects the PMSM phase
currents, particularly for low speed and torque values, as
shown in Fig. 18. Therefore, the distortion of the motor phase
currents for topology T1 (Fig. 18a) will be larger than for
topology T2 (Fig. 18b).
An important issue related to the distortion of the PMSM
supplying voltages and currents is their impact on the machine
efficiency and its lifetime. Hysteresis and eddy current losses
are part of the iron losses that are produced in the machine
core due to the alternating magnetic field. Hysteresis losses
are proportional to the frequency while eddy current losses
vary with its square value. Therefore, high frequency voltage
components produce additional losses in the PMSM core,
which in turn, increase the operating temperature of the core
itself and also of the surrounding windings.
As seen before, the application of a non-sinusoidal voltage
to the motor results in harmonic current circulation in its
windings. As a consequence, due to the skin effect, they will
contribute even more to the decrease of the machine
efficiency. These additional power losses also affect
negatively the PMSM temperature, contributing in this way to
the reduction of its lifetime.
Another important issue related to the harmonic distortion
is the noise generation. This aspect is particularly important in
electric/hybrid vehicles applications since it is required to
keep the noise levels to the minimum in order to assure the
passengers comfort. Accordingly, by reducing the PMSM
supplying voltages TWD values with topology T2, it is
possible to decrease the machine generated of noise.
Finally, Fig. 19 presents the PMSM power factor results for
several mechanical speed values and for a load torque
equivalent to 50% of the motor rated value. It is clearly seen
that higher power factor values can be obtained for topology
T2, since the variable voltage control allows to reduce the
voltage rms values and therefore the apparent power.
A. Regenerative Braking Operation
Table IV presents the main drive components efficiency for
topologies T1 and T2, including the global drive efficiency,
for a load level equivalent to 50% of the PMSM rated torque,
under regenerative braking operation.
As expected, comparing both configurations, higher
efficiency values can be obtained for topology T2, especially
for low operating speeds. Under these conditions, it can be
seen that the global drive efficiency can be significantly
improved for the topology T2, despite of the power losses in
the dc-dc converter. In a similar way to the motoring mode
operation, high efficiency values can be obtained for the drive
main devices, and in particular for the inverter. For low
mechanical speeds, the variable voltage control imposes a
lower system voltage in order to maintain the defined
modulation index. As a consequence, the inverter losses,
namely the switching losses, are reduced. This control strategy
also allows to decrease the motor voltage rms values, which
lead to the subsequent decreasing of the machine losses,
especially the iron losses. However, for higher PMSM speed
values, the global efficiency for topology T2 is lower than for
topology T1. Although the inverter and PMSM efficiency
values are higher for topology T2, under these conditions, the
dc-dc converter efficiency is negatively affected, contributing
to the decrease of the drive overall efficiency.
Table V presents the PMSM power factor and phase-to-
phase voltage TWD values for both topologies and for a load
level equivalent to 50% of the machine rated torque. Once
again, it can be verified that with the variable voltage control
applied to topology T2, it is possible to obtain lower distortion
values for the motor voltages, and therefore for its phase
currents, as well as higher power factor values.
B. Drive Cycle Analysis
In order to evaluate the drive dynamic behavior, for both
0.4
0.45
0.5
0.55
0.6
0.65
0.7
0.75
0.8
PM
SM
Pow
er F
acto
r
T1
T2
600 rpm 900 rpm 1200 rpm
Fig. 19 – Power factor results for topologies T1 and T2 for 50% of the PMSM
rated torque under motoring operation.
TABLE IV
EFFICIENCY RESULTS (%), UNDER REGENERATIVE BRAKING OPERATION, FOR
50% OF THE PMSM RATED TORQUE
Topology T1 Topology T2
600
rpm
900
rpm
1200
rpm
600
rpm
900
rpm
1200
rpm
DC-DC
Converter − − − 98.8 97.8 95.7
Inverter 91.1 94.8 96.1 95.9 97.6 97.8
PMSM 81.4 82.9 83.7 82.2 83.6 84.1
Global 74.2 78.7 80.5 77.9 79.8 78.7
TABLE V
TWD AND POWER FACTOR RESULTS, UNDER REGENERATIVE BRAKING
OPERATION, FOR 50% OF THE PMSM RATED TORQUE
Topology T1 Topology T2
600 rpm TWD (%) 186.89 97.93
Power Factor 0.477 0.712
900 rpm TWD (%) 133.21 68.22
Power Factor 0.602 0.820
1200 rpm TWD (%) 75.39 69.75
Power Factor 0.703 0.821

topologies, under motor and regenerative braking modes, a
whole driving cycle analysis is also presented.
Fig. 20 presents the drive cycle used for this purpose. This
profile is similar to ECE 15 urban drive cycle, also integrated
in the first part of the New European Drive Cycle (NEDC)
[33]-[34].
Based on this drive cycle, Fig. 21 presents the time-domain
waveforms of the power drawn from the battery for both
topologies T1 and T2. During the acceleration periods the
power required by the drive system increases proportionally to
the machine speed and reaches larger values than for the
steady-state operation. In steady-state, the PMSM is operating
with a constant mechanical speed and the electromagnetic
torque is less significant. As a consequence, the power drawn
from the battery is constant and relatively low. During the
deceleration periods, a braking torque is developed by the
machine, resulting in a negative power that charges the
battery. Comparing the two considered drive topologies (Fig.
21) it becomes clear that topology T1 requires more battery
output power than topology T2.
Finally, considering the drive energy consumption results
shown in Fig. 22, it can be observed that the energy increases
when the system operates under the motoring mode and
decreases due to the kinetic energy recovery under
regenerative braking. However, the most important conclusion
is that, as expected, topology T2 is the more efficient one for
the considered drive cycle, consuming about 5.62 Wh in
opposition to 5.98 Wh consumed by topology T1. If a drive
cycle corresponding to an extra-urban profile is considered,
the PMSM will operate at higher speeds. Under these
conditions, and taking into account the global drive efficiency
maps presented in Fig. 14 and Fig. 15, the topology T1 will
perform better than topology T2.
VII. CONCLUSIONS
A detailed efficiency analysis of two basic drive train
topologies based on a PMSM and applied to electric/hybrid
vehicles has been presented in this paper. The first topology
comprises a traditional PWM battery-powered inverter, while
in the second one the battery is connected to a bidirectional
dc-dc converter, which supplies the inverter. In addition,
considering this second topology, a variable voltage control
technique applied to the dc-dc converter was presented with
the aim to optimize the global drive performance.
The presented results, in the form of efficiency maps,
provide a very good perspective about the torque/speed
combinations at which a specific propulsion motor drive or
device is most efficient. This allows for better design of these
advanced vehicular systems that make use of electric traction
motors for propulsion, and allow for choosing and optimize
the right kind of technology, in order to improve the system as
a whole.
Regarding the obtained results, it can be concluded that
with the variable voltage control, applied to the second
topology, the inverter efficiency can be significantly
improved, as compared to the first topology. The PMSM
efficiency can also be enhanced, especially for low load
values. As to the global drive efficiency, it is concluded that
for the considered operating conditions, higher efficiency
values can be obtained for the second topology at low speeds
and partial load. However, the inclusion of a dc-dc converter
brings some disadvantages such as increased complexity, cost
and size. Comparing both topologies, it can also be concluded
0 20 40 60 80 100 120 140 160 180 2000
200
400
600
800
1000
Time (s)
PM
SM
Mec
han
ical
Sp
eed
(rp
m)
Fig. 20 – Considered drive cycle.
0 20 40 60 80 100 120 140 160 180 200−300
−200
−100
0
100
200
300
400
500
600
700
Time (s)
Bat
tery
Ou
tpu
t P
ow
er (
W)
T1
T2
Fig. 21 – Time-domain waveforms of the battery output power for topologies
T1 and T2 and for the considered drive cycle.
0 20 40 60 80 100 120 140 160 180 2000
1
2
3
4
5
6
7x 10
−3
Time (s)
Dri
ve
En
erg
y C
on
sum
pti
on
(k
Wh
)
T1
T2
Fig. 22 – Time-domain waveforms of the drive energy consumption for
topologies T1 and T2 and for the considered drive cycle.

that the maximum efficiency value for the first topology is
achieved at high speeds, while for the second one it is reached
at low speeds.
The presented voltage distortion and power factor results
also allow to demonstrate that a better performance can be
obtained for the second topology with the variable voltage
control technique. The obtained distortion results are
particularly important since high acoustic noise levels are
typically associated with high distortion values. Hence, this
topology also allows to reduce the overall acoustic noise
generated by the traction motor.
Finally, considering all this and taking into account that for
an urban driving cycle a traction machine operates most
frequently at light loads and low speeds [5], the electric drive
train system should be designed to operate at maximum
efficiency and minimum acoustic noise in this region.
Therefore, the presented variable voltage control technique,
applied to the second topology, allows to fulfill these
requirements.
APPENDIX
TABLE VI
PARAMETERS OF THE USED PMSM
Power P 2.2 kW
Torque T 12 Nm
Voltage V 316 V
Current I 5.3 A
Number of pole pairs p 5
Armature resistance Rs 1.72 Ω
Iron losses resistance Rc 700 Ω
Magnet flux linkage ÃPM 0.244 Wb
d-axis inductance Ld 20.5 mH
q-axis inductance Lq 20.5 mH
Moment of inertia J 0.007 Kg.m2
REFERENCES
[1] A. Y. Saber and G. K. Venayagamoorthy, “Plug-in vehicles and
renewable energy sources for cost and emission reductions”, IEEE
Transactions on Industrial Electronics, vol. 58, no. 4, pp. 1229-1238,
April 2011.
[2] C. C. Chan, A. Bouscayrol and K. Chen, “Electric, hybrid, and fuel-cell
vehicles: architectures and modeling”, IEEE Transactions on Vehicular
Technology, vol. 59, no. 2, pp. 589-598, February 2010.
[3] K. T. Chau, C. C. Chan and L. Chunhua, “Overview of permanent-
magnet brushless drives for electric and hybrid electric vehicles”, IEEE
Transactions on Industrial Electronics, vol. 55, no. 6, pp. 2246-2257,
June 2008.
[4] M. Zeraoulia, M. E. H. Benbouzid and D. Diallo, “Electric motor drive
selection issues for HEV propulsion systems: a comparative study”,
IEEE Transactions on Vehicular Technology, vol. 55, no. 6, pp. 1756-
1764, November 2006.
[5] Z. Q. Zhu and D. Howe, “Electrical machines and drives for electric,
hybrid, and fuel cell vehicles”, Proceedings of the IEEE, vol. 95, no. 4,
pp. 746-765, April 2007.
[6] K. I. Laskaris and A. G. Kladas, “Internal permanent magnet motor
design for electric vehicle drive”, IEEE Transactions on Industrial
Electronics, vol. 57, no. 1, pp. 138-145, January 2010.
[7] C. Liu, K. T. Chau and J. Z. Jiang, “A permanent-magnet hybrid
brushless integrated starter–generator for hybrid electric vehicles”, IEEE
Transactions on Industrial Electronics, vol. 57, no. 12, pp. 4055-4064,
December 2010.
[8] M. Shen and F. Z. Peng, “Converter systems for hybrid electric
vehicles”, International Conference on Electrical Machines and
Systems, pp. 2004-2010, 8-11 October, 2007.
[9] J. S. Lai and D. J. Nelson, “Energy management power converters in
hybrid electric and fuel cell vehicles”, Proceedings of the IEEE, vol. 95,
no. 4, pp. 766-777, April 2007.
[10] C. C. Chan, “The state of the art of electric, hybrid, and fuel cell
vehicles”, Proceedings of the IEEE, vol. 95, no. 4, pp. 704-718, April
2007.
[11] A. Kawahashi, “A new-generation hybrid electric vehicle and its
supporting power semiconductor devices”, International Symposium on
Power Semiconductor Devices and ICs, pp. 23-29, 24-27 May, 2004.
[12] K. Asano, Y. Inaguma, H. Ohtani, E. Sato, M. Okamura and S. Sasaki,
“High performance motor drive technologies for hybrid vehicles”,
Power Conversion Conference, pp. 1584-1589, 2-5 April, 2007.
[13] E. Sato, “Permanent magnet synchronous motor drives for hybrid
electric vehicles”, IEEJ Transactions on Electrical and Electronic
Engineering, vol. 2, no. 2, pp. 162-168, 2007.
[14] Z. Amjadi and S. S. Williamson, “A novel control technique for a
switched-capacitor-converter-based hybrid electric vehicle energy
storage system”, IEEE Transactions on Industrial Electronics, vol. 57,
no. 3, pp. 926-934, March 2010.
[15] M. B. Camara, H. Gualous, F. Gustin, A. Berthon and B. Dakyo,
“DC/DC converter design for supercapacitor and battery power
management in hybrid vehicle applications − polynomial control
strategy”, IEEE Transactions on Industrial Electronics, vol. 57, no. 2,
pp. 587-597, February 2010.
[16] Z. Amjadi and S. S. Williamson, “Power-electronics-based solutions for
plug-in hybrid electric vehicle energy storage and management
systems”, IEEE Transactions on Industrial Electronics, vol. 57, no. 2,
pp. 608-616, February 2010.
[17] F. H. Khan, L. M. Tolbert and W. E. Webb, “Hybrid electric vehicle
power management solutions based on isolated and nonisolated
configurations of multilevel modular capacitor-clamped converter”,
IEEE Transactions on Industrial Electronics, vol. 56, no. 8, pp. 3079-
3095, August 2009.
[18] A. Emadi, Y. J. Lee and K. Rajashekara, “Power electronics and motor
drives in electric, hybrid electric, and plug-in hybrid electric vehicles”,
IEEE Transactions on Industrial Electronics, vol. 55, no. 6, pp. 2237-
2245, June 2008.
[19] T. Azib, O. Bethoux, G. Remy, C. Marchand and E. Berthelot, “An
innovative control strategy of a single converter for hybrid fuel
cell/supercapacitor power source”, IEEE Transactions on Industrial
Electronics, vol. 57, no. 12, pp. 4024-4031, December 2010.
[20] S. Williamson, M. Lukic and A. Emadi, “Comprehensive drive train
efficiency analysis of hybrid electric and fuel cell vehicles based on
motor-controller efficiency modeling”, IEEE Transactions on Power
Electronics, vol. 21, no. 3, pp. 730-740, May 2006.
[21] A. S. Samosir and A. H. M. Yatim, “Implementation of dynamic
evolution control of bidirectional DC–DC converter for interfacing
ultracapacitor energy storage to fuel-cell system”, IEEE Transactions on
Industrial Electronics, vol. 57, no. 10, pp. 3468-3473, October 2010.
[22] M. Zandi, A. Payman, J.-P. Martin, S. Pierfederici, B. Davat and F. M.
Tabar, “Energy management of a fuel cell/supercapacitor/battery power
source for electric vehicular applications”, IEEE Transactions on
Vehicular Technology, vol. 60, no. 2, pp. 433-443, February 2011.
[23] J. Bauman and M. Kazerani, “A novel capacitor-switched regenerative
snubber for DC/DC boost converters”, IEEE Transactions on Industrial
Electronics, vol. 58, no. 2, pp. 514-523, February 2011.
[24] J. O. Estima and A. J. M. Cardoso, “Performance analysis of a PMSM
drive for hybrid electric vehicles”, International Conference on
Electrical Machines, 6 pp., 6-8 September 2010.
[25] S. Morimoto, Y. Tong, Y. Takeda and T. Hirasa, “Loss minimization
control of permanent magnet synchronous motor drives”, IEEE
Transactions on Industrial Electronics, vol. 41, no. 5, pp. 511-517,
October, 1994.
[26] N. Urasaki, T. Senjyu and K. Uezato, “A novel calculation method for
iron loss resistance suitable in modeling permanent-magnet synchronous
motors”, IEEE Transactions on Energy Conversion, vol. 18, no. 1, pp.
41- 47, March 2003.

[27] Y. K. Chin and J. Soulard, “Modeling of iron losses in permanent
magnet synchronous motors with field weakening capability for electric
vehicles”, International Journal of Automotive Technology, vol. 4, no. 2,
pp. 87-94, March, 2003.
[28] N. Urasaki, T. Senjyu and K. Uezato, “Relationship of parallel model
and series model for permanent magnet synchronous motors taking iron
loss into account”, IEEE Transaction on Energy Conversion, vol. 19, no.
2, pp. 265-270, June, 2004.
[29] J. O. Estima and A. J. M. Cardoso, “Performance evaluation of DTC-
SVM permanent magnet synchronous motor drives under inverter fault
conditions", IEEE Industrial Electronics Conference, Porto, Portugal,
pp. 1228-1233, 3-5 November, 2009.
[30] S. Bolognani, L. Peretti, M. Zigliotto and E. Bertotto, “Commissioning
of electromechanical conversion models for high dynamic PMSM
drives”, IEEE Transactions on Industrial Electronics, vol. 57, no. 3, pp.
986-993, March 2010.
[31] O. Tremblay, L.-A. Dessaint and A.-I. Dekkiche, “A generic battery
model for the dynamic simulation of hybrid electric vehicles”, IEEE
Vehicle Power and Propulsion Conference, pp. 284-289, 9-12
September 2007.
[32] J. Holtz, “Pulsewidth modulation − a survey”, IEEE Transactions on
Industrial Electronics, vol. 39, no. 5, pp. 410-420, October 1992.
[33] P. H. Nguyen, E. Hoang, M. Gabsi, L. Kobylanski and D. Condamin,
“Permanent magnet synchronous machines: performances during driving
cycles for a hybrid electric vehicle application”, IEEE International
Symposium on Industrial Electronics, pp. 1432-1438, 4-7 July 2010.
[34] A. Froberg and L. Nielsen, “Efficient drive cycle simulation”, IEEE
Transactions on Vehicular Technology, vol. 57, no. 3, pp. 1442-1453,
May 2008.
Jorge O. Estima was born in Aveiro, Portugal in
1984. He received the E. E. diploma from University
of Coimbra, Portugal, in 2007. Since then, he has
been a PhD student at the Department of Electrical
and Computer Engineering of the Faculty of Sciences
and Technology of the University of Coimbra,
Portugal. His research interests are focused on
condition monitoring and diagnostics of power
electronics and AC motor drives, fault-tolerant
variable speed AC drives, traction motor drives
applied to electric/hybrid vehicles and wind energy conversion systems.
Antonio J. Marques Cardoso (S’89, A’95, SM’99)
was born in Coimbra, Portugal, in 1962. He received
the Electrical Engineering diploma, the Dr. Eng.
degree and the Habilitation degree, all from the
University of Coimbra, Coimbra, Portugal, in 1985,
1995 and 2008, respectively. From 1985 until 2011
he was with the University of Coimbra, Coimbra,
Portugal, where he was Director of the Electrical
Machines Laboratory. Since 2011, he has been with
the University of Beira Interior (UBI), Covilhã,
Portugal, where he is a Full Professor at the Department of Electromechanical
Engineering. His teaching interests cover electrical rotating machines,
transformers, and maintenance of electromechatronic systems and his research
interests are focused on condition monitoring and diagnostics of electrical
machines and drives. He is the author of a book entitled Fault Diagnosis in
Three-Phase Induction Motors (Coimbra, Portugal: Coimbra Editora, 1991),
(in Portuguese) and about 300 papers published in technical journals and
conference proceedings.