ELECTRIC VEHICLES MARKET INTELLIGENCE REPORT
96
1 ELECTRIC VEHICLES: MIR 2021 ELECTRIC VEHICLES MARKET INTELLIGENCE REPORT 2021
-
Upload
khangminh22 -
Category
Documents
-
view
0 -
download
0
Transcript of ELECTRIC VEHICLES MARKET INTELLIGENCE REPORT
1E
LE
CT
RIC
VE
HIC
LE
S: M
IR 2
02
1
ELECTRIC VEHICLES MARKET INTELLIGENCE REPORT
20
21


IE
LE
CT
RIC
VE
HIC
LE
S: M
IR 2
02
1
GreenCape
GreenCape is a non-profit organisation that works at the interface of business, government
and academia to identify and remove barriers to economically viable green economy
infrastructure solutions. Working in developing countries, GreenCape catalyses the replication
and large-scale uptake of these solutions to enable each country and its citizens to prosper.
Acknowledgements
This market intelligence report was produced in partnership with the Western Cape Government
Department of Economic Development and Tourism. We thank Wilberforce Chege and Jack Radmore
for the time and effort that they have put into compiling this market intelligence report.
Disclaimer
While every attempt has been made to ensure that the information published
in this report is accurate, no responsibility is accepted for any loss or damage
to any person or entity relying on any of the information contained in this report.
Copyright © GreenCape 2021
Cover image courtesy of Unsplash.com.
This document may be downloaded at no charge from www.greencape.co.za.
All rights reserved.
Subscribe to receive e-mail alerts or GreenCape news, events,
and publications by registering as a member on our website: www.greencape.co.za
42 Hans Strijdom Ave, Foreshore, Cape Town, 8001
Author: Wilberforce W. Chege
Editorial and review: Jack Radmore, Cilnette Pienaar,
Lauren Basson, and Nicholas Fordyce
Images: GreenCape, Jaguar South Africa, BMW South Africa,
uYilo, Green Scooter, Hiten Parmer, Pxhere, City of Cape Town
and Global District Watch
Layout and design: Tamlin Lockhart
03
EL
EC
TR
IC
VE
HIC
LE
S: M
IR
20
21
II
431
0 2
South African industry overview 19
3.1. South African automotive market supply 21
3.2. The impact of COVID-19 23
3.3. South African automotive market demand 24
3.3.1. Commuter behaviour and travel patterns 24
3.4. An overview of the development of SA’s EV industry 27
3.5. The South African EV value chain 32
3.6. Potential impacts of EV market growth on the ICE
value chain and economy 35
3.6.1. The effect of EVs on oil imports, the balance of
trade and Government revenue 36
3.7. Market sizing and dynamics 37
3.7.1. The EV passenger vehicle market 37
3.7.2. The public and industrial EV market 40
3.7.3. Charging infrastructure and network 40
3.8. Market drivers: EV and charging infrastructure 47
3.8.1. Macroeconomic drivers 47
3.8.2. Local demand drivers 48
3.9. Market barriers 52
3.9.1. Products that are not fit for the South African
market 52
3.9.2. High import duties 53
3.9.3. Lack of policy certainty and support for EVs 53
3.9.4. Lack of local skills throughout the value chain
to facilitate market growth 54
Executive summary 1
What’s new? 5
Policy and regulation 55
4.1. Automotive Production and Development Programme
(APDP) (2013-2020) 57
4.2. The South African Automotive Masterplan (SAAM) 2021 – 2035 57
4.3. Green Transport Strategy (GTS) for South Africa: (2018 – 2050) 58
4.4. Preferential Procurement Policy Framework Act (PPPFA) of 2000 59
4.5. The National Climate Change Response Policy (NCCRP) (2011) 59
4.6. The 2019 Integrated Resource Plan (IRP 2019) 59
4.7. The Carbon Tax Act 15 of 2019 60
Global industry overview 13
Introduction and purpose 7
CONTENTS
GreenCape’s support to
businesses and investors 79
Market opportunities 61
5.1. Local manufacturing and electrification of public transport 63
5.2. Lithium-ion batteries (LIB) production 64
5.3. Passenger vehicle manufacturing 68
5.4. EV use in construction, retail, and in underground mining 69
Funding and incentives 71
6.1. General database web page 73
6.1.1. Green Finance Database 73
6.1.2. Government funding and incentives database 73
6.1.3. Finfind database 74
6.1.4. AlliedCrowds database 74
References 81
The Western Cape: Africa’s growing
greentech hub 75
6 875 9
03
EL
EC
TR
IC
VE
HIC
LE
S: M
IR
20
21
IV
Figure 1: Global EV sales in recent years 8
Figure 2: Leading countries with the highest proportion of EVs in new passenger car sales 9
Figure 3: South Africa’s Total final consumption (TFC) of Energy by sector, 1990-2018 10
Figure 4: Leading EV markets globally 15
Figure 5: Forecast of global EV sales 17
Figure 6: Manufacturing hubs in South Africa 22
Figure 7: Commuter travel patterns indicated by the number of annual travel trips by trip type 25
Figure 8: Modal split of work travel in South Africa by province 26
Figure 9: EV value chain in SA 33
Figure 10: Illustration of gains and losses in the ICE value chain due to EV uptake 35
Figure 11: Petrol and diesel consumption from 2007 to 2018 36
Figure 12: Fuel levy collected in South Africa between 2008 and 2020 37
Figure 13: ICE and EV Passenger car sales in South Africa since 2010 39
Figure 14: Active and incoming charging infrastructure stations in SA 41
Figure 15: Projected uptake of EVs in Cape Town 41
Figure 16: Projected increase in energy consumption in Cape Town 42
Figure 17: Proportion of ICE light vehicles exported and imported over the last decade 47
Figure 18: Year-on-year fuel prices in South Africa 49
Figure 19: LIB price/kWh over time 50
Figure 20: Graphite price over time 50
Figure 21: How much respondents were willing to spend in purchasing an EV 52
Figure 22: EV global market share forecast 63
Figure 23: Reserves of EV minerals in the Southern Africa region 66
Figure 24: LIB manufacturing value chain 67
Figure 25: Passenger EV sales in South Africa since 2010 69
LIST OF FIGURES
VE
LE
CT
RIC
VE
HIC
LE
S: M
IR 2
02
1
LIST OF TABLES
Table 1: Overview of the market opportunities, drivers, and barriers within the EV Market 3
Table 2: Key market segment definitions and vehicle types 11
Table 3: Private transport representation in SA 21
Table 4: South Africa’s market share of global vehicle production 23
Table 5: Vehicle Production Market share of the top OEMs in South Africa 23
Table 6: The impact of COVID-19 on South Africa’s vehicle production, exports, sales, and imports 24
Table 7: The history of the EV market development in South Africa: 1970s to 2020 28
Table 8: Recent EV developments and near-future plans by EV sector role players in South Africa 29-32
Table 9: Benefits and drawbacks to South Africa of EV market growth and fewer oil imports 37
Table 10: Overview of South Africa’s conventional ICE vehicle market: September 2020 38
Table 11: OEMs, industry, and distributors’ DC charging technology 45
Table 12: ICE restriction status for South Africa’s top vehicle export markets 48
Table 13: Import taxes and total cost of importing a Tesla Model X Performance All-Wheel Drive from the UK to South Africa (My Broadband, 2021) 54
Table 14: Availability of raw materials in the sub-Saharan region for lithium-ion battery production 65
Table 15: Live heavy vehicle load population in South Africa: September 2020 70
03
EL
EC
TR
IC
VE
HIC
LE
S: M
IR
20
21
VI
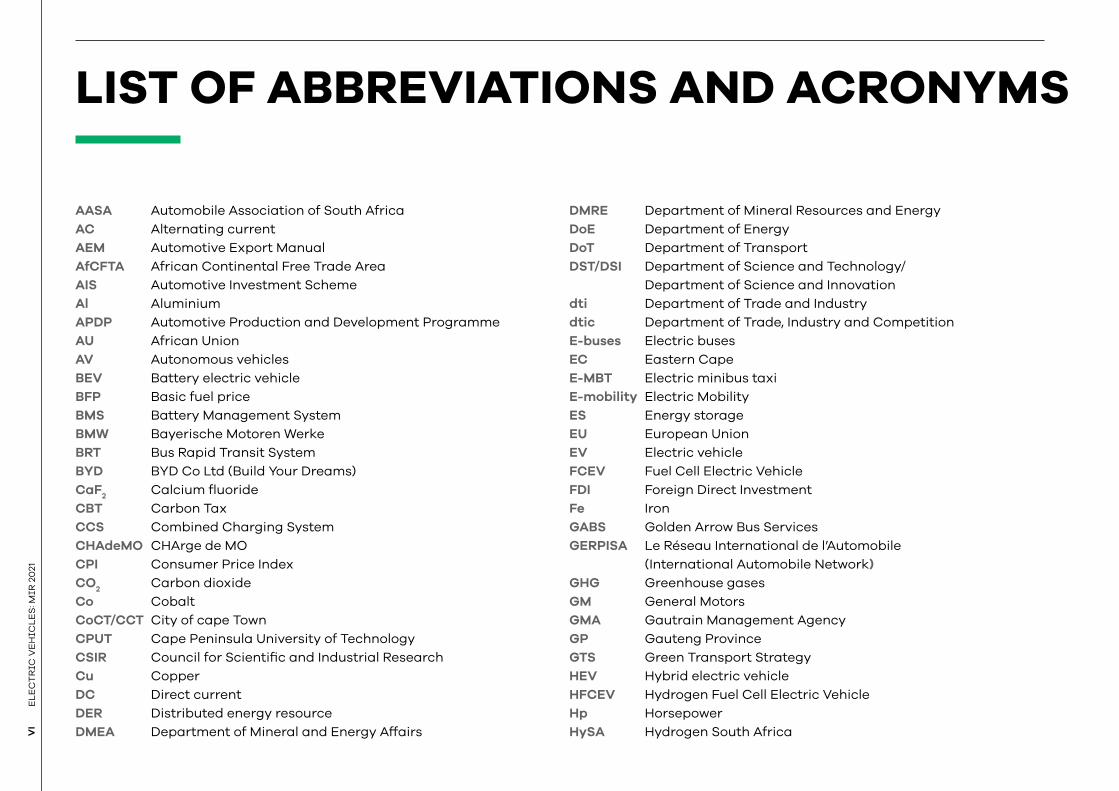
LIST OF ABBREVIATIONS AND ACRONYMS
AASA Automobile Association of South Africa
AC Alternating current
AEM Automotive Export Manual
AfCFTA African Continental Free Trade Area
AIS Automotive Investment Scheme
Al Aluminium
APDP Automotive Production and Development Programme
AU African Union
AV Autonomous vehicles
BEV Battery electric vehicle
BFP Basic fuel price
BMS Battery Management System
BMW Bayerische Motoren Werke
BRT Bus Rapid Transit System
BYD BYD Co Ltd (Build Your Dreams)
CaF2 Calcium fluoride
CBT Carbon Tax
CCS Combined Charging System
CHAdeMO CHArge de MO
CPI Consumer Price Index
CO2 Carbon dioxide
Co Cobalt
CoCT/CCT City of cape Town
CPUT Cape Peninsula University of Technology
CSIR Council for Scientific and Industrial Research
Cu Copper
DC Direct current
DER Distributed energy resource
DMEA Department of Mineral and Energy Affairs
DMRE Department of Mineral Resources and Energy
DoE Department of Energy
DoT Department of Transport
DST/DSI Department of Science and Technology/
Department of Science and Innovation
dti Department of Trade and Industry
dtic Department of Trade, Industry and Competition
E-buses Electric buses
EC Eastern Cape
E-MBT Electric minibus taxi
E-mobility Electric Mobility
ES Energy storage
EU European Union
EV Electric vehicle
FCEV Fuel Cell Electric Vehicle
FDI Foreign Direct Investment
Fe Iron
GABS Golden Arrow Bus Services
GERPISA Le Réseau International de l’Automobile
(International Automobile Network)
GHG Greenhouse gases
GM General Motors
GMA Gautrain Management Agency
GP Gauteng Province
GTS Green Transport Strategy
HEV Hybrid electric vehicle
HFCEV Hydrogen Fuel Cell Electric Vehicle
Hp Horsepower
HySA Hydrogen South Africa
VII
EL
EC
TR
IC V
EH
ICL
ES
: MIR
20
21
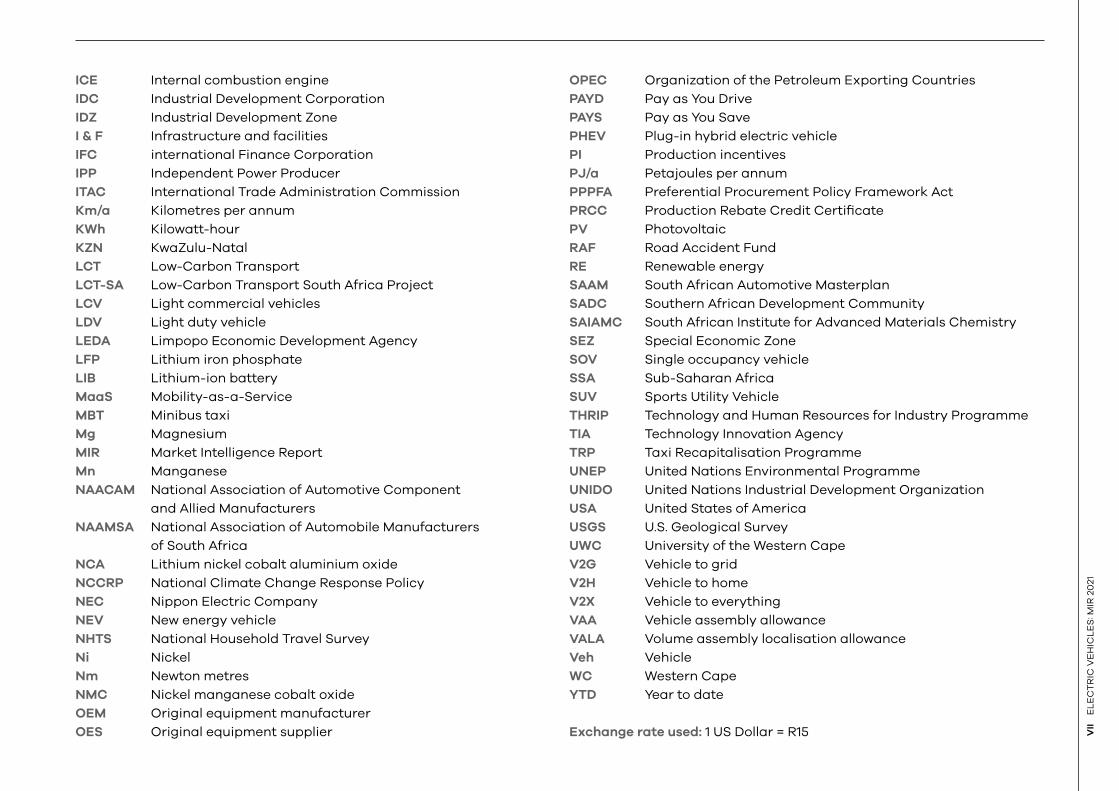
ICE Internal combustion engine
IDC Industrial Development Corporation
IDZ Industrial Development Zone
I & F Infrastructure and facilities
IFC international Finance Corporation
IPP Independent Power Producer
ITAC International Trade Administration Commission
Km/a Kilometres per annum
KWh Kilowatt-hour
KZN KwaZulu-Natal
LCT Low-Carbon Transport
LCT-SA Low-Carbon Transport South Africa Project
LCV Light commercial vehicles
LDV Light duty vehicle
LEDA Limpopo Economic Development Agency
LFP Lithium iron phosphate
LIB Lithium-ion battery
MaaS Mobility-as-a-Service
MBT Minibus taxi
Mg Magnesium
MIR Market Intelligence Report
Mn Manganese
NAACAM National Association of Automotive Component
and Allied Manufacturers
NAAMSA National Association of Automobile Manufacturers
of South Africa
NCA Lithium nickel cobalt aluminium oxide
NCCRP National Climate Change Response Policy
NEC Nippon Electric Company
NEV New energy vehicle
NHTS National Household Travel Survey
Ni Nickel
Nm Newton metres
NMC Nickel manganese cobalt oxide
OEM Original equipment manufacturer
OES Original equipment supplier
OPEC Organization of the Petroleum Exporting Countries
PAYD Pay as You Drive
PAYS Pay as You Save
PHEV Plug-in hybrid electric vehicle
PI Production incentives
PJ/a Petajoules per annum
PPPFA Preferential Procurement Policy Framework Act
PRCC Production Rebate Credit Certificate
PV Photovoltaic
RAF Road Accident Fund
RE Renewable energy
SAAM South African Automotive Masterplan
SADC Southern African Development Community
SAIAMC South African Institute for Advanced Materials Chemistry
SEZ Special Economic Zone
SOV Single occupancy vehicle
SSA Sub-Saharan Africa
SUV Sports Utility Vehicle
THRIP Technology and Human Resources for Industry Programme
TIA Technology Innovation Agency
TRP Taxi Recapitalisation Programme
UNEP United Nations Environmental Programme
UNIDO United Nations Industrial Development Organization
USA United States of America
USGS U.S. Geological Survey
UWC University of the Western Cape
V2G Vehicle to grid
V2H Vehicle to home
V2X Vehicle to everything
VAA Vehicle assembly allowance
VALA Volume assembly localisation allowance
Veh Vehicle
WC Western Cape
YTD Year to date
Exchange rate used: 1 US Dollar = R15
03
1E
LE
CT
RIC
VE
HIC
LE
S: M
IR 2
02
1
Globally, the momentum for
electric mobility has increased
exponentially as evidenced by the
number of sales over the period
2013 to 2020. This global shift has
been primarily driven by national
emission reduction commitments
stemming from the Paris
Agreement on climate change,
growing urban air pollution
concerns, and continued crude oil
price volatility. In 2019 a year-on-
year decrease in Electric Vehicle
(EV) sales figures was seen for the
first time after China halved its
subsidies for new energy vehicles
(NEVs), including EVs. Many
countries across the world have
now shifted their policies towards
accelerating EV uptake — also
as part of their Covid-19 recovery
strategies — which is likely to drive
up the global demand for EVs.
South Africa (SA) does not yet
have policies, subsidies, or
incentives in place to accelerate
the development of the EV market.
SA has thus not yet joined
the ranks of those countries
experiencing a steep rise in EV
uptake and the development of the
ecosystem and value chain around
EVs. However, this is likely to
change as lithium-ion battery (LIB)
prices continue to fall. Decreasing
battery prices drive EV prices
down. It is expected that once the
price of EVs becomes competitive
in South Africa, the same rise in
uptake in the consumer market will
be experienced.
South Africa already has a strong
market for the assembly of internal
combustion engine (ICE) vehicles.
The automotive sector is a key
player in the country’s economic
landscape, contributing 6.4% of
GDP and 27.6% of manufacturing
output. Total revenue from this
sector was more than R500 billion
(US$35.6 billion) in 2019, with the
industry employing up to 900 000
people directly and indirectly —
including downstream in wholesale,
retail trade, and maintenance.
EXECUTIVE
SUMMARY
This market intelligence report is written for investors, original equipment manufacturers (OEMs), equipment
suppliers, project developers, and technical advisers. It highlights current investment opportunities in the
electric vehicles market in South Africa.
2E
LE
CT
RIC
VE
HIC
LE
S: M
IR 2
02
1
South Africa is considered a
second-tier market, having
produced more than 600 000 ICE
vehicles, predominantly for the
export market. SA is, therefore, a
net exporter of vehicles.
When the COVID-19 case rate
increased in South Africa, the
national government implemented
national restrictions (lockdown
regulations) to reduce the spread
of the virus. This included the
limiting of active business activity,
also affecting the automotive
industry. The lockdown, coupled
with reduced international trade,
saw the South African gross
domestic product (GDP) shrink
by 51% in quarter two of 2020. By
November 2020, the total domestic
production by the automotive
sector had decreased by 32%.
Total vehicle exports from
South Africa by the end of
November 2020 had decreased
by 33% (NAAMSA, 2020). For SA,
a thriving EV market supported
by local manufacturing holds the
promise of sustainable economic
development, job creation, and
advance in the development of the
local green economy.
A thriving EV market in SA will
also result in increased economic
resilience to some of the economic
impacts of climate change
mitigation measures through,
for example, counteracting
the economic impact of the
inevitable decline in demand
for ICE vehicles globally.
There are substantial
environmental, economic, and
social opportunities for South
Africa in the transition to a
low-carbon trajectory, enabled
by a green energy transition.
Consequently, there are several
emerging opportunities in SA’s
nascent EV market:
• Local manufacturing and
electrification of public
transport: Public transport
presents the best business
case for electrification. This
is especially true for the bus
market that already produces
buses largely for the domestic
market. Buses are designated in
SA and are subject to ~80% local
content requirements by the
Department of Trade, Industry
and Competition (dtic) for
public procurement.
The assembly of buses
further enjoys the benefit of
duty-free importation of all
driveline components. While
this is a flat market in SA,
there is scope to revitalise this
space. Incorporating e-bus
manufacturing for public
transportation is a more
economically viable way of
achieving this revitalisation than
private vehicles, because as
per the last National Household
Travel Survey (NHTS, 2013), over
80% of South Africans use public
transportation as their primary
means of mobility.
• Local lithium-ion battery
(LIB) production: South Africa
is an attractive assembly and
possibly future manufacturing
destination for lithium-ion
batteries because of its existing
battery assembly and recycling
industry. This is coupled with
SA’s mining sector’s ability
to provide some of the raw
materials required for the
nickel-manganese-cobalt-oxide
cathode battery chemistry,
especially manganese. SA
holds about 78% of the
world’s manganese.
Also, other raw materials
required in the cathode are
mined in Sub-Saharan Africa.
The logistical advantages of
closer geographical proximity
coupled with improved regional
free trade policies, such as the
African Continental Free Trade
Area (AfCFTA) and the African
Union (AU) Agenda 63, could
provide a range of advantages
in accessing and utilising these
raw materials.
• Local passenger vehicle
manufacturing: There is
a medium- to long-term
opportunity building on South
Africa’s existing significant
automotive manufacturing
capability to develop a
manufacturing hub for electric
passenger vehicles for the
export market. Manufacturing
for the domestic market is a
longer-term opportunity as local
demand increases and a more
supportive policy environment
is developed.
03
3E
LE
CT
RIC
VE
HIC
LE
S: M
IR 2
02
1
EV use in construction, retail, and
in underground mining: There is a
medium- to long-term opportunity
for battery-powered EVs and
machinery in underground and
opencast mining in South Africa,
where mining is a key sector of the
economy. This is because one of the
highest costs for mining operations
is getting air underground, and
temperature regulation.
Electric mining equipment
produces no fine particular
matter (PM2.5) from diesel and
other tailpipe emissions, thereby
necessitating fewer ventilation
requirements, and therefore
lower costs, and safeguarding
health for miners. Additionally,
EV mining equipment produces
less heat because of the higher
efficiency of the conversion from
electric energy compared to diesel.
This saves on ventilation and heat
regulation underground.
The electric mining equipment also
produces less noise and vibration,
and requires less maintenance —
further saving on mining costs and
operational expenditure.
Since EVs produce no tailpipe
emissions, they are increasingly
being touted as a remedy for use
in underground mining.
Additionally, the demand for
lithium-ion-powered forklifts
is increasing locally, owing to
companies wanting to reap the
benefits of energy efficiency,
reduced air pollution for public
health benefits, and cost-
effectiveness, as well as to
prepare for changing legislation
regarding emissions, such as the
recently enacted Carbon Tax Act
15 of 2019 (SARS, 2020).
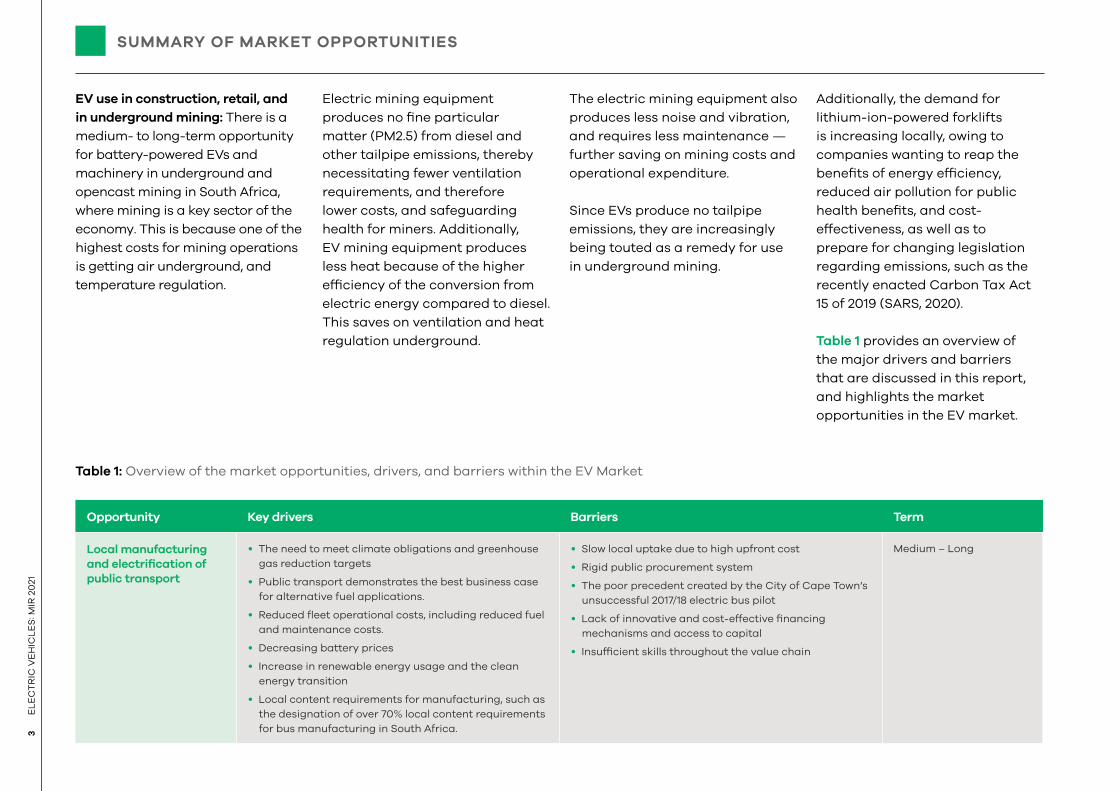
Table 1 provides an overview of
the major drivers and barriers
that are discussed in this report,
and highlights the market
opportunities in the EV market.
Table 1: Overview of the market opportunities, drivers, and barriers within the EV Market
Opportunity Key drivers Barriers Term
Local manufacturing
and electrification of
public transport
• The need to meet climate obligations and greenhouse
gas reduction targets
• Public transport demonstrates the best business case
for alternative fuel applications.
• Reduced fleet operational costs, including reduced fuel
and maintenance costs.
• Decreasing battery prices
• Increase in renewable energy usage and the clean
energy transition
• Local content requirements for manufacturing, such as
the designation of over 70% local content requirements
for bus manufacturing in South Africa.
• Slow local uptake due to high upfront cost
• Rigid public procurement system
• The poor precedent created by the City of Cape Town’s
unsuccessful 2017/18 electric bus pilot
• Lack of innovative and cost-effective financing
mechanisms and access to capital
• Insufficient skills throughout the value chain
Medium – Long
SUMMARY OF MARKET OPPORTUNITIES
4E
LE
CT
RIC
VE
HIC
LE
S: M
IR 2
02
1
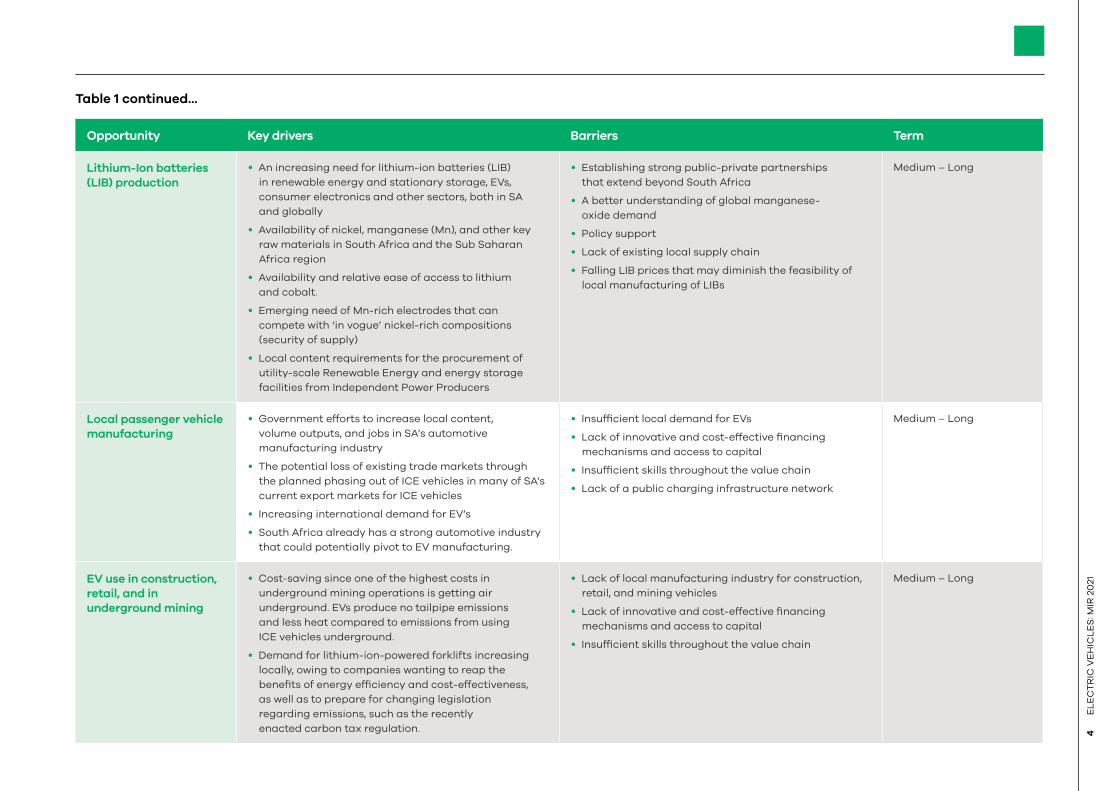
Opportunity Key drivers Barriers Term
Lithium-Ion batteries
(LIB) production
• An increasing need for lithium-ion batteries (LIB)
in renewable energy and stationary storage, EVs,
consumer electronics and other sectors, both in SA
and globally
• Availability of nickel, manganese (Mn), and other key
raw materials in South Africa and the Sub Saharan
Africa region
• Availability and relative ease of access to lithium
and cobalt.
• Emerging need of Mn-rich electrodes that can
compete with ‘in vogue’ nickel-rich compositions
(security of supply)
• Local content requirements for the procurement of
utility-scale Renewable Energy and energy storage
facilities from Independent Power Producers
• Establishing strong public-private partnerships
that extend beyond South Africa
• A better understanding of global manganese-
oxide demand
• Policy support
• Lack of existing local supply chain
• Falling LIB prices that may diminish the feasibility of
local manufacturing of LIBs
Medium – Long
Local passenger vehicle
manufacturing
• Government efforts to increase local content,
volume outputs, and jobs in SA’s automotive
manufacturing industry
• The potential loss of existing trade markets through
the planned phasing out of ICE vehicles in many of SA’s
current export markets for ICE vehicles
• Increasing international demand for EV’s
• South Africa already has a strong automotive industry
that could potentially pivot to EV manufacturing.
• Insufficient local demand for EVs
• Lack of innovative and cost-effective financing
mechanisms and access to capital
• Insufficient skills throughout the value chain
• Lack of a public charging infrastructure network
Medium – Long
EV use in construction,
retail, and in
underground mining
• Cost-saving since one of the highest costs in
underground mining operations is getting air
underground. EVs produce no tailpipe emissions
and less heat compared to emissions from using
ICE vehicles underground.
• Demand for lithium-ion-powered forklifts increasing
locally, owing to companies wanting to reap the
benefits of energy efficiency and cost-effectiveness,
as well as to prepare for changing legislation
regarding emissions, such as the recently
enacted carbon tax regulation.
• Lack of local manufacturing industry for construction,
retail, and mining vehicles
• Lack of innovative and cost-effective financing
mechanisms and access to capital
• Insufficient skills throughout the value chain
Medium – Long
Table 1 continued...
03
5E
LE
CT
RIC
VE
HIC
LE
S: M
IR 2
02
1
WHAT’S
NEW?
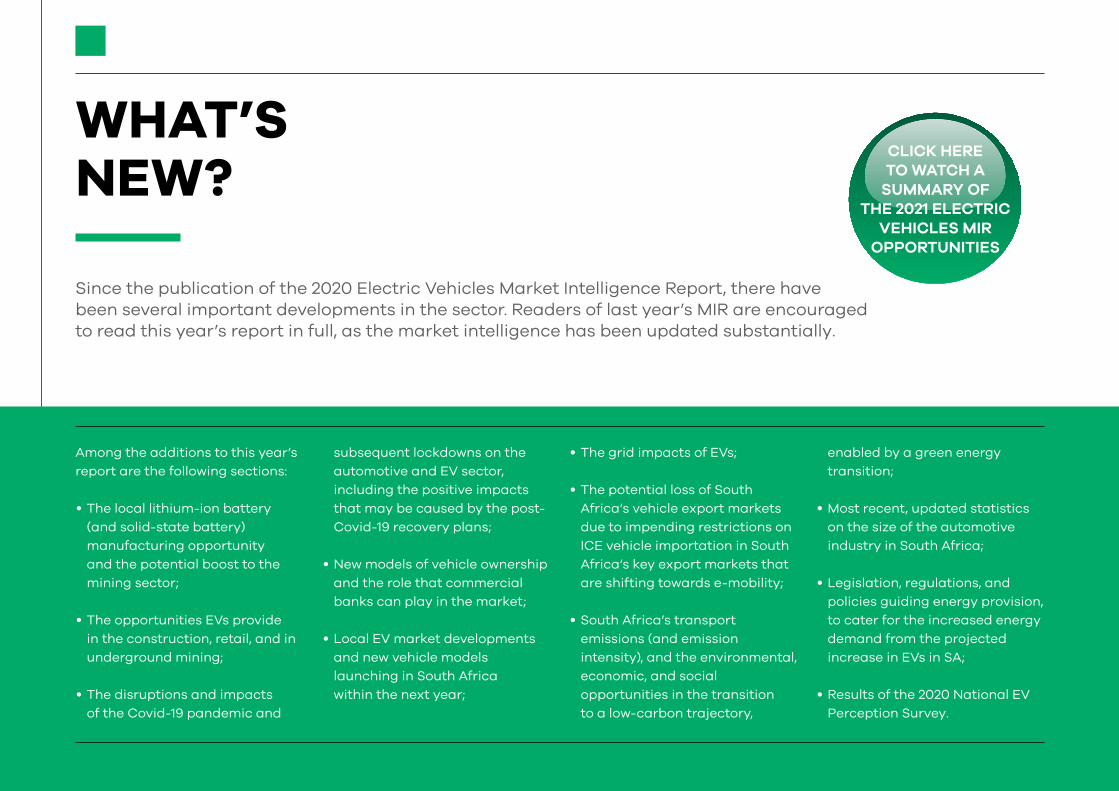
Since the publication of the 2020 Electric Vehicles Market Intelligence Report, there have
been several important developments in the sector. Readers of last year’s MIR are encouraged
to read this year’s report in full, as the market intelligence has been updated substantially.
Among the additions to this year’s
report are the following sections:
• The local lithium-ion battery
(and solid-state battery)
manufacturing opportunity
and the potential boost to the
mining sector;
• The opportunities EVs provide
in the construction, retail, and in
underground mining;
• The disruptions and impacts
of the Covid-19 pandemic and
subsequent lockdowns on the
automotive and EV sector,
including the positive impacts
that may be caused by the post-
Covid-19 recovery plans;
• New models of vehicle ownership
and the role that commercial
banks can play in the market;
• Local EV market developments
and new vehicle models
launching in South Africa
within the next year;
• The grid impacts of EVs;
• The potential loss of South
Africa’s vehicle export markets
due to impending restrictions on
ICE vehicle importation in South
Africa’s key export markets that
are shifting towards e-mobility;
• South Africa’s transport
emissions (and emission
intensity), and the environmental,
economic, and social
opportunities in the transition
to a low-carbon trajectory,
enabled by a green energy
transition;
• Most recent, updated statistics
on the size of the automotive
industry in South Africa;
• Legislation, regulations, and
policies guiding energy provision,
to cater for the increased energy
demand from the projected
increase in EVs in SA;
• Results of the 2020 National EV
Perception Survey.
CLICK HERE
TO WATCH A
SUMMARY OF
THE 2021 ELECTRIC
VEHICLES MIR
OPPORTUNITIES
6E
LE
CT
RIC
VE
HIC
LE
S: M
IR 2
02
1
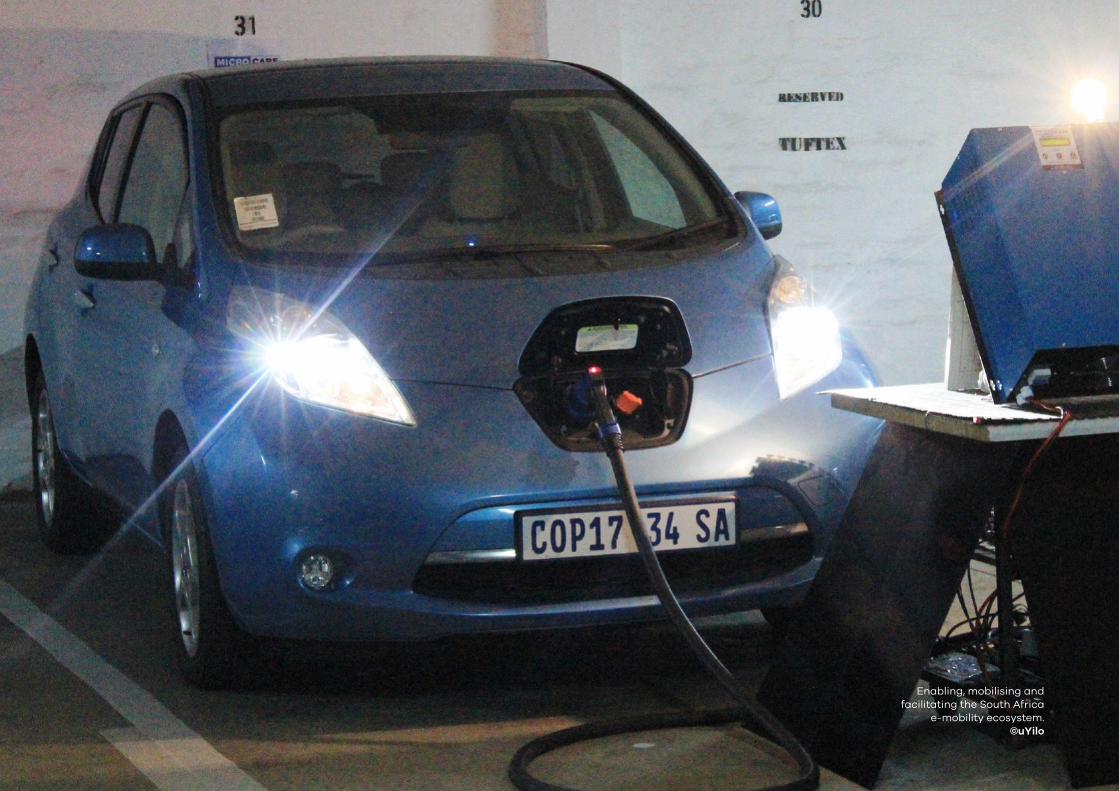
Enabling, mobilising and
facilitating the South Africa
e-mobility ecosystem.
©uYilo

03
EL
EC
TR
IC
VE
HIC
LE
S: M
IR
20
21
7
This market intelligence report is written for investors, OEMs,
equipment suppliers, project developers, and technical advisers. It highlights
investment opportunities in the EV market in South Africa.
INTRODUCTION
AND PURPOSE
8E
LE
CT
RIC
VE
HIC
LE
S: M
IR 2
02
1
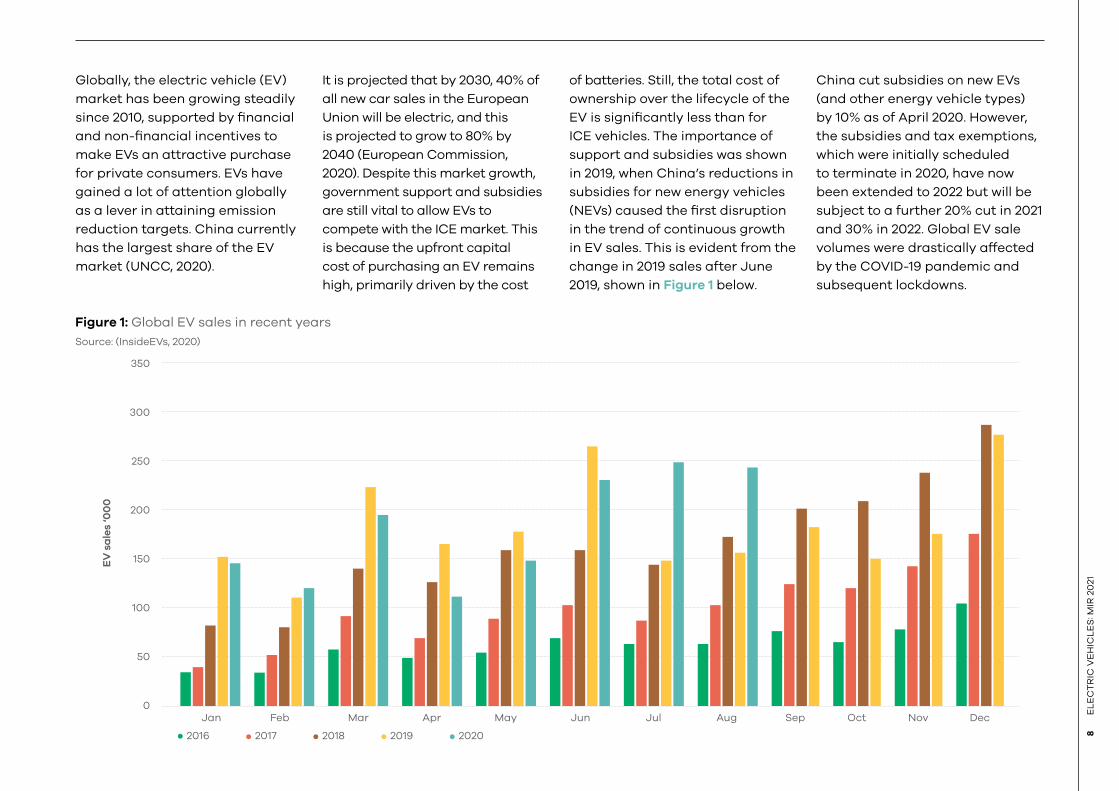
Globally, the electric vehicle (EV)
market has been growing steadily
since 2010, supported by financial
and non-financial incentives to
make EVs an attractive purchase
for private consumers. EVs have
gained a lot of attention globally
as a lever in attaining emission
reduction targets. China currently
has the largest share of the EV
market (UNCC, 2020).
It is projected that by 2030, 40% of
all new car sales in the European
Union will be electric, and this
is projected to grow to 80% by
2040 (European Commission,
2020). Despite this market growth,
government support and subsidies
are still vital to allow EVs to
compete with the ICE market. This
is because the upfront capital
cost of purchasing an EV remains
high, primarily driven by the cost
of batteries. Still, the total cost of
ownership over the lifecycle of the
EV is significantly less than for
ICE vehicles. The importance of
support and subsidies was shown
in 2019, when China’s reductions in
subsidies for new energy vehicles
(NEVs) caused the first disruption
in the trend of continuous growth
in EV sales. This is evident from the
change in 2019 sales after June
2019, shown in Figure 1 below.
China cut subsidies on new EVs
(and other energy vehicle types)
by 10% as of April 2020. However,
the subsidies and tax exemptions,
which were initially scheduled
to terminate in 2020, have now
been extended to 2022 but will be
subject to a further 20% cut in 2021
and 30% in 2022. Global EV sale
volumes were drastically affected
by the COVID-19 pandemic and
subsequent lockdowns.
Figure 1: Global EV sales in recent years
Source: (InsideEVs, 2020)
EV
sa
les
‘00
0
350
250
300
200
150
100
50
0Jan Feb Mar Apr May Jun Jul Aug Sep Oct Nov Dec
2016 2017 2018 2019 2020
03
9E
LE
CT
RIC
VE
HIC
LE
S: M
IR 2
02
1
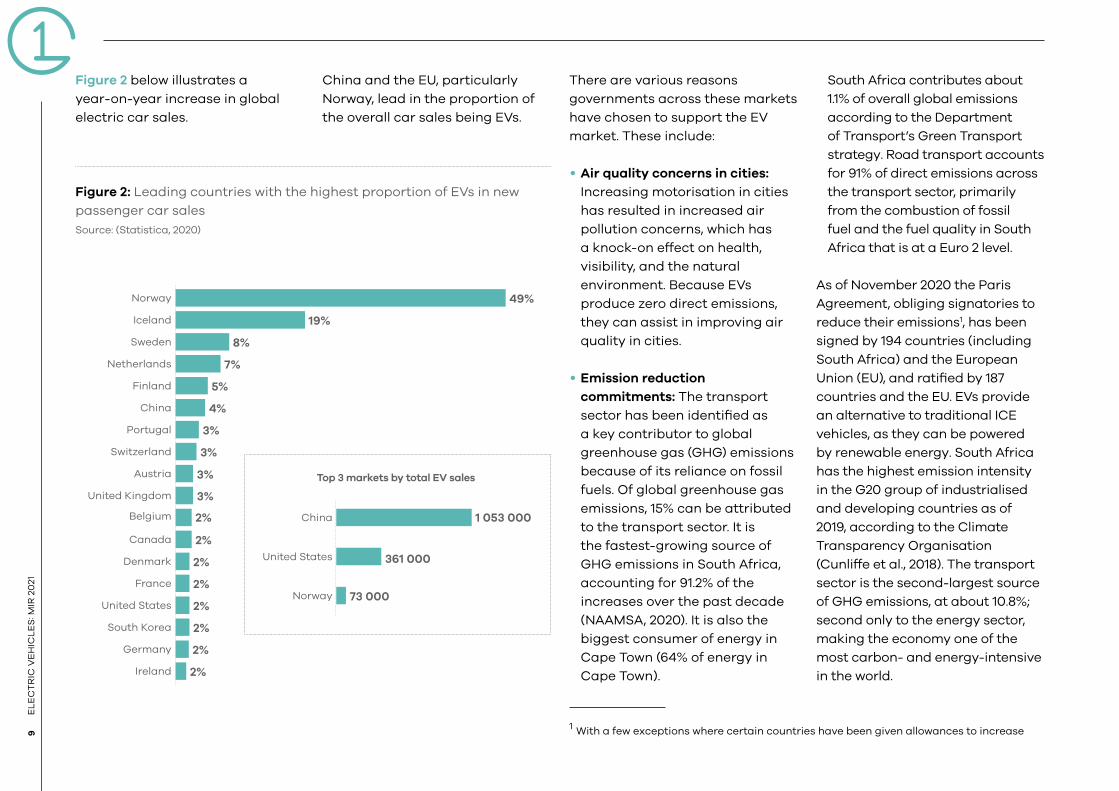
Figure 2 below illustrates a
year-on-year increase in global
electric car sales.
China and the EU, particularly
Norway, lead in the proportion of
the overall car sales being EVs.
Norway
Iceland
Sweden
Netherlands
Finland
China
Portugal
Switzerland
Austria
United Kingdom
Belgium
Canada
Denmark
France
United States
South Korea
Germany
Ireland
49%
19%
8%
7%
5%
4%
3%
3%
3%
3%
2%
2%
2%
2%
2%
2%
2%
2%
1 053 000
361 000
73 000
China
United States
Norway
Top 3 markets by total EV sales
Figure 2: Leading countries with the highest proportion of EVs in new
passenger car sales
Source: (Statistica, 2020)
There are various reasons
governments across these markets
have chosen to support the EV
market. These include:
• Air quality concerns in cities:
Increasing motorisation in cities
has resulted in increased air
pollution concerns, which has
a knock-on effect on health,
visibility, and the natural
environment. Because EVs
produce zero direct emissions,
they can assist in improving air
quality in cities.
• Emission reduction
commitments: The transport
sector has been identified as
a key contributor to global
greenhouse gas (GHG) emissions
because of its reliance on fossil
fuels. Of global greenhouse gas
emissions, 15% can be attributed
to the transport sector. It is
the fastest-growing source of
GHG emissions in South Africa,
accounting for 91.2% of the
increases over the past decade
(NAAMSA, 2020). It is also the
biggest consumer of energy in
Cape Town (64% of energy in
Cape Town).
1 With a few exceptions where certain countries have been given allowances to increase
South Africa contributes about
1.1% of overall global emissions
according to the Department
of Transport’s Green Transport
strategy. Road transport accounts
for 91% of direct emissions across
the transport sector, primarily
from the combustion of fossil
fuel and the fuel quality in South
Africa that is at a Euro 2 level.
As of November 2020 the Paris
Agreement, obliging signatories to
reduce their emissions1, has been
signed by 194 countries (including
South Africa) and the European
Union (EU), and ratified by 187
countries and the EU. EVs provide
an alternative to traditional ICE
vehicles, as they can be powered
by renewable energy. South Africa
has the highest emission intensity
in the G20 group of industrialised
and developing countries as of
2019, according to the Climate
Transparency Organisation
(Cunliffe et al., 2018). The transport
sector is the second-largest source
of GHG emissions, at about 10.8%;
second only to the energy sector,
making the economy one of the
most carbon- and energy-intensive
in the world.
10E
LE
CT
RIC
VE
HIC
LE
S: M
IR 2
02
1
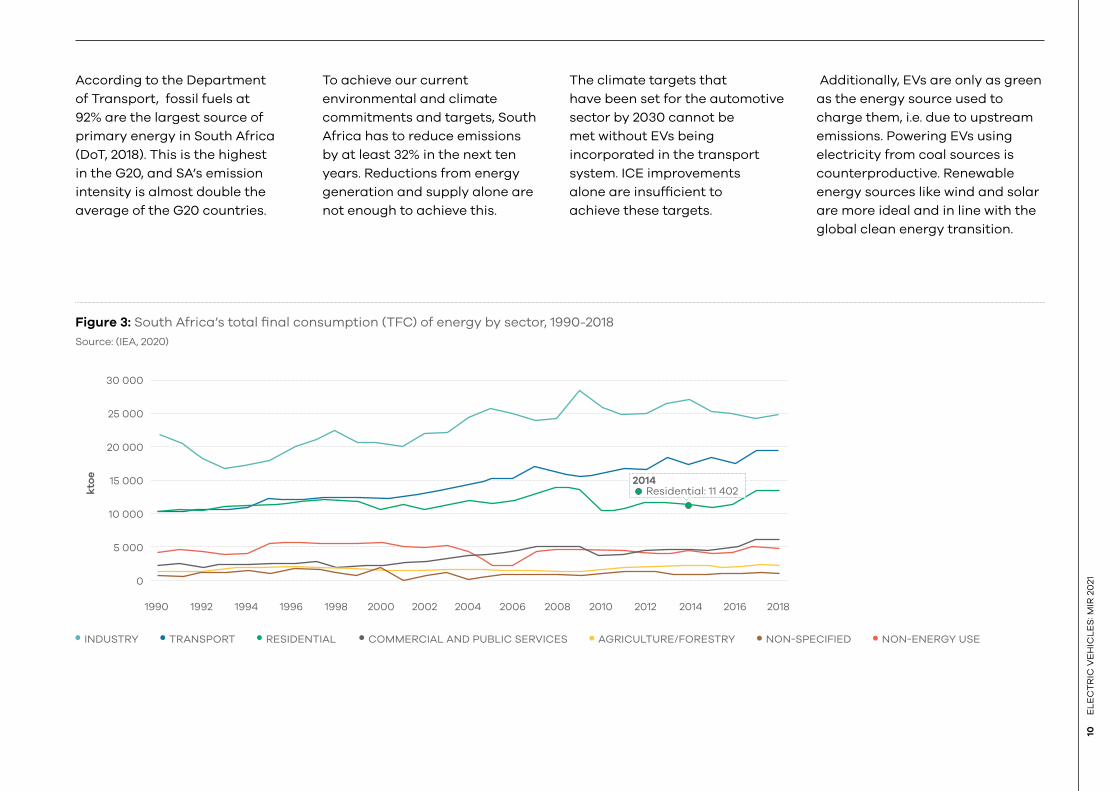
According to the Department
of Transport, fossil fuels at
92% are the largest source of
primary energy in South Africa
(DoT, 2018). This is the highest
in the G20, and SA’s emission
intensity is almost double the
average of the G20 countries.
To achieve our current
environmental and climate
commitments and targets, South
Africa has to reduce emissions
by at least 32% in the next ten
years. Reductions from energy
generation and supply alone are
not enough to achieve this.
The climate targets that
have been set for the automotive
sector by 2030 cannot be
met without EVs being
incorporated in the transport
system. ICE improvements
alone are insufficient to
achieve these targets.
Additionally, EVs are only as green
as the energy source used to
charge them, i.e. due to upstream
emissions. Powering EVs using
electricity from coal sources is
counterproductive. Renewable
energy sources like wind and solar
are more ideal and in line with the
global clean energy transition.
Figure 3: South Africa’s total final consumption (TFC) of energy by sector, 1990-2018
Source: (IEA, 2020)
INDUSTRY TRANSPORT RESIDENTIAL COMMERCIAL AND PUBLIC SERVICES AGRICULTURE/FORESTRY NON-SPECIFIED NON-ENERGY USE
5 000
0
10 000
15 000
20 000
25 000
30 000
kto
e
19921990 1994 1996 1998 2000 2002 2004 2006 2008 2010 2012 2014 2016 2018
2014 Residential: 11 402
03
11E
LE
CT
RIC
VE
HIC
LE
S: M
IR 2
02
1
Figure 3 illustrates the gradual
increase in energy use in South
Africa expressed in kilo tonnes of
oil equivalent. The transportation
sector has been the second-
largest energy consumer in the
country since 1994.
Reliance on fossil fuels in the
transport sector poses a risk to
countries because of the volatility
of the crude oil price. As a result,
many countries are seeking
alternatives that will reduce their
crude oil import bill and exposure
to oil price volatility. Because local
electricity production derived from
a variety of sources can power EVs,
they are becoming increasingly
attractive in this respect.
South Africa has not implemented
any form of incentives or policies
to accelerate the growth of the
EV market.
It has yet to join the ranks of those
countries experiencing a steep
rise in uptake of EVs. It is expected
that, as the market matures,
the competitiveness of EVs will
continue to increase. In due course,
EVs might not require government
subsidies to be financially viable,
making it likely that SA could
follow the global trends in time.
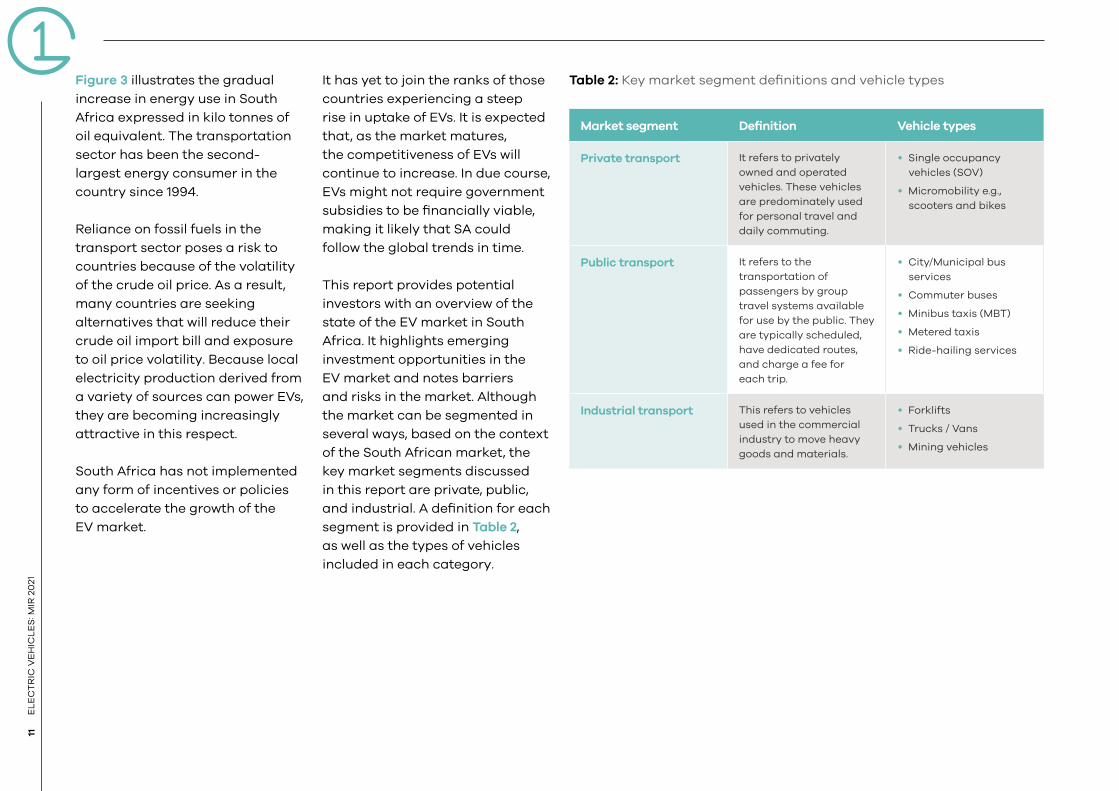
This report provides potential
investors with an overview of the
state of the EV market in South
Africa. It highlights emerging
investment opportunities in the
EV market and notes barriers
and risks in the market. Although
the market can be segmented in
several ways, based on the context
of the South African market, the
key market segments discussed
in this report are private, public,
and industrial. A definition for each
segment is provided in Table 2,
as well as the types of vehicles
included in each category.
Table 2: Key market segment definitions and vehicle types
Market segment Definition Vehicle types
Private transport It refers to privately
owned and operated
vehicles. These vehicles
are predominately used
for personal travel and
daily commuting.
• Single occupancy
vehicles (SOV)
• Micromobility e.g.,
scooters and bikes
Public transport It refers to the
transportation of
passengers by group
travel systems available
for use by the public. They
are typically scheduled,
have dedicated routes,
and charge a fee for
each trip.
• City/Municipal bus
services
• Commuter buses
• Minibus taxis (MBT)
• Metered taxis
• Ride-hailing services
Industrial transport This refers to vehicles
used in the commercial
industry to move heavy
goods and materials.
• Forklifts
• Trucks / Vans
• Mining vehicles
12E
LE
CT
RIC
VE
HIC
LE
S: M
IR 2
02
1
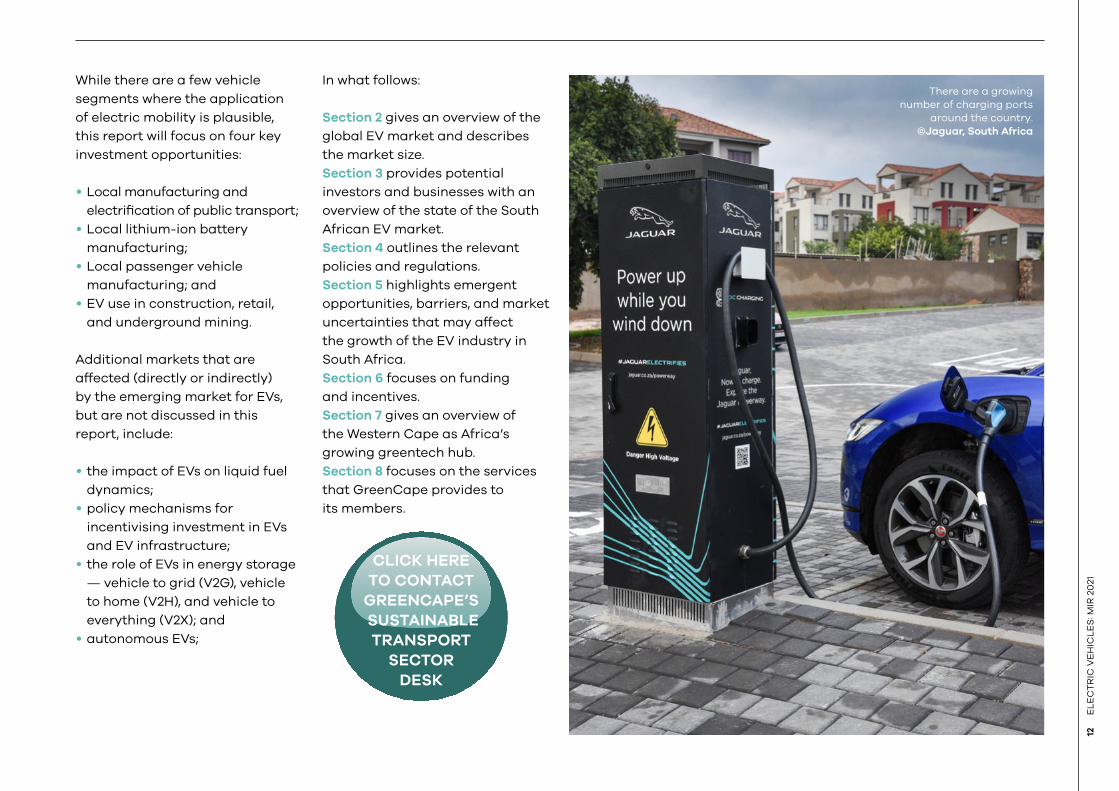
While there are a few vehicle
segments where the application
of electric mobility is plausible,
this report will focus on four key
investment opportunities:
• Local manufacturing and
electrification of public transport;
• Local lithium-ion battery
manufacturing;
• Local passenger vehicle
manufacturing; and
• EV use in construction, retail,
and underground mining.
Additional markets that are
affected (directly or indirectly)
by the emerging market for EVs,
but are not discussed in this
report, include:
• the impact of EVs on liquid fuel
dynamics;
• policy mechanisms for
incentivising investment in EVs
and EV infrastructure;
• the role of EVs in energy storage
— vehicle to grid (V2G), vehicle
to home (V2H), and vehicle to
everything (V2X); and
• autonomous EVs;
In what follows:
Section 2 gives an overview of the
global EV market and describes
the market size.
Section 3 provides potential
investors and businesses with an
overview of the state of the South
African EV market.
Section 4 outlines the relevant
policies and regulations.
Section 5 highlights emergent
opportunities, barriers, and market
uncertainties that may affect
the growth of the EV industry in
South Africa.
Section 6 focuses on funding
and incentives.
Section 7 gives an overview of
the Western Cape as Africa’s
growing greentech hub.
Section 8 focuses on the services
that GreenCape provides to
its members.
There are a growing
number of charging ports
around the country.
©Jaguar, South Africa
CLICK HERE
TO CONTACT
GREENCAPE’S
SUSTAINABLE
TRANSPORT
SECTOR
DESK
03
EL
EC
TR
IC
VE
HIC
LE
S: M
IR
20
21
13
This section provides an overview of the global EV industry to provide
context for the South African industry.
GLOBAL INDUSTRY
OVERVIEW
14E
LE
CT
RIC
VE
HIC
LE
S: M
IR 2
02
1
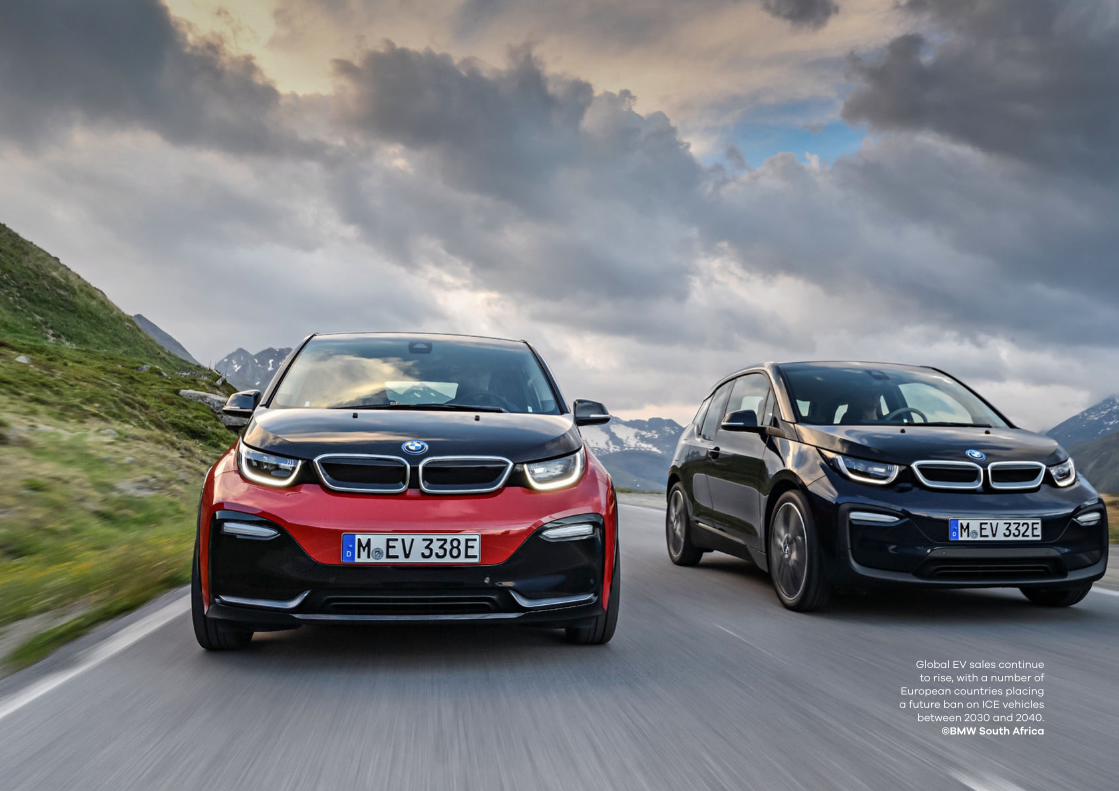
Global EV sales continue
to rise, with a number of
European countries placing
a future ban on ICE vehicles
between 2030 and 2040.
©BMW South Africa
03
15E
LE
CT
RIC
VE
HIC
LE
S: M
IR 2
02
1
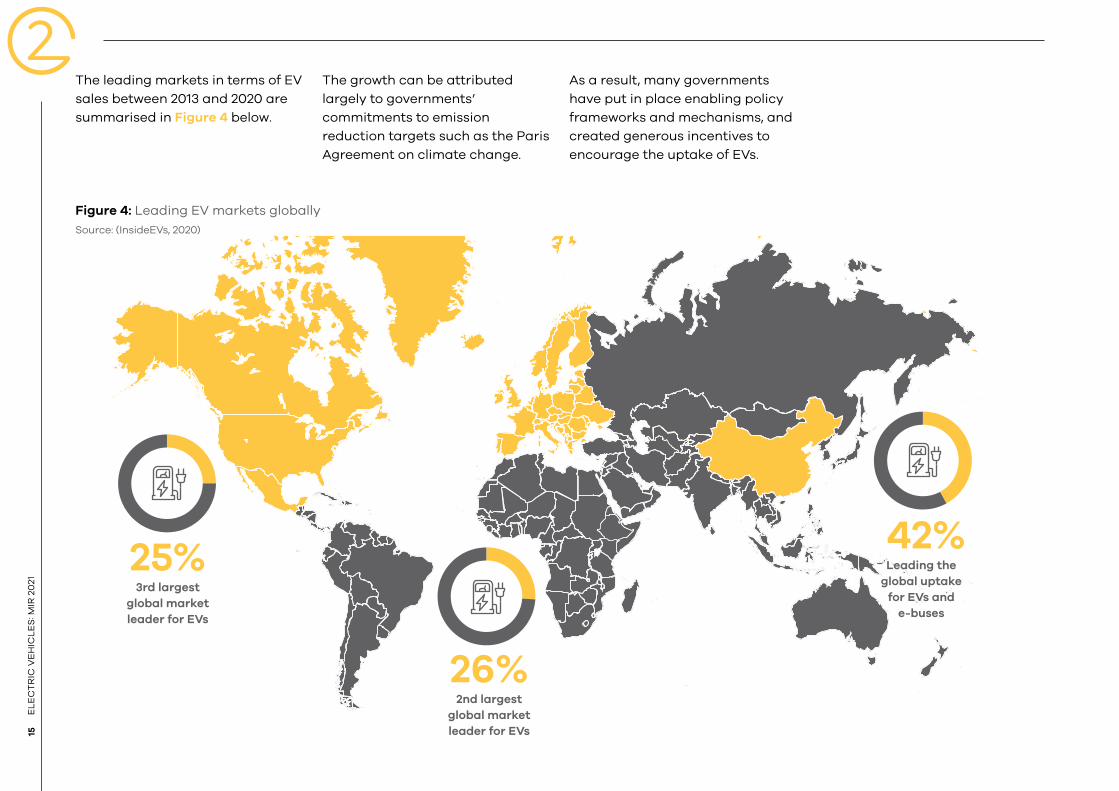
The leading markets in terms of EV
sales between 2013 and 2020 are
summarised in Figure 4 below.
The growth can be attributed
largely to governments’
commitments to emission
reduction targets such as the Paris
Agreement on climate change.
As a result, many governments
have put in place enabling policy
frameworks and mechanisms, and
created generous incentives to
encourage the uptake of EVs.
Figure 4: Leading EV markets globally
Source: (InsideEVs, 2020)
25+75+L26+74+L
42+58+L25%
26%
42%3rd largest
global market
leader for EVs
2nd largest
global market
leader for EVs
Leading the
global uptake
for EVs and
e-buses

16E
LE
CT
RIC
VE
HIC
LE
S: M
IR 2
02
1
42+58+L
As indicated in Section 1, in 2019
there was a slightly reduced
growth trajectory for EVs, linked
to the reduction of incentives.
Global car (ICE and EV) production
was 91.8 million. Sales declined to
91.3 million, primarily because of
reduced demand from China.
However, EV sales in 2019
increased to 2.21 million units (2.5%
market share of new vehicle sales),
with Europe as the main driver of
EV growth. This increase has been
driven by government policies
such as the European Green Deal
that aims for Europe to be climate
neutral by 2050, emission and fuel
economy regulations, and financial
and non-financial incentives
(European Commission, 2020).
As indicated in Section 1, China
currently has the largest share of
the electric vehicle market. It is
also projected that by 2030, 40% of
all new car sales in the European
Union will be electric, and this is
projected to grow to 80% by 2040.
According to Global EV Outlook
2019/20, the global EV market was
valued at ~R1.6 trillion (USD 118.9
billion). Although only accounting
for 2.1% of the automotive industry,
the compound annual growth rate
for EV sales is estimated at 22.3%.
The private transport segment
accounts for the largest share
of this global market, with public
transport accounting for far less.
The number of electricity charging
points worldwide was estimated
to be approximately 5.2 million at
the end of 2018, up 44% from the
previous year. Most of this increase
was in private charging points,
accounting for more than 90%
of the 1.6 million installations last
year (IEA 2019).
China (42%), Europe (26%), and
North America (25%) are the
markets leading the global
uptake in EVs. In their respective
territories, BYD, Nissan and Tesla
are the leading brands.
China is the largest global market
for passenger vehicles, driven by:
• the government’s commitment
to reducing greenhouse gas
emissions;
• tight fuel regulations that
have resulted in the provision
of generous incentives and
subsidies (financial and non-
financial), making EV cost
comparable to ICE vehicles;
• local manufacturing and
economies of scale, thereby
reducing the cost of vehicles;
and
• extensive charging infrastructure
networks.
Europe and the US are also leading
global markets, driven by financial
and non-financial incentives for
manufacturers and consumers, as
well as the respective governments’
commitment to developing
enabling policy environments.
Although the market is seeing
rapid growth, there are key factors
that could slow down the growth of
the EV market. These include:
• battery prices not decreasing as
expected;
• a lack of, or inadequate/
insufficient enabling policy
environment;
• China’s reduction and
elimination of some EV
incentives;
• oil prices decreasing further
instead of increasing due to
lower demand for oil in Europe
and China, coupled with a steady
supply of oil from OPEC; and
• limited range and charging
infrastructure networks.
Without incentives and subsidies,
the barriers would result in delayed
EV and ICE vehicle cost parity,
thereby limiting rapid adoption.
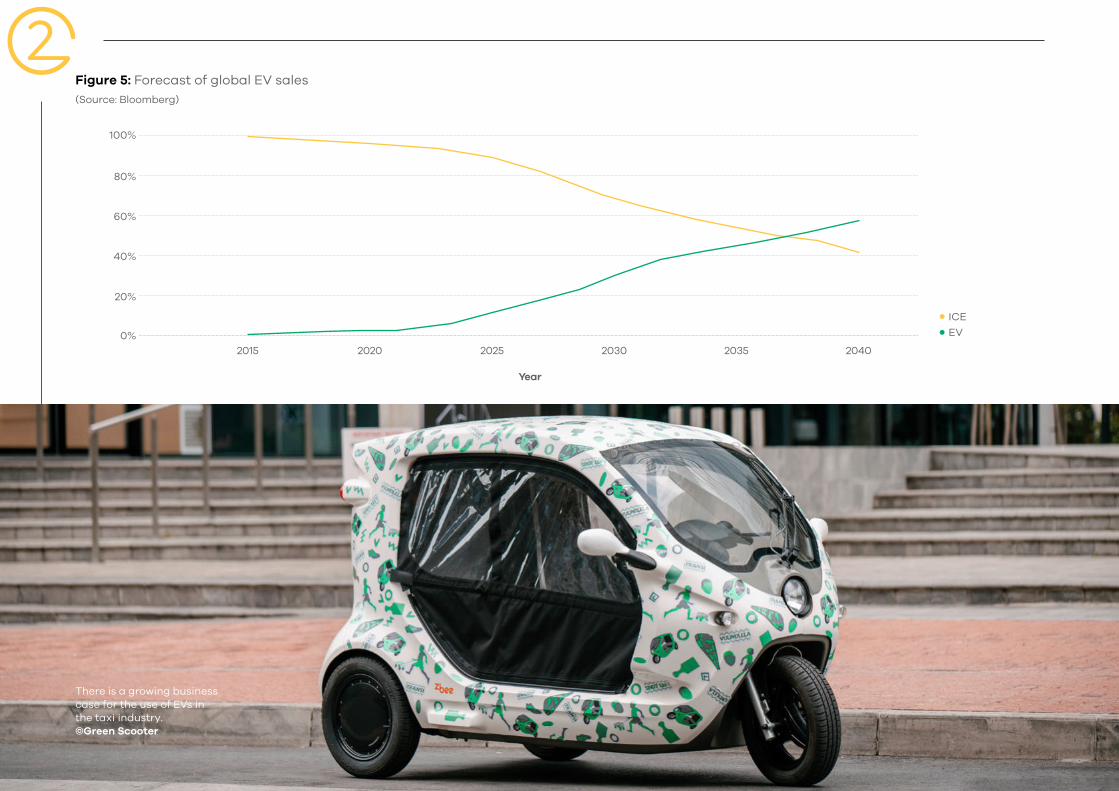
However, Bloomberg forecasts that
EV passenger vehicle sales will
exceed ICE vehicle sales around
2037 (Figure 5).
03
17E
LE
CT
RIC
VE
HIC
LE
S: M
IR 2
02
1
Figure 5: Forecast of global EV sales
(Source: Bloomberg)
0%
20%
40%
60%
100%
80%
2015 2020 2025
Year
2030 2035 2040
ICE
EV
There is a growing business
case for the use of EVs in
the taxi industry.
©Green Scooter
18E
LE
CT
RIC
VE
HIC
LE
S: M
IR 2
02
1
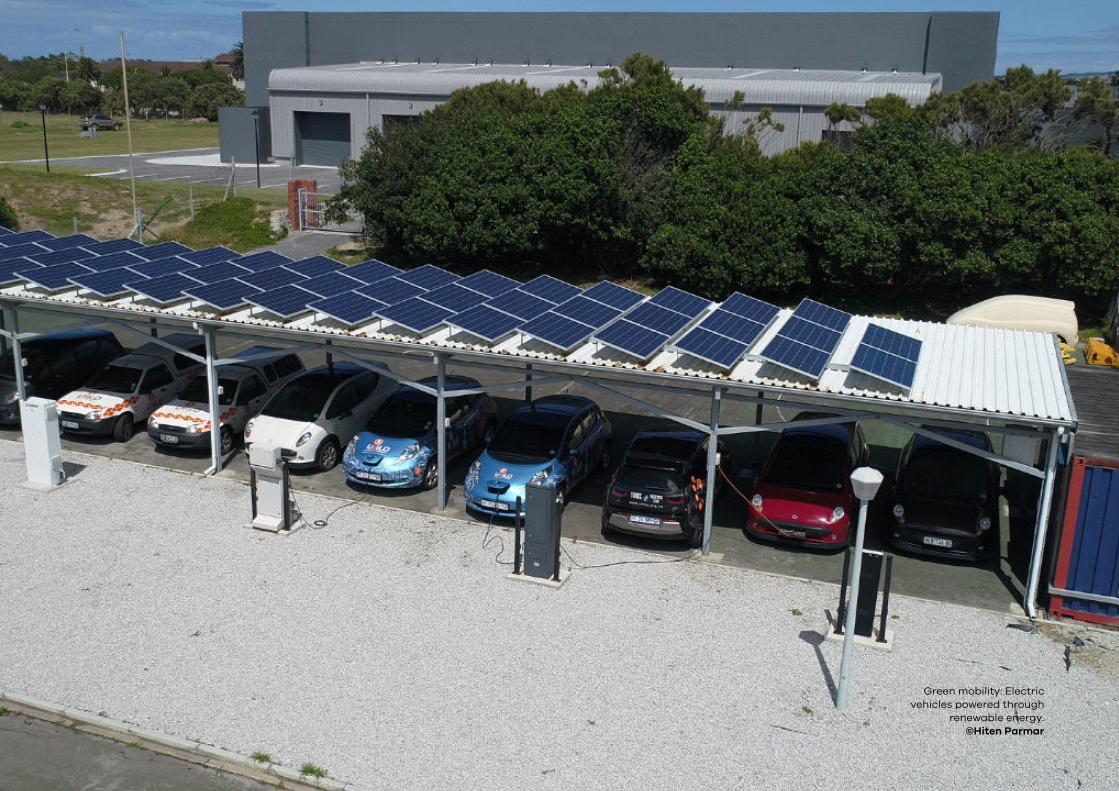
Green mobility: Electric
vehicles powered through
renewable energy.
©Hiten Parmar
The emerging EV market represents a small share of the
SA automotive industry but presents substantial opportunities for
businesses and investors active and/or interested in the sector.
SOUTH AFRICAN
INDUSTRY OVERVIEW
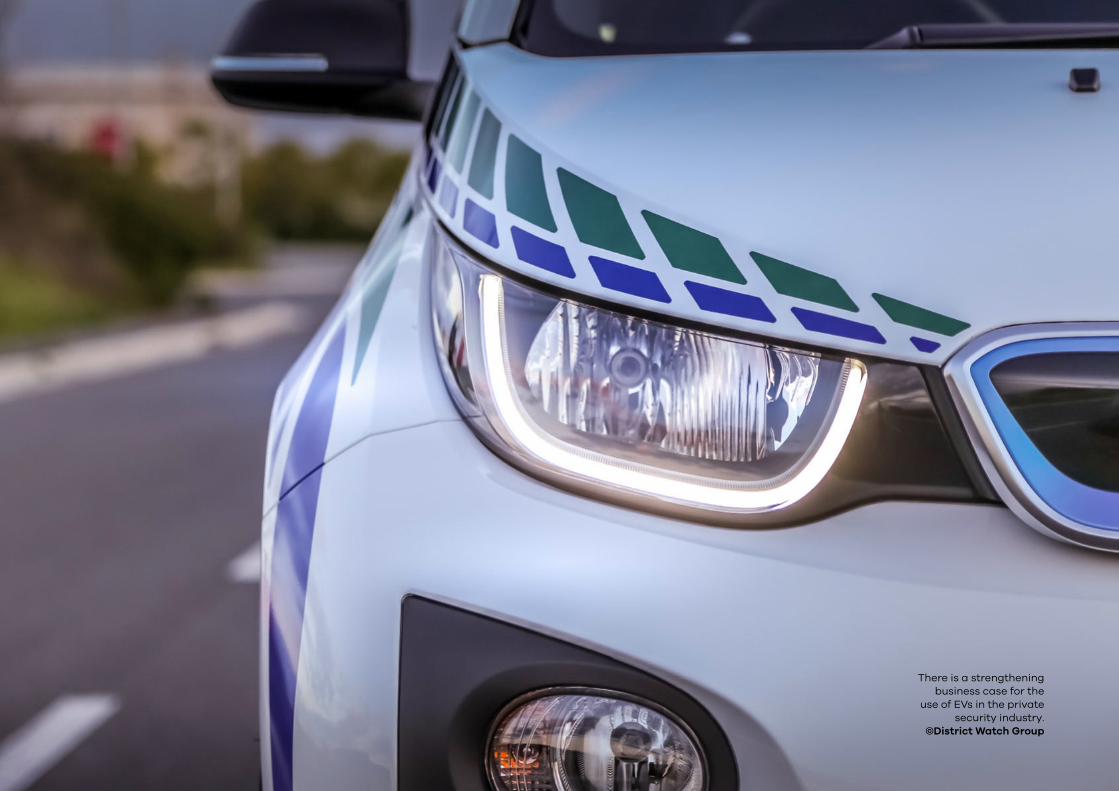
There is a strengthening
business case for the
use of EVs in the private
security industry.
©District Watch Group
03
21
EL
EC
TR
IC V
EH
ICL
ES
: MIR
20
21
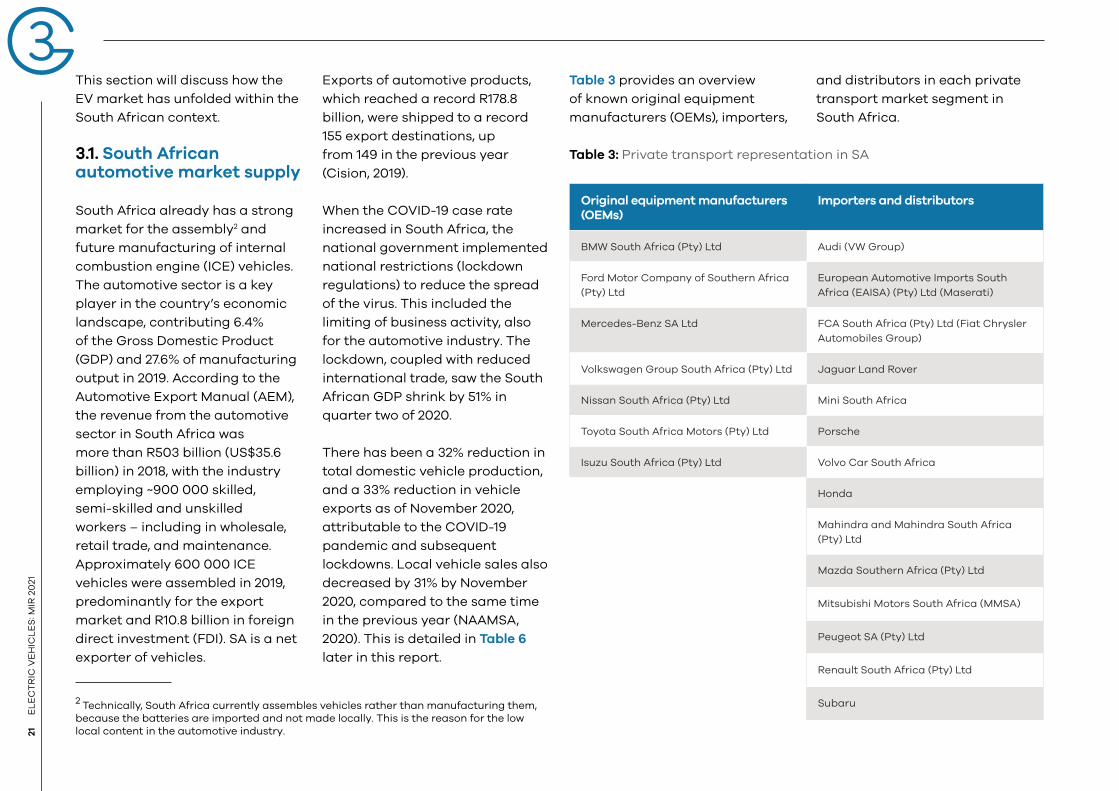
This section will discuss how the
EV market has unfolded within the
South African context.
3.1. South African automotive market supply
South Africa already has a strong
market for the assembly2 and
future manufacturing of internal
combustion engine (ICE) vehicles.
The automotive sector is a key
player in the country’s economic
landscape, contributing 6.4%
of the Gross Domestic Product
(GDP) and 27.6% of manufacturing
output in 2019. According to the
Automotive Export Manual (AEM),
the revenue from the automotive
sector in South Africa was
more than R503 billion (US$35.6
billion) in 2018, with the industry
employing ~900 000 skilled,
semi-skilled and unskilled
workers – including in wholesale,
retail trade, and maintenance.
Approximately 600 000 ICE
vehicles were assembled in 2019,
predominantly for the export
market and R10.8 billion in foreign
direct investment (FDI). SA is a net
exporter of vehicles.
2 Technically, South Africa currently assembles vehicles rather than manufacturing them,
because the batteries are imported and not made locally. This is the reason for the low
local content in the automotive industry.
Exports of automotive products,
which reached a record R178.8
billion, were shipped to a record
155 export destinations, up
from 149 in the previous year
(Cision, 2019).
When the COVID-19 case rate
increased in South Africa, the
national government implemented
national restrictions (lockdown
regulations) to reduce the spread
of the virus. This included the
limiting of business activity, also
for the automotive industry. The
lockdown, coupled with reduced
international trade, saw the South
African GDP shrink by 51% in
quarter two of 2020.
There has been a 32% reduction in
total domestic vehicle production,
and a 33% reduction in vehicle
exports as of November 2020,
attributable to the COVID-19
pandemic and subsequent
lockdowns. Local vehicle sales also
decreased by 31% by November
2020, compared to the same time
in the previous year (NAAMSA,
2020). This is detailed in Table 6
later in this report.
Table 3 provides an overview
of known original equipment
manufacturers (OEMs), importers,
and distributors in each private
transport market segment in
South Africa.
Table 3: Private transport representation in SA
Original equipment manufacturers (OEMs)
Importers and distributors
BMW South Africa (Pty) Ltd Audi (VW Group)
Ford Motor Company of Southern Africa
(Pty) Ltd
European Automotive Imports South
Africa (EAISA) (Pty) Ltd (Maserati)
Mercedes-Benz SA Ltd FCA South Africa (Pty) Ltd (Fiat Chrysler
Automobiles Group)
Volkswagen Group South Africa (Pty) Ltd Jaguar Land Rover
Nissan South Africa (Pty) Ltd Mini South Africa
Toyota South Africa Motors (Pty) Ltd Porsche
Isuzu South Africa (Pty) Ltd Volvo Car South Africa
Honda
Mahindra and Mahindra South Africa
(Pty) Ltd
Mazda Southern Africa (Pty) Ltd
Mitsubishi Motors South Africa (MMSA)
Peugeot SA (Pty) Ltd
Renault South Africa (Pty) Ltd
Subaru

22
EL
EC
TR
IC V
EH
ICL
ES
: MIR
20
21
Original equipment manufacturers (OEMs)
Importers and distributors
Suzuki Auto South Africa
Hyundai Auto South Africa Pty Ltd
(MOTUS Group)
KIA Motors South Africa (Pty) Ltd
HAVAL Motors South Africa (Pty) Ltd
(HMSA)
TATA Motors South Africa
Figure 6 highlights that SA
has three key automotive
manufacturing hubs located in the
Eastern Cape (EC), KwaZulu-Natal
(KZN) and Gauteng (GP). Although
the EC does not experience
high commuter patterns like the
Western Cape (WC), KZN and GP,
the EC has been an attractive
manufacturing destination
because of the incentives provided
by the East London and Coega
Industrial Development Zones
(IDZs). All three transport hubs
have commonalities in that they
all harbour private, public, and
industrial transport manufacturing
industries, as well as component
companies that support them.
Figure 6: Manufacturing hubs in South Africa
OEM
BMW (South Africa (Pty) Ltd
Nissan South Africa (Pty) Ltd
Ford Motor Company of Southern
Africa (Pty) Ltd
Commercial vehicles & bus companies
Babcock, Eicher Trucks, Fiat
Group, Ford, Hyundai, Iveco, JMC,
MAN Truck & Bus, MarcoPolo,
Peugeot Citroen, Powerstar SA,
Scania, Tata Trucks, VDL Bus
& Coach and Volvo Group
Southern Africa
GAUTENG
OEM
Volkswagen Group South
Africa (Pty) Ltd
Mercedes-Benz SA Ltd
Isuzu South Africa
Commercial vehicles & bus companies
FAW Trucks, Isuzu Truck,
Mercedes-Benz SA (Freightliner
and Fuso) and Volkswagen
Group SA
EASTERN CAPE
OEM
Toyota South Africa Motors
(Pty) Ltd
Commercial vehicles & bus companies
Bell Equipment, MAN Truck & Bus
and Toyota (Hino)
KWAZULU-NATAL
Table 3 continued...
03
23
EL
EC
TR
IC V
EH
ICL
ES
: MIR
20
21
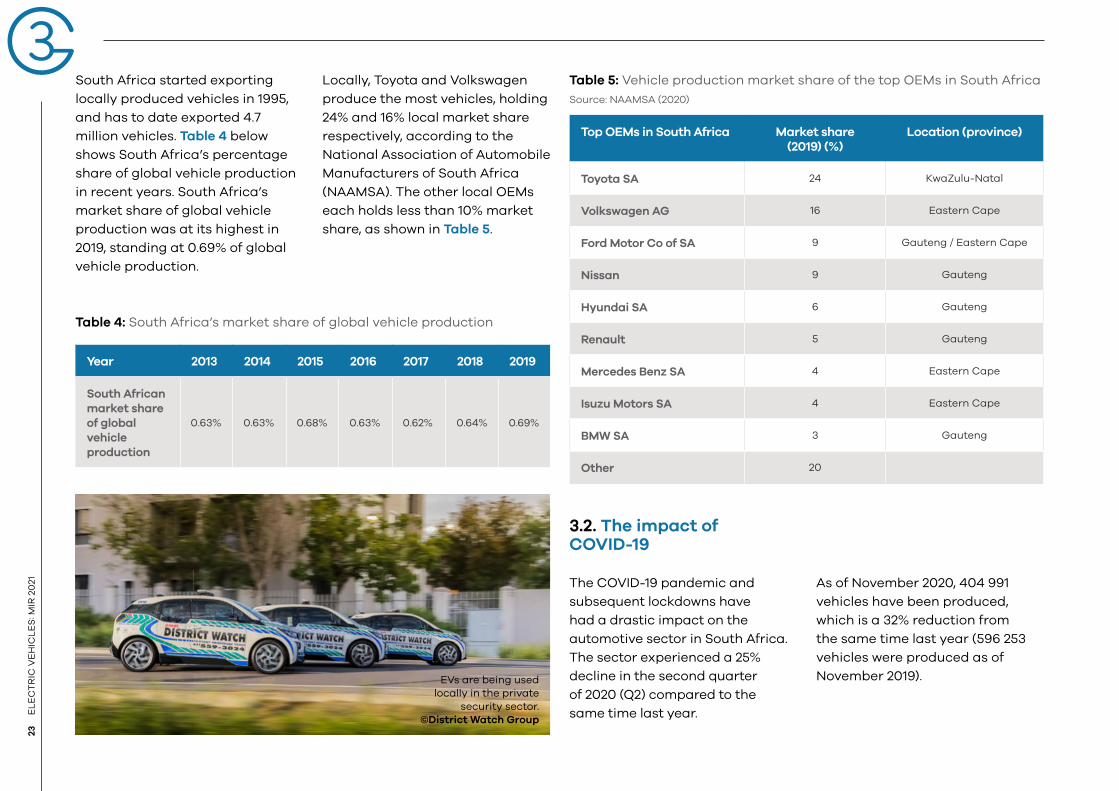
South Africa started exporting
locally produced vehicles in 1995,
and has to date exported 4.7
million vehicles. Table 4 below
shows South Africa’s percentage
share of global vehicle production
in recent years. South Africa’s
market share of global vehicle
production was at its highest in
2019, standing at 0.69% of global
vehicle production.
Locally, Toyota and Volkswagen
produce the most vehicles, holding
24% and 16% local market share
respectively, according to the
National Association of Automobile
Manufacturers of South Africa
(NAAMSA). The other local OEMs
each holds less than 10% market
share, as shown in Table 5.
Table 4: South Africa’s market share of global vehicle production
Year 2013 2014 2015 2016 2017 2018 2019
South African
market share
of global
vehicle
production
0.63% 0.63% 0.68% 0.63% 0.62% 0.64% 0.69%
Table 5: Vehicle production market share of the top OEMs in South Africa
Source: NAAMSA (2020)
Top OEMs in South Africa Market share (2019) (%)
Location (province)
Toyota SA 24 KwaZulu-Natal
Volkswagen AG 16 Eastern Cape
Ford Motor Co of SA 9 Gauteng / Eastern Cape
Nissan 9 Gauteng
Hyundai SA 6 Gauteng
Renault 5 Gauteng
Mercedes Benz SA 4 Eastern Cape
Isuzu Motors SA 4 Eastern Cape
BMW SA 3 Gauteng
Other 20
3.2. The impact of COVID-19
The COVID-19 pandemic and
subsequent lockdowns have
had a drastic impact on the
automotive sector in South Africa.
The sector experienced a 25%
decline in the second quarter
of 2020 (Q2) compared to the
same time last year.
As of November 2020, 404 991
vehicles have been produced,
which is a 32% reduction from
the same time last year (596 253
vehicles were produced as of
November 2019). EVs are being used
locally in the private
security sector.
©District Watch Group
24
EL
EC
TR
IC V
EH
ICL
ES
: MIR
20
21
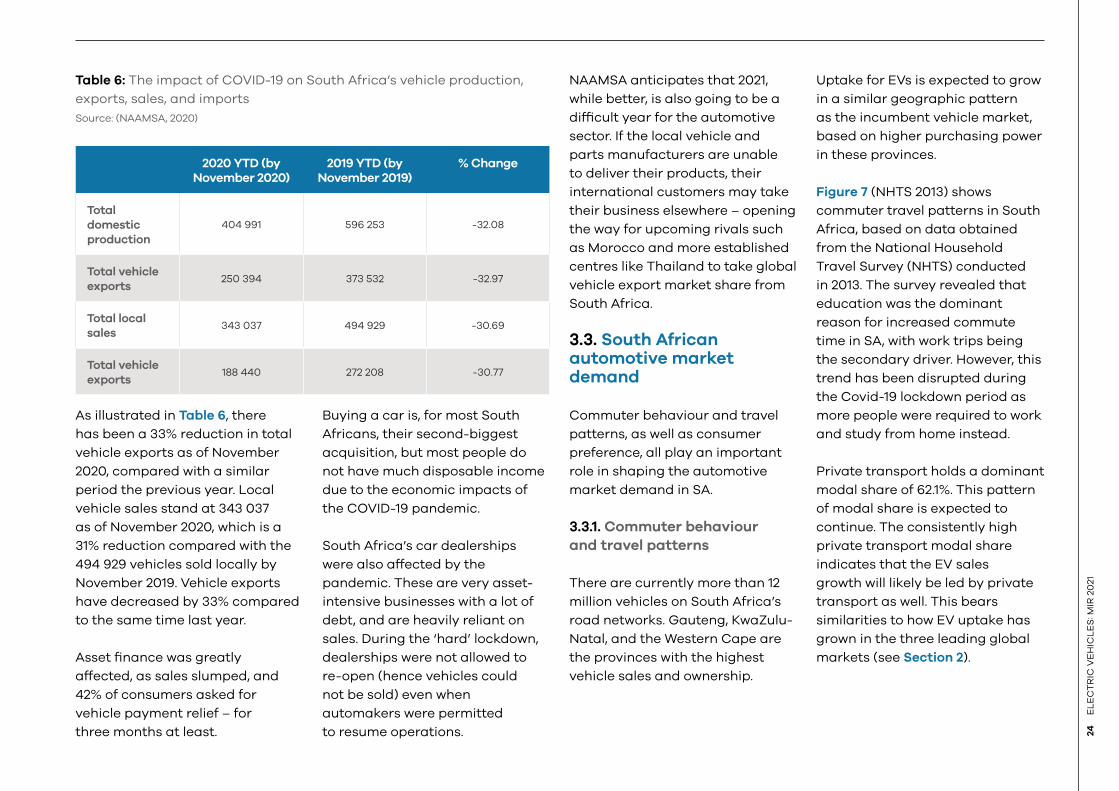
Table 6: The impact of COVID-19 on South Africa’s vehicle production,
exports, sales, and imports
Source: (NAAMSA, 2020)
2020 YTD (by November 2020)
2019 YTD (by November 2019)
% Change
Total
domestic
production
404 991 596 253 -32.08
Total vehicle
exports250 394 373 532 -32.97
Total local
sales343 037 494 929 -30.69
Total vehicle
exports188 440 272 208 -30.77
As illustrated in Table 6, there
has been a 33% reduction in total
vehicle exports as of November
2020, compared with a similar
period the previous year. Local
vehicle sales stand at 343 037
as of November 2020, which is a
31% reduction compared with the
494 929 vehicles sold locally by
November 2019. Vehicle exports
have decreased by 33% compared
to the same time last year.
Asset finance was greatly
affected, as sales slumped, and
42% of consumers asked for
vehicle payment relief – for
three months at least.
Buying a car is, for most South
Africans, their second-biggest
acquisition, but most people do
not have much disposable income
due to the economic impacts of
the COVID-19 pandemic.
South Africa’s car dealerships
were also affected by the
pandemic. These are very asset-
intensive businesses with a lot of
debt, and are heavily reliant on
sales. During the ‘hard’ lockdown,
dealerships were not allowed to
re-open (hence vehicles could
not be sold) even when
automakers were permitted
to resume operations.
NAAMSA anticipates that 2021,
while better, is also going to be a
difficult year for the automotive
sector. If the local vehicle and
parts manufacturers are unable
to deliver their products, their
international customers may take
their business elsewhere – opening
the way for upcoming rivals such
as Morocco and more established
centres like Thailand to take global
vehicle export market share from
South Africa.
3.3. South African automotive market demand
Commuter behaviour and travel
patterns, as well as consumer
preference, all play an important
role in shaping the automotive
market demand in SA.
3.3.1. Commuter behaviour
and travel patterns
There are currently more than 12
million vehicles on South Africa’s
road networks. Gauteng, KwaZulu-
Natal, and the Western Cape are
the provinces with the highest
vehicle sales and ownership.
Uptake for EVs is expected to grow
in a similar geographic pattern
as the incumbent vehicle market,
based on higher purchasing power
in these provinces.
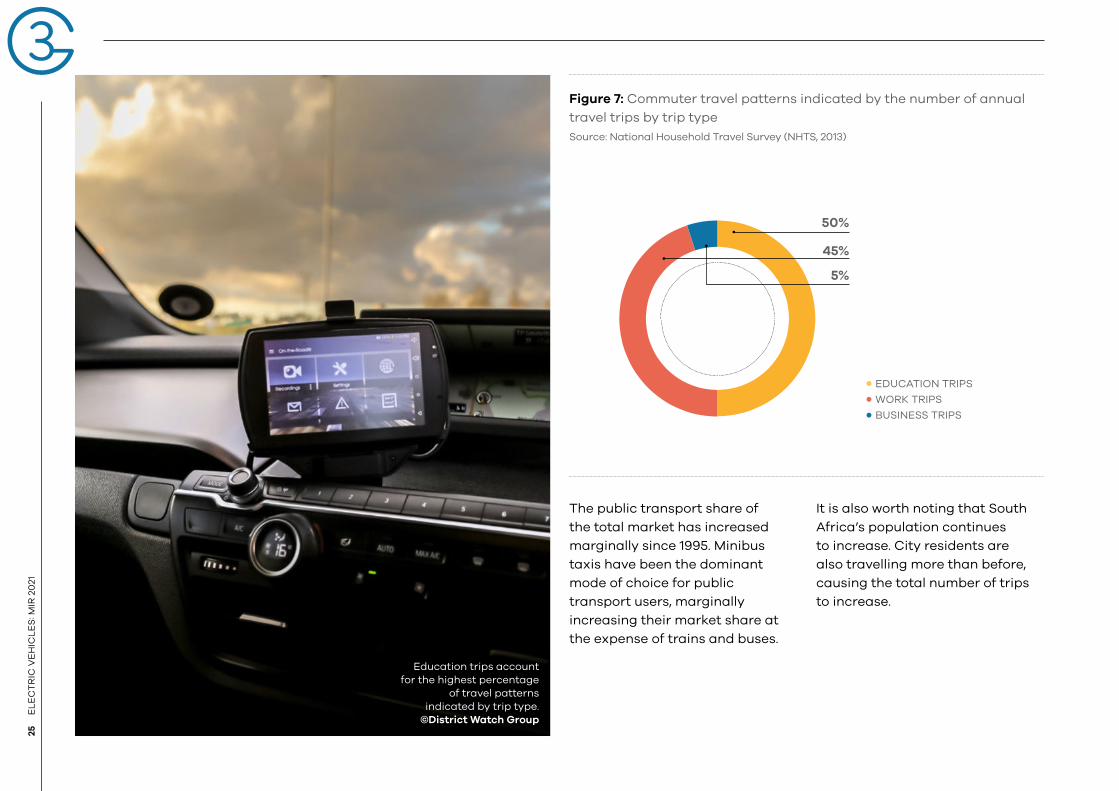
Figure 7 (NHTS 2013) shows
commuter travel patterns in South
Africa, based on data obtained
from the National Household
Travel Survey (NHTS) conducted
in 2013. The survey revealed that
education was the dominant
reason for increased commute
time in SA, with work trips being
the secondary driver. However, this
trend has been disrupted during
the Covid-19 lockdown period as
more people were required to work
and study from home instead.
Private transport holds a dominant
modal share of 62.1%. This pattern
of modal share is expected to
continue. The consistently high
private transport modal share
indicates that the EV sales
growth will likely be led by private
transport as well. This bears
similarities to how EV uptake has
grown in the three leading global
markets (see Section 2).
03
25
EL
EC
TR
IC V
EH
ICL
ES
: MIR
20
21
Figure 7: Commuter travel patterns indicated by the number of annual
travel trips by trip type
Source: National Household Travel Survey (NHTS, 2013)
50+45+5+L5%
45%
EDUCATION TRIPS
WORK TRIPS
BUSINESS TRIPS
50%
The public transport share of
the total market has increased
marginally since 1995. Minibus
taxis have been the dominant
mode of choice for public
transport users, marginally
increasing their market share at
the expense of trains and buses.
It is also worth noting that South
Africa’s population continues
to increase. City residents are
also travelling more than before,
causing the total number of trips
to increase.
Education trips account
for the highest percentage
of travel patterns
indicated by trip type.
©District Watch Group
26
EL
EC
TR
IC V
EH
ICL
ES
: MIR
20
21
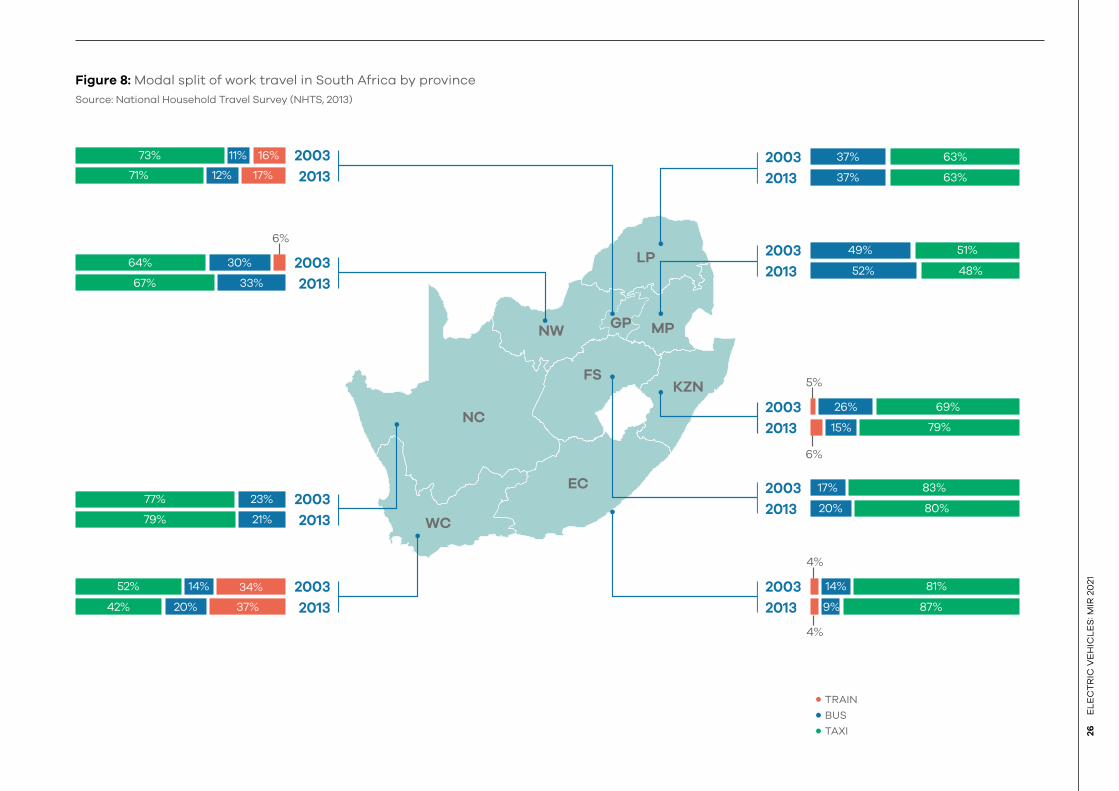
Figure 8: Modal split of work travel in South Africa by province
Source: National Household Travel Survey (NHTS, 2013)
51%
2003
2013
2003
2013LP
GP MP
KZNFS
EC
WC
NC
NW
37% 63%
37% 63%
49% 51%
52% 48%
2003
2013
17% 83%
20% 80%
2003
2013
2003
2013
2003
2013
2003
2013
2003
2013
14% 81% 83%
9% 87%42% 20% 37%
79% 21%
67% 33%
77%
64%
73%
71%
23%
30%
11%
12%
16%
17%
52% 14% 34%
5%
4%
6%
4%
6%
2003
2013
26%
15%
69%
79%
TRAIN
BUS
TAXI

03
27
EL
EC
TR
IC V
EH
ICL
ES
: MIR
20
21
Figure 8, on the previous page,
shows is a comparison of how
commuters have used public
transport for work trips in 2003
and 2013 (NHTS 2013) — the year
the last National Household Travel
Survey was conducted (once every
decade). The figure shows that in
the case of public transport:
• minibus taxis are the dominating
mode; this has increased in all
provinces except for Gauteng
and the Western Cape;
• bus usage has also marginally
increased in almost all provinces;
this number would also have
increased substantially with
the introduction of bus rapid
transit (BRT) systems that have
dedicated lanes and have
improved reliability, scheduling,
and travel efficiency for many
commuters; and
• trains, despite being the most
cost-effective mode of travel,
are the least used option and
one that has seen the smallest
increase between 2003 and 2013.
Reliability, safety, and travel time
are some of the factors cited as
reasons for this limited increase
in use.
3.4. An overview of the development of SA’s EV industry
The early foundations of the EV
market in SA date as far back as
the early 1970s as a response to
the first oil crisis hitting SA.
Table 7 details the developments
from these early foundations
until 2013.
Bus usage has marginally
increased in almost all provinces.
©City of Cape Town

28
EL
EC
TR
IC V
EH
ICL
ES
: MIR
20
21
Table 7: The history
of the EV market
development in South
Africa: 1970s to 2020
20182019
- 2020
In response to the first oil crisis,
the Department of Mineral
and Energy Affairs (DMEA)
and the Council for Scientific
and Industrial Research
(CSIR) conducted research
that highlighted EVs as an
alternative to oil. This led to
the development of the ZEBRA
and LIB technologies.
Kobus Meiring, CEO of the SA
company Optimal Energy based
in Cape Town, and his team
started developing the Joule –
a local, all-electric family car.
This was funded jointly from
the Sovereign Innovation Fund
of the Department of Science
and Technology (DST) and
the Industrial Development
Corporation (IDC), with a
combined investment of
approximately R300 million.
The car needed R9 billion for
commercialisation. The venture
failed to demonstrate any
economic merit or sustainability.
The City of Cape Town
implemented an e-bus pilot
of 11 electric buses, procured
from BYD, for the MyCiTi
Integrated Rapid Transit (IRT)
system in Cape Town.
Triggered yet again by high oil
prices, the NEC was formed
to look at alternatives. In 1992,
Eskom took over the research,
and various vehicles were piloted.
These include:
• two VW shuttle buses
• a utility vehicle
• an electric game viewer in the
Kruger National Park.
It was also during the Eskom
programme when Denel
developed a hybrid electric
combat vehicle.
A decrease in oil prices saw the
Eskom programme halted in
June 2002.
OEMs and
service providers
throughout the value
chance announced
ground-breaking
e-mobility plans for
the South African
market. Some of
these are detailed
in Table 8.
The uYilo eMobility Technology
Innovation Programme,
initiated by the Technology
Innovation Agency (TIA) in 2013,
is the custodian of Optimal
Energy’s assets. uYilo fast-
tracks the development and
commercialisation of key
technologies that will primarily
support the EV industry, such
as lithium-ion batteries.
EV industry roadmap. Led by
the dtic, it proposes incentives
for vehicle manufacturers
to locally produce EVs. The
incentive was a 35% cash-
back in investment over three
years, on the condition that
manufacturers produce a
minimum of 5 000 volumes
annually to qualify for the
incentive. The status of this
subsidy is pending.
TIA launched the National
Electric Vehicle Technology
Innovation Programme in
March 2013. It was intended
to create a collaborative
environment for entrepreneurs,
academia, equipment
manufacturers, technology
companies, and science
councils to accelerate
the development and
commercialisation of the EV
industry in SA. The Nissan Leaf
EV was introduced in the South
African market
1988 - 2002
2004 - 2012
2013 - 2017
The 1970s
03
29
EL
EC
TR
IC V
EH
ICL
ES
: MIR
20
21
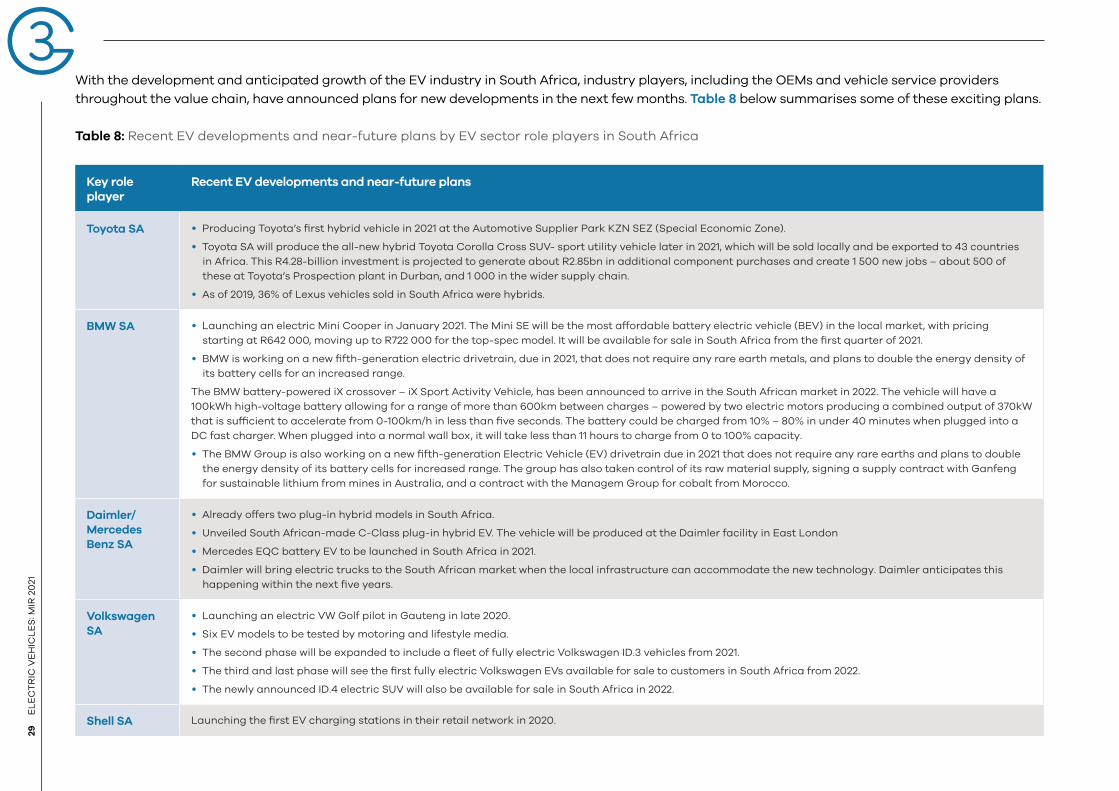
With the development and anticipated growth of the EV industry in South Africa, industry players, including the OEMs and vehicle service providers
throughout the value chain, have announced plans for new developments in the next few months. Table 8 below summarises some of these exciting plans.
Table 8: Recent EV developments and near-future plans by EV sector role players in South Africa
Key role player
Recent EV developments and near-future plans
Toyota SA • Producing Toyota’s first hybrid vehicle in 2021 at the Automotive Supplier Park KZN SEZ (Special Economic Zone).
• Toyota SA will produce the all-new hybrid Toyota Corolla Cross SUV- sport utility vehicle later in 2021, which will be sold locally and be exported to 43 countries
in Africa. This R4.28-billion investment is projected to generate about R2.85bn in additional component purchases and create 1 500 new jobs – about 500 of
these at Toyota’s Prospection plant in Durban, and 1 000 in the wider supply chain.
• As of 2019, 36% of Lexus vehicles sold in South Africa were hybrids.
BMW SA • Launching an electric Mini Cooper in January 2021. The Mini SE will be the most affordable battery electric vehicle (BEV) in the local market, with pricing
starting at R642 000, moving up to R722 000 for the top-spec model. It will be available for sale in South Africa from the first quarter of 2021.
• BMW is working on a new fifth-generation electric drivetrain, due in 2021, that does not require any rare earth metals, and plans to double the energy density of
its battery cells for an increased range.
The BMW battery-powered iX crossover – iX Sport Activity Vehicle, has been announced to arrive in the South African market in 2022. The vehicle will have a
100kWh high-voltage battery allowing for a range of more than 600km between charges – powered by two electric motors producing a combined output of 370kW
that is sufficient to accelerate from 0-100km/h in less than five seconds. The battery could be charged from 10% – 80% in under 40 minutes when plugged into a
DC fast charger. When plugged into a normal wall box, it will take less than 11 hours to charge from 0 to 100% capacity.
• The BMW Group is also working on a new fifth-generation Electric Vehicle (EV) drivetrain due in 2021 that does not require any rare earths and plans to double
the energy density of its battery cells for increased range. The group has also taken control of its raw material supply, signing a supply contract with Ganfeng
for sustainable lithium from mines in Australia, and a contract with the Managem Group for cobalt from Morocco.
Daimler/
Mercedes
Benz SA
• Already offers two plug-in hybrid models in South Africa.
• Unveiled South African-made C-Class plug-in hybrid EV. The vehicle will be produced at the Daimler facility in East London
• Mercedes EQC battery EV to be launched in South Africa in 2021.
• Daimler will bring electric trucks to the South African market when the local infrastructure can accommodate the new technology. Daimler anticipates this
happening within the next five years.
Volkswagen
SA
• Launching an electric VW Golf pilot in Gauteng in late 2020.
• Six EV models to be tested by motoring and lifestyle media.
• The second phase will be expanded to include a fleet of fully electric Volkswagen ID.3 vehicles from 2021.
• The third and last phase will see the first fully electric Volkswagen EVs available for sale to customers in South Africa from 2022.
• The newly announced ID.4 electric SUV will also be available for sale in South Africa in 2022.
Shell SA Launching the first EV charging stations in their retail network in 2020.
30
EL
EC
TR
IC V
EH
ICL
ES
: MIR
20
21
Key role player
Recent EV developments and near-future plans
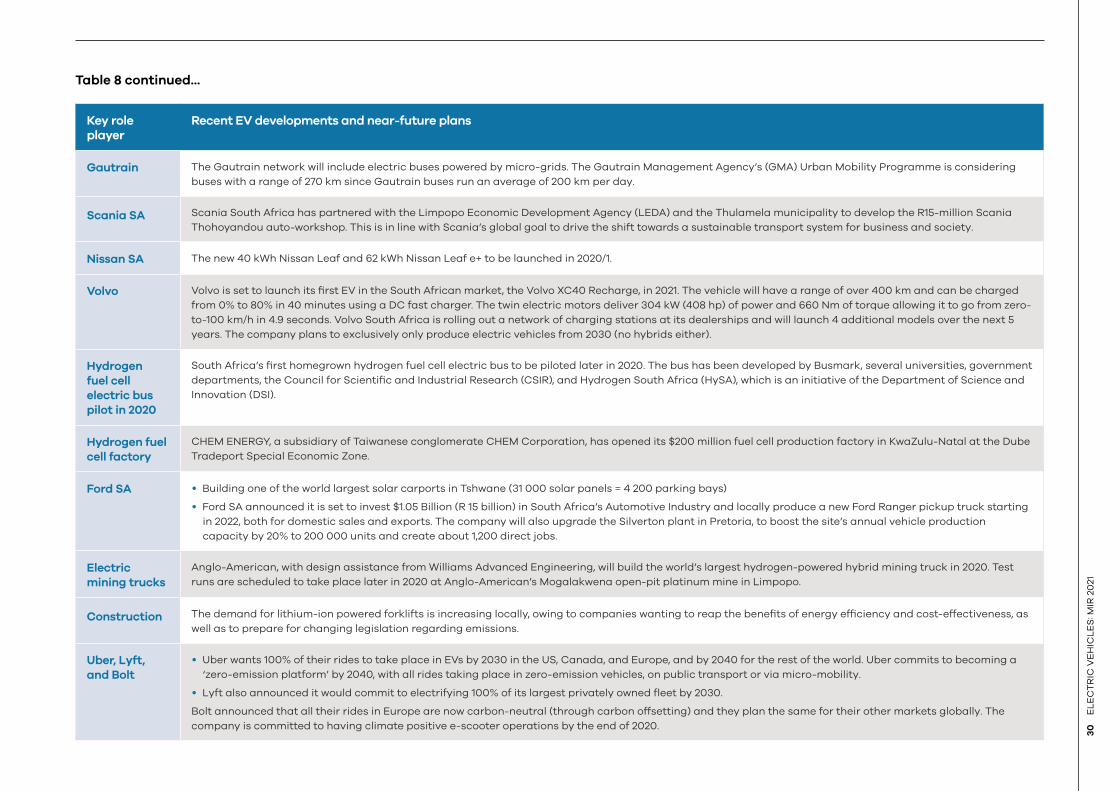
Gautrain The Gautrain network will include electric buses powered by micro-grids. The Gautrain Management Agency’s (GMA) Urban Mobility Programme is considering
buses with a range of 270 km since Gautrain buses run an average of 200 km per day.
Scania SA Scania South Africa has partnered with the Limpopo Economic Development Agency (LEDA) and the Thulamela municipality to develop the R15-million Scania
Thohoyandou auto-workshop. This is in line with Scania’s global goal to drive the shift towards a sustainable transport system for business and society.
Nissan SA The new 40 kWh Nissan Leaf and 62 kWh Nissan Leaf e+ to be launched in 2020/1.
Volvo Volvo is set to launch its first EV in the South African market, the Volvo XC40 Recharge, in 2021. The vehicle will have a range of over 400 km and can be charged
from 0% to 80% in 40 minutes using a DC fast charger. The twin electric motors deliver 304 kW (408 hp) of power and 660 Nm of torque allowing it to go from zero-
to-100 km/h in 4.9 seconds. Volvo South Africa is rolling out a network of charging stations at its dealerships and will launch 4 additional models over the next 5
years. The company plans to exclusively only produce electric vehicles from 2030 (no hybrids either).
Hydrogen
fuel cell
electric bus
pilot in 2020
South Africa’s first homegrown hydrogen fuel cell electric bus to be piloted later in 2020. The bus has been developed by Busmark, several universities, government
departments, the Council for Scientific and Industrial Research (CSIR), and Hydrogen South Africa (HySA), which is an initiative of the Department of Science and
Innovation (DSI).
Hydrogen fuel
cell factory
CHEM ENERGY, a subsidiary of Taiwanese conglomerate CHEM Corporation, has opened its $200 million fuel cell production factory in KwaZulu-Natal at the Dube
Tradeport Special Economic Zone.
Ford SA • Building one of the world largest solar carports in Tshwane (31 000 solar panels = 4 200 parking bays)
• Ford SA announced it is set to invest $1.05 Billion (R 15 billion) in South Africa’s Automotive Industry and locally produce a new Ford Ranger pickup truck starting
in 2022, both for domestic sales and exports. The company will also upgrade the Silverton plant in Pretoria, to boost the site’s annual vehicle production
capacity by 20% to 200 000 units and create about 1,200 direct jobs.
Electric
mining trucks
Anglo-American, with design assistance from Williams Advanced Engineering, will build the world’s largest hydrogen-powered hybrid mining truck in 2020. Test
runs are scheduled to take place later in 2020 at Anglo-American’s Mogalakwena open-pit platinum mine in Limpopo.
Construction The demand for lithium-ion powered forklifts is increasing locally, owing to companies wanting to reap the benefits of energy efficiency and cost-effectiveness, as
well as to prepare for changing legislation regarding emissions.
Uber, Lyft,
and Bolt
• Uber wants 100% of their rides to take place in EVs by 2030 in the US, Canada, and Europe, and by 2040 for the rest of the world. Uber commits to becoming a
‘zero-emission platform’ by 2040, with all rides taking place in zero-emission vehicles, on public transport or via micro-mobility.
• Lyft also announced it would commit to electrifying 100% of its largest privately owned fleet by 2030.
Bolt announced that all their rides in Europe are now carbon-neutral (through carbon offsetting) and they plan the same for their other markets globally. The
company is committed to having climate positive e-scooter operations by the end of 2020.
Table 8 continued...
03
31
EL
EC
TR
IC V
EH
ICL
ES
: MIR
20
21
Key role player
Recent EV developments and near-future plans
Electric
micro-
mobility –
scooters
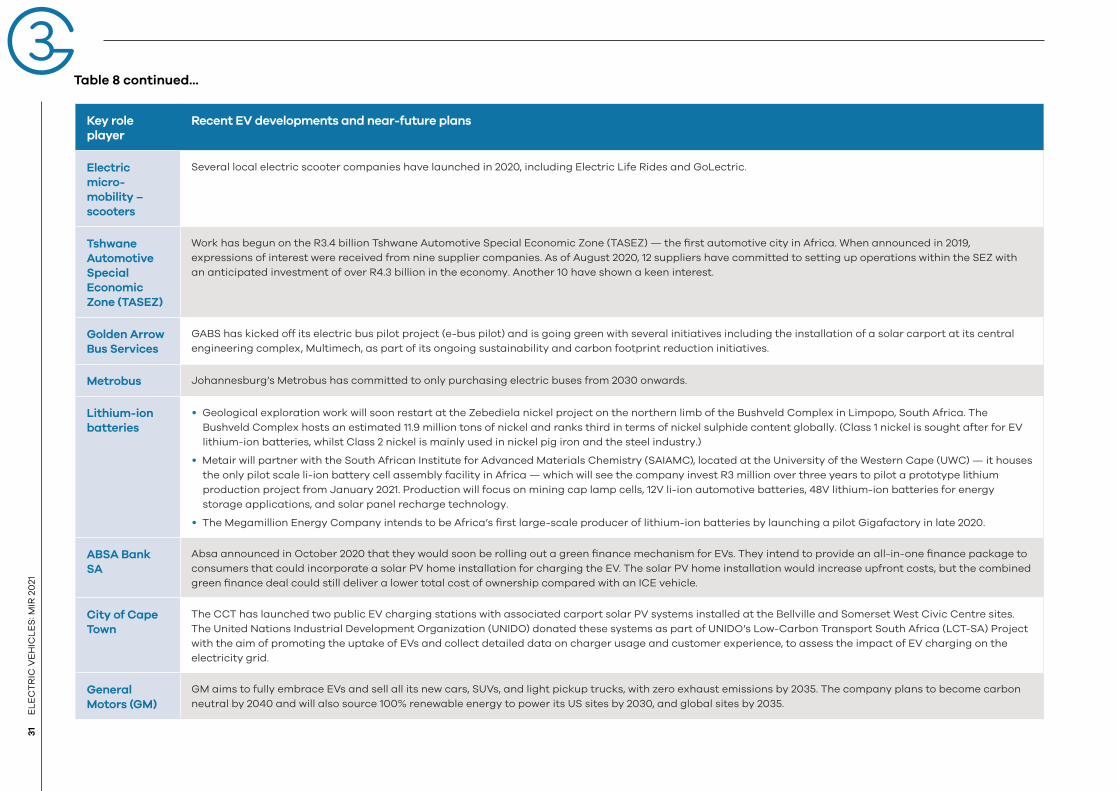
Several local electric scooter companies have launched in 2020, including Electric Life Rides and GoLectric.
Tshwane
Automotive
Special
Economic
Zone (TASEZ)
Work has begun on the R3.4 billion Tshwane Automotive Special Economic Zone (TASEZ) — the first automotive city in Africa. When announced in 2019,
expressions of interest were received from nine supplier companies. As of August 2020, 12 suppliers have committed to setting up operations within the SEZ with
an anticipated investment of over R4.3 billion in the economy. Another 10 have shown a keen interest.
Golden Arrow
Bus Services
GABS has kicked off its electric bus pilot project (e-bus pilot) and is going green with several initiatives including the installation of a solar carport at its central
engineering complex, Multimech, as part of its ongoing sustainability and carbon footprint reduction initiatives.
Metrobus Johannesburg’s Metrobus has committed to only purchasing electric buses from 2030 onwards.
Lithium-ion
batteries
• Geological exploration work will soon restart at the Zebediela nickel project on the northern limb of the Bushveld Complex in Limpopo, South Africa. The
Bushveld Complex hosts an estimated 11.9 million tons of nickel and ranks third in terms of nickel sulphide content globally. (Class 1 nickel is sought after for EV
lithium-ion batteries, whilst Class 2 nickel is mainly used in nickel pig iron and the steel industry.)
• Metair will partner with the South African Institute for Advanced Materials Chemistry (SAIAMC), located at the University of the Western Cape (UWC) — it houses
the only pilot scale li-ion battery cell assembly facility in Africa — which will see the company invest R3 million over three years to pilot a prototype lithium
production project from January 2021. Production will focus on mining cap lamp cells, 12V li-ion automotive batteries, 48V lithium-ion batteries for energy
storage applications, and solar panel recharge technology.
• The Megamillion Energy Company intends to be Africa’s first large-scale producer of lithium-ion batteries by launching a pilot Gigafactory in late 2020.
ABSA Bank
SA
Absa announced in October 2020 that they would soon be rolling out a green finance mechanism for EVs. They intend to provide an all-in-one finance package to
consumers that could incorporate a solar PV home installation for charging the EV. The solar PV home installation would increase upfront costs, but the combined
green finance deal could still deliver a lower total cost of ownership compared with an ICE vehicle.
City of Cape
Town
The CCT has launched two public EV charging stations with associated carport solar PV systems installed at the Bellville and Somerset West Civic Centre sites.
The United Nations Industrial Development Organization (UNIDO) donated these systems as part of UNIDO’s Low-Carbon Transport South Africa (LCT-SA) Project
with the aim of promoting the uptake of EVs and collect detailed data on charger usage and customer experience, to assess the impact of EV charging on the
electricity grid.
General
Motors (GM)
GM aims to fully embrace EVs and sell all its new cars, SUVs, and light pickup trucks, with zero exhaust emissions by 2035. The company plans to become carbon
neutral by 2040 and will also source 100% renewable energy to power its US sites by 2030, and global sites by 2035.
Table 8 continued...
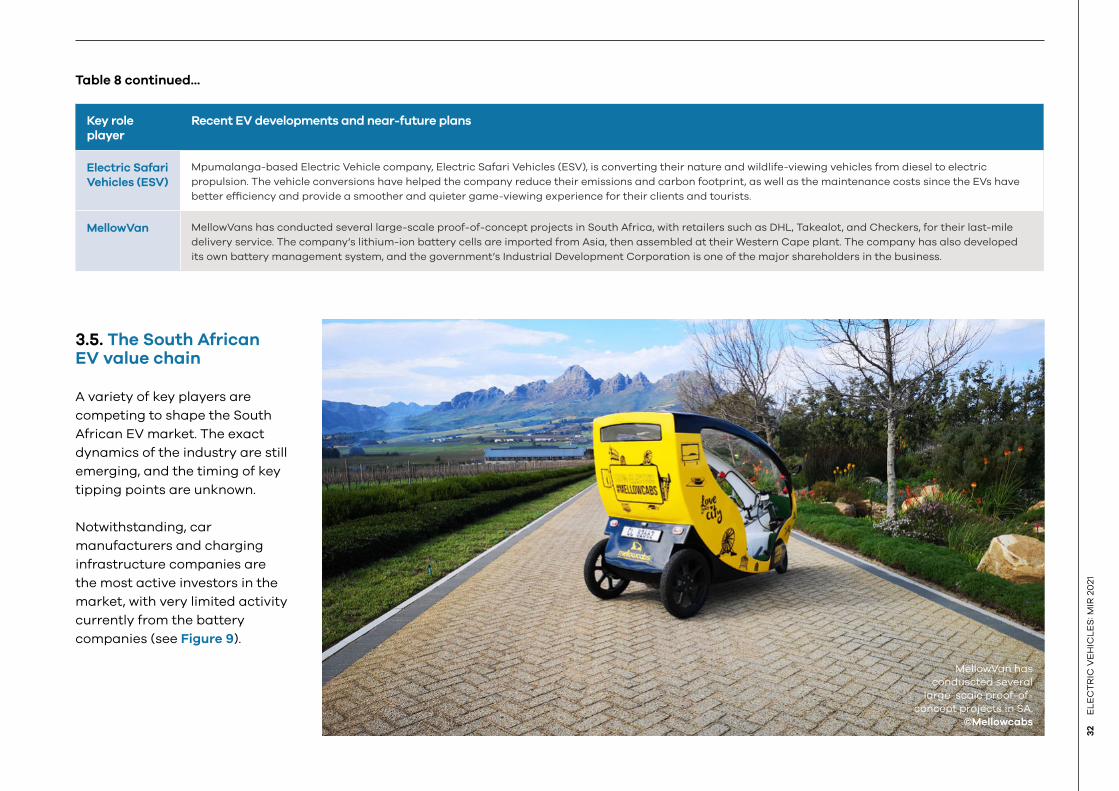
32
EL
EC
TR
IC V
EH
ICL
ES
: MIR
20
21
Key role player
Recent EV developments and near-future plans
Electric Safari
Vehicles (ESV)
Mpumalanga-based Electric Vehicle company, Electric Safari Vehicles (ESV), is converting their nature and wildlife-viewing vehicles from diesel to electric
propulsion. The vehicle conversions have helped the company reduce their emissions and carbon footprint, as well as the maintenance costs since the EVs have
better efficiency and provide a smoother and quieter game-viewing experience for their clients and tourists.
MellowVan MellowVans has conducted several large-scale proof-of-concept projects in South Africa, with retailers such as DHL, Takealot, and Checkers, for their last-mile
delivery service. The company’s lithium-ion battery cells are imported from Asia, then assembled at their Western Cape plant. The company has also developed
its own battery management system, and the government’s Industrial Development Corporation is one of the major shareholders in the business.
Table 8 continued...
3.5. The South African EV value chain
A variety of key players are
competing to shape the South
African EV market. The exact
dynamics of the industry are still
emerging, and the timing of key
tipping points are unknown.
Notwithstanding, car
manufacturers and charging
infrastructure companies are
the most active investors in the
market, with very limited activity
currently from the battery
companies (see Figure 9).
MellowVan has
conduscted several
large-scale proof-of-
concept projects in SA.
©Mellowcabs
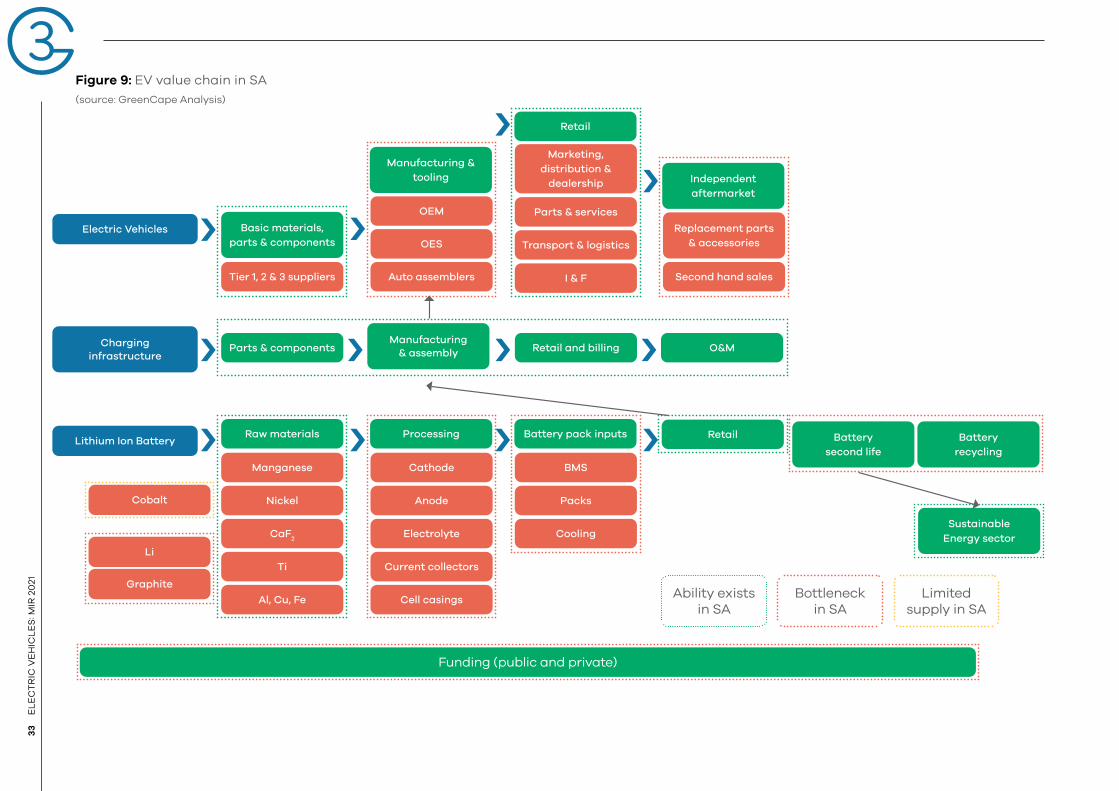
03
33
EL
EC
TR
IC V
EH
ICL
ES
: MIR
20
21
Tier 1, 2 & 3 suppliers
Basic materials,
parts & components
Auto assemblers
Retail
Parts & services
Transport & logistics
I & F
Marketing,
distribution &
dealership Independent
aftermarket
Second hand sales
Replacement parts
& accessories
Cobalt
Li
Graphite
Manganese
Nickel
CaF2
Ti
Al, Cu, Fe
Cathode
Anode
Electrolyte
Current collectors
Cell casings
Packs
BMS
CoolingSustainable
Energy sector
Battery
recycling
Battery
second life
Retail
OEM
OES
Manufacturing &
tooling
Figure 9: EV value chain in SA
(source: GreenCape Analysis)
Funding (public and private)
Manufacturing
& assembly
Electric Vehicles
Charging
infrastructure
Processing Battery pack inputs
Ability exists in SA
Bottleneck in SA
Limited supply in SA
Lithium Ion BatteryRaw materials
Parts & components Retail and billing O&M

34
EL
EC
TR
IC V
EH
ICL
ES
: MIR
20
21
The BMW i3.
©BMW South Africa
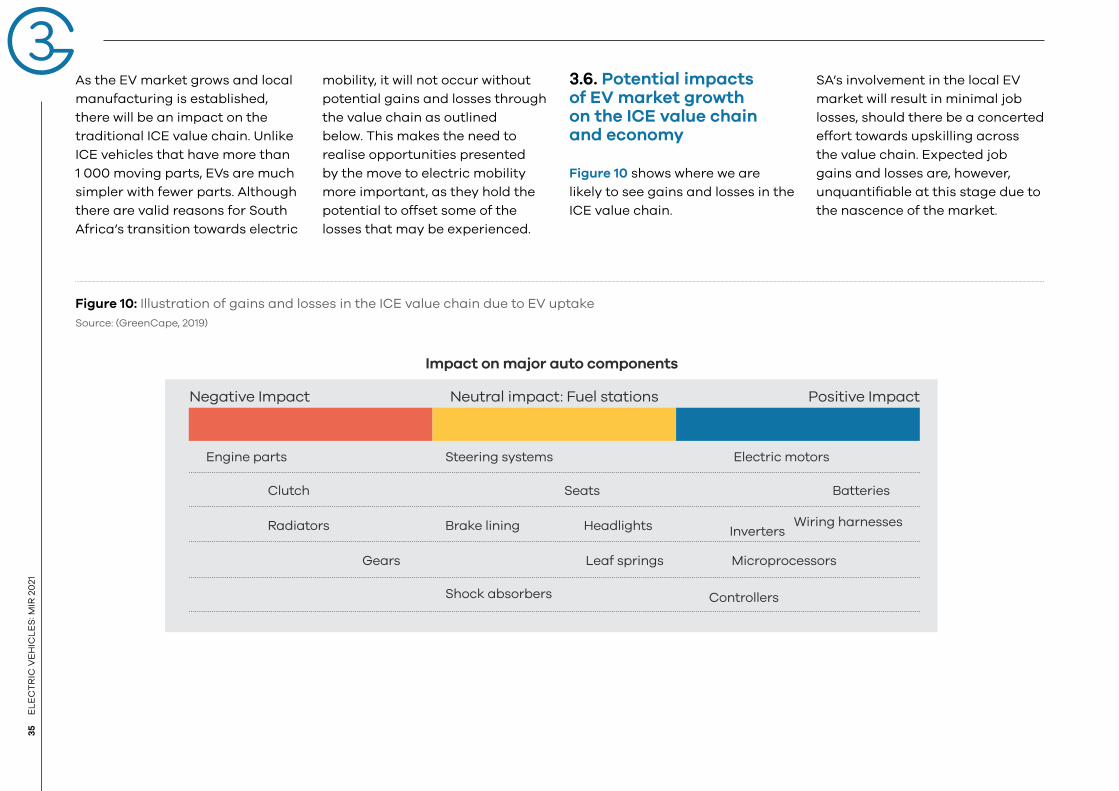
03
35
EL
EC
TR
IC V
EH
ICL
ES
: MIR
20
21
As the EV market grows and local
manufacturing is established,
there will be an impact on the
traditional ICE value chain. Unlike
ICE vehicles that have more than
1 000 moving parts, EVs are much
simpler with fewer parts. Although
there are valid reasons for South
Africa’s transition towards electric
mobility, it will not occur without
potential gains and losses through
the value chain as outlined
below. This makes the need to
realise opportunities presented
by the move to electric mobility
more important, as they hold the
potential to offset some of the
losses that may be experienced.
3.6. Potential impacts of EV market growth on the ICE value chain and economy
Figure 10 shows where we are
likely to see gains and losses in the
ICE value chain.
SA’s involvement in the local EV
market will result in minimal job
losses, should there be a concerted
effort towards upskilling across
the value chain. Expected job
gains and losses are, however,
unquantifiable at this stage due to
the nascence of the market.
Negative Impact
Engine parts Steering systems
Shock absorbers
Electric motors
Controllers
Clutch Seats Batteries
Radiators Brake lining
Gears Leaf springs Microprocessors
Headlights InvertersWiring harnesses
Neutral impact: Fuel stations
Impact on major auto components
Positive Impact
Figure 10: Illustration of gains and losses in the ICE value chain due to EV uptake
Source: (GreenCape, 2019)
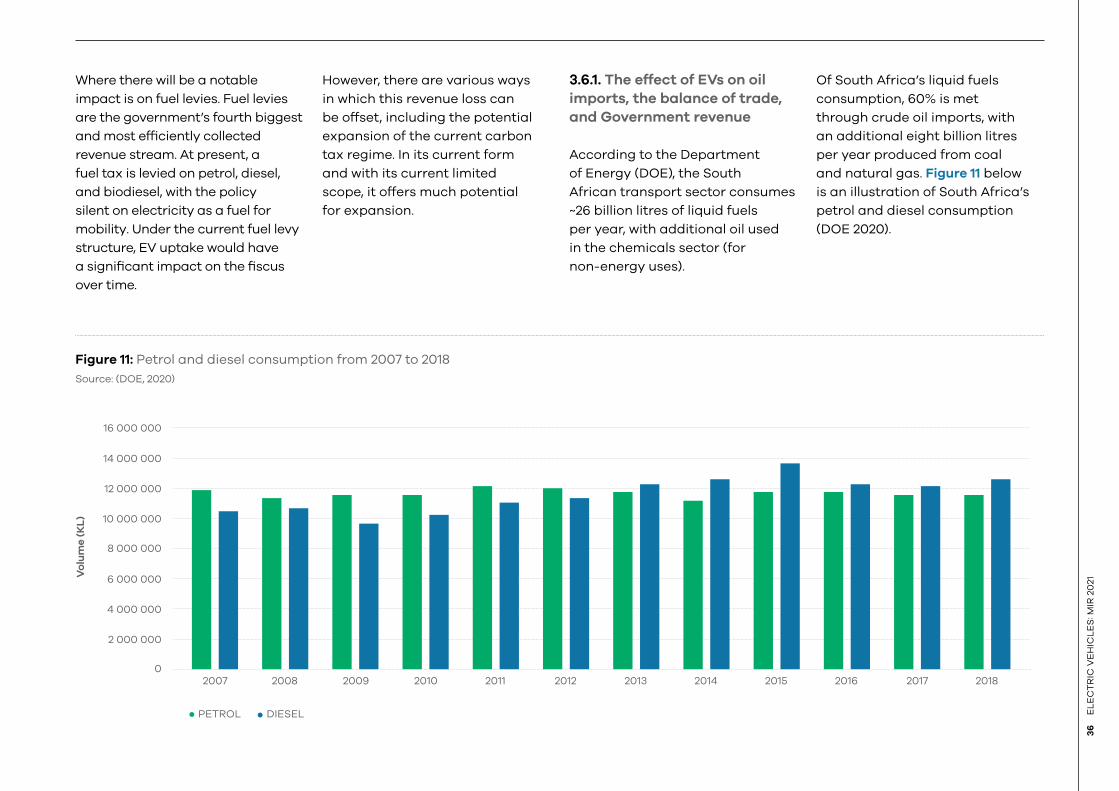
36
EL
EC
TR
IC V
EH
ICL
ES
: MIR
20
21
Where there will be a notable
impact is on fuel levies. Fuel levies
are the government’s fourth biggest
and most efficiently collected
revenue stream. At present, a
fuel tax is levied on petrol, diesel,
and biodiesel, with the policy
silent on electricity as a fuel for
mobility. Under the current fuel levy
structure, EV uptake would have
a significant impact on the fiscus
over time.
However, there are various ways
in which this revenue loss can
be offset, including the potential
expansion of the current carbon
tax regime. In its current form
and with its current limited
scope, it offers much potential
for expansion.
3.6.1. The effect of EVs on oil
imports, the balance of trade,
and Government revenue
According to the Department
of Energy (DOE), the South
African transport sector consumes
~26 billion litres of liquid fuels
per year, with additional oil used
in the chemicals sector (for
non-energy uses).
Of South Africa’s liquid fuels
consumption, 60% is met
through crude oil imports, with
an additional eight billion litres
per year produced from coal
and natural gas. Figure 11 below
is an illustration of South Africa’s
petrol and diesel consumption
(DOE 2020).
Figure 11: Petrol and diesel consumption from 2007 to 2018
Source: (DOE, 2020)
2009 2010 2011 2012 2013 2014 2015 2016 2017 2018
Vo
lum
e (
KL
)
2 000 000
4 000 000
6 000 000
8 000 000
10 000 000
12 000 000
14 000 000
16 000 000
02007 2008
PETROL DIESEL
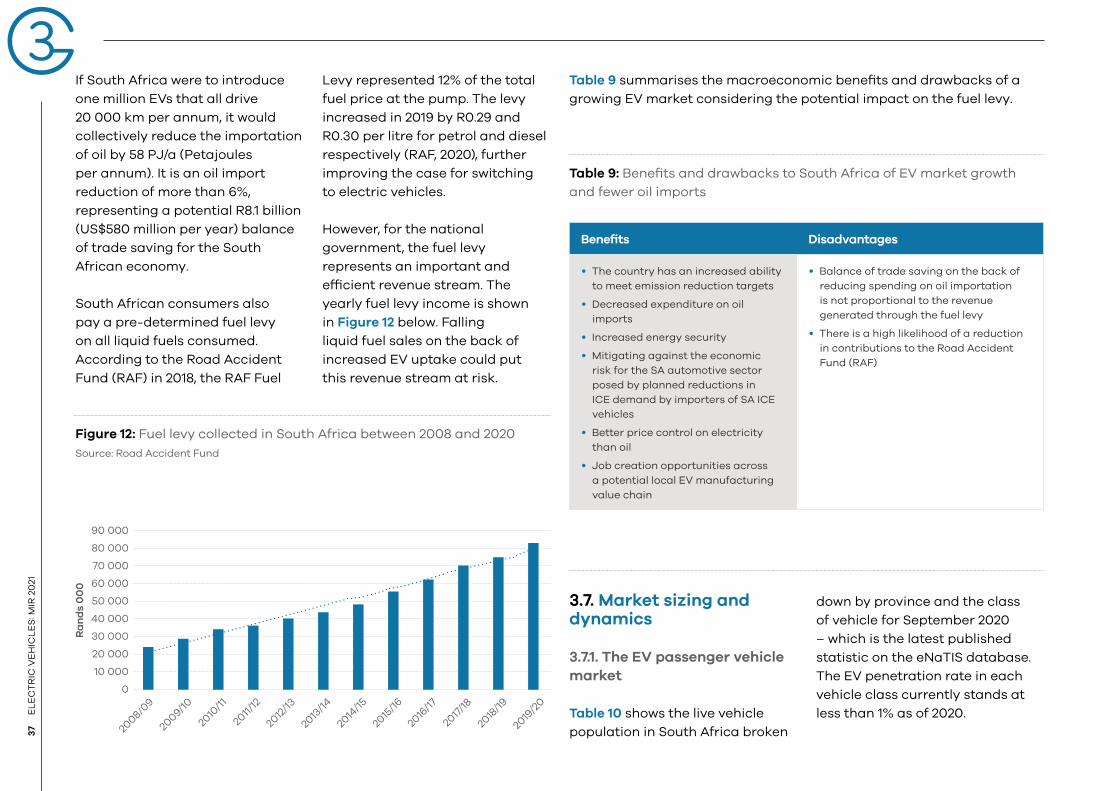
03
37
EL
EC
TR
IC V
EH
ICL
ES
: MIR
20
21
If South Africa were to introduce
one million EVs that all drive
20 000 km per annum, it would
collectively reduce the importation
of oil by 58 PJ/a (Petajoules
per annum). It is an oil import
reduction of more than 6%,
representing a potential R8.1 billion
(US$580 million per year) balance
of trade saving for the South
African economy.
South African consumers also
pay a pre-determined fuel levy
on all liquid fuels consumed.
According to the Road Accident
Fund (RAF) in 2018, the RAF Fuel
Levy represented 12% of the total
fuel price at the pump. The levy
increased in 2019 by R0.29 and
R0.30 per litre for petrol and diesel
respectively (RAF, 2020), further
improving the case for switching
to electric vehicles.
However, for the national
government, the fuel levy
represents an important and
efficient revenue stream. The
yearly fuel levy income is shown
in Figure 12 below. Falling
liquid fuel sales on the back of
increased EV uptake could put
this revenue stream at risk.
Figure 12: Fuel levy collected in South Africa between 2008 and 2020
Source: Road Accident Fund
Ra
nd
s 0
00
10 000
20 000
30 000
40 000
50 000
60 000
70 000
80 000
90 000
0
2008/0
9
2018
/19
2017
/18
2016
/17
2015
/16
2014
/15
2013
/14
2012
/13
2011/1
2
2010
/11
2009/1
0
2019
/20
Table 9 summarises the macroeconomic benefits and drawbacks of a
growing EV market considering the potential impact on the fuel levy.
Table 9: Benefits and drawbacks to South Africa of EV market growth
and fewer oil imports
Benefits Disadvantages
• The country has an increased ability
to meet emission reduction targets
• Decreased expenditure on oil
imports
• Increased energy security
• Mitigating against the economic
risk for the SA automotive sector
posed by planned reductions in
ICE demand by importers of SA ICE
vehicles
• Better price control on electricity
than oil
• Job creation opportunities across
a potential local EV manufacturing
value chain
• Balance of trade saving on the back of
reducing spending on oil importation
is not proportional to the revenue
generated through the fuel levy
• There is a high likelihood of a reduction
in contributions to the Road Accident
Fund (RAF)
3.7. Market sizing and dynamics
3.7.1. The EV passenger vehicle
market
Table 10 shows the live vehicle
population in South Africa broken
down by province and the class
of vehicle for September 2020
– which is the latest published
statistic on the eNaTIS database.
The EV penetration rate in each
vehicle class currently stands at
less than 1% as of 2020.
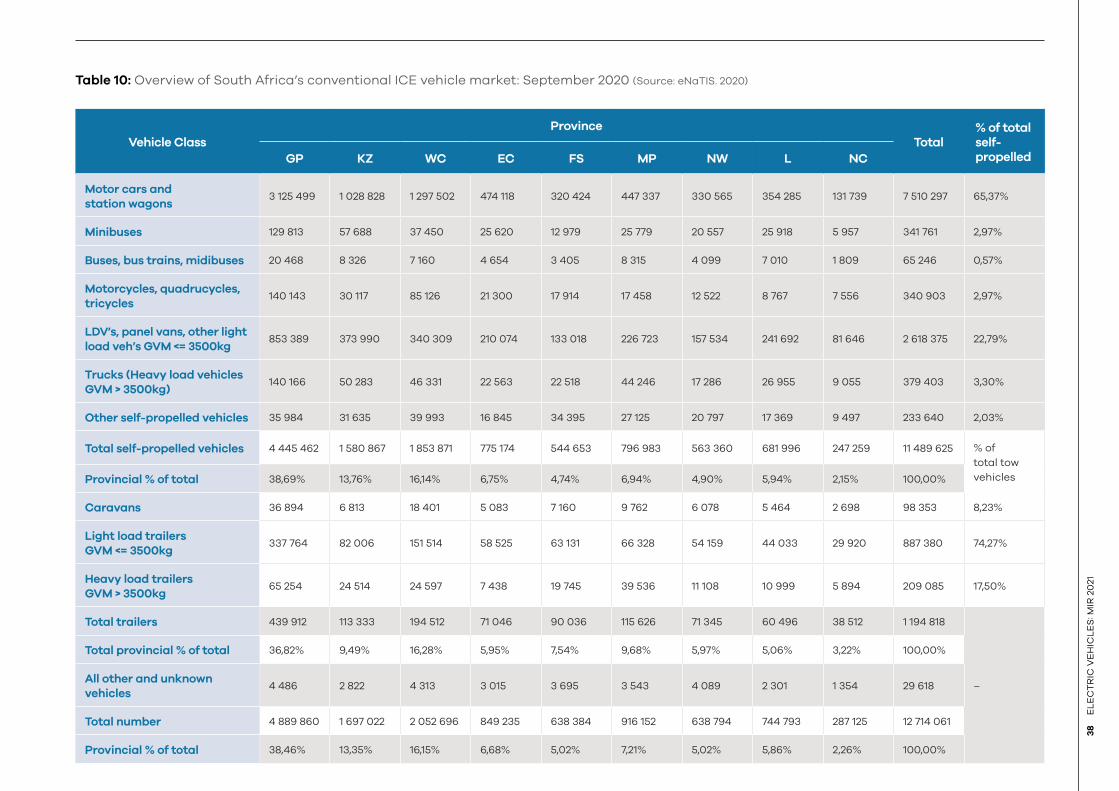
38
EL
EC
TR
IC V
EH
ICL
ES
: MIR
20
21
Table 10: Overview of South Africa’s conventional ICE vehicle market: September 2020 (Source: eNaTIS. 2020)
Vehicle Class
Province
Total% of total self-propelledGP KZ WC EC FS MP NW L NC
Motor cars and
station wagons3 125 499 1 028 828 1 297 502 474 118 320 424 447 337 330 565 354 285 131 739 7 510 297 65,37%
Minibuses 129 813 57 688 37 450 25 620 12 979 25 779 20 557 25 918 5 957 341 761 2,97%
Buses, bus trains, midibuses 20 468 8 326 7 160 4 654 3 405 8 315 4 099 7 010 1 809 65 246 0,57%
Motorcycles, quadrucycles,
tricycles140 143 30 117 85 126 21 300 17 914 17 458 12 522 8 767 7 556 340 903 2,97%
LDV’s, panel vans, other light
load veh’s GVM <= 3500kg853 389 373 990 340 309 210 074 133 018 226 723 157 534 241 692 81 646 2 618 375 22,79%
Trucks (Heavy load vehicles
GVM > 3500kg)140 166 50 283 46 331 22 563 22 518 44 246 17 286 26 955 9 055 379 403 3,30%
Other self-propelled vehicles 35 984 31 635 39 993 16 845 34 395 27 125 20 797 17 369 9 497 233 640 2,03%
Total self-propelled vehicles 4 445 462 1 580 867 1 853 871 775 174 544 653 796 983 563 360 681 996 247 259 11 489 625 % of
total tow
vehiclesProvincial % of total 38,69% 13,76% 16,14% 6,75% 4,74% 6,94% 4,90% 5,94% 2,15% 100,00%
Caravans 36 894 6 813 18 401 5 083 7 160 9 762 6 078 5 464 2 698 98 353 8,23%
Light load trailers
GVM <= 3500kg337 764 82 006 151 514 58 525 63 131 66 328 54 159 44 033 29 920 887 380 74,27%
Heavy load trailers
GVM > 3500kg65 254 24 514 24 597 7 438 19 745 39 536 11 108 10 999 5 894 209 085 17,50%
Total trailers 439 912 113 333 194 512 71 046 90 036 115 626 71 345 60 496 38 512 1 194 818
–
Total provincial % of total 36,82% 9,49% 16,28% 5,95% 7,54% 9,68% 5,97% 5,06% 3,22% 100,00%
All other and unknown
vehicles4 486 2 822 4 313 3 015 3 695 3 543 4 089 2 301 1 354 29 618
Total number 4 889 860 1 697 022 2 052 696 849 235 638 384 916 152 638 794 744 793 287 125 12 714 061
Provincial % of total 38,46% 13,35% 16,15% 6,68% 5,02% 7,21% 5,02% 5,86% 2,26% 100,00%
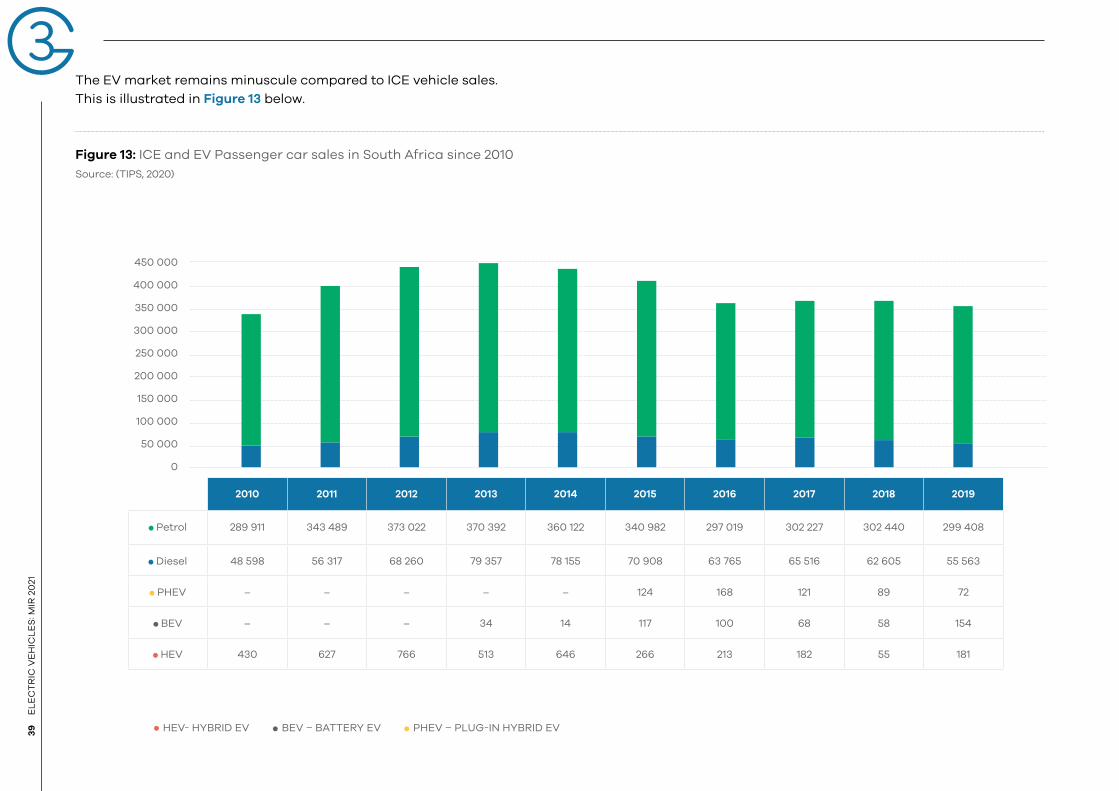
03
39
EL
EC
TR
IC V
EH
ICL
ES
: MIR
20
21
The EV market remains minuscule compared to ICE vehicle sales.
This is illustrated in Figure 13 below.
Figure 13: ICE and EV Passenger car sales in South Africa since 2010
Source: (TIPS, 2020)
50 000
100 000
150 000
200 000
250 000
300 000
350 000
400 000
450 000
LEGEND: HEV- HYBRID EV; BEV – BATTERY EV; PHEV – PLUG-IN HYBRID EV
2010 2011 2012 2013 2014 2015 2016 2017 2018 2019
Petrol 289 911 343 489 373 022 370 392 360 122 340 982 297 019 302 227 302 440 299 408
Diesel 48 598 56 317 68 260 79 357 78 155 70 908 63 765 65 516 62 605 55 563
PHEV – – – – – 124 168 121 89 72
BEV – – – 34 14 117 100 68 58 154
HEV 430 627 766 513 646 266 213 182 55 181
0
HEV- HYBRID EV BEV – BATTERY EV PHEV – PLUG-IN HYBRID EV
40
EL
EC
TR
IC V
EH
ICL
ES
: MIR
20
21
3.7.2. The public and industrial
EV market
It is expected that public transport
will soon follow a similar trend to
the one seen in passenger vehicles.
The bus industry, bus rapid transit
(BRT), local municipal buses, and
the minibus taxi industry present
a good business case for the
electrification of transportation
in South Africa (See Section 5 for
details on this opportunity).
As shown in Table 10 above, as
of September 2020, there are 341
761 minibuses, and 65 246 buses,
minibuses and bus trains in South
Africa. This adds up to a total of
407 007 public transport vehicles
in SA, representing 3.54% of the
total self-propelled vehicles in
the country. This represents
the potential market for public
transport electrification.
This potential business case is
driven by:
• peak travel patterns (when and
where people travel)
• long-standing/idle times that
coincide with current AC
charging times
• reduced operation and
maintenance costs across
bus/minibus fleets over ICE
technology.
The challenge in this market,
as is the case with all EVs in SA
at present, is financing for the
significant capital price difference
between ICE vehicles and EVs, and
charging infrastructure investment.
Electrification of the forklift market
is also expected to improve based
on ‘fit for purpose’ technology
improvements. Where heavy-duty
vehicles are concerned, the push for
freight to rail is a more immediate
need, and is expected to take
precedence over electrification.
The 19C-1E excavator in the UK is
the world’s first volume-produced
fully electric digger that has
shown it is possible to make
powerful construction machinery
without an internal combustion
engine. To date, the current fleet
has saved the equivalent of 15 100
kg in CO2 emissions across 5 616
hours of work.
Electric micromobility such as
electric scooters (e-scooter) are
witnessing high growth over the
past year. As outlined in Table 8,
several local electric scooter
companies have launched in 2020.
Last-mile delivery LDV is similarly
experiencing a surge in market
demand, particularly during the
Covid-19 lockdown periods.
Despite the barriers, automotive
vehicle manufacturers see value in
SA’s nascent EV market and expect
a diversified EV mix as passenger
vehicles continue to be purchased
year-on-year. Forklifts and two- and
three-wheeled EVs gain traction
within the industrial segment, and
interest in the electrification of
public transport is increasing.
3.7.3. Charging infrastructure
and network
It is widely accepted that having
charging stations in locations that
commuters can easily access is
key to the adoption and growth
of the EV market. In South Africa,
the network currently consists of
~250 publicly accessible charging
stations. This means that there
is one public charging station
for four EVs in the country. Thus
the charging infrastructure is
ahead of the demand. South
Africa also has a vast fuel station
network that could potentially be
modified to integrate EV charging;
they then become hybrid fuel/
charging stations.
Many of these charging stations
are found in Gauteng. They are
largely AC charging stations that
take up to six hours to arrive at full
charge. Figure 14 shows active and
incoming charging infrastructure
stations in the country.

03
41
EL
EC
TR
IC V
EH
ICL
ES
: MIR
20
21
Figure 14: Active and incoming charging infrastructure stations in SA
(PlugShare, 2020)
Battery electric vehicles (BEVs)
would create extra demand for
energy on the electricity grid,
especially if the charging is
uncoordinated. For instance, a 2015
study done by the CSIR projected
a gradual increase in the uptake of
EVs in Cape Town.
According to the study, by 2050
EVs are projected to account
for almost half of all vehicles
in Cape Town, as illustrated in
Figure 15. The study found that
this projected uptake in EVs would
lead to an 11% increase in the total
energy consumption in the City of
Cape Town by 2050, as shown in
Figure 16 (CSIR, 2015).
Figure 15: Projected uptake of EVs in Cape Town
Source: (CSIR, 2015)
PUBLIC CHARGING STATION STATIONS THAT HAVE RESTRICTED
ACCESS OR ARE UNDER MAINTENANCE
Nu
mb
er
of
lig
ht
pa
sse
ng
er
ve
hic
les
500 000
1 000 000
1 500 000
2 000 000
2 500 000
3 000 000
02012 2020 2025 2030 2035 2040 2045 2050
ELECTRIC VEHICLES ICE VEHICLES
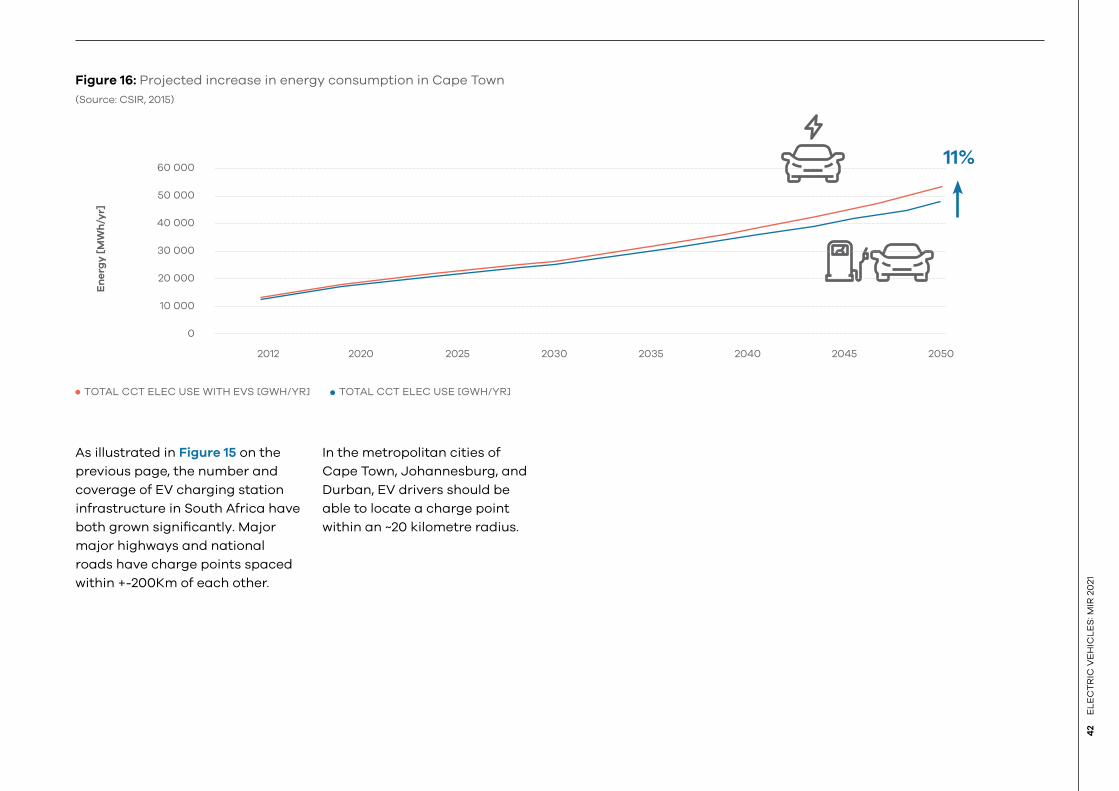
42
EL
EC
TR
IC V
EH
ICL
ES
: MIR
20
21
Figure 16: Projected increase in energy consumption in Cape Town
(Source: CSIR, 2015)
TOTAL CCT ELEC USE WITH EVS [GWH/YR] TOTAL CCT ELEC USE [GWH/YR]
En
erg
y [
MW
h/y
r]
0
30 000
40 000
50 000
60 000
10 000
20 000
2012 2020 2025 2030 2035 2040 2045 2050
11%
As illustrated in Figure 15 on the
previous page, the number and
coverage of EV charging station
infrastructure in South Africa have
both grown significantly. Major
major highways and national
roads have charge points spaced
within +-200Km of each other.
In the metropolitan cities of
Cape Town, Johannesburg, and
Durban, EV drivers should be
able to locate a charge point
within an ~20 kilometre radius.
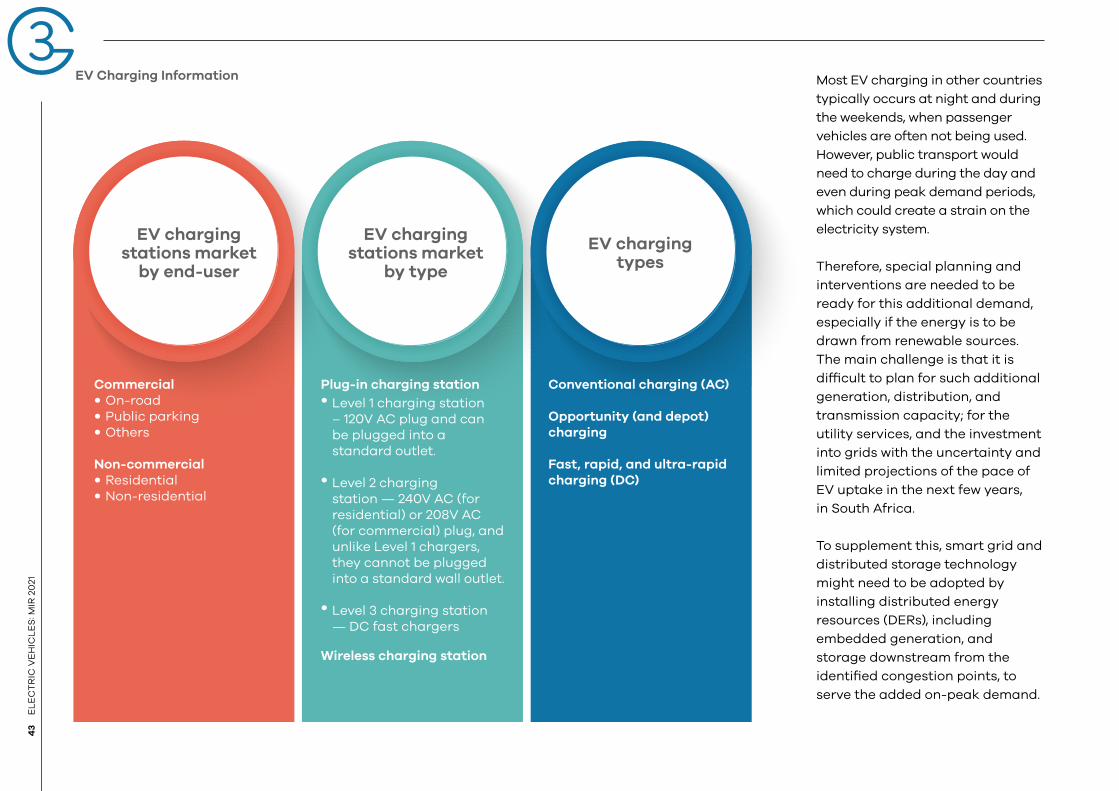
03
43
EL
EC
TR
IC V
EH
ICL
ES
: MIR
20
21
Commercial
• On-road
• Public parking
• Others
Non-commercial
• Residential
• Non-residential
Plug-in charging station
• Level 1 charging station
– 120V AC plug and can
be plugged into a
standard outlet.
• Level 2 charging
station — 240V AC (for
residential) or 208V AC
(for commercial) plug, and
unlike Level 1 chargers,
they cannot be plugged
into a standard wall outlet.
• Level 3 charging station
— DC fast chargers
Wireless charging station
Conventional charging (AC)
Opportunity (and depot)
charging
Fast, rapid, and ultra-rapid
charging (DC)
EV charging stations market
by end-user
EV charging stations market
by type
EV charging types
EV Charging Information Most EV charging in other countries
typically occurs at night and during
the weekends, when passenger
vehicles are often not being used.
However, public transport would
need to charge during the day and
even during peak demand periods,
which could create a strain on the
electricity system.
Therefore, special planning and
interventions are needed to be
ready for this additional demand,
especially if the energy is to be
drawn from renewable sources.
The main challenge is that it is
difficult to plan for such additional
generation, distribution, and
transmission capacity; for the
utility services, and the investment
into grids with the uncertainty and
limited projections of the pace of
EV uptake in the next few years,
in South Africa.
To supplement this, smart grid and
distributed storage technology
might need to be adopted by
installing distributed energy
resources (DERs), including
embedded generation, and
storage downstream from the
identified congestion points, to
serve the added on-peak demand.

44
EL
EC
TR
IC V
EH
ICL
ES
: MIR
20
21
This distributed storage can
then be recharged at night when
demand is low, which has the
added benefit of smoothening
demand and lowering peaks in
the electricity demand profile.
GreenCape’s 2021 Energy Services
Market Intelligence Report
explores DERs in great detail.
The charging market is segmented
on the connector type: CHArge de
MOve (CHAdeMO) and Combined
Charging System (CCS), with
Nissan using the former and BMW
the latter. A broader breakdown of
the charging standards employed
by automotive companies in SA is
shown in Table 11.
Globally, however, as of October
2020, the number of EVs sold
that are equipped with the
international CHAdeMO charging
standard crossed the one million
mark. This makes CHAdeMO the
second most popular DC fast-
charging system globally, after
China’s GB/T system.
A third of all EVs sold in Europe
are fitted with the CHAdeMO
technology. It is available in 90
countries with 20 EV manufacturers
around the world producing
CHAdeMO-equipped and capable
vehicles (uYilo, 2020). South Africa
does not yet have any locally
available CHAdeMO charging
standard manufactured EVs.
Jaguar i-Pace at
charging station.
©Jaguar South Africa
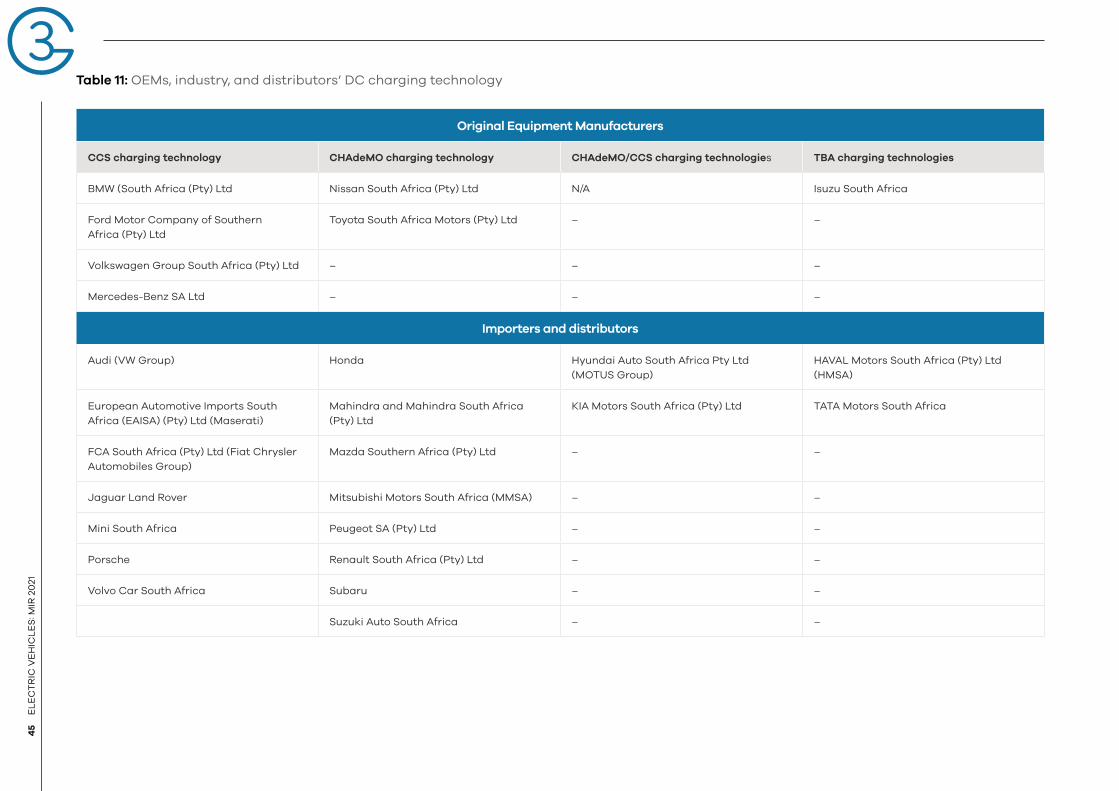
03
45
EL
EC
TR
IC V
EH
ICL
ES
: MIR
20
21
Table 11: OEMs, industry, and distributors’ DC charging technology
Original Equipment Manufacturers
CCS charging technology CHAdeMO charging technology CHAdeMO/CCS charging technologies TBA charging technologies
BMW (South Africa (Pty) Ltd Nissan South Africa (Pty) Ltd N/A Isuzu South Africa
Ford Motor Company of Southern
Africa (Pty) Ltd
Toyota South Africa Motors (Pty) Ltd – –
Volkswagen Group South Africa (Pty) Ltd – – –
Mercedes-Benz SA Ltd – – –
Importers and distributors
Audi (VW Group) Honda Hyundai Auto South Africa Pty Ltd
(MOTUS Group)
HAVAL Motors South Africa (Pty) Ltd
(HMSA)
European Automotive Imports South
Africa (EAISA) (Pty) Ltd (Maserati)
Mahindra and Mahindra South Africa
(Pty) Ltd
KIA Motors South Africa (Pty) Ltd TATA Motors South Africa
FCA South Africa (Pty) Ltd (Fiat Chrysler
Automobiles Group)
Mazda Southern Africa (Pty) Ltd – –
Jaguar Land Rover Mitsubishi Motors South Africa (MMSA) – –
Mini South Africa Peugeot SA (Pty) Ltd – –
Porsche Renault South Africa (Pty) Ltd – –
Volvo Car South Africa Subaru – –
Suzuki Auto South Africa – –
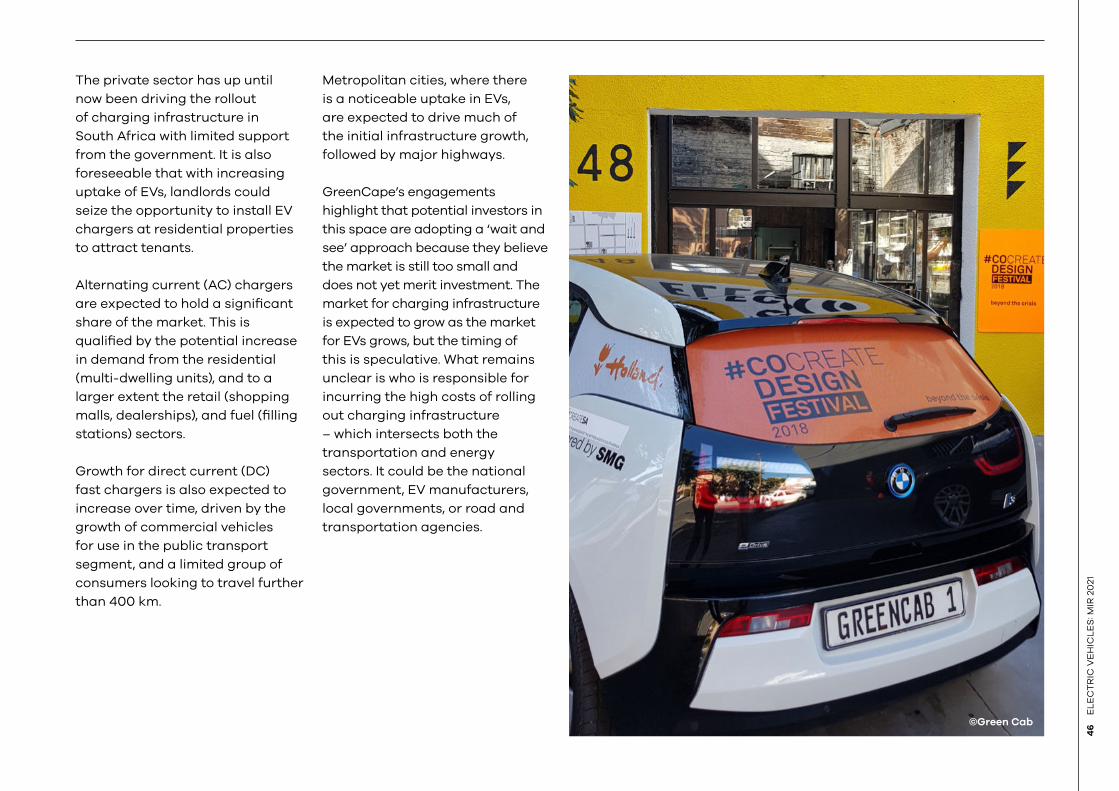
46
EL
EC
TR
IC V
EH
ICL
ES
: MIR
20
21
The private sector has up until
now been driving the rollout
of charging infrastructure in
South Africa with limited support
from the government. It is also
foreseeable that with increasing
uptake of EVs, landlords could
seize the opportunity to install EV
chargers at residential properties
to attract tenants.
Alternating current (AC) chargers
are expected to hold a significant
share of the market. This is
qualified by the potential increase
in demand from the residential
(multi-dwelling units), and to a
larger extent the retail (shopping
malls, dealerships), and fuel (filling
stations) sectors.
Growth for direct current (DC)
fast chargers is also expected to
increase over time, driven by the
growth of commercial vehicles
for use in the public transport
segment, and a limited group of
consumers looking to travel further
than 400 km.
Metropolitan cities, where there
is a noticeable uptake in EVs,
are expected to drive much of
the initial infrastructure growth,
followed by major highways.
GreenCape’s engagements
highlight that potential investors in
this space are adopting a ‘wait and
see’ approach because they believe
the market is still too small and
does not yet merit investment. The
market for charging infrastructure
is expected to grow as the market
for EVs grows, but the timing of
this is speculative. What remains
unclear is who is responsible for
incurring the high costs of rolling
out charging infrastructure
– which intersects both the
transportation and energy
sectors. It could be the national
government, EV manufacturers,
local governments, or road and
transportation agencies.
©Green Cab
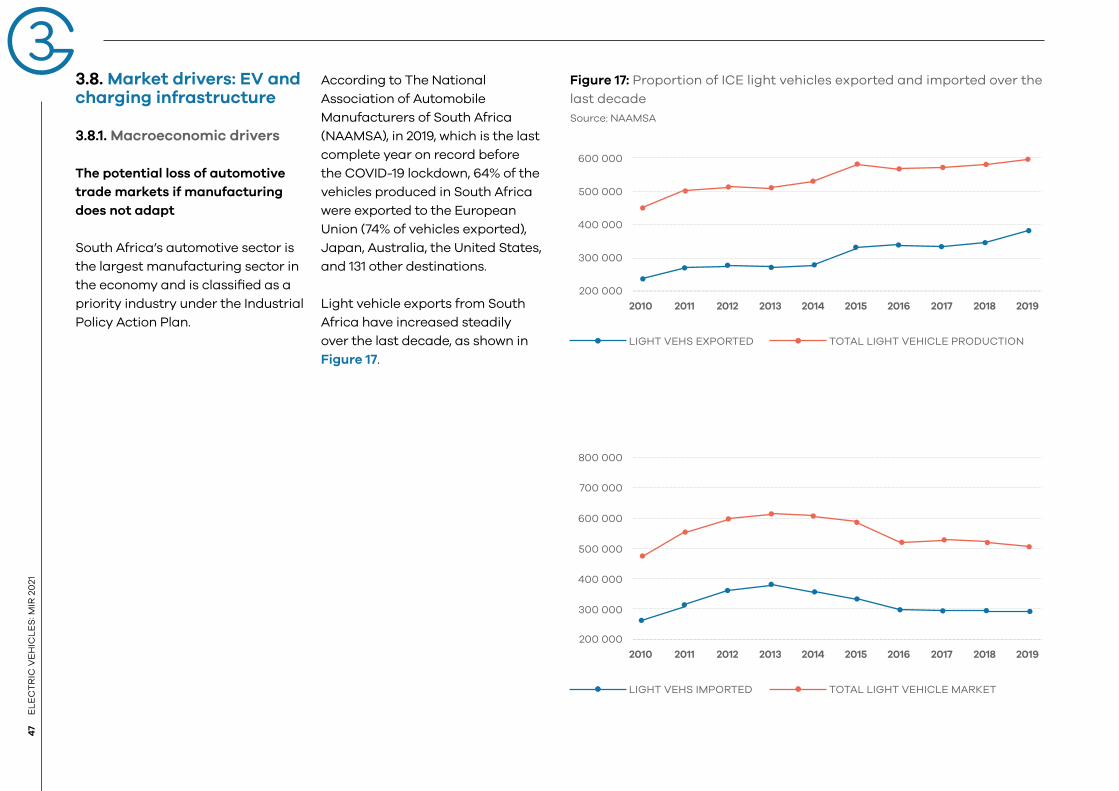
03
47
EL
EC
TR
IC V
EH
ICL
ES
: MIR
20
21
Figure 17: Proportion of ICE light vehicles exported and imported over the
last decade
Source: NAAMSA
200 000
300 000
400 000
500 000
600 000
2010 2011 2012 2013 2014 2015 2016 2017 2018 2019
LIGHT VEHS EXPORTED TOTAL LIGHT VEHICLE PRODUCTION
200 000
300 000
400 000
500 000
600 000
700 000
800 000
2010 2011 2012 2013 2014 2015 2016 2017 2018 2019
LIGHT VEHS IMPORTED TOTAL LIGHT VEHICLE MARKET
3.8. Market drivers: EV and charging infrastructure
3.8.1. Macroeconomic drivers
The potential loss of automotive
trade markets if manufacturing
does not adapt
South Africa’s automotive sector is
the largest manufacturing sector in
the economy and is classified as a
priority industry under the Industrial
Policy Action Plan.
According to The National
Association of Automobile
Manufacturers of South Africa
(NAAMSA), in 2019, which is the last
complete year on record before
the COVID-19 lockdown, 64% of the
vehicles produced in South Africa
were exported to the European
Union (74% of vehicles exported),
Japan, Australia, the United States,
and 131 other destinations.
Light vehicle exports from South
Africa have increased steadily
over the last decade, as shown in
Figure 17.
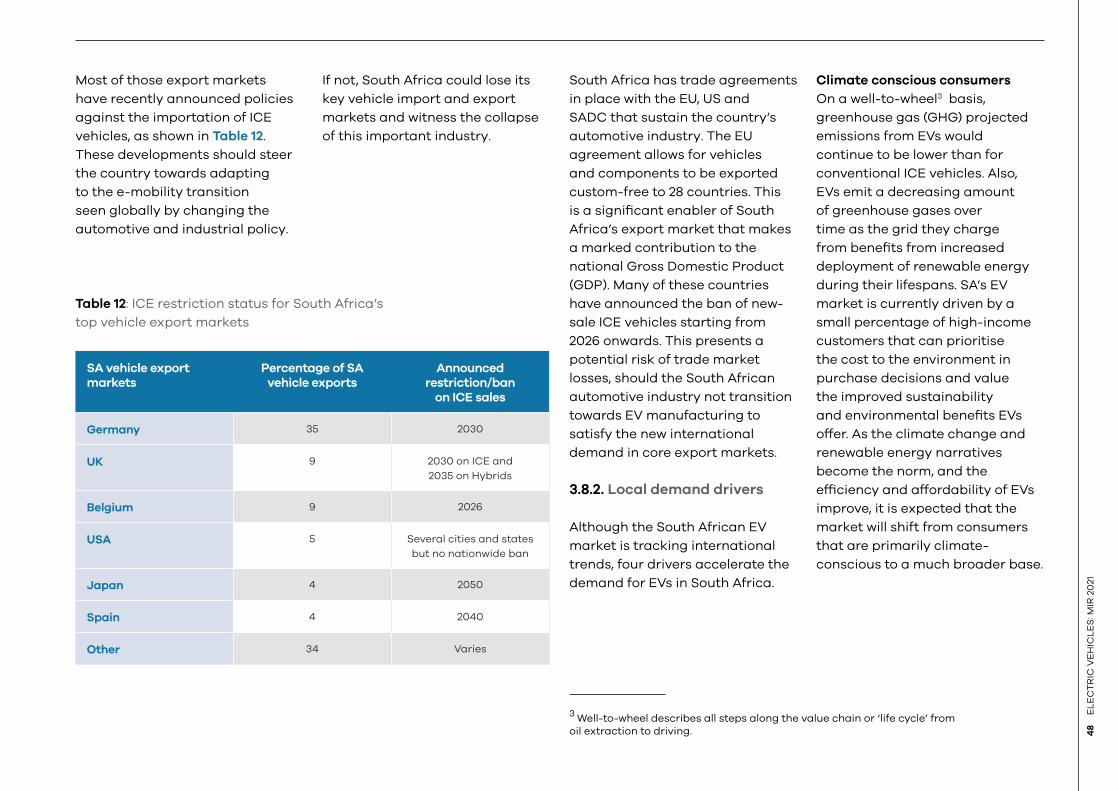
48
EL
EC
TR
IC V
EH
ICL
ES
: MIR
20
21
Most of those export markets
have recently announced policies
against the importation of ICE
vehicles, as shown in Table 12.
These developments should steer
the country towards adapting
to the e-mobility transition
seen globally by changing the
automotive and industrial policy.
If not, South Africa could lose its
key vehicle import and export
markets and witness the collapse
of this important industry.
Table 12: ICE restriction status for South Africa’s
top vehicle export markets
SA vehicle export markets
Percentage of SA vehicle exports
Announced restriction/ban
on ICE sales
Germany 35 2030
UK 9 2030 on ICE and
2035 on Hybrids
Belgium 9 2026
USA 5 Several cities and states
but no nationwide ban
Japan 4 2050
Spain 4 2040
Other 34 Varies
South Africa has trade agreements
in place with the EU, US and
SADC that sustain the country’s
automotive industry. The EU
agreement allows for vehicles
and components to be exported
custom-free to 28 countries. This
is a significant enabler of South
Africa’s export market that makes
a marked contribution to the
national Gross Domestic Product
(GDP). Many of these countries
have announced the ban of new-
sale ICE vehicles starting from
2026 onwards. This presents a
potential risk of trade market
losses, should the South African
automotive industry not transition
towards EV manufacturing to
satisfy the new international
demand in core export markets.
3.8.2. Local demand drivers
Although the South African EV
market is tracking international
trends, four drivers accelerate the
demand for EVs in South Africa.
3 Well-to-wheel describes all steps along the value chain or ‘life cycle’ from
oil extraction to driving.
Climate conscious consumers
On a well-to-wheel3 basis,
greenhouse gas (GHG) projected
emissions from EVs would
continue to be lower than for
conventional ICE vehicles. Also,
EVs emit a decreasing amount
of greenhouse gases over
time as the grid they charge
from benefits from increased
deployment of renewable energy
during their lifespans. SA’s EV
market is currently driven by a
small percentage of high-income
customers that can prioritise
the cost to the environment in
purchase decisions and value
the improved sustainability
and environmental benefits EVs
offer. As the climate change and
renewable energy narratives
become the norm, and the
efficiency and affordability of EVs
improve, it is expected that the
market will shift from consumers
that are primarily climate-
conscious to a much broader base.
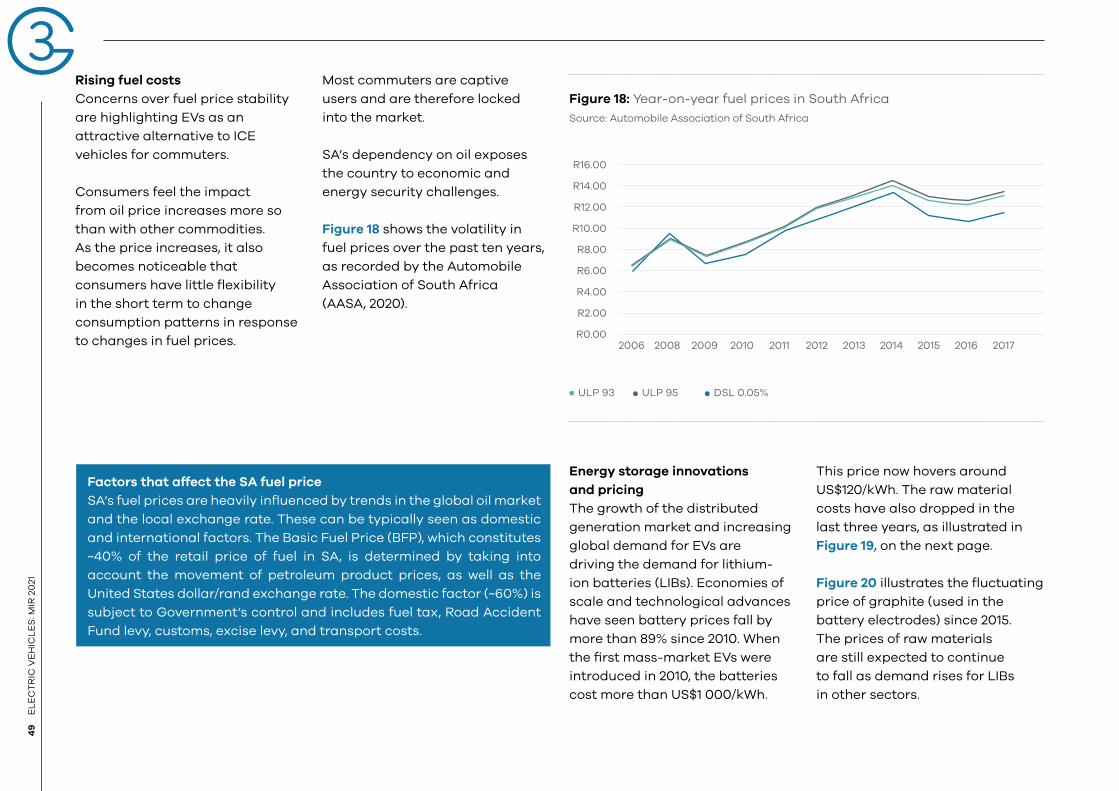
03
49
EL
EC
TR
IC V
EH
ICL
ES
: MIR
20
21
Rising fuel costs
Concerns over fuel price stability
are highlighting EVs as an
attractive alternative to ICE
vehicles for commuters.
Consumers feel the impact
from oil price increases more so
than with other commodities.
As the price increases, it also
becomes noticeable that
consumers have little flexibility
in the short term to change
consumption patterns in response
to changes in fuel prices.
Most commuters are captive
users and are therefore locked
into the market.
SA’s dependency on oil exposes
the country to economic and
energy security challenges.
Figure 18 shows the volatility in
fuel prices over the past ten years,
as recorded by the Automobile
Association of South Africa
(AASA, 2020).
Figure 18: Year-on-year fuel prices in South Africa
Source: Automobile Association of South Africa
Factors that affect the SA fuel price
SA’s fuel prices are heavily influenced by trends in the global oil market
and the local exchange rate. These can be typically seen as domestic
and international factors. The Basic Fuel Price (BFP), which constitutes
~40% of the retail price of fuel in SA, is determined by taking into
account the movement of petroleum product prices, as well as the
United States dollar/rand exchange rate. The domestic factor (~60%) is
subject to Government’s control and includes fuel tax, Road Accident
Fund levy, customs, excise levy, and transport costs.
Energy storage innovations
and pricing
The growth of the distributed
generation market and increasing
global demand for EVs are
driving the demand for lithium-
ion batteries (LIBs). Economies of
scale and technological advances
have seen battery prices fall by
more than 89% since 2010. When
the first mass-market EVs were
introduced in 2010, the batteries
cost more than US$1 000/kWh.
This price now hovers around
US$120/kWh. The raw material
costs have also dropped in the
last three years, as illustrated in
Figure 19, on the next page.
Figure 20 illustrates the fluctuating
price of graphite (used in the
battery electrodes) since 2015.
The prices of raw materials
are still expected to continue
to fall as demand rises for LIBs
in other sectors.
R0.00
R2.00
R4.00
R10.00
R12.00
R14.00
R16.00
R6.00
R8.00
2006 2008 2009 2010 2011 2012 2013 2014 2015 2016 2017
ULP 93 ULP 95 DSL 0.05%
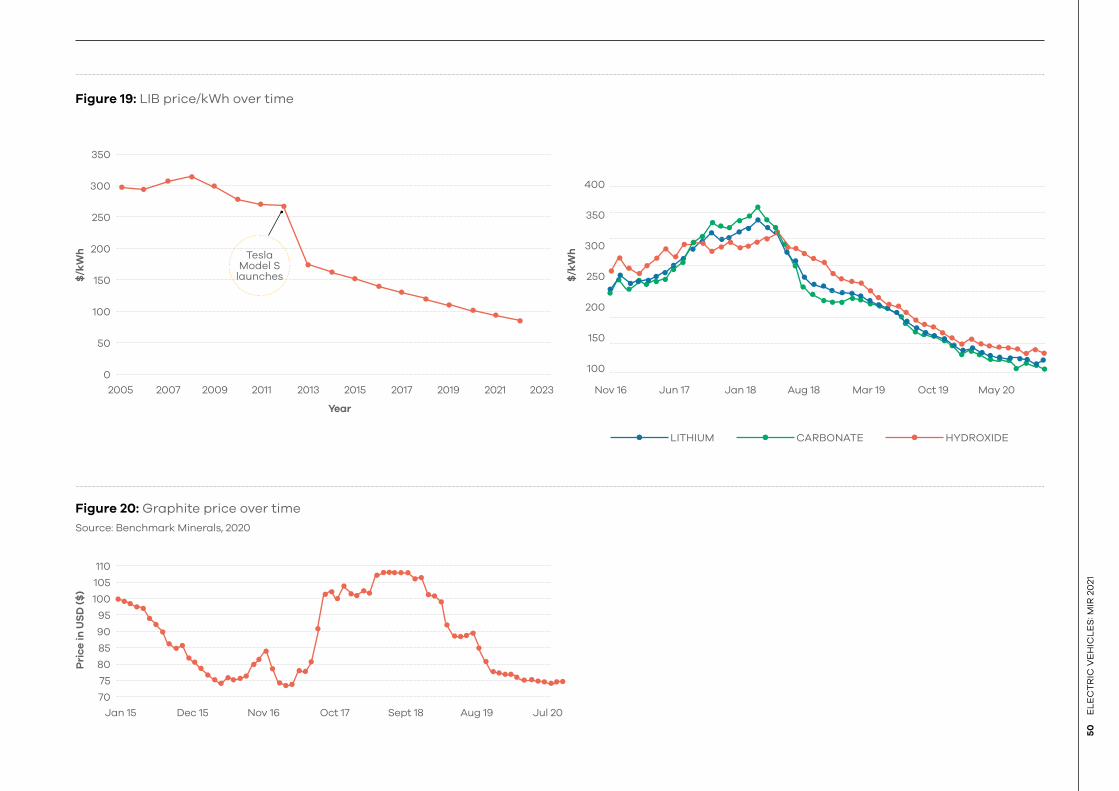
50
EL
EC
TR
IC V
EH
ICL
ES
: MIR
20
21
Figure 19: LIB price/kWh over time
Figure 20: Graphite price over time
Source: Benchmark Minerals, 2020
0
50
100
150
200
250
300
350
2005 2007 2009 2011 2013 2015 2017 2019 2021 2023
Year
$/k
Wh
Pri
ce
in
US
D (
$)
$/k
WhTesla
Model S launches
70
75
80
85
90
95
100
105
110
Jan 15 Dec 15 Nov 16 Oct 17 Sept 18 Aug 19 Jul 20
Nov 16 Jun 17 Jan 18 Aug 18 Mar 19 Oct 19 May 20
100
150
200
250
300
350
400
LITHIUM HYDROXIDECARBONATE
03
51
EL
EC
TR
IC V
EH
ICL
ES
: MIR
20
21
Falling cost of EVs
Currently, batteries make up
between 40% and 50% of the
total cost of an EV. Falling battery
prices, as discussed above, means
that EVs may be cost-comparable
with ICE vehicles by the middle of
the decade (~$125/kWh to $150/
kWh is the range in which price
parity may be achieved). It is
at this point that the business
case for owning EVs moves from
operational cost savings to include
capital price savings.
Reduced range anxiety
The limited driving range of
EVs is one of the key reasons
for prospective buyers not to
buy them. While most of the
charging happens at home for
private vehicles, consumers
want the comfort of knowing
they can safely travel on a
single charge. Improvements in
battery management systems
have resulted in batteries with a
significantly higher driving range,
approximately 150 km to 400 km.
As the South African EV market
continues to develop, the following
will have to be considered with a
view to growing the EV industry:
• Technology advances are
delivering substantial cost cuts.
Key enablers are developments
in battery chemistry, and
expansion of production capacity
in assembly and manufacturing
plants, locally and internationally.
• Policies play a critical role.
Leading countries in electric
mobility use a variety of
economic measures to bridge
the cost gap between electric
and conventional vehicles, and
support the deployment of
charging infrastructure.
• Renewed focus on raw materials
supply. The EV uptake and
related battery production
requirements imply a bigger
demand for new materials in the
automotive sector.
• Changes to the tax revenue
base derived from vehicle
and fuel taxes.
2020 National EV Perception Survey
A 2020 national EV perception survey conducted on over 3 000 car
buyers on South Africa’s biggest automotive marketplace over 12
months has found that 1.8% of the respondents have owned an EV, 13%
have driven one, and 68% would want to own one in future. The majority
of the respondents, 86%, would be open to using an EV as their primary
vehicle, rather than as a second vehicle.
The unavailability of public and home charging infrastructure (61%),
charging times (59.6%), and cost (55%), were cited by the respondents
as the biggest barriers to EV ownership in South Africa.
Reduced emissions (80.5%), reduced noise pollution (63.9%), and cheaper
running costs (54.7%) were the top three cited advantages of EVs.
An interesting finding was that most of the respondents aged 18-34 said
they were more likely to purchase an EV in the next five years, while those
aged 55+ were thinking of purchasing an EV within the next three years.
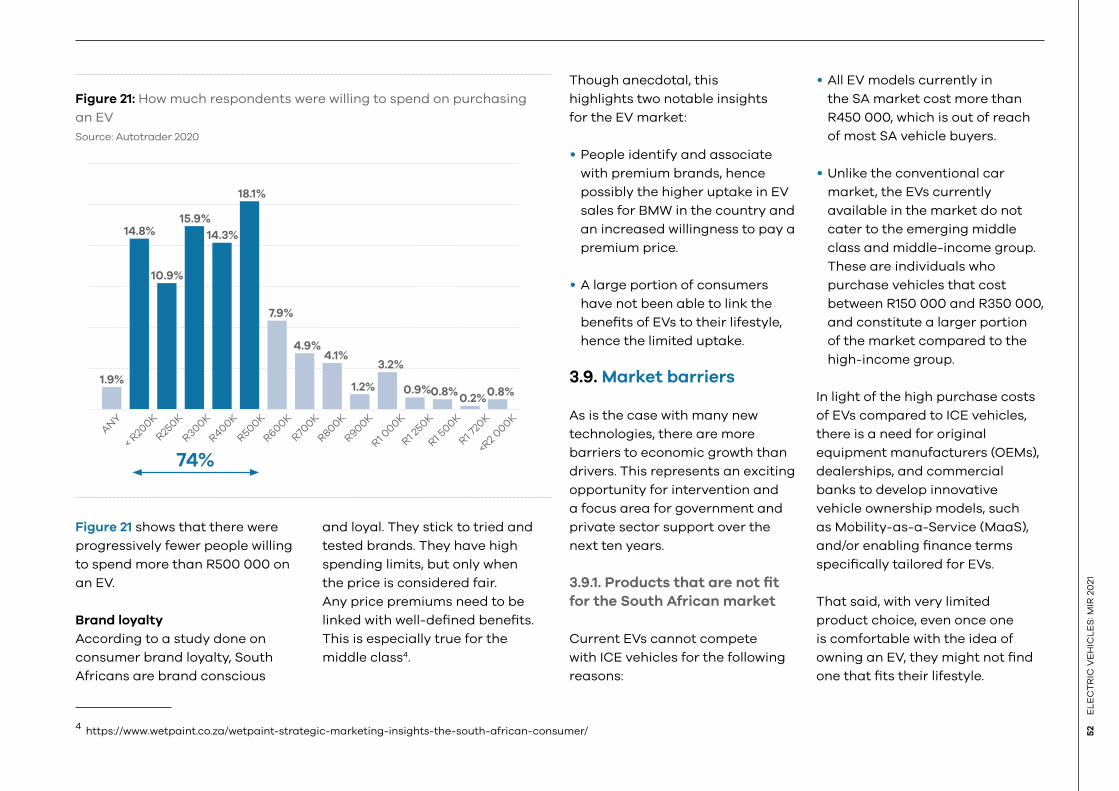
52
EL
EC
TR
IC V
EH
ICL
ES
: MIR
20
21
Figure 21 shows that there were
progressively fewer people willing
to spend more than R500 000 on
an EV.
Brand loyalty
According to a study done on
consumer brand loyalty, South
Africans are brand conscious
4 https://www.wetpaint.co.za/wetpaint-strategic-marketing-insights-the-south-african-consumer/
and loyal. They stick to tried and
tested brands. They have high
spending limits, but only when
the price is considered fair.
Any price premiums need to be
linked with well-defined benefits.
This is especially true for the
middle class4.
Though anecdotal, this
highlights two notable insights
for the EV market:
• People identify and associate
with premium brands, hence
possibly the higher uptake in EV
sales for BMW in the country and
an increased willingness to pay a
premium price.
• A large portion of consumers
have not been able to link the
benefits of EVs to their lifestyle,
hence the limited uptake.
3.9. Market barriers
As is the case with many new
technologies, there are more
barriers to economic growth than
drivers. This represents an exciting
opportunity for intervention and
a focus area for government and
private sector support over the
next ten years.
3.9.1. Products that are not fit
for the South African market
Current EVs cannot compete
with ICE vehicles for the following
reasons:
• All EV models currently in
the SA market cost more than
R450 000, which is out of reach
of most SA vehicle buyers.
• Unlike the conventional car
market, the EVs currently
available in the market do not
cater to the emerging middle
class and middle-income group.
These are individuals who
purchase vehicles that cost
between R150 000 and R350 000,
and constitute a larger portion
of the market compared to the
high-income group.
In light of the high purchase costs
of EVs compared to ICE vehicles,
there is a need for original
equipment manufacturers (OEMs),
dealerships, and commercial
banks to develop innovative
vehicle ownership models, such
as Mobility-as-a-Service (MaaS),
and/or enabling finance terms
specifically tailored for EVs.
That said, with very limited
product choice, even once one
is comfortable with the idea of
owning an EV, they might not find
one that fits their lifestyle.
Figure 21: How much respondents were willing to spend on purchasing
an EV
Source: Autotrader 2020
AN
Y
< R20
0K
R250K
R300K
R400K
R500K
R600K
R700K
R800K
R900K
R1 000K
R1 250K
R1 500K
R1 720
K
<R2
000K
1.9%
14.8%
10.9%
15.9%
14.3%
18.1%
74%
7.9%
4.9%4.1%
1.2%
3.2%
0.9%0.8%0.2%
0.8%
03
53
EL
EC
TR
IC V
EH
ICL
ES
: MIR
20
21
As a result, some brands that
currently have a high market
share in the ICE vehicle market
have a much lower share of the
EV market. Ultimately, the
production cost of EVs would
reduce significantly with
economies of scale volume
increases. For this increased
production to happen, there
is a need to facilitate local
demand for EVs.
3.9.2. High import duties
Even with the overall cost of EVs
falling due to decreasing battery
prices, the cost of EVs remains
high relative to ICE vehicles.
In South Africa, one of the key
reasons for this is the high import
duties imposed on EVs.
Currently, EVs are subjected to
25% import duties, while buses
and trucks carry a 20% duty. In
comparison, ICE vehicles incur 18%
import duties. EVs are also more
likely to incur ad valorem 5 tax
based on their classification as a
luxury good, while their high price
tag contributes to ad valorem
being a large amount of money.
5 An ad valorem tax is a tax whose amount is based on the value of a transaction or of property.
Ad valorem tax ranges up to a
maximum of 30%, based on the
vehicle price (SARS, 2020) (current
EV products on average work out
at around 17%). This means that in
practice the total taxes on EVs and
hybrids average around 42%.
In 2018, the International Trade
Administration Commission
(ITAC) rejected an application
for a reduction in the general
rate of customs duty applicable
to EVs. The rationale was that
this was meant to support local
manufacturing of EVs, and vehicle
manufacturers could already
offset customs duty through
the Automotive Production and
Development Programme (APDP).
The dtic is in negotiations with
the EU to reduce the import tariff
on EVs down from 25%. In return,
South Africa will increase the import
tariff on vehicles with an engine
size smaller than 1 000 cc, which
currently stands at 0% to 18%. These
vehicles hold a large segment of
the new vehicle market and are
not produced in South Africa. The
timelines of an outcome from these
negotiations are yet unknown.
BMW has also applied to the ITAC
for the reduction of import duties
to stimulate vehicles sales. The
application was for a reduction
in duties on imported EVs to 0%
for three years, with a subsequent
increase to 10%. The outcome of
this application was unsuccessful.
To reduce the upfront cost of
EVs, the only options are to either
reduce VAT or the ad valorem
excise duty - which is a tax based
on the price of the product. It is
however a complex balancing-
act to justify reducing VAT on EVs,
which still carry the perception
of being targeted at middle and
higher income segments of the
population, on account of the high
cost of EVs. One must also consider
the opportunity cost of a reduction
on VAT which would have been used
for alternative purposes.
3.9.3. Lack of policy certainty
and support for EVs
The incumbent automotive
sector works effectively because
investors have the comfort of
longstanding policy certainty and
government support, as outlined
in the Automotive Production and
Development Programme (APDP).
While there are enabling policy
frameworks in place to support
ICE vehicle manufacturing, those
policies have not been adapted
to incorporate EV manufacturing.
As such, the current lack of
policy directives on local EV
manufacturing presents an
investment risk to the country.
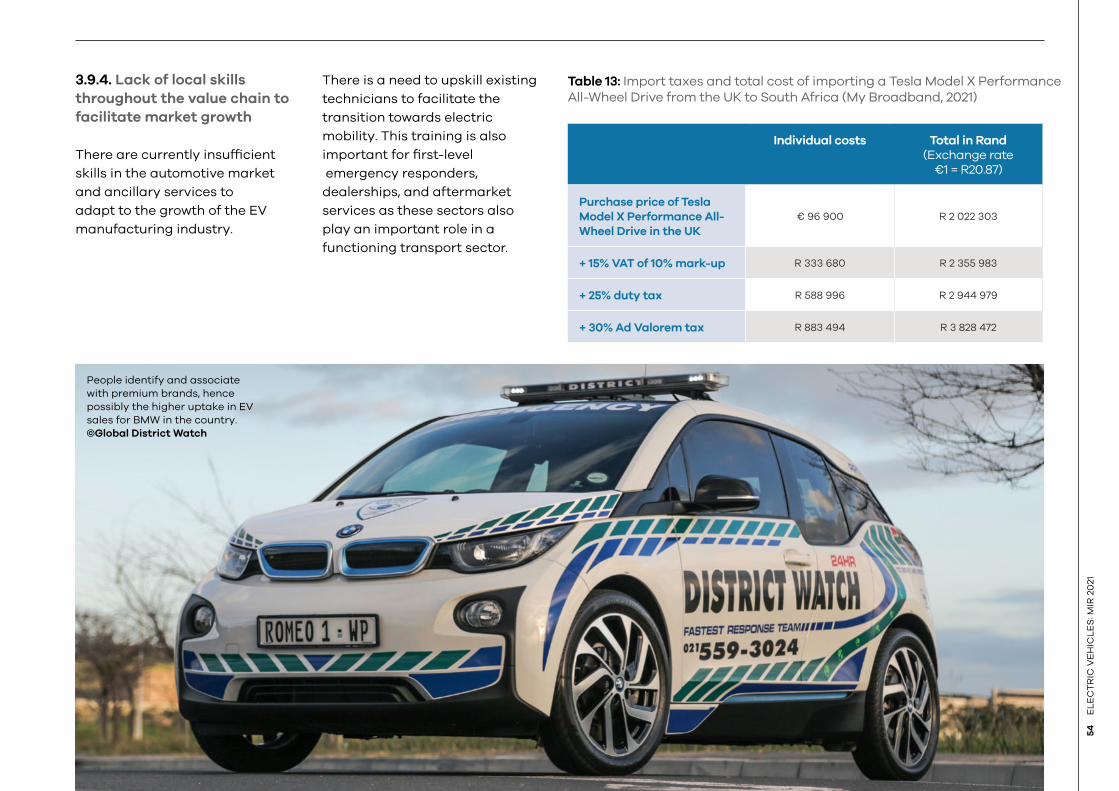
54
EL
EC
TR
IC V
EH
ICL
ES
: MIR
20
21
People identify and associate
with premium brands, hence
possibly the higher uptake in EV
sales for BMW in the country.
©Global District Watch
Table 13: Import taxes and total cost of importing a Tesla Model X Performance
All-Wheel Drive from the UK to South Africa (My Broadband, 2021)
Individual costs Total in Rand (Exchange rate
€1 = R20.87)
Purchase price of Tesla
Model X Performance All-
Wheel Drive in the UK
€ 96 900 R 2 022 303
+ 15% VAT of 10% mark-up R 333 680 R 2 355 983
+ 25% duty tax R 588 996 R 2 944 979
+ 30% Ad Valorem tax R 883 494 R 3 828 472
3.9.4. Lack of local skills
throughout the value chain to
facilitate market growth
There are currently insufficient
skills in the automotive market
and ancillary services to
adapt to the growth of the EV
manufacturing industry.
There is a need to upskill existing
technicians to facilitate the
transition towards electric
mobility. This training is also
important for first-level
emergency responders,
dealerships, and aftermarket
services as these sectors also
play an important role in a
functioning transport sector.

This section focuses on the policy and legislative framework relevant to the SA transport
sector. It also highlights policies and strategies that speak to alternative transport.
POLICY AND
REGULATION

The Vehicle Assembly
Allowance is a rebate
mechanism targeted at
doubling domestic vehicle
production lines by providing
lower tax rates for domestic
vehicle manufacturers.
©Pxhere
03
57
EL
EC
TR
IC V
EH
ICL
ES
: MIR
20
21
The regulatory framework for
transport is governed by the
Department of Transport (DoT)
in SA. The Department of Trade,
Industry and Competition (dtic)
is key to ensuring the policy
environment is conducive
to investment, assembly,
manufacturing, and trade. Several
policies are relevant to the
automotive industry:
4.1. Automotive Production and Development Programme (APDP) (2013-2020)
The APDP was implemented on 1
January 2013 and will be in place
until 2020, after which it will be
replaced with the South African
Automotive Masterplan (SAAM) in
2021 until 2035.
The current APDP (2013-2020)
consists of four pillars that drive
the programme:
• Import duty (tax) – these tariffs
are meant to protect and
support continued domestic
vehicle manufacturing.
• Production Incentives (rebate
mechanism) – this is to
encourage increasing levels
of local value addition along
the automotive value chain,
with positive spin-offs for
employment creation. A higher
production incentive valuation
allows for a greater duty
account reduction.
• Vehicle Assembly Allowance
(VAA) (rebate mechanism) – this
is targeted at doubling domestic
vehicle production lines by
providing lower tax rates for
domestic vehicle manufacturers.
• Automotive Investment Scheme
(cash grant) – effective from
2009, this support is available to
encourage investments by OEMs
and component manufacturers
in a manner that supports
productive capacity upgrading.
The APDP applies only to light
vehicles (passenger cars and light
commercial vehicles), although
components produced for heavy
commercial vehicles also qualify
for the Production Incentive (PI).
While the automotive industry has
not declined since the introduction
of the APDP in 2013, it has not
shifted SA’s global position as a
second-tier player. Aggregated
vehicle sales have increased,
but production for the local and
regional market has declined. The
local market is far from having
sufficient demand to attract local
assembly exclusively for domestic
market supply.
This policy does not make
provision for EV manufacturing,
but outlines taxes, rebate
mechanisms, and incentives in the
traditional automotive industry.
4.2. The South African Automotive Masterplan (SAAM) 2021 – 2035
The SAAM guides policy on
growing and supporting the
domestic automotive industry from
2020 to 2035. It replaces the APDP,
addressing some of the latter’s
shortcomings. This masterplan,
which comes into effect in 2021,
has adapted the Vehicle Assembly
Allowance (VAA) to the Volume
Assembly Localisation Allowance
(VALA). The difference is that VAA
was based on the wholesale selling
price of the vehicle produced in
SA, irrespective of local content
(whether parts were locally
produced or imported). VALA, on
the other hand, has changed this
so that the incentive is no longer
based solely on the wholesale
selling price. Rather, OEMs have
to deduct the value of imported
content from the vehicle’s
wholesale selling price. The figure
is then multiplied by the applicable
VALA percentage as specified
in the updated APDP (the VALA
percentage starts at 40% in 2021
and drops progressively to 35%).
Developed by government and the
automotive industry, the SAAM
covers car and light commercial
vehicle manufacturing, medium,
heavy, extra-heavy truck, and bus
production (potentially including
off-highway vehicles), motorcycles,
and the South African component
supplier industry. Vehicle
importers and distributors are also
covered. The Masterplan creates
a framework for securing even
higher levels of investments and
production (Barnes & Black, 2017).
SAAM’s goals include:
• growing SA’s vehicle production
to 1% of global output (projected
to reach 140 million units
annually by 2035);
• increasing local content of
vehicles assembled in South
Africa to 60%, from a 38.7% base;
58
EL
EC
TR
IC V
EH
ICL
ES
: MIR
20
21
• doubling total employment in
the automotive value chain from
112 000 to 224 000 jobs;
• improving automotive industry
competitiveness levels to
that of leading international
competitors, such as Turkey
and Thailand;
• achieving the transformation
of the South African automotive
industry by employing black
South Africans, upskilling
black employees, empowering
dealerships and authorised
repair facilities, and substantially
increasing the contribution
of black-owned automotive
component manufacturers
within the automotive supply
chain; and
• deepening value addition within
South African automotive
value chains, across selected
commodities/technologies.
Notable changes in the SAAM:
• The Vehicle Assembly Allowance
(VAA), which is one of the four
legs of the APDP, is phased out
6 The Department of Trade, Industry and Competition (the dtic) was established in June 2019 by the incorporation of the Department of Economic Development (EDD) into the Department
of Trade and Industry (the dti) (dtic, 2019).
and replaced by the Volume
Assembly Localisation Allowance
(VALA). VALA will be phased in
between 2021 and 2026 to ensure
no disruptions to existing OEM
investment models.
• By 2026, the VALA is set at 35%
of local value-add for OEM
volumes above 10 000 units,
but in 2021 it is set at 40%. This
is different from the VAA, which
gave vehicle manufacturers
component import allowances
of 20% (2013) of the ex-factory
vehicle price. This was reduced
to 19% and 18% in 2014 and
2015 respectively, for all light
motor vehicles (LMVs) produced
domestically. In short, the VALA
advocates the use of local
content in the components that
manufacturers use by removing
credits for imported contents.
• The Production Incentives (PI)
benefit has been increased
to 25% on components. The
production rebate credit
certificates (PRCCs) will be
replaced by duty credits that are
tied to local value addition. This
is expected to help mop up the
current surplus of PRCCs, which
are used by OEMs and importers
to bring new vehicles into South
Africa duty-free.
• The Automotive Investment
Scheme (AIS) cash grant for
capital investments has been
retained. However, it will be
reduced by 5% from current
levels in those instances where
non-South African tooling
and machinery is employed.
Incentives for investment into new
technologies such as EVs and
hybrids will be covered under this
scheme. These incentives are,
however, still subject to approval
by National Treasury.
• SA is seeking a one-tariff regime
across all light vehicles, including
EVs. This will potentially address
the high import duty challenge.
• Previously, the APDP only applied
to light vehicles (passenger cars
and LCVs). The SAAM, however,
now also includes medium and
heavy commercial vehicles, as
well as motorcycles; but the VALA
formula would not be applied in
either category.
Incentives for investment into
new technologies such as EVs
and hybrids are expected to be
covered under the Automotive
Investment Scheme (AIS).
4.3. Green Transport Strategy (GTS) for South Africa: (2018 – 2050)
To address the significant
contribution of transport to
national greenhouse gas (GHG)
emissions, the Department of
Transport (DoT) has developed
a green transport strategy. The
GTS, which is based on sustainable
development principles, aims to
minimise the impact of transport on
the environment, and meet current
and future transport demands. It
promotes green mobility and is
the first national government-led
strategy that makes provision for
sustainable transport.
To radically grow the uptake of
EVs in South Africa, in conjunction
with dti (now Department of Trade,
Industry and Competition – dtic) 6
and National Treasury, the DoT will:
03
59
EL
EC
TR
IC V
EH
ICL
ES
: MIR
20
21
• offer producers of EVs
manufacturing incentives to
both produce and sell affordable
EVs in South Africa, for both the
local and export markets;
• work with local research
institutions to research EV
batteries;
• work with national, provincial,
and local government
departments and authorities;
government purchases in 2019
accounted for 2.9% (15 423
vehicles) of total vehicle sales
in the country, while corporate
industry fleets accounted for
3.5% (18 695 vehicles), which
could be two areas to start the
EV transition;
• introduce the conversion of old
technology vehicles with higher
emission factors to be retrofitted
with EV technology – this is,
however, an expensive exercise;
• consider providing incentives
related to the beneficiation
of using local resources in
the manufacturing of key
machinery and/or components
(e.g., hydrogen fuel cell electric
vehicles); and
• assist in establishing and
developing local EV OEMs.
4.4. Preferential Procurement Policy Framework Act (PPPFA) of 2000
The revised regulations came
into effect on 7 December 2011 to
empower the dtic to designate
industries, sectors, and sub-
sectors for local production at a
specified level of local content.
Buses are one of the industries
that have been designated for
local production with minimum
local content thresholds.
As such, the Preferential
Procurement Regulations under
the PPPFA prescribe ~80% local
content of the bus body for city
and commuter buses (dti, 2016).
In the case of EVs, the regulations
are not excluding the battery from
the bodywork, thereby creating
an import barrier as at this stage
there is no local manufacturing of
EV batteries.
4.5. The National Climate Change Response Policy (NCCRP) (2011)
This policy is the key policy
document guiding climate change
response across all government
departments. It recognises
that response should be of a
departmental, cost-effective,
and integrated nature. As
discussed previously, EVs have
a role to play in climate change
mitigation, particularly in
mitigating the emissions from
the transportation sector.
The plan aims to address both
mitigation and adaptation in the
short, medium, and long term (up
to 2050), with strategies covering
the following areas:
• Carbon pricing
• Water
• Agriculture and commercial
forestry
• Health
• Biodiversity and ecosystems
• Human settlements
• Disaster risk reduction and
management
4.6. The 2019 Integrated Resource Plan (IRP 2019)
The Integrated Resource Plan
from the Department of Mineral
Resources and Energy (DMRE)
aims to provide a clear indication
of South Africa’s electricity
demand and how this demand
will be supplied, and at what
cost. It provides 1) an overall
plan indicating the quantities
of various electricity sources to
meet the country’s electricity
demand in the next 20 years (the
current plan runs up to 2030),
and 2) guidance for future energy
infrastructure investments. Thus,
it largely determines the country’s
generation mix.
In May 2011, the then Department of
Energy (now Department of Mineral
Resources and Energy) released
the Integrated Resource Plan 2010-
2030 (IRP 2010) in respect of South
Africa’s forecast energy demand for
the 20 years from 2010 to 2030. The
IRP 2010 was intended to be a ‘living
plan’ that would be reviewed by
key stakeholders at least every two
years. However, this was never
done and resulted in an energy mix
that failed to adequately meet the
constantly changing supply and
demand scenarios in South Africa.
60
EL
EC
TR
IC V
EH
ICL
ES
: MIR
20
21
Since 2010/11, there have been
several draft revisions of the
IRP that have been distributed
for public comment. In 2018, the
latest IRP was released for public
comment. In October 2019, the final
IRP 2019 was gazetted to provide
policy certainty to the market.
For the period ending 2030,
several policy adjustments are
proposed to ensure a practical
plan that will be flexible to
accommodate new, innovative
technologies that are not currently
cost-competitive, minimisation of
the impact of decommissioning
coal power plants, and the
changing demand profile.
Some of these adjustments
include increased build limits to
correct the rollout of renewable
energy, which will help sustain
the industry. Inclusion of 1 500
MW of coal-to-power is aimed
at minimising the impact of
job losses resulting from the
decommissioning.
These policy adjustments will be
retained, pending a report on the
just transition strategy expected
in 2020/21.
Provision has been made for the
following new additional capacity
by 2030:
• 1 500 MW of coal;
• 2 500 MW of hydro;
• 6 000 MW of solar PV;
• 14 400 MW of wind;
• 1 860 MW of nuclear;
• 2 088 MW for storage;
• 3 000 MW of gas/diesel; and
• 4 000 MW from other
distributed generation,
co-generation, biomass, and
landfill technologies.
More details on the 2019 IRP are
provided in GreenCape’s Energy
Services Market Intelligence
Report 2021 (GreenCape, 2021).
4.7. The Carbon Tax Act 15 of 2019
The Carbon Tax Act No 15 of 2019
was gazetted in May 2019 and
came into effect on 1 June 2019.
The carbon tax will be applied over
two phases: Phase 1 will be from
1 June 2019 to 31 December 2022,
and phase 2 will be from 2023 to
2030. In Phase 1 it will not have
an impact on electricity prices.
The rate of the carbon tax will be
imposed at an amount of R120 per
tonne of carbon dioxide equivalent
(tCO2e) emitted. However, taking
the tax-free thresholds into
account, this rate will range closer
to R6 and R48 per tCO2e. This rate
will increase by Consumer Price
Index (CPI) +2% per year until 31
December 2022.
The Act has assumed a ‘polluter
pays principle’ to the tax. This
relatively low tax rate and range
of tax-free allowances in Phase
1 are designed to incentivise
large emitters to transit to a low
carbon profile before Phase 2.
Once the results of the tax have
been reviewed at the end of Phase
1, changes to rates and tax-free
thresholds will be applied before
the next phase begins. This would
especially affect businesses
with high fuel and electricity
consumption.
The impact of the carbon tax
on the uptake of solar and other
renewable forms of energy (which
present an opportunity to meet
the energy demand from broad EV
uptake in the country) is still to be
determined and will be monitored.
There are several emerging opportunities in the South African EV market for local
investors and investors looking to enter the South African electric mobility market.
MARKET
OPPORTUNITIES
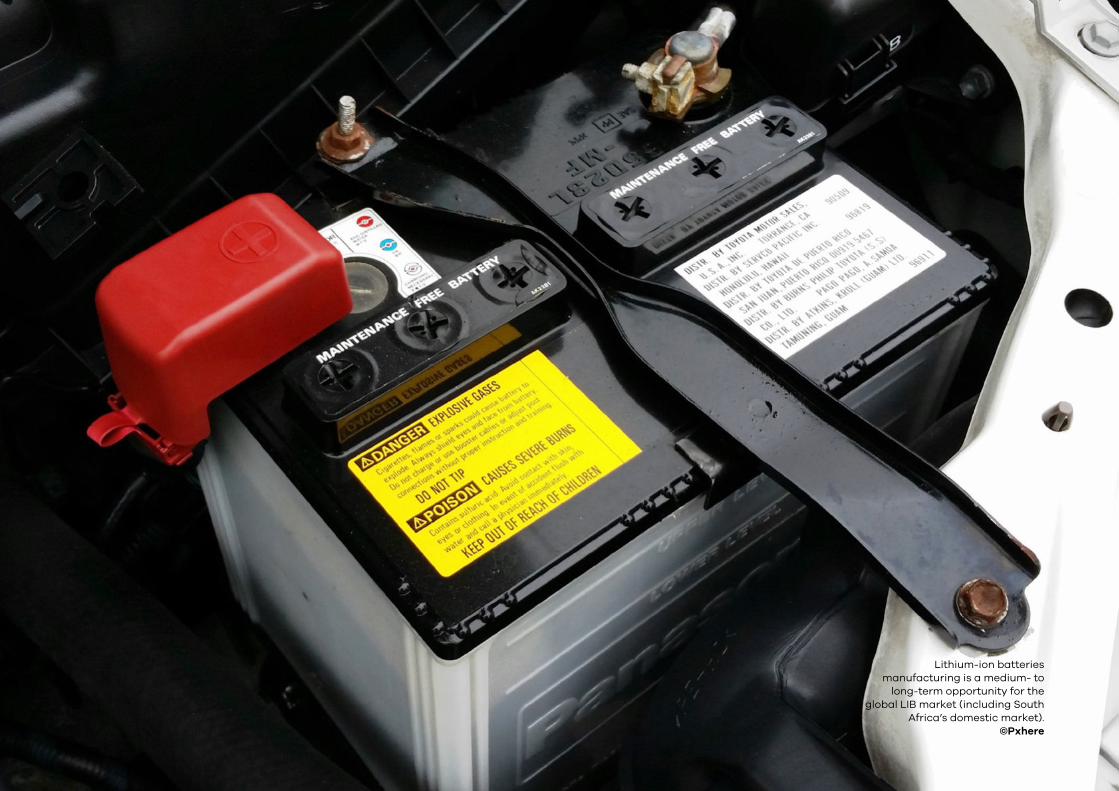
62
EL
EC
TR
IC V
EH
ICL
ES
: MIR
20
21
Lithium-ion batteries
manufacturing is a medium- to
long-term opportunity for the
global LIB market (including South
Africa’s domestic market).
©Pxhere
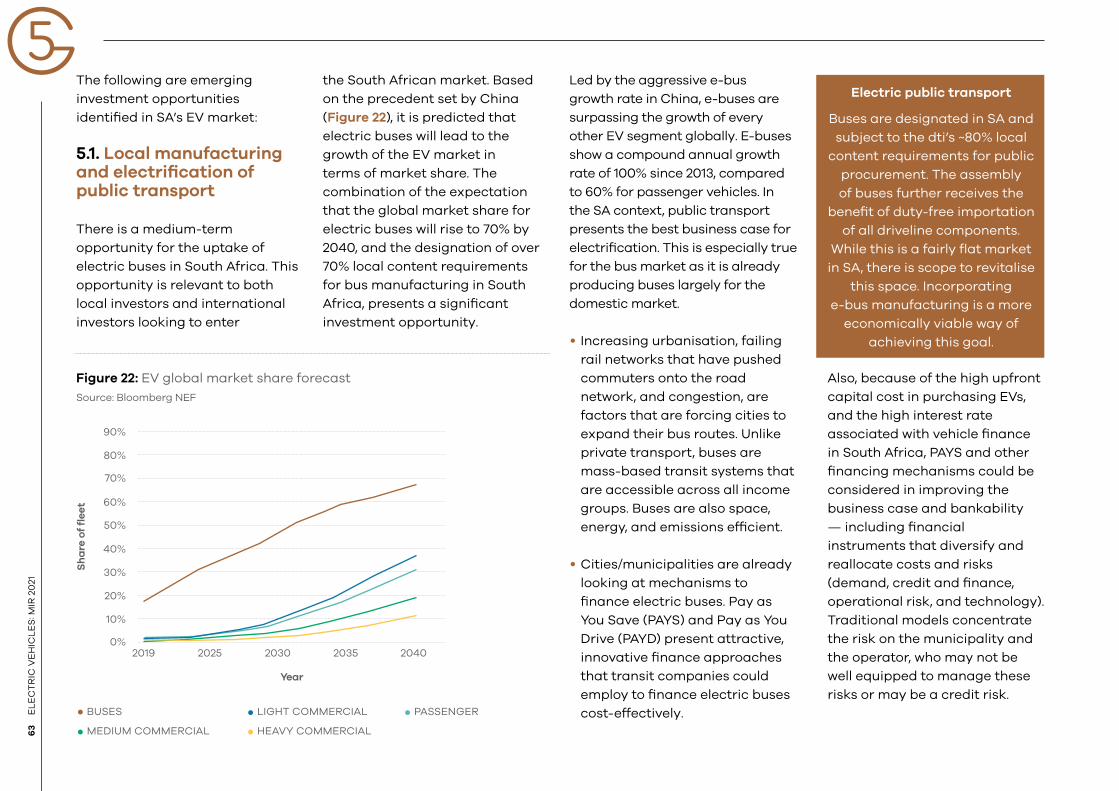
03
63
EL
EC
TR
IC V
EH
ICL
ES
: MIR
20
21
The following are emerging
investment opportunities
identified in SA’s EV market:
5.1. Local manufacturing and electrification of public transport
There is a medium-term
opportunity for the uptake of
electric buses in South Africa. This
opportunity is relevant to both
local investors and international
investors looking to enter
the South African market. Based
on the precedent set by China
(Figure 22), it is predicted that
electric buses will lead to the
growth of the EV market in
terms of market share. The
combination of the expectation
that the global market share for
electric buses will rise to 70% by
2040, and the designation of over
70% local content requirements
for bus manufacturing in South
Africa, presents a significant
investment opportunity.
Figure 22: EV global market share forecast
Source: Bloomberg NEF
Led by the aggressive e-bus
growth rate in China, e-buses are
surpassing the growth of every
other EV segment globally. E-buses
show a compound annual growth
rate of 100% since 2013, compared
to 60% for passenger vehicles. In
the SA context, public transport
presents the best business case for
electrification. This is especially true
for the bus market as it is already
producing buses largely for the
domestic market.
• Increasing urbanisation, failing
rail networks that have pushed
commuters onto the road
network, and congestion, are
factors that are forcing cities to
expand their bus routes. Unlike
private transport, buses are
mass-based transit systems that
are accessible across all income
groups. Buses are also space,
energy, and emissions efficient.
• Cities/municipalities are already
looking at mechanisms to
finance electric buses. Pay as
You Save (PAYS) and Pay as You
Drive (PAYD) present attractive,
innovative finance approaches
that transit companies could
employ to finance electric buses
cost-effectively.
Also, because of the high upfront
capital cost in purchasing EVs,
and the high interest rate
associated with vehicle finance
in South Africa, PAYS and other
financing mechanisms could be
considered in improving the
business case and bankability
— including financial
instruments that diversify and
reallocate costs and risks
(demand, credit and finance,
operational risk, and technology).
Traditional models concentrate
the risk on the municipality and
the operator, who may not be
well equipped to manage these
risks or may be a credit risk.
Electric public transport
Buses are designated in SA and
subject to the dti’s ~80% local
content requirements for public
procurement. The assembly
of buses further receives the
benefit of duty-free importation
of all driveline components.
While this is a fairly flat market
in SA, there is scope to revitalise
this space. Incorporating
e-bus manufacturing is a more
economically viable way of
achieving this goal.
0%
10%
20%
30%
60%
70%
80%
90%
40%
50%
2019 2025 2030 2035 2040
BUSES LIGHT COMMERCIAL PASSENGER
MEDIUM COMMERCIAL HEAVY COMMERCIAL
Sh
are
of
fle
et
Year
64
EL
EC
TR
IC V
EH
ICL
ES
: MIR
20
21
Newer alternative models try
to separate the asset owner from
the operator, through unbundling
and the separation of
responsibilities (C40 Cities, 2018).
The manufacturing of EVs is
correlated with their demand,
and it is unlikely to materialise
domestically until the demand for
EVs increases significantly. Fleets,
both public and private, account
for about 40% of the energy use
in the transport sector. From a
life cycle assessment perspective
through the entire value chain,
it is more efficient to electrify
public transport as compared to
single-occupancy vehicles (SOV).
According to the United Nations
Environmental Programme (UNEP),
most African countries, including
South Africa, will face massive
vehicle fleet growth in the next
ten years. Thus there is an
opportunity to do it right and
channel that growth into low
emission transport, and avoid air
pollution in the process.
When renewing bus contracts,
municipalities could propose to or
require operators to progressively
start incorporating electric fleets,
at least partially, or replace ageing
fleets with electric variants when
their useful life is complete.
Renewable energy sources, either
procured from IPPs on a larger
scale, or distributed embedded
generation on a smaller scale
by municipalities, the energy
utility, Eskom, bus company
operators or others, could support
the increased energy demand
by ensuring the grid and the
transport that relies on it is more
sustainable and lower carbon.
The Department of Transport’s
relaunched Taxi Recapitalisation
Programme (TRP) could provide an
opportunity to start transitioning
the local transport industry towards
e-mobility. There is potential to
align the taxi-scrapping allowance
with a shift from ICE minibus taxis
to electric variants. There is still
no e-MBT (electric minibus taxi)
currently available in South Africa,
even though the maintenance cost
of MBT in South Africa is very high
due to the distances travelled and
the driving style. The taxi market
share represents 67% of all daily
trips in South Africa, and it is rising.
Transitioning this manufacturing
to EVs, powered by renewable
energy sources, is buoyed by the
fact that there are many similarities
and overlaps between EV and
ICE drivetrains and components.
Local OEMs have gone from barely
registering the possibilities of
EVs, just a few years ago, to fully
embracing them. Now every major
manufacturer has an EV strategy,
and the shift is accelerating
rapidly.
5.2. Lithium-ion batteries (LIB) production
Lithium-ion batteries (LIB)
manufacturing is a medium- to
long-term opportunity for the
global LIB market (including South
Africa’s domestic market), based
on the diversification of the LIB
market and increasing demand
from the EV industry. Lithium-
ion battery manufacturing has
the potential of creating jobs
throughout the value chain,
as it is very labour-intensive.
Battery recycling is, however,
not yet viable in South Africa
because the number of EVs is
still very low, and those available
have not yet reached their end-
of useful life point.
As indicated in Section 3.8.2,
EVs have a high upfront capital
cost which is directly linked to the
high production cost of batteries.
These batteries still account for
between 30% and 50% of the cost
of the EV. As most people make
their vehicle purchase decision
based on price, this remains one
of the biggest barriers to the
uptake of EVs in the country. The
increased demand for lithium-
ion batteries from consumer
electronics, stationary storage,
and EVs, together with improved
technology, has reduced the
price of lithium-ion batteries by
89% since 2010, with the volume-
weighted average hitting US$156/
kWh. This is because the costs
depend much less on raw material
cost than on economies of scale, in
terms of the production volumes of
the batteries.
Besides powering the vehicle, EV
batteries have two other potentially
useful applications: (1) mobile
storage while they are installed in
the vehicle; and (2) as second-life
storage after the vehicle batteries
are retired.
EV manufacturers use several
different chemistries in batteries.
Lithium iron phosphate (LFP),
lithium nickel cobalt aluminium
oxide (NCA), and nickel manganese
cobalt oxide (NMC) are the three
leading cathode chemistry types.
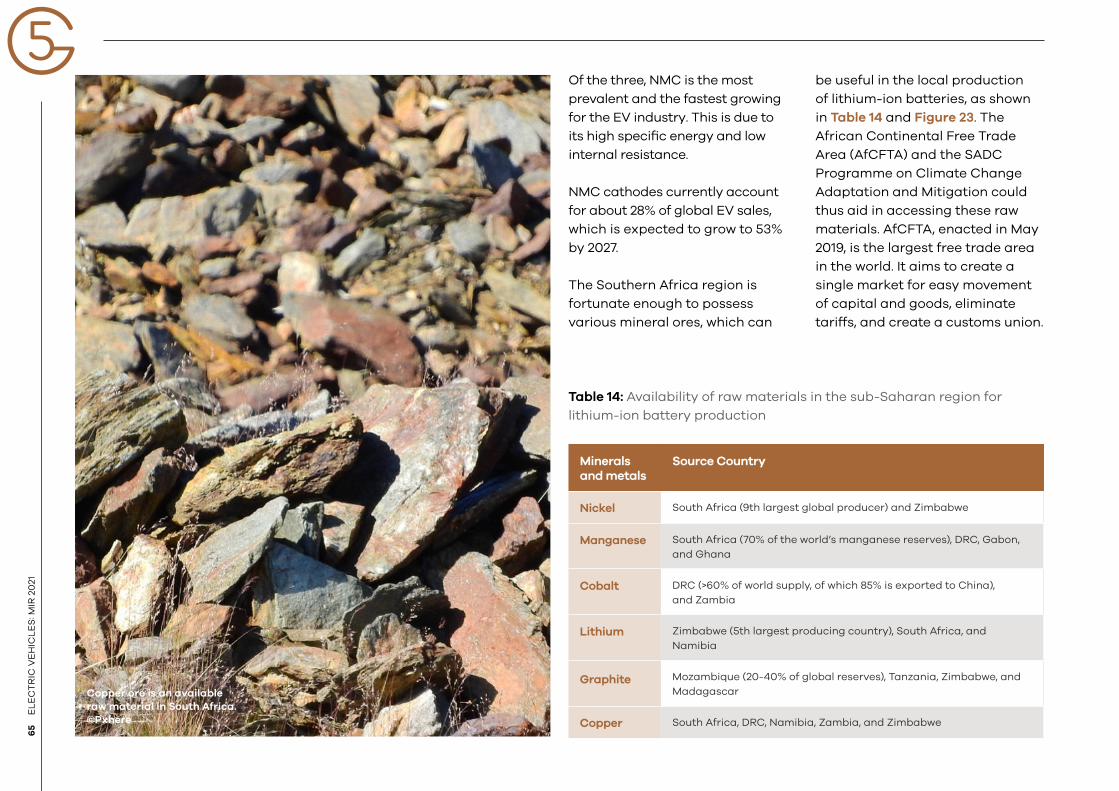
03
65
EL
EC
TR
IC V
EH
ICL
ES
: MIR
20
21
Of the three, NMC is the most
prevalent and the fastest growing
for the EV industry. This is due to
its high specific energy and low
internal resistance.
NMC cathodes currently account
for about 28% of global EV sales,
which is expected to grow to 53%
by 2027.
The Southern Africa region is
fortunate enough to possess
various mineral ores, which can
be useful in the local production
of lithium-ion batteries, as shown
in Table 14 and Figure 23. The
African Continental Free Trade
Area (AfCFTA) and the SADC
Programme on Climate Change
Adaptation and Mitigation could
thus aid in accessing these raw
materials. AfCFTA, enacted in May
2019, is the largest free trade area
in the world. It aims to create a
single market for easy movement
of capital and goods, eliminate
tariffs, and create a customs union.
Table 14: Availability of raw materials in the sub-Saharan region for
lithium-ion battery production
Minerals and metals
Source Country
Nickel South Africa (9th largest global producer) and Zimbabwe
Manganese South Africa (70% of the world’s manganese reserves), DRC, Gabon,
and Ghana
Cobalt DRC (>60% of world supply, of which 85% is exported to China),
and Zambia
Lithium Zimbabwe (5th largest producing country), South Africa, and
Namibia
Graphite Mozambique (20-40% of global reserves), Tanzania, Zimbabwe, and
Madagascar
Copper South Africa, DRC, Namibia, Zambia, and Zimbabwe
Copper ore is an available
raw material in South Africa.
©Pxhere
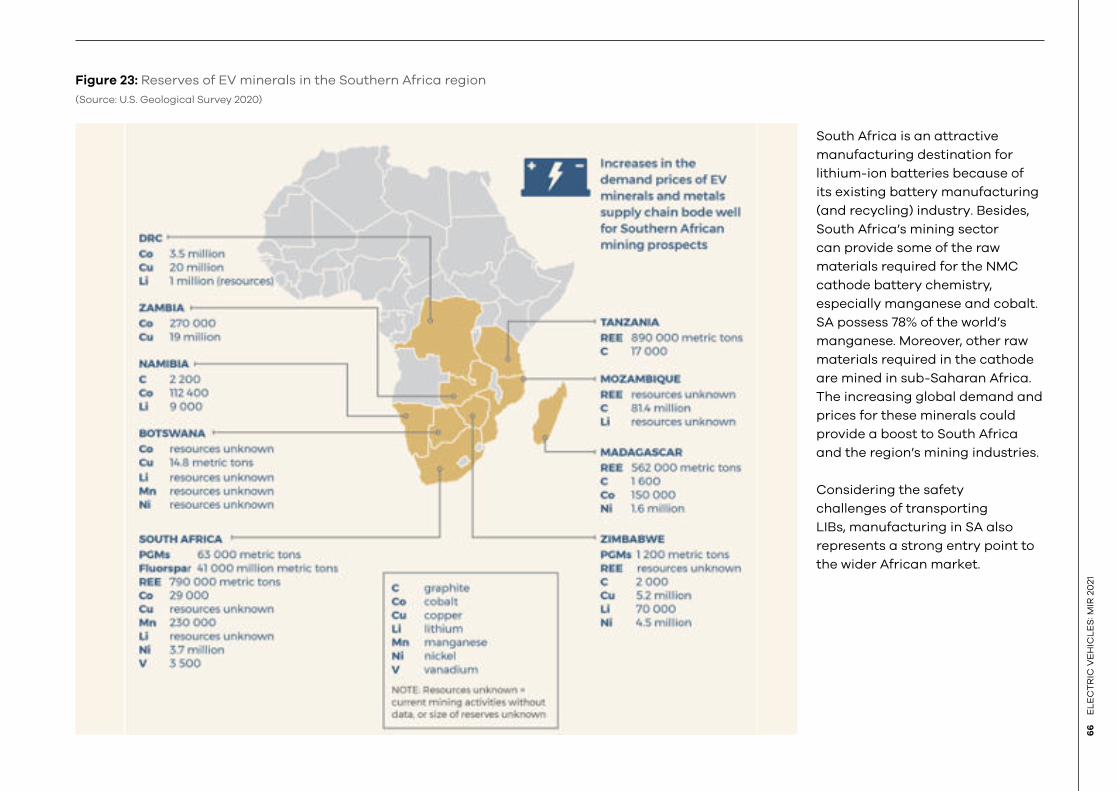
66
EL
EC
TR
IC V
EH
ICL
ES
: MIR
20
21
Figure 23: Reserves of EV minerals in the Southern Africa region
(Source: U.S. Geological Survey 2020)
South Africa is an attractive
manufacturing destination for
lithium-ion batteries because of
its existing battery manufacturing
(and recycling) industry. Besides,
South Africa’s mining sector
can provide some of the raw
materials required for the NMC
cathode battery chemistry,
especially manganese and cobalt.
SA possess 78% of the world’s
manganese. Moreover, other raw
materials required in the cathode
are mined in sub-Saharan Africa.
The increasing global demand and
prices for these minerals could
provide a boost to South Africa
and the region’s mining industries.
Considering the safety
challenges of transporting
LIBs, manufacturing in SA also
represents a strong entry point to
the wider African market.
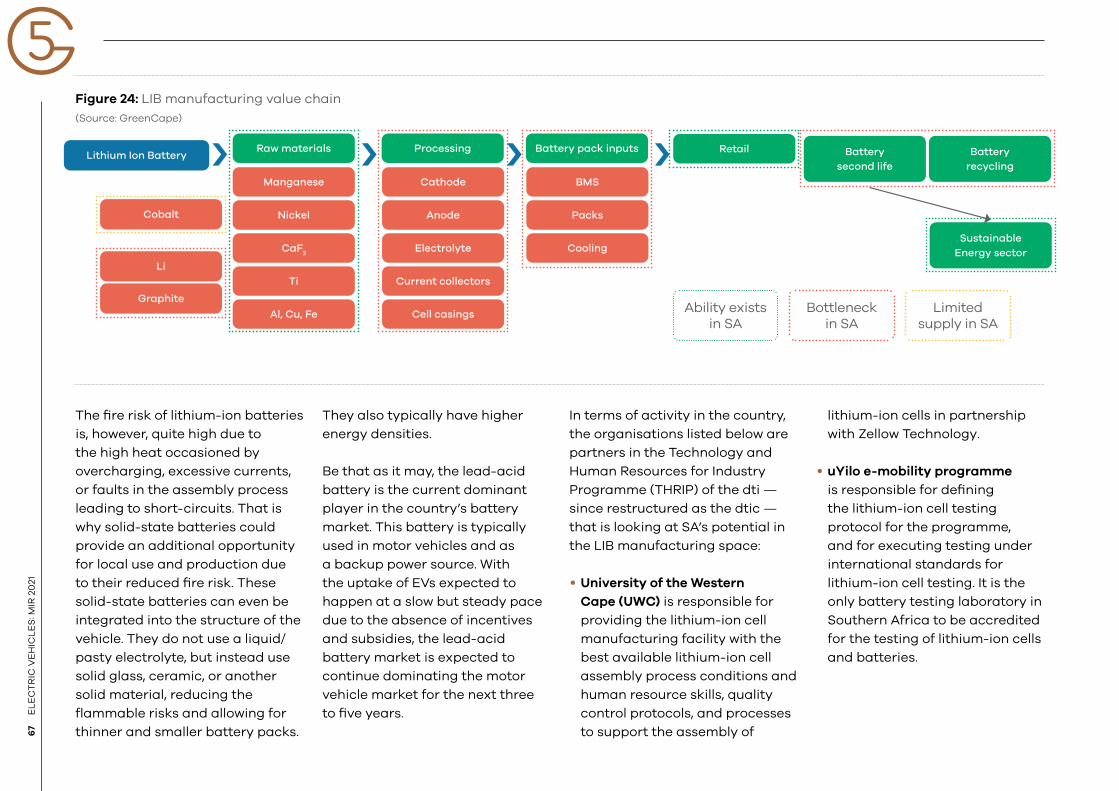
03
67
EL
EC
TR
IC V
EH
ICL
ES
: MIR
20
21
Figure 24: LIB manufacturing value chain
(Source: GreenCape)
The fire risk of lithium-ion batteries
is, however, quite high due to
the high heat occasioned by
overcharging, excessive currents,
or faults in the assembly process
leading to short-circuits. That is
why solid-state batteries could
provide an additional opportunity
for local use and production due
to their reduced fire risk. These
solid-state batteries can even be
integrated into the structure of the
vehicle. They do not use a liquid/
pasty electrolyte, but instead use
solid glass, ceramic, or another
solid material, reducing the
flammable risks and allowing for
thinner and smaller battery packs.
They also typically have higher
energy densities.
Be that as it may, the lead-acid
battery is the current dominant
player in the country’s battery
market. This battery is typically
used in motor vehicles and as
a backup power source. With
the uptake of EVs expected to
happen at a slow but steady pace
due to the absence of incentives
and subsidies, the lead-acid
battery market is expected to
continue dominating the motor
vehicle market for the next three
to five years.
In terms of activity in the country,
the organisations listed below are
partners in the Technology and
Human Resources for Industry
Programme (THRIP) of the dti —
since restructured as the dtic —
that is looking at SA’s potential in
the LIB manufacturing space:
• University of the Western
Cape (UWC) is responsible for
providing the lithium-ion cell
manufacturing facility with the
best available lithium-ion cell
assembly process conditions and
human resource skills, quality
control protocols, and processes
to support the assembly of
lithium-ion cells in partnership
with Zellow Technology.
• uYilo e-mobility programme
is responsible for defining
the lithium-ion cell testing
protocol for the programme,
and for executing testing under
international standards for
lithium-ion cell testing. It is the
only battery testing laboratory in
Southern Africa to be accredited
for the testing of lithium-ion cells
and batteries.
Cobalt
Li
Graphite
Manganese
Nickel
CaF2
Ti
Al, Cu, Fe
Cathode
Anode
Electrolyte
Current collectors
Cell casings
Packs
BMS
CoolingSustainable
Energy sector
Battery
recycling
Battery
second life
RetailProcessing Battery pack inputs
Ability exists in SA
Bottleneck in SA
Limited supply in SA
Lithium Ion BatteryRaw materials
68
EL
EC
TR
IC V
EH
ICL
ES
: MIR
20
21
• Council for Scientific and
Industrial Research (CSIR)
is responsible for providing
cathode material manufactured,
using South African intellectual
property and raw materials, to
be utilised in the lithium-ion
assembly process.
• Zellow Technology is responsible
for the development of a local
lithium-ion cell manufacturing
competency, driving the
commercialisation of the final
product by identifying customers
and using cases through off-
take agreements.
• Metair is responsible for
providing a consumer use
case for the final product and
agreeing to utilise the product
once all safety and quality
standards have been met.
5.3. Passenger vehicle manufacturing
There is a medium- to long-term
opportunity for SA to be used
as a manufacturing hub for
electric passenger vehicles for
the export market. As discussed
in Section 3, this is imperative
if SA is to maintain its vehicle
export markets and the revenues
drawn from the automotive
industry. Manufacturing for the
domestic market is a longer-term
opportunity as demand increases.
SA has a very strong automotive
market. It is a dominant industry
in the country’s manufacturing
sector, backed by a relatively
cheap labour force. The automotive
industry has overtaken the mining
industry in South Africa in terms
of contribution to the GDP.
The automotive sector could
also support the mining sector
in terms of creating demand for
Platinum Group Metals (PGM),
nickel, manganese, etc. The SA
government is faced with the task
of securing higher investments
and increasing vehicle production
volumes to stimulate the local
market and remain internationally
competitive. This manufacturing
base, combined with the significant
tax incentives offered, contributes
to cheaper manufacturing costs.
The trade agreements that SA
has with the EU (which allow
vehicles and parts to be exported
custom-free to 28 countries) and
SADC, coupled with cheaper
manufacturing, position SA as a
suitable manufacturing destination
for companies targeting Africa, the
US, and countries in the EU.
As shown in Table 10 previously,
as of September 2020 there are
7 510 297 passenger vehicles in
South Africa, representing 65% of
the total self-propelled vehicles in
the country. This represents the
potential market for passenger
vehicle electrification.
Figure 25, on the next page,
further provides a breakdown of
electric passenger vehicle sales
by vehicle model over the last
decade. This market has seen a
slow growth path since Nissan
entered the market in 2013, with
BMW and Jaguar following in 2015
and 2018, respectively.
There is a notable decrease
in sales from 2015 onwards.
This speaks to the need for a
market step change towards
creating an enabling environment
for any significant growth to
be recognised.
EVs accounted for a meagre
0.04% of vehicle sales in South
Africa in 2019. Hybrid EV sales
comprise the largest number of
EV sales in South Africa, followed
by plug-in hybrid EV (PHEV) and
battery EV (BEV).
In terms of the National Environmental Management:
Waste Act 59 of 2008):
Effective from 23 August 2013, lead acid batteries disposal is banned
from landfill. All ‘other batteries’ will be banned from landfill by 2021.
The lead acid battery market has seen an increase in recycling
capabilities (29 016 t) as a result of the Waste Act. The Act is also
a key driver for the incorporation of LIB reuse and recycling by LIB
manufacturing companies looking to set up in SA.
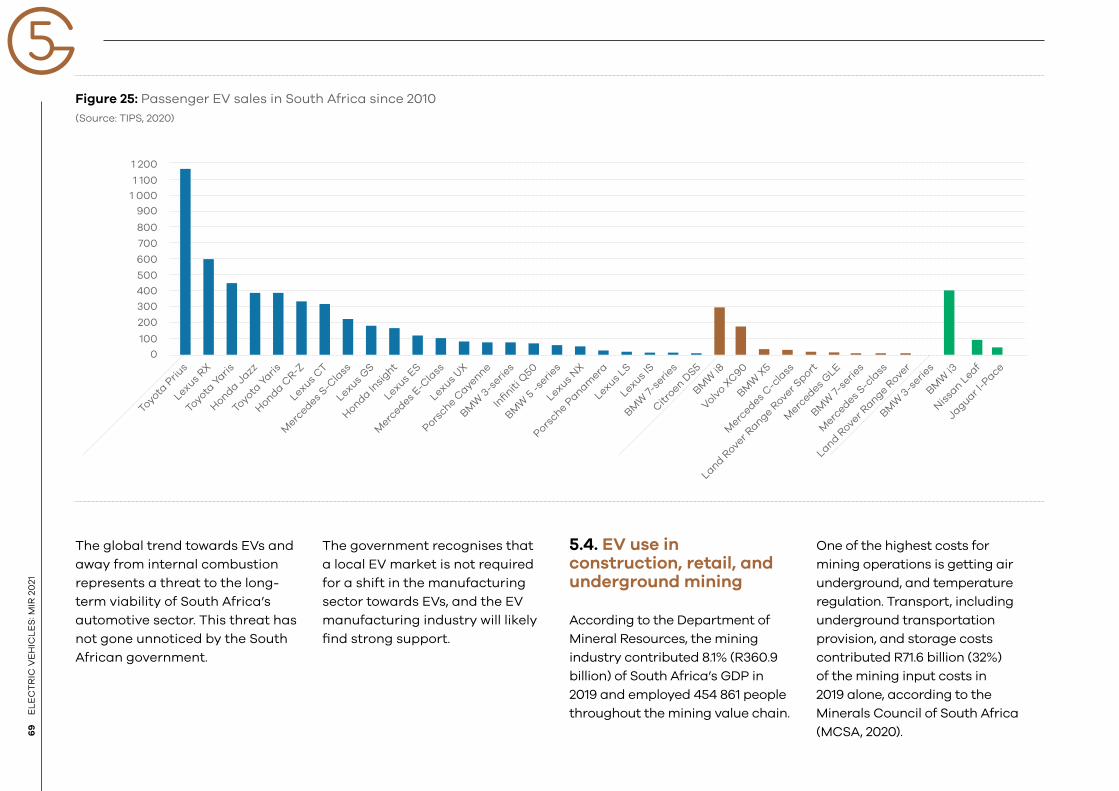
03
69
EL
EC
TR
IC V
EH
ICL
ES
: MIR
20
21
Figure 25: Passenger EV sales in South Africa since 2010
(Source: TIPS, 2020)
The global trend towards EVs and
away from internal combustion
represents a threat to the long-
term viability of South Africa’s
automotive sector. This threat has
not gone unnoticed by the South
African government.
The government recognises that
a local EV market is not required
for a shift in the manufacturing
sector towards EVs, and the EV
manufacturing industry will likely
find strong support.
5.4. EV use in construction, retail, and underground mining
According to the Department of
Mineral Resources, the mining
industry contributed 8.1% (R360.9
billion) of South Africa’s GDP in
2019 and employed 454 861 people
throughout the mining value chain.
One of the highest costs for
mining operations is getting air
underground, and temperature
regulation. Transport, including
underground transportation
provision, and storage costs
contributed R71.6 billion (32%)
of the mining input costs in
2019 alone, according to the
Minerals Council of South Africa
(MCSA, 2020).
400
500
600
700
800
900
1 000
1 100
1 200
300
200
100
0
Toyota P
rius
Lexus RX
Toyota Y
aris
Honda J
azz
Toyota Y
aris
Honda C
R-Z
Lexus C
T
Merc
edes S-C
lass
Lexus G
S
Honda In
sight
Lexus ES
Merc
edes E-C
lass
Lexus U
X
Porsche C
ayenne
BMW
3-s
eries
Infiniti
Q50
BMW
5 -se
ries
Lexus N
X
Porsche P
anamera
Lexus LS
Lexus IS
BMW
7-s
eries
Citr
oen DS5
BMW
i8
Volvo X
C90
BMW
X5
Merc
edes C
-cla
ss
Land Rover R
ange Rover S
port
Merc
edes G
LE
BMW
7-s
eries
Merc
edes S-c
lass
Land Rover R
ange Rover
BMW
3-s
eries
BMW
i3
Nis
san L
eaf
Jaguar l-P
ace
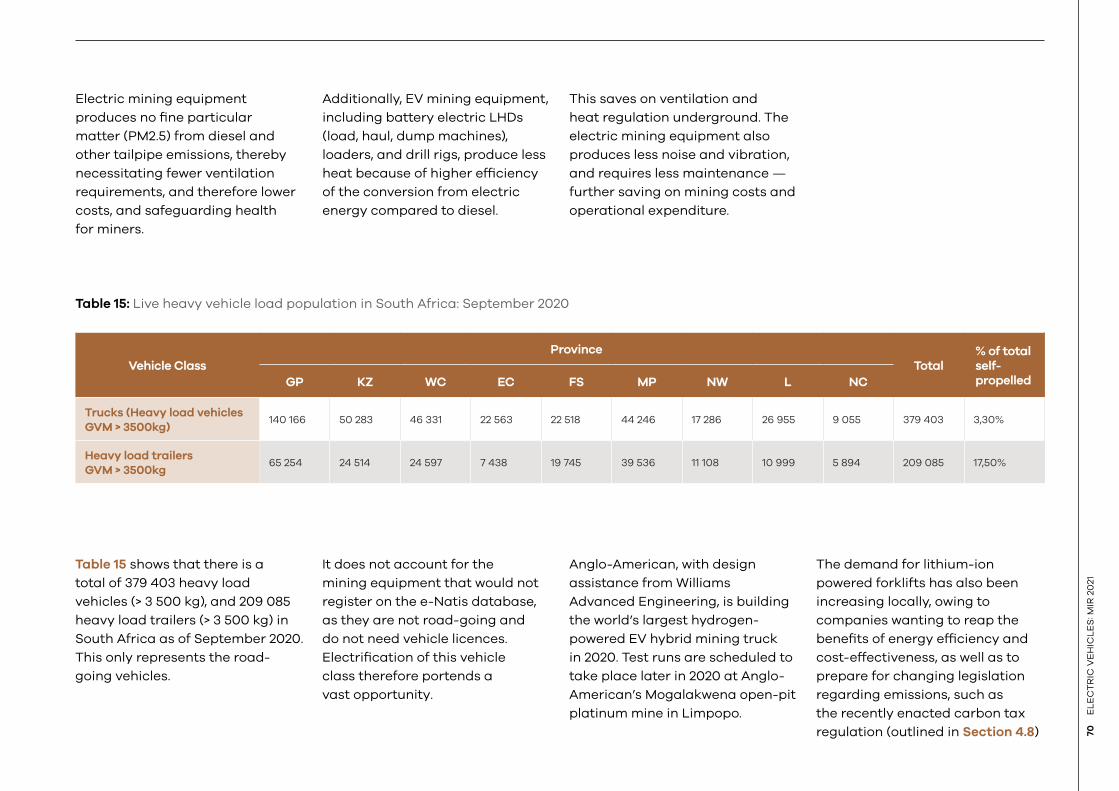
70
EL
EC
TR
IC V
EH
ICL
ES
: MIR
20
21
Electric mining equipment
produces no fine particular
matter (PM2.5) from diesel and
other tailpipe emissions, thereby
necessitating fewer ventilation
requirements, and therefore lower
costs, and safeguarding health
for miners.
Additionally, EV mining equipment,
including battery electric LHDs
(load, haul, dump machines),
loaders, and drill rigs, produce less
heat because of higher efficiency
of the conversion from electric
energy compared to diesel.
This saves on ventilation and
heat regulation underground. The
electric mining equipment also
produces less noise and vibration,
and requires less maintenance —
further saving on mining costs and
operational expenditure.
Table 15: Live heavy vehicle load population in South Africa: September 2020
Vehicle Class
Province
Total% of total self-propelledGP KZ WC EC FS MP NW L NC
Trucks (Heavy load vehicles
GVM > 3500kg)140 166 50 283 46 331 22 563 22 518 44 246 17 286 26 955 9 055 379 403 3,30%
Heavy load trailers
GVM > 3500kg65 254 24 514 24 597 7 438 19 745 39 536 11 108 10 999 5 894 209 085 17,50%
Table 15 shows that there is a
total of 379 403 heavy load
vehicles (> 3 500 kg), and 209 085
heavy load trailers (> 3 500 kg) in
South Africa as of September 2020.
This only represents the road-
going vehicles.
It does not account for the
mining equipment that would not
register on the e-Natis database,
as they are not road-going and
do not need vehicle licences.
Electrification of this vehicle
class therefore portends a
vast opportunity.
Anglo-American, with design
assistance from Williams
Advanced Engineering, is building
the world’s largest hydrogen-
powered EV hybrid mining truck
in 2020. Test runs are scheduled to
take place later in 2020 at Anglo-
American’s Mogalakwena open-pit
platinum mine in Limpopo.
The demand for lithium-ion
powered forklifts has also been
increasing locally, owing to
companies wanting to reap the
benefits of energy efficiency and
cost-effectiveness, as well as to
prepare for changing legislation
regarding emissions, such as
the recently enacted carbon tax
regulation (outlined in Section 4.8)
A range of general and sector-specific funding solutions and incentives
is available to investors, manufacturers, and service companies in the green economy.
It covers Development Finance Institutions (DFIs), local public and private sector
financiers and investors, and a considerable range of tax incentives.
FUNDING AND
INCENTIVES

72
EL
EC
TR
IC V
EH
ICL
ES
: MIR
20
21
The BMW battery-powered iX
crossover – iX Sport Activity
Vehicle, has been announced
to arrive in the South African
market in 2022.
©District Watch Group
03
73
EL
EC
TR
IC V
EH
ICL
ES
: MIR
20
21
South Africa ranks as one of the
top 15 nations in the world in
terms of driving the green growth
agenda (ahead of Australia,
Singapore, and Finland). This
drive is on the back of a range
of funding solutions and tax
incentives available to green
technology manufacturers and
service companies, as well as
those who use or procure such
goods and services.
The South African Climate Finance
Landscape looks at detailed
project-level data, understanding
in detail the source, disbursement,
instrument and use. The insights
can support public and private
role-players with information to
shape sectoral strategies and
selected policies and improve
coherence and coordination
between public and private level
spending in the sectors. The
South African Climate Finance
Landscape has tracked R62.2
billion in annual climate finance
invested in SA. Find out more here.
7 https://www.green-cape.co.za/content/focusarea/green-finance-databases
8 https://www.greencape.co.za/assets/Uploads/Government-Funding-and-Incentive-Booklet.pdf
6.1. General database web page
The GreenCape Finance Desk
hosts a web page with a number
of Green Finance resources that
cover funding and incentives
available to companies operating
in the green economy. A few of
the available database are
highlighted below.
6.1.1. Green Finance Database
In conjunction with the Western
Government Department of
Economic Development and
Tourism, GreenCape maintains
a database of funding sources
and incentives that may be
relevant to green economy
investors. The database contains
information on more than 150
funding opportunities, including
an overview of the opportunity and
relevant contact details and links.
It is ideal for any entity seeking a
broad range of funding solutions
and financial incentives, with
South African institutions being
the main source of opportunities.
The database is available to view
and download online7.
6.1.2. Government funding and
incentives database
An updated document
focused on South African
government funding and
incentives is available to view and
download online8. These incentives
cover local manufacturing, critical
infrastructure grants, small
enterprise development
and a diverse set of sector
specific incentives (i.e.
Aquaculture Development and
Enhancement Programme).
The Green Finance Desk
(GFD) primarily acts as a
facilitator in the financing
of green projects and green
business. The GFD works across
all sector desks at GreenCape.
For more support please visit
https://www.greencape.co.za/
content/sector/green-finance
ACCESS THE SOUTH
AFRICAN CLIMATE
FINANCE LANDSCAPE
74
EL
EC
TR
IC V
EH
ICL
ES
: MIR
20
21
Click the buttons below to
access the relevant content
6.1.3. Finfind database
Finfind9 is an innovative online
finance solution that brings
together SMME finance providers
and finance seekers. With a focus
on finance readiness, Finfind
has more than 200 lenders and
over 350 loan products available
to SMEs. The database is ideal
for South African SMMEs who
are seeking funding and/or
business advisory services, and
those who want to improve their
understanding of finance.
Wesgro has partnered with Finfind
to assist local companies seeking
finance for their business. See
more here: https://wesgro.finfind.
co.za/quiz/disclaimer/wesgro
9 https://www.finfindeasy.co.za/
10 https://alliedcrowds.com/
6.1.4. AlliedCrowds database
AlliedCrowds10 is the first complete
aggregator and directory of
alternative finance providers in
the developing world. Sign-up is free
and allows users to access a global
database where one can filter
for sector (including greentech,
agriculture and social impact), type
of capital (equity, lending, grant),
and type of funding (crowdfunding,
angel investing, venture capital,
impact investing). In addition:
• Themed databases around the
Sustainable Development Goals
(SDGs) and the World Green
Economy Organisation (WGEO)
are available.
• Reports, including a number
specifically about African
funding sources, can also be
downloaded for free.
• Businesses / organisations can
also contact Allied Crowds to
create a customised funding
database. This resource is ideal
for any entity seeking a broad
range of financial solutions on a
global scale.
GREENCAPE’S GREEN
FINANCE WEB-PAGE
GREEN FINANCE
DATABASE
GOVERNMENT FUNDING
AND INCENTIVE BOOKLET
FINFIND WEBSITE
ALLIED CROWDS
WEBSITE
Rising electricity prices, national energy insecurity, dropping technology costs,
supportive energy policies, and incentives are prompting consumers to explore
alternative energy options driving the growth of the Energy Services (ES)
market in South Africa, and creating a thriving value chain.
SECTOR
OVERVIEW
The Western Cape is a world-class investment destination.
THE WESTERN CAPE: AFRICA’S
GREEN ECONOMY HUB

MellowCabs is a delivery
company based in
Stellenbosch, Western
Cape which uses electric
vehicles for delivery.
©MellowCabs
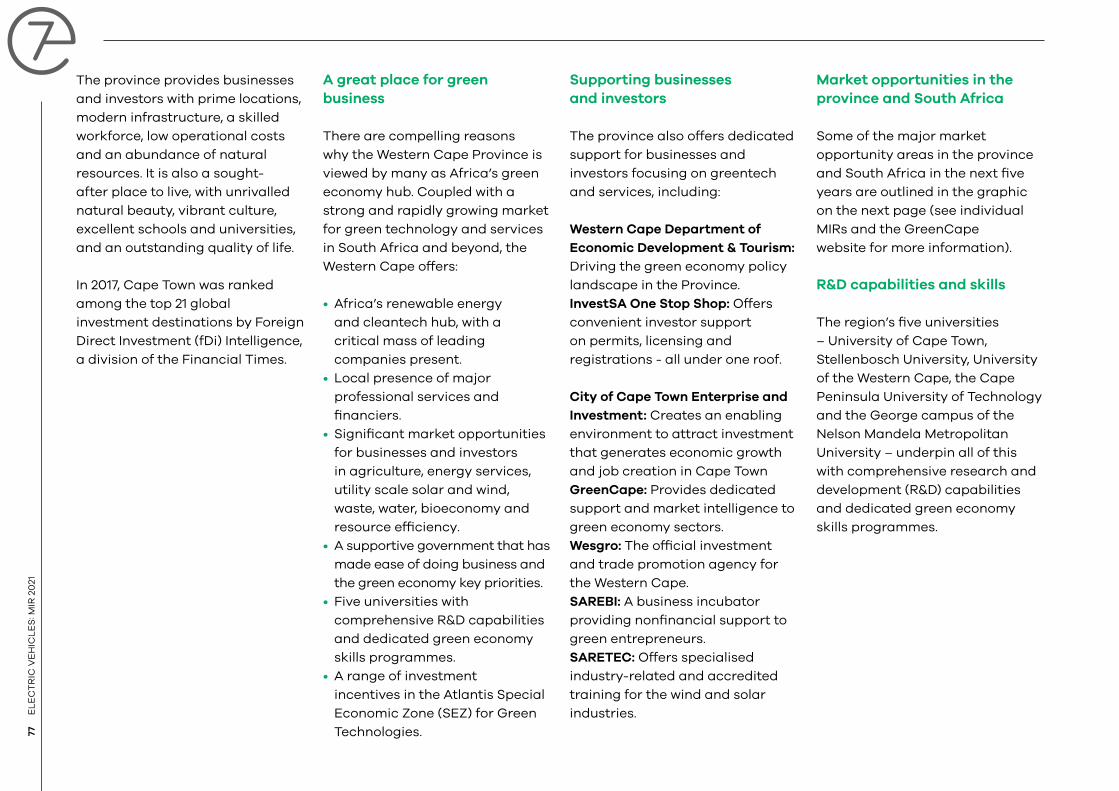
03
77
EL
EC
TR
IC V
EH
ICL
ES
: MIR
20
21
The province provides businesses
and investors with prime locations,
modern infrastructure, a skilled
workforce, low operational costs
and an abundance of natural
resources. It is also a sought-
after place to live, with unrivalled
natural beauty, vibrant culture,
excellent schools and universities,
and an outstanding quality of life.
In 2017, Cape Town was ranked
among the top 21 global
investment destinations by Foreign
Direct Investment (fDi) Intelligence,
a division of the Financial Times.
A great place for green
business
There are compelling reasons
why the Western Cape Province is
viewed by many as Africa’s green
economy hub. Coupled with a
strong and rapidly growing market
for green technology and services
in South Africa and beyond, the
Western Cape offers:
• Africa’s renewable energy
and cleantech hub, with a
critical mass of leading
companies present.
• Local presence of major
professional services and
financiers.
• Significant market opportunities
for businesses and investors
in agriculture, energy services,
utility scale solar and wind,
waste, water, bioeconomy and
resource efficiency.
• A supportive government that has
made ease of doing business and
the green economy key priorities.
• Five universities with
comprehensive R&D capabilities
and dedicated green economy
skills programmes.
• A range of investment
incentives in the Atlantis Special
Economic Zone (SEZ) for Green
Technologies.
Supporting businesses
and investors
The province also offers dedicated
support for businesses and
investors focusing on greentech
and services, including:
Western Cape Department of
Economic Development & Tourism:
Driving the green economy policy
landscape in the Province.
InvestSA One Stop Shop: Offers
convenient investor support
on permits, licensing and
registrations - all under one roof.
City of Cape Town Enterprise and
Investment: Creates an enabling
environment to attract investment
that generates economic growth
and job creation in Cape Town
GreenCape: Provides dedicated
support and market intelligence to
green economy sectors.
Wesgro: The official investment
and trade promotion agency for
the Western Cape.
SAREBI: A business incubator
providing nonfinancial support to
green entrepreneurs.
SARETEC: Offers specialised
industry-related and accredited
training for the wind and solar
industries.
Market opportunities in the
province and South Africa
Some of the major market
opportunity areas in the province
and South Africa in the next five
years are outlined in the graphic
on the next page (see individual
MIRs and the GreenCape
website for more information).
R&D capabilities and skills
The region’s five universities
– University of Cape Town,
Stellenbosch University, University
of the Western Cape, the Cape
Peninsula University of Technology
and the George campus of the
Nelson Mandela Metropolitan
University – underpin all of this
with comprehensive research and
development (R&D) capabilities
and dedicated green economy
skills programmes.
78
EL
EC
TR
IC V
EH
ICL
ES
: MIR
20
21
ATLANTIS SPECIAL
ECONOMIC ZONE FOR GREEN
TECHNOLOGIES
The Atlantis SEZ is a zone
dedicated to the manufacturing
and provision of services in
the green technology space
- technologies that reduce or
reverse the impact of people on
the planet. Wind turbines, solar
panels, insulation, biofuels, electric
vehicles, materials recycling and
green building materials are all
examples of green technologies
that will be welcomed to the zone.
The zone welcomes
manufacturers, service providers,
suppliers and other players in the
value chains of different green
technologies. The SEZ is situated in
the Atlantis industrial area north of
Cape Town, south of Wesfleur, east
of Dassenberg Road, and west of
the Witsand community.
Why invest in the Atlantis SEZ?
There are strong and growing
South African and African markets
for greentech. The South African
greentech manufacturing market
is worth at least R30bn; with a
growing greentech market in the
neighbouring countries. South
Africa has opportunities in energy,
waste, agriculture, transport and
other sectors and is a great entry
point for the whole of Africa, in
particular the SADC region.
Atlantis is a great location and
development ready. 94 hectares of
zoned development-ready land is
available for leasing to investors.
Bulk infrastructure is in place and
Atlantis has new public transport
and shipping links, whilst boasting
fibre connectivity too. Atlantis is
also close to major ports, roads,
universities and greentech markets.
Investors have access to extensive
investment support through
the One Stop Shop for investor
support and the rest of the
investor support ecosystem, which
includes InvestSA, GreenCape, the
City of Cape Town, and Wesgro.
Together the ecosystem provides
information and advocacy;
market intelligence; facilitated
access to permits and licenses,
planning and development
approval; and skills training.
Investors and tenants are
accessing attractive incentives
in the form of tax relief and
allowances, employment
tax incentives, fast-tracked
development approvals, fee
exemptions and subsidies.
There is an attractive, wide-
ranging skills base to recruit from
with 5 universities and many more
colleges in the province, and a
large range of unskilled, semi-
skilled, technical and
professional candidates.
CLICK TO VIEW THE
ATLANTIS SEZ WEBSITE
FOR MORE INFO, CLICK
TO EMAIL THE ATLANTIS SEZ
BUSINESS DEVELOPMENT
EXECUTIVE
Rising electricity prices, national energy insecurity, dropping technology costs,
supportive energy policies, and incentives are prompting consumers to explore
alternative energy options driving the growth of the Energy Services (ES)
market in South Africa, and creating a thriving value chain.
SECTOR
OVERVIEW
GreenCape is a non-profit organisation that works at the interface
of business, government and academia to identify and remove barriers
to economically viable green economy infrastructure solutions.
Our vision is a thriving prosperous Africa, mobilised by the green economy
GREENCAPE’S SUPPORT TO
BUSINESSES AND INVESTORS
GreenCape is a non-profit
organisation that works at the
interface of business, government
and academia to identify and
remove barriers to economically
viable green economy
infrastructure solutions. Our vision
is a thriving prosperous Africa,
mobilised by the green economy
Working in developing countries,
GreenCape catalyses the
replication and large-scale uptake
of green economy solutions to
enable each country and its
citizens to prosper. We work with
businesses, investors, academia
and government to help unlock
the investment and employment
potential of greentech and services,
and to support a transition to a
resilient green economy.
We assist businesses by
removing barriers to their
establishment and growth and
provide our members with:
• free, credible and impartial
market information and insights
• access to networks of key players
in government, industry, finance
and academia
• an advocacy platform to help
create an enabling policy and
regulatory environment for
green business
We assist local, provincial
and national government to
build a resilient green economy
by providing:
• support on the development
of standards, regulations, tools
and policies
• expert technical knowledge on
key sectors in the green economy
• access to networks of key players
across business, academia, and
internationally
Since inception in 2010, GreenCape
has grown to a multi-disciplinary
team of over 40 staff members,
representing backgrounds in
finance, engineering, environmental
science and economics.
Our market intelligence reports
form part of a working body
of information generated by
sector desks and projects
within GreenCape’s three main
programmes – energy, circular
economy and resources.
Benefits of becoming a
GreenCape member
We currently have over
2 500 members, and offer free
membership. Becoming a member
of GreenCape will give you access
to the latest information regarding
developments in the various
sectors; access to tools, reports,
and project information; and offer
you the opportunity – through our
networking events – to meet and
interact with various stakeholders
in the green economy.
CLICK HERE
TO BECOME
A GREENCAPE
MEMBER
We have facilitated and
supported ~R41bn of investments
in renewable energy projects
and manufacturing. From these
investments, more than19 000
jobs have been created.
Through our WISP (industrial
symbiosis) programme, by
connecting businesses with
waste / under-used resources:
309 200 fossil GHG
emissions saved
(equivalent to the
electrical usage of
39 800 households in SA);
Over R120 million
generated in
financial benefits
(additional revenue,
cost savings and private
investments);
69 permanent
jobs in member
companies, as well
as 25 temporary
positions, and 218 economy-
wide jobs in supply chains
have been created.
80
EN
ER
GY
SE
RV
IC
ES
: M
IR
20
21

REFERENCES
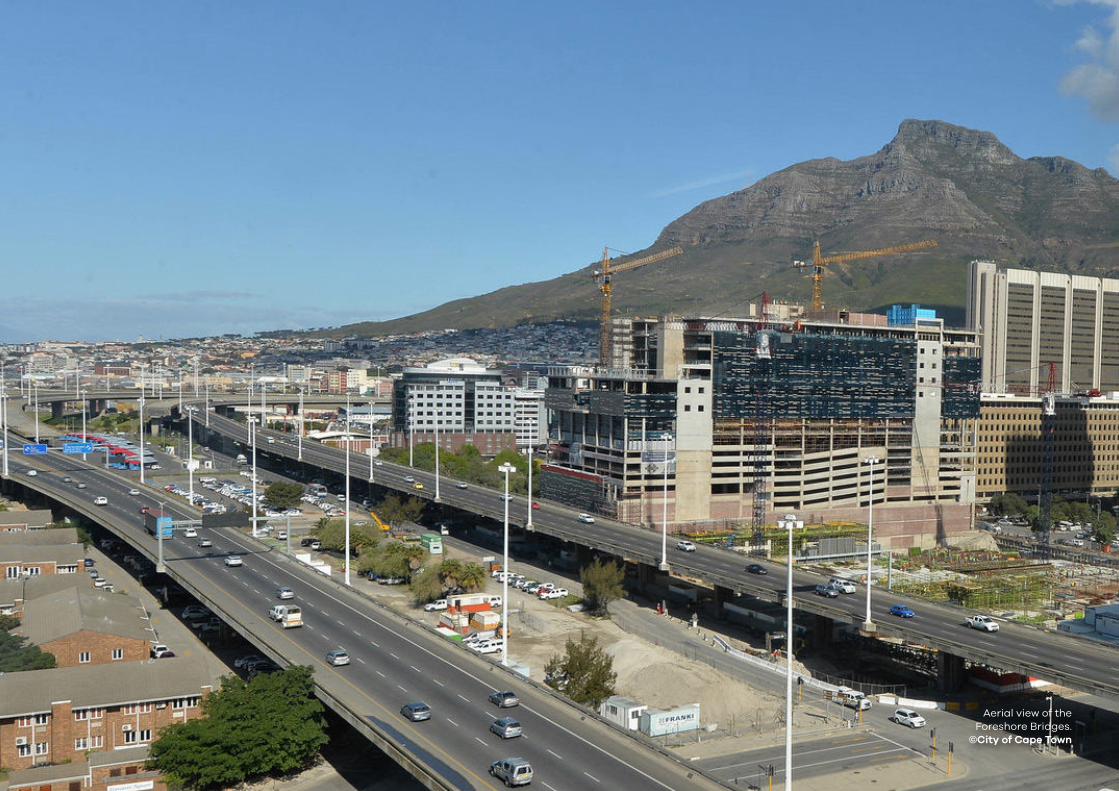
Aerial view of the
Foreshore Bridges.
©City of Cape Town
03
83
EL
EC
TR
IC V
EH
ICL
ES
: MIR
20
21
AASA 2020. Road Accident Fund.
Available from <https://www.
aa.co.za/fuel-pricing>. [Accessed
November 2020].
Autotrader 2020. Electric Vehicle
buyers survey. Available: https://
reports.autotrader.co.za/
industry/2020-EV-buyers-survey/.
[Accessed November 2020].
Barnes, Justine & Black, Anthony,
2017. Developing a South African
Automotive Masterplan to 2035
in the context of Global Value
Chain drivers: Lessons for second-
tier automotive economies.
Paper prepared for the GERPISA
Colloquium, 14 to 16 June 2017,
Paris, France.
Benchmark Mineral Intelligence
2020. Price reporting agency &
market intelligence for lithium-ion
battery, electric vehicle & energy
storage supply chains. Available:
https://www.benchmarkminerals.
com/. [Accessed November 2020].
Bloomberg New Energy Finance
(BNEF). 2018. Cumulative Global
EV Sales Hit 4 Million. Available
from: < https://about.bnef.com/
blog/cumulative-global-ev-sales-
hit-4-million/> [Accessed 29
January 2019].
Businesstech 2017. How fuel prices
have changed in South Africa
over the past 10 years. Available
from: <https://businesstech.co.za/
news/energy/176603/how-fuel-
prices-have-changed-in-south-
africa-over-the-past-10-years/>
[Accessed 11 February 2019].
BusinessWire 2018. Electric Vehicle
Market by Type, and Vehicle Type
– Global Opportunity Analysis
and Industry Forecast, 2018-
2025. Available from <https://
www.businesswire.com/news/
home/20180827005257/en/Global-
Electric-Vehicle-Market-2018-
2025-567.3-Billion>
[Accessed 11 February 2019].
C40 Cities 2018. How the FSCI
is Helping Cities Rethink Bus
Procurement. Available: https://
www.c40.org/blog_posts/how-
the-fsci-is-helping-cities-rethink-
bus-procurement. [Accessed
November 2020].
Cision PR Newswire. 2019 Study of
the South African Motor Vehicle
Industry – Size and State of the
Industry, Key Influencing Factors,
Competitive Analysis and Outlook.
27 December 2019. Available from
<https://www.prnewswire.com/
news-releases/2019-study-of-
the-south-african-motor-vehicle-
industry---size-and-state-of-
the-industry-key-influencing-
factors-competitive-analysi-
s-and-outlook-300979519.html>
[Accessed February 2020]
CSIR 2015. Cape Town: State of
Energy Report. Pp 11-95.
Cunliffe, Guy et al. 2018. Brown
to Green. Available: https://
www.climate-transparency.
org/g20-climate-performance/
g20report2018#1531904263713-
04b62b8d-e708. [Accessed
November 2020].
Department of Energy (DOE) 2017.
Overview of the Petrol and Diesel
Market in South Africa between
2007 and 2016. Pretoria, South
African Government.
Department of Environmental
Affairs (DEA) 2018. South Africa
State of Waste. A report on the
state of the environment. First
draft report. Pretoria, South
African Government.
Department of Trade and Industry
(dti). Industrial Procurement 2011.
Available from: <http://www.dti.
gov.za/industrial_development/
ip.jsp> [Accessed November 2018].
Department of Trade, Industry
and Competition (dtic). 2019.
Technology and Human Resources
for Industry Programme
(THRIP). Available from:
<https://nationalgovernment.
co.za/units/view/46/department-
of-trade-industry-and-
competition-the-dtic>
Department of Transport (DoT)
2018. Green Transport Strategy for
South Africa: (2018-2050). Available
from: <http://www.transport.gov.
za/documents/11623/89294/Green_
Transport_Strategy_2018_2050_
onlineversion.pdf/71e19f1d-259e-
4c55-9b27-30db418f105a> Pretoria,
South African Government.
84
EL
EC
TR
IC V
EH
ICL
ES
: MIR
20
21
eNaTIS 2020. Live vehicle
population as per the National
Traffic Information System.
Available: http://www.enatis.com/.
[Accessed November 2020].
European Commission 2020. A
European Green Deal. Available:
https://ec.europa.eu/info/strategy/
priorities-2019-2024/european-
green-deal_en. [Accessed
November 2020].
IEA 2019. Global EV Outlook 2019.
20 May. Scaling up the transition
to electric mobility. Available from:
<https://www.iea.org/reports/
global-ev-outlook-2019> [Accessed
November 2019].
IEA 2020. Data and statistics.
Available: https://www.iea.
org/data-and-statistics?
country=SOUTHAFRIC&fuel=
Energy% 20consumption
&indicator= TFCShareBySector.
Last accessed November 2020.
InsideEVs 2020. Global Plug-In
Electric Car Sales August 2020:
Close To 241,000. Available: https://
insideevs.com/news/446657/
global-plugin-electric-car-
sales-august-2020/. [Accessed
November 2020].
Labuschagne, H., 2021. How
much it costs to import a
Tesla to South Africa. [online]
Mybroadband.co.za. Available
at: <https://mybroadband.co.za/
news/motoring/388258-how-
much-it-costs-to-import-a-tesla-
to-south-africa.html>
[Accessed 6 March 2021].
Lamprecht, Norman 2018.
Automotive Export Manual
2017. Available from: <http://
www.aiec.co.za/Reports/
AutomotiveExportManual.pdf>
[Accessed 20 January 2019].
Mineral Council of South Africa
(2019). Fact and Figures 2019.
Pretoria: MCSA. Pp 4-43.
National Association of Automobile
Manufacturers of South Africa
(2020). Auto Dashboard. Available:
https://NAAMSA.net/. [Accessed
November 2020].
National Household Travel Survey
(NHTS) 2013. Revised July 2014.
Statistics South Africa. Available
from < http://www.statssa.gov.za/
publications/P0320/P03202013.pdf.
National Treasury 2012. Invitation
and Evaluation of Bids Based on a
Stipulated Minimum Threshold for
Local Production and Content for
the Bus Sector. Available from:
<http://ocpo.treasury.gov.za/
Resource_Centre/Legislation/
INote%20on%20a%20stipulated%20
minimum%20threshold%20for%20
the%20bus%20sector.pdf> Pretoria,
South African Government.
National Treasury. 2019 Budget
Report. Available from <http://
www.treasury.gov.za/documents/
national%20budget/2019/review/
Chapter%204.pdf>
PlugShare 2019. Available from:
<https://www.plugshare.com/>
[Accessed 7 January 2019].
Preferential Procurement
Policy Framework Act 5 of
2000. Preferential Procurement
Regulations, 2017.
Randall, Tom 2016. Here’s How
Electric Cars Will Cause the Next
Oil Crisis. Bloomberg New Energy
Finance, 25 February. Available
from: < https://www.bloomberg.
com/features/2016-ev-oil-crisis/>
[Accessed November 2018].
Road Accident Fund 2020. Fuel
Levy. Available: www.raf.co.za.
[Accessed November 2020].
Rodrigue, JP 2017. The
Environmental Impacts of
Transportation. Available from:
< https://transportgeography.
org/?page_id=5711> [Accessed
March 2019].
Santander Trade Portal 2019.
South Africa: Reaching the
consumer. Available from: <https://
en.portal.santandertrade.com/
analyse-markets/south-africa/
reaching-the-consumers>
[Accessed November 2018].
SARS 2020. Carbon Tax. Available:
https://www.sars.gov.za/
ClientSegments/Customs-Excise/
Excise/Environmental-Levy-
Products/Pages/Carbon-Tax.aspx.
[Accessed November 2020].
Statistica 2020. Electric Mobility:
Norway Races Ahead. Available:
https://www.statista.com/
chart/17344/electric-vehicle-share/.
[Accessed November 2020].
03
85
EL
EC
TR
IC V
EH
ICL
ES
: MIR
20
21
TIPS. 2020. Harnessing electric
vehicles for industrial development
in South Africa. Available: https://
www.tips.org.za/research-archive/
sustainable-growth/green-
economy/item/3876-harnessing-
electric-vehicles-for-industrial-
development-in-south-africa.
[Accessed November 2020].
UNCC. 2020. The Paris Agreement.
Available: https://unfccc.int/
process-and-meetings/the-paris-
agreement/the-paris-agreement.
[Accessed November 2020].
UNIDO Low Carbon Transport
Project in South Africa (LCT-SA).
Unity in Sustainable Mobility:
Roadmap towards building a
unified electromobility industry
in South Africa. Available
from: <http://www.evia.org.za/
EVIA2016Booklet.pdf > [Accessed
January 2019].
US Geological Survey (USGS) 2020.
Mineral Commodity Summaries
2020. Available: https://pubs.
usgs.gov/periodicals/mcs2020/
mcs2020.pdf. [Accessed
November 2020].
Venter, I., 2021. Volvo to launch
its first electric car in South
Africa. [online] Engineering
News. Available at:
<https://www.engineeringnews.
co.za/article/volvo-to-launch-
its-first-electric-car-in-south-
africa-2021-03-09/rep_id:4136>
[Accessed 9 March 2021].
Wetpaint The Little Big Agency
2021. Wetpaint Strategic Marketing
Insights: The South African
Consumer. Available: https://
www.wetpaint.co.za/wetpaint-
strategic-marketing-insights-
the-south-african-consumer/
[Accessed 25 March 2021]
uYilo E-mobility Programme
2017. Sustainable Transport and
Mobility for Cities Workshop
-eThekwini Municipality. Available
from: <https://www.sanedi.org.
za/Cleaner%20Mobility/images/
Presentations/uYilo_UNIDO_
Sustainable_Transport_and_
Mobility_for_Cities_workshop_
HitenParmar_320170330.pdf>
[Accessed 6 February 2019].

The writing of this MIR was made possible with the generous
support of the Western Cape Government of South Africa.