System Level modelling of fuel cell driven electric vehicles
88
System Level modelling of fuel cell driven electric vehicles Master’s thesis in Electric Engineering ALBERT CERDÁN CODINA Elteknik Power Electronics Department CHALMERS UNIVERSITY OF TECHNOLOGY Gothenburg, Sweden 2017
-
Upload
khangminh22 -
Category
Documents
-
view
1 -
download
0
Transcript of System Level modelling of fuel cell driven electric vehicles

System Level modelling of fuelcell driven electric vehicles
Master’s thesis in Electric Engineering
ALBERT CERDÁN CODINA
Elteknik Power Electronics DepartmentCHALMERS UNIVERSITY OF TECHNOLOGYGothenburg, Sweden 2017


Master’s thesis 2017
System level modelling of fuel cell driven electricvehicles
ALBERT CERDÁN CODINA
Department of Energy and EnvironmentDivision of Electric Power Engineering
Chalmers University of TechnologyGothenburg, Sweden 2017
System level modelling of fuel cell driven electric vehiclesALBERT CERDÁN CODINA
© ALBERT CERDÁN CODINA, 2017.
Supervisor: Yujing Liu, Chalmers University of TechnologyExaminer: Yujing Liu, Department of Energy and Environment Environment
Master’s Thesis 2017Department of Energy and EnvironmentDivision of Electric Power EngineeringChalmers University of TechnologySE-412 96 GothenburgTelephone +46 31 772 1000
Cover: Basic illustration of the main principle of a fuel cell electric vehicle.
Typeset in LATEXPrinted by Chalmers ReproserviceGothenburg, Sweden 2017
iv

System level modelling of fuel cell driven electric vehiclesALBERT CERDÁN CODINADepartment of Energy and EnvironmentChalmers University of Technology
AbstractNowadays, climate change is an issue of major concern for the majority of the world’ssociety. Not just the emission of Greenhouse Gases but also the brutal pace at whichfossil fuels are being consumed.Within that topic and having innovation in mind, several alternatives have risenin the automotive industry in order to address this issue such as Battery ElectricVehicles or more recently at a commercial scale, Fuel Cell Vehicles. This last tech-nology uses hydrogen as a fuel and transforms the chemical energy generated in thereaction with oxygen in electricity able to drive an electric motor, usually a PMSM.This report will try to take an insight in this technology using different approaches.To do so, literature work will be done in order to review Hydrogen production,transportation and storage and how is now positioned as an energy resource in theworld. Moreover, fuel cell technologies will be reviewed and explained as well ascompared. Also, some literature work will be done in order to explain how a fuelcell vehicle operates and which are the most important elements of its drivetrain,also evaluating cost and feasibility of this kind of automotive solution.Having reviewed the current state of the art of fuel cell technologies, this reportwill explain how the electric drivetrain of a fuel cell vehicle can be modelled in aSimulation platform such as MATLAB/Simulink. The most important elements ofthe fuel cell vehicle drivetrain will be modelled (Fuel cell stack, boost converter,power systems, etc.) and will be tested to see how they behave on its own and as apart of a small vehicle fuel cell drivetrain.With the obtained results several conclusions were extracted as well as some futurework pathways such as adapting the small scale model to a full power commercialvehicle model.In all, this report will try to make clear how fuel cell vehicles can be considered asa feasible alternative to substitute conventional mobility methods.
Keywords: Fuel, cell, vehicle, hydrogen, Matlab/Simulink, electromobility.
v


AcknowledgementsI would like to thank professor Yujing Liu of the department of Energy and Envi-ronment at Chalmers University of Technology for all the help and advice offeredthroughout the whole making of this thesis and broadening my knowledge in thefield of power electronics.I would also like to thank Stefan Bohatsch, Robert Eriksson and Martin Andreasson,employees at Volvo Cars AB for all the feedback given in the held meeting at Volvoheadquarters in Gothenburg.Also thank Felix Haberl, sales engineer at Powercell AB for a more than instructivevisit to Powercell facilities and laboratories and for being able to provide importantclarifications to my understanding of fuel cell technologies.Finally, I would like to thank my family and friends for the continuous support,without which I would have not gotten this far.
Albert Cerdán Codina, Göteborg, July 2017
vii


Abbreviations
AC Alternate currentAFC Alkaline fuel cellBEV Battery electric vehicleDC Direct currentDMFC Direct methanol fuel cellFCV Fuel cell vehicleGDL Gas Diffusion LayersGHG Greenhouse GasesHPE High Pressure ElectrolysisHV High VoltageIC Internal combustionMCFC Molten carbonate fuel cellMOSFET MOS Field Effect TransistorPAFC Phosphoric acid fuel cellPEC PhotoelectrochemicalPEMFC Polymer electrolyte membrane fuel cellPEM Proton exchange membrane, Polymer electrolyte membranePFSA Perfluorosulfonic acid, NafionPTFE PolytetrafluoroethylenePWM Pulse Width ModulationRFC Reversible Fuel CellRFC Reversible fuel cellSOFC Solid oxide fuel cellSTCH Solar Thermochemical Hydrogen
ix


Contents
List of Figures xiii
List of Tables xv
1 Introduction 11.1 Background . . . . . . . . . . . . . . . . . . . . . . . . . . . . . . . . 11.2 Aim . . . . . . . . . . . . . . . . . . . . . . . . . . . . . . . . . . . . 21.3 Limitations . . . . . . . . . . . . . . . . . . . . . . . . . . . . . . . . 21.4 Methods . . . . . . . . . . . . . . . . . . . . . . . . . . . . . . . . . . 2
2 Hydrogen production, transportation and storage 32.1 Hydrogen production . . . . . . . . . . . . . . . . . . . . . . . . . . . 3
2.1.1 Steam Reforming . . . . . . . . . . . . . . . . . . . . . . . . . 32.1.2 Gasification . . . . . . . . . . . . . . . . . . . . . . . . . . . . 42.1.3 Partial Oxidation . . . . . . . . . . . . . . . . . . . . . . . . . 52.1.4 Water Splitting and Electrolysis . . . . . . . . . . . . . . . . . 6
2.1.4.1 High Pressure Electrolysis . . . . . . . . . . . . . . . 72.1.4.2 High Temperature Electrolysis . . . . . . . . . . . . 72.1.4.3 Thermochemical Water Splitting . . . . . . . . . . . 82.1.4.4 Photoelectrochemical Water Splitting . . . . . . . . . 8
2.2 Hydrogen transportation . . . . . . . . . . . . . . . . . . . . . . . . . 82.2.1 Pipeline transportation . . . . . . . . . . . . . . . . . . . . . . 82.2.2 Batch transportation . . . . . . . . . . . . . . . . . . . . . . . 9
2.3 Hydrogen storage . . . . . . . . . . . . . . . . . . . . . . . . . . . . . 9
3 Fuel Cells 113.1 Fuel cell mode of operation . . . . . . . . . . . . . . . . . . . . . . . . 113.2 Parts of a fuel cell . . . . . . . . . . . . . . . . . . . . . . . . . . . . . 12
3.2.1 Membrane electrode assembly . . . . . . . . . . . . . . . . . . 123.2.1.1 Polymer electrolyte membrane . . . . . . . . . . . . 123.2.1.2 Catalyst layers . . . . . . . . . . . . . . . . . . . . . 123.2.1.3 Gas diffusion layers . . . . . . . . . . . . . . . . . . . 13
3.2.2 Gaskets . . . . . . . . . . . . . . . . . . . . . . . . . . . . . . 143.2.3 Bipolar plates . . . . . . . . . . . . . . . . . . . . . . . . . . . 14
3.3 Types of a fuel cell . . . . . . . . . . . . . . . . . . . . . . . . . . . . 153.3.1 Polymer electrolyte membrane fuel cells . . . . . . . . . . . . . 153.3.2 Direct methanol fuel cells . . . . . . . . . . . . . . . . . . . . 16
xi

Contents
3.3.3 Alkaline fuel cells . . . . . . . . . . . . . . . . . . . . . . . . . 163.3.4 Phosphoric acid fuel cells . . . . . . . . . . . . . . . . . . . . . 173.3.5 Molten carbonate fuel cells . . . . . . . . . . . . . . . . . . . . 183.3.6 Solid oxide fuel cells . . . . . . . . . . . . . . . . . . . . . . . 193.3.7 Reversible fuel cells . . . . . . . . . . . . . . . . . . . . . . . . 203.3.8 Fuel cell technology comparison . . . . . . . . . . . . . . . . . 21
3.4 Fuel cell systems . . . . . . . . . . . . . . . . . . . . . . . . . . . . . 213.4.1 Fuel processor . . . . . . . . . . . . . . . . . . . . . . . . . . . 213.4.2 Power conditioners . . . . . . . . . . . . . . . . . . . . . . . . 213.4.3 Air compressors . . . . . . . . . . . . . . . . . . . . . . . . . . 223.4.4 Humidifiers . . . . . . . . . . . . . . . . . . . . . . . . . . . . 22
4 Fuel Cell Vehicles 234.1 Elements of an automotive fuel cell system . . . . . . . . . . . . . . . 24
4.1.1 Hydrogen tank . . . . . . . . . . . . . . . . . . . . . . . . . . 244.1.2 Fuel cell stack . . . . . . . . . . . . . . . . . . . . . . . . . . . 244.1.3 Battery stack . . . . . . . . . . . . . . . . . . . . . . . . . . . 254.1.4 DC Boost converter . . . . . . . . . . . . . . . . . . . . . . . . 254.1.5 DC/DC converter . . . . . . . . . . . . . . . . . . . . . . . . . 264.1.6 Inverter . . . . . . . . . . . . . . . . . . . . . . . . . . . . . . 274.1.7 Motor . . . . . . . . . . . . . . . . . . . . . . . . . . . . . . . 294.1.8 Cooling system . . . . . . . . . . . . . . . . . . . . . . . . . . 30
4.2 Drivetrain layout comparison . . . . . . . . . . . . . . . . . . . . . . 304.3 Cost analysis of a FCV . . . . . . . . . . . . . . . . . . . . . . . . . . 32
5 System Design and Simulations 355.1 Fuel Cell Stack . . . . . . . . . . . . . . . . . . . . . . . . . . . . . . 35
5.1.1 Voltage Output for the Fuel Cell Stack . . . . . . . . . . . . . 355.1.2 Voltage Drops for the Fuel Cell Stack . . . . . . . . . . . . . . 365.1.3 Thermodynamical Equations . . . . . . . . . . . . . . . . . . . 38
5.2 Boost converter . . . . . . . . . . . . . . . . . . . . . . . . . . . . . . 405.3 Power systems . . . . . . . . . . . . . . . . . . . . . . . . . . . . . . . 425.4 Dynamic model . . . . . . . . . . . . . . . . . . . . . . . . . . . . . . 44
6 Results 496.1 Fuel cell stack simulation . . . . . . . . . . . . . . . . . . . . . . . . . 496.2 Boost converter and fuel cell stack . . . . . . . . . . . . . . . . . . . . 526.3 Power systems . . . . . . . . . . . . . . . . . . . . . . . . . . . . . . . 546.4 Fuel cell vehicle system . . . . . . . . . . . . . . . . . . . . . . . . . . 56
7 Future Work 61
8 Conclusion 63
A Appendix 1 IA.1 Model Figures . . . . . . . . . . . . . . . . . . . . . . . . . . . . . . . IA.2 MATLAB/Simulink Simulation startup script . . . . . . . . . . . . . IV
xii

List of Figures
2.1 Steam reforming process . . . . . . . . . . . . . . . . . . . . . . . . . 42.2 Gasification process [2] . . . . . . . . . . . . . . . . . . . . . . . . . . 52.3 Electrolysis of water . . . . . . . . . . . . . . . . . . . . . . . . . . . 62.4 High temperature electrolysis [3] . . . . . . . . . . . . . . . . . . . . . 7
3.1 Proton exchange membrane fuel cell mode of operation . . . . . . . . 113.2 Parts of the membrane electrode assembly in a fuel cell . . . . . . . . 133.3 Drawing of a polymer exchange membrane fuel cell . . . . . . . . . . 153.4 Drawing of a direct methanol fuel cell . . . . . . . . . . . . . . . . . . 163.5 Drawing of an alkaline fuel cell’s mode of operation and a NASA’s
alkaline fuel cell stack for aerospace purposes [4] . . . . . . . . . . . . 173.6 Drawing of a phosphoric acid fuel cell . . . . . . . . . . . . . . . . . . 183.7 Drawing of a molten carbonate fuel cell . . . . . . . . . . . . . . . . . 193.8 Drawing of a solid oxide fuel cell [5] . . . . . . . . . . . . . . . . . . . 20
4.1 Boost converter general scheme . . . . . . . . . . . . . . . . . . . . . 254.2 Boost converter continuous mode waveforms [6] . . . . . . . . . . . . 264.3 Boost converter discontinuous mode waveforms [7] . . . . . . . . . . . 264.4 Buck converter general scheme . . . . . . . . . . . . . . . . . . . . . . 274.5 Three phase inverter general scheme . . . . . . . . . . . . . . . . . . . 284.6 Pure sine wave versus three level modified sine wave . . . . . . . . . . 284.7 Pulse width modulation mode of operation example . . . . . . . . . . 294.8 Audi h-tron block diagram . . . . . . . . . . . . . . . . . . . . . . . . 314.9 Toyota Mirai block diagram . . . . . . . . . . . . . . . . . . . . . . . 314.10 Honda Clarity block diagram . . . . . . . . . . . . . . . . . . . . . . 324.11 Average cost shares for a FCV . . . . . . . . . . . . . . . . . . . . . . 33
5.1 Double layer charge effect in a fuel cell . . . . . . . . . . . . . . . . . 375.2 Part of the electrical system of the PEMFC model . . . . . . . . . . . 385.3 Part of the electrical system of the PEMFC model . . . . . . . . . . . 385.4 Part of the electrical system of the PEMFC model . . . . . . . . . . . 405.5 Model of the boost converter with a load . . . . . . . . . . . . . . . . 405.6 Model of the boost controller . . . . . . . . . . . . . . . . . . . . . . 415.7 Discharge curve for the chosen Li-ion battery configuration . . . . . . 425.8 Power systems structure . . . . . . . . . . . . . . . . . . . . . . . . . 435.9 Control block of power system . . . . . . . . . . . . . . . . . . . . . . 435.10 Dynamic Model Implementation . . . . . . . . . . . . . . . . . . . . . 45
xiii

List of Figures
5.11 Aerodynamic drag force implementation . . . . . . . . . . . . . . . . 465.12 Simulink implementation of the rolling force of a vehicle . . . . . . . 465.13 Simulink implementation for the grading force of a vehicle . . . . . . 47
6.1 Full structure of the PEMFC stack . . . . . . . . . . . . . . . . . . . 496.2 Stack power response to a constant current input of 20 A . . . . . . . 506.3 Stack voltage response to a constant current input of 20 A . . . . . . 506.4 Stack power response to a linear variation in load current . . . . . . . 516.5 Stack voltage response to a linear variation in load current . . . . . . 526.6 Boost converter voltage output curve . . . . . . . . . . . . . . . . . . 536.7 Boost converter voltage output curve . . . . . . . . . . . . . . . . . . 536.8 Scheme of fixed values power systems test . . . . . . . . . . . . . . . 546.9 Inverter output current . . . . . . . . . . . . . . . . . . . . . . . . . . 556.10 Zoomed graph of inverter output current . . . . . . . . . . . . . . . . 556.11 Driving cycle implemented as system testing, in the perspective of
motor speed request . . . . . . . . . . . . . . . . . . . . . . . . . . . 566.12 Fuel cell stack power output throughout the full driving cycle . . . . 576.13 Output voltage from the boost converter throughout the full driving
cycle . . . . . . . . . . . . . . . . . . . . . . . . . . . . . . . . . . . . 586.14 Inverter current throughout the full driving cycle . . . . . . . . . . . 596.15 Motor power output throughout the full driving cycle . . . . . . . . . 60
A.1 Resultant model of the drivetrain of the fuel cell vehicle . . . . . . . . IA.2 Simulink implementation of the testing driving cycle . . . . . . . . . . IA.3 Detail of force calculation, as well as PEFC and boost converter im-
plementation . . . . . . . . . . . . . . . . . . . . . . . . . . . . . . . IIA.4 Display of the power systems of the model . . . . . . . . . . . . . . . IIA.5 Power calculations in the FCV model . . . . . . . . . . . . . . . . . . IIIA.6 Thermal structure of the PEMFC stack . . . . . . . . . . . . . . . . . IIIA.7 Part of the electrical structure of the PEMFC stack . . . . . . . . . . IVA.8 Part of the electrical structure of the PEMFC stack . . . . . . . . . . IV
xiv

List of Tables
3.1 Comparison of different fuel cell technologies . . . . . . . . . . . . . . 21
4.1 Cost of the main components in a FCV drivetrain (Year 2007) [8] . . 32
5.1 Dynamic constants values for the chosen vehicle model . . . . . . . . 48
xv

List of Tables
xvi

1Introduction
1.1 BackgroundIn the last few decades it has been demonstrated not only that global warmingexists, but that if society continues to pollute and consume fossil fuels at this pace,will be irreversible. Moreover, it is clear enough to the major part of the societythat the pace at which fossil fuels are being consumed is not sustainable enough andalternatives are needed in order to substitute petrol, coal and natural gas.
Nowadays there are many technologies that could actually partially or even totallysubstitute fossil fuels in energy matters, all related in some way to electricity pro-duction such as hydro power generation, wind power, photovoltaic, solar thermalenergy, etc.
Just as energy industry, automotive industry which is always in a context of constantinnovation has been inflicting change trying to find feasible alternatives to internalcombustion engines which are the main cause of fossil fuel consumption and pollutionin mobility currently.
During this last few years and in this context of constant innovation, several alter-natives for internal combustion engines arose with the aim to find feasible optionsto fossil fuel consuming devices.
As one may recall, the main alternative for internal combustion cars is without adoubt BEVs (battery electric vehicle). Those vehicles rely on electricity in orderto function, storing the electricity in a battery pack and using it to feed a motorin order to give motion. However, some issues are still to solve in order to makethem as appealing as internal combustion cars. Two of the most important issuesto tackle are mileage range and charging time.
On the other hand, fuel cell technology which began in the late sixties is beginningto take part in the automotive sector. Fuel cell technology converts chemical energyfrom a fuel into electricity through a chemical reaction by combining hydrogen froma continuous supply and oxygen from the air. As hydrogen makes its way through anelectrolyte, electricity is generated. In the same way, hydrogen mixes with oxygenpresent in the air leaving nothing but water as a by-product of the process. Recentlycompanies like Toyota, Hyundai, Honda or Nikola Motors have been making progressin this technology, and even launching commercial models sucha s the Toyota Mirai.
This type of technology takes advantage of hydrogen being the most abundant ele-ment in nature and tackles the problem of autonomy range and recharge time. On
1

1. Introduction
the other hand, nowadays hydrogen production is almost entirely accomplished byfossil fuel consumption.
1.2 AimThis thesis has two different approaches. First, reviewing the various methods inwhich hydrogen is produced, transported and stored, as well as reviewing existingfuel cell technologies and how this technologies have been applied in the automotivesector.Second and applying this knowledge, a Matlab/Simulink model of the electric systemof a fuel cell vehicle will be implemented, taking in account all important parts ofthe system such as the PEMFC stack, the boost converter and the various powersystems in order to see how a system of this kind behaves and how this elementsinteract with one another.In order to achieve this aim several questions have been raised:
• How is hydrogen currently produced, transported and stored?• Which are the current technologies regarding fuel cell and which of those have
better properties and benefits regarding autowhen it comes to the automotivesector?
• How main fuel cell vehicle components operate and how they behave whenworking in synchrony?
1.3 LimitationsRegarding this thesis, limitations in perfecting a system and therefore a solution aremostly based in the delivery time. As time as an important limiting factor, only fewtests will be evaluated and several hypothesis will be made regarding simulations inorder deliver a complete result.
1.4 MethodsIn order to review existing hydrogen, fuel cell and automotive industry fuel cellsolution, literature work will be done.Furthermore when model the elements of a fuel cell vehicle, MATLAB/Simulinkplatform will be done, obtaining system level models for all drivetrain elements fora fuel cell vehicle.
2
2Hydrogen production,
transportation and storage
2.1 Hydrogen production
As hydrogen doesn’t typically exist by itself in nature, some processes have to becarried in order to obtain hydrogen as an energy carrier. Currently, most of hydrogenproduction comes from fossil fuel sources such as Natural Gas, Oil and Coal. Therest of hydrogen production is covered by alternative and renewable energy sourcessuch as nuclear power, biomass, wind, geothermal, solar thermal, hydro-electric andsolar photovoltaic power.
Current annual production is situated at 65 million metric tonnes of hydrogen,which is equivalent to approximately 8000PJ, a 2% of the world’s total primaryenergy supply. If we divide hydrogen production by energy source, it can be seenthat 48% comes from natural gas, 30% comes from oil refineries/chemical refineries,18% from coal and only the remaining 4% from water electrolysis[1].
As seen, hydrogen can be obtained through a very wide range of processes. Hereare listed and explained the most common and important ones:
2.1.1 Steam Reforming
Steam-methane reforming, or steam reforming is the most common method for hy-drogen production throughout the world, representing over 3840PJ of the total pro-duced hydrogen, and might be probably the most important technology pathway fora near-term hydrogen production, as this technology is far advanced and mature.
Steam reforming is an endothermic process (heat must be supplied in order for thereaction to take place) consisting in using a methane source such as natural gas andmaking it react with high temperature steam (roughly between 700°C and 1,000°C).The steam is put under 3 to 25 bar of pressure and all agents are in presence of acatalyst that helps the reaction take place. By-products of the reaction are hydrogen,carbon monoxide and carbon dioxide.
3

2. Hydrogen production, transportation and storage
Figure 2.1: Steam reforming process
The chemical reaction for a high temperature steam reforming process would be theone listed below:
CH4 + H2O −−⇀↽−− CO + 3 H2 (2.1)
Once finished the first step of the process, carbon monoxide is submitted to anotherprocess in order to eliminate carbon monoxide and obtain carbon dioxide and morehydrogen. This process is called water-gas shift reaction, and the reaction would beas listed:
CO + H2O −−⇀↽−− CO2 + H2 (2.2)
Note that for this second process the amount of heat that needs to be given is muchless considerable than in the first process. In order to obtain pure hydrogen, theobtained mixture is put through a final step called pressure swing adsorption, whichessentially removed carbon dioxide and by-products and waste to eventually leavepure hydrogen.
2.1.2 GasificationThe gasification process accepts multiple feedstocks such as coal, biomass, waste,petrol coke, or natural gas. Practically in the same way as the steam reforming pro-cess, coal, biomass etc. are put through a series of high temperatures and pressuresalong with oxygen and steam in order to obtain syngas (mainly carbon monoxideand hydrogen) and then, just as in the steam reforming process, the syngas is putthrough the water-gas shift reaction to obtain hydrogen and carbon dioxide.
4

2. Hydrogen production, transportation and storage
Figure 2.2: Gasification process [2]
Once more, when all processes are finished, hydrogen meeds to be separated fromboth carbon dioxide and other impurities in order to obtain pure useful Hydogen.Differently than in steam reforming, in gasification appear as well sulfur and slag asby-products, as seen in Figure 2.2.Although these processes are not completely environmentally friendly as carbondioxide is created, there are some existing solutions that help make hydrogen pro-duction a green process, such as carbon sequestration (process based on carbondioxide capture so it is not released into the atmosphere). While it is true that it isnot a vastly used technique, it helps making hydrogen production a clean process.
2.1.3 Partial OxidationPartial oxidation is a chemical process that takes advantage of the hydrocarbonsin fossil fuels such as natural gas and oil. When oxidising a fuel, one can obtainwater and carbon dioxide as by-products. However, if the amount of oxygen is notenough the chemical reaction obtained is a partial oxidation, where the obtainedby-products are carbon monoxide and hydrogen.Conventional combustion reaction:
CnHm+2n +m
4O2 −−→ nCO + m
2H2O (2.3)
Partial oxidation chemical reaction:
CnHm+n2
O2 −−→ nCO + m
2H2 (2.4)
5

2. Hydrogen production, transportation and storage
As seen in the chemical reactions (first one corresponding a natural combustionreaction, second one corresponding to partial oxidation reaction), one clear drawbackwould be that the amount of hydrogen produced per unit of fuel is less that in steamreforming or coal/biomass gasification. Nevertheless, partial oxidation processes donot require such big installations as in steam reforming processes and are muchfaster as well.
2.1.4 Water Splitting and ElectrolysisWatter splitting is the term used to refer to any kind of chemical reaction in whichwater is separated into oxygen and hydrogen. Achieving efficient and economicalwater splitting methods would be a key factor and breakthrough to hydrogen pro-duction, entailing green mass production of hydrogen and in that situation, makingcars GHG emission free. Several water splitting techniques have been developedthrough time but currently only 4% of global hydrogen production is done followingwater splitting techniques.Electrolysis is one kind of water splitting method which consists in breaking watermolecules into oxygen and hydrogen, by applying an electrical current to it, as seenin Figure 2.3. Electrolysis requires a large quantity of electricity in order to producehigh hydrogen quantities. For that reason, current methods such as steam reformingor gasification are much more used, as they require much less primary energy in orderto produce the same quantity if hydrogen.
Figure 2.3: Electrolysis of water
However, electricity can be provided through renewable sources such as hydropower,solar photovoltaic, wind, etc. although this means that produced electricity is morevaluable than the hydrogen produced, making this technique not feasible for eco-nomical benefits. A suitable candidate for electric production would also be nuclearpower.
6

2. Hydrogen production, transportation and storage
There are many different kinds of electrolysis and water splitting methods. Mostused ones are listed and explained below.
2.1.4.1 High Pressure Electrolysis
High pressure electrolysis or HPE consists has the same mode of operation than aconventional water electrolysis. For a high pressure electrolysis water is split andhydrogen goes through a proton exchange membrane staying separated from theoxygen. The difference between those two processes is the hydrogen output. In ahigh pressure electrolysis, the hydrogen output is compressed around a pressure of120 to 200 bar, which eliminates the need of an external compressor and therefore,total energy required per unit of produced hydrogen is less in a HPE than in aconventional electrolysis.There also exist ultra high pressure electrolysis where the output hydrogen is at apressure around 340 to 690 bar. For this process, modified proton exchange mem-brane are required in order not to affect hydrogen purity.
2.1.4.2 High Temperature Electrolysis
In high temperature electrolysis some of the energy required to obtain hydrogen issupplied in the form of heat rather than in electricity. This makes high temperatureelectrolysis more efficient than conventional electrolysis methods for two main rea-sons. First, electrolysis processes are more efficient at higher temperatures makingit easier to break the bonds between water molecules. Second, as heat is cheaperthan electricity, the overall process is more cost-efficient.Average temperatures for high temperature electrolysis processes is normally be-tween 100°C and 850°C. Considering that at higher temperatures efficiencies are aswell higher, to obtain the same amount of hydrogen less thermal energy would berequired at higher temperatures.
Figure 2.4: High temperature electrolysis [3]
7

2. Hydrogen production, transportation and storage
2.1.4.3 Thermochemical Water Splitting
Thermochemical water splitting consists in taking advantage of solar power, concen-trating solar radiation and therefore achieving temperatures between 500°C up to2000°C. Although this is still a long-term technology option, it can achieve eventu-ally no greenhouse gas emissions, which would make it one technological key factorin hydrogen production.One main advantage of thermochemical water splitting is that all chemicals usedalong all processes are re-utilised. This creates a process that only consumes waterand produces oxygen and hydrogen. However, in order to start the process, very hightemperatures are required (as stated in the paragraph above). These temperaturescan be reached following different methods:
• By concentrating sunlight into the receiver of a STCH reactor using a field ofeither plain heliostats or parabolic dish concentrators.
• Using waste heat from advanced nuclear reactors.Nowadays several types of thermochemical water splitting cycles have been inves-tigated and every one of them has its range of operating conditions and hydrogenproduction efficiencies. As said before, although being a long-term solution for hy-drogen production, high production rates and efficiencies can be reached and at acertain point no greenhouse gases would be emitted, making this water splittingprocess a very feasible solution for granting hydrogen supplies to the market.
2.1.4.4 Photoelectrochemical Water Splitting
Photoelectrochemical (PEC) water splitting is a process that consists in producinghydrogen from water using both sunlight and photoelectrochemical materials (whichare in fact specialized semiconductors). These materials use the energy form sunlightto split water molecules into hydrogen and oxygen.In the same way that happens with thermochemical water splitting, PEC watersplitting is a long-term solution for hydrogen production but it entails low or nogreenhouse gases emissions to the atmosphere. Also, this processes can obtain theenergy both from sunlight and nuclear energy processes.
2.2 Hydrogen transportationThere are currently several modes of hydrogen transportation divided into con-tinuous (or pipeline), batch and ocean transportation. Choosing either one thistransportation modes, it is crucial to have always pressurised vessels to transporthydrogen, which makes all transportation methods rather expensive. These differentmethods can be found explained in detail below.
2.2.1 Pipeline transportationGas and liquid hydrogen can be transported by pipeline. Taking this in mind,pipelines may vary in diameter, pressure, etc. Nevertheless, liquid hydrogen trans-
8

2. Hydrogen production, transportation and storage
portation by pipeline is mainly restricted to aerospace industry, where having liquidhydrogen is essential for the space shuttle. Otherwise, the amount of energy given tohydrogen just to keep it under cryogenic conditions is not feasible. For that reasonindustrial transportation of hydrogen occurs only with gaseous hydrogen.Currently most pipeline systems are laid underground in order not to be affectedby external events that may damage the infrastructure, and are made commonmaterial and then covered in anticorrosion coating in order not to be affected byembrittlement.
2.2.2 Batch transportationBatch transportation for hydrogen is the most used method for transporting hydro-gen, mainly because it needs to be stored in vessels or tanks to be transported. Inthat way it is easily transported while already stored. Vessels for batch transporta-tion are filled either with compressed hydrogen or liquid hydrogen.Any batch transportation process has three distinct processes:
• A refining process in order to remove impurities from hydrogen. Dependingof the type of impurity that must be removed, different removal methods maybe applied such as gas absorption or adsorption methods.
• A compression stage in order to fill the corresponding tanks/vessels. Whenfilling the vessels hydrogen is usually compressed up to pressures around 15-30MPa.
• Transportation of the vessels.There also exists the possibility of ocean transportation in tankers, but currentlyliquid hydrogen tankers are not a widely accepted option to transport hydrogen dueto the high amount of energy needed to keep liquid hydrogen in cryogenic conditionsfor the long period it requires.
2.3 Hydrogen storageHydrogen can be stored in many ways. However the most common ones are com-pressed hydrogen cryogenic hydrogen and liquid hydrogen storage. Find this storagemodes explained below:
• Compressed hydrogen: Storage technique in which hydrogen is stored in tanksand pressurised. In the automotive industry, compressed hydrogen is kept ata pressure of either 350 bar or 700 bar, so tanks must be able to resist thishigh pressures without problem.
• Cryogenic hydrogen: This process consists in having hydrogen stored in tanksin liquid form, below hydrogen’s critical point. Moreover, the cryogenic liquidis also compressed. While this method ensures great density per volume unit,it also entails a great amount of energy in order to keep the tank at cryogenictemperatures.
9

2. Hydrogen production, transportation and storage
• Alternative storage techniques: While the two previous storage techniquesare physical-based, recent investigations point towards material-based hydro-gen storage. This means that using specific techniques such as absorption oradsorption, hydrogen molecules can be stored in certain materials, offeringlighter solutions and with more power density than current used technolo-gies. Nevertheless, this technology has to be considered in a mid to long termbreakthrough.
10
3Fuel Cells
3.1 Fuel cell mode of operation
Fuel cell are alike batteries, in the same way that they can be considered as a devicecapable of delivering sustained current and voltage when an energy input is givento them.
However, while a battery runs out of energy if not recharged, that is not the casefor a fuel cell. A fuel cell will supply energy whenever is supplied with fuel withoutrunning down on energy. This energy comes in two forms: electric energy and heat.
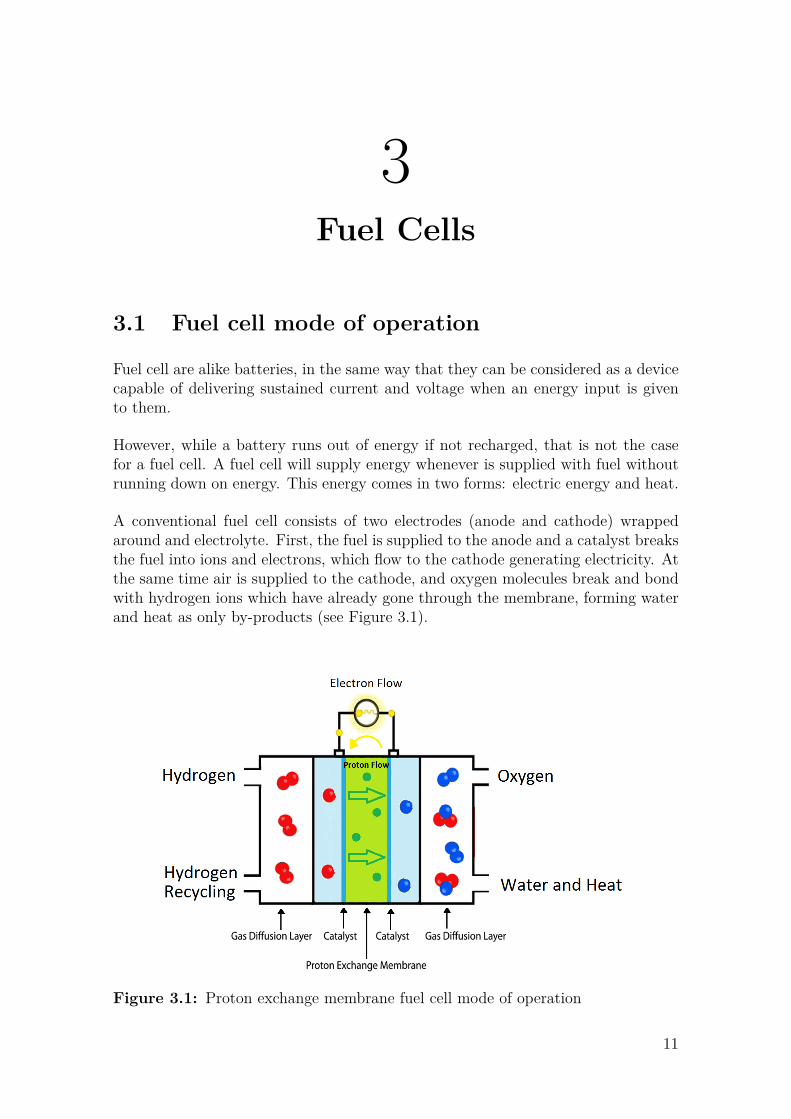
A conventional fuel cell consists of two electrodes (anode and cathode) wrappedaround and electrolyte. First, the fuel is supplied to the anode and a catalyst breaksthe fuel into ions and electrons, which flow to the cathode generating electricity. Atthe same time air is supplied to the cathode, and oxygen molecules break and bondwith hydrogen ions which have already gone through the membrane, forming waterand heat as only by-products (see Figure 3.1).
Figure 3.1: Proton exchange membrane fuel cell mode of operation
11

3. Fuel Cells
3.2 Parts of a fuel cellNowadays, most utilised and developed fuel cells for automotive applications arepolymer electrolyte membrane fuel cells (PEM). PEM fuel cells are made from dif-ferent materials, described below.
The main component of a PEM fuel cell is the membrane electrolyte assembly, whichincludes the membrane, the catalyst and gas diffusion layers.
To keep this structure all together, several annex components are used such asbipolar plates and gaskets. While bipolar plates are used to assemble each fuel cellinto a bigger fuel cell stack in order to obtain the desired output power, the gasketsare used to seal the membrane electrolyte assembly and prevent in that way thepossibility of gas leakage.
All this elements can be found described in more detail below.
3.2.1 Membrane electrode assembly3.2.1.1 Polymer electrolyte membrane
The polymer electrolyte membrane (PEM) also called proton exchange membranewhen working with hydrogen is a specialised device that only conducts positivelycharged particles through and blocks negatively charged particles. For that reason,when the catalyst breaks the hydrogen molecules into protons and electrons, pro-tons go through the membrane and electrons go from anode to cathode generatingelectricity.
This semi permeable membrane is the main key component to fuel cell vehiclesapplications as it is the responsible from obtaining electric energy by not lettingthrough electrons and other chemical substances that might cause the chemicalreaction to stop or not to reach the desired efficiency level.
Proton exchange membranes can be from many different materials. Nowadays themost common material can either be pure polymer or composite membrane, wherea material is wrapped around a polymer matrix. The most common material formembrane assembly nowadays is PFSA, a fluoropolymer also called Nafion. How-ever, companies are starting to change the trend towards organic membranes, whichare easier to recycle and entail less contamination while fabricating them. Averagethickness for membranes in vehicle applications is under 20 µm. Also, recent re-search has proofed that membranes can be implemented at atomic level, thanks tographene technology.
3.2.1.2 Catalyst layers
A catalyst is a chemical component that helps chemical reactions take place. Ina fuel cell, the catalyst is placed between the membrane and both the anode andthe cathode. Nowadays, conventional catalysts are made out of a very fine layer
12

3. Fuel Cells
(nanometers of thickness) of platinum and dispersed in a carbon support, whichis mixed with an ion-conducting polymer in order to let the ions flow through themembrane. The catalyst is normally put between the gas diffusion layers and themembrane. On the anode it helps the hydrogen split into protons and electrons andon the other side (cathode side) it helps the oxygen react with the protons enablingthe formation of water.
3.2.1.3 Gas diffusion layers
The gas diffusion layers (GDLs) are the element which helps in the transport bothhydrogen and the air stream into the catalyst and at the same time, helps the waterto flow out of the fuel cell.Gas diffusion layers are typically made of carbon coated with polytetrafluoroethylene(PTFE), a hydrophobic polymer that prevents water accumulation inside the fuelcell.When gases incise in the gas diffusion layers, they rapidly flow through the poresof the carbon surface and then arrive to a microporous surface made of a coat ofcarbon with PTFE needed to maintain the balance between water expulsion andwater retention, as some water is needed to maintain the fuel cell conductivity buttoo much reduces efficiency, as the pores in the gas diffusion layers need to be openin order to help the hydrogen and oxygen diffuse through the layers of the GDL andthe membrane, for finally arriving to the electrodes.
Figure 3.2: Parts of the membrane electrode assembly in a fuel cell
13

3. Fuel Cells
3.2.2 GasketsGaskets are a vital part in the assembly of the membrane of a fuel cell. As a fuelcell is comprised between two plates that keep the membrane together, gaskets areadded in order to make a gas seal. Gaskets are normally made out of elastomers(rubber polymers) so they can fit in the architecture of the fuel cell and gas doesn’tleak.
3.2.3 Bipolar platesAs said before, the membrane of a fuel cell is built between two plates. This socalled bipolar plates are put in the membrane fro two main reasons.
• First and foremost, a single conventional fuel cell produces in average lessthan 1V when submitted to typical operating conditions, and for automotivepurposes more voltage is needed (average 400V to 600V). That makes neces-sary to create stacks of fuel cells, and these need to be separated from oneanother. This is possible thanks to the bipolar plates, which insulate each cellto develop its full functionality.
• Second and having in mind that most bipolar plates are fabricated in materialssuch as metal or composites (Glass fibre or carbon fibre), these elements notjust bring the membrane altogether but also give stiffness and strength to thefuel cell and the fuel cell stack.
Those plates are usually machined following specialised patterns which try to getthe gases in and out in the most aerodynamically efficient way through the fuel cell.To set as an example, in the new Toyota Mirai, bipolar plates have been designedconcerning aerodynamics and flows of the intake and outtake gases and in thatway efficiency has been augmented drastically. There also exist additional channelsinside the plates for coolant circulation.
14

3. Fuel Cells
3.3 Types of a fuel cell
3.3.1 Polymer electrolyte membrane fuel cellsAs said before, polymer electrolyte membrane fuel cells, also called proton exchangemembrane fuel cells, are currently the most used type of fuel cell for most appli-cations, including transportation and automotive industry applications. This typeof cell is capable to deliver high power density (nowadays 0.7 W · cm2) as well asoffering low weight and volume when put aside other types of fuel cells.
Once again, proton exchange membrane fuel cells use a polymer as an electrolyte,carbon electrodes and gas diffusion layers and platinum based catalysts. The mainadvantage of this type of fuel cell is that they feed from hydrogen and oxygen fromthe air.
Figure 3.3: Drawing of a polymer exchange membrane fuel cell
Normal operating temperature for this type of fuel cell are around 80°C (consideredrelatively low temperatures). However, it has been proved that cold starts for fuelcell vehicles are possible even in below 0°C situations. As they are able to start in lowtemperatures, they have a quick start and that entail less wear of the componentsof the system and therefore, gives more durability to the whole set. Nevertheless,the use of platinum as catalyst increases the cost of the fuel cell stack drastically.
In all, PEMFC are a very suitable and feasible alternative for mass producing hy-drogen powered vehicles due to how technologically advanced and reliable they are,as well as their good power to weight ratio.
15

3. Fuel Cells
3.3.2 Direct methanol fuel cellsDirect methanol fuel cells use pure methanol as fuel intake, which is usually mixedwith water and fed directly into the fuel cell. As methanol has higher energy densitythan hydrogen, and has easier storage and transportation than hydrogen given thatmethanol is liquid as gasoline (current distribution network cold be useful). Normaloperating temperatures for direct methanol fuel cells are between 60°C and 130°C,depending on the operation conditions and the electrolyte is normally a polymer.
Direct methanol fuel cells are used to power up portable systems such as laptopsor mobile phones but also, this type of fuel cells has been starting to be utilisedfor military purposes due to its low noise and the non toxicity of the residue. Cur-rently there are existing devices with powers between 25 watts and 5 kilowatts withdurations up to 100 hours.
Figure 3.4: Drawing of a direct methanol fuel cell
3.3.3 Alkaline fuel cellsAlkaline fuel cells were the first model to be developed and in fact, the most widelyused in the U.S. space program in order to produce electricity and water on boardof the spacecrafts.This type of fuel cell contains a solution of potassium hydroxide
that uses as electrolyte although in more recent models, electrolyte can be madeof different kind of polymers as well. Alkaline fuel cells have been proved withefficiencies above 60%. This is in part due to the rate which electro-chemical reactiontake place in the cell.
16

3. Fuel Cells
However, this type of cells has a main problem which is poisoning by carbon dioxide(CO2). Having carbon dioxide poisoning can affect and decrease drastically thecell’s durability and efficiency, as carbonate is formed and stuck in the key workingcomponents.Nowadays, there exist two types of alkaline fuel cells; ones with a electrolyte solu-tion (KOH) and others with a polymer alkaline solution. First ones carry severalissues that affect global performance of the fuel cell such as high corrosion, pressurehandling difficulties and humidity levels. Alkaline polymer membrane ones try totackle this different issues and therefore, have a lower chance of CO2 poisoning aswell as better water management.
Figure 3.5: Drawing of an alkaline fuel cell’s mode of operation and a NASA’salkaline fuel cell stack for aerospace purposes [4]
3.3.4 Phosphoric acid fuel cellsPhosphoric acid fuel cells (PAFCs) use a solution of phosphoric acid as electrolyte.The phosporic acid is contained in a Teflon and silicon carbide matrix and betweencarbon electrodes and platinum catalysts. The reactions that take place in this typeof cell are the same as in a PEMFC, splitting hydrogen and bonding it to oxygen inorder to produce water.This type of fuel cell is considered to be one of the most mature fuel cell technologies,as it was the first to be used commercially. The uses for this type of fuel cell noware stationary power generation, but in some cases phosphoric acid fuel cells havebeen used for transportation purposes, implementing them in large vehicles such astrucks or metropolitan buses.
17

3. Fuel Cells
One advantage for phosphoric acid fuel cells is that they have more endurance infront of impurities in the hydrogen than proton exchange membrane fuel cells, asPEMFC have more easiness to bind carbon monoxide to the platinum catalyst inthe anode, making the efficiency decrease.
In phosphoric acid fuel cells for stationary power generation, average efficiency isaround 85% when used for co-generation of electricity and heat, and around 40%when solely used for electricity generation. These cells are typically large and heavyas they have a lower power per wheight ratio than other fuel cells and they areused for large energy amounts applications. In consequence, this type of cells areexpensive as they need a large quantity of platinum to be fed into the catalyst.
Figure 3.6: Drawing of a phosphoric acid fuel cell
3.3.5 Molten carbonate fuel cellsMolten carbonate fuel cells (MCFCs) use a molten carbonate mixture contained ina lithium aluminium oxide matrix. In order to keep the carbonate mixture molten,the cell has to work at very high temperatures of operation, which reduces the fieldof application for this type of fuel cells to industrial, power generation and milytaryapplications. However, as operating temperatures are around 650°C, many types ofmetals can be used as catalyst, reducing costs in manufacturing.
One major advantage of molten carbonate fuel cells in front of other types of fuelcells such as phosphoric acid fuel cells or proton exchange membrane fuel cells is thatdo not require an external fuel reformer, due to the high temperatures of operation.Fuels used in molten carbonate fuel cells are directly converted to hydrogen withinthe fuel cell (what is called internal reforming), which also reduces the overall cost.
Moreover, molten carbonate fuel cells also count with higher efficiency rates thanphosphoric acid fuels. While phosphoric acid fuel cells have efficiency rates of roughly40%, molten carbonate fuel cells can reach efficiencies up to 65% when assembled
18

3. Fuel Cells
with a turbine. Also, when the residual heat of the process is used (co-generation),fuel cell efficiencies can reach up to 85%.
Nevertheless and despite the advantages commented right before, molten carbonatefuel cells have one major disadvantage, which is durability. Taking in account thatoperating temperatures are around 650°C and also that molten carbonate is cor-rosive, component breakdown and corrosion are quite common in this type of cell.Of course, corrosion and component breakdown cause durability of the fuel cell todecrease. Recent studies are focused in corrosion-resistant materials that can extendthe fuel cell life up to approximately 5 years.
Figure 3.7: Drawing of a molten carbonate fuel cell
3.3.6 Solid oxide fuel cellsSolid oxide fuel cells (SOFC) use a solid oxide or non-porous ceramic compound aselectrolyte. While in overall efficiency this cells have rates of approximately 60%,when applied in co-generation systems efficiency can climb up to 85% rates.
This type of fuel cell operates at very high temperatures (normally higher than1000°C), which removes the need for the used of metals such as platinum as catalystsentailing a reduction of the overall cost of the fuel cell. Moreover, these temperaturesallow the fuel to reform internally such as in the molten carbonate fuel cell.
Other advantages include for example low emissions, long-term stability and fuelflexibility. Solid oxide fuel cells are also the most sulfur-resistant fuel cell type.Additionally this type of fuel cell cannot be poisoned by carbon monoxide and caneven be used as a fuel.
Nevertheless, having to work at high temperatures entails longer start-up times, itrequires a significantly effective thermal shielding in order to maintain the heat of
19

3. Fuel Cells
the process as well as protecting operators working alongside the fuel cell. As wellas in molten carbonate fuel cells, durability is one of the main problems in solidoxide fuel cells, as working in such high temperatures affects the life of the cellcomponents.
Is for that reason that new research lines are trying to tackle this issue in twodifferent ways:
• By finding cost-effective materials that are resistant to corrosion at currentoperating temperatures.
• By developing a possible lower temperature solid oxide fuel cell (around 700°C),that would in fact have fewer durability problems. However nowadays lowertemperature processes have not matched performance rates of high tempera-ture ones and this technology is still under investigation.
Without doubt the research for new materials to work in a more efficient way in thecell will be the key component for a technological breakthrough in solid oxide fuelcells.
Figure 3.8: Drawing of a solid oxide fuel cell [5]
3.3.7 Reversible fuel cellsReversible fuel cells (RFC) work the same way as conventional fuel cells, generatingelectricity and obtaining water and heat as by-products. However, reversible fuelcells can also take electricity from any source (may it be solar, hydroelectric, wind,etc.) and use it to convert water into hydrogen and oxygen using water splittingtechniques.
In that way, this type of fuel cell can produce energy when needed but at the sametime can use power peaks when other technologies produce in excess to produce andstore hydrogen. That capability of producing energy but storing hydrogen (possible
20

3. Fuel Cells
mass consume energy source in the future), could be a key factor in launching thiskind of technology into the majority of the society. It could be a good energy systemto implement in green households.
3.3.8 Fuel cell technology comparisonAs seen in the paragraphs above fuel cells present several differences regarding tem-perature of operation or even fuel and electrolyte type. We can see below an ex-planatory table with all fuel cell types, operating temperature and type of fuel andelectrolyte.
Operating Temperature (°C) Fuel ElectrolytePEMFC 40 - 90 H2 PolymerAFC 40 - 200 H2 KOHDMFC 60 - 130 Methanol PolymerPAFC 200 H2 Phosphoric AcidMCFC 650 H2, CH4, CO Molten carbonateSOFC 600 - 950 H2, CH4, CO Solid Oxide
Table 3.1: Comparison of different fuel cell technologies
3.4 Fuel cell systems
3.4.1 Fuel processorThe fuel processor in fuel cell systems is the element responsible for converting theprimary source of fuel into the usable form of fuel appropriate for every type of fuelcell. Depending on which type of fuel cell has the system, the fuel processor canbe a simple filter to remove impurities or a more complex system with reactors andfilters.
For systems using fuels such as methanol, gasified coal, gasoline or diesel, the con-ventional device widely used is a reformer, used to convert hydrocarbons into syngas(as explained in 2.1.1).
For other systems using fuels like molten carbonate or solid oxide, reforming can bedone internally in the fuel cell taking advantage of the high temperature of operationof the fuel cell. This process is called internal reforming. However this process willstill need filters to retain impurities before the reformed fuel reaches the fuel cell.
3.4.2 Power conditionersPower conditioners are vital for controlling all parameters of an electrical current tomeet the specifications of the system. These parameters include voltage, current,frequency, etc.
21

3. Fuel Cells
Fuel cells produce direct current and while many elements in the fuel cell systemwork with direct current, some other work with alternate current instead, as it isthe case of the motor. For each cases, we need two different types of controllers orconditioners:
• On one hand and in order to work with DC currents, DC/DC converters areneeded, usually boost converters to raise voltages between the battery and theinverter.
• On the other hand, to work with AC currents, it is usual to implement aninverter capable of transforming a certain DC current into an AC currentstream with the desired amplitude and frequency. This is needed because oneof the most important elements in the fuel cell system (as said before, themotor), works in the majority of cases with AC currents.Normally these converting and conditioning processes entail a reduction inefficiency as well, which goes between a 2% and a 6%.
3.4.3 Air compressorsAs fuel cell overall performance is increased when pressure of the reactant increasesas well, fuel systems include compressors which normally raise the pressure of theair intake up to 2 - 4 times the atmospheric pressure.When it comes to transportation purposes, air compressors should have an efficiencyof at least 75% and in some cases, an expander is also used to recover some powerfrom the high pressure exhaust gases. The efficiency of the expander should be ofat least 80%.
3.4.4 HumidifiersAs said before, polymer electrolyte membranes don’t work well when completely drybut when kept at a certain humidity level. For that reason many fuel cell systemsinclude humidifiers in order to raise the humidity of the inlet air to the fuel cell.Normally, the humidifier is made from the same material as the polymer electrolytemembrane. This allows the system to obtain humidity from the produced water inthe fuel cell and therefore keep the humidity in the fuel cell at the right level.
22

4Fuel Cell Vehicles
Once explained how hydrogen is obtained and how energy can be obtained from it,we can proceed to take an insight of what fuel cell vehicles are and which are thekey components of a fuel cell vehicle drivetrain.Fuel cell technology started in the 19th century with the first primitive models of fuelcells but it wasn’t until the year 1959 that fuel cells were implemented in a vehicle(a 15 kW fuel cell was implemented in an Allis-Chalmers tractor. Further on, thecold war and the space race between the US and the USSR brought fuel cell technol-ogy into deep investigation and development, with wide applications in aerospacetechnologies (as seen in 3.3.3 all fuel cells dedicated to aerospace technologies werealkaline fuel cells).In 1966 general motors launched their first FCV, the Chevrolet Electrovan but onlyone unit was made, as the project was rejected for being cost-prohibitive. It wouldn’tbe until the late 90s that most car companies would start developing their own FCVmodels.Nowadays there exist several companies that have placed a strong bet on fuel cellvehicles. The most important ones with cars already in the market are Toyota,Hyundai and Honda. Nevertheless other companies such as the Volkswagen group,Daimler or General Motors are developing their own car as well in order to preparefor the near future.Fuel cell vehicles have several key factors that may carry the automotive break-through in a mid-term period:
• First and foremost, even if hydrogen is produced with fossil fuels, the overallfuel cell vehicle contamination is 50% less than with a conventional inter-nal combustion car. That means that if all cars in a mid-term period wereswitched to fuel cell vehicles, greenhouse emissions would be drastically de-creased. Moreover if hydrogen is obtained by electrolysis and the electricityneeded for the process is obtained from renewable sources, no carbon dioxidenor carbon monoxide would be released into the atmosphere making the wholehydrogen cycle completely environmentally friendly.
• Range of fuel cell vehicles nowadays has matched the ranges for internal com-bustion vehicles and surpassed autonomy range of BEV (Battery Electric Ve-hicles).
• Hydrogen refueling takes about three minutes, where in the most technologi-cally advanced BEVs loads last up to 20 minutes.
23

4. Fuel Cell Vehicles
• Average life of a fuel cell stack is 10 to 15 years, which matches the averagelife of a car in current times, with no need for FC stack replacement.
However some put backs have to be considered too:
• Nowadays hydrogen production is not really clean, and up to 96% of producedhydrogen is obtained from either natural gas, coal or petroleum.
• Hydrogen refueling networks are fare from being well implemented. Currentlythe number of available hydrogen refueling stations is very limited and there-fore FCVs are not available to the major extent of the society.
• Scepticism about safety in fuel cell vehicles is a fact. Even though fuel cellvehicles are now completely safe and have diverse emergency protocols in caseof hydrogen leakage, there still exists a general perception that FCVs are notas safe as IC cars or BEVs.
4.1 Elements of an automotive fuel cell system
4.1.1 Hydrogen tankHydrogen tanks store the hydrogen in the vehicle at a certain pressure and conditionsin order to ease chemical reactions in the fuel cell stack. Regulations establishthat pressure in the tanks must be either 700 bar (High pressure) or 300 bar (Lowpressure) and while all main leading FCV brands have tank pressures of 700 bar,Honda bets for low pressure tanks in the Honda Clarity. Tanks must be strong andstiff enough to resist both internal and external events that may incur in possibletank damage. Those events may be higher inner pressures than expected, chassisvibrations, possible scratches and cracks, hydrogen leakage, etc.
For that reason tanks are made of composite materials, bestowing lightness and ro-bustness to the whole storage system. Tanks have several layers of several materialsin order to tackle those external and internal threats to the normal operation ofthe tank. Inner layers might be of plastic polymer in order to seal the hydrogen inthe tank and outer layers are normally made from carbon fibre reinforced plasticsand glass fibre reinforced plastics. When using composite materials overall resultsregarding strength and performance are enhanced.
In order to match autonomy ranges of internal combustion vehicles, fuel cell vehicleshave two or even three hydrogen tanks per vehicle.
4.1.2 Fuel cell stackThe fuel cell stack is the main key component of an automotive fuel cell system.It has the responsibility to generate DC current from the electro-chemical reactionsthat take place in the fuel cell. As it has been mentioned before in subsection 3.2.3a single fuel cell offers less than 1 voltage so in order to meet specifications forany possible application it is necessary to pile fuel cells in series into a stack. The
24

4. Fuel Cell Vehicles
amount of power delivered by the fuel cell stack depends on several factors such ascell size, operating temperature, fuel type, pressure of intake gases, etc.
To set as an example, the Toyota Mirai fuel cell stack is now one of the most advancedand innovative in this field. The new 2016 Mirai has an external maximum electricoutput of 144 kW, a volume power density of 3.1 kW/L and a number of cells inseries of 370.
4.1.3 Battery stackThe battery stack in a FCV is a backup element in the drivetrain system, in the waythat is responsible for storing energy in decelerations of the vehicle and contributewith an energy boost in accelerations and starts of the vehicle. While some brands asToyota bet on a nickel-metal hydride battery for the Mirai, Honda has implementeda conventional Lithium ion battery in the Clarity with a maximum voltage capacityof 288 V.
4.1.4 DC Boost converterThe DC boost converter is a device that increases a voltage input to a higher value.In most cases it raises the output voltage from the fuel cell stack or the battery upto 650 V in direct current as required by the HV components. What this means isthat more power can be generated having the same current.
Another advantage of having increased power is being able to reduce the number offuel cells per stack, as well as the number of cells in the battery pack. This has animpact on weight and eventually in overall performance of the FCV.
Below we can see the general scheme for a Boost converter as well as the character-istic waveforms:
L D
RloadVs S C
Figure 4.1: Boost converter general scheme
Boost converters face to distinct modes of operation: Continuous and discontinuousmode. In continuous mode the current going through the inductor is never zero andas seen in figure 4.2 the characteristic waveforms are this way:
25

4. Fuel Cell Vehicles
Figure 4.2: Boost converter continuous mode waveforms [6]
In discontinuous mode, the inductor is able to completely discharge before theswitching cycle ends and therefore the waveforms are like in figure 4.3.
Figure 4.3: Boost converter discontinuous mode waveforms [7]
4.1.5 DC/DC converterThe DC/DC converter is the device in the drivetrain responsible for adapting highvoltage obtained either from the batteries or the fuel cell stack into 12 V, which is
26

4. Fuel Cell Vehicles
the normal operation voltage for control electronic devices. Those electronic devicescan include from the fuel cell control system to even headlights.
In this case then, it can be said that the DC/DC converter is a step-down converter(Buck converter). The layout for a conventional Buck converter can be seen below,as well as the characteristic waveforms of the device.
S L
RloadVs D C
Figure 4.4: Buck converter general scheme
Boost converters face to distinct modes of operation: Continuous and discontinuousmode. In continuous mode the current going through the inductor is never zero,
4.1.6 Inverter
The inverter or DC/AC converter is the device responsible of transforming the DCcurrent obtained in the boost converter after the fuel cell stack to AC current in orderto feed the electric motor in the drivetrain system. In order to do that parameterssuch as output voltage, output frequency, total delivered power have to be specified,and the final design of the converter will vary if those parameters vary.
When decelerating, the inverter has to be capable to obtain the AC current generatedin the motor and transform it in DC current in order to feed the battery.
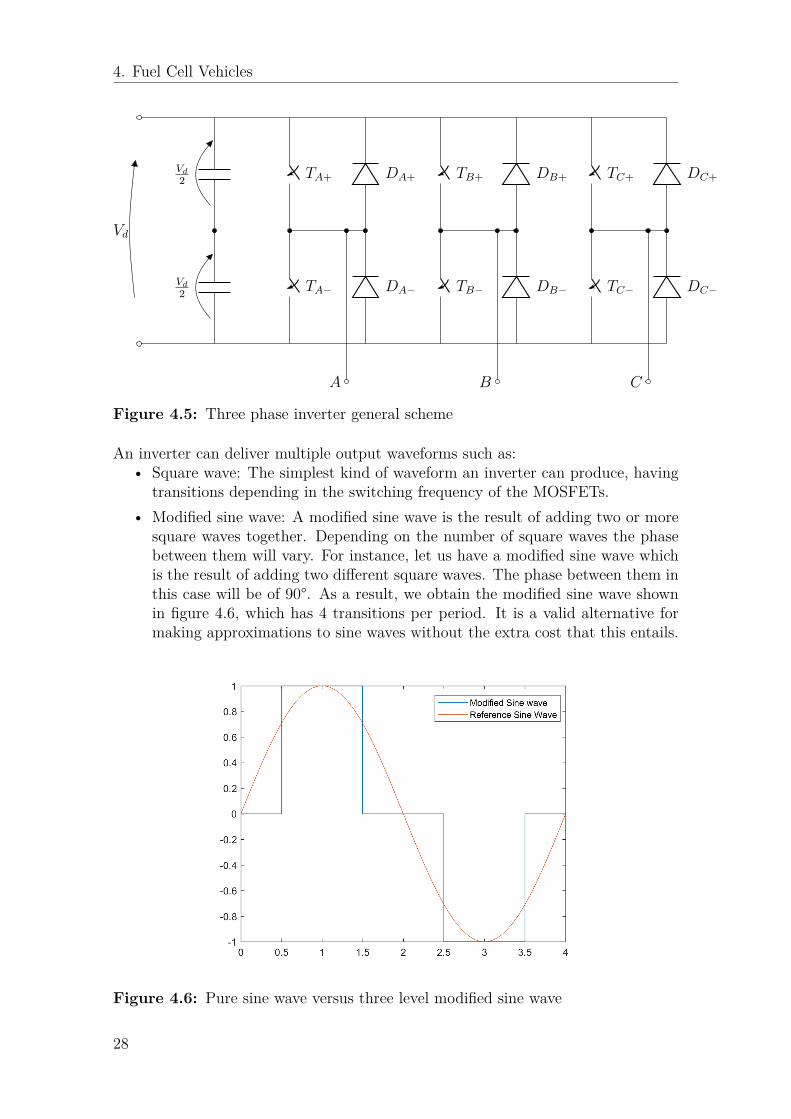
For that reason, it is needed a three-phase inverter, scheme of which is shown below,as well as the characteristic waveforms.
27
4. Fuel Cell Vehicles
Vd
2
Vd
2
Vd
TA+
TA− DA−
DA+ TB+
TB− DB−
DB+ TC+
TC− DC−
DC+
A B C
Figure 4.5: Three phase inverter general scheme
An inverter can deliver multiple output waveforms such as:• Square wave: The simplest kind of waveform an inverter can produce, having
transitions depending in the switching frequency of the MOSFETs.• Modified sine wave: A modified sine wave is the result of adding two or more
square waves together. Depending on the number of square waves the phasebetween them will vary. For instance, let us have a modified sine wave whichis the result of adding two different square waves. The phase between them inthis case will be of 90°. As a result, we obtain the modified sine wave shownin figure 4.6, which has 4 transitions per period. It is a valid alternative formaking approximations to sine waves without the extra cost that this entails.
Figure 4.6: Pure sine wave versus three level modified sine wave
28

4. Fuel Cell Vehicles
• Sine wave: It is very unlikely that an inverter delivers a pure sine wave with nodistortion. In much cases, sine waves are highly stepped modified sine wavesthat eventually work as a pure sine wave. More steps in the output waveform,entail more complicated and therefore more expensive devices.
• Pulse width modulated wave (PWM): Pulse width modulation is a techniquein which the duty ratio of the switched is modified in order to vary the RMSvoltage value. The aim of this is controlling the electrical power supplied (inthis case) to the electric motor of the vehicle. As seen in figure 4.7, pulsewidth modulated signals are obtained from the control triangle signal and thedifferent phase voltages.
Figure 4.7: Pulse width modulation mode of operation example
4.1.7 MotorAs seen before, fuel cell vehicles obtain electricity to feed an electric motor. Elec-tric motors are divided in two types according to whether they work with direct(PMDC) or alternating current (PMAC). For PMAC motors we can find two dif-ferent types; Brushless DC Motors (BLDCM) and Permanent Magnet SynchronousMotor (PMSM). but the most used type of motor in automotive solutions due topower/weight ratio, durability and technology knowledge is the Permanent MagnetsSynchronous Motor (working with alternate current).While brushless DC motorsgenerate a trapezoidal counter electromotive force when the rotor spins, PMSMgenerate a sinusoidal force.
29

4. Fuel Cell Vehicles
PMSMs are separated in two groups according to the position of the magnets withinthe rotor. In Surface Permanent Magnet Synchronous Motors (SPMSM) the mag-nets are located in the surface of the rotor while in Interior Permanent MagnetSynchronous Motors (IPMSM) magnets are located inside the rotor.
Either way, those magnets generate a certain magnetic flux. When an electrical inputis applied to the stator, a magnetic flux is generated as well and therefore the rotortends to follow it producing the desired spin. Some materials used for permanentmagnets are Samarium-Cobalt (SmCo), Neodimium-Iron-Boron (NdFeB) or ceramicmaterials (BaOx6Fe2O3, SrOx6Fe2O3).
Regarding electric drives, there are some variations to take in account. Commonconfigurations are one electric motor either in front or in the rear part of the vehicle,or two motors (rear and back). Current innovations have introduced to this fieldthe four wheel drive vehicles (cars with a motor per wheel, each one with its owntransmission and controlled independently by torque vectoring).
4.1.8 Cooling systemIn conventional FCV drivetrain systems, two independent cooling systems are used.One is used for cooling the fuel cell stack and the other one to cool the HV compo-nents such as the inverter, boost converter and motor.
Having in mind that in a fuel cell is produced both electricity and residual heat,an efficient cooling system is needed. In that way, the cooling system of a fuel cellvehicle in the fuel cell stack resembles a conventional IC cooling system, with aradiator and a pumping system that circulates the cooling fluid between the fuelcell and the before mentioned radiator.
In those systems though, it is possible to produce short-circuits in the fuel cell stackif the cooling system fluid is electrically charged. For that reason an ion exchangeris used, in order to tackle that issue.
4.2 Drivetrain layout comparisonWhile there are not so many commercial FCV models currently in market, everymanufacturer has developed its own powertrain concepts which eventually leads todifferent powertrain layouts for each model in the market. Below it can be seen howdifferent models implement in different ways the same elements in order to achievedifferent results.
For example Audi with its concept car h-tron quattro implements a four wheel drivewith two electric motors, one in the rear and one in the front. An example as wellis the Toyota Mirai, which has a separate boost converter unit while other modelsimplement the boost converter within the power control unit.
30

4. Fuel Cell Vehicles
Figure 4.8: Audi h-tron block diagram
Figure 4.9: Toyota Mirai block diagram
31

4. Fuel Cell Vehicles
Figure 4.10: Honda Clarity block diagram
4.3 Cost analysis of a FCV
One of the major drawbacks of fuel cell technology right now is the manufacturingcost and therefore, the selling price fuel cell vehicles. Prices nowadays are around $50,000 - 60,000 which makes fuel cell vehicles an expensive alternative for personaltransportation if compared to conventional IC cars, or even if compared to BEVs.
The reason for that cost is due to the components and technology behind it. Averagecost of the main components can be seen in the table below. It has to be notedthough that this extracted data is from the year 2007, and reflects the prices ofthe main components of the fuel cell vehicle in that year. Currently, this priceshave gone down as technology through the years has become more reachable for thedifferent automotive companies. For that reason, this table will only be taken inaccount in a qualitative way, to see in fact which are the most economically relevantcomponents in a fuel cell powertrain system.
Component Cost [$]Fuel cell stack 12,000 - 14,000Battery pack 2,000
Motor and inverter 8,000Balance of plant 6,000
Tanks and pressure regulator 8,000 - 10,000Glider 10,000
Table 4.1: Cost of the main components in a FCV drivetrain (Year 2007) [8]
32

4. Fuel Cell Vehicles
Figure 4.11: Average cost shares for a FCV
As we can see in the figures, the most expensive components are the fuel cell stack,the tanks and the HV system. Fuel cell stack are expensive because of the materialsused in the manufacturing process. As commented in the last chapter, fuel cellcatalysts are made of platinum alloy and thus they heighten the price, as well as fullaluminum machined parts (common mode of encasing the fuel cell stack).In the same way, tanks are expensive as well as they are hand manufactured withexpensive composite materials such as plastic fibre reinforced polymers or carbonfibre reinforced polymers.While for instance in the tanks there is not much more cost improvement, theintroduction of organic membranes in the PEMFC or possible catalysts substitutingplatinum, could considerably reduce the cost of the fuel cell stack.
33

4. Fuel Cell Vehicles
34
5System Design and Simulations
In order to simulate an entire driving system formed by the fuel cell stack, theDC/DC boost converter, DC/AC converter and PMSM motor, a software such asMatlab Simulink has been chose. This software allows to implement design levelstructures in order to model complex systems and then obtain the desired data.
5.1 Fuel Cell StackFor the fuel cell stack modelling some considerations have been taken in account1.
5.1.1 Voltage Output for the Fuel Cell StackFor a conventional PEMFC fuel cell, the output voltage can be obtained throughthe Nernst equation in order to obtain the reversible potential of the fuel cell. Thisequation only corresponds to the behaviour for one single fuel cell. Every fuel cellwithin the fuel cell stack will be driven by this same equation. The correspondingequation is 5.1.
Ecell = E0,cell + RT
2F · ln(PH2· P 0.5
O2
PH2O
)(5.1)
Which can also be written as follows in equation 5.2, assuming that the outcomeof H2O is in liquid form as in conventional fuel cell vehicles, water in the fuel cellcomes out in liquid form.
Ecell = E0,cell + RT
2F · ln(pH2· p0.5
O2) (5.2)
E0,cell stands for the reference base potential, and at the same time, this potentialis function of temperature and can be expressed by the following equation 5.3.
E0,cell = E°0,cell − ke · (T − 298) (5.3)
Where E°0,cell stand for the standard reference cell potential (at 1 atm and 25
°Celsius). Also, ke is an empirical constant corresponding the gain when calculatingE0,cell, with units (°K)−1.
1All equations and constants have been extracted from reference [9]
35

5. System Design and Simulations
Nevertheless, it has to be considered that this is the internal output voltage for aPEMFC, and for this reason several voltage drops and effects have to be subtracted.For instance, there are several delays in the fuel and in the oxidants that can bemodelled by the following equation in the Laplace domain 5.4:
Ed,cell(s) = λe · I(s) τe · sτe ·+1 (5.4)
Besides the effect of the fuel and oxidant delays, some voltage drops have to beconsidered. In a PEMFC voltage output function, there will be considered thefollowing voltage drops as explained in the equation below 5.5.
Vcell = Ecell − Vact,cell − Vohm,cell − Vconc,cell (5.5)
where Vact,cell stands for the activation voltage drop (activation losses), Vohm,cell forohmic voltage drop (ohmic losses) and Vconc,cell stands for concentration voltage drop(concentration losses). Next section goes through the equations of the voltage dropsand final modelling of the electrical system of the fuel cell stack.
5.1.2 Voltage Drops for the Fuel Cell StackVoltage drops can be calculated as follow:
• Activation losses: Activation voltage drop is function of both current and tem-perature in the PEMFC and its behaviour is described by the Tafel equation,described below in 5.6:
Vact = T · (a+ b · ln(I)) (5.6)
where a and b are empirical parameters. Equally, Vact can be described asVact = Vact1 + Vact2, where Vact1 can be described as the part of the activationvoltage drop that is invariant to current (only affected by temperature) andVact2, which is both current and temperature dependant.
• Ohmic losses: Ohmic losses can be described by the following equation:
Vohm,cell = I ·Rohm (5.7)
where Rohm is:Rohm = Rohm0 + kRI · I − kRT · T (5.8)
with kRI and kRT being the empirical parameters when calculating Rohm.
• Concentration losses: Concentration losses can be calculated by the followingequation, function of the current through the fuel cell.
Vconc = −RTzF· ln
(1− I
Ilimit
)(5.9)
36

5. System Design and Simulations
Rohm
Ract
Rconc
C
E − V act1
Vout
Figure 5.1: Double layer charge effect in a fuel cell
This voltage drops cannot be modelled straight ahead. There is one effect morethat has top be taken into account. This is the called double-layer charge effect.This effect is due to the architecture of the PEMFC, as the electrodes are separatedby a membrane and this lead the layers in between the membrane behave like acapacitance. This effect only affects the part of the activation losses that is bothcurrent ad temperature dependant, and the concentration losses, but doesn’t affectneither the ohmic losses nor the temperature dependant part of the activation losses(as seen in the figure below).
From this scheme we can deduce that the output voltage for the fuel cell may thenbe:
Vout = E − Vact1 − Vc − Vohm (5.10)
where Vc stands for the voltage throughout the capacitance, which can be expressedas:
Vc =(I − C · dVc
dt
)· (Ract +Rconc) (5.11)
With all the equations listed above a proper electrical model for a fuel cell canbe designed. However, this model will depend on the inputs of both temperatureand current to work properly. For that reason, thermodynamical equations willbe implemented in order to make the system more accurate and temperature non-dependant (as seen in 5.1.3).One can observe below a figure regarding the electrical modeling of the fuel cell andhow this model has been implemented in Simulink.
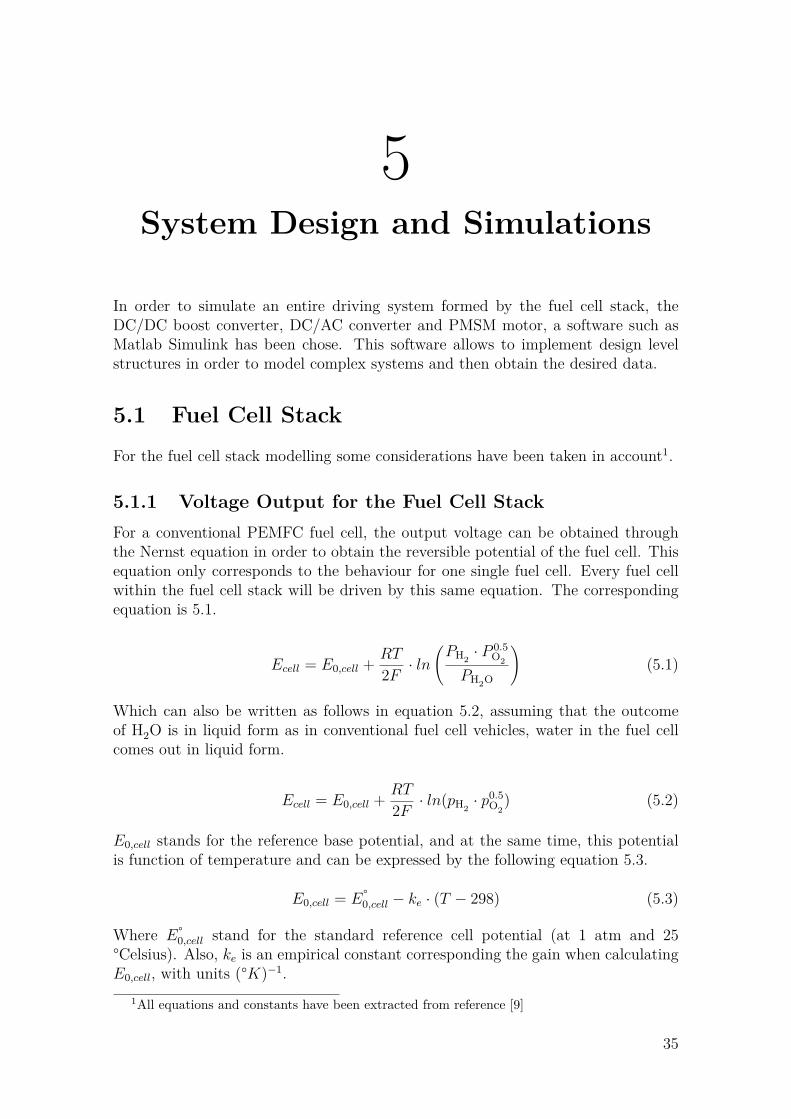
37

5. System Design and Simulations
Figure 5.2: Part of the electrical system of the PEMFC model
Figure 5.3: Part of the electrical system of the PEMFC model
5.1.3 Thermodynamical EquationsAs seen in subsection 5.1.1, voltage in the fuel cell is temperature dependant andthat affects to the electrical output of the fuel cell stack and many other parametersof a fuel cell (such as voltage drops) and eventually, to the performance of thatsystem. For that reason, modelling a structure capable of taking in account andcontrolling the temperature in an accurate way.
In order to model the thermal model of the fuel cell, a simple heat balance is madefollowing the laws of thermodynamics. The heat losses and the generated heat haveto be taken in account. The equation below shows the balance (see equation 5.12).
q̇out = q̇cell − q̇elec − q̇sens+lat − q̇convection (5.12)
38

5. System Design and Simulations
In order to obtain the heat from the fuel cell it is necessary to calculate first theGibbs energy of this same fuel cell, which can be calculated as follows:
∆G = −E · n · F (5.13)
Once the Gibbs energy is obtained, q̄chem can be calculated using the equation listedbelow:
q̇chem = kcell
2F ·∆G · I (5.14)
¨Besides, the heat due to the electrical consumption q̄elec can bhe calculated like this:
q̇elec = Vout · I (5.15)
For the case of the losses q̇convection due to convection, the calculations go like listedbelow:
q̇convection = hcell · (T − Troom) ·Ncell · Acell (5.16)
Finally, for the calculations regarding q̇sens+lat the formula can be seen below:
q̇sens−lat = (T −Troom) ·[(
I
2F · CpH2
)+(I
4F · CpO2
)+(I
2F · CpH2O
)]+ I
2F ·HvH2O
(5.17)
When all losses are calculated, the balance is made and heat can be integrated inorder to obtain the output temperature like so:
MF C · CF CdT
dt= q̇out (5.18)
Where MF C is the mass of the whole fuel cell stack and CF C is the total specificheat of the fuel cell stack. Once achieved this part of the modelling temperaturecan bee fed back into the electrical model. In this way, a load current dependantmodel can be obtained. A figure of the thermal model can be seen below.
39
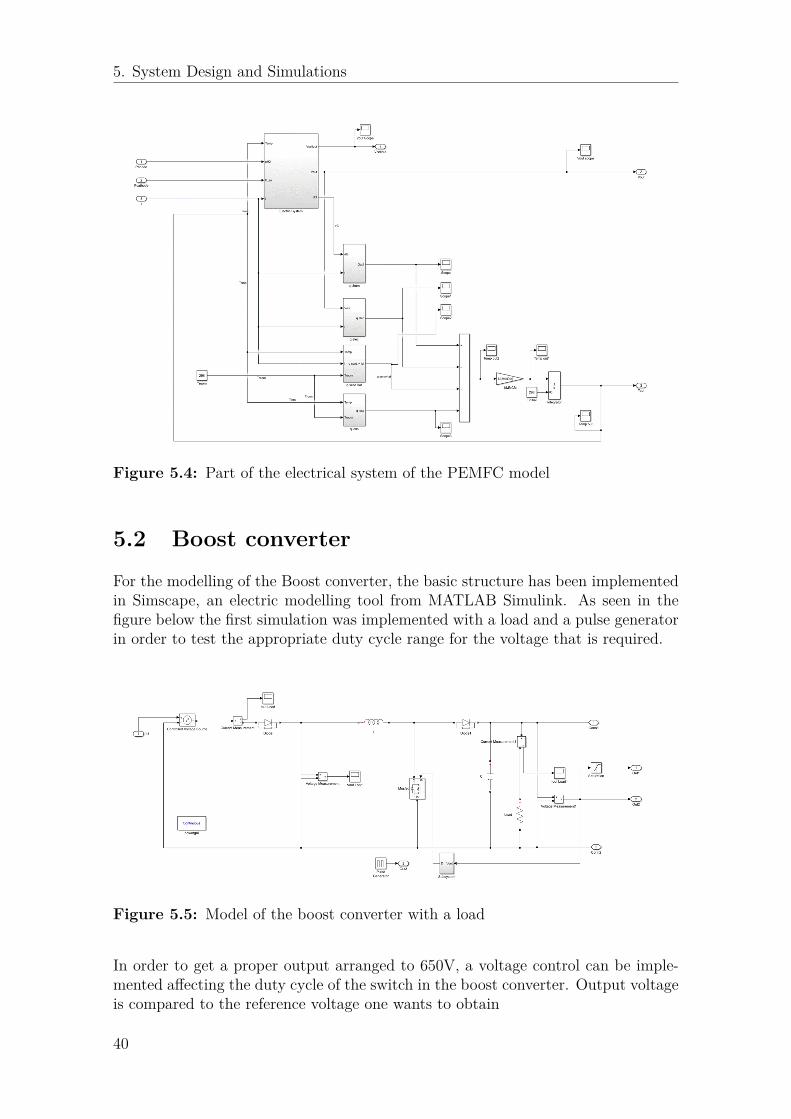
5. System Design and Simulations
Figure 5.4: Part of the electrical system of the PEMFC model
5.2 Boost converterFor the modelling of the Boost converter, the basic structure has been implementedin Simscape, an electric modelling tool from MATLAB Simulink. As seen in thefigure below the first simulation was implemented with a load and a pulse generatorin order to test the appropriate duty cycle range for the voltage that is required.
Figure 5.5: Model of the boost converter with a load
In order to get a proper output arranged to 650V, a voltage control can be imple-mented affecting the duty cycle of the switch in the boost converter. Output voltageis compared to the reference voltage one wants to obtain
40

5. System Design and Simulations
Figure 5.6: Model of the boost controller
As can be seen in figure 5.6, error in the output voltage can be calculated andcorrected with the proper PID controller which allows us to obtain the control signal.Once obtained, the control signal can be compared with a reference sawtooth signalin order to adjust the duty cycle up or down so the voltage output can reach thedesired voltage reference.Converter’s design parameters can be calculated as follows, knowing the outputdesired voltage and voltage input range, as well as desired power transfer:The maximum duty cycle ratio is given by the equation 5.19, which can be foundbelow.
DMAX = 1− VinMIN· ηconverter
Vout
(5.19)
For the inductance selection, equation 5.20 can be used. With that equation, theminimum value for the boost converter inductance can be found.
VIN · (VOUT − VIN)∆IL · fs · VOUT
(5.20)
The procedure for setting the capacitor value is the same as above, deciding on aminimum capacitor value depending in values in equation 5.21.
IMAX ·DMAX
fs ·∆Vripple
(5.21)
Once all components are dimensioned, basic structure for the boost converter canbe implemented.
41
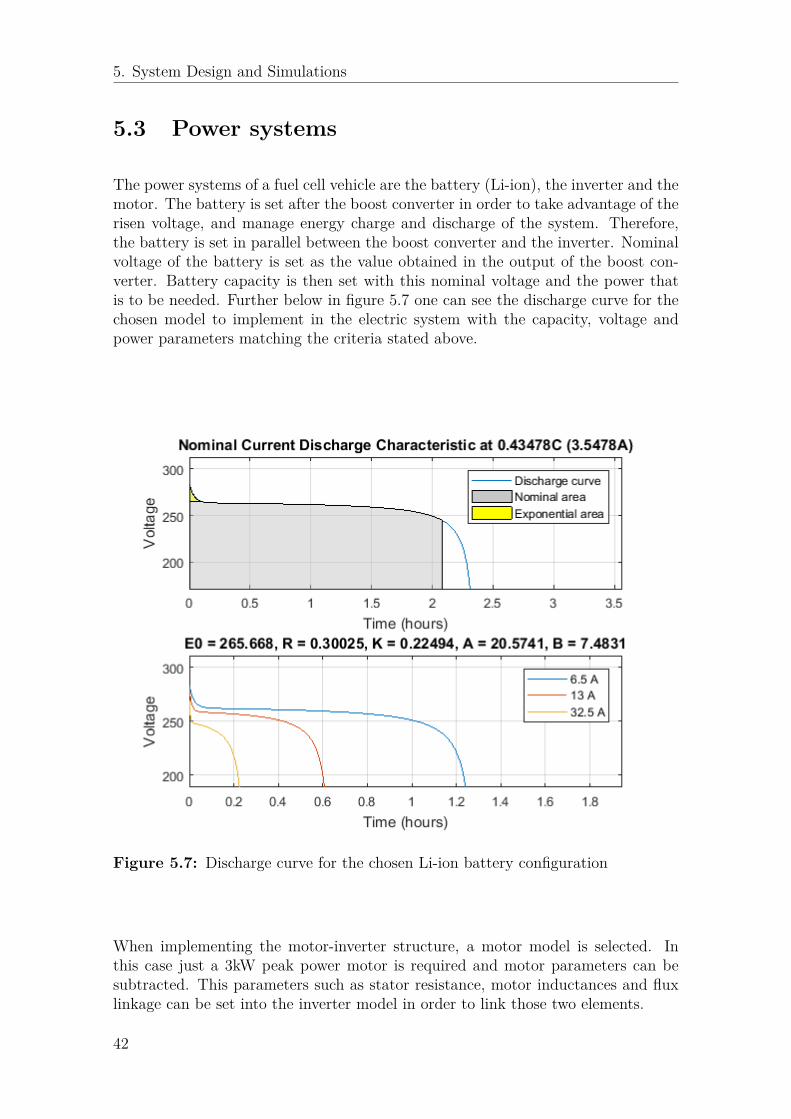
5. System Design and Simulations
5.3 Power systems
The power systems of a fuel cell vehicle are the battery (Li-ion), the inverter and themotor. The battery is set after the boost converter in order to take advantage of therisen voltage, and manage energy charge and discharge of the system. Therefore,the battery is set in parallel between the boost converter and the inverter. Nominalvoltage of the battery is set as the value obtained in the output of the boost con-verter. Battery capacity is then set with this nominal voltage and the power thatis to be needed. Further below in figure 5.7 one can see the discharge curve for thechosen model to implement in the electric system with the capacity, voltage andpower parameters matching the criteria stated above.
Figure 5.7: Discharge curve for the chosen Li-ion battery configuration
When implementing the motor-inverter structure, a motor model is selected. Inthis case just a 3kW peak power motor is required and motor parameters can besubtracted. This parameters such as stator resistance, motor inductances and fluxlinkage can be set into the inverter model in order to link those two elements.
42

5. System Design and Simulations
Figure 5.8: Power systems structure
However, these elements need to be controlled and for that, a speed and currentcontrol has to be implemented. As shown in figure 5.9 a speed and vector controlleris implemented, taking the motor speed, obtaining the required torque and thenobtaining the current control in order to drive the inverter.
Figure 5.9: Control block of power system
From this system, several data can be retrieved such as electromagnetic torque, androtor current and voltage as well as rotor speed.
43

5. System Design and Simulations
5.4 Dynamic model
In order to test the system in real conditions once it has all been modelled, it hasbeen decided to put this system through a driving cycle consisting in an accelerationramp, a velocity maintaining phase and a deceleration ramp between 0 and 45 km/h,as the object of study is a vehicle with small power output, such a scooter or a tuk-tuk.
In order to do that, several equations have to be implemented in what is called thedynamic model of the vehicle. That means that the force balance is implemented inorder to get the force required by the wheel and eventually, both torque and angularspeed in order to be able to control the electrical system of the vehicle.
When implementing the dynamic model of the vehicle, several assumptions havebeen made, such as considering the vehicle a rigid body with only one axis affectedby the forces that intervene in the system. Hence, the equation in which the modelwill be based is Newton’s second law of motion which says that the acceleration ofan object as produced by a net force is mass times proportional in the same directionto this same force. In the case of the system in study, the resulting force can bewritten as the forces that help the vehicle accelerate (tractive forces) and the forcesthat make the vehicle decelerate (resistive forces). All that can be written as inequation 5.222.
m · a = m · v̇ = m · ddtv(t) = Ft(t)− Fr(t) (5.22)
From equation 5.22 can be seen that tractive forces equal mass product accelerationand the sum of all the resistive forces, as in equation 5.23. From this point ontractive forces will be considered as the force that the wheel produces in order togive the car the certain acceleration required at any time by the vehicle.
Ft(t) = Fwheel(t) = m · ddtv(t) + Fr(t) (5.23)
Below in figure 5.10 it can be seen how the general structure for the dynamic mod-elling of the vehicle has been implemented. Following these equations one can obtainthe power required by the wheels. Once the power is obtained and the angular speedhas gone through the gearbox, the torque can be obtained.
2Literature study in this part of the thesis done in reference [10]
44

5. System Design and Simulations
Figure 5.10: Dynamic Model Implementation
Several forces can be described as resistive, in which the aerodynamic drag, therolling force and the grading force can be included.
• Aerodynamic drag is the force to which any moving vehicle is exposed whenmoving through air. Having an accurate model for the drag force is relativelycomplicated so a mathematical formula is used instead in order to describe ina simpler way an acceptable behaviour of the aerodynamic drag. The formulacan be seen below in equation 5.24, where ρa corresponds to air density, Cd
corresponds to drag coefficient, Af to the cross-section of the vehicle (area ofthe vehicle actually exposed to the air flow), and vwind the speed of the windin the opposite direction to the movement of the car.
Fd = 12 · ρa · Cd · Af · (vcar − vwind)2 (5.24)
In figure 5.11 one can see how the drag resistive force equation has beenimplemented.
45

5. System Design and Simulations
Figure 5.11: Aerodynamic drag force implementation
• Rolling force is due to all effects actuating in the tire while in motion (in otherwords, while rolling). These effects are considered in the rolling coefficient(Cr), which is function of the tire temperature, speed, material and inflationamong other characteristics. The rolling coefficient has been narrowed empir-ically, as well as its behaviour. It has been proofed that increasing the rollingspeed, the rolling coefficient also increases. For a lower speed range, Cr in-creases slightly. However, while increasing speed to higher values, Cr increasesat almost square times the speed.
On the other hand, tire inflation and temperature have a reverse effect inthe rolling coefficient, where to higher tire pressures and higher temperatures,lower values for Cr are obtained. In all the formula for the rolling for in avehicle can be written as in equation 5.25.
Fr = m · g · Cr · cos(α) (5.25)
Rolling force implementation structure in Simulink can be seen down below infigure 5.12.
Figure 5.12: Simulink implementation of the rolling force of a vehicle
46

5. System Design and Simulations
• Grading force appears when having a particular slope in the road, and it isthe component of the gravitational force of the vehicle in the horizontal planeof the vehicle. In this way, having more slope in the road increments thisforce and of course, decreasing the slope has a diminishing effect in the rollingforce. The equation for this force can be found below in 5.26 where alpha isthe inclination angle between the road and the horizontal plane.
Fg = m · g · sin(α) (5.26)
Grading force implementation can be seen below in figure 5.13
Figure 5.13: Simulink implementation for the grading force of a vehicle
Alpha angle can actually be written as an expression between the verticaldistance and the horizontal distance such as in formula 5.27
α = arctan(rise
run
)= arctan
(slope(%)
100
)(5.27)
Implementing all these equations in a Simulink model will eventually grant thechance to obtain the resulting force on the wheel and, with that and the linearspeed, the overall power in the wheel can be obtained, as shown in equations 5.23and 5.28.
Pwheel(t) = Fwheel(t) · v(t) (5.28)
Nevertheless, the designed model has as input reference both torque (Nm) andangular speed of the motor. In order to obtain the parameters above mentioned,equation 5.29 can be used, always having in account that the angular speed shall bein between a certain functioning limit as the motor requires. In this particular case,a one stage gearbox has been implemented with a transmission ratio of 5, meaningthat angular speed is multiplied by 5 when arriving to the motor. Having this andif power is maintained, less torque is required to match the power requirements.
Pwheel(t) = Γwheel(t) · ω(t) (5.29)
Having the driving cycle and the wheel radius of the vehicle in study, angular speedcan be easily obtained and therefore torque can be calculated. Once obtained both
47

5. System Design and Simulations
angular speed and torque, this values can be inputted respectively in the motorcontrolling and the speed controller for the inverter in order to give the drivingcycle reference to the system.In table 5.1 one can see the chosen values for the different dynamic constants, takingin account all made considerations.
Constant [Unit] ValueWind speed [m/s] 0Cross section [m2] 1.8Air density [kg/m3] 1.225Rolling coefficient 0.012Drag coefficient 0.27
Slope [%] 0Mass [kg] 250
Wheel Radius [m] 0.2
Table 5.1: Dynamic constants values for the chosen vehicle model
48

6Results
When approaching any final stage of modelling of any component of the system,several tests have been done in order to assure the proper functioning of every partand in ultimate instance, the proper functioning of the whole of the fuel cell vehicle.Those results are presented below for each of the modelled elements in the system.
6.1 Fuel cell stack simulationAs seen in figure 6.1 the structure of the fuel cell stack depends in pressures in thecathode and the anode as well as the input current, and delivers an output voltage,output power and output temperature.
Figure 6.1: Full structure of the PEMFC stack
Nonetheless, as far as this study is concerned temperature will not be evaluatedsince what it is important in the system is output power and voltage. In order toproperly test the system, several current inputs have been set so the response of thefuel cell stack could be observed in different kinds of situations. In all, three typesof inputs were set: constant current at a certain value between 0 and Ilim, first orderstep and ramps of different durations and slopes.
Below, in figures 6.2 and 6.3 can be seen the reaction of the fuel cell stack wheninputted a constant current of 24A.
49

6. Results
Figure 6.2: Stack power response to a constant current input of 20 A
Figure 6.3: Stack voltage response to a constant current input of 20 A
50
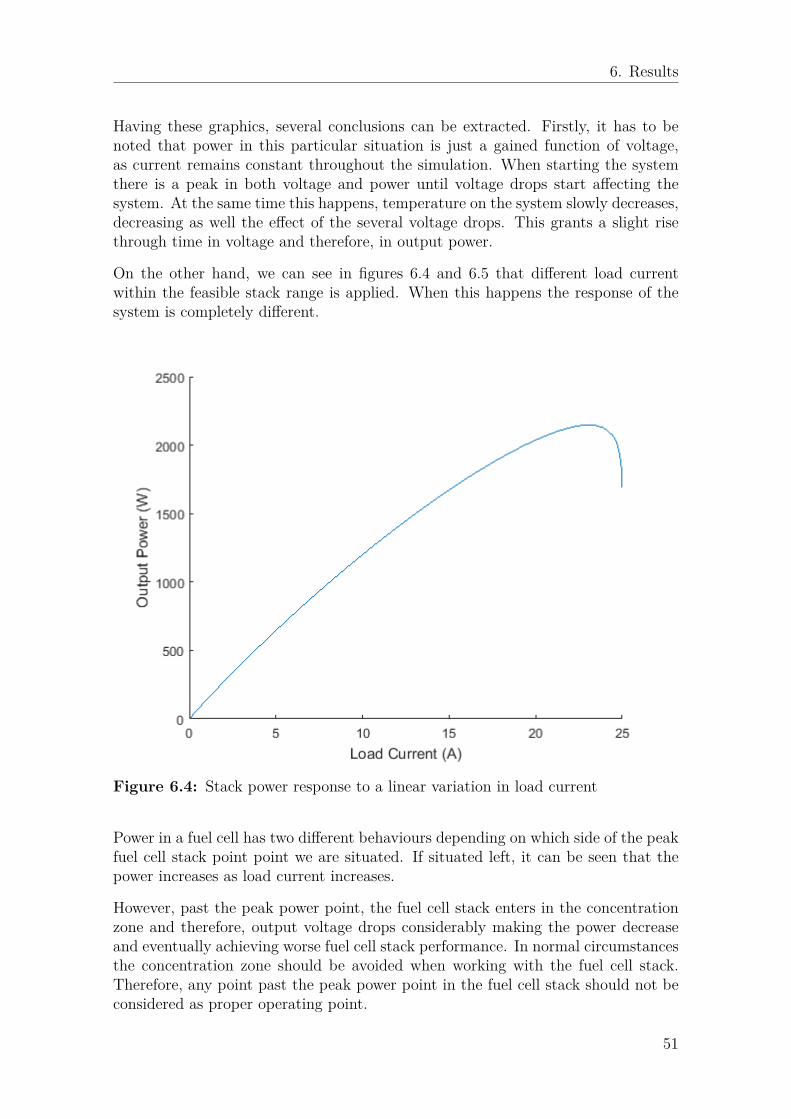
6. Results
Having these graphics, several conclusions can be extracted. Firstly, it has to benoted that power in this particular situation is just a gained function of voltage,as current remains constant throughout the simulation. When starting the systemthere is a peak in both voltage and power until voltage drops start affecting thesystem. At the same time this happens, temperature on the system slowly decreases,decreasing as well the effect of the several voltage drops. This grants a slight risethrough time in voltage and therefore, in output power.
On the other hand, we can see in figures 6.4 and 6.5 that different load currentwithin the feasible stack range is applied. When this happens the response of thesystem is completely different.
Figure 6.4: Stack power response to a linear variation in load current
Power in a fuel cell has two different behaviours depending on which side of the peakfuel cell stack point point we are situated. If situated left, it can be seen that thepower increases as load current increases.
However, past the peak power point, the fuel cell stack enters in the concentrationzone and therefore, output voltage drops considerably making the power decreaseand eventually achieving worse fuel cell stack performance. In normal circumstancesthe concentration zone should be avoided when working with the fuel cell stack.Therefore, any point past the peak power point in the fuel cell stack should not beconsidered as proper operating point.
51

6. Results
Figure 6.5: Stack voltage response to a linear variation in load current
Regarding the voltage, the graphic shows how in the beginning and the end of theload current progression concentration and activation losses play an important rolein the overall voltage drops while in between those zones, ohmic losses are responsiblefor this semi-linear voltage drop. In this graphic can be appreciated how past thepeak power point voltage drops drastically, decreasing output power.
6.2 Boost converter and fuel cell stack
When simulating the boost converter within the PEMFC system, the area of interestwill be the output voltage and whether it can be increased or not. Regarding thatmatter, several simulations have been implemented and the results have been asfollow. As it can be seen in figure 6.6, tuning in the PID controller has to be madein order for the output voltage to manage to stay within the given reference (in thiscase 245V). While after some time the converter is able to reach the said reference,it is quite clear that we may require additional tuning in order to adapt the boostconverter to a faster, more accurate response. For that reason, the boost converterhas been linearised and implemented in an auxiliary system as a transfer function,in order to automatically tune the PID controller and obtain precise values for kp,kd and ki.
52

6. Results
Figure 6.6: Boost converter voltage output curve
With the newly found controller values, another simulation is launched, which resultscan be seen in 6.7.
Figure 6.7: Boost converter voltage output curve
53

6. Results
As seen in this graphic, controller response is way faster than in the previous PIDtuning and variation range is smaller, always keeping a small variancy around 245,the given voltage reference.However and in case of controller failure, an additional block has been implementedin order to keep the voltage constant within an acceptable range. The output signalhas been narrowed between values of 244 and 246 volts. Having this signal, a moreaccurate functioning of the three-phase inverter can be achieved and eventually, abetter functioning of the whole system can be accomplished.
6.3 Power systemsWhen simulating the power systems of the model, two stages were considered:
• First and once modelled the power systems and its control devices, it wassimulated considering a continuous invariant voltage source of 245V, as wellas with fixed reference torque and angular speed for the motor, in order to seeif the system worked properly without any mistakes, as can be seen in figure6.8.
Figure 6.8: Scheme of fixed values power systems test
• Second and only once the model was verified, the power systems of the modelwere attached to the PEMFC/Boost structure in order to see how the systembehaved as a whole. Fixing a speed of the motor and obtaining the power thatthe fuel cell can give, reference torque can be calculated using equation 6.1.Then the current measurement from the motor can be fed back directly to thefuel cell stack in order close the loop and make steady-state simulations.
P = Γmotor · ωmotor (6.1)
54

6. Results
Result for steady-state conditions can be seen below. It has to be taken in accounta fixed angular speed of the motor value of 300 rad/s, and a selected motor of 3kWof peak power. Figures 6.9 and 6.10 show the functioning of the three-phase inverterand how the three-phase sinusoidal waveforms are obtained.
Figure 6.9: Inverter output current
Figure 6.10: Zoomed graph of inverter output current
55
6. Results
6.4 Fuel cell vehicle system
In order to test the full model of the vehicle, including the dynamic model andall the electrical system of the vehicle, a driving cycle has been implemented. Asthe system in test does not give the amount of power a conventional vehicle wouldsupply, a customised driving cycle has been implemented.
As shown in figure 6.11 a first stage of acceleration is implemented, from 0 to 40km/h. After accelerating, the vehicle will maintain speed at 40 km/h and decreaseit down to 0 km/h in the end of the cycle, having a deceleration stage. This linearspeed translates into a certain rotor speed in the motor once it is put throughthe gearbox. With this driving cycle we can actually see how the car and all itssystems behave in every situation and if eventually, the electric power supply canfeed correctly the motor in order to make the vehicle move.
Figure 6.11: Driving cycle implemented as system testing, in the perspective ofmotor speed request
Simulations can allow us to obtain graphics of different parts of the system, which areshown below. Please note that all figures listed below correspond to the behaviourof several parts of the system when exposed to the above said driving cycle.
56

6. Results
Figure 6.12: Fuel cell stack power output throughout the full driving cycle
As it can be seen in figure 6.12, the power output for the fuel cell stack has, asthe driving cycle, three well differently stated parts. As the driving cycle linearlyincreases speed of the car in the first stage, forces also vary due to this variation inspeed. Altogether it results in a semi-linear behaviour for the power output in thefuel cell stack, as this changes in the required power keep requiring more currentas time goes forward. Power then increases up to its peak power when the desiredmaximum speed is reached. This behaviour happens until the next stage of thedriving cycle is reached.
As the cycle progresses and we enter in the constant speed region, the current neededis no longer as big as it was when trying to reach this said speed. For that reason,when current decreases in the motor, the power in the motor also decreases causingthe fuel cell stack to give less power that in the previous stage, as the system nolonger needs that big amount of power anymore. In figure 6.12 can be seen that theapproximate power to run the vehicle at a constant speed of 40 km/h goes roughlyaround 750-800W. Once this stage is completed, we enter in the deceleration stageof the driving cycle.
In the deceleration stage of the driving cycle, the current changes its sign and there-fore, the motor acts as a power generator. When the motor starts working as powergenerator, current is generated instead of wasted so technically the fuel cell stackmust not provide any kind of energy and therefore, power must equal to zero.
57
6. Results
Figure 6.13: Output voltage from the boost converter throughout the full drivingcycle
When it comes to the boost converter behaviour (figure 6.13), several stages canbe easily spotted as well. Regarding the acceleration process, response time of theboost converter is fast and in addition voltage signal is mildly stable in between anacceptable voltage range. The signal stays at all times in between 244.5 and 246 Vand, taking in account that the boost controller sets voltage output reference at 245V, the signal must be considered as stable enough.
Nevertheless, as time keeps running in the simulation and speed and current areincreasing, voltage keeps decreasing as stated in figure 6.5, where for a linear in-creasing change in load current voltage in the fuel cell decreases. As voltage in thefuel cell decreases it is harder for the controller to boost and maintain the outputvoltage at the set reference and for that reason higher distortion in the signal canbe appreciated in acceleration stage for higher currents.
Once we enter in the constant speed stage, we can see how the boost controller hasno problem whatsoever controlling the output voltage. It can be even seen how atthe beginning of this second stage of the driving cycle, the output voltage follows afirst order signal, as it should theoretically be. Regarding the deceleration process,voltage output suddenly rises, and the controller is not able to fully maintain voltagewithin the given reference. However, for purposes of the good performance of thewhole system, signal is narrowed down between 244 and 246V, as said in section 6.2.
58

6. Results
Figure 6.14: Inverter current throughout the full driving cycle
Figure 6.14 shows clearly what it has been stated above in previous explanations. Inthe acceleration stage we can see how current keeps increasing as we keep increasingspeed. Current tendency could be described as semi-linear which is in fact thetendency that follows the power output from the fuel cell stack in this same stageof the driving cycle.
It can also be seen that for the second stage of the process, as it has been said earliercurrent needed is lower than in initial stages, as the system has just to maintainspeed.
For the last stage of the process, in deceleration, current actually rises in absolutevalue (in module), but as it has been said earlier on, it is negative (reason whythe motor is actuating like a generator). Anyway, current output in the inverter isthree-phase alternate current which means that in fact module is the only importantmatter regarding output current, as argument is constantly changing. It is just afterthe motor that current is transformed again into DC current in order to feed it backto the fuel cell stack.
59

6. Results
Figure 6.15: Motor power output throughout the full driving cycle
When it comes to the behaviour of the electric motor, we can see again in figure6.15 three different types of behaviour regarding the three different phases of theinputted driving cycle. Just as the fuel cell stack, in the two first stages of thedriving cycle power developed by the electric motor is very much similar in termsof both tendency and overall numbers. However, in deceleration the motor behaveslike a generator. In this figure power appears as negative, which actually meansthat this motor in this stage of the driving cycle is generating power. This powercould be used to charge the auxiliary battery of the system in which is called energyrecuperation. Most of BEVs, plug-in hybrid and mild hybrid cars now in marketalready integrate this kind of technology, as well as FCV vehicles.In all, it can be seen that the diverse elements in the system behave within what itis to expect of a system with this characteristics when submitted to an input of thisnature.
60

7Future Work
In the making of this project, it is clear that are several points that can be furtherdeveloped and studied in a deeper way. In that way, there are several points thatcan be taken into account such as listed below:
• First and foremost, the most important point to try to improve would be thetotal power of the system. The system now conceived is an automotive vehicleof two kW of overall power which is equivalent to a small electric vehicle, ca-pable to reach medium speeds. We would be talking of a city transportationvehicle. However, it is clear that a major improvement goes through increasingthe total power that the fuel cell stack is delivering. Commercial car modelshave nominal fuel cell stack powers which go in ranges from 100 to 110 kW.Obviously, increasing the fuel cell stack power means that all other systemsin the vehicle have to be adapted to this new power. The modelling of theelectric motor would happen to have different modelling parameters and thiseventually affects the DC/AC converter and the speed and torque control. Itcould also be probable that the boost converter elements (duty cycle, induc-tance and capacitor values) had to be recalculated in order to fit the voltageoutput of the fuel cell to the 600V to which high voltage systems are working.
The only empirical data found for a fuel cell model was made for a 48 cell500W fuel cell stack. In order to adapt it to a 2kW fuel cell stack the easiestsolution was implementing a higher number of fuel cells in series. Nevertheless,adapting it to a 100 kW fuel cell stack using this method would not be feasible,as the voltage range would be way too wide and the number of cells would beimpossible to assemble. For that reason, the whole set of empirical constantswould have to be replaced in order to obtain proper ones, and the only way toobtain those values would be through testing, which was not conceived in theaims of this thesis.
However, regarding the power increase for the fuel cell stack, once the setof empirical parameters for the 100 kW fuel cell stack is obtained, one couldsimply substitute the values in the Simulink model, as this model has beencreated in a totally generic way in order to tackle this issue.
Once the fuel cell model is converted to a higher power output all the otherelements can be easily adapted, as well as the data for the dynamic model ofthe vehicle (weight, wheel radius, drag and rolling coefficient, etc.) in order toget power results for a commercial fuel cell vehicle.
61

7. Future Work
• Another point regarding the electric system would be the battery. Whiledecelerating, all power from the motor shall be recuperated via regenerativebraking, and then the auxiliary system battery should be charged in order tofeed the low voltage systems during the start-up, as well as starting the powersystems and put them to work. The battery could even be used to supply thevehicle with a power boost when needed.For that, a power control unit should be implemented. A device capable ofchoosing either energy recuperation should be activated or not, and capableof choosing which power power supplies to use in every situation possible. Inthat way, that device could decide whether to subtract power from the fuelcell stack, the battery or both. Of course it should also allow the battery tocharge when decelerating, as said before.
• Regarding the electrical system, it is clear that exists several component setupsand ways in which the power supplies could work together. In that way, a goodpoint to look into further study would be how to optimize the configurationbetween the main power supply (the fuel cell stack) and the auxiliary powersupply. This auxiliary power supply which normally comes in form of a battery,could even be something different such as super capacitors. Analysing theefficiency of the power supply elements, should be able to grant the possibilityof choosing the optimal solution regarding multiple factors.For example, one could try to achieve the most cost-efficient solution, as thefuel cell stack is a very expensive part of a fuel cell vehicle. One could di-mension the size of the stack trying to obtain the same power combining itwith a bigger battery or super capacitors. In the same way, the system couldbe analysed and dimensioned in order to work with the maximum possibleefficiency at all times. Taking in account the power the motor is requiringand the power that the fuel cell stack and the battery is supplying, efficiencycurves can be made and then assess at what load currents those should work.
• Last, a good improvement would be to make a more detailed and completevehicle model. The model at study is simply the electrical drivetrain, and theforces that actuate in the virtual vehicle in order to take angular speed andtorque as a reference. However, one could implement a complete structureincluding a more detailed model regarding all mechanic systems and mechanicforces such as slip ratio in the tires, actual gearbox designing, etc.
62

8Conclusion
After having done the study and the subsequent report, some conclusions can beextracted regarding both literature work and the modelling of the fuel cell vehicle.Regarding the literature work on hydrogen and fuel cell technologies, several pointscan be stated, as follows below:
• Production of hydrogen is far from being a renewable process, as more than90% of hydrogen production comes from fossil fuel consumption. Neverthe-less, substituting fossil fuels for hydrogen as a power supply for energy systemswould imply a major reduction regarding pollution into the atmosphere. More-over, several options are appearing as mid-term and long-term solutions to evensubstitute conventional hydrogen procurement methods, that will eventuallymake hydrogen production, transportation and storage a greenhouse gas free,a totally green and environmentally friendly process.
• Regarding fuel cell technologies, it is clear enough that proton exchange mem-brane fuel cells is the fuel cell technology offering better performance when itcomes to applying those to the automotive sector. Other technologies mightbe better when it comes to stationary energy procurement purposes. Never-theless, proton exchange membrane fuel cells still have a long way in termsof material improvement and cost. The major breakthrough in this type oftechnology will come when manufacturing is cheap enough to compete withconventional modes of transportation, as other characteristics have been al-ready matched, such as autonomy range and recharge time.
• It is clear enough as well that fuel cell vehicles cannot be commercialisedin a full scale currently, because there is not a well implemented hydrogentransportation network with which fuel cell vehicle users can rely on in orderto recharge their vehicles. This is without a doubt one of the major drawbacksthat is slowing fuel cell vehicle acceptance down.
• Regarding the Simulink model, it can be seen that the results of the overallsystem are coherent and that the system responds as it should in the proposedsituation. The fuel cell stack is able to deliver the range of power for whichit was conceived and the power conditioning elements are able to adapt andcontrol this power in order to give the electric motor the power to move thevehicle to the desired speed. It goes without saying that as commented inchapter 7, much improvement can be done in order to perfect this model.
63

8. Conclusion
64

Bibliography
[1] IEA, “Iea energy technology essentials”, p. 4, 2007. [Online]. Available: https://www.iea.org/publications/freepublications/publication/essentials5.pdf.
[2] S. Zurek. (2016). Igcc diagram, [Online]. Available: https://commons.wikimedia.org/wiki/File:IGCC_diagram.svg.
[3] U. S. D. of Energy. (2006). High-temperature electrolysis.png, [Online]. Avail-able: https://commons.wikimedia.org/wiki/File:High-temperature_electrolysis.png.
[4] NASA. (2008). 5420hoberecht.jpg, [Online]. Available: https : / / commons .wikimedia.org/wiki/File:5420hoberecht.jpg.
[5] I. Sakurambo. (2007). Solid oxide fuel cell.svg, [Online]. Available: https://commons.wikimedia.org/wiki/File:Solid_oxide_fuel_cell.svg.
[6] C. Buttai. (2006). Buckboost chronogram.svg, [Online]. Available: https://commons.wikimedia.org/wiki/File:Buckboost_chronogram.svg.
[7] C. Buttai. (2006). Boost chronogram.png, [Online]. Available: https://commons.wikimedia.org/wiki/File:Boost_chronogram_discontinuous.png.
[8] D. L. Greene and G. Duleep, “Status and prospects of the global automotivefuel cell industry and plans for deployment of fuel cell vehicles and hydrogenrefueling infrastructure”, p. 16, doi: ORNL/TM-2013/222. [Online]. Available:https://energy.gov/sites/prod/files/2014/03/f9/fcev_status_prospects_july2013.pdf.
[9] M. Nehrir and C. Wang, Modeling and Control of Fuel Cells: Distributed Gen-eration Applications, ser. IEEE Press Series on Power Engineering. Wiley,2009, isbn: 9780470233283. [Online]. Available: https://books.google.se/books?id=keg9JLtETh8C.
[10] E. Grunditz, BEV Powertrain Component Sizing With Respect to Perfor-mance, Energy Consumption and Driving Patterns. Institutionen för energioch miljö, Elteknik, Chalmers tekniska högskola, 2014, 171.
65

Bibliography
66

AAppendix 1
A.1 Model Figures
Figure A.1: Resultant model of the drivetrain of the fuel cell vehicle
Figure A.2: Simulink implementation of the testing driving cycle
I

A. Appendix 1
Figure A.3: Detail of force calculation, as well as PEFC and boost converterimplementation
Figure A.4: Display of the power systems of the model
II
A. Appendix 1
Figure A.5: Power calculations in the FCV model
Figure A.6: Thermal structure of the PEMFC stack
III
A. Appendix 1
Figure A.7: Part of the electrical structure of the PEMFC stack
Figure A.8: Part of the electrical structure of the PEMFC stack
A.2 MATLAB/Simulink Simulation startup script
1
2 %VARIABLE DEFINITION3
4 R = 8 . 3 1 4 ;5 F = 96487;6 Nce l l = 180 ;7 E0 = 1 . 2 2 7 ;8 MaxV = E0∗Nce l l ;9 ke = 0 . 00085 ;
10 a = −0.00286;11 nu0 = 0 . 4 1 9 ;12 Krt = −0.0000494;13 Kri = 0 .000039 ;
IV
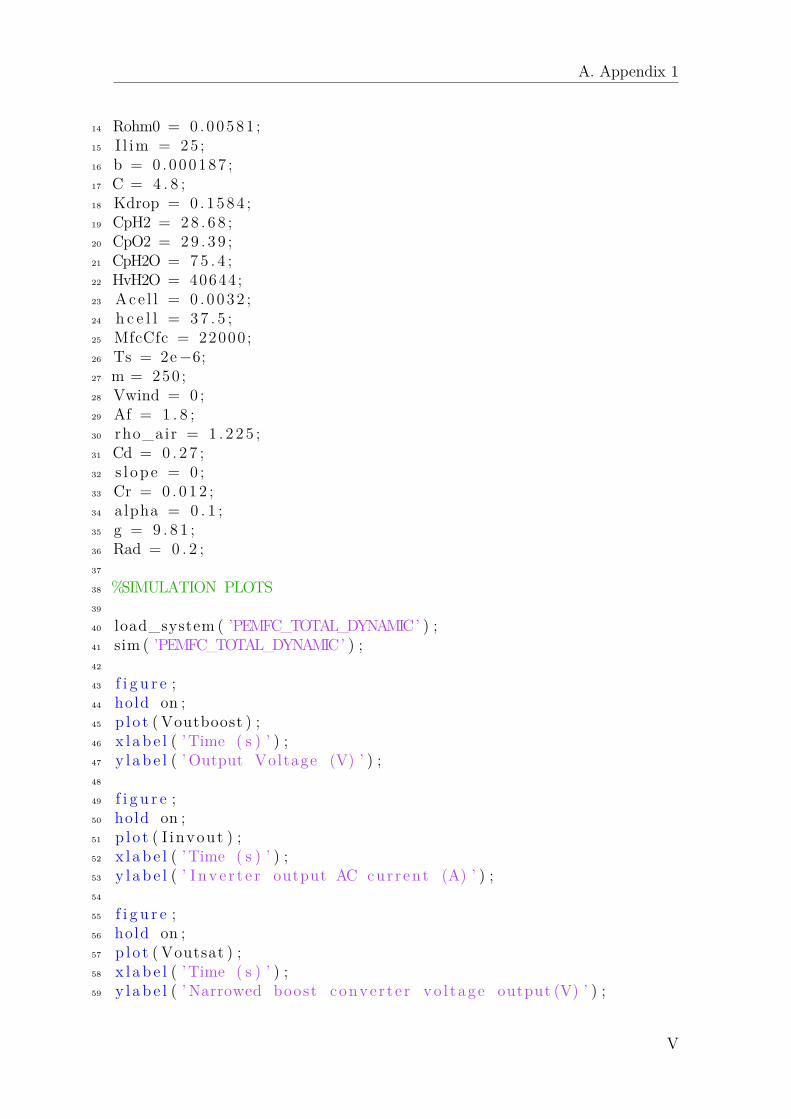
A. Appendix 1
14 Rohm0 = 0 .00581 ;15 I l im = 25 ;16 b = 0 .000187 ;17 C = 4 . 8 ;18 Kdrop = 0 . 1584 ;19 CpH2 = 28 . 6 8 ;20 CpO2 = 29 . 3 9 ;21 CpH2O = 75 . 4 ;22 HvH2O = 40644;23 Ace l l = 0 . 0 032 ;24 h c e l l = 3 7 . 5 ;25 MfcCfc = 22000 ;26 Ts = 2e−6;27 m = 250 ;28 Vwind = 0 ;29 Af = 1 . 8 ;30 rho_air = 1 . 2 2 5 ;31 Cd = 0 . 2 7 ;32 s l ope = 0 ;33 Cr = 0 . 0 1 2 ;34 alpha = 0 . 1 ;35 g = 9 . 8 1 ;36 Rad = 0 . 2 ;37
38 %SIMULATION PLOTS39
40 load_system ( ’PEMFC_TOTAL_DYNAMIC’ ) ;41 sim ( ’PEMFC_TOTAL_DYNAMIC’ ) ;42
43 f i g u r e ;44 hold on ;45 p lo t ( Voutboost ) ;46 x l ab e l ( ’Time ( s ) ’ ) ;47 y l ab e l ( ’Output Voltage (V) ’ ) ;48
49 f i g u r e ;50 hold on ;51 p lo t ( I invout ) ;52 x l ab e l ( ’Time ( s ) ’ ) ;53 y l ab e l ( ’ I nv e r t e r output AC current (A) ’ ) ;54
55 f i g u r e ;56 hold on ;57 p lo t ( Voutsat ) ;58 x l ab e l ( ’Time ( s ) ’ ) ;59 y l ab e l ( ’ Narrowed boost conve r t e r vo l t age output (V) ’ ) ;
V

A. Appendix 1
60
61 f i g u r e ;62 hold on ;63 p lo t (Pout ) ;64 x l ab e l ( ’Time ( s ) ’ ) ;65 y l ab e l ( ’ Fuel Ce l l power output (W) ’ ) ;66
67 f i g u r e ;68 hold on ;69 p lo t ( Pmotorout ) ;70 x l ab e l ( ’Time ( s ) ’ ) ;71 y l ab e l ( ’Motor power output (W) ’ ) ;72
73 f i g u r e ;74 hold on ;75 p lo t (wout ) ;76 x l ab e l ( ’Time ( s ) ’ ) ;77 y l ab e l ( ’Motor angular speed ( rad/ s ) ’ ) ;78
79 f i g u r e ;80 hold on ;81 e=(Pmotorout/Pout ) ∗100 ;82 p lo t ( e ) ;83 x l ab e l ( ’Time ( s ) ’ ) ;84 y l ab e l ( ’ Powertrain o v e r a l l e f f i c i e n c y (\%) ’ ) ;
VI