compared to traditional vehicles - LeasePlan
14
The Total Cost of Ownership of electric vehicles compared to traditional vehicles
-
Upload
khangminh22 -
Category
Documents
-
view
1 -
download
0
Transcript of compared to traditional vehicles - LeasePlan

The Total Cost of Ownership of electric vehicles compared to traditional vehicles

2
ContentIntroduction 3
Comparison difficulties 4
Results of the EV TCO study 7
Recommendations for fleet managers 11
Appendix 12A fair TCO comparison of EVs 13
Electric vehicles (EVs) are currently at the top of the agenda for fleet managers. EVs have clear sustainability advantages, such as zero tail-pipe emissions and lower wheel-to-well emissions¹, and are quieter compared to traditional vehicles.

3
OEMs are investing huge sums of money (amounting to US$ 300 billion globally over the next decade²) to ramp up EV production. The number of electric car models on the European market will more than triple over the next three years, with EU carmakers set to offer a choice of 214 electric models between them by 2021³. The charging infrastructure, which is another key aspect of EVs, is improving rapidly. There are already over 150,000 public charging stations in Europe, including 23,000 fast chargers⁴. The main issue continues to be the price; EVs are regarded as expensive because the high battery costs drive up the purchase price.
But if you factor in all the costs and assess the total cost of ownership (TCO), is it right to perceive EVs as being expensive? This white paper will explore this in more detail by answering the following two questions: 1. How can a framework be developed to achieve a like-for-
like comparison between electric vehicles and vehicles with an internal combustion engine (ICE)?
2. Looking at the TCO for fleets in Europe, what is a fair cost comparison when you include all the cost elements, such as maintenance, tyres, taxes and fuel/electricity?
4
Comparison difficulties
A like-for-like comparison is important and difficult due to so many possible vehicle combinations. There will always be some differences between EVs and ICE vehicles, but the aim is to compare vehicles that are as similar to one another as possible. ICE vehicles are traditionally compared based on vehicle size, luxury level, engine power and fuel type. This gives us the C1 segment – e.g. the Volkswagen Golf (4,258 mm) and the Peugeot 308 (4,253 mm). Another factor to consider is the engine capacity; a 1.6 litre engine is typically less powerful than a 2.0 litre engine. A comparison based on segment and engine capacity works well for diesel and petrol vehicles, since any other differences between the powertrains are limited. However, the same cannot be said for electric vehicles.
EVs differ from ICE vehicles in terms of more than just size and engine capacity. The other differences include:• A silent engine and automatic transmission with just one gear• Zero tail-pipe emissions • More interieur space due to the absence of a large engine• Additional charging infrastructure requirement
This makes it more complex to achieve a fair like-for-like comparison. For example, how should you include in the comparison the fact that EVs are quieter than ICE vehicles? These are sometimes personal preferences, making them difficult to include in an unbiased comparison.
However, there are some are factors that should always be included in your EV vs ICE comparison:• Match the power of the vehicles: select engines with similar brake horsepower• Match the gearbox: select an ICE with an automatic transmission• Match the luggage space: include the EV’s front boot space (‘frunk’) in your calculations
Ultimately, achieving a like-for-like comparison comes down to selecting two vehicles with similar trim levels. The next step is to create the right scope to enable a TCO comparison.

5
For a like-for-like comparison, the same services need to be included for both the ICE vehicle and EV. An operational lease includes a full service package of the following services:• Funding • Repair and maintenance • Tyres (summer and winter if applicable)• Insurance (comprehensive)• Replacement vehicle• Energy budget: Fuel or electricity
The energy budget is a particularly important factor; it is a cost differentiator since electricity has a different cost level than traditional fuels. It is therefore recommended to always include fuel/electricity for a true like-for-like comparison.
The price of electricity differs depending on the location. Usually, electricity costs the least at the workplace and at the driver’s home. Our data shows a mix of 10% public charging, 60% home charging and 30% workplace charging, reflecting average real-life usage.
Besides the services, the specific mileage and the term of the lease contract also need to be considered. Since many vehicle-related costs vary in line with the mileage and duration of the contract, we have considered multiple scenarios. To provide a complete picture, the following contract conditions have been included:
Term (in months) Mileage (in km)
36 months 20,000 30,000 40,000
48 months 20,000 30,000 40,000
60 months 20,000 30,000 40,000
This results in a total of nine different scenarios per vehicle.
A like-for-like TCO comparison includes all services

6
Scope: 13 countries
The vehicle costs vary per country, influenced by factors such as the local taxation system, labour costs and customer demand. In many countries EVs benefit from government incentives. Additionally, the demand level varies per country which impacts on the up-front price of a vehicle and its value in the used-car market. Therefore, a country-by-country comparison is required. For this EV study, we have included markets in which EV demand already exists and is growing. The scope covers the following 13 countries:
Not all vehicles are available in all term/mileage combinations in the countries in the scope. In total, the scope of this study includes a total of 912 scenarios, which can be split as follows:
ICE vehicle # scenarios included
Electric vehicle # scenarios included
Peugeot 208 111 Renault Zoe 111
Volkswagen Golf 119 Nissan Leaf 119
BMW 3 series 106 Tesla model 3 106
Mercedes GLE 120 Audi E-Tron 120
ICE total 456 Electric total 456

7
Results of the EV TCO study
Average TCO for EVs is lower than for ICE vehiclesAll the scenarios were averaged across all countries and compared within the same segment (e.g. a B-segment ICE vehicle was compared with a B-segment EV vehicle). The results show that the EV has a lower TCO than the ICE vehicle in 508 of the 912 comparison scenarios, equating to a majority at 56%. The ICE vehicle has a lower TCO than the EV in the remaining 44% of the scenarios.
508 404
56% 44%
0 200 400 600 800 1000
# of scenarios
EV parity
EV has lower TCO compared to ICE ICE has lower TCO compared to EV
17%
-23%
2%
6%
0%
-88%
-100% -80% -60% -40% -20% 0% 20% 40% 60% 80% 100%
Depreciation and Interest
Maintenance
Tyres
Insurance
Management fee
Taxes
Fuel/electricity
Grand total
Difference in EV costs compared to ICE vehicles
5%-
54%-
Main cost differences are in depreciation, maintenance, taxes and fuel costsThere are clear differences in the average cost elements between ICE vehicles and EVs, as illustrated in the figure below. The costs of ICE vehicles have been set as the baseline and then the EV costs have been compared against them (based on similar vehicles). This method clearly shows the differences between EVs and ICE vehicles.
This data shows that, on average, the costs of an EV are actually 5% lower than for a similar ICE vehicle.
8
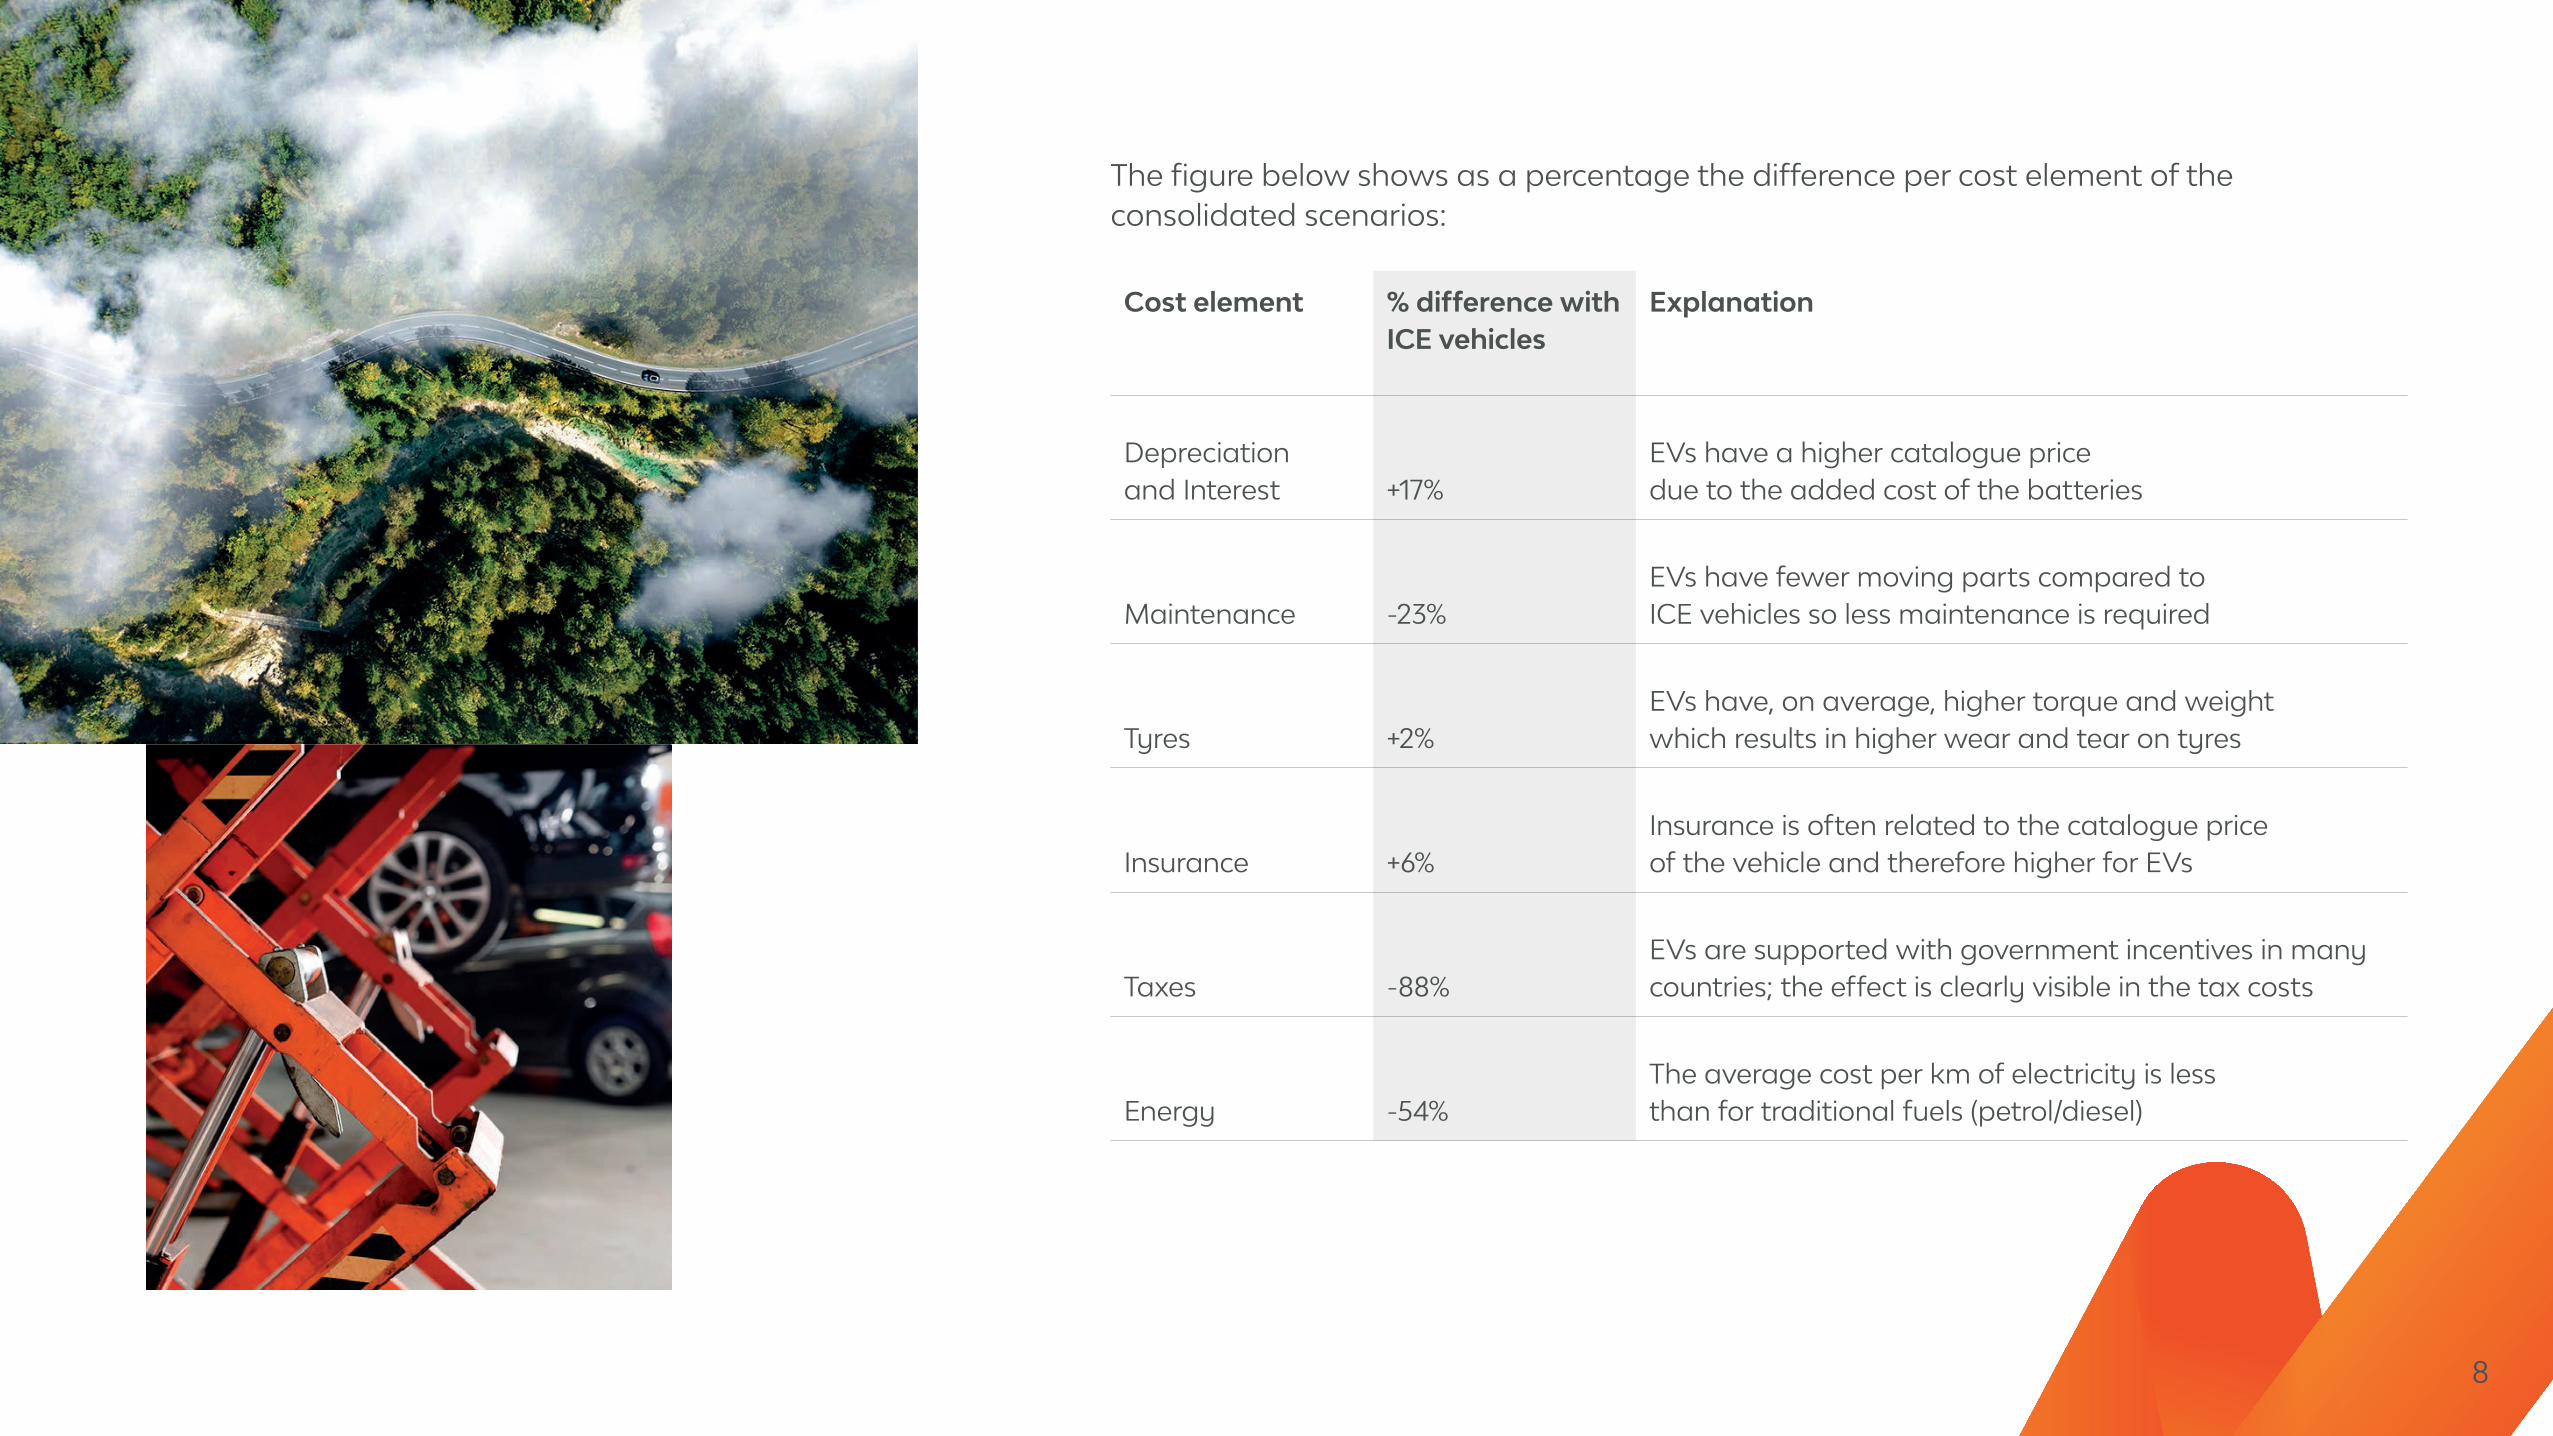
The figure below shows as a percentage the difference per cost element of the consolidated scenarios:
Cost element % difference with ICE vehicles
Explanation
Depreciation and Interest +17%
EVs have a higher catalogue price due to the added cost of the batteries
Maintenance -23%EVs have fewer moving parts compared to ICE vehicles so less maintenance is required
Tyres +2%EVs have, on average, higher torque and weight which results in higher wear and tear on tyres
Insurance +6%Insurance is often related to the catalogue price of the vehicle and therefore higher for EVs
Taxes -88%EVs are supported with government incentives in many countries; the effect is clearly visible in the tax costs
Energy -54%The average cost per km of electricity is less than for traditional fuels (petrol/diesel)

9
Diving into the details provides an even better understanding of the results. Below is an extract of all the scenarios and the average difference between the EV and the ICE vehicle. A positive percentage indicates that the EV is more expensive while a negative percentage shows a cost advantage for the EV.
36 months 48 months 60 months
Car segment: B (small cars)
Renault Zoe vs Peugeot 208
20,000km 16.2% 9.5% 5.2%
30,000km 7.8% 3.0% -1.9%
40,000km 1.5% -2.7% -2.3%
Car segment: C (medium cars)
Nissan Leaf vs Volkswagen Golf
20,000km -2.4% -3.8% -5.7%
30,000km -5.4% -7.2% -8.7%
40,000km -8.1% -11.3% -9.6%
Car segment: D (large cars)
Tesla model 3 vs BMW 3 series
20,000km 14.2% 11.3% 10.0%
30,000km 12.0% 9.6% 6.4%
40,000km 9.4% 6.7% 8.6%
Car segment: E (SUV executive cars)
Audi E-tron vs Mercedes GLE
20,000km -13.9% -15.6% -15.9%
30,000km -15.5% -16.1% -17.7%
40,000km -16.7% -16.8% -5.5%
The following can be concluded from this data: • Compared to ICE vehicles, EVs have
lower costs in conjunction with a longer duration and higher mileage, simply due to the lower running costs. The gap widens as EVs are driven further and longer.
• When it comes to TCO parity, the vehicle selection is a more important factor than the duration and mileage. In two cases (the C and E-segment vehicles), the EV always has a lower TCO compared to the ICE vehicle. Only the B-segment vehicles (Renault Zoe and Peugeot 208) show a ‘parity point’, with the EV only achieving a lower TCO than the ICE vehicle from 48 months/40,000 km and 60 months/30,000 km.

10
The data discussed on the previous page is the consolidated data of all countries. There are however huge differences per country. The fiscal treatment, vehicle costs and labour costs all vary per country which means the TCO also differs per country, as indicated below:
The graph shows the percentage of scenarios in which the TCO is lower for the EV compared to the ICE vehicle. For example, the EV has a lower cost than the ICE in 85% of the scenarios in Norway. As the data shows, there are many differences per country. The majority of countries have a wide range of scenarios with a lower TCO for EVs.
11%
33%
49%
85%
90%
100%
0% 10% 20% 30% 40% 50% 60% 70% 80% 90% 100%
ES
FR
CH
81%BE
DK
50%
50%
50%
50%
53%
56%
58%
GR
IT
PT
SE
DE
AT
NO
UK
NL
% of vehicles of which EV is cheaper than ICE

11
More informationPlease feel free to contact us at [email protected] to discuss these or other aspects in more detail.
Recommendations for fleet managers
So what can we learn from this study? Firstly, that a perfect like-for-like comparison is not feasible with EVs; there are always other trade-offs to be considered. The silent and clean driving of an EV cannot be compared with a diesel vehicle. However, it is possible to match as closely as possible elements such as size, power and trim level. An entry-class ICE vehicle typically has lower specifications compared to an entry-class EV. It is important to try to match similar vehicle specs when you are comparing the TCO.
Secondly, the TCO comparison shows that the TCO of EVs already equals – or is even lower than – the TCO of ICE vehicles in many countries. This implies that EVs really are a suitable alternative in lease policies and there are few reasons not to allow EVs from a cost perspective. All 13 countries included in this study show scenarios in which an EV is the lower-cost option. In general, a longer lease duration and higher
mileage will produce greater cost advantages for the EV compared to the ICE vehicle. This is due to the running costs (maintenance, fuel) being lower for EVs than for ICEs.
Thirdly, a key consideration is to include all cost elements in the comparison. The most significant cost differences are in depreciation, maintenance, taxes and fuel/electricity. In practice, however, the fuel/electricity costs in particular are often left out of the scope, even though these costs are borne by the company. To achieve a correct comparison the fuel/electricity costs should therefore be included in the scope, even if the current lease policy budgets exclude fuel.
Besides just the TCO, there are other elements to consider for EVs as well – such as the charging infrastructure, driver communication/training relating to the different driving style, and the impact of driver taxation (benefit in kind).
Sources used1 https://www.eea.europa.eu/publications/electric-vehicles-from-life-cycle2 https://graphics.reuters.com/AUTOS-INVESTMENT-ELECTRIC/010081ZB3HD/index.html³ https://www.transportenvironment.org/press/electric-car-models-triple-europe-2021-%E2%80%93-market-data⁴ https://www.eafo.eu/countries/european-union/23640/infrastructure/electricity

Appendix
12

13
A fair TCO comparison of EVs
Eight carefully selected comparable vehiclesThis study is based on the eight models shown in the table below. They have been carefully selected to enable as fair a comparison as possible. Common vehicles have been chosen from each of the typical fleet segments – from small (B segment) up to executive vehicles – and the ICEs and EVs have been matched as closely as possible in terms of the trim level. See the table below for more details.
Segment Power train Model Trim level Length (in mm)
Power (in kW)
Luggage space with seats up (in litres)
B (small cars)
Internal combustion engine Peugeot 208 1.2 PureTech 110 Automatic 4,055 81 kW (110 hp) 265
Electric Renault Zoe 40 kWh Life R90 4,084 68 kW (91 hp) 338
C (medium cars)
Internal combustion engine Volkswagen Golf Highline 2.0 TDI 110kW DSG 4,258 110 kW (150 hp) 380
Electric Nissan Leaf 40 kWh Acenta 4,480 110 kW (150 hp) 435
D (large cars)
Internal combustion engine BMW 3 series 320d xDrive Sedan Automatic 4,624 140 kW (190 hp) 480
Electric Tesla model 3 75 kWh Long- range Dual-motor AWD 4,690 274 kW (367 hp) 425
E (SUV executive cars)
Internal combustion engine Mercedes GLE 400 d 4MATIC 4,900 243 kW (330 hp) 650
Electric Audi E-Tron 55 quattro 4,901 300 kW (402 hp) 660
Note: the general availability of vehicles in the countries was important when selecting these vehicles. When a particular trim was not available in a country, the closest available alternative was selected. In the D segment, the matching for the ICE vehicle could have been based on a higher powertrain but it was not available in all countries. This would have affected the outcome of the comparison in the D segment.

leaseplan.com
LeasePlan Corporation N.V. Gustav Mahlerlaan 360 1082 ME Amsterdam The Netherlands [email protected]