Energy Technology CW Electric Vehicles
20
Electric Vehicles: Technological Progress, Implications on Grid and other Infrastructure Assessing UK EV Potential Zephaniah Kivungi 4/9/2014 To the attention of Dr. Stas Burek
Transcript of Energy Technology CW Electric Vehicles
Electric Vehicles: Technological
Progress, Implications on Grid and
other Infrastructure
Assessing UK EV Potential
Zephaniah Kivungi
4/9/2014
To the attention of Dr. Stas Burek

S1339586 | Zephaniah Kivungi Page 1
Table of Contents
List of Acronyms .................................................................................................................... 2
List of Figures ........................................................................................................................ 3
Executive Summary ............................................................................................................... 4
1.0 Introduction ..................................................................................................................... 4
2.0 The Technology: ............................................................................................................. 6
2.1 Energy Efficiency ............................................................................................................. 7
3.0 Crucial Improvements: What has to Change for EVs to Dominate ................................ 9
3.1 Battery Technology: Capacity versus Cost ...................................................................... 9
3.2 Range and Recharging Time .......................................................................................... 10
4.0 Infrastructure: What if UK had a complete Shift to EVs? ............................................ 12
4.1 Grid Capacity ................................................................................................................. 12
4.2 Grid Stability .................................................................................................................. 14
4.3 Development of infrastructure and Knowhow .............................................................. 15
5.0 Sustainability: Coal versus Nuclear and RE for Electricity .......................................... 16
6.0 Conclusions and Recommendations ............................................................................. 17
7.0 References ..................................................................................................................... 18
Appendices ........................................................................................................................... 19

S1339586 | Zephaniah Kivungi Page 2
List of Acronyms
BCG – Boston Consulting Group
BPEV – Battery [powered electric vehicle
CO2 – Carbon Dioxide
EV – Electric Vehicle
FCEV– Fuel-cell electric vehicle
HEV– Hybrid Electric Vehicles
ICEV– Internal combustion engine vehicles
kWh – Kilowatt-hour
LCA – Life Cycle Analysis
Li – Lithium
R&D – Research and Development
RE –Renewable Energy
SMMT– The Society of Motor Manufacturers and Traders

S1339586 | Zephaniah Kivungi Page 3
List of Figures Figure 1: BEV Powertrain. Either a battery pack at back or entire chassis base ....................... 6
Figure 2: Standard Hybrid Vehicle mechanism. Source: www.bydeurope.com, 2014 ............. 7
Figure 3: Vehicle Electrification path, Gradual Technology Shift ............................................ 8
Figure 4: Energy versus power for various EV Options. Source: Broussely, 2010 ................... 8
Figure 5: Commercial EV Performance Comparison. Adapted from: www.byd.com and
www.Teslamotors.com .............................................................................................................. 9
Figure 6: Advanced Charging Technology in Use in USA and Europe .................................. 11
Figure 7: Extra Demand if half of UK cars were electrified .................................................... 12
Figure 8: Energy Demand Increase in the Event electrifying half of UK's cars ...................... 12
Figure 9: If only new cars were Electrified ............................................................................. 13
Figure 10: Demand profile with nominal EV demands. .......................................................... 13
Figure 11: EV demanding electricity in UK by hour of day. Source: Element Energy, 2014 14
Figure 12: Electric Charging Points across UK. Source: NextgreenCar.com, 2014 ............... 16

S1339586 | Zephaniah Kivungi Page 4
Electric Vehicles: Technological Progress, Implications on
Grid and other Infrastructure
Executive Summary
Electric vehicles will continue to generate interest in the world in the pursuit of a low-carbon
economy. The huge energy efficiency and reliability gap between EVs and internal
combustion presents massive barriers. If EVs are to dominate on the road, battery technology
for energy storage will need to be revolutionary to go beyond the current maximum range of
425km. The source of electricity complicates the emission reductions, policy around nuclear
electricity and presents serious challenges to renewable electricity targets; though EVs can be
good means to ‘store’ intermittent RE. Other than capacity, grid stability would be altered
and new balances have to be developed. If UK is to electrify even just the new cars coming
onto the roads each year, an additional 3.2TWh has to be availed in addition to an electric
charging grid whose running will be a delicate balance between profitability and
sustainability.
1.0 Introduction
Road transport has been and remains one of the biggest users of energy in the UK. There are
about 32 million cars on UK roads, after a 436,000 increase in 2013 (SMMT, 2014). The
transport sector consumed 36% of all energy in UK in 2012 according to Digest of UK
Energy Statistics (DUKES, 2013). This translates to 621.042TWh. An improvement of fuel
efficiency technologies would translate to significant savings in energy use.

S1339586 | Zephaniah Kivungi Page 5
Electric vehicles (EVs) were dominant in the world up to 1912 when Ford’s the Model T, run
by an internal combustion engine, took over (history.com, 2014). The internal combustion
engine vehicles (ICEVs) have dominated the car industry and technologies have improved
tremendously over these 100 years. The main area of improvement has been fuel economics
over and above aerodynamics and safety. Fuel economics focus on two intricate aspects-
mileage and cost. In the US for instance, there is regulation requiring a minimum of 14.5km
per litre so as to attain CO2 emission reduction (Lynette, 2011). Climate change will thus
remain a major driver to the adoption of EVs.
UK’s electricity consumption increased in the transport sector in 2012, to 4.1 TWh, with a
small increase in numbers of electric road vehicles. 99% of transport electricity consumption
was Rail (DUKES, 2013). According to DUKES, 2013, out of 621.042TWh used by
transport, road transport used 74.12% or 459.036TWh. If UK was to switch to 100% EVs,
this would mean different delivery patterns, potentially higher demand. The electricity
generation capacity would require significant expansion and the supply dynamics including
peak loads might change. EVs are expected to make a re-emergence in the world market due
to the global challenge of climate change in a bid to control CO2 emissions.
UK has concerns over reliance of foreign petroleum fuels and increased electricity generation
to meet a migration to EVs would complicate the challenge. Nuclear, renewables and coal
are, thus, the possible means of this new capacity owing. A pathway to sustainable petroleum
displacement is the adoption of high-efficiency powertrain technologies, like fuel-cell or
battery-EVs able to deliver high performance, higher efficiency, and zero exhaust emissions
(Dong et al., 2014).
This report assesses the variants of electric vehicle technology and underpins their
efficiencies - storage capacity versus driving range and the current advances on these

S1339586 | Zephaniah Kivungi Page 6
concerns. The odds of achieving less reliance of imported energy is critically assessed with
respect to if road transport was to shift to EVs; and whether this would necessarily mean
reduction of carbon emissions. Further, the implications on the electricity supply dynamics
(like peak demands) and the infrastructure development and flexibility as well as metering.
Finally, recommendations as to the adoption potential and required adjustments are
suggested.
2.0 The Technology: Various Configurations
A vehicle requires energy for propulsion. Internal combustion engine vehicles (ICEVs)
purely use the conversion of chemical energy in fuel to heat and kinetic energy that then
drives a motor and propels the car. Battery electric vehicles (BEVs) draw all power from the
electric grid, using only batteries for on-board energy storage. The range thus depends on
battery capacity and availability of recharge points is a key consideration.
Figure 1: BEV Powertrain. Top has a battery pack at back while the Tesla design (bottom) has entire chassis as battery

S1339586 | Zephaniah Kivungi Page 7
On the other hand, plug-in-electric vehicles (PEVs) which include full EVs and plug-in
hybrids (PHEVs) draw part or all their power from the electric grid. The PHEV draws the
rest of its power from an alternative energy source on board, like gasoline. They thus have
internal combustion engines. There exist many possible configurations and designs of
PHEVs. Further, there are hybrid electric vehicles (HEVs) that have both an ICE and an
electric drivetrain for propulsion, but does not take electricity from the grid (Ma, et al. 2012).
Figure 2: Standard Hybrid Vehicle mechanism. Source: www.bydeurope.com, 2014
2.1 Energy Efficiency
A gradual shift towards full EVs hinges on improvement of thermodynamic efficiencies in
ICEVs by hybridizing and adoption of cleaner electricity for charging if the EVs are to satisfy
one of the drivers-CO2 emission reductions. The electricity generated having to go through
thermal power plants (whose efficiencies are 10-50%) translate to much less efficient
resource use when further losses- at charging and propulsion dynamics - are factored in. In
essence, the losses at power plants would be similar to ICEV engine losses; therefore ICEVs
remain a step ahead in energy costs unless renewable energy sources are considered. The
renewable energy argument will also be based on what particular technology is used.

S1339586 | Zephaniah Kivungi Page 8
Figure 3: Vehicle Electrification path, Gradual Technology Shift. Source: Boston Consulting Group, 2013
The overall energy and LCA efficiencies (celled well-to-wheel in ICEVs) is depend largely
on battery technology; if the battery have a complex disposal (and potentially energy
intensive) processes, then on an energy perspective, EVs will not much ICEV technology.
Alongside range, the car size also impacts battery sizing and energy efficiencies- from small
hybrid to full EVs, the specific electric properties required and battery size vary considerably
with the vehicle type and size (Broussely, 2010). The consumer perceptions of comfort and
satisfaction are complex (BCG, 2014).
Figure 4: Energy versus power for various EV Options. Source: Broussely, 2010
S1339586 | Zephaniah Kivungi Page 9
3.0 Crucial Improvements: What has to Change for EVs to Dominate
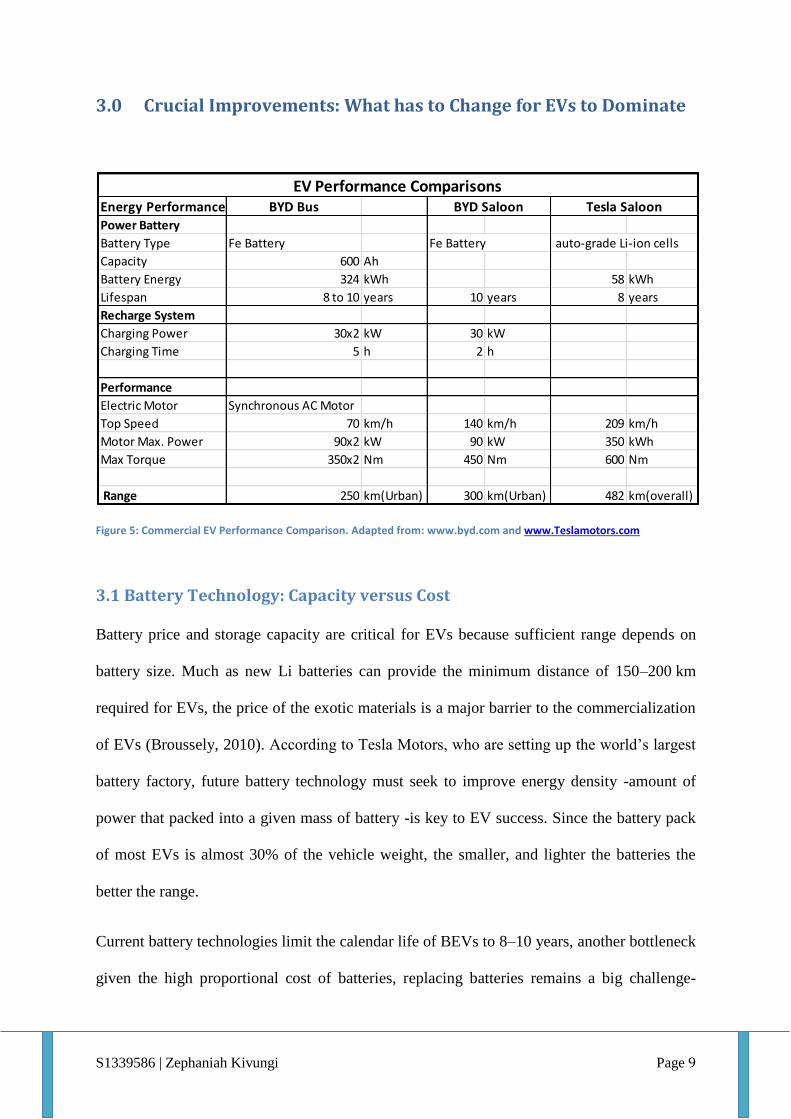
Figure 5: Commercial EV Performance Comparison. Adapted from: www.byd.com and www.Teslamotors.com
3.1 Battery Technology: Capacity versus Cost
Battery price and storage capacity are critical for EVs because sufficient range depends on
battery size. Much as new Li batteries can provide the minimum distance of 150–200 km
required for EVs, the price of the exotic materials is a major barrier to the commercialization
of EVs (Broussely, 2010). According to Tesla Motors, who are setting up the world’s largest
battery factory, future battery technology must seek to improve energy density -amount of
power that packed into a given mass of battery -is key to EV success. Since the battery pack
of most EVs is almost 30% of the vehicle weight, the smaller, and lighter the batteries the
better the range.
Current battery technologies limit the calendar life of BEVs to 8–10 years, another bottleneck
given the high proportional cost of batteries, replacing batteries remains a big challenge-
Energy Performance BYD Bus
Power Battery
Battery Type Fe Battery Fe Battery auto-grade Li-ion cells
Capacity 600 Ah
Battery Energy 324 kWh 58 kWh
Lifespan 8 to 10 years 10 years 8 years
Recharge System
Charging Power 30x2 kW 30 kW
Charging Time 5 h 2 h
Performance
Electric Motor Synchronous AC Motor
Top Speed 70 km/h 140 km/h 209 km/h
Motor Max. Power 90x2 kW 90 kW 350 kWh
Max Torque 350x2 Nm 450 Nm 600 Nm
Range 250 km(Urban) 300 km(Urban) 482 km(overall)
EV Performance ComparisonsBYD Saloon Tesla Saloon
S1339586 | Zephaniah Kivungi Page 10
whether by customer or by manufacturer. Tesla’s first Li-ion batteries were priced at about
£600 a kWh and in 5years the price is £240 to £450 a kWh (Tesla Motors, 2014). Even then,
the 85 kWh pack in their sedan is a production cost of between £20,500 and £38,000. A study
by BCG established that battery costs would have to be £120 or less per kWh by 2020 if
electric vehicles are to compete with the all familiar internal combustion engine vehicles.
Further, at R&D the technology that reaches that target will still need to address disposal or
recycling barrier especially in accordance with Directive 2000/53/EC on September 2000,
defining the end-of-life of vehicles and increasing recycling minimum levels.
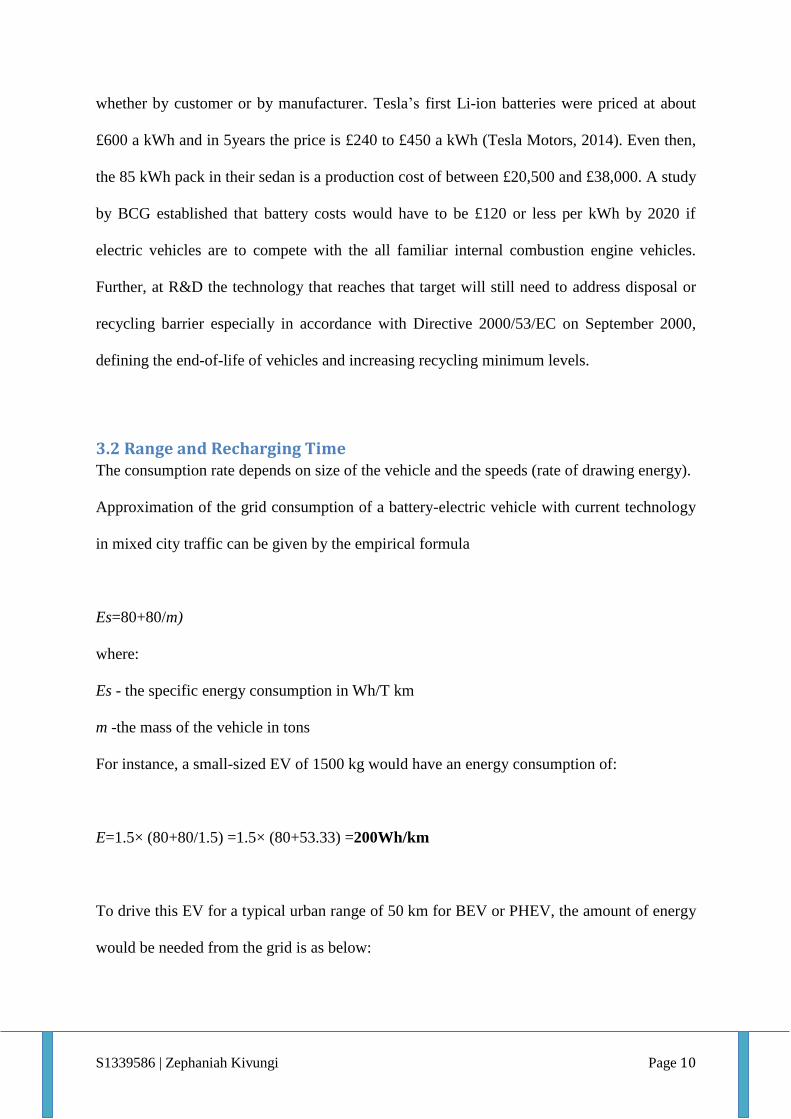
3.2 Range and Recharging Time The consumption rate depends on size of the vehicle and the speeds (rate of drawing energy).
Approximation of the grid consumption of a battery-electric vehicle with current technology
in mixed city traffic can be given by the empirical formula
Es=80+80/m)
where:
Es - the specific energy consumption in Wh/T km
m -the mass of the vehicle in tons
For instance, a small-sized EV of 1500 kg would have an energy consumption of:
E=1.5× (80+80/1.5) =1.5× (80+53.33) =200Wh/km
To drive this EV for a typical urban range of 50 km for BEV or PHEV, the amount of energy
would be needed from the grid is as below:

S1339586 | Zephaniah Kivungi Page 11
E=50km ×200Wh/km= 10kWh
A maximum range design paradox is optimising space and cost yet the more battery cell, the
more the final mass of the EV. So to get 425km range:
For pure EVs to make long journeys the battery bank has to be quite big or recharging is
required in in reasonably short distances. Crucial improvement to the recharging points are
thus around the capacity to recharge the batteries to full capacity rapidly. One such
development done by Tesla Motors has a 120kW charge points that recharge 16times faster
than the conventional chargers. 30minutes for is still way slower than petrol or diesel
refuelling for 200miles.
Figure 6: Advanced Charging Technology in Use in USA and Europe. Source: http://www.teslamotors.com
Another downside of these advanced chargers is the fact that they are dedicated to a
particular model meaning the car manufacturer has to install them.
Range Grid Energy
50km Range 10 kWh
425km Range 85 kWh

S1339586 | Zephaniah Kivungi Page 12
4.0 Infrastructure: What if UK had a complete Shift to EVs?
For a complete shift, whenever it will happen, there will need to be an Electric Recharge Grid
with universal charging points.
4.1 Grid Capacity
If the about 32 million cars on UK roads were electrified, and taking half of them to be light
and doing 100km a day, the grid demand would have an additional demand as follows:
Figure 7: Extra Demand if half of UK cars were electrified
A daily additional 320,000MWh delivered to the Electric Recharge Grid which a constant
output of 13,333.33MW for the 24hrs of the day charging patterns notwithstanding. So
electrifying all cars would translate to 27,000MW installed, a massive expansion in
generation capacity. The energy demand would increase as follows:
Figure 8: Energy Demand Increase in the Event electrifying half of UK's cars
A nominal energy demand of 116.8TWh up from 4.1TWh in 2013 (DUKES, 2013) is close to
28times increase.
Even if only new cars were factored, the 436,000 new cars in 2013 would translate to
3.183TWh increase in electricity demand.
Grid Energy Demand
50km Range 10.00 kWh
100km Range 20.00 kWh
16,000,000 320,000.00 MWh
For 16m cars Grid Energy Demand
50km Range 10.00 kWh
100km Range 20.00 kWh
16,000,000 320,000.00 MWh
365 Days 116,800,000.00 MWh

S1339586 | Zephaniah Kivungi Page 13
Figure 9: If only new cars were Electrified
One way of looking at the demand patterns would be to follow the normal demand curves as
below:
Figure 10: Demand profile with nominal EV demands. Source: Eon UK, 2014
Figure 11: Predicted Electricity peak demand and supply after Forecast Closures of Power plants. Source: E.ON UK
For 436k New cars in 2013 Grid Energy Demand
50km Range 10.00 kWh
100km Range 20.00 kWh
436,000 8,720.00 MWh
365 Days 3,182,800.00 MWh

S1339586 | Zephaniah Kivungi Page 14
This kind of demand would mean massive increase in GHG emission given the additional
peaks would be supplied primarily by the dispatchable fossil capacity. As the years progress,
then either new coal or nuclear power plants may need to be built. And if then renewable
energy was to be expanded to meet the extra demand, then GHG emission reductions would
be significant.
4.2 Grid Stability
Since road transport is used for running the economy mainly during the day, there is likely to
be a new late night peak or an escalation of the early evening.
Figure 12: EV demanding electricity in UK by hour of day. Source: Element Energy, 2014
A late night would create a good balance to the existing day-time/night-time imbalances. This
kind of demand would best be supplied by nuclear if it is to be clean. The challenge with
nuclear is the lack of flexibility when the peak dies out- the excess capacity, in the morning,
would need to be transferred elsewhere. Finding that perfect importer to take up the excess
would be a challenge if cost is to be maintained reasonably low.

S1339586 | Zephaniah Kivungi Page 15
If charging happened in the night, then the electricity suppliers could design smart metering
in which the uptake of electricity by electric cars could be incentivised for times when
variable resources are most available. Case in point is, if UK exploits the tidal or wind
potential o such a level. The cars then become a means to ‘store’ energy by being charged
when these resources generate maximum electricity.
4.3 Development of infrastructure and Knowhow
One of the low carbon technologies the Committee on Climate Change (CCC) proposes for
meeting UK’s 2020 emission reduction targets is EVs. The CCC has calculated at least 1.7
million EVS (with 3.9m drivers trained in fuel-efficient techniques) by 2020 for UK to hit the
targets. The knowledge on repairs of cars will be a critical skill. "Dramatic improvements," as
the CCC calls them (CCC, 2014), demand for revolutionary technological breakthroughs if
uptake of EVs is to rise. Otherwise, measures to cut the growth in traffic, including road
pricing may be easier way out.

S1339586 | Zephaniah Kivungi Page 16
Figure 13: Electric Charging Points across UK. Source: NextgreenCar.com, 2014
There is a possibility of having custom-made pre-charged batteries at the charging station so
that motorists can leave discharged ones and avoid the delay at charging. Customisation,
specific storage capacity requirements and model designs would be a barrier to this option.
5.0 Sustainability: Coal versus Nuclear and RE for Electricity
With an Electric Recharge Grid, operating and managing it becomes the next decision to
make: operate it as an open, competitive manner or as a controlled, profit-maximization tool.
In a normal competitive market model, the choice of fuel for electricity generation would be
the most cost-effective. On the other hand, if based on current energy policy, the Electric
Charging Grid is to be required to only purchase and sell clean electricity, then the capacity
will have to be built first otherwise, the gains on decarbonisation of electricity supply will
disappear if the EV demand increases and then quick fossil fuels like coal have to fill the
gap.

S1339586 | Zephaniah Kivungi Page 17
6.0 Conclusions and Recommendations
The ultimate attraction of EVs as perfect for a low-carbon economy will remain elusive since
it is an expensive technology owing to energy storage limitation. Battery prices have to come
to the region of £120 a kWh. Additionally, the huge electricity generation will remain a
barrier if decommissioning of nuclear and coal power plants is to stay on course. This
coupled with the setup of a complete electric charging grid as well as increasing technical
knowhow. Developing countries will not have this as a priority in the short and medium term
since grid capacity, stability and reliability is largely elusive.
In UK, hard decisions will have to be made at policy level about new generation capacity and
renewable energy targets. EVs can be storage for intermittent energy from renewable sources
like wind and tidal. Dedicated nuclear power plants could perhaps be a way to power the
Electric Charging Grid. On the technology side, domestic automakers must focus on the
R&D of key technologies, so as to lower the costs. Overall, the potential remains big for EVS
in the UK and world. Translating this potential into reality requires government, academia
and industry to make hard decisions on technology choice, electric charging infrastructure,
and on the economic front, the level of subsidies and support research from both sides.

S1339586 | Zephaniah Kivungi Page 18
7.0 References
Bohnsack, R., Pinkse, J. & Kolk, A. 2014, "Business models for sustainable technologies: Exploring
business model evolution in the case of electric vehicles", Research Policy, Vol. 43, no. 2, pp. 284-
300.
Boston Consulting Group, 2014. [online]. Available on: http://www.bcg.com [Accessed on:
[01.04.2014]
Broussely, M. 2010, "CHAPTER THIRTEEN - battery requirements for HEVs, PHEVs, and EVs: An
overview." in: Electric and hybrid vehicles, ed. G. Pistoia, Elsevier, Amsterdam, pp. 305-345.
Dong, J., Liu, C. & Lin, Z. 2014, "Charging infrastructure planning for promoting battery electric
vehicles: An activity-based approach using multiday travel data", Transportation Research Part C:
Emerging Technologies, Vol. 38, no. 0, pp. 44-55.
Drude, L., Pereira Junior, L.C. & Rüther, R. 2014, "Photovoltaics (PV) and electric vehicle-to-grid
(V2G) strategies for peak demand reduction in urban regions in brazil in a smart grid
environment",Renewable Energy, Vol. 68, no. 0, pp. 443-451.
Element Energy (UK), 2014. [online]. Available on: www.element-energy.co.uk. [Accessed on
01.04.2014]
Eon Energy, UK, 2014. [online]. Available on www.eonenergy.com. [Accessed on: 02.04.2014]
History Channel, 2014. [online]. Available on: http://www.history.co.uk [Accessed on: 25.03.2014]
Johansson, B. & Åhman, M. 2002, "A comparison of technologies for carbon-neutral passenger
transport", Transportation Research Part D: Transport and Environment, Vol. 7, no. 3, pp. 175-196.
Ma, H., Balthasar, F., Tait, N., Riera-Palou, X. & Harrison, A. 2012, "A new comparison between the
life cycle greenhouse gas emissions of battery electric vehicles and internal combustion
vehicles",Energy Policy, Vol. 44, no. 0, pp. 160-173.
Pina, A., Baptista, P., Silva, C. & Ferrão, P. 2014, "Energy reduction potential from the shift to
electric vehicles: The flores island case study", Energy Policy, Vol. 67, no. 0, pp. 37-47.
Saisirirat, P., Chollacoop, N., Tongroon, M., Laoonual, Y. & Pongthanaisawan, J. 2013, "Scenario
analysis of electric vehicle technology penetration in thailand: Comparisons of required electricity
with power development plan and projections of fossil fuel and greenhouse gas reduction", Energy
Procedia, Vol. 34, no. 0, pp. 459-470.
SMMT, 2014. [online]. Available on: http://www.smmt.co.uk [Accessed on: 28.03.2014]
The Committee on Climate Change - UK, 2014. [online]. Available on: http://www.theccc.org.uk
[Accessed on 01.04.2014].
Xu, L., Li, J., Ouyang, M., Hua, J. & Yang, G. 2014, "Multi-mode control strategy for fuel cell
electric vehicles regarding fuel economy and durability", International Journal of Hydrogen
Energy, Vol. 39, no. 5, pp. 2374-2389.

S1339586 | Zephaniah Kivungi Page 19
Appendices
1. Charging points are not universal yet. Car manufacturers are still having to supply
them and some are exclusive to their models
2. Related reports and articles
http://www.hybridcars.com/wp-content/uploads/2013/12/Norway_BEV_Adoption.jpg
http://www.smmt.co.uk/2014/03/decades-fastest-growth-sees-almost-32-million-cars-road/
http://www.hybridcars.com/november-ev-sales-12-percent-norway/
http://www.nextgreencar.com/news/6562/Rapid-EV-chargers-coming-to-North-East
http://www.renewableenergyworld.com/rea/news/article/2013/12/are-electric-vehicles-
already-halfway-to-market-dominance?cmpid=WNL-Wednesday-December18-2013
https://www.gov.uk/government/uploads/system/uploads/attachment_data/file/279546/DUKE
S_2013_Chapter_5.pdf