Stability Control for Electric Vehicles with Four In-Wheel ...
Upload
khangminh22Category
view
1download
0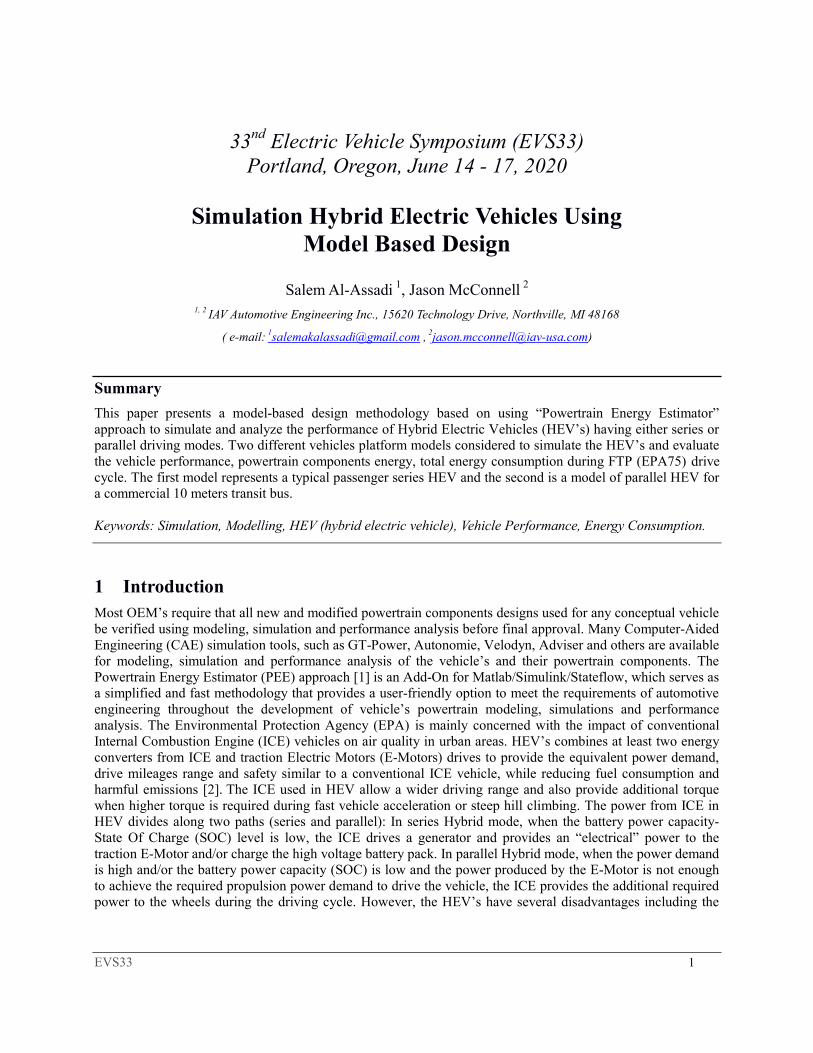
EVS33 1
33nd Electric Vehicle Symposium (EVS33) Portland, Oregon, June 14 - 17, 2020
Simulation Hybrid Electric Vehicles Using Model Based Design
Salem Al-Assadi 1, Jason McConnell 2
1, 2 IAV Automotive Engineering Inc., 15620 Technology Drive, Northville, MI 48168
( e-mail: [email protected] , [email protected])
Summary
This paper presents a model-based design methodology based on using “Powertrain Energy Estimator” approach to simulate and analyze the performance of Hybrid Electric Vehicles (HEV’s) having either series or parallel driving modes. Two different vehicles platform models considered to simulate the HEV’s and evaluate the vehicle performance, powertrain components energy, total energy consumption during FTP (EPA75) drive cycle. The first model represents a typical passenger series HEV and the second is a model of parallel HEV for a commercial 10 meters transit bus.
Keywords: Simulation, Modelling, HEV (hybrid electric vehicle), Vehicle Performance, Energy Consumption.
1 Introduction Most OEM’s require that all new and modified powertrain components designs used for any conceptual vehicle be verified using modeling, simulation and performance analysis before final approval. Many Computer-Aided Engineering (CAE) simulation tools, such as GT-Power, Autonomie, Velodyn, Adviser and others are available for modeling, simulation and performance analysis of the vehicle’s and their powertrain components. The Powertrain Energy Estimator (PEE) approach [1] is an Add-On for Matlab/Simulink/Stateflow, which serves as a simplified and fast methodology that provides a user-friendly option to meet the requirements of automotive engineering throughout the development of vehicle’s powertrain modeling, simulations and performance analysis. The Environmental Protection Agency (EPA) is mainly concerned with the impact of conventional Internal Combustion Engine (ICE) vehicles on air quality in urban areas. HEV’s combines at least two energy converters from ICE and traction Electric Motors (E-Motors) drives to provide the equivalent power demand, drive mileages range and safety similar to a conventional ICE vehicle, while reducing fuel consumption and harmful emissions [2]. The ICE used in HEV allow a wider driving range and also provide additional torque when higher torque is required during fast vehicle acceleration or steep hill climbing. The power from ICE in HEV divides along two paths (series and parallel): In series Hybrid mode, when the battery power capacity-State Of Charge (SOC) level is low, the ICE drives a generator and provides an “electrical” power to the traction E-Motor and/or charge the high voltage battery pack. In parallel Hybrid mode, when the power demand is high and/or the battery power capacity (SOC) is low and the power produced by the E-Motor is not enough to achieve the required propulsion power demand to drive the vehicle, the ICE provides the additional required power to the wheels during the driving cycle. However, the HEV’s have several disadvantages including the

EVS33
increase in vehicle mass, components, costs, power electronics and complexity of the overall powertrain control managements [
2 Components of Hybrid Electric Vehicle
The main components of the two configuration
2.1 Series HEV In series HEV, the E-Motor only suppliesoptimal operation range to provide the energy to the storage system (main advantage of the series configurationcan run at its optimum, greatly reducing fuel consumption. connected to the wheels and sized to achieve the target vehicle performancemaximum vehicle speed and acceleration timecapacity (SOC) of the battery pack higher than the required
2.2 Parallel HEV
In parallel HEV, both the E-Motor and the and engine are both coupled directly to the wheels by share the high power demand during fast vehicle accelerations downsize both the E-Motor and the capacity is initially determined by the power demand in steady driving speed. The engine must deliver enough power resistance power and the aerodynamic drag power. The Eduring dynamic driving, such as fast acceleration and maximum grade ability requirements. Since the speed is linked to the vehicle speed, the conditions. However, using power from efficiency as compared to the series configuration during most operating conditions [located anywhere between the output
(a) Series HEV
Figure1. Components of
increase in vehicle mass, components, costs, power electronics and potentially a lower reliability due to the complexity of the overall powertrain control managements [2].
onents of Hybrid Electric Vehicle
the two configuration types of HEV’s are shown in Figure 1:
supplies power to propel the vehicle. The engine drives a operation range to provide the energy to the storage system (battery) when it needs to be charged. One
configuration is that the engine and vehicle speeds are decoupledgreatly reducing fuel consumption. In this configuration, the E-Motor is the only one
connected to the wheels and sized to achieve the target vehicle performance (sustain the road grade ability, maximum vehicle speed and acceleration time). The engine and generator are sized only to maintain the
higher than the required limit to power the E-Motor to drive the vehicle
Motor and the engine have a mechanical connection to the wheelsboth coupled directly to the wheels by transmission gearbox/clutch/differential
share the high power demand during fast vehicle accelerations or grade climbing [2]. Therefore, it is possibMotor and the engine compared to series Hybrid configuration.
initially determined by the power demand in steady driving conditions with a constant cruising speed. The engine must deliver enough power to meet the vehicle power demand, which includes the rolling resistance power and the aerodynamic drag power. The E-Motor power size depends on
fast acceleration and maximum grade ability requirements. Since the linked to the vehicle speed, the engine can operate close to its best efficiency curve only under certain
using power from both the E-Motor and the engine to propel the vehicle increaseseries configuration during most operating conditions [2]. The E
located anywhere between the output engine shaft and the wheels.
(b) Parallel HEV
Figure1. Components of series/parallel HEV’s
2
reliability due to the
drives a generator within its attery) when it needs to be charged. One
is that the engine and vehicle speeds are decoupled so the engine Motor is the only one
sustain the road grade ability, sized only to maintain the power
Motor to drive the vehicle [2].
connection to the wheels. The E-Motor ifferential axles, and can
Therefore, it is possible to The engine power
with a constant cruising , which includes the rolling
Motor power size depends on the power demand fast acceleration and maximum grade ability requirements. Since the engine
can operate close to its best efficiency curve only under certain to propel the vehicle increases the
]. The E-Motor can be
EVS33
3 Powertrain Energy EstimatorThis section briefly describes the topperformance of any conceptual conventionalElectric Vehicles (HEV’s series or parallelmodel-based design used for simulations and does not require any building or compilation steps. It is flexible enough to operate on most computers in commercially available MATLAB/Simulinkgraphical/object-oriented software environments. The the usage and the development of any conceptualand update the overall vehicle model by selecting the powerdifferent drive cycles from various files that can be loaded and saved to
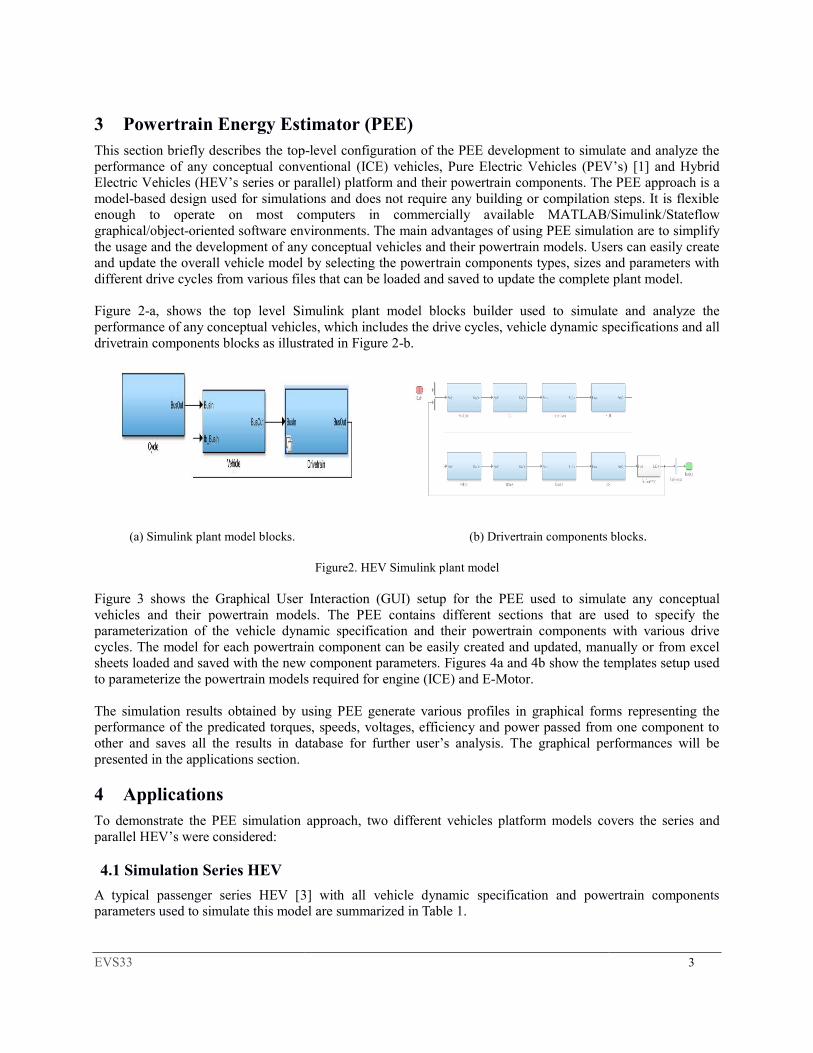
Figure 2-a, shows the top level Simulink performance of any conceptual vehiclesdrivetrain components blocks as illustrated in Figure
(a) Simulink plant model blocks.
Figure 3 shows the Graphical User Interaction (GUI) vehicles and their powertrain modelsparameterization of the vehicle dynamic specification and their powertrain components cycles. The model for each powertrain component can be easily creatsheets loaded and saved with the new component parameters. Figures to parameterize the powertrain models required for
The simulation results obtained by using PEE generate various profiles in graphical formperformance of the predicated torques, speeds, voltages, efficiency and power passed from one component to other and saves all the results in database for further user’s analysis. Tpresented in the applications section.
4 Applications To demonstrate the PEE simulation approach,parallel HEV’s were considered:
4.1 Simulation Series HEV
A typical passenger series HEV [3parameters used to simulate this model
Powertrain Energy Estimator (PEE) the top-level configuration of the PEE development to simulate and analyze the
conventional (ICE) vehicles, Pure Electric Vehicles (PEV’s series or parallel) platform and their powertrain components. The PEE approach is a
based design used for simulations and does not require any building or compilation steps. It is flexible enough to operate on most computers in commercially available MATLAB/Simulink
ted software environments. The main advantages of using PEE simulation areany conceptual vehicles and their powertrain models. Users can easily create
and update the overall vehicle model by selecting the powertrain components types, sizes and parameters with different drive cycles from various files that can be loaded and saved to update the complete
Simulink plant model blocks builder used to simulate and analyze the vehicles, which includes the drive cycles, vehicle dynamic specifications and all
components blocks as illustrated in Figure 2-b.
(b) Drivertrain components
Figure2. HEV Simulink plant model
shows the Graphical User Interaction (GUI) setup for the PEE used to simulate any powertrain models. The PEE contains different sections that are used to specify the
of the vehicle dynamic specification and their powertrain components The model for each powertrain component can be easily created and updated, manually
with the new component parameters. Figures 4a and 4b show the templates setup used the powertrain models required for engine (ICE) and E-Motor.
by using PEE generate various profiles in graphical formperformance of the predicated torques, speeds, voltages, efficiency and power passed from one component to
all the results in database for further user’s analysis. The graphical performance
PEE simulation approach, two different vehicles platform models covers
3] with all vehicle dynamic specification and powertrain components parameters used to simulate this model are summarized in Table 1.
3
ration of the PEE development to simulate and analyze the (PEV’s) [1] and Hybrid
components. The PEE approach is a based design used for simulations and does not require any building or compilation steps. It is flexible
enough to operate on most computers in commercially available MATLAB/Simulink/Stateflow advantages of using PEE simulation are to simplify
sers can easily create train components types, sizes and parameters with
complete plant model.
to simulate and analyze the specifications and all
omponents blocks.
for the PEE used to simulate any conceptual used to specify the
of the vehicle dynamic specification and their powertrain components with various drive manually or from excel
show the templates setup used
by using PEE generate various profiles in graphical forms representing the performance of the predicated torques, speeds, voltages, efficiency and power passed from one component to
he graphical performances will be
covers the series and
specification and powertrain components
EVS33
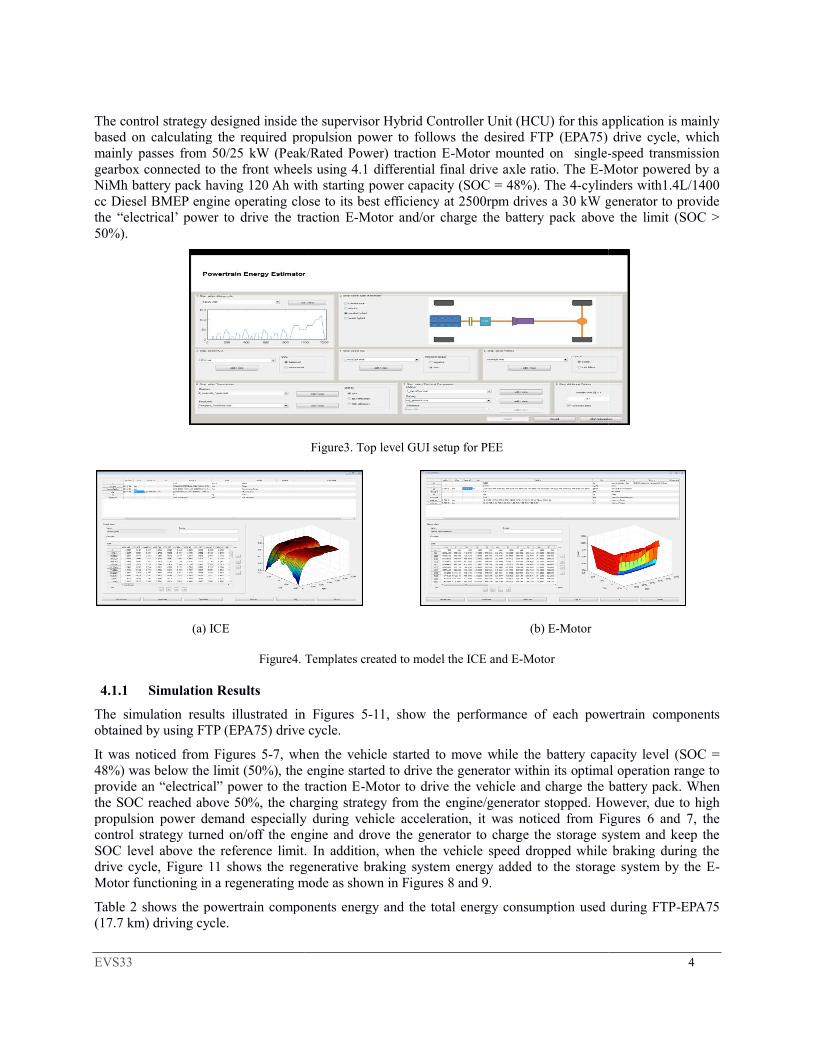
The control strategy designed inside the supervisor Hybrid Controller Unit (HCU) for this abased on calculating the required propulsion power to follows the desired FTPmainly passes from 50/25 kW (Peak/Rated Power) traction Egearbox connected to the front wheels using 4.1 NiMh battery pack having 120 Ah with cc Diesel BMEP engine operating close to its best efficiencythe “electrical’ power to drive the traction E50%).
(a) ICE
Figure4. Template
4.1.1 Simulation Results
The simulation results illustrated in Figures obtained by using FTP (EPA75) drive cycle.
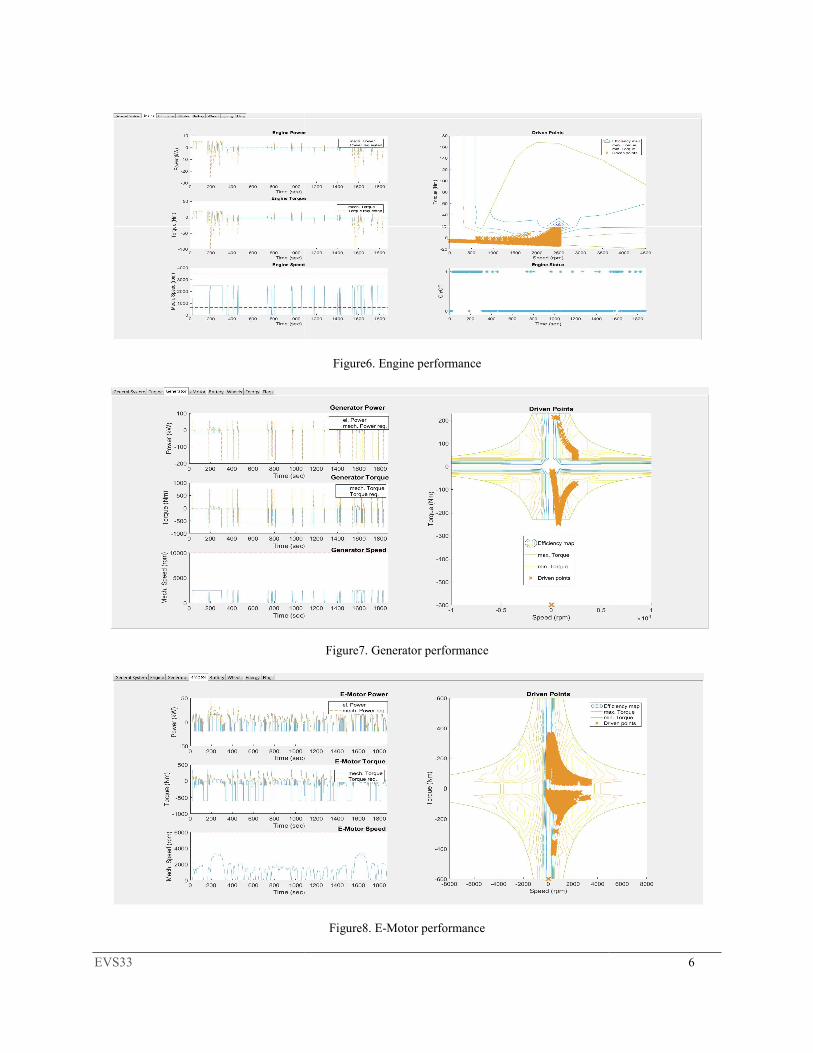
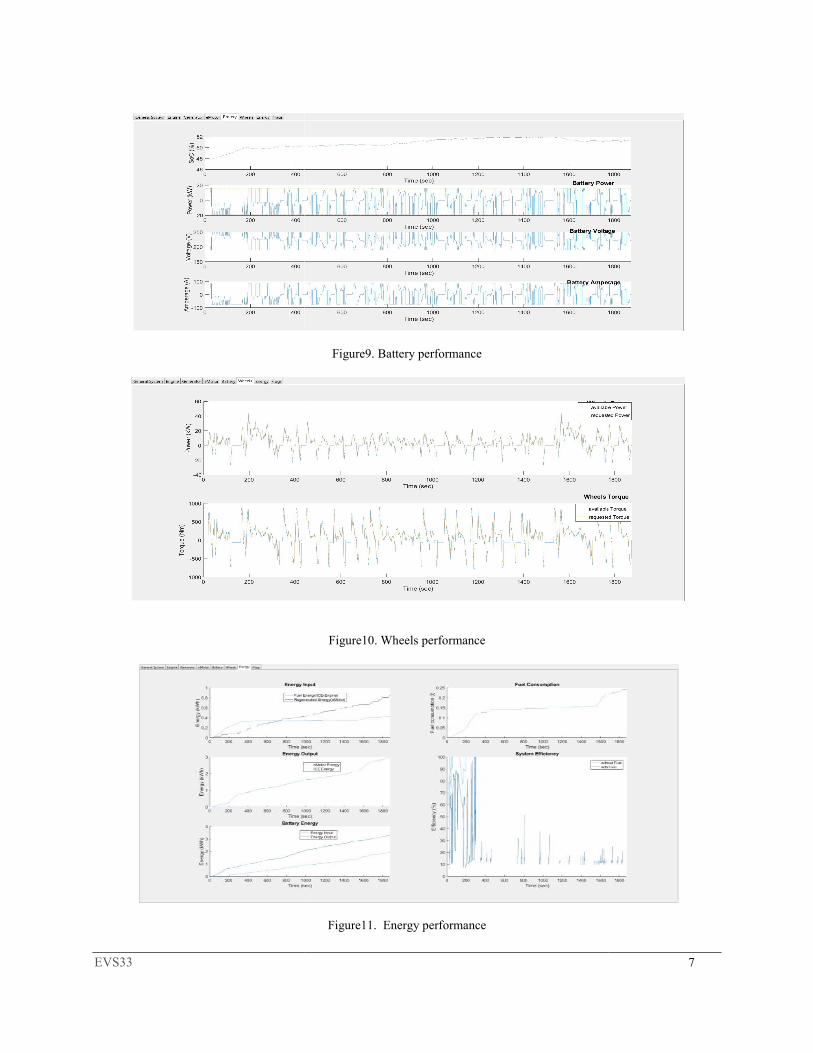
It was noticed from Figures 5-7, when the vehicle started to move while the 48%) was below the limit (50%), the provide an “electrical” power to the traction Ethe SOC reached above 50%, the charging strategy from the propulsion power demand especially during vehicle acceleration, it was noticed from Figures control strategy turned on/off the engine and drove the SOC level above the reference limit. Idrive cycle, Figure 11 shows the regenerative braking system Motor functioning in a regenerating mode as shown in Figures
Table 2 shows the powertrain components energy and the total energy consumption used d(17.7 km) driving cycle.
The control strategy designed inside the supervisor Hybrid Controller Unit (HCU) for this abased on calculating the required propulsion power to follows the desired FTP (EPA75) driv
from 50/25 kW (Peak/Rated Power) traction E-Motor mounted on single-nt wheels using 4.1 differential final drive axle ratio. The E-Motor powered by a
attery pack having 120 Ah with starting power capacity (SOC = 48%). The 4-cylinders with1.4L/1400 close to its best efficiency at 2500rpm drives a 30 kW g
the traction E-Motor and/or charge the battery pack above the limit (SOC >
Figure3. Top level GUI setup for PEE
(b) E-Motor
. Templates created to model the ICE and E-Motor
The simulation results illustrated in Figures 5-11, show the performance of each powertraindrive cycle.
, when the vehicle started to move while the battery capacity level (SOC = 48%) was below the limit (50%), the engine started to drive the generator within its optimal operation range to provide an “electrical” power to the traction E-Motor to drive the vehicle and charge the the SOC reached above 50%, the charging strategy from the engine/generator stopped. However, due to propulsion power demand especially during vehicle acceleration, it was noticed from Figures
ngine and drove the generator to charge the storage system and keep the SOC level above the reference limit. In addition, when the vehicle speed dropped while braking during the
regenerative braking system energy added to the storage system by the EMotor functioning in a regenerating mode as shown in Figures 8 and 9.
s the powertrain components energy and the total energy consumption used d
4
The control strategy designed inside the supervisor Hybrid Controller Unit (HCU) for this application is mainly (EPA75) drive cycle, which
-speed transmission Motor powered by a
cylinders with1.4L/1400 generator to provide
attery pack above the limit (SOC >
, show the performance of each powertrain components
apacity level (SOC = enerator within its optimal operation range to
Motor to drive the vehicle and charge the battery pack. When enerator stopped. However, due to high
propulsion power demand especially during vehicle acceleration, it was noticed from Figures 6 and 7, the enerator to charge the storage system and keep the
n addition, when the vehicle speed dropped while braking during the added to the storage system by the E-
s the powertrain components energy and the total energy consumption used during FTP-EPA75

EVS33
Table1. Vehicle dynamic and powertrain
Series HEV Vehicle Specification
Drive Type
Final Drive Ratio
Vehicle Mass (Kg)
Wheelbase (m)
Aero Drag Coefficient
Air Density Coefficient
Road Rolling Resistance
Front Area (m^2)
Dynamic wheel radius(m)
Inertia of Wheels(kgm^2)
Table
Table1. Vehicle dynamic and powertrain specifications
Vehicle Specification
RWD
4.1
1500
3.3
0.31
1.2
0.015
4
0.289
1.25
Table2 Powertrain energy during FTP drive cycl
Figure5. General vehicle performance
5
EVS33
Figure6. Engine performance
Figure7. Generator performance
Figure8. E-Motor performance
6
EVS33
Figure9. Battery performance
Figure10. Wheels performance
Figure11. Energy performance
7

EVS33
4.2 Simulation Parallel HEV
The simulated model used for the parallel HEVFigure 12 [1]. All vehicle specifications and powertrain3 [1].
Figure 1
The 140 kW E-Motor mounted on efficient 4wheels with 6.2 differential final drive power. The vehicle model was configured in this paper as parallel HEV by including a 2.5L/2500cc TDI [4] coupled in parallel with traction Ewhen high propulsion power demand required and/or the
Remark (1): It was assumed for this application; when the vehicle started to move, the power provided from the traction E-Motor was limited due to the low initial achieve the propulsion power demand required to drive the vehicle. This assumption allowparallel HEV can combine the power from both drive comppropulsion power demand to drive the rear wheels and avoid dropping the SOC below the limit < 50%
Remark (2): It should also noted that for this application; a proper efficient 4designed by Eaton were selected such that both their best efficiency regions of operation energy efficiency and reduced fuel consumption.
Therefore, the control strategy points designed inside the supervisor Hybrid Controller Unit (HCU) for this application is mainly based on calculating the required propulsion power demand during FTPcycle and managed the distribute the below the limit and to keep both drive componentspower from the E-Motor was limited, the mode adding the rest of the power required
4.2.1 Simulation Results
The performances of the vehicle and their powertrain components obtained from the simulation (EPA75) drive cycle are shown in Figures 1decreased slightly when the vehicle started to move and the traction Ewas not enough to meet the higher propulsion power meet the driving cycle speed and keeping the (50%), the hydraulic separation clutch additional torque to meet the propulsion power demand. The SOC remain16, but decreased at high vehicle speed when both region. In addition, when the vehicle speed steeply dropped while braking, the SOC level dramatically increased due to the regenerative braking system recovered from the Eto supply the “electricity” power to charge the
the parallel HEV, is representing a commercial 10 meters transit bus shown in [1]. All vehicle specifications and powertrain components parameters are available as listed in Table
Figure 12 Typical commercial transits bus
otor mounted on efficient 4-speed Eaton AMT transmission gearbox connected to the rear ifferential final drive axle ratios and powered by Altair Nano battery with 60 Ah capacity
. The vehicle model was configured in this paper as parallel HEV by including a 2.5L/2500cc TDI with traction E-Motor to share the propulsion power demand during the drive cycle
when high propulsion power demand required and/or the battery power capacity (SOC) level is low.
It was assumed for this application; when the vehicle started to move, the power provided from the Motor was limited due to the low initial battery capacity (SOC = 60%) and was not enough to
achieve the propulsion power demand required to drive the vehicle. This assumption allowedcombine the power from both drive components (engine and E-Motor)
to drive the rear wheels and avoid dropping the SOC below the limit < 50%
that for this application; a proper efficient 4-speeds transmission gear rasuch that both drive components (engine and E-Motor) can
operation during vehicle drive cycle, which greatly improvefuel consumption.
Therefore, the control strategy points designed inside the supervisor Hybrid Controller Unit (HCU) for this application is mainly based on calculating the required propulsion power demand during FTP
tribute the torque to both drive components. In order to avoid drive components operating close to their best efficiency region
, the hydraulic separation clutch locked and the engine operatethe rest of the power required to drive the rear wheels.
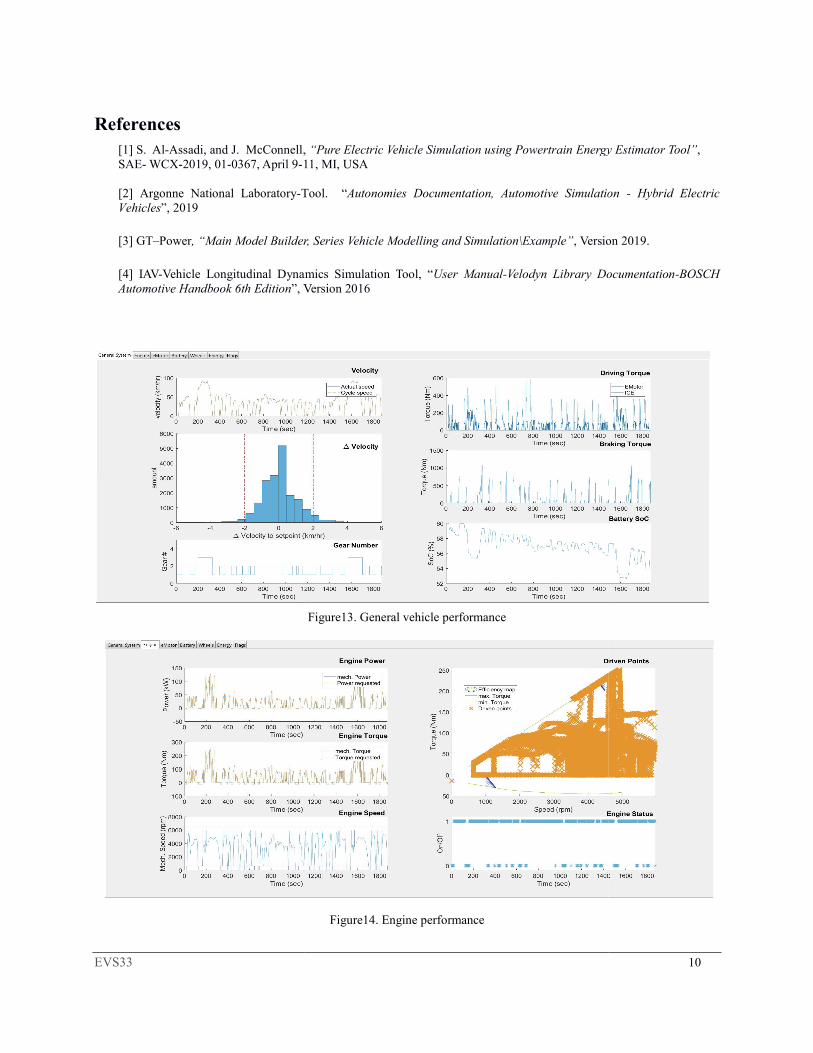
The performances of the vehicle and their powertrain components obtained from the simulation shown in Figures 13-18. It was noticed from Figures 13 and 15
decreased slightly when the vehicle started to move and the traction E-Motor produced a limited torquwas not enough to meet the higher propulsion power demand required for the driving cycle speed. In order to meet the driving cycle speed and keeping the battery capacity level (SOC) from dropping below the limit
lutch locked and the engine was running as shown in Figure 14 additional torque to meet the propulsion power demand. The SOC remained above the limit
speed when both engine and E-Motor operated close to theirthe vehicle speed steeply dropped while braking, the SOC level dramatically
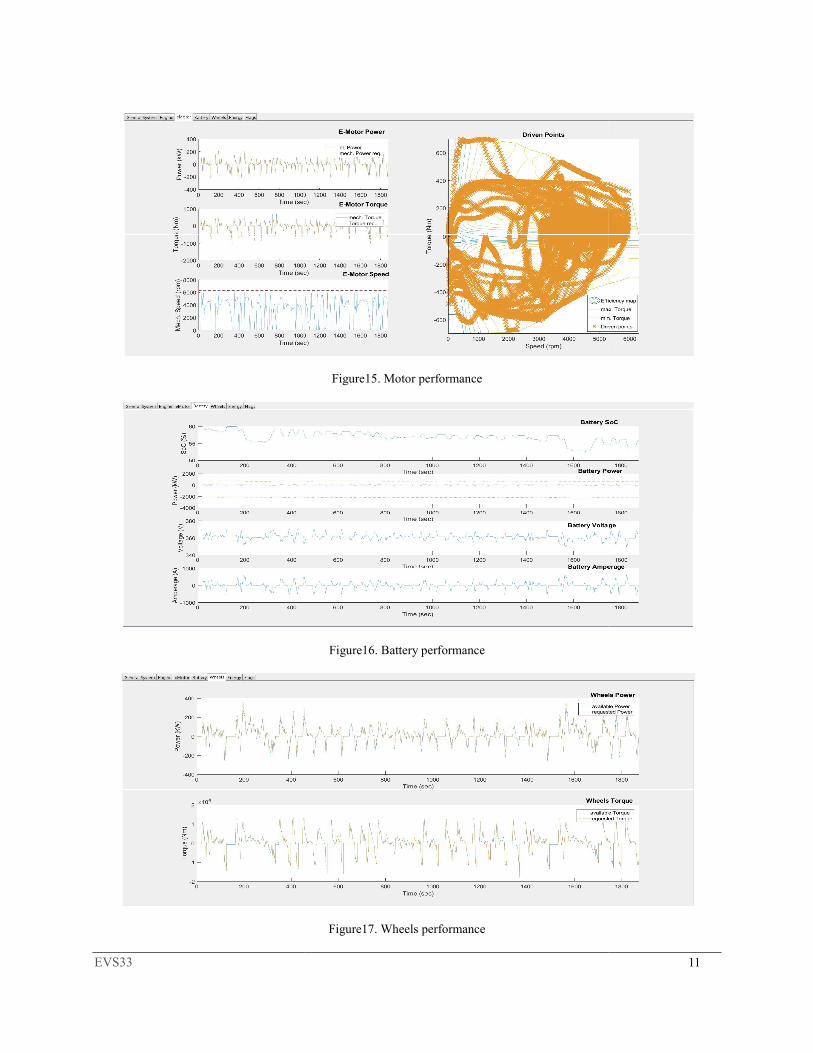
increased due to the regenerative braking system recovered from the E-Motor functioning in regenerating mode the “electricity” power to charge the battery pack as shown in Figures 16 and 18.
8
commercial 10 meters transit bus shown in components parameters are available as listed in Table
earbox connected to the rear attery with 60 Ah capacity
. The vehicle model was configured in this paper as parallel HEV by including a 2.5L/2500cc TDI engine power demand during the drive cycle
level is low.
It was assumed for this application; when the vehicle started to move, the power provided from the attery capacity (SOC = 60%) and was not enough to
ed us to see how the Motor) to achieve the high
to drive the rear wheels and avoid dropping the SOC below the limit < 50%.
transmission gear ratio can operate close to
during vehicle drive cycle, which greatly improved the total system
Therefore, the control strategy points designed inside the supervisor Hybrid Controller Unit (HCU) for this application is mainly based on calculating the required propulsion power demand during FTP(EPA75) drive
avoid dropping the SOC best efficiency region, the output
ngine operated in parallel
The performances of the vehicle and their powertrain components obtained from the simulation during the FTP 5, the level of SOC a limited torque that
demand required for the driving cycle speed. In order to from dropping below the limit
as shown in Figure 14 to generate above the limit as shown in Figure
their best efficiency the vehicle speed steeply dropped while braking, the SOC level dramatically
in regenerating mode
EVS33
Table3. Vehicle
Vehicle PlatformVehicle Mass (kg)
Wheelbase (ft.)
Aero Drag Coefficient
Air Density Coefficient
Road Rolling ResistanceFront Area (m^2)
Dynamic Wheel Radius(m)
EM-TypeMax. Motor Speed(rpm)
Max. Motor Power(kW)
Motor Peak Torque (Nm)
HV-TypeCapacity Power (Ah)(SOC) - Initial /
Battery Manufactured
Transmission Gearbox/Axle Specification
Vehicle Drive
Transmission Gearbox
Final Drive Ratio
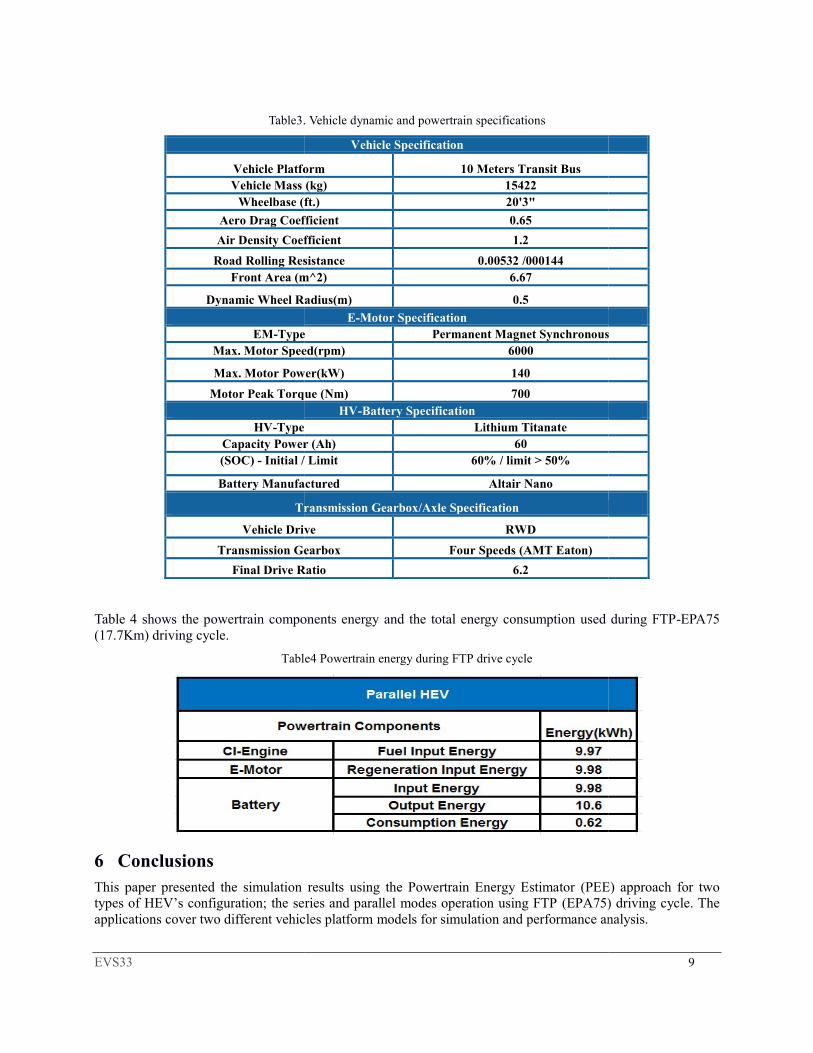
Table 4 shows the powertrain components energy (17.7Km) driving cycle.
Table
6 Conclusions This paper presented the simulation types of HEV’s configuration; the series and parallel modes operation using FTPapplications cover two different vehicles platform
. Vehicle dynamic and powertrain specifications
Vehicle Specification
Vehicle Platform 10 Meters Transit Bus Vehicle Mass (kg) 15422
Wheelbase (ft.) 20'3"
Aero Drag Coefficient 0.65
Air Density Coefficient 1.2
Resistance 0.00532 /000144 Front Area (m^2) 6.67
Dynamic Wheel Radius(m) 0.5
E-Motor Specification Type Permanent Magnet Synchronous
Max. Motor Speed(rpm) 6000
Max. Motor Power(kW) 140
Motor Peak Torque (Nm) 700 HV-Battery Specification
Type Lithium Titanate Capacity Power (Ah) 60
/ Limit 60% / limit > 50%
Battery Manufactured Altair Nano
Transmission Gearbox/Axle Specification
Vehicle Drive RWD
Transmission Gearbox Four Speeds (AMT Eaton)
Final Drive Ratio 6.2
shows the powertrain components energy and the total energy consumption used during FTP
Table4 Powertrain energy during FTP drive cycle
simulation results using the Powertrain Energy Estimator (PEE) the series and parallel modes operation using FTP (EPA75)
applications cover two different vehicles platform models for simulation and performance analysis.
9
Permanent Magnet Synchronous
used during FTP-EPA75
(PEE) approach for two ) driving cycle. The
for simulation and performance analysis.
EVS33
References [1] S. Al-Assadi, and J. McConnell, SAE- WCX-2019, 01-0367, April 9-11, MI, USA [2] Argonne National Laboratory-ToolVehicles”, 2019
[3] GT–Power, “Main Model Builder,
[4] IAV-Vehicle Longitudinal Dynamics Simulation Tool, Automotive Handbook 6th Edition”, Version
, “Pure Electric Vehicle Simulation using Powertrain Energy 11, MI, USA
Tool. “Autonomies Documentation, Automotive Simulation
Main Model Builder, Series Vehicle Modelling and Simulation\Example”, Version 2019.
amics Simulation Tool, “User Manual-Velodyn Library DocumentationVersion 2016
Figure13. General vehicle performance
Figure14. Engine performance
10
Energy Estimator Tool”,
Autonomies Documentation, Automotive Simulation - Hybrid Electric
, Version 2019.
Library Documentation-BOSCH
EVS33
Figure15. Motor performance
Figure16. Battery performance
Figure17. Wheels performance
11

EVS33
Authors
Salem Al-Assadi, (Bsc, M.Sc, Ph.D)
(1990), Ph.D. degree in Electrical & Computer Engineering, Concordia University, Montreal, Canada. (1991-1995), PostFaculty, Department of Electrical & Computer Eng
(1995-2002), Control Analyst (Gas Turbine Engine), Rolls Royce
(2003-2020),Technical SpecialistEngineering Inc. (2005Vehicles (HEV’s)”, (2014Design” for Eaton, Fiat
Areas of interest: Model Based Dcalibration using on-line optimization. Published over 60 technical papers in recognizedand presented at different international conferences.
Jason McConnell (B.S
(1995), B.Sc in Electrical Engineering, Kettering University.
(2000), M.Sc in Electrical Engineering
(2000 -2002), Senior Product Engineer
(2002-Present), BusinessIAV Automotive Engineering Inc.
Figure18. Energy performance
Assadi, (Bsc, M.Sc, Ph.D):
(1990), Ph.D. degree in Electrical & Computer Engineering, Concordia University, Montreal, 1995), Post-Doctoral Fellowship, Research Position, Lecturer and Part
Faculty, Department of Electrical & Computer Engineering at Concordia University.
2002), Control Analyst (Gas Turbine Engine), Rolls Royce Canada, Montreal Canada.
2020),Technical Specialist-Hybrid & Electrification Control Systems, IAV Automotive Engineering Inc. (2005-2013) work on IAV-General Motor project “Advanced Hybrid Electric
)”, (2014-2020) work on IAV projects “Electrification & Hybrid Control Systems for Eaton, Fiat-Chrysler Automotive and Mitsubishi Motors R&D of America.
Areas of interest: Model Based Design (MBD-SIL/MIL), HIL (dSPACE/OPL-RT/ISI/ADI), auto line optimization. Published over 60 technical papers in recognized
and presented at different international conferences.
.Sc, M.Sc,):
in Electrical Engineering, Kettering University.
), M.Sc in Electrical Engineering - Control Systems. Michigan State University.
Senior Product Engineer, Eaton Corporation.
Business Unit Director - Electrification, Hybrid and Battery SystemIAV Automotive Engineering Inc.
12
(1990), Ph.D. degree in Electrical & Computer Engineering, Concordia University, Montreal, Doctoral Fellowship, Research Position, Lecturer and Part-time
ineering at Concordia University.
, Montreal Canada.
Hybrid & Electrification Control Systems, IAV Automotive eneral Motor project “Advanced Hybrid Electric
2020) work on IAV projects “Electrification & Hybrid Control Systems Chrysler Automotive and Mitsubishi Motors R&D of America.
RT/ISI/ADI), auto line optimization. Published over 60 technical papers in recognized journals
. Michigan State University.
System.
Copyright © 2022 FDOKUMEN