Real-world usage of plug-in hybrid vehicles in Europe
55
JUNE 2022 WHITE PAPER REAL-WORLD USAGE OF PLUG-IN HYBRID VEHICLES IN EUROPE A 2022 UPDATE ON FUEL CONSUMPTION, ELECTRIC DRIVING, AND CO 2 EMISSIONS Patrick Plötz, Steffen Link, Hermann Ringelschwendner, Marc Keller, Cornelius Moll, Georg Bieker, Jan Dornoff, Peter Mock BEIJING | BERLIN | SAN FRANCISCO | SÃO PAULO | WASHINGTON www.theicct.org [email protected] twitter @theicct
-
Upload
khangminh22 -
Category
Documents
-
view
2 -
download
0
Transcript of Real-world usage of plug-in hybrid vehicles in Europe

JUNE 2022
WHITE PAPER
REAL-WORLD USAGE OF PLUG-IN HYBRID VEHICLES IN EUROPE A 2022 UPDATE ON FUEL
CONSUMPTION, ELECTRIC DRIVING,
AND CO2 EMISSIONS
Patrick Plötz, Steffen Link, Hermann Ringelschwendner, Marc Keller,
Cornelius Moll, Georg Bieker, Jan Dornoff, Peter Mock
B E I J I N G | B E R L I N | S A N F R A N C I S C O | S Ã O PA U LO | WA S H I N G TO N
www.theicct.org
twitter @theicct

ACKNOWLEDGMENTSThe authors thank all internal and external reviewers of this report, with special thanks to Uwe Tietge (ICCT), John German, Anna Krajinska (Transport & Environment), and three anonymous individuals. Their review does not imply an endorsement, and any errors are the authors’ own. In addition, the authors thank the Bundesverband Betriebliche Mobilität (formerly known as Bundesverband Fuhrparkmanagement) for the kind support in contacting companies for fuel consumption data as well further companies for providing their data.
Edited by Amy Smorodin
For additional information:ICCT – International Council on Clean Transportation EuropeFasanenstraße 85, 10623 Berlin
[email protected] | www.theicct.org | @TheICCT
© 2022 International Council on Clean Transportation
Funding for this work was generously provided by the European Climate Foundation, the Climate Imperative Foundation, and Aspen Global Change Institute.

i ICCT WHITE PAPER | REAL-WORLD USAGE OF PLUG-IN HYBRID VEHICLES IN EUROPE
EXECUTIVE SUMMARYPlug-in hybrid electric vehicles (PHEVs) combine an electric and a combustion engine drive train. Their potential to reduce fuel consumption, global greenhouse gas (GHG) emissions, and local air pollution thus depends on how much they are effectively driven on electricity. Existing studies on the real-world usage of PHEVs certified under the New European Driving Cycle (NEDC) have shown that those vehicle models are driven much less on electricity than the type-approval procedure assumes, which on average results in two to four times larger real-world fuel consumption and CO2 emissions than the official type-approval values. There is less evidence concerning the average real-world fuel consumption of PHEVs certified under the more recent Worldwide Harmonized Light Vehicles Test Procedure (WLTP). As newer PHEVs certified under WLTP are equipped with longer electric ranges and the deviation between real-world and type-approval fuel consumption for conventional vehicles is smaller, one could expect the deviation between type-approval and real-world fuel consumption of PHEVs to decrease with the WLTP introduction.
To fill this knowledge gap and provide clarity, this study presents a large-scale analysis of the average real-world fuel consumption and electric driving share of about 9,000 private and company car PHEVs in Europe, with an emphasis on WLTP type-approved vehicle models. The analysis arrives at the following main findings:
The real-world fuel consumption of PHEVs in Europe is on average three to five times higher than WLTP type-approval values. The average real-world fuel consumption of PHEVs in Europe is 4.0–4.4 L/100 km for private vehicles and 7.6–8.4 L/100 km for company cars compared to an average of 1.6–1.7 L/100 km in WLTP type approval (Figure ES 1). These values correspond to tailpipe emissions of 90–105 g CO2/km for private vehicles and 175–195 g CO2/km for company cars compared to only 37–39 g CO2/km in WLTP type approval.
The deviation between real-world and type-approval fuel consumption is growing. For PHEVs in general, the real-world fuel consumption has been growing by a few percent on average with every new vehicle build year since 2012 when normalized for changing vehicle properties such as equivalent all-electric ranges or mass (Figure ES1). This long-term growth corresponds to an average increase of 0.1–0.2 L/100 km with every build year. The deviation from type-approval values is higher for WLTP certified cars than for NEDC vehicles as newer WLTP certified cars show slightly higher average real-world fuel consumption.
ii ICCT WHITE PAPER | REAL-WORLD USAGE OF PLUG-IN HYBRID VEHICLES IN EUROPE
Company car PHEVs
Private PHEVs
real−world driving
type approval
threetimes
higher
fivetimes
higher
NEDC
WLTP
0
1
2
3
4
5
6
7
8
9
2012 2013 2014 2015 2016 2017 2018 2019 2020 2021
Vehicle build year
Ave
rag
e fu
el c
ons
ump
tio
n (L
/10
0 k
m)
Figure ES1. Development of the average real-world and type-approval fuel consumption of private and company car PHEVs in Europe over vehicle build year. Shaded areas represent 95% confidence interval from sample size uncertainty.
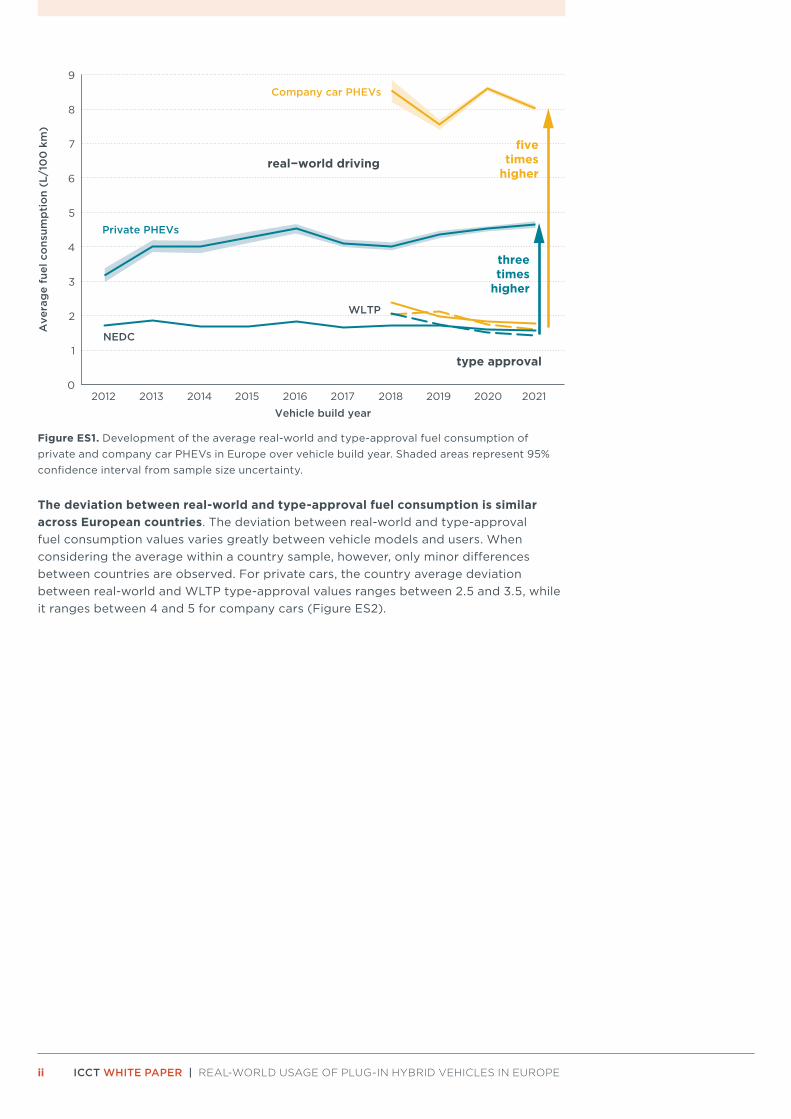
The deviation between real-world and type-approval fuel consumption is similar across European countries. The deviation between real-world and type-approval fuel consumption values varies greatly between vehicle models and users. When considering the average within a country sample, however, only minor differences between countries are observed. For private cars, the country average deviation between real-world and WLTP type-approval values ranges between 2.5 and 3.5, while it ranges between 4 and 5 for company cars (Figure ES2).
iii ICCT WHITE PAPER | REAL-WORLD USAGE OF PLUG-IN HYBRID VEHICLES IN EUROPE
N = 118N = 55
N = 21
N = 12
N = 31
N = 21
N = 30
N = 38
N = 33
N = 9
N = 2696N = 2616
N = 125
N = 178
Hungary Italy Netherlands United Kingdom
Denmark Spain Finland France
Austria Belgium Switzerland Germany
0 1 2 3 4 5 6 7 0 1 2 3 4 5 6 7 0 1 2 3 4 5 6 7 0 1 2 3 4 5 6 7
Den
sity
dis
trib
utio
n
Relation of real−world to WLTP fuel consumption Company cars Private cars
Figure ES2. Distribution of real-world fuel consumption values in relation to WLTP type-approval fuel consumption values for PHEVs across Europe. ‘N’ indicates the number of vehicles included in the respective sample. Solid vertical bars indicate country specific (sample size-weighted) mean, dashed vertical lines correspond to where the real-world and type-approval values are the same.
The average real-world electric driving share is about 45%–49% for private cars and about 11%–15% for company cars. The electric driving share corresponds to the share of distance driven on the electric motor with the combustion engine off. In contrast, the official WLTP type-approval procedure assumes the share of driving in the mostly, but not fully, electric charge-depleting mode at around 70%–85% (Figure ES3). The low electric driving share is one of the main reasons for the high deviation between type approval and real-world fuel consumption.

iv ICCT WHITE PAPER | REAL-WORLD USAGE OF PLUG-IN HYBRID VEHICLES IN EUROPE
0%
20%
40%
60%
80%
100%
0 20 40 60 80 100 120
WLTP equivalent all−electric range (km)
Ele
ctri
c d
rivi
ng s
hare
5
25
50
Mix of private andcompany cars
WLTP
Private cars
Company cars
Sample size
Company cars
Private cars
Figure ES3. Real-world electric driving share compared to WLTP assumption on charge-depleting mode driving share.
The real-world fuel consumption and electric driving share correlates with certain vehicle properties. Although the real-world fuel consumption and electric driving share of PHEVs is mostly determined by usage conditions, such as charging frequency and share of long-distance driving, they are found to also correlate with certain vehicle properties. A 10-kilometer increase in equivalent all-electric range is connected to a fuel consumption reduction of about 12%–15% and increases the electric driving share by 1–7 percentage points. Similarly, an increase in system power by 50 kW is connected to 3%–8% higher fuel consumption, and an increase in vehicle curb weight of 100 kg is connected to 4%–6% higher fuel consumption.
The existing WLTP type-approval assumptions should be revised to better reflect real-world PHEV usage. Four main factors contribute to the high deviation between the real-world usage and type-approval fuel consumption values of PHEVs: (1) The real-world all-electric range is shorter than under type-approval conditions; (2) Long-distance driving exceeds the electric driving range and leads to large distances travelled mainly powered by the combustion engine; (3) Many vehicles are not fully charged before every driving day; (4) When the combustion engine is running, it uses more fuel during real-world usage than in type-approval conditions. The first three factors could be addressed by adjusting the WLTP assumptions on the share of driving in charge-depleting mode. The fourth factor is also observed for vehicles with only a combustion engine and requires more realistic test conditions or adjustment factors for type-approval CO2 values based on on-board fuel consumption monitoring (OBFCM) data.

v ICCT WHITE PAPER | REAL-WORLD USAGE OF PLUG-IN HYBRID VEHICLES IN EUROPE
RECOMMENDATIONSWhile PHEVs could principally offer environmental benefits, these benefits are only partially observed during average real-world operation. With a real-world fuel consumption three to five times higher on average than considered in the WLTP type-approval values, the CO2 emissions of PHEVs are largely underestimated in the European Union’s CO2 standards and PHEVs are disproportionately privileged in federal incentives and taxation policies. This real-world deviation demands more realistic usage assumptions in WLTP type-approval. In parallel, national policies and actions by vehicle manufacturers can help reduce the real-world CO2 emissions of PHEVs.
Based on our findings, we provide the following non-exhaustive recommendations:
» PHEV usage assumptions in WLTP type approval should be adjusted to empirical evidence. As presented in this study, rescaling the existing formula for the assumed charge-depleting mode driving share in the WLTP (the Utility Factor, or UF) allows a more accurate reflection of real-world usage conditions. The existing evidence from almost 9,000 vehicles across many European countries allows for an immediate adjustment. The usage assumptions could be further refined based on fleet-wide data obtained from OBFCM devices, but such data will not become available for several years. The present study offers a solution that could be implemented already today: replace the parameter dn = 800 km in the UF regulation with a more realistic value of dn = 4260 km.
» PHEVs should be excluded from zero- and low-emission vehicle (ZLEV) credits in the CO2 emission standards. Given PHEVs’ much higher CO2 emissions in average real-world operation compared to type-approval values, they should not be considered in the credits for zero- and low-emission vehicles targets of the European Union’s CO2 emission standards. Alternatively, only those vehicles that meet the low emission targets during real-world operation could be included.
» Fiscal incentives for PHEVs should be abolished or limited to vehicles with demonstratively low fuel consumption or high electric driving share. On an individual user level, fiscal incentives such as purchase subsidies and reduced taxation rates for PHEVs should only be issued if a user can demonstrate a certain fuel consumption. The realized electric driving share is a less suitable indicator but could be used as a proxy. If the electric driving share is used as a threshold, it should be about 80% for average PHEV models to achieve real-world fuel consumption close to type-approval values. Similar to what is observed in private PHEVs today, an electric driving share of 50% would, depending on the vehicle model, still result in an about two to three times higher fuel consumption than considered in WLTP values. On a vehicle model level, incentives for PHEVs should thus be limited to vehicles that allow users to realize low fuel consumption and high electric driving shares. Real-world data on fuel consumption and electric driving share may be obtained through OBFCM devices.
» Increase the required WLTP equivalent all-electric range to about 90 km. To enable users to realize high electric driving shares and low fuel consumption over larger daily driving distances, even in cold weather and at high velocities, fiscal incentives could further be limited to vehicle models with a high electric range. In addition, as we find that higher fuel consumption correlates with higher maximum system power, which is typically dominated by the combustion engine, the power of the combustion engine should be limited. This could be achieved by deciding on a minimum regulatory ratio for electric motor power to combustion engine power, typically well above 40%–50%. In parallel, this would allow purely electric driving in real-world usage conditions, including during cold weather and with higher power load.

vi ICCT WHITE PAPER | REAL-WORLD USAGE OF PLUG-IN HYBRID VEHICLES IN EUROPE
» Charging should be incentivized. As PHEVs are mostly charged at home or work, the legal and financial barriers to installing home charging points should be reduced. At the same time, company-car PHEV incentives should be issued only to companies that provide a sufficient workplace charging infrastructure or support employees in home or public charging. There should be non-discriminatory access to public charging stations, and the introduction of a universal charging card or convenient and straightforward payment methods such as credit cards should be further pursued. However, as public charging is most likely less than 20% of charging events for PHEVs the impact of such policies on the mean electric driving share is probably limited. The attractiveness of charging can further be increased by PHEV models with fast charging capability and lower charging costs. Driving on fossil fuel can be disincentivized by higher energy tax rates or higher CO2 prices on fossil fuels, abolishing or limiting free fuel cards for company cars, or limiting the tax-deductibility of costs for fossil fuels for organizations.
» Manufacturers and vehicle dealers should provide more transparent information. Manufacturers should be obligated to disclose the charge-depleting and charge-sustaining mode fuel consumption to the customer, and not only the combined type-approval value, to give car buyers a more realistic view of PHEVs. In addition, in order to allow PHEV users to monitor their real-world electric driving share, vehicle manufacturers should clearly display their realized electric driving share on the dashboard. This could be done via OBFCM devices, which are equipped in all PHEV models registered in the European Union from January 2021.

vii ICCT WHITE PAPER | REAL-WORLD USAGE OF PLUG-IN HYBRID VEHICLES IN EUROPE
LIST OF ACRONYMSACEA European Automobile Manufacturers’ Association
ADAC Allgemeiner Deutscher Automobil-Club (General German Automobile Club)
AER All-electric range (in NEDC)
BEV Battery electric vehicle
CD mode Charge-depleting mode
CI mode Charge-increasing mode
CS mode Charge-sustaining mode
DF Degrees of freedom
dist Distance
DLR Deutsches Zentrum für Luft- und Raumfahrt (German Aerospace Center)
EAER Equivalent all-electric range (in WLTP)
EAFO European Alternative Fuels Observatory
EDS Electric driving share
EU European Union
FC Fuel consumption
GHG Greenhouse gas
HEV Not externally chargeable hybrid electric vehicle
ICE Internal combustion engine
IEA International Energy Agency
KBA Kraftfahrt-Bundesamt (German Federal Motor Transport Authority)
MPG Miles per gallon
NEDC New European Driving Cycle
OBFCM On-board fuel consumption monitoring
PHEV Plug-in hybrid electric vehicle
RoE Rest of Europe
SoC State of charge
UF Utility Factor
VKT Vehicles kilometers travelled
WLTP Worldwide Harmonized Light Vehicles Test Procedure
ZLEV Zero- and low-emission vehicle

viii ICCT WHITE PAPER | REAL-WORLD USAGE OF PLUG-IN HYBRID VEHICLES IN EUROPE
TABLE OF CONTENTS
Executive summary ................................................................................................................... i
Recommendations .................................................................................................................... v
List of acronyms ......................................................................................................................vii
1. Introduction ...........................................................................................................................1
2. Data and methods ............................................................................................................... 2
2.1. Overview ..............................................................................................................................................2
2.2. Individual data sources ..................................................................................................................3
2.3. Derivation of electric driving share .......................................................................................... 7
3. Results ...................................................................................................................................9
3.1. Average real-world fuel consumption .....................................................................................9
3.2. Real-world electric driving share ............................................................................................ 14
3.3. Impact of individual factors .......................................................................................................17
4. Discussion and Outlook ...................................................................................................22
Limitations of evaluated data sources ......................................................................................... 22
Limitations of the method for real-world EDS calculation .................................................. 22
Comparison with the previous study ............................................................................................ 23
Outlook ...................................................................................................................................................... 23
References ...............................................................................................................................24
Appendix A: Sample details .................................................................................................26
Appendix B: Details on the derivation of the electric driving share ............................32
Appendix C: Regression results ...........................................................................................36
Appendix D: Contribution of individual factors to the deviation of real-world and NEDC fuel consumption ............................................................................................... 44
Appendix E: Online PHEV fleet survey questionnaire .....................................................45

1 ICCT WHITE PAPER | REAL-WORLD USAGE OF PLUG-IN HYBRID VEHICLES IN EUROPE
1. INTRODUCTIONThe global sales of plug-in hybrid electric vehicles (PHEVs) have risen tremendously in the past few years. While their diffusion into the portfolio of almost all manufacturers was modest at the beginning of the century, recent years have witnessed broad model availability, a double-digit growth in sales, and accelerated market diffusion. Worldwide, there were 10 million battery electric vehicles and PHEVs on the road in 2020, with PHEVs accounting for roughly one third of sales, stock, and available models (International Energy Agency [IEA], 2021). In Europe, PHEVs hit the 1 million vehicle mark and comprised about 9% of total car sales in 2021, ranking them nearly equal with battery electric vehicle models (European Automobile Manufacturers’ Association [ACEA], 2022). However, their share in the vehicle stock is still below 1% (IEA, 2021). In Germany, PHEVs accounted for around 12% of new vehicle sales in 2021 and 1.3% of vehicle stock (Kraftfahrt-Bundesamt [KBA], 2021).
The PHEV powertrain is characterized by the complex interplay of an internal combustion engine (ICE) and an electric motor powered by an externally rechargeable battery. Both powertrains are typically used separately and only electric driving results in zero tailpipe emissions. Thus, any potential contribution to reducing fuel consumption, CO2 emissions, and air pollutant emissions largely depends on real-world operation and charging patterns. Decisive factors on the realizable real-world fuel consumption are the share of distance driven on electricity and the model-specific engineering, i.e., the ratio of combustion engine and electric power or system interaction of the ICE and the electric motor.
Our previous study on the real-world usage, electric driving share, and CO2 emissions of PHEVs (Plötz et al., 2020) reignited public attention and societal discussion on the opportunities and challenges of this technology. We focused on vehicle models certified under the New European Driving Cycle (NEDC) in that study. Since September 2018, however, a new type-approval procedure, the Worldwide Harmonized Light Vehicles Test Procedure (WLTP), must be applied to all new passenger cars. Dornoff et al. (2020) indicate that for conventional gasoline and diesel vehicles, the introduction of the WLTP resulted in a lower gap between the real-world and type-approval fuel consumption values than for NEDC type-approved vehicles. For PHEVs, however, little is publicly known about the real-world representativeness of the WLTP fuel consumption values and, thus, CO2 emission values. In light of their growing relevance in sales and vehicle stock, this representativeness is crucial for the effectiveness of climate policies, such as the European Union’s CO2 emission standards, as well as national incentive or taxation policies.
This study aims to better understand the development of the real-world usage of private and company car PHEVs in Europe, emphasizing Germany as the largest European PHEV market. Specifically, it evaluates the effect of the WLTP introduction on the gap between the real-world and type-approval fuel consumption to determine if the WLTP reflects mean and individuals’ real-world driving and charging patterns more accurately than the NEDC. For this purpose, various data sources on PHEV usage from more recent vehicle models are statistically evaluated. Based on our findings, policy recommendations are identified and discussed.
Section 2 introduces the data sources and methods used for this study. The results are presented in Section 3, starting with an overview of the average deviation between real-world and type-approval fuel consumption, followed by a deduction of real-world electric driving shares, and analyses of vehicle-specific parameters affecting the real-world fuel consumption. We close with a discussion and outlook in Section 4.

2 ICCT WHITE PAPER | REAL-WORLD USAGE OF PLUG-IN HYBRID VEHICLES IN EUROPE
2. DATA AND METHODSThe data and methods section consists of three parts. First, we give a rough overview of the data used for this study and depict their main characteristics. Second, we describe the individual data sources forming the basis for our empirical dataset. We close with our methods for deriving real-world electric driving shares.
2.1. OVERVIEWWe collected data on real-world PHEV usage from online databases, companies, and existing and new surveys. Our data collection focuses on gathering new empirical data on real-world usage patterns, such as real-world fuel consumption, electric driving shares, and annual vehicle kilometers traveled (VKT).
The data covers 27 countries, including almost all Member States of the European Union, as well as the United Kingdom, Switzerland, and Norway. Most data is from Germany, the United Kingdom, France, Austria, the Netherlands, Switzerland, and Finland. It includes data from private and company cars, i.e., vehicles owned by an organization and assigned to an individual user for both business and private purposes. Table 1 gives an overview of the total sample sizes by country and user group. Further country-specific values are given in Table A1 in the Appendix.
Table 1. Number of PHEVs in the sample by user group and country.
PHEVs in sample Germany Rest of Europe Total
Private 4,199 1,609 5,808
Company car 2,924 123 3,047
Total 7,123 1,732 8,855
Our new empirical dataset from primary sources covers almost 9,000 PHEVs. While vehicle driven in Germany (80%) dominate our sample, the data also includes ten other countries with at least 50 vehicles, including strong selling PHEV markets. Thus, we can discern general trends and draw conclusions across different countries. Our total sample covers about 1% of the German PHEV stock (KBA, 2021) and about 0.4% of the PHEV stock in the European Union, the United Kingdom, Norway, Switzerland, Iceland, and Liechtenstein, while excluding Germany our sample covers just under 0.1% of the European PHEV stock (European Alternative Fuels Observatory [EAFO], 2021; ACEA, 2021). Our non-German sample mainly consists of vehicles driven in the United Kingdom (23%), France (16%) and Austria (14%), as well as other European countries (3%–6%).
While most of the vehicles in our sample are private (66%), a substantial number of almost 3,000 PHEVs are company cars, allowing significant analyses for this user group.
As presented in Table 2, about 70% of the vehicles in our sample have WLTP type-approval values reported. For most of these vehicles, NEDC type-approval values are provided, as well. The process of how type-approval values of vehicle models are matched to individual vehicles in our sample is explained in Section 2.2.
Table 2. Number of PHEVs in the sample with reported type-approval values in WLTP, NEDC, or both by user group.
PHEVs in sample Only NEDC Only WLTPNEDC and
WLTP N/A Total
Private 2,536 25 3,242 5 5,808
Company car 229 0 2,817 1 3,047
Total 2,765 25 6,059 6 8,855

3 ICCT WHITE PAPER | REAL-WORLD USAGE OF PLUG-IN HYBRID VEHICLES IN EUROPE
Our sample covers vehicles with build years from 2011 to 2021. For around 60% of the vehicles, the build year is later than 2017, and 39% are from 2020 or 2021. However, for 30% of the vehicles build years may not be assigned clearly. A further breakdown by build years is given in Table A2 in the Appendix.
Our sample covers 27 vehicle manufacturers, over 100 PHEV models, and over 400 model variants. BMW (24%), Mercedes-Benz (14%), and VW (11%) make up the top three brands. Mitsubishi Outlander (9%), VW Passat (5%), and BMW X3 (5%) make up the top three models. For sample classification, IEA (2021) indicates there were between 60 and 120 PHEV models available globally from 2017 to 2020, while Transport & Environment (2019) specifies another 118 new PHEV models in 2021. Further details are given in Appendix A.
2.2. INDIVIDUAL DATA SOURCESOur sample consists of data from Spritmonitor.de (42% of vehicles), company reports (33%), the German Aerospace Center (Deutsches Zentrum für Luft- und Raumfahrt, DLR) (17%), and different websites or surveys (8%). These are described in the following sections.
Spritmonitor.de Spritmonitor.de is a free German web service that allows users to track their vehicle fuel consumption. Established in 2001, this platform provides an easy-to-use app and a web tool to track fuel consumption and compare it to other users using identical or comparative vehicles. The service is available in German, English, French, and Spanish. Database entries for real-world fuel consumption data are publicly available. In March 2022, this database comprises over 990,000 vehicles and almost 680,000 registered users, with the predominant share located in Germany (around 70%). Users must register with a unique username, may create several vehicle accounts, and provide accompanying vehicle specifications such as brand, model, variant, engine type, fuel type, build year, power, transmission type, and country. After initialization and entering details on the initial refueling, users can complete their trip diaries with fuel consumption and travelled distances. Apart from vehicle-specific data, users may provide data about their usage behavior (e.g., driving behavior or utilization of air conditioning) or surrounding data (e.g., tire type or route profile) per entry. For PHEVs, both charging and refueling events can be tracked separately.
In this study, Spritmonitor.de data is used as part of the private vehicle sample. For our analysis Spritmonitor.de provided an anonymized dataset of all entries for PHEVs as of December 2021 without odometer values, usernames, and text notes. We calculate the real-world fuel consumption based on the distance travelled between refueling stops and the associated amount of fuel. This initial dataset covers 7,377 private PHEVs with 214,379 refueling entries.
Data cleaning comprises three successive steps. (1) We limit our sample to vehicles with build years later than 2010 and exclude all entries with partial fuel consumption larger than 20 L/100 km. (2) We exclude any vehicle with less than five refueling stops or a recorded distance of less than 1,500 km. (3) We filter out other hybrid-powered vehicles such as mild- or full hybrid vehicles that have been declared as PHEVs by mistake. To do so, we use several criteria such as electric charging events, official model specifications, build year, and vehicle power information and compare those to both our PHEV vehicle model database and official manufacturer labels. Our cleaned dataset covers 3,756 vehicles with 123,794 refueling entries. While the average fuel consumption is 4.4 L/100 km, the 1st percentile is 0.6 L/100 km and the 99th percentile is 9.9 L/100 km.
4 ICCT WHITE PAPER | REAL-WORLD USAGE OF PLUG-IN HYBRID VEHICLES IN EUROPE
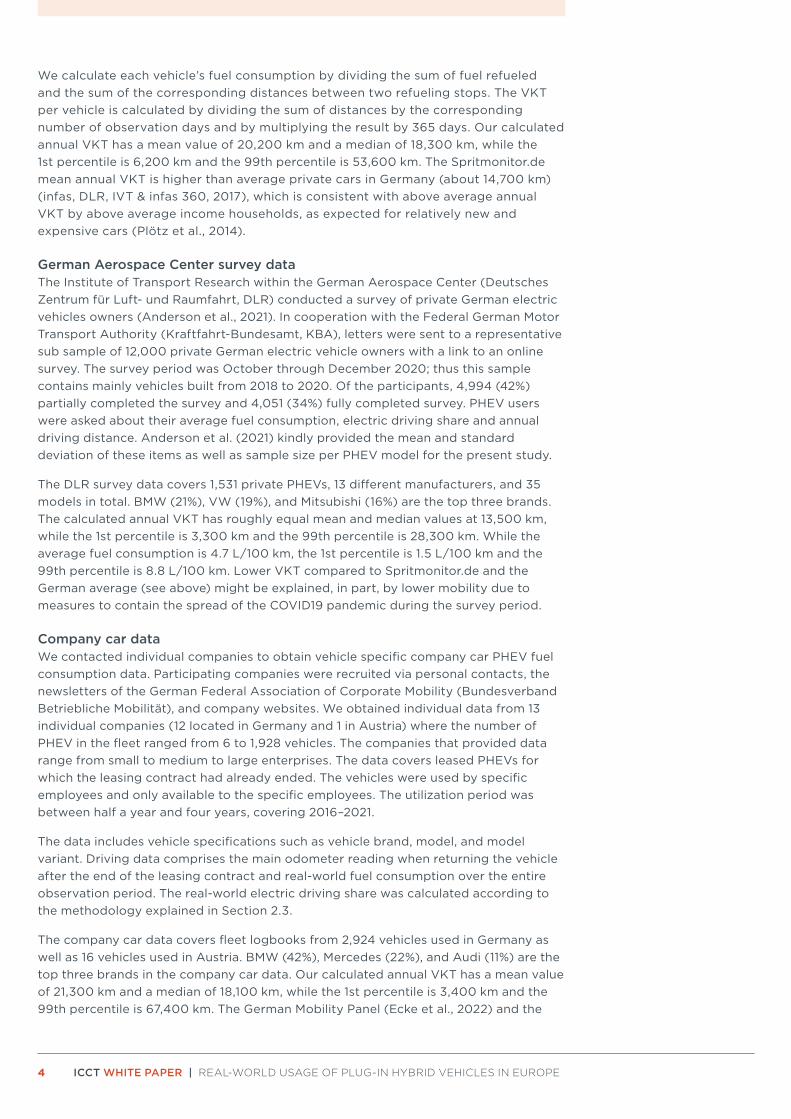
We calculate each vehicle’s fuel consumption by dividing the sum of fuel refueled and the sum of the corresponding distances between two refueling stops. The VKT per vehicle is calculated by dividing the sum of distances by the corresponding number of observation days and by multiplying the result by 365 days. Our calculated annual VKT has a mean value of 20,200 km and a median of 18,300 km, while the 1st percentile is 6,200 km and the 99th percentile is 53,600 km. The Spritmonitor.de mean annual VKT is higher than average private cars in Germany (about 14,700 km) (infas, DLR, IVT & infas 360, 2017), which is consistent with above average annual VKT by above average income households, as expected for relatively new and expensive cars (Plötz et al., 2014).
German Aerospace Center survey dataThe Institute of Transport Research within the German Aerospace Center (Deutsches Zentrum für Luft- und Raumfahrt, DLR) conducted a survey of private German electric vehicles owners (Anderson et al., 2021). In cooperation with the Federal German Motor Transport Authority (Kraftfahrt-Bundesamt, KBA), letters were sent to a representative sub sample of 12,000 private German electric vehicle owners with a link to an online survey. The survey period was October through December 2020; thus this sample contains mainly vehicles built from 2018 to 2020. Of the participants, 4,994 (42%) partially completed the survey and 4,051 (34%) fully completed survey. PHEV users were asked about their average fuel consumption, electric driving share and annual driving distance. Anderson et al. (2021) kindly provided the mean and standard deviation of these items as well as sample size per PHEV model for the present study.
The DLR survey data covers 1,531 private PHEVs, 13 different manufacturers, and 35 models in total. BMW (21%), VW (19%), and Mitsubishi (16%) are the top three brands. The calculated annual VKT has roughly equal mean and median values at 13,500 km, while the 1st percentile is 3,300 km and the 99th percentile is 28,300 km. While the average fuel consumption is 4.7 L/100 km, the 1st percentile is 1.5 L/100 km and the 99th percentile is 8.8 L/100 km. Lower VKT compared to Spritmonitor.de and the German average (see above) might be explained, in part, by lower mobility due to measures to contain the spread of the COVID19 pandemic during the survey period.
Company car dataWe contacted individual companies to obtain vehicle specific company car PHEV fuel consumption data. Participating companies were recruited via personal contacts, the newsletters of the German Federal Association of Corporate Mobility (Bundesverband Betriebliche Mobilität), and company websites. We obtained individual data from 13 individual companies (12 located in Germany and 1 in Austria) where the number of PHEV in the fleet ranged from 6 to 1,928 vehicles. The companies that provided data range from small to medium to large enterprises. The data covers leased PHEVs for which the leasing contract had already ended. The vehicles were used by specific employees and only available to the specific employees. The utilization period was between half a year and four years, covering 2016–2021.
The data includes vehicle specifications such as vehicle brand, model, and model variant. Driving data comprises the main odometer reading when returning the vehicle after the end of the leasing contract and real-world fuel consumption over the entire observation period. The real-world electric driving share was calculated according to the methodology explained in Section 2.3.
The company car data covers fleet logbooks from 2,924 vehicles used in Germany as well as 16 vehicles used in Austria. BMW (42%), Mercedes (22%), and Audi (11%) are the top three brands in the company car data. Our calculated annual VKT has a mean value of 21,300 km and a median of 18,100 km, while the 1st percentile is 3,400 km and the 99th percentile is 67,400 km. The German Mobility Panel (Ecke et al., 2022) and the

5 ICCT WHITE PAPER | REAL-WORLD USAGE OF PLUG-IN HYBRID VEHICLES IN EUROPE
Mobility in Germany study (infas et al., 2018) show that company cars in Germany had an average VKT of around 30,000 kilometers before the COVID19 pandemic (cf. Plötz et al., 2020), about twice as high as privately registered vehicles (see previous section), while a noticeable decrease from 2020 to 2021 of about 25% is stated. This matches the scales in our sample. The average fuel consumption is 7.5 L/100 km, while the 1st percentile is 2.8 L/100 km and the 99th percentile 13.4 L/100 km.
Online surveysWe conducted a survey to obtain additional data on the real-world usage of PHEV in company car fleets. To this end, a survey of fleet managers was designed and conducted. The questionnaire included reasons for the purchase and use of PHEVs as well as questions on the conditions of use, such as the availability of charging cards and charging opportunities. The survey also includes a query on the number of passenger cars and PHEVs in the fleet as well as if the fleet was used mainly as company cars or as pool vehicles. Finally, the following items were asked for the three most common PHEVs in the fleet: number, average fuel consumption, and average electric driving share. Details of the survey are given in Appendix E.
The survey data covers 107 company car PHEVs from outside Germany (103 from Austria, 1 from Belgium and 3 from Norway) from seven different PHEV models. The fuel consumption ranges from 0.3 L/100 km to 7.3 L/100 km, and the VKT information is incomplete.
HonestJohn.co.uk HonestJohn is a British web-based broker for used cars. Road tests, third-party reviews, and anonymized owner reviews are offered as an additional service. While no registration is required, owners may select their vehicle by brand, model, version, and build year and add their average annual mileage, driving behavior, and real-world fuel consumption in miles per gallon (MPG). The website shows the real-world MPG per vehicle model and the number of submitted MPGs per model variant. However, the total number of reporting PHEVs is unclear and no VKT information is given. We assume that each PHEV user reported only one MPG value.
Our dataset from HonestJohn (2022) was used as part of the private vehicles sample. It includes 304 PHEVs, whereas we find 28 different PHEV models, dominated by Mercedes and Toyota (each 18%) and BMW (14%) as the top three brands. The sample covers vehicles with build years from 2015 to 2021. WLTP data could be assigned for 19 models. Since there was only little information about the vehicles, the cleaning was limited to a critical examination of the reported values. Fuel consumption ranges from 31.2 MPG (7.6 L/100 km) to 234 MPG (1.1 L/100 km) and 53.4 MPG (4.4 L/100 km) on average, which are reasonable values for the underlying cars—the submitted entries per model variant range from 7 to 698.
The fuel consumption values on HonestJohn are aggregated values on model level. For further calculation, each value must be weighted by the number of vehicles and not the fueling events reported. We estimated the number of vehicles by assuming a correlation between submitted MPGs, i.e., number of refueling events, and the number of vehicles. This correlation could be found in Spritmonitor.de data with about 23 fueling stops per vehicle.
CarbuyerCarbuyer (Autovia, 2022) is a British web-based motoring website, as well as a broker for new and used cars. The technical service comprises professional services such as road tests, third-party reviews, and anonymized owner reviews. For the latter, registered owners may select their vehicle by brand, vehicle model, and year of registration, whereas information on the model version is an additional user-defined string. User data
6 ICCT WHITE PAPER | REAL-WORLD USAGE OF PLUG-IN HYBRID VEHICLES IN EUROPE
includes average annual mileage clustered into five categories, real-world MPG, year of registration, and personal reviews, including purchase recommendations.
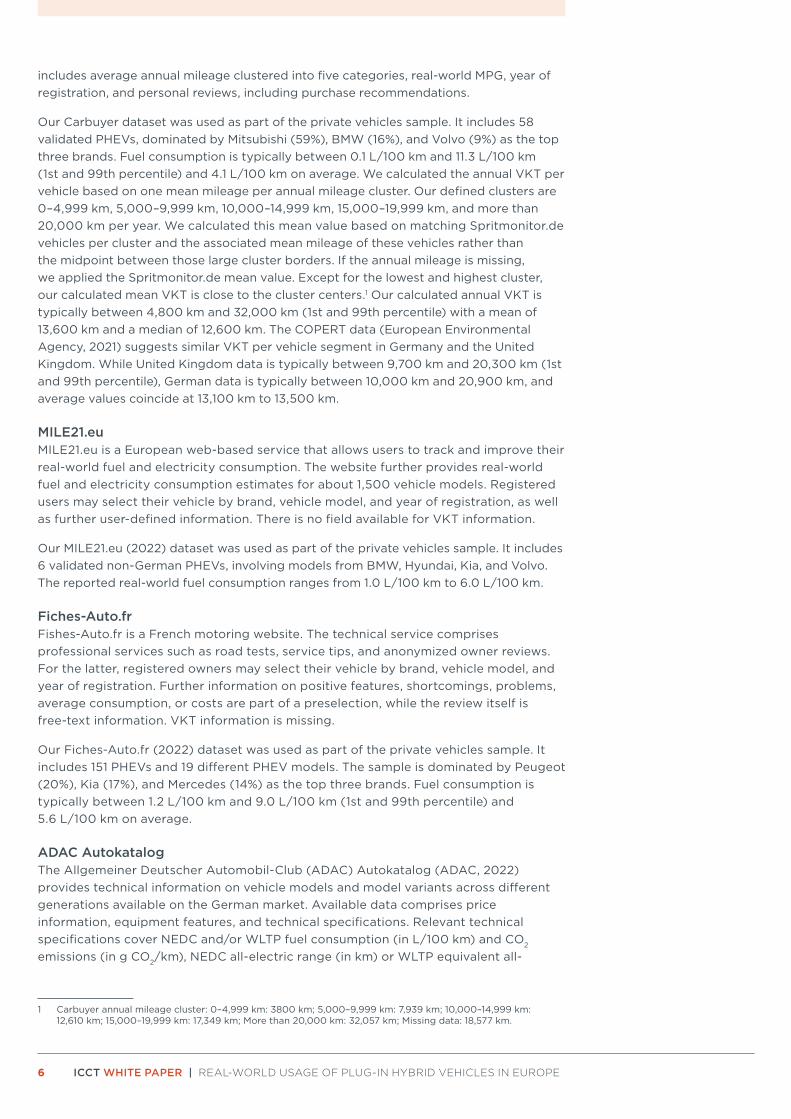
Our Carbuyer dataset was used as part of the private vehicles sample. It includes 58 validated PHEVs, dominated by Mitsubishi (59%), BMW (16%), and Volvo (9%) as the top three brands. Fuel consumption is typically between 0.1 L/100 km and 11.3 L/100 km (1st and 99th percentile) and 4.1 L/100 km on average. We calculated the annual VKT per vehicle based on one mean mileage per annual mileage cluster. Our defined clusters are 0–4,999 km, 5,000–9,999 km, 10,000–14,999 km, 15,000–19,999 km, and more than 20,000 km per year. We calculated this mean value based on matching Spritmonitor.de vehicles per cluster and the associated mean mileage of these vehicles rather than the midpoint between those large cluster borders. If the annual mileage is missing, we applied the Spritmonitor.de mean value. Except for the lowest and highest cluster, our calculated mean VKT is close to the cluster centers.1 Our calculated annual VKT is typically between 4,800 km and 32,000 km (1st and 99th percentile) with a mean of 13,600 km and a median of 12,600 km. The COPERT data (European Environmental Agency, 2021) suggests similar VKT per vehicle segment in Germany and the United Kingdom. While United Kingdom data is typically between 9,700 km and 20,300 km (1st and 99th percentile), German data is typically between 10,000 km and 20,900 km, and average values coincide at 13,100 km to 13,500 km.
MILE21.euMILE21.eu is a European web-based service that allows users to track and improve their real-world fuel and electricity consumption. The website further provides real-world fuel and electricity consumption estimates for about 1,500 vehicle models. Registered users may select their vehicle by brand, vehicle model, and year of registration, as well as further user-defined information. There is no field available for VKT information.
Our MILE21.eu (2022) dataset was used as part of the private vehicles sample. It includes 6 validated non-German PHEVs, involving models from BMW, Hyundai, Kia, and Volvo. The reported real-world fuel consumption ranges from 1.0 L/100 km to 6.0 L/100 km.
Fiches-Auto.frFishes-Auto.fr is a French motoring website. The technical service comprises professional services such as road tests, service tips, and anonymized owner reviews. For the latter, registered owners may select their vehicle by brand, vehicle model, and year of registration. Further information on positive features, shortcomings, problems, average consumption, or costs are part of a preselection, while the review itself is free-text information. VKT information is missing.
Our Fiches-Auto.fr (2022) dataset was used as part of the private vehicles sample. It includes 151 PHEVs and 19 different PHEV models. The sample is dominated by Peugeot (20%), Kia (17%), and Mercedes (14%) as the top three brands. Fuel consumption is typically between 1.2 L/100 km and 9.0 L/100 km (1st and 99th percentile) and 5.6 L/100 km on average.
ADAC Autokatalog The Allgemeiner Deutscher Automobil-Club (ADAC) Autokatalog (ADAC, 2022) provides technical information on vehicle models and model variants across different generations available on the German market. Available data comprises price information, equipment features, and technical specifications. Relevant technical specifications cover NEDC and/or WLTP fuel consumption (in L/100 km) and CO2 emissions (in g CO2/km), NEDC all-electric range (in km) or WLTP equivalent all-
1 Carbuyer annual mileage cluster: 0–4,999 km: 3800 km; 5,000–9,999 km: 7,939 km; 10,000–14,999 km: 12,610 km; 15,000–19,999 km: 17,349 km; More than 20,000 km: 32,057 km; Missing data: 18,577 km.

7 ICCT WHITE PAPER | REAL-WORLD USAGE OF PLUG-IN HYBRID VEHICLES IN EUROPE
electric range (in km), brand, model, model variant, as well as many other vehicle characteristics. We find minor inconsistencies for the type-approval fuel consumption versus CO2 emissions values across different PHEV brands and models, such as varying specific CO2 emission factors. Thus, we use the CO2 emissions as a reference and calculate the associated fuel consumption using the same standard CO2 emission factors to ensure high consistency and comparability.2
We match the real-world fuel consumption values from each data source to the technical vehicle specifications provided in the ADAC Autokatalog. We use the following information, if available and usable, in descending priority order: vehicle brand, vehicle model, model generation, production period, system power, ICE power, and engine displacement. If the vehicle assignment proves unclear, we use an averaged vehicle model calculated based on all potential vehicle model variants. This comprises different model generations within one year, i.e., model predecessors and successors, usually associated with minor technical modifications, yet major ones are possible. If user vehicle model information is inconsistent, we have allocated the vehicle to the most appropriate averaged vehicle models. If a body type distinction between sedan and station wagon proved unclear, we have allocated technical specifications of the station wagon not to underestimate any type-approval value. However, we exclude any vehicle in any dataset with insufficient information for matching. This gives us 8,855 complete entries.
Technical specifications from the ADAC Autokatalog do not include any special vehicle equipment such as a sunroof, larger wheels, etc., which might cause higher energy consumption due to more auxiliaries and higher vehicle weight. This fact might be associated with higher fuel consumption than type-approval values. However, the effect on electric range or type-approval fuel consumption is within single-digit percentage points and even smaller than that for the electric driving share.
2.3. DERIVATION OF ELECTRIC DRIVING SHAREPHEVs offer the potential to reduce greenhouse gas (GHG) emissions and air pollution if powered primarily by electricity. Intuitively, this requires the ICE to be turned off. Therefore, we define the electric driving share (EDS), denoted by EDSreal, as share of total distance disttotal
real driven purely on electricity distelectricreal . Note that in WLTP, the
Utility Factor (UF) does not exacty correspond to the EDS. In WLTP, the UF rather corresponds to the share of distance driven in charge-depleting mode, which is mostly, but not fully, electric (Riemersma and Mock, 2017).
EDSreal = distelectric
real
disttotalreal
In Appendix B, we present how the EDS can also be approximated from the real-world fuel consumption FCtotal
real as found in the PHEV usage datasets and from the real-world fuel consumption of driving solely in charge-sustaining mode FCCS
real.
EDSreal = 1 – FCtotal
real
FCCSreal
The real-world fuel consumption of driving in charge-sustaining mode FCCSreal can be
estimated from NEDC or WLTP type-approval values FCtotaltype-approval and a correction
factor X.
FCCSreal = X × FCtotal
type-approval
2 Diesel: 2,67455 g CO2 eq. per liter; gasoline: 2,421 g CO2 eq. per liter - both according to DIN 16258 / KS2050.

8 ICCT WHITE PAPER | REAL-WORLD USAGE OF PLUG-IN HYBRID VEHICLES IN EUROPE
As presented in Appendix B, FCtotaltype-approval can be obtained from NEDC or WLTP type-
approval combined fuel consumption values and the corresponding NEDC all-electric range or WLTP equivalent all-electric range as provided by the ADAC Autokatalog database (ADAC, 2022). Based on existing studies on the deviation of real-world and type-approval fuel consumption of hybrid electric vehicles that are not externally chargeable, X is approximately equal to 1.47 for NEDC and 1.23 for WLTP type-approval values, i.e., FCCS
real is on average 47% higher than its NEDC type-approval value (Tietge et al., 2019). Further details are given Appendix B.
This leads to the final equation for cars where NEDC type-approval values are available
EDSreal = 1 – FCtotal
real
1.47 FCCSNEDC
and for those where only WLTP type-approval values are available
EDSreal = 1 – FCtotal
real
1.23 FCCSWLTP
When both NEDC and WLTP values are available, the two derived values for the real-world fuel consumption in charge-sustaining mode FCCS
real do not necessarily match. In that case we use the average of the two values.

9 ICCT WHITE PAPER | REAL-WORLD USAGE OF PLUG-IN HYBRID VEHICLES IN EUROPE
3. RESULTSThe results from our analysis of the real-world usage of PHEVs are presented in three parts. In Section 3.1, average real-world fuel consumption values and deviations from type-approval are presented. Section 3.2 then analyses the real-world electric driving shares and compares them to type approval assumptions. Lastly, Section 3.3 provides information on how different factors, such as long-distance driving, charging behavior, equivalent all-electric range, user group, and engine power, affect the electric driving shares and fuel consumption of PHEVs.
3.1. AVERAGE REAL-WORLD FUEL CONSUMPTIONWe first analyze the real-world usage of PHEVs by evaluating the real-world fuel consumption and its deviation from type-approval values.
Figure 1 shows the development of the mean fuel consumption of private PHEVs over the vehicle build year. The figure shows that the real-world fuel consumption of private PHEVs generally increased over time even though a noticeable dip emerged for vehicles built around 2018, which marks the introduction of the WLTP. Note that the values shown are build year average and not annual averages. Thus, we find that newer vehicles tend to show higher mean fuel consumption than older vehicles.
Private PHEVsreal−worlddriving
typeapproval
threetimeshigher
NEDC
WLTP
0
1
2
3
4
5
2012 2013 2014 2015 2016 2017 2018 2019 2020 2021
Vehicle build year
Ave
rag
e fu
el c
ons
ump
tio
n (L
/10
0 k
m)
Figure 1. Development of the average real-world and type-approval fuel consumption of private PHEVs in Europe over vehicle build year. Shaded area indicates 95% confidence intervals for the mean.
As shown, the NEDC fuel consumption values remain almost constant, while the average WLTP fuel consumption in our sample (comprising both private and company cars) shows a downwards trend. For vehicles with a build year of 2018, we observed that the WLTP values are higher than the NEDC values. As the sample size for WLTP type-approved vehicles with that build year is limited, however, this difference might be an artefact. In any case, with the increasing sample size of WLTP type-approved vehicles from build year 2019 onwards, it is observed that the type-approval values from both certification procedures converge towards vehicle build year 2021. In later build years, WLTP values in our sample are on average even below NEDC values. This

10 ICCT WHITE PAPER | REAL-WORLD USAGE OF PLUG-IN HYBRID VEHICLES IN EUROPE
is in line with latest findings of the European Commission’s Joint Research Center (Pavlovic et al., 2021). Since we find almost constant type-approval fuel consumption values yet increased real-world fuel consumption, the deviation between real-world and type-approval values grew significantly. For vehicles built in 2021, real-world fuel consumption is roughly three times higher than type-approval values.
Likewise, Figure 2 shows the development of the mean real-world and type-approval fuel consumption of company car PHEVs over the vehicle build year. While formatting follows the previous figure, note the different scaling of the y-axis as company car real-world fuel consumption is considerably higher, and the shorter time scale. We find that the real-world fuel consumption of company car PHEVs remains almost constant, with a minor decrease for vehicles built since 2018 and a less definite trend than for private PHEVs, while uncertainty has decreased notably. The reported NEDC and WLTP type-approval values are almost parallel and slightly decrease between vehicles built in 2018 and 2021. Given the higher fuel consumption of company car PHEVs compared to private ones, we find a significantly higher and constant deviation to type-approval values. For vehicles built in 2021, real-world fuel consumption is roughly five times higher than type-approval values.
Company car PHEV
real−worlddriving
typeapproval
NEDC
WLTP
fivetimeshigher
0
2
4
6
8
2018 2019 2020 2021
Vehicle build year
Ave
rag
e fu
el c
ons
ump
tio
n (L
/10
0 k
m)
Figure 2. Development of the average real-world and type-approval fuel consumption of company car PHEVs in Europe over vehicle build year. Shaded area indicates 95% confidence intervals for the mean.
Table 3 summarizes our aggregated results divided by user group. We find that the average sample size-weighted real-world fuel consumption is 4.0–4.4 L/100 km for private PHEVs and 7.6–8.4 L/100 km for company car PHEVs, with the range indicating the 95% confidence interval for the sample size-weighted mean. This means that the actual mean deviation, i.e., the ratio between actual and type-approval fuel consumption, has a 95% likelihood to be within the given range. For private vehicles the real-world fuel consumption is on average between 240% and 260% of the NEDC and between 270% and 310% of the WLTP values. In contrast, the sample size-weighted mean real-world fuel consumption is 420%–460% of the NEDC and 455%–520% of the WLTP values for company cars. It follows that the real-world fuel consumption is, on average and for all build years, between 2.5 (private cars) and 4.5 (company cars)

11 ICCT WHITE PAPER | REAL-WORLD USAGE OF PLUG-IN HYBRID VEHICLES IN EUROPE
times higher than the NEDC values. At the same time, this deviation is more significant for WLTP values, i.e., between a factor of three (private cars) and five (company cars) times. For vehicles solely certified to the NEDC (before the introduction of the WLTP), the sample size-weighted mean deviation is fully consistent, as it ranges from 220% to 240% for private vehicles and from 360% to 410% for company cars. It follows that more recently produced PHEVs show a higher real-world fuel consumption and higher deviation to type-approval values.
Table 3. Sample size-weighted mean real-world fuel consumption and deviation to type-approval values (95% confidence intervals) over the entire observation period.
Fuel consumption (L/100 km)Ratio of real-world to type-approval fuel consumption
NEDC WLTP real-world NEDC WLTP
Private cars 1.70 1.60 4.0–4.4 240%–260% 270%–310%
Company cars 1.85 1.71 7.6–8.4 420%–460% 455%–520%
Note: The (sample size-weighted) mean of the deviation is unequal to the deviation of (sample size-weighted) means, as the ratio is a non-linear function. The reason is that the distributions are not symmetric and the variables correlated.
In contrast to the summarized results above, Table 4 differentiates the mean real-world and reported type-approval fuel consumption values by vehicle build year to better quantify temporal evolution. Additional error estimates (95% confidence interval) and sample size per year and user group are provided to support robustness. Note that sample size is for the number of PHEV with real-world fuel consumption data. For private PHEVs, real-world fuel consumption has been consistently at least 4.0 L/100 km for vehicles built since 2013. The NEDC values oscillate between roughly 1.6 L/100 km and 1.9 L/100 km, and the WLTP values decrease from roughly 2.0 L/100 km to 1.5 L/100 km. It is notable that the highest mean real-world fuel consumption for vehicles built in 2021 is approximately in line with the lowest mean type-approval values according to both the WLTP and the NEDC. For company car PHEVs, real-world fuel consumption tends to be twice as high compared to private PHEVs (around 7.5–8.5 L/100 km), while NEDC and WLTP values are in a similar range (around 1.6–2.4 L/100 km) and decrease towards vehicles built in 2021.
Table 4. Sample size-weighted mean real-world and type-approval fuel consumption by vehicle build year (95% confidence intervals).
Vehicle build year
Private cars Company cars
N
Fuel consumption (L/100 km)
N
Fuel consumption (L/100 km)
Real-world NEDC WLTP Real-world NEDC WLTP
2012 82 3.18±0.2 1.70±0.14
2013 151 4.02±0.18 1.86±0.10
2014 170 4.00±0.18 1.70±0.10
2015 215 4.27±0.16 1.68±0.08
2016 303 4.52±0.14 1.83±0.08
2017 487 4.10±0.10 1.66±0.06 125 8.59±0.2 2.20±0.1
2018 447 4.02±0.12 1.72±0.06 2.05±0.08 68 8.53±0.2 2.39±0.2 2.05±0.1
2019 484 4.36±0.10 1.72±0.06 1.73±0.08 251 7.55±0.2 1.97±0.1 2.13±0.1
2020 1051 4.52±0.08 1.61±0.04 1.50±0.04 1163 8.59±0.2 1.84±0.04 1.73±0.04
2021 574 4.65±0.10 1.58±0.04 1.43±0.06 666 8.03±0.2 1.78±0.04 1.60±0.04
For the country-specific analysis, we visualize the distribution of real-world fuel consumption in relation to type-approval values for both user groups. Here, we consider vehicles of all build years within a country sample. While Figure 3 shows the relation to the NEDC, the same relation to the WLTP is shown in Figure 4.

12 ICCT WHITE PAPER | REAL-WORLD USAGE OF PLUG-IN HYBRID VEHICLES IN EUROPE
N = 119
N = 49
N = 82
N = 49
N = 48
N = 55
N = 94
N = 86
N = 95
N = 2924N = 4175
N = 261
N = 370
Hungary Italy Netherlands United Kingdom
Denmark Spain Finland France
Austria Belgium Switzerland Germany
0 1 2 3 4 5 6 7 0 1 2 3 4 5 6 7 0 1 2 3 4 5 6 7 0 1 2 3 4 5 6 7
Relation of real−world to NEDC fuel consumption
Den
sity
dis
trib
utio
n
Company cars Private cars
N = 105
Figure 3. Distribution of real-world fuel consumption in relation to NEDC fuel consumption by country. The vertical dashed lines correspond to vehicles where the real-world and type-approval fuel consumption are the same. Thin colored vertical lines indicate the mean deviation by country and user group. Small rugs below the x-axis indicate individual observations at model variant level.
N = 118N = 55
N = 21
N = 12
N = 31
N = 21
N = 30
N = 38
N = 33
N = 9
N = 2696N = 2616
N = 125
N = 178
Hungary Italy Netherlands United Kingdom
Denmark Spain Finland France
Austria Belgium Switzerland Germany
0 1 2 3 4 5 6 7 0 1 2 3 4 5 6 7 0 1 2 3 4 5 6 7 0 1 2 3 4 5 6 7
Den
sity
dis
trib
utio
n
Relation of real−world to WLTP fuel consumption Company cars Private cars
Figure 4. Distribution of real-world fuel consumption in relation to WLTP fuel consumption by country. The vertical dashed lines correspond to vehicles where the real-world and type-approval fuel consumption are the same. Thin colored vertical lines indicate the mean deviation by country and user group. Small rugs below the x-axis indicate individual observations at model variant level.

13 ICCT WHITE PAPER | REAL-WORLD USAGE OF PLUG-IN HYBRID VEHICLES IN EUROPE
Both figures show the same 12 European countries, although company car data is available only for Germany and Austria. Per figure and user group, peaks are roughly similar even if distributions are sometimes narrower or broader. Only a minor fraction, if any, succeeds in hitting the type-approval values. For both type-approval procedures, company car data feature broader distributions than private vehicles. Overall, we find the real-world fuel consumption two to three times higher than NEDC type-approval values for private PHEVs and around four times higher for company cars. In parallel, real-world fuel consumption is two to three times higher than WLTP type-approval values for private PHEVs and around four to five times higher for company cars.
Figure 5 summarizes the ratio of the real-world to NEDC and WLTP fuel consumption values per country and user group. Please note that the sample size varies between countries and that many individual country samples are too small to derive statistically significant differences between the countries. However, the fact that the deviation of real-world fuel consumption from WLTP values is larger than that from NEDC in all countries is a consistent and robust finding. We close with a non-weighted mean value across all countries to approximate a European average for private PHEVs. This average value is between 250% (NEDC) and 290% (WLTP) of the type-approval values.
European average for private cars:250% to NEDC, 290% to WLTP
Austria
Germany
Austria
Belgium
Switzerland
Czech Republic
Germany
Denmark
SpainFinland
France
HungaryItaly
Luxembourg
Netherlands
Norway
Portugal
Romania
Sweden
United Kingdom
Deviation to WLTPhigher than to NEDC
Deviation to NEDChigher than to WLTP
100%
200%
300%
400%
500%
100% 200% 300% 400% 500%
Relation of real−world to NEDC fuel consumption
Rel
atio
n o
f re
al−w
orl
d t
o W
LTP
fue
l co
nsum
pti
on
Sample size
30
100
300
1,000
Company cars
Private cars
Figure 5. Mean relation of real-world to NEDC and WLTP type-approval fuel consumption by country sample.
Reasons for country-specific deviation are diverse and cannot be analyzed in more detail here. However, some points will be picked up in Section 3.3, while the following general key points are helpful to classify some deviations: (1) The relative representation of specific brands, vehicle models, and segments might differ across the individual countries. (2) Country-specific relevance and distribution for short-distance to long-distance driving due to public charging infrastructure or points-of-interests density, such as workplace, shopping, errands, or leisure. (3) Charging accessibility at home, at the employer’s premises, or generally along a journey or at a destination. (4) Financial aspects including purchase subsidies and incentives for company cars, wall box subsidies, and the costs of fossil fuels versus electricity. (5) Influence of surrounding conditions such as ambient temperature (e.g., air conditioning) or route topography on energy consumption.

14 ICCT WHITE PAPER | REAL-WORLD USAGE OF PLUG-IN HYBRID VEHICLES IN EUROPE
3.2. REAL-WORLD ELECTRIC DRIVING SHAREIn the present section, we analyze the electric driving share (EDS), i.e., the share of distance driven with combustion engine off. Please note that this can be identified with the UF in NEDC but not exactly with the UF in WLTP since the latter indicates the share of distance driven in the mostly, but not fully, electric CD mode (see Section 2.3).
Table 5 summarizes the sample size-weighted mean real-world EDS by user group and vehicle build year. Additional error estimates (± one standard error) and sample size per year and user group are also provided. For private PHEVs, real-world EDS oscillates around 44%–46% and values have somewhat stabilized for vehicles built in 2020 and 2021, while the minimum is 41% and the peak is 52%. For company car PHEVs, real-world EDS seems to be more than halved compared to private PHEVs and well below 20%, although uncertainty and fluctuation are more pronounced and no statistically stable trend toward vehicles built in 2020 and 2021 is discernible.
Please note that the mean EDS for private PHEVs is close to 50%, meaning almost half of the distance driven by private PHEVs are done on electricity, but the mean real-world fuel consumption is still 4.0–4.4 L/100 km and much higher than the mean type-approval values of 1.6 L/100 km (WLTP) or 1.7 L/100 km (NEDC). To realize the type-approval fuel consumption, the actual EDS would need to be much higher than 50%. Taking 7.1 L/100 km as mean WLTP CS mode fuel consumption for the vehicles in our sample and adding 23% to obtain real-world CS mode fuel consumption, the EDS would need to be 82% (with EDSreal = 1 – FCreal / (1.23 × FCCS
WLTP), compare Section 2.3).
Table 5. Sample size-weighted mean real-world electric driving share by vehicle build year.
Vehicle build year
Private cars Company cars
Real-world EDS N Real-world EDS N
2012 52±4% 82
2013 47±3% 151
2014 51±3% 170
2015 43±3% 215
2016 41±2% 303
2017 42±2% 487 4±2% 125
2018 46±2% 447 8±3% 68
2019 46±2% 484 20±2% 251
2020 44±1% 1051 11±1% 1163
2021 44±2% 574 10±1% 666
Sample size-weighted mean 45%–49% 3661 11%–15% 2273
In Figure 6, we compare the observed distribution of real-world EDS per WLTP equivalent all-electric range to the CD mode driving share per CD mode range that is considered as the Utility Factor (UF) curve in WLTP. The sample size per vehicle model in a country is indicated by its circle size. We limit our sample to WLTP-certified vehicles and refrain from converting NEDC type-approval values, such as described in Plötz and Jöhrens (2021).
As for most PHEV models, the CD mode is not purely electric and also uses the combustion engine to support the electric motor, meaning this comparison is not trivial. Due to the support of the ICE in the CD mode, the CD mode range is longer than the equivalent all-electric range. Accordingly, also the CD mode driving share is higher than the EDS.
In real-world usage, which includes more demanding usage conditions than considered in type approval, such as driving at high or low temperature and high load, the fuel
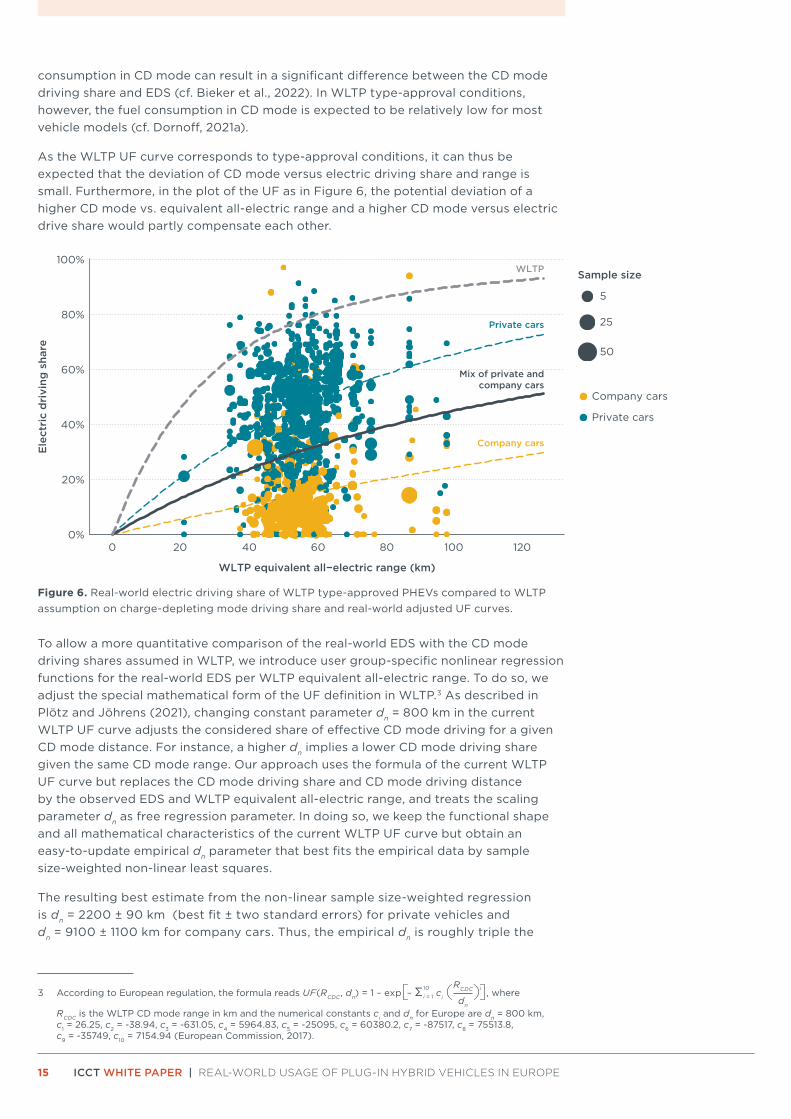
15 ICCT WHITE PAPER | REAL-WORLD USAGE OF PLUG-IN HYBRID VEHICLES IN EUROPE
consumption in CD mode can result in a significant difference between the CD mode driving share and EDS (cf. Bieker et al., 2022). In WLTP type-approval conditions, however, the fuel consumption in CD mode is expected to be relatively low for most vehicle models (cf. Dornoff, 2021a).
As the WLTP UF curve corresponds to type-approval conditions, it can thus be expected that the deviation of CD mode versus electric driving share and range is small. Furthermore, in the plot of the UF as in Figure 6, the potential deviation of a higher CD mode vs. equivalent all-electric range and a higher CD mode versus electric drive share would partly compensate each other.
0%
20%
40%
60%
80%
100%
0 20 40 60 80 100 120
WLTP equivalent all−electric range (km)
Ele
ctri
c d
rivi
ng s
hare
5
25
50
Mix of private andcompany cars
WLTP
Private cars
Company cars
Sample size
Company cars
Private cars
Figure 6. Real-world electric driving share of WLTP type-approved PHEVs compared to WLTP assumption on charge-depleting mode driving share and real-world adjusted UF curves.
To allow a more quantitative comparison of the real-world EDS with the CD mode driving shares assumed in WLTP, we introduce user group-specific nonlinear regression functions for the real-world EDS per WLTP equivalent all-electric range. To do so, we adjust the special mathematical form of the UF definition in WLTP.3 As described in Plötz and Jöhrens (2021), changing constant parameter dn = 800 km in the current WLTP UF curve adjusts the considered share of effective CD mode driving for a given CD mode distance. For instance, a higher dn implies a lower CD mode driving share given the same CD mode range. Our approach uses the formula of the current WLTP UF curve but replaces the CD mode driving share and CD mode driving distance by the observed EDS and WLTP equivalent all-electric range, and treats the scaling parameter dn as free regression parameter. In doing so, we keep the functional shape and all mathematical characteristics of the current WLTP UF curve but obtain an easy-to-update empirical dn parameter that best fits the empirical data by sample size-weighted non-linear least squares.
The resulting best estimate from the non-linear sample size-weighted regression is dn = 2200 ± 90 km (best fit ± two standard errors) for private vehicles and dn = 9100 ± 1100 km for company cars. Thus, the empirical dn is roughly triple the
3 According to European regulation, the formula reads UF(RCDC, dn) = 1 – exp[– Σ i = 1
10 ci ( dn
RCDC)i], where
RCDC is the WLTP CD mode range in km and the numerical constants ci and dn for Europe are dn = 800 km, c1 = 26.25, c2 = -38.94, c3 = -631.05, c4 = 5964.83, c5 = -25095, c6 = 60380.2, c7 = -87517, c8 = 75513.8, c9 = -35749, c10 = 7154.94 (European Commission, 2017).

16 ICCT WHITE PAPER | REAL-WORLD USAGE OF PLUG-IN HYBRID VEHICLES IN EUROPE
value considered in the current WLTP UF curve for private cars and increases more than tenfold for company cars.
As the current PHEV stock consists of both private and company cars, we assume a 50–50 split for private and company cars to determine a joint best estimate for a respective fleet. In doing so, we expect the impact of slightly higher private ownership versus lower annual vehicle kilometers for private households and vice versa for company cars to roughly compensate each other (see Plötz & Jöhrens, 2021). The resulting best estimate is dn = 4260 ± 1100 km for the joint private and company car EDS curve. The higher dn value can be interpreted as a rescaling of the assumed daily driving distance so that, for instance, vehicles in real-world operation may need more than five times the range than expected in WLTP to reach the same driving share.4
For the country-specific analysis and the validation of robustness, Figure 7 plots the mean real-world EDS per PHEV model and the models’ WLTP equivalent all-electric range across several country samples. For the total dataset in Figure 6, we further compare the mean real-world EDS in relation to the WLTP range with the official WLTP UF curve (dashed) and adjust the WLTP UF curve to the real-world EDS with using dn as a free parameter (solid). The PHEV model sample points and the adjusted WLTP curves highlight that in all countries, the real-world EDS is consistently smaller than the WLTP UF.
WLTP
WLTP
WLTP
WLTP
WLTP
WLTP
WLTP
WLTP
WLTP
WLTP
WLTP
WLTP
Hungary Italy Netherlands United Kingdom
Denmark Spain Finland France
Austria Belgium Switzerland Germany
0 50 100 0 50 100 0 50 100 0 50 100
0%20%40%60%80%
100%
0%20%40%60%80%
100%
0%20%40%60%80%
100%
WLTP equivalent all−electric range (km)
Ele
ctri
c d
rivi
ng s
hare
Sample size
100
200
300
Company cars
Private cars
Figure 7. Real-world electric driving share of WLTP type-approved PHEVs compared to WLTP assumption on charge-depleting mode driving share and real-world adjusted UF curves for individual country samples.
In summary, we obtain an empirical EDS curve that takes all mathematical characteristics of the WLTP CD mode driving share curve yet matched to empirical data. Thus, we demonstrate that the WLTP UF curve can be adjusted to average real-world usage with just one scaling parameter modified, making an update of the existing legislation straightforward. The extent to which the parameter needs to be modified,
4 In our previous study, we choose UF = 1 – exp[-EAER/L] as a monotonically increasing nonlinear regression function instead of adjusting the WLTP formula. Here, EAER is the WLTP equivalent all-electric range in km and L is a user group specific parameter for scaling. For private vehicles, we obtain L = 80 ± 2.5 km (best fit ± two standard errors) and L = 361 ± 50 km for company cars. Both regression results are obtained from numerical minimization of the sum of squared deviations. Given a standard WLTP range of 50 km to 75 km, we find an EDS to range from 13%–19% for company cars and 50%–60% for private PHEVs more representative than 75%–85%, as proposed by the WLTP UF.

17 ICCT WHITE PAPER | REAL-WORLD USAGE OF PLUG-IN HYBRID VEHICLES IN EUROPE
coupled with the deviation of the real-world and type-approval fuel consumption values, reveals how crucial this modification is.
3.3. IMPACT OF INDIVIDUAL FACTORSIn addition to PHEV model-specific factors, external and user-specific factors also impact the real-world fuel consumption of PHEVs. This section analyzes the effects of technical specifications such as WLTP equivalent all-electric range, system power, or vehicle mass using regression analysis. In addition, this section explores main causes of the deviation of real-world and type-approval fuel consumption using decomposition analysis.
WLTP equivalent all-electric range We visualize the development of the reported EAER by vehicle build year for the WLTP-reported PHEVs in our sample in Figure 8. Individual vehicle models including different body types and variants, as well as the sample size-weighted mean per year are given. Please note that the y-axis has been cropped at 20 km and 100 km to highlight the central part of the diagram. The spread of the EAER increases, as some vehicle models already reach around 100 km EAER, while the majority stays between 45 km and 65 km and only a few vehicles fall below. A modest trend is apparent, with an annual growth rate around 3.5% per vehicle build year for the mean EAER.
49.250.5
55.9 56.5
20
30
40
50
60
70
80
90
100
2018 2019 2020 2021Vehicle build year
WLT
P e
qui
vale
nt a
ll−el
ectr
ic r
ang
e (k
m)
Sample size
100
200
300
Figure 8. Development of the WLTP equivalent all-electric range (EAER) per vehicle build year of PHEVs in the WLTP sample.
This trend indicates that it might be technically feasible for more recent vehicle models to reach higher real-world EDS. Intuitively and neglecting any compensatory effects, one might expect an improvement compared to our previous study (Plötz et al., 2020). However, as shown in Section 3.2, this is not the case and a higher EAER does not necessarily lead to higher EDS. We rather find constant real-world fuel consumption and consequently growing deviation from type-approval values. Thus, the following section attempts to quantify technical, vehicle-specific effects.
Regression analysisTo quantify any effect of technical, vehicle specific differences, we use a regression analysis limited to our full sample of WLTP-certified vehicles. In doing so, we use the

18 ICCT WHITE PAPER | REAL-WORLD USAGE OF PLUG-IN HYBRID VEHICLES IN EUROPE
(log of) real-world fuel consumption and EDS5 as dependent variables and control for different parameters, namely vehicle system power (in kW),6 WLTP EAER (in km), vehicle curb weight (in kg), build year, user group, and further control variables.7 All technical parameters are taken from the ADAC Autokatalog (ADAC, 2022) (see Section 2.2). Since different subsamples vary in size and include different vehicle models, we use sample size-weighted or unweighted regression models, including user group and the country as control variables. Our methodology follows the previous PHEV study (Plötz et al., 2020). Further details are given in Appendix C.
Table 6 summarizes the main regression results for vehicle system power, curb weight, EAER, build year, and private user group. Results include effects on real-world fuel consumption and thus tailpipe CO2 emissions and effects on potential real-world EDS gains (in percentage points). System power is the total power available for propulsion (and slightly smaller than the sum of electric motor and engine power) and functions as a proxy for model specific engineering and user driving style in the regression. Please note that a separate inclusion of combustion engine and electric motor power in the regression does not alter the results but indicates that the main effect stems from the combustion engine power. The regression results show acceptable (for the highly aggregated data) goodness of fit (adjusted R² = 0.68).8
Table 6. Regression results for factors impacting average real-world fuel consumption (all vehicles).
Change in factorChange in real-world
fuel consumptionaChange in real-world electric driving shareb
+ 10 km WLTP EAER -12% to -15% +1 to +7 percentage points
+ 50 kW system power +3% to +8% Insignificant results
+ 100 kg mass + 4% to +6% Insignificant results
+ 1 vehicle build year +6% to +8% Insignificant results
User group: Company car +45% to +55% –39 to –25 percentage pointsa Since fuel consumption is strictly non-negative, we use an exponential function for the effect of range and
power and control for user group and country-specific effects with the following regression model FCreal = exp(β0 + β1Power + β2EAER + β3usergroup + β4 build_year + β5controls) + ε. Here, the system power (Power) in kW, is used as a proxy for engine displacement, weight, and model-specific aggressiveness of driving. Controls is a placeholder for various additional controls used in the regression (incl. country, segment, body type, annual mileage, and mass). The chosen dependence on WLTP equivalent all-electric range (EAER) and power are: For EAER"0, the fuel consumption approaches a finite value (i.e., the fuel consumption in the charge-sustaining mode) and is decreasing to zero for EAER"∞ (i.e., a negative β2). Likewise, the fuel consumption approaches zero for Power"0 and grows with increasing power (i.e., a positive β1). Cf. Plötz et al. (2018) for a discussion of this regression model. The regression is performed after taking logarithms of the above equation by ordinary least squares (weighted by the square root of sample size for aggregated data and unweighted for vehicle individual data). The model itself and all coefficients are significant (p < 0.05) and the coefficients have the expected signs (β1 > 0 and β2 < 0). The significance levels are robust against choosing heteroscedasticity robust standard errors in the regression and all variables have been checked for multi-collinearity. The details are given in Appendix C.
b For the EDS as dependent variable with use fractional logit regression weighted by the square root of sample size for aggregated data and unweighted for vehicle individual data (implemented as quasi-binomial regression model, cf. Clark 2019). The shown changes are marginal effects with respect to the changes indicated in the first column.
5 For the EDS as dependent variable we use fractional logit regression since the EDS is a fraction in the interval [0, 1]. This is implemented via glm() with quasi-binomial likelihood in the statistical software R, cf. Clark (2019).
6 Strictly speaking, the system power is the maximal power available for propulsion. For most PHEV models, this is the approx. sum of engine and electric motor power. Yet, for some vehicles, notably range-extended electric vehicles such as the Chevrolet Volt or the BMW i3 REX, the engine is not directly used for propulsion but to charge the battery, so the system power is smaller than the sum of engine and electric motor power.
7 E.g. KBA vehicle segment and body type. Both could affect the fuel consumption as cars of different segments are used for different purposes and the shape of the vehicles, in particular frontal area affects fuel consumption.
8 The results for range and user group are robust against different model specifications. However, the coefficient for system power increases threefold when vehicle mass is omitted as an additional variable and afterwards robust against adding further controls. We thus choose a regression model including mass as base model. If engine power and electric motor power are included as individual variables, the change in real-world fuel consumption with a 10 kW engine power increase is 0.8% to 2.4% and -1.0% to +1.8% for a 10 kW increase of electric motor power (the sum of coefficients is smaller than the system power coefficients as the sum is on average 12% larger than system power). Thus, if treated individually, only engine power has an effect on fuel consumption that is significantly different from zero.

19 ICCT WHITE PAPER | REAL-WORLD USAGE OF PLUG-IN HYBRID VEHICLES IN EUROPE
We find that with a 10 km increase in WLTP EAER and other parameters fixed, the fuel consumption decreases by 12%–15% while the EDS increases by 1 to 7 percentage points.9 The estimated range of values includes a 95% confidence interval from the regression. Likewise, an increase in system power by 50 kW is connected to a 3%–8% higher fuel consumption and an increase in vehicle curb weight of 100 kg is connected to 4%–6% higher fuel consumption. Other technical parameters lead to an expected increase in single-digit percentage, yet no statistically significant EDS changes. Considering the dependency of vehicle build year, an additional increase in fuel consumption with every built year is noticeable at around 0.1–0.2 L/100 km. Overall, the private versus company car selection impacts fuel consumption and EDS the most, which might be expected given the high difference between user groups (see Figure 6).
Contribution of individual factors to the deviation of real-world and WLTP fuel consumptionTo conclude this chapter, we estimate the contribution of four factors influencing the deviation between real-world and type-approval fuel consumption. We analyze WLTP type-approval values and quantify the individual contributions from a CD mode range lower than in type approval, from less frequent charging and more long-distance driving, and from a higher CS mode fuel consumption than in type approval. We use previous findings as well as relations between EDS and fuel consumption. Some uncertainty arises, especially concerning parameter sequence and their mutual influence, so that this evaluation does not reflect any comprehensive or definitive statement. The structure is given in Table 7. A similar derivation for NEDC is given in Appendix D.
The starting points are the average WLTP type-approval fuel consumption values in our sample of 1.6 L/100 km for private cars and 1.7 L/100 km for company cars. As the real-world electric energy consumption is higher than the type-approval electricity consumption in CD mode driving, the real-world CD mode range is lower than in type approval. We use the WLTP UF curve (see Section 2.3) for the EDS with the EAER instead of the CD mode range to estimate this effect. When assuming that the electricity consumption of the CD mode in real-world usage is about 20% higher than in WLTP type-approval,10 a WLTP CD mode range of 56 km would be 17% lower in real-world usage, at about 46 km. The difference in the WLTP UF between a CD mode range of 46 km and 56 km is 5.5 percentage points.11 For PHEV models with a typical WLTP CS mode fuel consumption of 7.1 L/100 km, this increases the average fuel consumption by about 0.4 L/100 km.
Next, we estimate the effect from a higher CS mode fuel consumption than in type-approval conditions. We take the typical average real-world fuel consumption values of 4.2 L/100 km for private and 8.0 L/100 km for company PHEVs as an example. As described in Section 2.3, we assume that the real-world fuel consumption when driving on fuel can be approximated by the CS mode fuel consumption and that the real-world CS mode fuel consumption is 23% higher than the WLTP CS mode fuel consumption. Thereby, already one fifth of the real-world average fuel consumption, which is
9 The changes indicated in the table and discussed in this paragraph allow us to roughly measure the effect of different factors but are only accurate as a local approximation to a generally non-linear relationship. For example, a 100 km increase in electric range will not lead to a 120%–150% lower fuel consumption (obviously).
10 For battery electric vehicles, the ADAC Ecotest (ADAC, 2021) typically finds a similar deviation from the WLTP electricity consumption values. Also, we use a similar deviation between the real-world and WLTP fuel consumption values in CS mode (see Section 2.3).
11 The official curve reads as UF(RCDC, dn) = 1 – exp[–Σi=110 ci (RCDC
dn
)i
], where RCDC is the WLTP CD mode range
(in km) and the numerical constants ci and dn for Europe are dn = 800 km, c1 = 26.25, c2 = -38.94, c3 = -631.05, c4 = 5964.83, c5 = -25095, c6 = 60380.2, c7 = -87517, c8 = 75513.8, c9 = -35749, c10 = 7154.94 according to (European Commission 2017). We enter the EAER values of 56 km and 46 km as RCDC and compare the outcomes.

20 ICCT WHITE PAPER | REAL-WORLD USAGE OF PLUG-IN HYBRID VEHICLES IN EUROPE
+0.8 L/100 km for private cars and +2.6 L/100 km for company cars, can be attributed to the deviation of real-world and type-approval CS mode fuel consumption values. Note that the contribution of the difference in fuel consumption when driving on fuel is proportional to the fuel consumption resulting from the realized EDS and CD mode driving share. The higher value for company than for private cars is directly linked to their lower EDS.
Finally, we assign the remainder of the difference of real-world and type-approval values to user behavior that includes a lower charging frequency and potentially a higher share of long-distance driving than considered in the type-approval value. By further lowering the realized EDS, these factors contribute to the deviation of the fuel consumption by +1.4 L/100 km for private and +3.3 L/100 km for company cars. Taken together, user behavior and the higher CS mode fuel consumption have the largest contributions to the gap between type-approval and real-world fuel consumption.
Table 7. Factors impacting average real-world fuel consumption and their estimated effect.
Fuel consumption (L/100 km)
Factor Private cars Company cars
WLTP 1.6 1.7
17% lower CD mode range +0.4 +0.4
Less charging and more long-distance driving +1.4 +4.4
23% higher CS mode fuel consumption +0.8 +1.5
Real-world usage 4.2 8.0
Figure 9 and Figure 10 visualize these individual contributions for private and company cars, respectively.
1.60.4
1.4
0.8 4.2
WLTP fuel consumption
LowerCD mode range
Less charging,more long-
distance driving
Higher CSmode fuel
consumption
Real-worldfuel
consumption
Fue
l co
nsum
pti
on
(L/1
00
km
)
0.0
0.5
1.0
1.5
2.0
2.5
3.0
3.5
4.0
4.5
5.0
Figure 9. Contribution of different real-world factors to real-world fuel consumption of private car PHEVs.

21 ICCT WHITE PAPER | REAL-WORLD USAGE OF PLUG-IN HYBRID VEHICLES IN EUROPE
WLTP fuel consumption
LowerCD mode range
Less charging,more long-
distance driving
Higher CSmode fuel
consumption
Real-worldfuel
consumption
1.70.4
4.4
1.5 8.0
Fue
l co
nsum
pti
on
(L/1
00
km
)
0.0
1.0
2.0
3.0
4.0
5.0
6.0
7.0
8.0
9.0
Figure 10. Contribution of different factors to real-world fuel consumption of company car PHEVs.
While the absolute impact of the deviation between real-world and type-approval CD mode range (about 0.5 L/100 km) is roughly equivalent for both user groups, main deviations occur for lower charging frequency and more long-distance driving (about 1.3 L/100 km for private and 3.3 L/100 km for company cars). The lower charging frequency of company car users (see Plötz et al., 2020) might be influenced by fuel cards that provide misaligned incentives, as extra fuel consumption has no direct monetary impact on the individual driver.

22 ICCT WHITE PAPER | REAL-WORLD USAGE OF PLUG-IN HYBRID VEHICLES IN EUROPE
4. DISCUSSION AND OUTLOOK The following discussion includes data sources and country-specific sample size, our method for calculating the real-world EDS, and a comparison to our previous study as well as the limitations of the present study.
LIMITATIONS OF EVALUATED DATA SOURCESOur sample includes over 6,000 WLTP-certified and a total of nearly 9,000 primarily up-to-date PHEV vehicle models, covering 27 European countries and two user groups. While PHEVs in Germany dominate our sample, we also cover ten other countries with at least 50 vehicles, including essential major current PHEV markets. Data for Eastern European countries is lacking which reflects the low PHEV stock shares in those countries. Even though varying and partly small sample sizes for individual countries barely allow any statistically significant comparison between the countries, we find similar tendencies in all European countries, indicating cross-national consistency and robustness of our findings. Data on company cars was available only for Germany and Austria, with Austria having a minor share. However, the overall trend is consistent for both countries and similar to earlier company car data from the Netherlands (cf. Plötz et al., 2020). Thus, we presume certain resilience and consistency for our latest WLTP-focused results, yet single numerical values may change. For the Spritmonitor.de data, we draw on voluntarily self-reported fuel consumption. It could therefore be biased towards private users with an above-average interest in their vehicle’s energy consumption. Therefore, the reported fuel consumption could be lower than in the full fleet of private PHEVs.
We analyze vehicle data in varying granularity, ranging from few refueling entries per vehicle, pre-aggregated refueling data, to reported total fuel consumption. Our sources vary from online web services, self-performed or third-party surveys, to company car fuel diaries. Each utilized data source might have been subject to incorrect user input, primarily where user-defined strings and free text boxes are used rather than pre-defined lists. Given our rigid data cleaning process, including the exclusion of unrealistic, incomplete, and inconclusive assignable vehicle model data, however, we aim to assure high accuracy and consistency.
LIMITATIONS OF THE METHOD FOR REAL-WORLD EDS CALCULATIONWe determine the real-world electric driving share as a proportion of distance with purely electric driving, i.e., with the ICE switched off. This is a major difference compared to WLTP type-approval, in which the Utility Factor corresponds to the CD mode driving share, thereby also covering the fuel consumption in CD mode. Depending on powertrain characteristics and operating strategy, some vehicles may not foresee any ICE deployment in CD mode, i.e., there is no difference between CD mode and pure electric driving. Other vehicles tend to increasingly make use of their ICE under higher load conditions, high or low operation temperature, and with decreasing battery state of charge (Dornoff, 2021a; Bieker et al., 2022). In such cases, the share of distance driven in CD mode with non-zero fuel consumption is higher than the share of pure electric driving with zero fuel consumption. At the same time, the CD mode range is higher than pure electric range. Overall, we expect our method of estimating the relationship between pure electric range and the share of distance driven on electricity to result in a very similar UF curve compared to estimates based on the relationship between CD mode range and CD mode driving share. However, more research on the relation between pure electric driving share and CD mode driving share is required.

23 ICCT WHITE PAPER | REAL-WORLD USAGE OF PLUG-IN HYBRID VEHICLES IN EUROPE
For the calculation of the real-world EDS, the CS mode fuel consumption is required. As the CS mode fuel consumption determined in the WLTP type-approval process is often not publicly available, our method required certain assumptions to deduce it from other values. Our validation shows only minor deviations in this recalculation to WLTP type-approval values. Thus, we consider our approach to be sufficiently accurate to reproduce real-world UF and EDS. Still, we estimated real-world electric driving shares based on possibly slightly too low estimates of real-world CS fuel consumption which implies that actual EDS could be slightly lower.
COMPARISON WITH THE PREVIOUS STUDYOverall, latest results are consistent with findings from the 2020 study (Plötz et al., 2020). For private PHEVs, an increased deviation of the real-world from type-approval fuel consumption values is noticeable. The (sample size-weighted) deviation for private, NEDC type-approved vehicles reported in 2020 was 135%–235% and has increased to 240%–260% for NEDC and 270%–310% for WLTP certified PHEVs. The deviation was 340%–410% for NEDC type-approved company cars in the 2020 study and is now 420%–460% for NEDC and 455%-520% for WLTP certified vehicles. This increase may result from larger combustion engines, higher combustion engine power, larger and heavier vehicles, as well as newly attained customer groups during the progressive PHEV market diffusion. The latter may be supported by fiscal incentives, including PHEV purchase subsidies and reduced tax rates. Compared to earlier adopters, consumers who make use of these financial incentives may be less motivated by environmental concern, which might further be associated with less frequent charging or other user behavior changes. Overall, we observe an increase of the deviation but cannot attribute it to specific reasons.
OUTLOOKEven though fleet data, i.e., vehicles for purely commercial use and not company cars for commercial and private use, is missing, we examine two major user groups involving substantial sample sizes. Thus, current evidence from this study, its precursor, and other studies are solid and robust enough to correct the unrealistic assumption on PHEV usage in the WLTP Utility Factor already today. At a later stage, as even more comprehensive data on the real-world usage of PHEV is available from on-board fuel consumption monitoring devices, prescribed and enabled by Regulation (EU) 2018/1832 and collected as required under Regulation (EU) 2021/392, further WLTP modifications could be refined (Dornoff, 2021b).
Given their tremendous sales shares in Europe and their subsequent long-term retention in vehicle stock, the effectiveness of climate policies in the transport sector, such as the European Union’s CO2 emission standards or fiscal policies, requires more realistic CO2 emission values for PHEVs as soon as possible. The present study offers one direct solution: replace the parameter dn = 800 km in the UF regulation by a more realistic value of dn = 4260 km.

24 ICCT WHITE PAPER | REAL-WORLD USAGE OF PLUG-IN HYBRID VEHICLES IN EUROPE
REFERENCESAllgemeiner Deutscher Automobil-Club. (2021). ADAC Ecotest. https://www.adac.de/rund-ums-
fahrzeug/tests/ecotest/.
Allgemeiner Deutscher Automobil-Club. (2022). ADAC Autokatalog [Car catalog]. https://www.adac.de/rund-ums-fahrzeug/autokatalog/.
Anderson, J. E., Bergfeld, M., Nguyen, D. M., and Steck, F. (2021). Real-world charging behavior and preferences of electric vehicles users in Germany (submitted for publication). Retrieved from Deutsches Zentrum für Luft- und Raumfahrt.
Autovia. (2022). Carbuyer. https://www.carbuyer.co.uk/.
Bieker, G., Moll, C., Link, S., Plötz, P., & Mock, P. (2022). More bang for the buck: A comparison of the life-cycle greenhouse gas emission benefits and incentives of plug-in hybrid and battery electric vehicles in Germany. Retrieved from the International Council on Clean Transportation https://theicct.org/publication/ghg-benefits-incentives-ev-mar22/.
Cambria Automobiles. (2022). Grange. Retrieved from https://www.grange.co.uk/.
Clark, M. (2019). Fractional Regression – A quick primer regarding data between zero and one, including zero and one. Retrieved from https://m-clark.github.io/posts/2019-08-20-fractional-regression/.
Dornoff, J. (2021a). Plug-in hybrid vehicle CO2 emissions: How they are affected by ambient conditions and driver mode selection. Retrieved from the International Council on Clean Transportation https://theicct.org/publication/plug-in-hybrid-vehicle-co2-emissions-how-they-are-affected-by-ambient-conditions-and-driver-mode-selection/.
Dornoff, J. (2021b). No time to lose for the European Commission to make plug-in hybrid CO2 emission values more realistic — and no need to wait! ICCT Staff Blog. http://theicct.org/no-time-to-lose-for-the-european-commission-to-make-plug-in-hybrid-co2-emission-values-more-realistic-and-no-need-to-wait/.https://theicct.org/no-time-to-lose-for-the-european-commission-to-make-plug-in-hybrid-co2-emission-values-more-realistic-and-no-need-to-wait/.
Dornoff, J., Tietge, U., & Mock, P. (2020). On the way to “real-world” CO2 values: The European passenger car market in its first year after introducing the WLTP. Retrieved from the International Council on Clean Transportation https://theicct.org/publication/on-the-way-to-real-world-co2-values-the-european-passenger-car-market-in-its-first-year-after-introducing-the-wltp/.
Ecke, L., Chlond, B., Magdolen, M., & Vortisch, P. (2020). Deutsches Mobilitätspanel (MOP) –Wissenschaftliche Begleitung und Auswertungen Bericht 2019/2020: Alltagsmobilität und Fahrleistung [German Mobility Panel (MOP) – Scientific monitoring and evaluation report 2019/2020: Everyday mobility and mileage]. Retrieved from Karlsruher Institut für Technologie (KIT) https://doi.org/10.5445/IR/1000126557.
European Alternative Fuels Observatory. (2021). European Union (EU27) - Vehicles and fleet. Retrieved from https://alternative-fuels-observatory.ec.europa.eu/transport-mode/road/european-union-eu27.
European Automobile Manufacturers’ Association. (2022). New passenger car registrations by fuel type in the EU. Retrieved from https://www.acea.auto/fuel-pc/fuel-types-of-new-cars-battery-electric-9-1-hybrid-19-6-and-petrol-40-0-market-share-full-year-2021/.
European Commission. (2017). Commission Regulation (EU) 2017/1151 of 1 June 2017 supplementing Regulation (EC) No 715/2007 of the European Parliament and of the Council on type-approval of motor vehicles with respect to emissions from light passenger and commercial vehicles (Euro 5 and Euro 6) and on access to vehicle repair and maintenance information, amending Directive 2007/46/EC of the European Parliament and of the Council, Commission Regulation (EC) No 692/2008 and Commission Regulation (EU) No 1230/2012 and repealing Commission Regulation (EC) No 692/2008. Retrieved from http://data.europa.eu/eli/reg/2017/1151/2020-01-25.
European Environmental Agency. (2021). COPERT – Computer programme to calculate emissions from road transport. Retrieved from Emisia https://www.emisia.com/utilities/copert-data/.
Fiches-auto.fr (2022). Fiches-auto.fr. https://www.fiches-auto.fr.
Fisch und Fischl GmbH. (2022). Spritmonitor.de. https://www.spritmonitor.de/.
infas, DLR, IVT & infas 360 (2019). Mobilität in Deutschland – MiD [Mobility in Germany]. Study on behalf of the Federal Ministry of Transport and Digital Affairs (BMVI). Retrieved from http://www.mobilitaet-in-deutschland.de/index.html.
International Energy Agency. (2021). Global EV Outlook 2021. Retrieved from https://www.iea.org/reports/global-ev-outlook-2021.
Kraftfahrt-Bundesamt. (2021). Neuzulassungen – Jahresbilanz 2021. Retrieved from https://www.kba.de/DE/Statistik/Fahrzeuge/Neuzulassungen/Jahresbilanz_Neuzulassungen/jahresbilanz_node.html.
MILE21.eu. (2022). MILE21.eu. https://www.mile21.eu.

25 ICCT WHITE PAPER | REAL-WORLD USAGE OF PLUG-IN HYBRID VEHICLES IN EUROPE
Pavlovic, J., Chatzipanagi, A., Ktistakis, M., Pastorello, C., Komnos, D., & Fontaras, G. (2021). Increase in WLTP‘s CO2 emissions from vehicles based on European certification datasets. Retrieved from SSRN https://ssrn.com/abstract=3996134.
Plötz, P., Schneider, U., Globisch, J., & Dütschke, E. (2014). Who will buy electric vehicles? Identifying early adopters in Germany. Transportation Research Part A: Policy and Practice, 67, 96-109. https://www.sciencedirect.com/science/article/abs/pii/S0965856414001463.
Plötz, P., Funke, S. Á., & Jochem, P. (2018). Empirical Fuel Consumption and CO2 Emissions of Plug-In Hybrid Electric Vehicles. Journal of Industrial Ecology, 22 (4), 773-784. https://onlinelibrary.wiley.com/doi/full/10.1111/jiec.12623.
Plötz, P. & Jöhrens, J. (2021). Realistic Test Cycle Utility Factors for Plug-in Hybrid Electric Vehicles in Europe. Retrieved from Fraunhofer ISI https://www.isi.fraunhofer.de/content/dam/isi/dokumente/cce/2021/BMU_Kurzpapier_UF_final.pdf.
Plötz, P., Moll, C., Bieker, G., Mock, P. & Li, Y. (2020). Real-world usage of plug-in hybrid electric vehicles: Fuel consumption, electric driving, and CO2 emissions. Retrieved from the International Council on Clean Transportation https://theicct.org/publication/real-world-usage-of-plug-in-hybrid-electric-vehicles-fuel-consumption-electric-driving-and-co2-emissions/.
Riemersma, I. & Mock, P. (2017). Too low to be true? How to measure fuel consumption and CO2 emissions of plug-in hybrid vehicles, today and in the future. Retrieved from the International Council on Clean Transportation https://theicct.org/publication/too-low-to-be-true-how-to-measure-fuel-consumption-and-co2-emissions-of-plug-in-hybrid-vehicles-today-and-in-the-future/.
Transport & Environment (2019). Electric surge – Carmakers’ electric car plans across Europe 2019-2025. Retrieved from https://www.transportenvironment.org/discover/electric-surge-carmakers-electric-car-plans-across-europe-2019-2025/.
Tietge, U., Diaz, S., Mock, P., Bandivadekar, A., Dornoff, J. & Ligterink, N. (2019). From laboratory to road. A 2018 update. Retrieved from the International Council on Clean Transportation https://theicct.org/publication/from-laboratory-to-road-a-2018-update/.

26 ICCT WHITE PAPER | REAL-WORLD USAGE OF PLUG-IN HYBRID VEHICLES IN EUROPE
APPENDIX A: SAMPLE DETAILSThe following table shows the number of PHEVs and PHEV model variants in the sample by country. For 136 PHEVs no specific country could be identified as the user-given country code did not correspond to a standard vehicle country code.
Table A1. Number of PHEVs and number of model variants and sources in sample by country.
Country No. of vehiclesNo. of model variants
and sources
Germany 7123 824
United Kingdom 370 62
France 261 82
Austria 226 90
Netherlands 95 46
Switzerland 94 67
Finland 87 59
Hungary 82 36
Italy 55 41
Denmark 51 33
Belgium 50 45
Spain 48 39
Sweden 43 30
Portugal 34 24
Norway 18 16
Czech Republic 17 17
Luxembourg 15 13
Romania 13 12
Slovakia 7 6
Lithuania 5 4
Poland 5 5
Bulgaria 4 4
Greece 4 4
Estonia 4 3
Croatia 3 3
European Union 2 2
Slovenia 2 2
Ireland 1 1
N/A 136 104
Total 8,855 1,674

27 ICCT WHITE PAPER | REAL-WORLD USAGE OF PLUG-IN HYBRID VEHICLES IN EUROPE
Table A2. Number of PHEVs and number of model variants and sources by build year.
Build yearNo. of
vehicles
No. of model variants
and sources
2011 3 1
2012 82 23
2013 151 46
2014 171 58
2015 215 72
2016 304 102
2017 612 153
2018 515 153
2019 735 164
2020 2214 363
2021 1240 301
N/A 2613 238
Total 8855 1674
Table A3. Summary statistics for real-world usage by model, user group and country.
User group Country Make Model N FCreal NEDC WLTP EDS
private DE Audi A3 99 4.0 1.6 1.3 41%
private DE Audi A3, S3, RS3 131 3.3 1.6 1.4 54%
private DE Audi A6 17 7.2 1.7 1.5 24%
private DE Audi A7 5 6.8 1.9 1.7 24%
private DE Audi Q5 14 6.0 2.0 2.1 38%
private DE Audi Q7 8 6.9 2.1 2.5 29%
private DE BMW 2 Series 247 4.1 2.0 2.0 53%
private DE BMW 2 Series 134 4.4 2.0 1.8 42%
private DE BMW 3 Series 25 5.3 1.7 1.4 38%
private DE BMW 3 Series 102 4.9 1.8 1.5 41%
private DE BMW 5 Series 33 5.8 2.0 1.6 37%
private DE BMW 5 Series 71 5.2 2.1 1.9 42%
private DE BMW 7 Series 7 7.1 2.3 2.3 30%
private DE BMW i8 9 6.6 2.0 2.1 28%
private DE BMW X1 25 4.0 1.9 1.8 56%
private DE BMW X3 13 6.5 2.1 2.1 34%
private DE BMW X5 24 6.5 2.3 1.2 42%
private DE BMW i3 16 0.8 0.6 88%
private DE Cupra Formentor 22 4.5 1.9 1.5 46%
private DE Cupra Leon 38 4.3 1.5 1.4 47%
private DE Citroën C5 5 4.7 1.6 1.4 42%
private DE Ford Explorer 5 8.7 2.9 3.1 32%
private DE Ford Kuga 82 4.2 1.3 1.2 43%
private DE Hyundai Ioniq 93 2.7 1.1 1.1 53%
private DE Hyundai Ioniq 58 2.2 1.1 1.1 63%
private DE Hyundai Tucson 13 5.7 1.4 34%
private DE Jeep Compass 7 6.0 2.0 2.0 34%

28 ICCT WHITE PAPER | REAL-WORLD USAGE OF PLUG-IN HYBRID VEHICLES IN EUROPE
User group Country Make Model N FCreal NEDC WLTP EDS
private DE Jeep Renegade 10 4.4 2.0 2.0 48%
private DE Kia Ceed 43 3.3 1.2 47%
private DE Kia Niro 135 2.8 1.3 1.4 61%
private DE Kia Optima 26 3.8 1.4 48%
private DE Kia Sorento 8 4.3 1.6 49%
private DE Kia XCeed 21 3.0 1.2 1.4 53%
private DE Kia Niro 78 2.7 1.3 1.3 65%
private DE Kia Optima 18 3.6 1.6 1.5 52%
private DE Mini Countryman 57 4.4 2.1 2.3 52%
private DE Mercedes A Class 39 3.7 1.4 1.1 55%
private DE Mercedes B Class 10 3.8 1.4 1.2 54%
private DE Mercedes C Class 118 5.4 1.7 1.4 29%
private DE Mercedes CLA 16 3.8 1.4 1.0 53%
private DE Mercedes E Class 107 5.1 1.7 1.4 29%
private DE Mercedes GLA 6 3.6 1.7 1.4 60%
private DE Mercedes GLC 36 6.7 2.2 2.0 26%
private DE Mercedes GLE 12 6.0 1.6 0.8 35%
private DE Mercedes GLK, GLC 37 5.7 2.3 2.1 39%
private DE Mini Countryman 7 2.7 2.1 68%
private DE Mini Mini 111 4.2 2.1 49%
private DE Mitsubishi Eclipse Cross 5 5.0 1.7 2.0 43%
private DE Mitsubishi Outlander 572 3.8 1.8 53%
private DE Opel Ampera 20 2.1 1.2 71%
private DE Opel Ampera (11/11 - 07/16) 29 2.5 1.2 66%
private DE Opel Grandland 24 4.4 1.5 1.4 44%
private DE Peugeot 3008 16 4.5 1.5 1.3 47%
private DE Peugeot 508 12 4.6 1.5 1.4 40%
private DE Porsche Cayenne 23 8.0 3.2 3.8 37%
private DE Porsche Pamera 28 7.5 2.7 3.0 37%
private DE Renault Captur 20 3.5 1.5 54%
private DE Renault Mégane 6 2.8 1.2 54%
private DE SEAT Leon 33 4.2 1.6 1.1 48%
private DE SEAT Tarraco 7 5.1 2.1 1.8 43%
private DE Skoda Superb 65 4.6 1.5 1.4 42%
private DE Skoda Octavia 33 4.5 1.3 1.0 37%
private DE Toyota Prius 165 2.7 1.4 1.3 50%
private DE Toyota RAV4 (XA5) Plug-In Hybrid (from 10/20) 11 3.6 1.2 1.0 54%
private DE VW Golf 341 3.7 1.6 1.5 53%
private DE VW Passat 324 4.2 1.5 1.1 42%
private DE Volvo V60 66 5.3 1.8 2.0 43%
private DE Volvo V60 (F) (12/10 - 07/13) 18 4.6 1.8 42%
private DE Volvo V90 16 5.2 2.0 2.0 46%
private DE Volvo V90 (P) (09/16 - 03/20) 7 5.6 2.0 2.0 39%
private DE Volvo XC40 23 5.0 1.8 2.0 41%
private DE Volvo XC60 43 6.6 2.0 2.6 35%
private DE Volvo XC90 48 7.1 2.2 3.2 33%
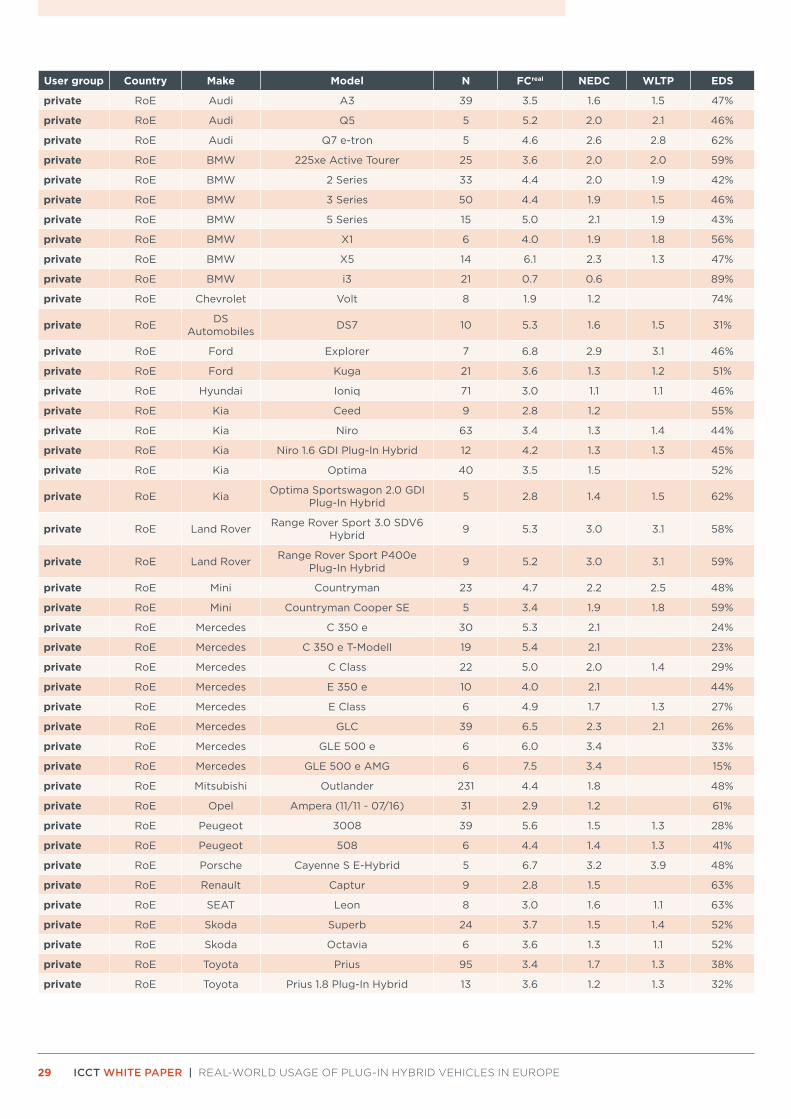
29 ICCT WHITE PAPER | REAL-WORLD USAGE OF PLUG-IN HYBRID VEHICLES IN EUROPE
User group Country Make Model N FCreal NEDC WLTP EDS
private RoE Audi A3 39 3.5 1.6 1.5 47%
private RoE Audi Q5 5 5.2 2.0 2.1 46%
private RoE Audi Q7 e-tron 5 4.6 2.6 2.8 62%
private RoE BMW 225xe Active Tourer 25 3.6 2.0 2.0 59%
private RoE BMW 2 Series 33 4.4 2.0 1.9 42%
private RoE BMW 3 Series 50 4.4 1.9 1.5 46%
private RoE BMW 5 Series 15 5.0 2.1 1.9 43%
private RoE BMW X1 6 4.0 1.9 1.8 56%
private RoE BMW X5 14 6.1 2.3 1.3 47%
private RoE BMW i3 21 0.7 0.6 89%
private RoE Chevrolet Volt 8 1.9 1.2 74%
private RoE DS Automobiles DS7 10 5.3 1.6 1.5 31%
private RoE Ford Explorer 7 6.8 2.9 3.1 46%
private RoE Ford Kuga 21 3.6 1.3 1.2 51%
private RoE Hyundai Ioniq 71 3.0 1.1 1.1 46%
private RoE Kia Ceed 9 2.8 1.2 55%
private RoE Kia Niro 63 3.4 1.3 1.4 44%
private RoE Kia Niro 1.6 GDI Plug-In Hybrid 12 4.2 1.3 1.3 45%
private RoE Kia Optima 40 3.5 1.5 52%
private RoE Kia Optima Sportswagon 2.0 GDI Plug-In Hybrid 5 2.8 1.4 1.5 62%
private RoE Land Rover Range Rover Sport 3.0 SDV6 Hybrid 9 5.3 3.0 3.1 58%
private RoE Land Rover Range Rover Sport P400e Plug-In Hybrid 9 5.2 3.0 3.1 59%
private RoE Mini Countryman 23 4.7 2.2 2.5 48%
private RoE Mini Countryman Cooper SE 5 3.4 1.9 1.8 59%
private RoE Mercedes C 350 e 30 5.3 2.1 24%
private RoE Mercedes C 350 e T-Modell 19 5.4 2.1 23%
private RoE Mercedes C Class 22 5.0 2.0 1.4 29%
private RoE Mercedes E 350 e 10 4.0 2.1 44%
private RoE Mercedes E Class 6 4.9 1.7 1.3 27%
private RoE Mercedes GLC 39 6.5 2.3 2.1 26%
private RoE Mercedes GLE 500 e 6 6.0 3.4 33%
private RoE Mercedes GLE 500 e AMG 6 7.5 3.4 15%
private RoE Mitsubishi Outlander 231 4.4 1.8 48%
private RoE Opel Ampera (11/11 - 07/16) 31 2.9 1.2 61%
private RoE Peugeot 3008 39 5.6 1.5 1.3 28%
private RoE Peugeot 508 6 4.4 1.4 1.3 41%
private RoE Porsche Cayenne S E-Hybrid 5 6.7 3.2 3.9 48%
private RoE Renault Captur 9 2.8 1.5 63%
private RoE SEAT Leon 8 3.0 1.6 1.1 63%
private RoE Skoda Superb 24 3.7 1.5 1.4 52%
private RoE Skoda Octavia 6 3.6 1.3 1.1 52%
private RoE Toyota Prius 95 3.4 1.7 1.3 38%
private RoE Toyota Prius 1.8 Plug-In Hybrid 13 3.6 1.2 1.3 32%

30 ICCT WHITE PAPER | REAL-WORLD USAGE OF PLUG-IN HYBRID VEHICLES IN EUROPE
User group Country Make Model N FCreal NEDC WLTP EDS
private RoE Toyota RAV4 Hybrid 2 WD (until 2019) 26 5.3 1.1 0.9 33%
private RoE Toyota RAV4 Hybrid 4 WD (until 2019) 26 5.6 1.1 0.9 29%
private RoE Toyota RAV4 2.5 Plug-In Hybrid 14 4.8 1.1 0.9 40%
private RoE VW Golf 61 3.5 1.5 1.3 47%
private RoE VW Passat 70 4.1 1.6 1.2 43%
private RoE Volvo V60 48 4.7 1.8 2.0 47%
private RoE Volvo V60 (F) (12/10 - 07/13) 35 4.4 1.8 46%
private RoE Volvo V60 D5 Plug-In Hybrid 31 2.9 1.8 64%
private RoE Volvo V60 D6 Hybrid 31 3.3 1.8 58%
private RoE Volvo V90 7 4.7 2.0 2.0 50%
private RoE Volvo V90 (P) (09/16 - 03/20) 5 4.8 2.0 2.0 47%
private RoE Volvo XC40 9 5.0 1.7 2.0 40%
private RoE Volvo XC60 26 5.6 2.1 2.8 44%
private RoE Volvo XC90 18 6.8 2.3 3.4 29%
company DE Audi A3 19 6.2 1.6 1.3 14%
company DE Audi A6 48 8.7 1.8 1.6 7%
company DE Audi A6 Avant 55 TFS 5 6.8 1.7 1.5 28%
company DE Audi A7 22 8.6 1.9 1.7 6%
company DE Audi Q3 10 8.5 1.4 1.7 2%
company DE Audi Q5 180 9.2 2.0 1.9 8%
company DE Audi Q5 50 TFSI e 9 7.9 1.9 1.7 21%
company DE Audi Q5 55 TFSI e 8 4.4 1.9 1.7 56%
company DE Audi Q7 6 11.2 2.7 2.9 10%
company DE BMW 225xe iPerformance 23 3.9 1.8 1.7 56%
company DE BMW 2 Series 111 7.6 2.3 2.7 30%
company DE BMW 330e 6 3.4 1.7 1.4 60%
company DE BMW 330e Touring 6 11.1 1.7 1.4 0%
company DE BMW 3 Series 186 8.0 1.7 1.4 9%
company DE BMW 530e iPerformance 9 7.7 1.9 1.6 12%
company DE BMW 5 Series 142 8.3 1.9 1.6 9%
company DE BMW X1 206 8.1 1.9 1.8 12%
company DE BMW X3 387 9.3 2.1 2.1 8%
company DE BMW X3 xDrive30e 5 6.1 2.1 2.0 38%
company DE BMW X5 109 10.5 1.8 1.2 14%
company DE BMW X5 xDrive45e 6 8.9 1.7 1.2 28%
company DE Citroen C5 6 8.2 1.6 1.4 7%
company DE Ford Kuga 2.5 Durante 10 5.9 1.2 1.2 18%
company DE Ford Explorer 6 11.2 2.9 3.1 10%
company DE Ford Kuga 72 6.8 1.3 1.2 11%
company DE Mini Countryman 25 7.8 1.8 1.7 13%
company DE Mercedes A 250 e 8G-DCT 18 3.3 1.4 1.0 60%
company DE Mercedes A Class 23 7.1 1.4 1.0 13%
company DE Mercedes C 300 de T 9G-T 13 5.7 1.4 1.3 15%
company DE Mercedes C 300 e T 9G-TR 6 8.1 1.8 1.6 6%
company DE Mercedes C Class 123 6.8 1.7 1.4 13%

31 ICCT WHITE PAPER | REAL-WORLD USAGE OF PLUG-IN HYBRID VEHICLES IN EUROPE
User group Country Make Model N FCreal NEDC WLTP EDS
company DE Mercedes CLA 7 6.4 1.4 1.0 25%
company DE Mercedes E 300 de 9G-TRO 11 6.2 1.6 1.3 13%
company DE Mercedes E 300 de T 9G-T 11 5.8 1.6 1.3 20%
company DE Mercedes E Class 229 7.4 1.8 1.4 10%
company DE Mercedes E 300 de 4MATIC T model 6 4.9 1.7 1.4 32%
company DE Mercedes GLC 151 9.2 2.3 2.0 6%
company DE Mercedes GLC 300 e 4MATIC 5 6.3 2.2 2.1 33%
company DE Mercedes GLC Coupé 300 e 5 9.4 2.2 2.1 0%
company DE Mercedes GLE 12 10.6 1.5 0.8 5%
company DE Mitsubishi Outlander 23 7.9 1.8 6%
company DE Opel Grandland 94 8.5 1.5 1.4 4%
company DE Peugeot 3008 9 7.7 1.5 1.3 14%
company DE Renault Mégane 5 5.7 1.3 16%
company DE Skoda Superb Combi 1.4 10 6.2 1.4 1.3 22%
company DE Skoda Superb 143 7.4 1.7 1.5 14%
company DE Skoda Octavia 13 7.2 1.4 1.1 5%
company DE VW Golf GTE 10 6.2 1.7 1.6 36%
company DE VW Passat Variant 28 6.1 1.4 1.2 19%
company DE VW Passat 72 6.4 1.5 1.2 13%
company DE VW Tiguan (II) (from 09/20) 31 7.8 1.5 1.6 4%
company DE Volvo V60 15 7.7 1.7 1.9 15%
company DE Volvo V90 29 10.3 2.0 2.0 4%
company DE Volvo XC40 25 8.3 1.8 2.1 6%
company DE Volvo XC40 T5 Recharge 6 5.3 1.8 2.0 37%
company DE Volvo XC60 28 9.2 2.1 2.7 8%
company DE Volvo XC90 25 10.3 2.2 3.1 6%
company RoE BMW 5 Series 6 6.2 2.0 1.7 23%
company RoE BMW X3 6 6.2 2.1 2.1 32%
company RoE Mercedes E 300 de 60 6.8 1.6 1.3 5%
company RoE Mercedes GLC 40 7.3 2.3 2.1 22%
Notes: DE – Germany, RoE – rest of Europe, FC values are mean combined fuel consumption.

32 ICCT WHITE PAPER | REAL-WORLD USAGE OF PLUG-IN HYBRID VEHICLES IN EUROPE
APPENDIX B: DETAILS ON THE DERIVATION OF THE ELECTRIC DRIVING SHARE
REAL-WORLD ELECTRIC DRIVING SHAREAs introduced in Section 2.3, the real-world electric driving share EDSreal is defined as the share of the total distance disttotal
real purely driven on electricity distelectricreal .
EDSreal = distelectric
real
disttotalreal
Most PHEVs can be operated in three modes:
» Charge-sustaining (CS) mode, where the battery state of charge (SoC) is kept constant and the propulsion energy stems from the combustion engine.
» Charge-depleting (CD) mode, where mainly the electric energy stored in the battery propels the vehicle.
» Charge-increasing (CI) mode, where the combustion engine is used to propel the vehicle and increase the battery SoC at the same time.
While the combustion engine is almost continuously used in CS and CI mode, consuming fuel quantity FCS
real and FCIreal , respectively, in CD mode the electric motor
and combustion engine can be operated in parallel. Therefore, to derive the equivalent purely electric driving distance, distelectric
real , the CD mode needs to be mathematically split into a purely electric driving part of distance, distCD,electric
real , with zero fuel consumption and a part that can be attributed to the exclusive usage of the combustion engine distCD,ICE
real consuming fuel quantity FCCD,ICEreal . The total fuel consumed over the lifetime of a
vehicle (in L) is then Ftotalreal = FCS
real + FCIreal + FCD,ICE
real .
With the fuel consumed in a specific drive mode i, Fi being the product of the fuel consumption in that mode FCi (in L/100 km) and the distance driven in that mode disti, we arrive at the following equation:
FCtotalreal × disttotal
real = FCCSreal × distCS
real + FCCIreal × distCI
real + FCCD,ICEreal × distCD,ICE
real
with disttotalreal = distCD,electric
real + distCD,ICEreal + distCS
real + distCIreal.
Since the CI mode has to be activated by the driver after each restart of the car and results in substantial fuel consumption, we assume for our analysis that the CI mode is not used very often. That means that distCI << (distCS + distCD) and we therefore neglect the CI term of the equations.
Following the assumptions made in the WLTP type-approval regulation when calculating the equivalent all-electric range (EAER), we assume the distance specific fuel consumption FCCD,ICE
real to be the same as the fuel consumption in charge-sustaining mode FCCS
real.
Applying these assumptions results in:
FCtotalreal × disttotal
real = FCCSreal × distCS
real + FCCSreal × distCD,ICE
real and
distelectricreal = distCD,electric
real = disttotalreal – distCS
real – distCD,ICEreal
Combing these equations, we arrive at:
distelectricreal
disttotalreal = 1 –
FCtotalreal
FCCSreal

33 ICCT WHITE PAPER | REAL-WORLD USAGE OF PLUG-IN HYBRID VEHICLES IN EUROPE
Hence, the definition of EDSreal = distelectric
real
disttotalreal is equivalent to EDSreal = 1 –
FCtotalreal
FCCSreal.
FCtotalreal is the average fuel consumption of a vehicle in real-world usage, as found in the
real-world fuel consumption datasets, and FCCSreal is the real-world fuel consumption in
charge-sustaining mode and can be estimated from type-approval values as follows.12
REAL-WORLD FUEL CONSUMPTION IN CHARGE-SUSTAINING MODEThe fuel consumption in CS mode FCCS
real represents the fuel consumption of a PHEV that is never charged. In this mode, the vehicle operates the same as a not externally chargeable hybrid electric vehicle (HEV). Therefore, we approximate the real-world CS fuel consumption from the type-approval CS mode fuel consumption of a PHEV model and the real-world to type-approval fuel consumption gap of comparable HEVs. According to Tietge et al. (2019), the real-world fuel consumption of HEVs is on average 47% higher than the NEDC type-approval values. It thus follows:
FCCSreal = 1.47 × FCCS
NEDC
using the NEDC CS mode fuel consumption FCCSNEDC, that can be derived as described in
the NEDC section below.
Similarly, the real-world CS mode fuel consumption can be approximated from the WLTP CS mode fuel consumption FCCS
WLTP. However, as no data on the average deviation of the real-world and type-approval fuel consumption for WLTP-certified HEVs was available, we took the following approach. First, we filtered our database for PHEV models for which both NEDC and WLTP type-approval values were available (183 models). Then, we calculated the average real-world to WLTP type-approval fuel consumption ratio in CS mode rCS
WLTP considering the NEDC real-world to type-approval ratio of 1.47 as follows:
rCSWLTP =
ΣFCCSreal
ΣFCCSWLTP
= 1.47 × ΣFCCS
NEDC
ΣFCCSWLTP
.
When determining the WLTP and NEDC CS mode fuel consumption as described in the following two sections, we find an average WLTP real-world to type-approval gap in CS mode of 23%:
FCCSreal = 1.23 × FCCS
WLTP.
Considering that the real-world to type-approval factors are fleet average values, we estimate the real-world CS mode fuel consumption of vehicles having both NEDC and WLTP type-approval values as the mean real-world value calculated from NEDC and WLTP CS mode fuel consumption as follows:
FCCSreal = 12 (1.47 × FCCS
NEDC + 1.23 × FCCSWLTP)
NEDC FUEL CONSUMPTION IN CHARGE-SUSTAINING MODEIn the NEDC procedure, the fuel and electricity consumption in the CD mode can be determined driving only a single test cycle (about 11 km).13 Given the relatively mild testing conditions and short distance, most PHEV models are expected to complete this cycle driving purely electric. As a result, the NEDC procedure neglects potential
12 FCCSreal can be determined by driving a vehicle purely on gasoline/diesel. It is then used like a not rechargeable
full hybrid electric vehicle.13 The certification process in charge-depleting (CD) mode starts with a fully charged battery and drives
exclusively electrically as long as the performance of the powertrain and the energy of the battery allow it.

34 ICCT WHITE PAPER | REAL-WORLD USAGE OF PLUG-IN HYBRID VEHICLES IN EUROPE
CD mode fuel consumption that could occur during longer-distance driving or under more demanding usage conditions.
The combined PHEV NEDC fuel consumption then calculates as
FCcomb.NEDC = (1 – UFNEDC) × FCCS
NEDC
with the Utility Factor (UF) being defined as
UFNEDC = AERNEDC/ (AERNEDC + 25 km).
The all-electric range AERNEDC is determined in a separate test.
FCcomb.NEDC and AERNEDC are publicly available and can be found for many vehicles in the
ADAC Autokatalog database. Therefore, FCCSNEDC can be calculated as:
FCCSNEDC = FCcomb.
NEDC/(1 – UFNEDC).
WLTP FUEL CONSUMPTION IN CHARGE-SUSTAINING MODEIn WLTP, the fuel and electricity consumption in the charge-depleting (CD) mode is determined over multiple test cycles, starting with a fully charged battery and ending when the battery is drained. In contrast to the NEDC procedure, any fuel consumed towards the end of the CD phase is measured and a non-zero CD mode fuel consumption FCCD
WLTP can be determined. The corresponding distance is the CD mode range distCD. In an additional WLTP test, the fuel consumption in CS mode FCCS
WLTP is determined.
From the CD and CS mode fuel consumption, the equivalent all-electric range EAERWLTP is calculated, which is the distance in CD mode that can be attributed to the use of externally charged electricity.
The combined WLTP fuel consumption is then calculated as
FCcomb.WLTP = UFCD
WLTP × FCCDWLTP + (1 – UFCD
WLTP) × FCCSWLTP
with UF being the Utility Factor.
The UF in WLTP corresponds to the share of driving in CD mode and is as a function of the CD mode range, as defined in the Commission Regulation (EU) 2017/1151 (European Commission, 2017).
Only FCcomb.WLTPand EAERWLTP is published by the car manufacturer while FCCD
WLTP, FCCSWLTP,
UFCDWLTP and distCD are usually not publicly available.
To estimate FCCSWLTP from the publicly available data, we assume the CD mode range
distCD can be split into a pure electric and an ICE powered part.
Using a piecewise linearized UF gradient, we consider the combined WLTP fuel consumption as
FCcomb.WLTP = UFCD,electric
WLTP × FCCD,electricWLTP + (UFCD
WLTP – UFCD,electricWLTP ) × FCCD,ICE
WLTP + (1 – UFCDWLTP ) × FCCS
WLTP
The fuel consumption in the pure electric part FCCD,electricWLTP is zero by definition. Following
the approach taken in the WLTP regulation when calculating the EAER, we assume the fuel consumption during the part attributable to ICE power FCCD,ICE
WLTP to be the same as the fuel consumption in charge-sustaining mode FCCS
WLTP.

35 ICCT WHITE PAPER | REAL-WORLD USAGE OF PLUG-IN HYBRID VEHICLES IN EUROPE
Given that the EAER is the distance attributable solely to the use of electric energy, UFCD,electric
WLTP can be approximated with the UF function of Commission Regulation (EU) 2017/1151 (European Commission, 2017) but using the EAER instead of the distance in CD mode RCDC. Applying these assumptions and resolving the formula above for FCcomb.
WLTP results in:
FCCSWLTP = FCcomb.
WLTP/(1 – UFCD,electricWLTP )
To validate our approach, we use type-approval values FCcomb.WLTP, and FCCS
WLTP as well as EAERWLTP that have been found for certain vehicle models (Cambria Automobiles, 2022). While we focus on the most relevant PHEV models, we use 29 vehicle models for validation. This includes different segments from compact (e.g., Audi A3, BMW Series 2, VW Golf) and medium segment (e.g., Mercedes-Benz C-Class, VW Passat, Toyota Prius, Volvo V60) to SUVs (e.g., Mitsubishi Outlander, Mercedes-Benz GLC, Audi Q5, Ford Kuga, Volvo XC90) and both gasoline and diesel ICEs. We used the above equations to calculate FCCS
WLTP from FCcomb.WLTP and EAERWLTP and compare it with the
type-approval value of FCCSWLTP. The comparison shows minor errors as deviations range
from 0.3% (median) to 1.5% (mean), a standard deviation of 4.6% and a correlation coefficient of 93%. With our assumptions FCCS
WLTP is overestimated for 14 vehicles and underestimated for 15 vehicles. Therefore, we consider our WLTP approximation to be sufficiently accurate.

36 ICCT WHITE PAPER | REAL-WORLD USAGE OF PLUG-IN HYBRID VEHICLES IN EUROPE
APPENDIX C: REGRESSION RESULTSThe regression analysis uses either individual vehicle data or aggregated data. Variables inside the tables indicate the effect of different variables (EAER, system power, user group, and build year) on the value of interest (real-world fuel consumption or EDS). Adding further controls shows how robust the coefficients are towards the integration of further control variables. These further control variables are vehicle mass, country, segment, body type, or annual VKT, either in an individual analysis or combined (see list of considered variables in the specific table). Section C1 examines the real-world fuel consumption (logarithmic values) as depended variable (Tables C1 to C2 with sample size-weighted aggregated data, Tables C3 to C6 with individual vehicle data). Section C2 examines the real-world EDS as depended variable (Tables C7 to C10, all with sample-size weighted aggregated data).
C.1 DEPENDENT VARIABLE: LOG OF REAL-WORLD FUEL CONSUMPTION
Aggregated vehicle data regressionTable C1. Regression results for log of real-world fuel consumption with sample size-weighted weighted least squares.
Term Estimate Std. error p-Value
(Intercept) -161.39 24.04 <0.0001
WLTP EAER (in 10 km) -0.129 0.008 <0.0001
System power (in 10 kW) 0.030 0.002 <0.0001
User group private -0.503 0.024 <0.0001
Build year 0.081 0.012 <0.0001
Notes: Multiple R-squared: 0.6028, Adjusted R-squared: 0.6009, F-statistic: 311.9 on 4 and 822 degrees of freedom (DF), p-value: < 2.2e-16

37 ICCT WHITE PAPER | REAL-WORLD USAGE OF PLUG-IN HYBRID VEHICLES IN EUROPE
Table C2. Regression results for log of real-world fuel consumption with sample size-weighted least squares.
Term Estimate Std. error p-Value
(Intercept) -135.9 24.2 <0.0001
WLTP EAER (in 10 km) -0.126 0.007 <0.0001
System power (in 10 kW) 0.03 0.002 <0.0001
User group private -0.446 0.025 <0.0001
Build year 0.068 0.012 <0.0001
Country Austria -0.02 0.078 0.796
Country Belgium -0.037 0.096 0.704
Country Bulgaria 0.118 0.234 0.613
Country Croatia 0.218 0.397 0.583
Country Czech Republic -0.241 0.170 0.158
Country Denmark -0.046 0.113 0.681
Country Estonia -0.079 0.397 0.842
Country Finland -0.33 0.093 <0.0001
Country France 0.079 0.077 0.304
Country Germany 0.078 0.060 0.194
Country Greece -0.188 0.284 0.509
Country Hungary -0.049 0.126 0.694
Country Italy -0.24 0.093 0.010
Country Lithuania -0.041 0.397 0.919
Country Luxembourg 0.023 0.152 0.880
Country Netherlands 0.017 0.143 0.903
Country Norway 0.056 0.205 0.783
Country Poland 0.264 0.285 0.354
Country Portugal 0.04 0.159 0.802
Country Romania -0.117 0.234 0.617
Country Slovakia 0.228 0.284 0.422
Country Spain -0.061 0.102 0.546
Country Sweden -0.2 0.128 0.117
Country Switzerland -0.227 0.090 0.011
Country United Kingdom -0.248 0.122 0.043
Notes: Multiple R-squared: 0.6395, Adjusted R-squared: 0.6263, F-statistic: 48.74 on 29 and 797 DF, p-value: < 2.2e-16
Individual vehicle data regressionTable C3. Regression results for log of real-world fuel consumption.
Term Estimate Std. error p-Value
(Intercept) -143.0 13.4 <0.0001
WLTP EAER (in 10 km) -0.110 0.005 <0.0001
System power (in 10 kW) 0.033 0.001 <0.0001
User group private -0.572 0.011 <0.0001
Build year 0.072 0.007 <0.0001
Notes: Multiple R-squared: 0.5756, Adjusted R-squared: 0.5752, F-statistic: 1370 on 4 and 4042 DF, p-value: < 2.2e-16

38 ICCT WHITE PAPER | REAL-WORLD USAGE OF PLUG-IN HYBRID VEHICLES IN EUROPE
Table C4. Regression results for log of real-world fuel consumption.
Term Estimate Std. error p-Value
(Intercept) -147.8 13.2 <0.0001
WLTP EAER (in 10 km) -0.105 0.005 <0.0001
System power (in 10 kW) 0.010 0.002 <0.0001
User group private -0.546 0.011 <0.0001
Build year 0.074 0.007 <0.0001
Mass (in kg) 0.001 0.0 <0.0001
Segment medium 0.449 0.05 <0.0001
Segment upper medium 0.446 0.051 <0.0001
Segment luxury 0.504 0.089 <0.0001
Segment lower medium 0.45 0.048 <0.0001
Notes: Multiple R-squared: 0.5756, Adjusted R-squared: 0.5752, F-statistic: 1370 on 4 and 4042 DF, p-value: < 2.2e-16

39 ICCT WHITE PAPER | REAL-WORLD USAGE OF PLUG-IN HYBRID VEHICLES IN EUROPE
Table C5. Regression results for log of real-world fuel consumption.
Term Estimate Std. error p-value
(Intercept) -134.768 13.273 <0.0001
WLTP EAER (in 10 km) -0.099 0.005 <0.0001
System power (in 10 kW) 0.010 0.002 <0.0001
User group private -0.530 0.012 <0.0001
Build year 0.067 0.007 <0.0001
Mass (in 100 kg) 0.0588 0.0049 <0.0001
Segment medium 0.394 0.050 <0.0001
Segment upper medium 0.386 0.051 <0.0001
Segment luxury 0.454 0.088 <0.0001
Segment lower medium 0.386 0.049 <0.0001
Country Austria -0.197 0.072 0.006
Country Belgium -0.120 0.087 0.168
Country Bulgaria 0.035 0.200 0.862
Country Croatia 0.145 0.336 0.666
Country Czech Republic -0.369 0.148 0.013
Country Denmark -0.161 0.094 0.086
Country Estonia -0.132 0.336 0.694
Country Finland -0.409 0.084 0.000
Country France 0.103 0.067 0.126
Country Germany -0.049 0.061 0.420
Country Greece -0.254 0.241 0.291
Country Hungary -0.120 0.110 0.273
Country Italy -0.272 0.083 0.001
Country Lithuania -0.092 0.335 0.785
Country Luxembourg -0.123 0.125 0.327
Country Netherlands -0.022 0.125 0.861
Country Norway -0.030 0.176 0.863
Country Poland 0.195 0.241 0.420
Country Portugal -0.007 0.139 0.961
Country Romania -0.197 0.200 0.325
Country Slovakia 0.128 0.241 0.597
Country Spain -0.174 0.091 0.055
Country Sweden -0.261 0.113 0.021
Country Switzerland -0.318 0.081 <0.0001
Country United Kingdom -0.629 0.104 <0.0001
Notes: Multiple R-squared: 0.6165, Adjusted R-squared: 0.6131, F-statistic: 184.2 on 35 and 4011 DF, p-value: < 2.2e-16.

40 ICCT WHITE PAPER | REAL-WORLD USAGE OF PLUG-IN HYBRID VEHICLES IN EUROPE
Table C6. Regression results for log of real-world fuel consumption.
Term Estimate Std. error p-Value
(Intercept) -158.183 13.841 <0.0001
WLTP EAER (in 10 km) -0.110 0.005 <0.0001
System power (in 10 kW) 0.013 0.002 <0.0001
User group private -0.553 0.011 <0.0001
Build year 0.079 0.007 <0.0001
Mass (in kg) 0.001 0.000 <0.0001
Body type station wagon -0.303 0.195 0.122
Body type roadster -0.273 0.391 0.486
Body type SUV -0.245 0.195 0.209
Body type hatchback -0.345 0.196 0.078
Body type notchback -0.197 0.196 0.315
Body type van -0.252 0.197 0.201
Notes: Multiple R-squared: 0.5959, Adjusted R-squared: 0.5948, F-statistic: 540.9 on 11 and 4035 DF, p-value: < 2.2e-16.

41 ICCT WHITE PAPER | REAL-WORLD USAGE OF PLUG-IN HYBRID VEHICLES IN EUROPE
C.2 DEPENDENT VARIABLE: EDS
Aggregated vehicle data regressionThe following tables summarize the regression results from the quasi binomial generalized linear models with robust standard errors.
Table C7. Regression results for EDS with sample size-weighted least squares.
Term Estimate Std. error p-Value
(Intercept) 195.90 56.5 0.001
WLTP EAER (in 10 km) 0.161 0.020 <0.0001
System power (in 10 kW) -0.023 0.004 <0.0001
User group private 1.693 0.082 <0.0001
Build year -0.098 0.028 <0.0001
Table C8. Regression results for EDS with sample size-weighted least squares.
Term Estimate Std. error p-Value
(Intercept) 175.613 56.367 0.002
WLTP EAR (in 10 km) 0.161 0.019 <0.0001
System power (in 10 kW) -0.025 0.004 <0.0001
User group private 1.601 0.082 <0.0001
Build year -0.088 0.028 0.002
Country Austria 0.200 0.161 0.215
Country Belgium 0.083 0.168 0.620
Country Bulgaria -0.189 0.474 0.690
Country Croatia -0.125 0.126 0.318
Country Czech Republic 0.590 0.247 0.017
Country Denmark 0.170 0.186 0.361
Country Estonia 0.227 0.130 0.081
Country Finland 0.548 0.175 0.002
Country France -0.417 0.208 0.046
Country Germany -0.095 0.130 0.468
Country Greece 0.398 0.383 0.299
Country Hungary 0.256 0.193 0.185
Country Italy 0.585 0.162 <0.0001
Country Lithuania 0.019 0.129 0.881
Country Luxembourg -0.129 0.342 0.707
Country Netherlands 0.151 0.201 0.450
Country Norway -0.089 0.316 0.777
Country Poland -0.309 0.456 0.498
Country Portugal 0.079 0.234 0.734
Country Romania 0.286 0.364 0.432
Country Slovakia -0.865 0.608 0.155
Country Spain 0.142 0.183 0.438
Country Sweden 0.396 0.186 0.034
Country Switzerland 0.615 0.161 <0.0001
Country United Kingdom 0.059 0.347 0.866

42 ICCT WHITE PAPER | REAL-WORLD USAGE OF PLUG-IN HYBRID VEHICLES IN EUROPE
Table C9. Regression results for EDS with sample size-weighted least squares
Term Estimate Std. error p-Value
(Intercept) 176.027 56.108 0.002
WLTP EAER (in 10 km) 0.166 0.019 <0.0001
System power (in 10 kW) -0.010 0.008 0.217
User group private 1.594 0.082 <0.0001
Build year -0.088 0.028 0.002
Mass (in 100 kg) -0.042 0.019 0.025
Country Austria 0.213 0.161 0.184
Country Belgium 0.081 0.168 0.630
Country Bulgaria -0.201 0.473 0.670
Country Croatia -0.137 0.125 0.271
Country Czech Republic 0.610 0.252 0.016
Country Denmark 0.159 0.185 0.389
Country Estonia 0.163 0.132 0.217
Country Finland 0.542 0.175 0.002
Country France -0.426 0.209 0.041
Country Germany -0.102 0.129 0.432
Country Greece 0.392 0.362 0.279
Country Hungary 0.244 0.190 0.198
Country Italy 0.587 0.161 <0.0001
Country Lithuania 0.005 0.129 0.966
Country Luxembourg -0.127 0.336 0.705
Country Netherlands 0.154 0.194 0.426
Country Norway -0.098 0.335 0.770
Country Poland -0.326 0.490 0.505
Country Portugal 0.059 0.232 0.798
Country Romania 0.289 0.376 0.443
Country Slovakia -0.850 0.622 0.172
Country Spain 0.145 0.185 0.433
Country Sweden 0.366 0.182 0.045
Country Switzerland 0.611 0.160 <0.0001
Country United Kingdom 0.066 0.339 0.845

43 ICCT WHITE PAPER | REAL-WORLD USAGE OF PLUG-IN HYBRID VEHICLES IN EUROPE
Table C10. Regression results for EDS with sample size-weighted least squares.
Term Estimate Std. error p-Value
(Intercept) 130.880 55.809 0.019
WLTP EAER (in 10 km) 0.168 0.019 <0.0001
System power (in 10 kW) -0.011 0.007 0.132
User group private 1.710 0.092 <0.0001
Build year -0.066 0.028 0.017
Mass (in 100 kg) -0.034 0.018 0.058
Annual VKT (in 1,000 km) -0.016 0.003 <0.0001
Country Austria 0.285 0.158 0.071
Country Belgium 0.137 0.165 0.406
Country Bulgaria -0.174 0.406 0.667
Country Croatia -0.090 0.120 0.453
Country Czech Republic 0.742 0.250 0.003
Country Denmark 0.244 0.184 0.186
Country Estonia 0.410 0.138 0.003
Country Finland 0.606 0.178 0.001
Country France 0.021 0.177 0.906
Country Germany -0.071 0.124 0.564
Country Greece 0.270 0.355 0.447
Country Hungary 0.316 0.191 0.097
Country Italy 0.580 0.159 <0.0001
Country Lithuania -0.002 0.123 0.989
Country Luxembourg -0.043 0.372 0.909
Country Netherlands 0.178 0.191 0.351
Country Norway -0.176 0.332 0.596
Country Poland -0.117 0.265 0.659
Country Portugal 0.043 0.242 0.860
Country Romania 0.416 0.340 0.222
Country Slovakia -0.794 0.614 0.196
Country Spain 0.187 0.183 0.309
Country Sweden 0.564 0.182 0.002
Country Switzerland 0.601 0.154 <0.0001
Country United Kingdom 0.076 0.327 0.817

44 ICCT WHITE PAPER | REAL-WORLD USAGE OF PLUG-IN HYBRID VEHICLES IN EUROPE
APPENDIX D: CONTRIBUTION OF INDIVIDUAL FACTORS TO THE DEVIATION OF REAL-WORLD AND NEDC FUEL CONSUMPTIONWe start with typical average fuel consumption values of 4.2 L/100 km for private and 8.0 L/100 km for company PHEVs. As described on Section 2.3, we assume that the real-world fuel consumption when driving on fuel, approximated with the CS mode fuel consumption, deviates from NEDC CS mode fuel consumption by 47%. Thereby, already 32% of the difference in real-world and type-approval fuel consumption, which is +1.3 L/100 km for private cars and +2.6 L/100 km for company cars, can be attributed to the deviation of real-world and type-approval CS mode fuel consumption values. Note that the contribution of the difference in fuel consumption when driving on fuel, i.e., in CS mode, is proportional to the fuel consumption resulting from the realized EDS. The higher value for company than for private cars is directly linked to their lower EDS.
Next, we estimate the effect of the all-electric range (AER) being lower in real-world than in NEDC type-approval. Here, we first set EDSNEDC equal to UFNEDC, i.e., UFNEDC = AERNEDC / (AERNEDC + 25 km) (see Section 2.3). Next, we take the NEDC UF factor curve (see Section 2.3) and assume a 35 km real-world all-electric range (-25%) instead of 50 km as typical AERNEDC. This yields in a –9 percentage points lower EDS for both user groups. PHEVs with typical NEDC type-approval values of 1.7 L/100 km for private and 1.9 L/100 km for company cars, this results in an increase in fuel consumption of +0.3 L/100 km for private and +0.4 L/100 km company cars.
Finally, we assign the remainder of the difference of real-world and type-approval values to user behavior that especially covers a lower charging frequency and potentially a higher share of long-distance driving than considered in the type-approval value. By further lowering the realized EDS, these factors contribute to the deviation of the fuel consumption by +0.8 L/100 km for private and +3.2 L/100 km for company cars.
Table D1. Factors impacting average real-world fuel consumption.
Factor
Fuel consumption (L/100 km)
Private cars Company cars
NEDC 1.7 1.9
32% lower all-electric range +0.3 +0.4
Less charging and more long-distance driving +0.8 +3.2
47% higher CS mode fuel consumption +1.3 +2.6
Real-world usage 4.2 8.0

45 ICCT WHITE PAPER | REAL-WORLD USAGE OF PLUG-IN HYBRID VEHICLES IN EUROPE
APPENDIX E: ONLINE PHEV FLEET SURVEY QUESTIONNAIREHere, we reproduce the main questions for PHEV fleet managers used in the present study. The following items were asked in an online survey about the three most common PHEV models in the fleet managers’ car fleet.
» From what brand is the most frequent plug-in hybrid in your fleet? For example: VW, Ford, Audi, Seat.
» What model is the most frequent plug-in hybrid in your fleet? For example: Golf, Kuga, A3, Leon.
» What is the official electric range of this model?
» How many plug-in hybrids of this model are in your fleet?
» Is this model in your fleet a company car or a fleet vehicle? By company cars we mean vehicles that are permanently assigned to a person and may also be used for private purposes. By fleet vehicles we mean vehicles that are only used for business purposes and have no fixed assignment to people.
1 Company car only
2 Mainly company car
3 Approximately an equal
4 Mainly fleet vehicle
5 Fleet vehicle only
» What is the average real-world fuel consumption of this plug-in hybrid model in your fleet in liters/100 km?
• 0 – 0,5
• 0,6 – 1,0
• 1,1 – 1,5
• 1,6 – 2,0
• 2,1 – 2,5
• 2,6 – 3,0
• 3,1 – 3,5
• 3,6 – 4,0
• 4,1 – 4,5
• 4,6 – 5,0
• 5,1 – 5,5
• 5,6 – 6,0
• 6,1 – 6,5
• 6,6 – 7,0
• 7,1 – 7,5
• 7,6 – 8,0
• 8,1 – 8,5
• 8,6 – 9,0
• 9,1 – 9,5
• 9,6 – 10,0
• >10,0 L/100 km
» On average: What proportion of the total distance is covered by this plug-in hybrid purely electrically, i.e. without the combustion engine running?
< 5 %, 6 – 15%, 16 – 25%, 26 – 35 %, 36 – 45 %, 46 – 55 %, 56 – 65 %, 66 – 75 %, 76 – 85%, 86 – 95 %, > 95 %
» What is the average annual mileage of this plug-in hybrid model in your fleet?
The answer to the question about the real-world fuel consumption together with the number of this PHEV model in the respondent’s fleet were mainly used in the analysis. The others served to validate the other items.