Fuel Economy and CO2 Emissions of Light-Duty Vehicles in ...
22
1 Fuel Economy and CO 2 Emissions of Light-Duty Vehicles in Bahrain Prepared by Maha Mahmood Alsabbagh Centre for Environment and Development in the Arab Region and Europe (CEDARE)
-
Upload
khangminh22 -
Category
Documents
-
view
1 -
download
0
Transcript of Fuel Economy and CO2 Emissions of Light-Duty Vehicles in ...
1
Fuel Economy and CO2 Emissions of Light-Duty Vehicles in Bahrain
Prepared by Maha Mahmood Alsabbagh
Centre for Environment and Development in the Arab Region and Europe (CEDARE)

2
Table of Contents
1. Introduction ................................................................................................................................. 4 2. Transport Sector in Bahrain.......................................................................................................... 5 3. Methods ...................................................................................................................................... 7 4. Results and Discussion ................................................................................................................. 8 5. Conclusions ................................................................................................................................ 12 References ........................................................................................................................................ 13 Annex 1: Methodology ...................................................................................................................... 15 1. Obtain vehicle registration data: ................................................................................................ 15 2. Cleaning data: ............................................................................................................................ 15 3. Structure the data set: ............................................................................................................... 16 4. Estimate baseline fuel economy and CO2 emissions ................................................................... 17 Annex 2: Sample of the data .............................................................................................................. 19 Annex 3: Tables ................................................................................................................................. 20
List of Tables
Table 1: Types of LDVs ........................................................................................................................... 15 Table 2: Data sources and contacts ........................................................................................................ 16 Table 3: Total number of LDVs used for the calculations ........................................................................ 17 Table 4: Passenger vehicle number vs. population size and real GDP in Bahrain between 2000 and 2010............................................................................................................................................................... 20 Table 5: Gasoline consumption in Bahrain between 2000 and 2010 (TJ) ................................................ 20 Table 6: Total number of registered vehicles in Bahrain between 2000 and 2012 .................................. 20 Table 7: Carbon emissions from transport sector in Bahrain between 2000 and 2010 ............................ 21 Table 8: Average fuel economy (L/100km) and CO2 emissions (g/km) for new LDVs in Bahrain .............. 21 Table 9: A comparison between the average fuel economy of new LDVs registered in Bahrain, USA, OECD, and non-OECD countries in 2005, 2008, 2010 and 2012 (L/100 km, CAFE) ................................... 21 Table 10: A comparison between the average fuel economy of new LDVs registered in Bahrain, OECD, and non-OECD countries in 2005, 2008, 2010 and 2012 (L/100 km, CAFE) ............................................. 21 Table 11: A comparison between the average CO2 emissions from new models of passenger vehicles in the EU and Bahrain in 2005, 2008, 2010 and 2012 (g CO2/km) .............................................................. 22 Table 12: Total new vehicles, new LDVs and gasoline LDVs in Bahrain in 2005, 2008, 2010 and 2012 ..... 22 Table 13: Average curb weight and engine size of new LDVs in Bahrain in 2005, 2008, 2010 and 2012 .. 22 Table 14: Number of new LDVs per year of first registration .................................................................. 22

3
List of Figures
Figure 1: Passenger vehicle number vs. population size and real GDP in Bahrain between 2000 and 2010................................................................................................................................................................. 5 Figure 2: Gasoline consumption in Bahrain between 2000 and 2010 (TJ) ................................................. 6 Figure 3: Total number of registered vehicles in Bahrain between 2000 and 2012 ................................... 6 Figure 4: Carbon emissions from transport sector in Bahrain between 2000 and 2010 ............................ 7 Figure 5: Average fuel economy (L/100km) and CO2 emissions (g/km) for new LDVs in Bahrain .............. 8 Figure 6: A comparison between the average fuel economy of new LDVs registered in Bahrain and USA in 2005, 2008, 2010 and 2012 (L/100 km, CAFE) .......................................................................................... 9 Figure 7: : A comparison between the average fuel economy of new LDVs registered in Bahrain, OECD, and non-OECD countries in 2005, 2008, 2010 and 2012 (L/100 km, NEDC) .............................................. 9 Figure 8: A comparison between the average CO2 emissions from new models of passenger vehicles in the EU and Bahrain in 2005, 2008, 2010 and 2012 (g CO2/km) .............................................................. 10 Figure 9: Total new LDVs and other types in Bahrain in 2005, 2008, 2010 and 2012 ............................... 10 Figure 10: Average curb weight and engine size of new LDVs in Bahrain in 2005, 2008, 2010 and 2012 . 11 Figure 11: Number of new LDVs per year of first registration ................................................................. 11
4
1. Introduction
The transport sector is responsible for 27 % of the world energy consumption (IEA, 2012a). This proportion has increased from 23% in 1973 (IEA, 2011) and contributes to 22 % of total CO2 emissions (IEA, 2012b). Many countries worldwide have fuel economy or CO2 emissions standards in place to improve vehicle efficiency. A number of initiatives around the world are also introduced to help countries with regard to fuel economy standards, data availability and calculation methodologies. The Global Fuel Economy Initiative (GFEI) – for example - comes as an effort of five organizations1 to promote improvements in vehicle fuel economy. This initiative aims to achieve 50 % improvements by 2050 in all vehicles globally compared to that in the year 2005. The initiative’s main activities include: data development and analysis, policy support, and awareness raising (GFEI, 2013a). In Bahrain, as in most other countries, road transport sector is one of the highest energy consuming sectors. It consumes around 22 % of its total energy (IEA, 2012a) and is responsible for a significant share of the CO2 emissions. According to Bahrain’s Second Communication to the United Nations Framework Convention on Climate Change (UNFCCC), the CO2 emissions from transport sector has been increasing over the period 2000 - 2010 by 5.5 % in average (PMEW, 2012). This is due to the rapid increase in the number of the passenger vehicles (7.3 % per year on average) (General Directorate of Traffic, 2012) which resulted in an accelerated rise in fuel consumption (5.7 % per year on average) (CIO, 2012) in addition to the increase in the carbon emissions. Fuel consumption and CO2 emissions of passenger vehicles in Bahrain are projected to double in the year 2030 compared to 2010 (Alsabbagh et al., 2013). Sustainability and energy efficiency issues receive considerable attention from policymakers in Bahrain. These issues are stated in the National Environment Strategy, the Economic Vision 2030, and the Second Communication Report to the UNFCCC. However, no specific targets or action plans have been developed yet. There is no car manufacturing industry in the country, and Bahrain still has not introduced any CO2 emissions or fuel economy standards yet. Fuel economy and CO2 emissions are recognized as missing indicators for vehicles in Bahrain (Alsabbagh et al., 2013). Hence, this paper aims to achieve three main objectives: firstly, it supplies information on two important indicators, namely average fuel economy and CO2 emissions of new Light Duty Vehicles (LDVs) in Bahrain in 2005, 2008, 2010 and 2012. Secondly, it analyzes the fuel economy trends of new LDVs. Thirdly, this study conducts comparisons between fuel economy of new LDVs in Bahrain and that of other countries. This report consists of five sections. Section 2 of the report sheds light on transport sector in Bahrain, while the methodology is explained briefly in the subsequent section. The study results
1FIA Foundation, International Energy Agency (IEA), International Transport Forum (ITF), United Nations Environment Programme (UNEP), and the International Council on Clean Transportation (ICCT).

5
and discussion are presented in section 4 and finally, section 5 states the main conclusions along with some recommendations.
2. Transport Sector in Bahrain
Since 2000, the total vehicle number in Bahrain has grown dramatically to reach 501,481 vehicles in 2012 with an average annual growth rate of 7.3 % (General Directorate of Traffic, 2012). This is a result of the rapidly increasing population (average annual growth rate of 7.1 %) (CIO, 2011; CIO, 2012) and Gross Domestic Product (GDP) (average annual growth rate of 6%) (MOF, 2011) between 2000 and 2010. Figure 1 provides a significant, positive and very strong correlation2 between the passenger vehicle number, the population size (R2=0.99) and the real GDP (R2=0.94) in Bahrain during the period between 2000 and 2010.
Figure 1: Passenger vehicle number vs. population size and real GDP in Bahrain between 2000 and 2010
Source: CIO, 2011; CIO, 2012; MOF, 2011 Despite the upward trend in vehicle ownership (366 vehicles per 1000 population in 2010), this is relatively low when comparing this statistic to that in countries worldwide (e.g. Australia 688, UK 523, USA 802 vehicles per 1000 population). However, this trend in Bahrain is higher than that of some neighboring countries (e.g. Saudi Arabia 192, and Oman 215 vehicles per 1000 population) (IRF, 2011). Vehicles in Bahrain rely heavily on gasoline. In 2010, more than 93% of the total vehicles have gasoline engines whilst the remaining percentage uses diesel. Therefore, gasoline usage has experienced an increase in local consumption with an average annual growth rate of 5.7% during the last decade (Figure 2). This increase was a result of the dramatic increase in the number of passenger vehicles, as shown in Figure 3 (CIO, 2012). 2The correlation is significant at the 0.01 level (2-tailed)
0123456789
0
200
400
600
800
1,000
1,200
1,400
0 50 100 150 200 250 300 350 400
Billi
on B
D
Thou
sand
s peo
ple
Thousands vehiclesPopulation GDP
2010
2000

6
Figure 2: Gasoline consumption in Bahrain between 2000 and 2010 (TJ)
Source: BAPCO, 2010
Figure 3: Total number of registered vehicles in Bahrain between 2000 and 2012
Source: General Directorate of Traffic, 2012 The nearly complete reliance on gasoline has resulted in an average annual increase of 5.5 % in CO2 emissions between 2000 and 2010 (Figure 4) (PMEW, 2012; own calculations). Despite the relatively low share of the carbon emissions from transport sector at 6.8% of the country’s total emissions in 2000 (PMEW, 2012), this rate has been gradually increasing since 1994. Therefore, this emissions rate is one of a high priority to be controlled and managed.
2
3
4
5
6
2000 2001 2002 2003 2004 2005 2006 2007 2008 2009 2010
Mill
ions
TJ
200
250
300
350
400
450
500
550
2000 2001 2002 2003 2004 2005 2006 2007 2008 2009 2010 2011 2012
Thou
sand
vehi
cles

7
Figure 4: Carbon emissions from transport sector in Bahrain between 2000 and 2010
Source: PMEW, 2012; own calculations.
3. Methods
Methodology suggested by the Global Fuel Economy Initiative (no date) to construct a baseline that tracks trends in the fuel economy and CO2 emissions of new light-duty vehicles (LDVs) is used to carry out this study. LDVs include mini, small, compact, family and big cars in addition to light vans and sport utility vehicles (SUVs) (Annex 1). The new LDVs data are compiled from the General Directorate of Traffic – Ministry of Interior for the years 2005, 2008, 2010 and 2012. A sample of the data set is presented in Annex 2. The data set includes the following vehicle characteristics:
- Vehicle make and model - Model production year - Year of first registration - Fuel type - Engine size (in cubic meters – cc) - Curb weight (in kilograms – kg) - Number of cylinders - Body type - Registration plate type / use of the vehicle
A number of tasks involved with data processing and management were undertaken. Details on the sources contacted and data cleaning are available in Annex 1. It is worth noting in this context that more than 50 % of accurate emission factors and fuel economy was achieved. Details are available in Annex 1.
1000
1500
2000
2500
3000
2000 2001 2002 2003 2004 2005 2006 2007 2008 2009 2010
Gg
CO2
8
4. Results and Discussion
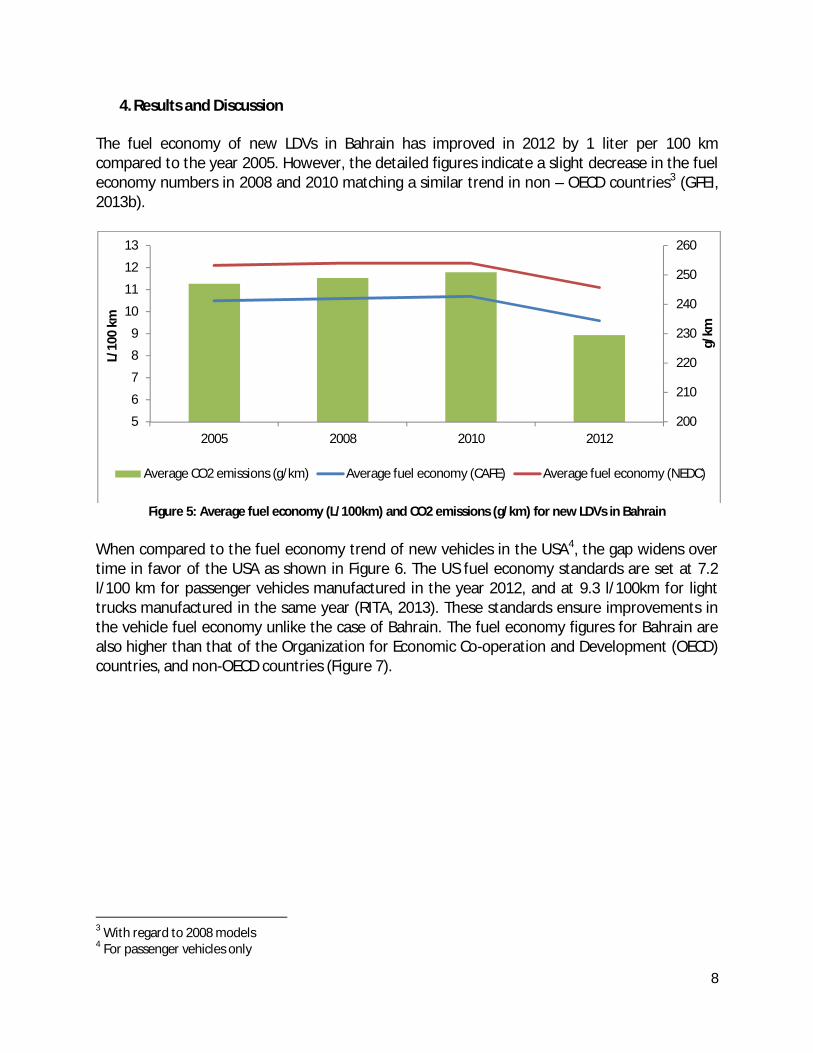
The fuel economy of new LDVs in Bahrain has improved in 2012 by 1 liter per 100 km compared to the year 2005. However, the detailed figures indicate a slight decrease in the fuel economy numbers in 2008 and 2010 matching a similar trend in non – OECD countries3 (GFEI, 2013b).
Figure 5: Average fuel economy (L/100km) and CO2 emissions (g/km) for new LDVs in Bahrain
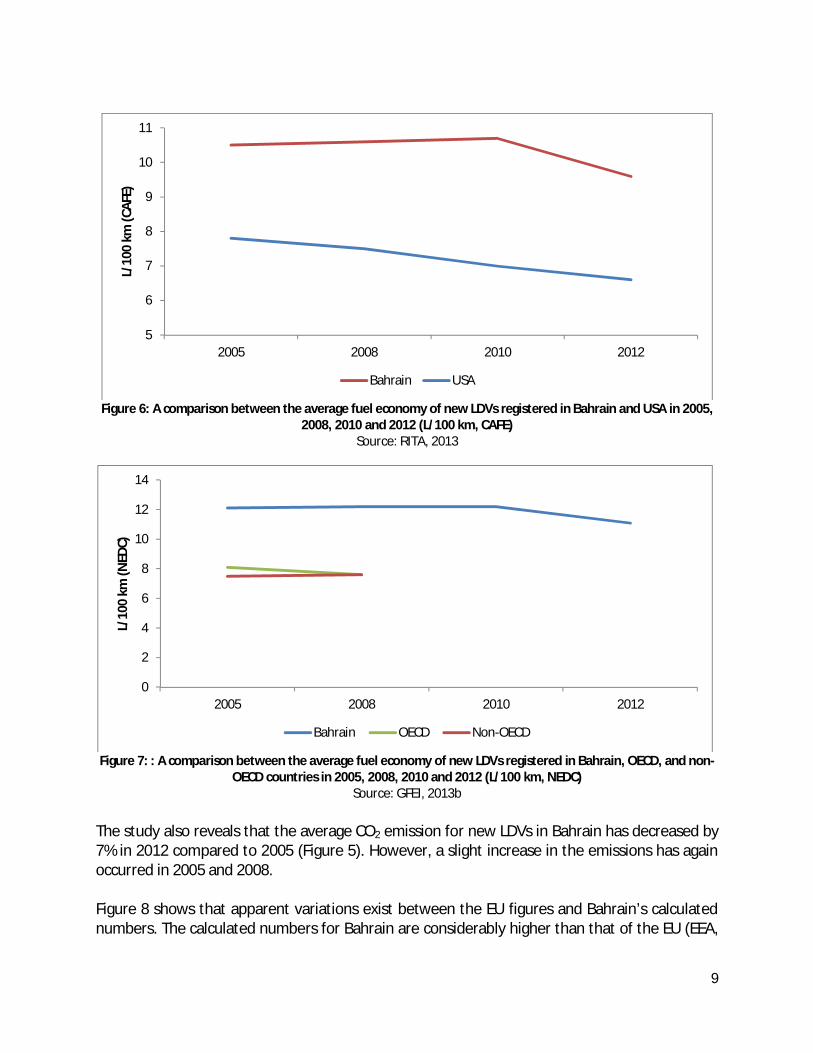
When compared to the fuel economy trend of new vehicles in the USA4, the gap widens over time in favor of the USA as shown in Figure 6. The US fuel economy standards are set at 7.2 l/100 km for passenger vehicles manufactured in the year 2012, and at 9.3 l/100km for light trucks manufactured in the same year (RITA, 2013). These standards ensure improvements in the vehicle fuel economy unlike the case of Bahrain. The fuel economy figures for Bahrain are also higher than that of the Organization for Economic Co-operation and Development (OECD) countries, and non-OECD countries (Figure 7).
3 With regard to 2008 models 4 For passenger vehicles only
200
210
220
230
240
250
260
5
6
7
8
9
10
11
12
13
2005 2008 2010 2012
g/km
L/10
0 km
Average CO2 emissions (g/km) Average fuel economy (CAFE) Average fuel economy (NEDC)
9
Figure 6: A comparison between the average fuel economy of new LDVs registered in Bahrain and USA in 2005,
2008, 2010 and 2012 (L/100 km, CAFE) Source: RITA, 2013
Figure 7: : A comparison between the average fuel economy of new LDVs registered in Bahrain, OECD, and non-
OECD countries in 2005, 2008, 2010 and 2012 (L/100 km, NEDC) Source: GFEI, 2013b
The study also reveals that the average CO2 emission for new LDVs in Bahrain has decreased by 7% in 2012 compared to 2005 (Figure 5). However, a slight increase in the emissions has again occurred in 2005 and 2008. Figure 8 shows that apparent variations exist between the EU figures and Bahrain’s calculated numbers. The calculated numbers for Bahrain are considerably higher than that of the EU (EEA,
5
6
7
8
9
10
11
2005 2008 2010 2012
L/10
0 km
(CAF
E)
Bahrain USA
0
2
4
6
8
10
12
14
2005 2008 2010 2012
L/10
0 km
(NED
C)
Bahrain OECD Non-OECD

10
2013). This could be a result of number of factors that affect the engine size and performance including dissimilar weather, consumption patterns, alternative modes of transportation, and CO2 emissions standards.
Figure 8: A comparison between the average CO2 emissions from new models of passenger vehicles in the EU
and Bahrain in 2005, 2008, 2010 and 2012 (g CO2/km) Source: EEA, 2013
The study results show that the number of new vehicles in Bahrain has grown by 19.8 % in 2012 compared to 2005 with LDVs making 82 % in average (Figure 9). New LDVs in Bahrain rely heavily on gasoline as it makes more than 99 % of the total number, while the remaining share uses diesel.
Figure 9: Total new LDVs and other types in Bahrain in 2005, 2008, 2010 and 2012
0
50
100
150
200
250
300
2005 2008 2010 2012
g CO
2/km
Bahrain EU
0
5
10
15
20
25
30
35
40
45
2005 2008 2010 2012
Thou
sand
vehi
cles
New LDVs Other types

11
The average curb weight of new LDVs has increased over the study period reaching 1718 kg in 2012 compared to 1685 kg in 2005 (Figure 10). These figures indicate that the new LDVs in Bahrain are growing in weight as predicted by Alnaser (1995) and Eltony (1996) and evidenced by Alsabbagh et al. (2013).
Figure 10: Average curb weight and engine size of new LDVs in Bahrain in 2005, 2008, 2010 and 2012
The majority of new LDVs in Bahrain are first registered at the vehicle year of manufacture (Figure 11). A considerable number of LDVs is registered a year before that, while only a small fraction is registered after the vehicle year of manufacture. One implication that can be drawn is that most LDVs in Bahrain are new imported vehicles.
Figure 11: Number of new LDVs per year of first registration (year of manufacture is stated as one year ahead)
2500
2700
2900
3100
3300
3500
1500
1600
1700
1800
1900
2000
2005 2008 2010 2012
cckg
Average curb weight (kg) Average engine size (cc)
0
5
10
15
20
25
30
35
2005 2008 2010 2012
Thou
sand
vehi
cles
Registered at more than threeyears after the year of themanufacture
Registered between one and threeyears after the year of themanufacture
Registered at the year ofmanufacture
Registered a year before the yearof manufacture
12
5. Conclusions
This study aims to provide a clear picture of the fuel economy and CO2 emissions trends of LDVs in Bahrain. Having a clear understanding of these indicators is crucial to informing effective policies. Analysis shows an improvement in vehicle fuel economy in 2012 compared to the base year 2005. However, an increasing trend towards buying large vehicles can be observed. This implies that the increase in the vehicle weight has offset the potential of significant savings gained from the wide distribution of small and more efficient vehicles. Although this could be a common problem that may possibly be found in other countries, it is of special importance to Bahrain. There are no restrictions in Bahrain on new vehicles with respect to fuel economy or CO2 emissions. Furthermore, environmental labeling, emission reduction targets and action plans are yet to be developed for the country. Hence, this denotes abundant objectives for focusing policy framing and research to encourage the use of more efficient vehicles and the introduction fuel economy standards.

13
References
[BAPCO] The Bahrain Petroleum Company 2010. Gasoline and diesel local consumption from 2000 to 2010. Unpublished data.
[CIO] Central Informatics Organization, 2011.Census 2010.<http://www.cio.gov.bh/CIO_ENG/SubDetailed.aspx?subcatid=256> (accessed February 2013).
[CIO] Central Informatics Organization, 2012. Statistical Abstract.<http://www.cio.gov.bh/CIO_ENG/SubDetailed.aspx?subcatid=566> (accessed June 2012).
[EEA] European Environment Agency, 2013. Monitoring CO2 emissions from new passenger cars in the EU: summary of data for 2012. http://www.eea.europa.eu/publications/monitoring-co2-emissions-from-new-cars (accessed August 2013).
[GFEI] Global Fuel Economy Initiative, 2013a. Global Fuel Economy Initiative: 50by50. <http://www.globalfueleconomy.org/about/Pages/AboutHome.aspx> (accessed November 2013).
[GFEI] Global Fuel Economy Initiative, 2013b. Global Fuel Economy Initiative: 50by50. <http://www.globalfueleconomy.org/Documents/Publications/workplan.pdf>(accessed November 2013).
[GFEI] Global Fuel Economy Initiative, no date. Developing a baseline. <http://www.unep.org/transport/gfei/autotool/nextsteps/developing_a_baseline.asp> (accessed December 2013).
[IEA] International Energy Agency, 2011.Key World Energy Statistics.<http://www.iea.org/publications/freepublications/publication/key_world_energy_stats-1.pdf> (accessed July 2013).
[IEA] International Energy Agency, 2012a.Key World Energy Statistics.<http://www.iea.org/publications/freepublications/publication/kwes.pdf> (accessed June 2013).
[IEA] International Energy Agency, 2012b.CO2 emissions from Fuel Combustion.<http://www.iea.org/co2highlights/co2highlights.pdf> (accessed June 2013).
[IRF] International Road Federation, 2011. IRF World Road Statistics 2011.<http://www.irfnet.org/files-upload/stats/2009/wrs2009_web.pdf> (accessed July 2012).
[MOF] Ministry of Finance, 2011.Some economic indicators. Unpublished data. [PMEW] General Commission for the Protection of Marine Resources, Environment & Wildlife
2012. Bahrain’s Second National Communication. [RITA] Research and Innovative Technology Administration, 2013. National Transportation
Statistics.<http://www.rita.dot.gov/bts/sites/rita.dot.gov.bts/files/NTS_Entire_Q1.pdf> (accessed June 2013).

14
Alnaser, W., 1995.Fuel consumption by vehicles in the State of Bahrain. Applied Energy 50, 31-40.
Alsabbagh, M.; Siu, Y. L.; Barrett, J.; Abdel Gelil, I., 2013. CO2 emissions and fuel consumption of passenger vehicles in Bahrain: Current status and future scenarios. SRI working paper series, no. 53. < http://www.see.leeds.ac.uk/research/sri/working-papers/> (accessed December 2013).
Eltony, M., 1996. Demand for gasoline in the GCC: an application for pooling and testing procedures. Energy Economics 18, 203–209.
General Directorate of Traffic, 2012.Traffic Accidents Facts in Kingdom of Bahrain.

15
Annex 1: Methodology
1. Obtain vehicle registration data:
- The data are compiled from the General Directorate of Traffic –Ministry of Interior. - The collected data for Bahrain are extracted from the on-road registered vehicles in
2013 data set. The new LDVs data could not be obtained directly due to IT system change in the General Directorate of Traffic.
- The collected data contains the following information and specifications: o Year of manufacture o First registration date o Vehicle make code and name o Vehicle model code and name o Engine capacity (cc) o Weight (kg) o Fuel type o Vehicle type code and name o Plate type code and name o Number of axles o Number of cylinders
- The database does not indicate whether the vehicle is imported as a new or used vehicle. However, estimates can be obtained from the comparison between the year of manufacture and the first registration year. If the car is registered three years or more after the year of manufacture, it can be assumed that it was imported as a used vehicle.
2. Cleaning data:
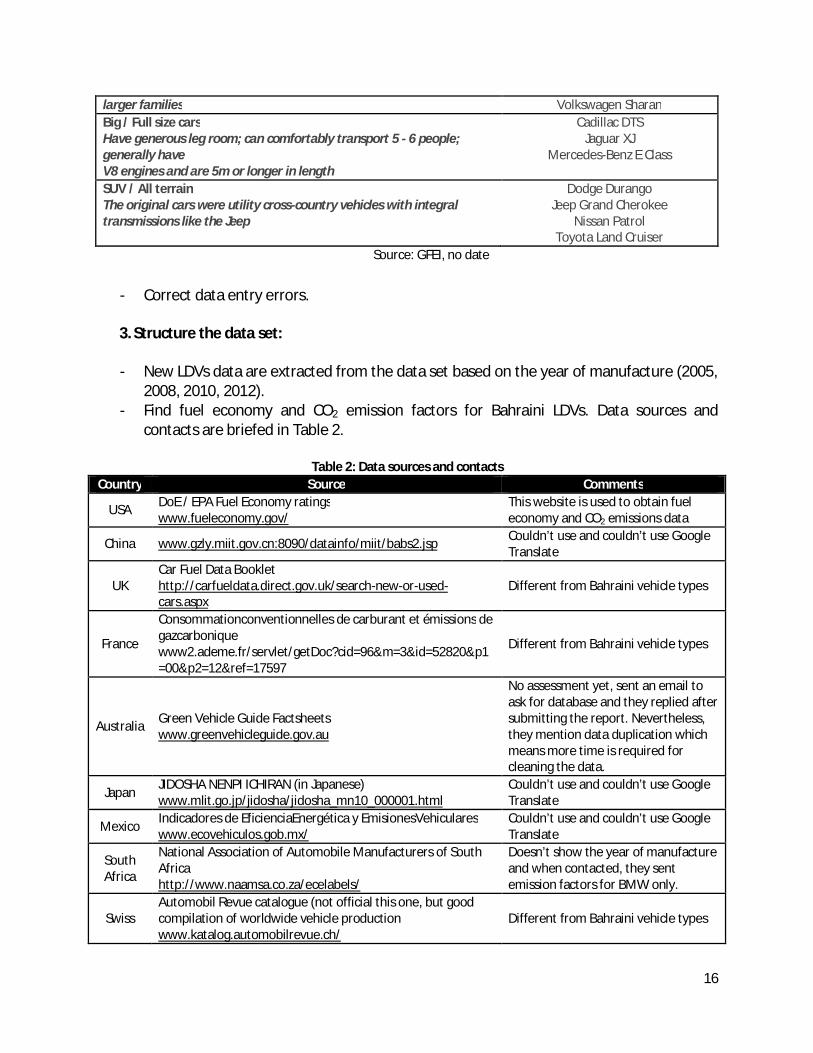
- Vehicles not classified as LDVs are removed. Types of vehicles classified as LDVs are presented at Table 1 (GFEI, no date).
Table 1: Types of LDVs Vehicle Segment Examples
A: Mini / Micro / Small town car Smallest cars, with a length between 2.50m to 3.60m.
Citroën C1 Fiat Panda
Smart Fortwo B: Small compact Slightly more powerful than the Minis; still primarily for urban use; length between 3.60m and 4.05m
Mitsubishi Colt Opel Corsa Suzuki Swift
C: Compact Length between 4.05m – 4.50m
Mazda 3 Subaru Impreza
Volvo S40 D: Family cars Designed for longer distance; fits 5- 6 people; length is 4.50m to 4.80m
BMW 3 series Chrysler Sebring
Lexus IS Light vans Size is similar to D, but interior volume is maximized to accommodate
Chevrolet Uplander Ford Galaxy
16
larger families Volkswagen Sharan Big / Full size cars Have generous leg room; can comfortably transport 5 - 6 people; generally have V8 engines and are 5m or longer in length
Cadillac DTS Jaguar XJ
Mercedes-Benz E Class
SUV / All terrain The original cars were utility cross-country vehicles with integral transmissions like the Jeep
Dodge Durango Jeep Grand Cherokee
Nissan Patrol Toyota Land Cruiser
Source: GFEI, no date
- Correct data entry errors.
3. Structure the data set:
- New LDVs data are extracted from the data set based on the year of manufacture (2005, 2008, 2010, 2012).
- Find fuel economy and CO2 emission factors for Bahraini LDVs. Data sources and contacts are briefed in Table 2.
Table 2: Data sources and contacts Country Source Comments
USA DoE / EPA Fuel Economy ratings www.fueleconomy.gov/
This website is used to obtain fuel economy and CO2 emissions data
China www.gzly.miit.gov.cn:8090/datainfo/miit/babs2.jsp Couldn’t use and couldn’t use Google Translate
UK Car Fuel Data Booklet http://carfueldata.direct.gov.uk/search-new-or-used-cars.aspx
Different from Bahraini vehicle types
France
Consommationconventionnelles de carburant et émissions de gazcarbonique www2.ademe.fr/servlet/getDoc?cid=96&m=3&id=52820&p1 =00&p2=12&ref=17597
Different from Bahraini vehicle types
Australia Green Vehicle Guide Factsheets www.greenvehicleguide.gov.au
No assessment yet, sent an email to ask for database and they replied after submitting the report. Nevertheless, they mention data duplication which means more time is required for cleaning the data.
Japan JIDOSHA NENPI ICHIRAN (in Japanese) www.mlit.go.jp/jidosha/jidosha_mn10_000001.html
Couldn’t use and couldn’t use Google Translate
Mexico Indicadores de EficienciaEnergética y EmisionesVehiculares www.ecovehiculos.gob.mx/
Couldn’t use and couldn’t use Google Translate
South Africa
National Association of Automobile Manufacturers of South Africa http://www.naamsa.co.za/ecelabels/
Doesn’t show the year of manufacture and when contacted, they sent emission factors for BMW only.
Swiss Automobil Revue catalogue (not official this one, but good compilation of worldwide vehicle production www.katalog.automobilrevue.ch/
Different from Bahraini vehicle types
17
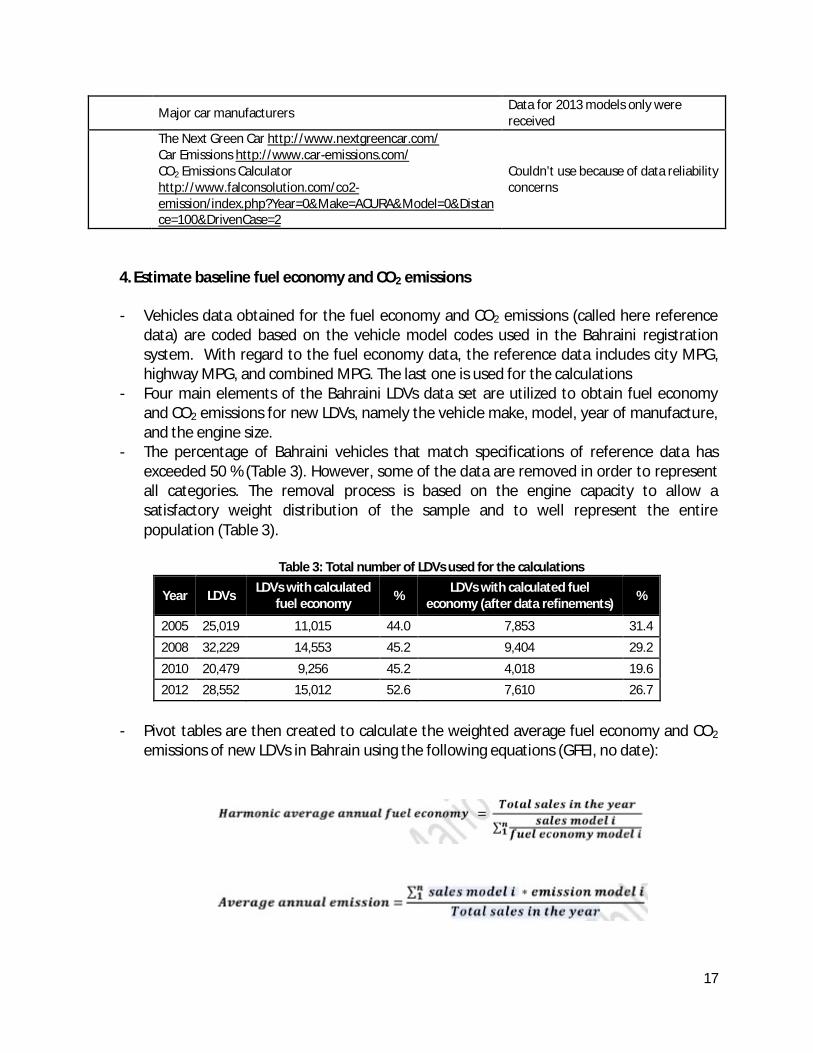
Major car manufacturers Data for 2013 models only were received
The Next Green Car http://www.nextgreencar.com/ Car Emissions http://www.car-emissions.com/ CO2 Emissions Calculator http://www.falconsolution.com/co2-emission/index.php?Year=0&Make=ACURA&Model=0&Distance=100&DrivenCase=2
Couldn’t use because of data reliability concerns
4. Estimate baseline fuel economy and CO2 emissions
- Vehicles data obtained for the fuel economy and CO2 emissions (called here reference data) are coded based on the vehicle model codes used in the Bahraini registration system. With regard to the fuel economy data, the reference data includes city MPG, highway MPG, and combined MPG. The last one is used for the calculations
- Four main elements of the Bahraini LDVs data set are utilized to obtain fuel economy and CO2 emissions for new LDVs, namely the vehicle make, model, year of manufacture, and the engine size.
- The percentage of Bahraini vehicles that match specifications of reference data has exceeded 50 % (Table 3). However, some of the data are removed in order to represent all categories. The removal process is based on the engine capacity to allow a satisfactory weight distribution of the sample and to well represent the entire population (Table 3).
Table 3: Total number of LDVs used for the calculations
Year LDVs LDVs with calculated fuel economy % LDVs with calculated fuel
economy (after data refinements) %
2005 25,019 11,015 44.0 7,853 31.4
2008 32,229 14,553 45.2 9,404 29.2
2010 20,479 9,256 45.2 4,018 19.6 2012 28,552 15,012 52.6 7,610 26.7
- Pivot tables are then created to calculate the weighted average fuel economy and CO2
emissions of new LDVs in Bahrain using the following equations (GFEI, no date):

18
- The fuel economy estimate is then converted from Corporate Average Fuel Economy (CAFE) to New European Driving Cycle (NEDC) using the Test Cycle Conversion Tool: http://www.theicct.org/sites/default/files/info-tools/GlobalStdReview_Conversionfactor_May17_v1.xlsx .

19
Annex 2: Sample of the data

20
Annex 3: Tables
Table 4: Passenger vehicle number vs. population size and real GDP in Bahrain between 2000 and 2010.
Year Vehicles Population Real GDP (BD Million)
2000 216679 637,582 2996.9 2001 229780 661,317 2981.5 2002 250978 710,554 3192.6 2003 273230 764,519 3665 2004 293801 823,744 4224.5 2005 314033 888,824 5060.6 2006 337545 960,425 5960.3 2007 366732 1,039,297 6945.6 2008 399546 1,106,509 8328.8 2009 428957 1,178,415 7377.5 2010 452222 1,234,571 8245.6
Source: CIO, 2011; CIO, 2012; MOF, 2011
Table 5: Gasoline consumption in Bahrain between 2000 and 2010 (TJ) Year Gasoline consumption 2000 3014350 2001 3143120 2002 3429410 2003 3639380 2004 3837740 2005 3933800 2006 4232630 2007 4303160 2008 4681990 2009 4945000 2010 5157350
Source: BAPCO, 2010
Table 6: Total number of registered vehicles in Bahrain between 2000 and 2012 Year Vehicles number 2000 216679 2001 229780 2002 250978 2003 273230 2004 293801 2005 314033

21
2006 337545 2007 366732 2008 399546 2009 428957 2010 452222 2011 475150 2012 501481
Source: General Directorate of Traffic, 2012
Table 7: Carbon emissions from transport sector in Bahrain between 2000 and 2010 Year CO2 emissions 2000 1462.61 2001 1500.09 2002 1712.48 2003 1863.74 2004 2021.64 2005 2350.25 2006 2458.99 2007 2587.22 2008 2906.78 2009 2928.59 2010 2905.25
Source: PMEW, 2012; own calculations.
Table 8: Average fuel economy (L/100km) and CO2 emissions (g/km) for new LDVs in Bahrain in 2005, 2008, 2010 and 2012
Year Average fuel economy (CAFE) Average fuel economy (NEDC) Average CO2 emissions (g/km)
2005 10.5 12.1 247.1 2008 10.6 12.2 249.0
2010 10.7 12.2 251.0
2012 9.6 11.1 229.6
Table 9: A comparison between the average fuel economy of new LDVs registered in Bahrain, USA, OECD, and non-OECD countries in 2005, 2008, 2010 and 2012 (L/100 km, CAFE)
Year 2005 2008 2010 2012 Bahrain 10.5 10.6 10.7 9.6 USA* 7.8 7.5 7 6.6
Source: *RITA, 2013
Table 10: A comparison between the average fuel economy of new LDVs registered in Bahrain, OECD, and non-OECD countries in 2005, 2008, 2010 and 2012 (L/100 km, NEDC)
Year 2005 2008 2010 2012 Bahrain 12.1 12.2 12.2 11.1 OECD* 8.1 7.6 Non-OECD* 7.5 7.6

22
Source: *GFEI, 2013b
Table 11: A comparison between the average CO2 emissions from new models of passenger vehicles in the EU and Bahrain in 2005, 2008, 2010 and 2012 (g CO2/km)
Year 2005 2008 2010 2012 EU* 162.4 153.6 140.3 -
Bahrain 248.5 250.4 252.4 230.9 Source: *EEA, 2013
Table 12: Total new vehicles, new LDVs and gasoline LDVs in Bahrain in 2005, 2008, 2010 and 2012
Year Total new vehicles New LDVs % Gasoline LDVs % of LDVs
2005 29395 25019 85.1 24946 99.7
2008 40395 32229 79.8 32161 99.8 2010 24939 20479 82.1 20439 99.8
2012 35219 28552 81.1 28439 99.6
Table 13: Average curb weight and engine size of new LDVs in Bahrain in 2005, 2008, 2010 and 2012
Item 2005 2008 2010 2012 Average curb weight (kg) 1685 1753 1731 1718
Average engine size (cc) 3191 3417 3061 2955
Table 14: Number of new LDVs per year of first registration
Item 2005 2008 2010 2012
Registered a year before the year of manufacture 5444 5669 3390 5216
Registered at the year of manufacture 13327 22550 14931 21143 Registered between one and three years after the year of the manufacture 2912 2769 2156 2191
Registered at more than three years after the year of the manufacture 3294 1174 0 0 N.A. 42 67 2 2
Total 25019 32229 20479 28552