Thesis Report Adult refreshners market
81
A Study on Scenario of Indian “Adult Confectionery” Market Compiled By:- Animesh Tohan (2004IPG-10) Under the Esteemed Guidance of:- Dr. Manoj Patwardhan Assistant Professor (Human Resource Management) & Dr. Naval Bajpai Assistant Professor (Work Culture – Organizational Behavior) On 4 th May, 2009
-
Upload
independent -
Category
Documents
-
view
1 -
download
0
Transcript of Thesis Report Adult refreshners market
A Study on Scenarioof Indian “AdultConfectionery”
Market
Compiled By:-Animesh Tohan(2004IPG-10)
Under the Esteemed Guidance of:-Dr. Manoj Patwardhan
Assistant Professor(Human Resource Management)
&Dr. Naval BajpaiAssistant Professor
(Work Culture – Organizational Behavior)
On4th May, 2009

ABV - Indian Institute of Information Technologyand Management, Gwalior
Table of Contents
Certificate.............................................2Acknowledgement.........................................3Abstract................................................4Introduction & Motivation...............................5Literature Survey.......................................6Statement of Problem & Scope............................7Objectives..............................................8Research Methodology....................................9Data Collection Method..................................9Analytical Techniques...................................9Exploratory Research...................................10Secondary Data.........................................11Preliminary Decisions..................................12Marketing Research Questionnaire.......................16Data collected.........................................20Major Findings from Primary Research...................22Data Analysis & Testing................................23Detailed Primary Research Findings.....................24Factor Analysis........................................27
Page 1

Chi2 Test to find out significant factors...............27Perceptual Maps........................................44Cluster Analysis.......................................48Deliverables...........................................60Summary & Conclusion...................................61References.............................................62
Certificate
This is to certify that the M.B.A. Dissertation titled “AStudy on Scenario of Indian “Adult Confectionery” Market”which is being submitted to Atal Bihari Vajpayee – IndianInstitute of Information Technology and Management,Gwalior, for the award of Master of BusinessAdministration by Mr. Animesh Tohan is a record of bonafide work carried out by him under my supervision andguidance. It is further certified that the work presentedhas reached a standard of the M.B.A. Dissertation and ithas not been submitted to any other university orInstitute for the award of any Degree.
Date:
Page 2

Place: ABV-IIITM Gwalior
Dr. Manoj Patwardhan Dr. Naval Bajpai
Acknowledgement
I hereby express my gratitude to my supervisorsDr Manoj Patwardhan & Dr. Naval Bajpai for their
Page 3

invaluable guidance throughout the course of our project.It was indeed a great honor and a great learningexperience to work under such unerring professors andhaving received their ever helping cooperation andwisdom. I shall be forever in debt and grateful for allthe support provided and the resources that were madeavailable to me. I dedicate this project to their immenseknowledge and expertise in their respective areas withoutwhich the project would not have been satisfactorilycompleted. I would also like to thank all the individualswho devoted their precious time in responding to thesurvey.
Page 4
Abstract
The mouth freshener toffees in India are a booming industry.Equally the mouth freshener brands available in the market areon the rise. With big players like ITC, Dabur, Wrigleys,Cadbury, Perfetti Van Melle Indian market will be fraught withextremely stiff competition. The impulse nature of buyingbehaviour makes it even tough for the producer to predict thebuying behaviour.
The objective of this research is to identify the segments inthe “Adult Confectionaries” with an objective to help thecompanies find the best possible way to attract customersthrough promotions. After deciding upon the primary andsecondary research objectives, an exploratory research wascarried out with the help of some open-ended questions to findout what people in general think about the adultconfectionaries and what the probable parameters/factors are,which will determine the buying decision.
Secondary data from various industry bodies was collected tohave a better understanding of the market. This was followedby a survey with the help of a questionnaire, which consistedof 12 close-ended questions to be answered by the respondents.The respondents are a mix of IT professionals, post-graduatestudents, coming from varied income segments. The datacollected was then analysed to determine the perception peoplehave about these products.
The segments in the confectionery markets were established.Also, the effect of promotions on the various buying variableswas studied during analysis.
This report explains the objectives of the research, themethodology adopted and finally the findings of the research.
Page 5
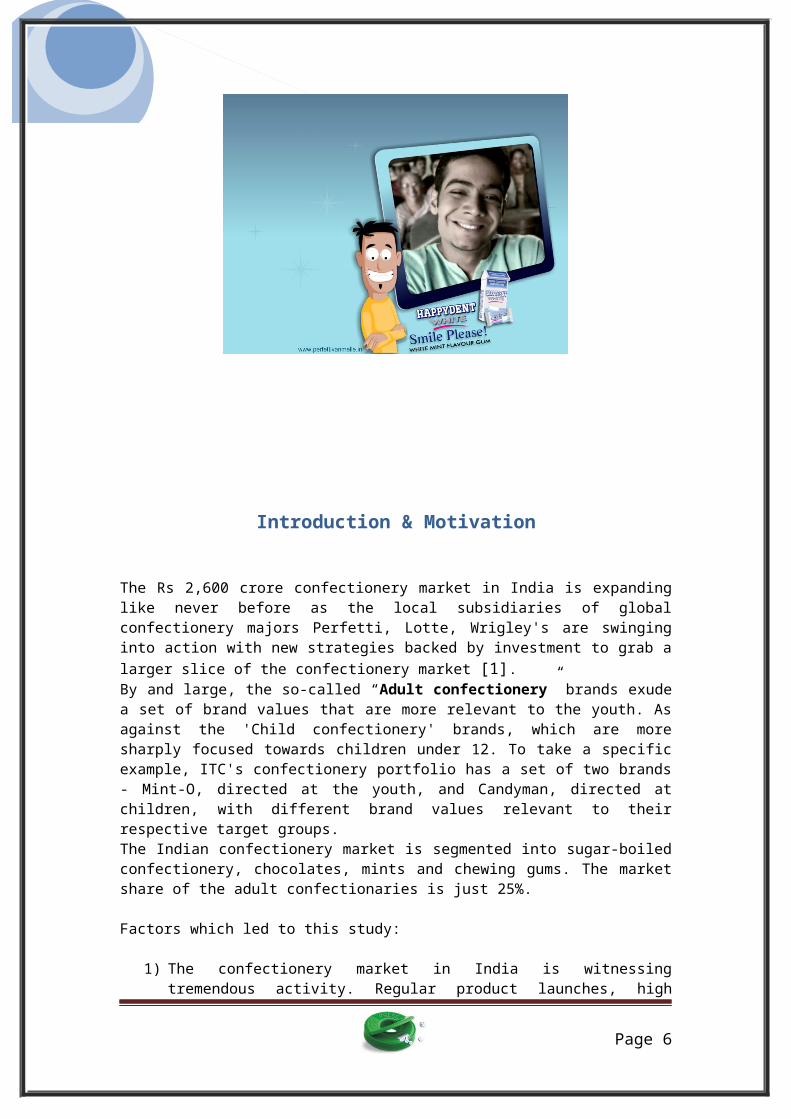
Introduction & Motivation
The Rs 2,600 crore confectionery market in India is expandinglike never before as the local subsidiaries of globalconfectionery majors Perfetti, Lotte, Wrigley's are swinginginto action with new strategies backed by investment to grab alarger slice of the confectionery market [1].By and large, the so-called “Adult confectionery” brands exudea set of brand values that are more relevant to the youth. Asagainst the 'Child confectionery' brands, which are moresharply focused towards children under 12. To take a specificexample, ITC's confectionery portfolio has a set of two brands- Mint-O, directed at the youth, and Candyman, directed atchildren, with different brand values relevant to theirrespective target groups.The Indian confectionery market is segmented into sugar-boiledconfectionery, chocolates, mints and chewing gums. The marketshare of the adult confectionaries is just 25%.
Factors which led to this study:
1) The confectionery market in India is witnessingtremendous activity. Regular product launches, high
Page 6

decibel media activity, consumer promotions and tradepromotions make it one of the most hyperactive categoriesin the Indian market.
2) The confectionery reaches 15 per cent of the households,leaving ample room for growth. Even considering the urbanmarket alone, the category reaches just 22 per cent ofthe urban consumers.
3) Also, promotions are extremely important as in theimpulse category the decision making often happens at thepoint of purchase.
All these factors, make studying the consumer buying patternand the effect of promotions on it, important. This surveywill help the companies understand how they can attractcustomers and gain market share.
Literature Survey
Certain studies have been conducted pertaining to thisparticular sector and domain. These studies and their keyfindings have been explained below:
Page 7

Statement of Problem & Scope
Page 8
A study was conducted that focused on analysis of the situational environment of Cadbury Dairy Milk in France which helped Dairy Milk to capitalize on organizational strengths, minimize any weaknesses, exploit market opportunities and avoid, as far as possible, any threats [2].Another research was conducted in which numerical information was used to determine price and ad spend effects as well as to evaluate the sales effectiveness of campaigns. Analysis revealed that the only sure way to assess advertising is by testing and careful monitoring in the field [3].
Statement of ProblemTo conduct research with intend to understand theperception of the consumer towards the buying behavior inthe “adult confectionery” market.
ScopeThis market research study will determine the factorsaffecting the buying behavior of consumers in the “adultconfectionery” market. Also, the study will exploredemographic factors which influence the buying behaviorof consumers. Along with this, the study will also try tostudy the reasons, occasions and frequency of buying ofthe adult confectionaries in the target segment.
Page 9

Objectives
Page 10
PROTo evaluate the influence of promotions on the buying behaviour of “adult confectionaries” through segmentation of the market.
Research Methodology
Page 11
SRO 1To segment the Indian adult confectionary market.SRO 2To study the reasons, occasions and frequency of buying of the adult confectionaries in the target segment.SRO 3To determine the customer preference for the type of adult confectionaries.SRO 4To study the impact of promotions on the purchase decision.
The study methodology involves use of extensive primary datathrough questionnaires, interviews. The data is obtained fromvarious sources such as Students of IIITM Campus, Survey ofworking professionals from IT companies located in New Delhi,various websites of confectionaries companies like Perfetti,Nestle, ITC etc.The random sample consisted of good representation ofstudents, working professionals, female, both unmarried andmarried. Multiple-choice close ended questions were used to elicitresponses. For factor and cluster analysis Likert scale wasadopted on a 5-point interval scale, ranging from stronglyagree to strongly disagree. The personal demographic data wasalso collected from the respondents.
Data Collection Method
The data was collected through a questionnaire designedspecifically for extracting various significant factors thatmight influence a prospective consumer’s decision in the adultconfectionery market. The questionnaires were e-mailed to therespondents and their responses were received and recorded inexcel sheets. The data collected was then Cross tabulatedusing various characteristics and attributes found relevantduring the course of research.
Analytical Techniques
Analysis of the entire data collected from questionnaire isdone by applying various statistical techniques such asTabulation, Graphs and Charts, Chi-Square for finding thegoodness of fit, Cross Tabs, Factor analysis for finding themost important attributes, Cluster analysis for segmentationand other parameters in a systematic manner. Various softwaretools like SPSS, MS Word, and MS Excel were used for analysisand presentation purposes.
Page 12
Exploratory Research
The scope of this exploratory research is to ascertain theprimary factors that drive the buyers towards confectionery inIndia.These factors further helped in designing the questionnaireand to answer the SROs and thereby the PRO. Two methods wereadopted to conduct this exploratory research.
Personal InterviewsPersonal interviews were conducted with 20 respondents todetermine factors that would affect their decisions to buyconfectionery. The following is the questionnaire that wasused to understand their reasoning behind the purchase ofconfectionery.
Do you like to consume confectionaries? _ Yes _ NoIf yes, then why? (Please explain)
What is the frequency of your consumption ofconfectionaries?
Page 13
Are you specific about the type of confectionaries thatyou consume? Which type of confectionaries do you usuallybuy?
Are you specific about the flavors of confectionariesthat you consume? Which flavors do you prefer to buy?
Do you think the confectionery products are adequatelypromoted in media?
The answers to the above mentioned questionnaire highlightedthe following key observations:
About 80% of the respondents like to consumeconfectionaries. Among these respondents, a majorityconsume these confectionaries as an after-meal fresheneror just as an agent of time-pass, while a few othersconsume these after smoking.
About 65% of the respondents are specifically inclinedtowards buying mint flavored confectionaries.
About 40% of the respondents prefer chewing gums over acomparative 30% of respondents that prefer candies ortoffees. While the rest have no specific choice ofconfectionaries.
Secondary Data
Page 14

The secondary data was collected from the Internet to identifyvarious factors that might affect the consumer’s behaviorwhile buying confectionaries. Thus based on the secondary research at this stage, followingare the short-listed factors which would affect a consumer’sdecision in buying confectionery.
Freshness (P,I) Confectionaries’ Omnipresence(P)
Fun (P,I) Sleep Reducer (P)Taste (P,I) Attractive Packaging (P,I)New Flavors (P,I) Interesting Ads(P,I)New Brands (P,I) Price (P,I)Agent of Time-pass (P) Promotion (P,I)Celebrity Association (P) Health Conscious (I)
P – Personal Interviews, I – Internet Sources
Page 15
Preliminary Decisions
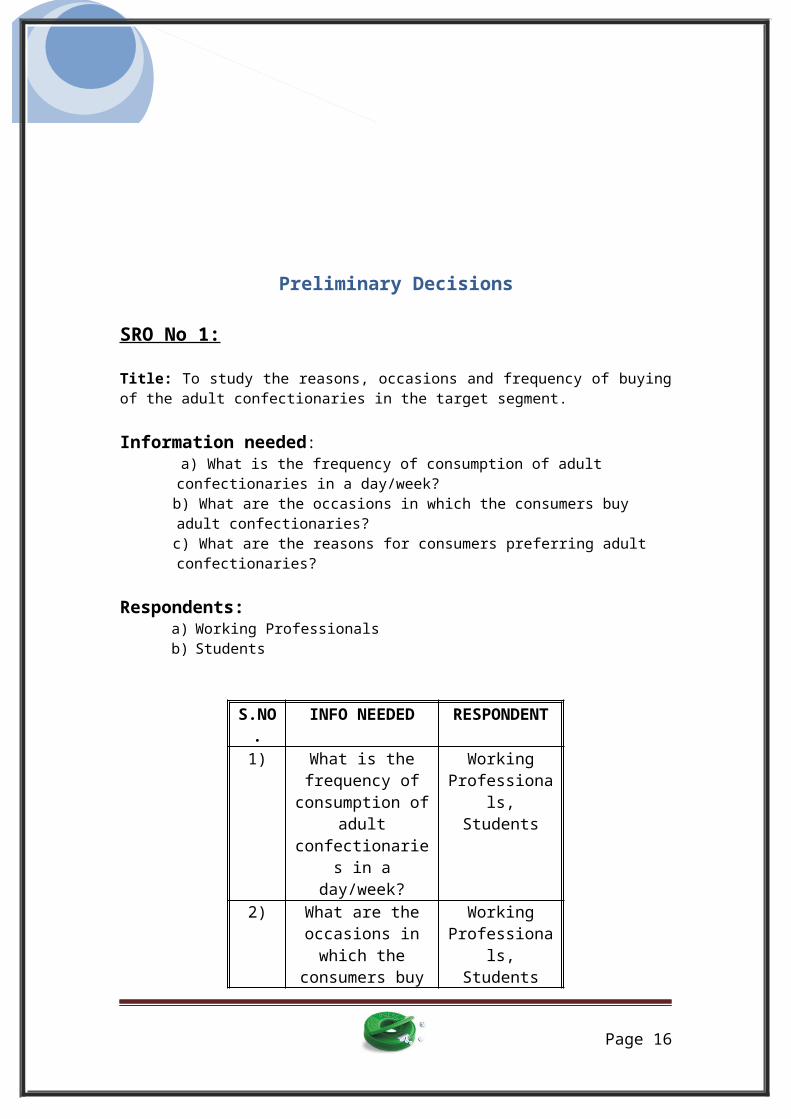
SRO No 1: Title: To study the reasons, occasions and frequency of buyingof the adult confectionaries in the target segment.
Information needed: a) What is the frequency of consumption of adult
confectionaries in a day/week? b) What are the occasions in which the consumers buy
adult confectionaries? c) What are the reasons for consumers preferring adult
confectionaries?
Respondents:a) Working Professionals b) Students
S.NO.
INFO NEEDED RESPONDENT
1) What is thefrequency ofconsumption of
adultconfectionarie
s in aday/week?
WorkingProfessiona
ls,Students
2) What are theoccasions inwhich the
consumers buy
WorkingProfessiona
ls,Students
Page 16
adultconfectionarie
s?3) What are the
reasons forconsumerspreferring
adultconfectionarie
s?
WorkingProfessiona
ls,Students
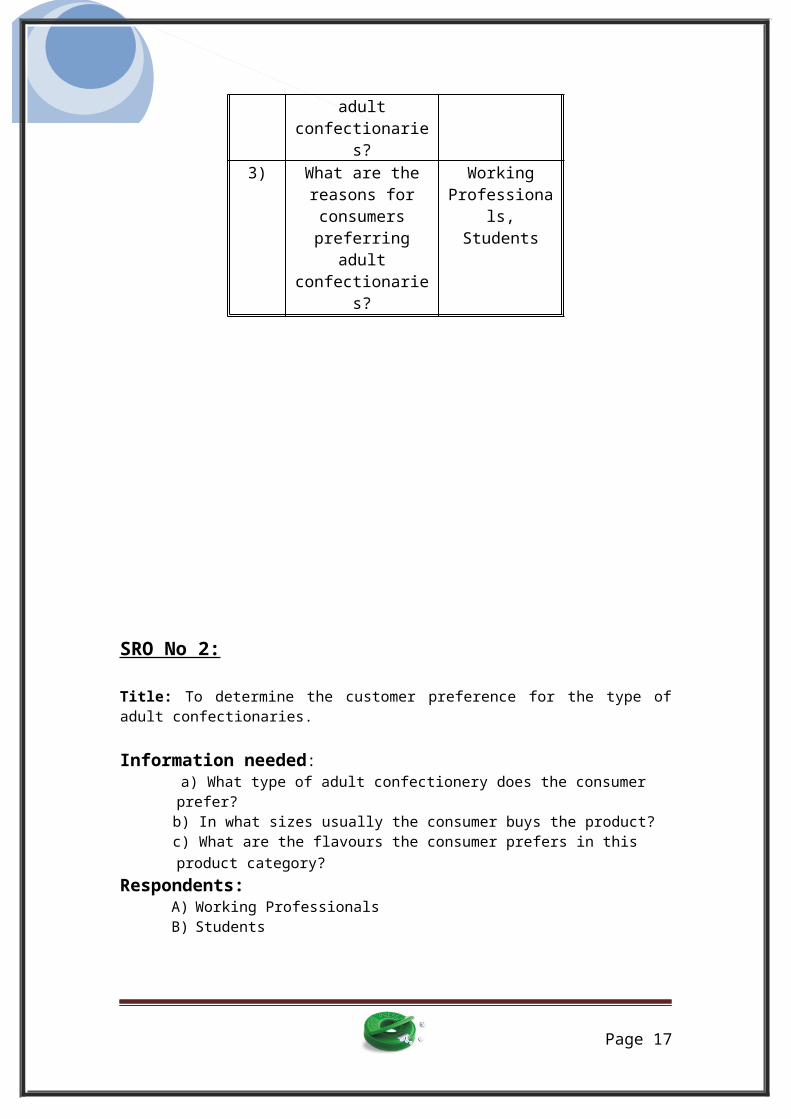
SRO No 2:
Title: To determine the customer preference for the type ofadult confectionaries.
Information needed: a) What type of adult confectionery does the consumer
prefer? b) In what sizes usually the consumer buys the product? c) What are the flavours the consumer prefers in this
product category? Respondents:
A) Working ProfessionalsB) Students
Page 17
S.NO.
INFO NEEDED RESPONDENT
1) What type ofadult
confectionerydoes the consumer
prefers?
WorkingProfessionals, Students
2) In what sizesusually the
consumer buys theproduct?
WorkingProfessionals, Students
3) What are theflavours the
consumer prefersin this product
category?
WorkingProfessionals, Students
SRO No 3:
Title: To segment the Indian adult confectionery market.
Page 18
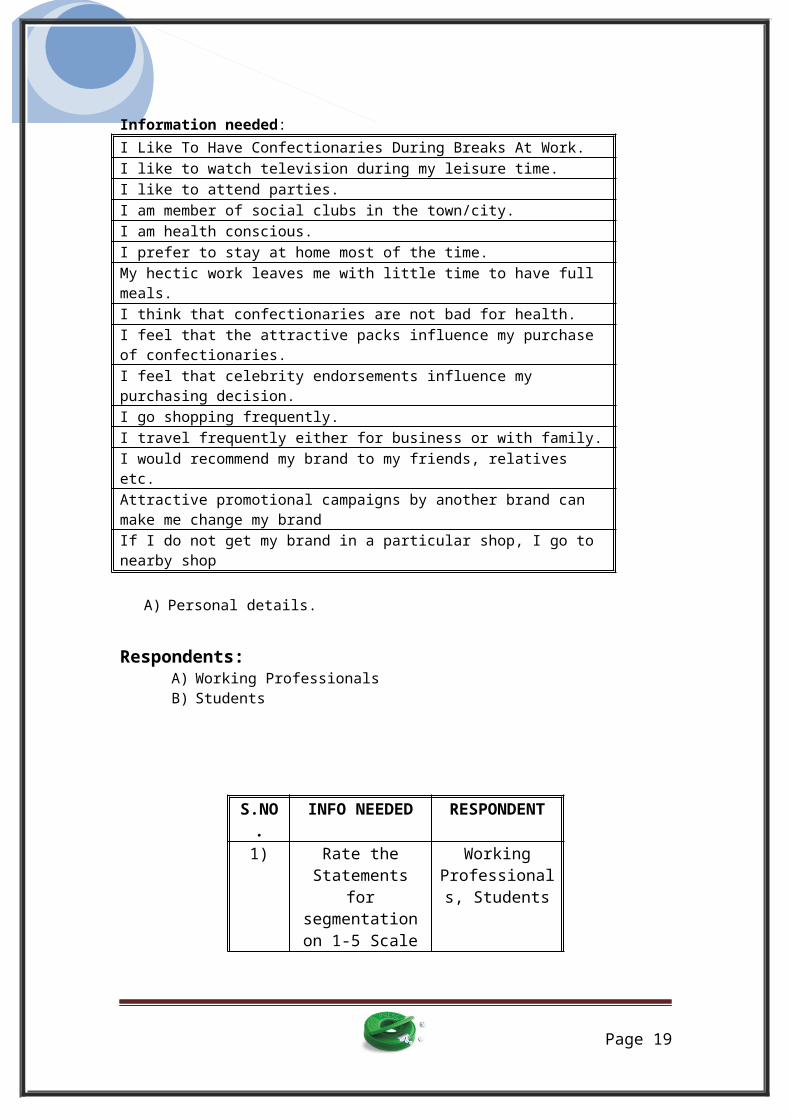
Information needed: I Like To Have Confectionaries During Breaks At Work.I like to watch television during my leisure time.I like to attend parties.I am member of social clubs in the town/city.I am health conscious.I prefer to stay at home most of the time.My hectic work leaves me with little time to have full meals.I think that confectionaries are not bad for health.I feel that the attractive packs influence my purchase of confectionaries.I feel that celebrity endorsements influence my purchasing decision.I go shopping frequently.I travel frequently either for business or with family.I would recommend my brand to my friends, relatives etc.Attractive promotional campaigns by another brand can make me change my brandIf I do not get my brand in a particular shop, I go to nearby shop
A) Personal details.
Respondents:A) Working ProfessionalsB) Students
S.NO.
INFO NEEDED RESPONDENT
1) Rate theStatements
forsegmentationon 1-5 Scale
WorkingProfessionals, Students
Page 19

2) Personaldetails
WorkingProfessionals, Students
SRO No 4:Title: To study the impact of promotions on the purchasedecision.
Information needed: a) Brand loyalty of a consumer c) Where do the consumers get to know more about
promotional offers?
Respondents:A) Working ProfessionalsB) Students
S.NO.
INFO NEEDED RESPONDENT
1) Brand loyaltyof a consumer
WorkingProfessiona
ls,Students
3) Where do theconsumers getto know more
aboutpromotionaloffers?
WorkingProfessiona
ls,Students
Page 20

Marketing Research Questionnaire
We are doing a market research for adult confectionaries. Adult confectionaries are those which are targeted specifically towards adults.Here are some of the pictures that will help you relate to the product category.
Page 21
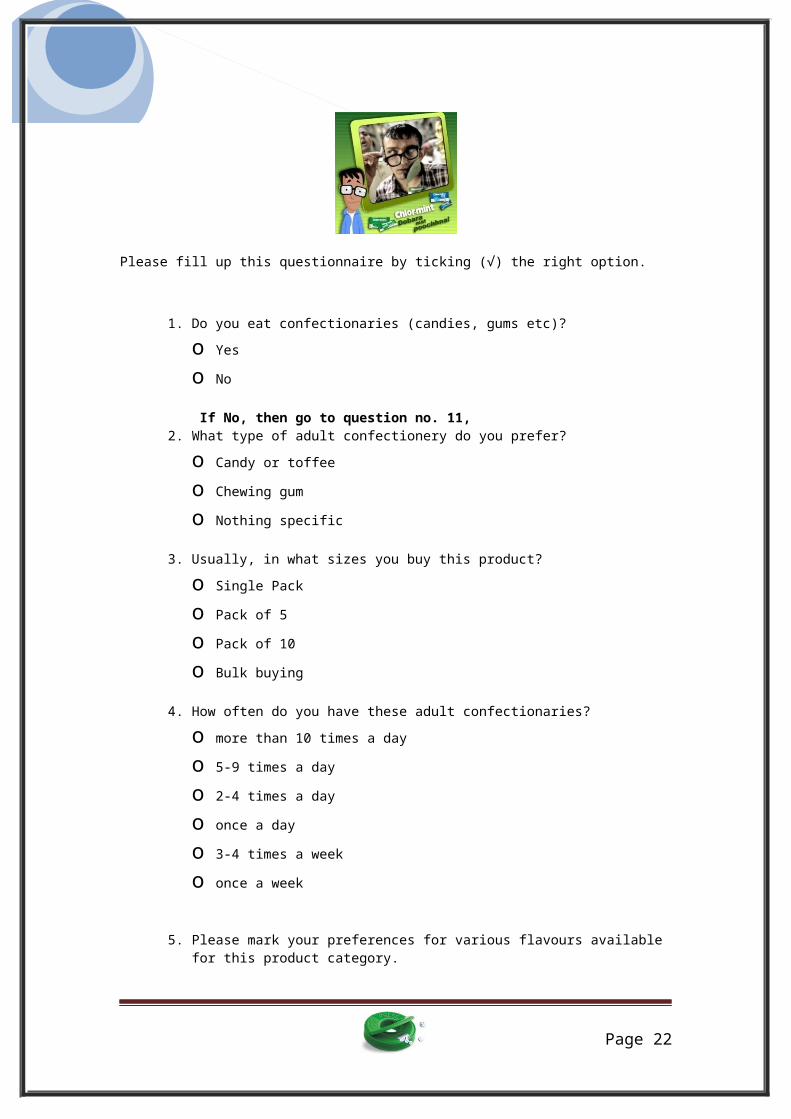
Please fill up this questionnaire by ticking (√) the right option.
1. Do you eat confectionaries (candies, gums etc)?o Yes
o No
If No, then go to question no. 11,2. What type of adult confectionery do you prefer? o Candy or toffee
o Chewing gum
o Nothing specific
3. Usually, in what sizes you buy this product?o Single Pack
o Pack of 5
o Pack of 10
o Bulk buying
4. How often do you have these adult confectionaries?o more than 10 times a day
o 5-9 times a day
o 2-4 times a day
o once a day
o 3-4 times a week
o once a week
5. Please mark your preferences for various flavours available for this product category.
Page 22
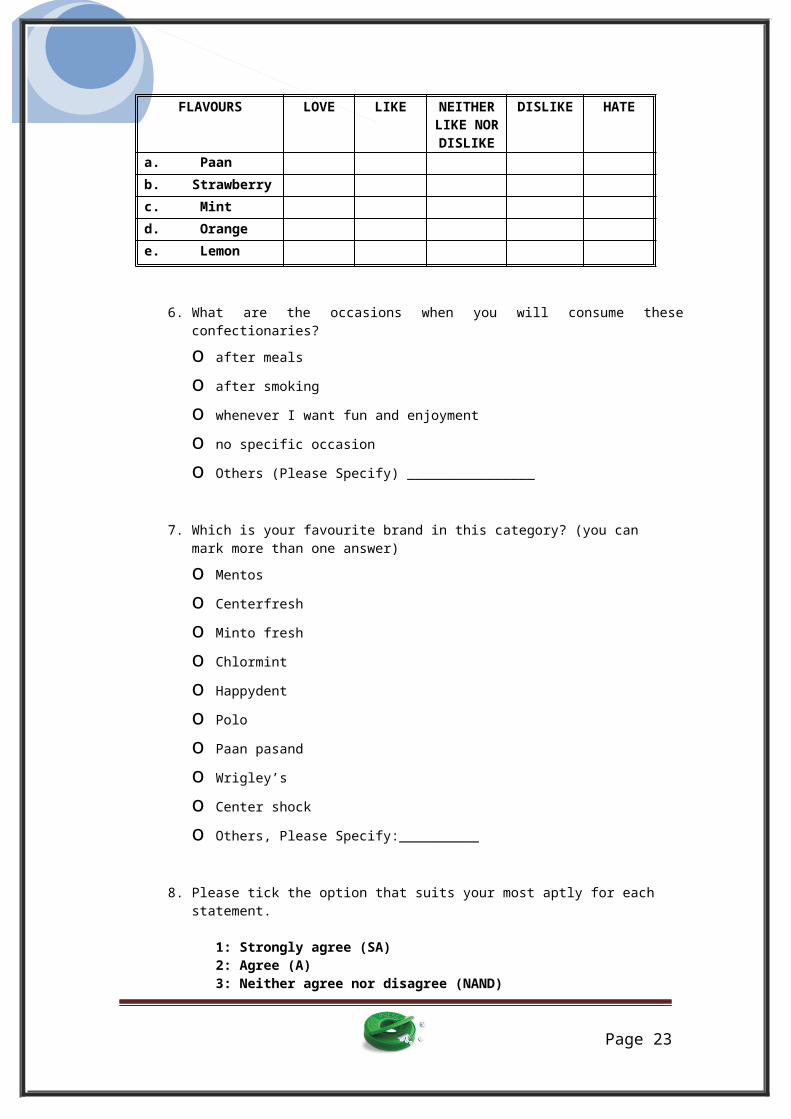
FLAVOURS LOVE LIKE NEITHERLIKE NORDISLIKE
DISLIKE HATE
a. Paan b. Strawberry c. Mint d. Orange e. Lemon
6. What are the occasions when you will consume theseconfectionaries? o after meals
o after smoking
o whenever I want fun and enjoyment
o no specific occasion
o Others (Please Specify) ________________
7. Which is your favourite brand in this category? (you can mark more than one answer)o Mentos
o Centerfresh
o Minto fresh
o Chlormint
o Happydent
o Polo
o Paan pasand
o Wrigley’s
o Center shock
o Others, Please Specify:__________
8. Please tick the option that suits your most aptly for each statement.
1: Strongly agree (SA)2: Agree (A)3: Neither agree nor disagree (NAND)
Page 23
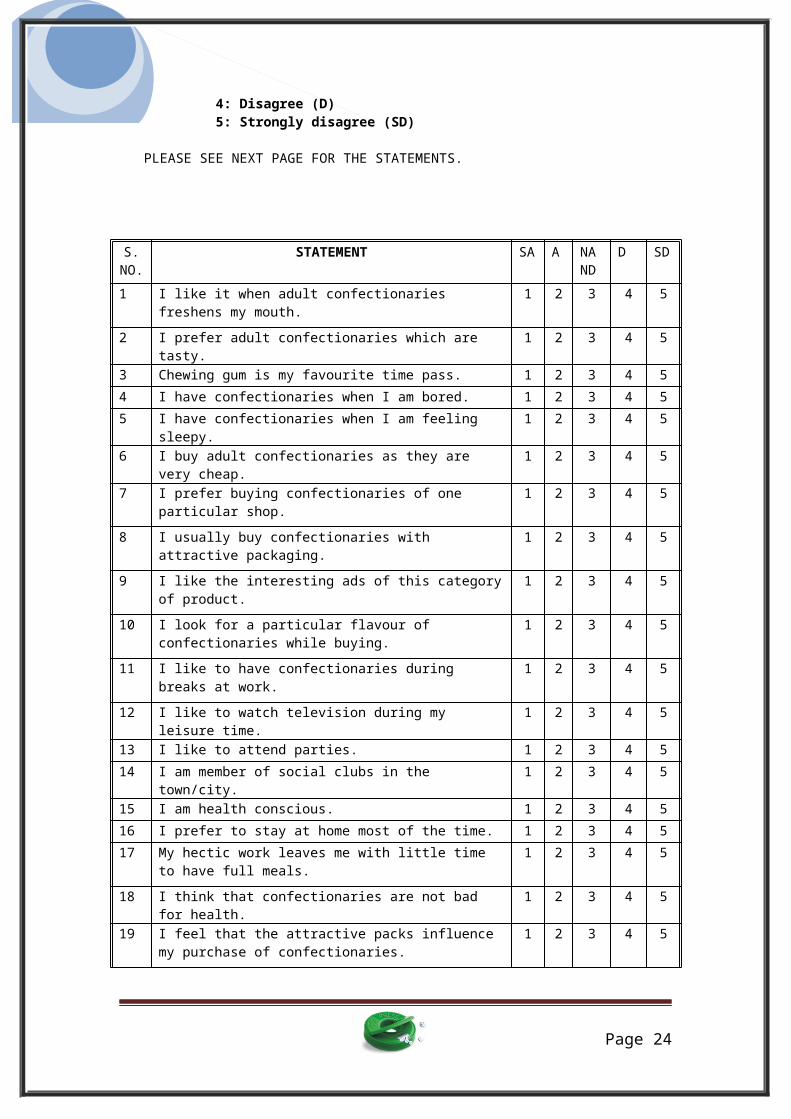
4: Disagree (D)5: Strongly disagree (SD)
PLEASE SEE NEXT PAGE FOR THE STATEMENTS.
S.NO.
STATEMENT SA A NAND
D SD
1 I like it when adult confectionaries freshens my mouth.
1 2 3 4 5
2 I prefer adult confectionaries which are tasty.
1 2 3 4 5
3 Chewing gum is my favourite time pass. 1 2 3 4 54 I have confectionaries when I am bored. 1 2 3 4 55 I have confectionaries when I am feeling
sleepy.1 2 3 4 5
6 I buy adult confectionaries as they are very cheap.
1 2 3 4 5
7 I prefer buying confectionaries of one particular shop.
1 2 3 4 5
8 I usually buy confectionaries with attractive packaging.
1 2 3 4 5
9 I like the interesting ads of this categoryof product.
1 2 3 4 5
10 I look for a particular flavour of confectionaries while buying.
1 2 3 4 5
11 I like to have confectionaries during breaks at work.
1 2 3 4 5
12 I like to watch television during my leisure time.
1 2 3 4 5
13 I like to attend parties. 1 2 3 4 514 I am member of social clubs in the
town/city.1 2 3 4 5
15 I am health conscious. 1 2 3 4 516 I prefer to stay at home most of the time. 1 2 3 4 517 My hectic work leaves me with little time
to have full meals.1 2 3 4 5
18 I think that confectionaries are not bad for health.
1 2 3 4 5
19 I feel that the attractive packs influence my purchase of confectionaries.
1 2 3 4 5
Page 24
20 I feel that celebrity endorsements influence my purchasing decision.
1 2 3 4 5
21 I go shopping frequently. 1 2 3 4 522 I travel frequently either for business or
with family.1 2 3 4 5
23 I would recommend my brand to my friends, relatives etc.
1 2 3 4 5
24 Attractive promotional campaigns by anotherbrand can make me change my brand
1 2 3 4 5
25 If I do not get my brand in a particular shop, I go to nearby shop
1 2 3 4 5
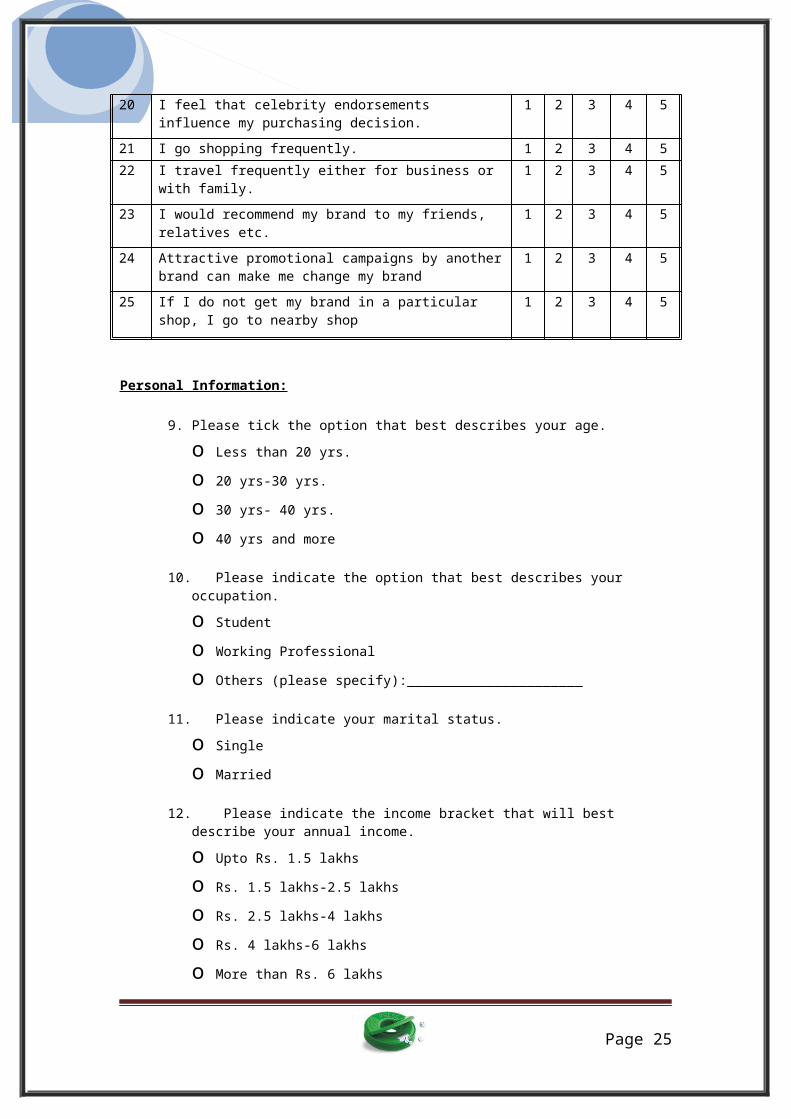
Personal Information:
9. Please tick the option that best describes your age.o Less than 20 yrs.
o 20 yrs-30 yrs.
o 30 yrs- 40 yrs.
o 40 yrs and more
10. Please indicate the option that best describes your occupation. o Student
o Working Professional
o Others (please specify):______________________
11. Please indicate your marital status.o Single
o Married
12. Please indicate the income bracket that will best describe your annual income.o Upto Rs. 1.5 lakhs
o Rs. 1.5 lakhs-2.5 lakhs
o Rs. 2.5 lakhs-4 lakhs
o Rs. 4 lakhs-6 lakhs
o More than Rs. 6 lakhs
Page 25
o NOT APPLICABLE
Name: __________________________
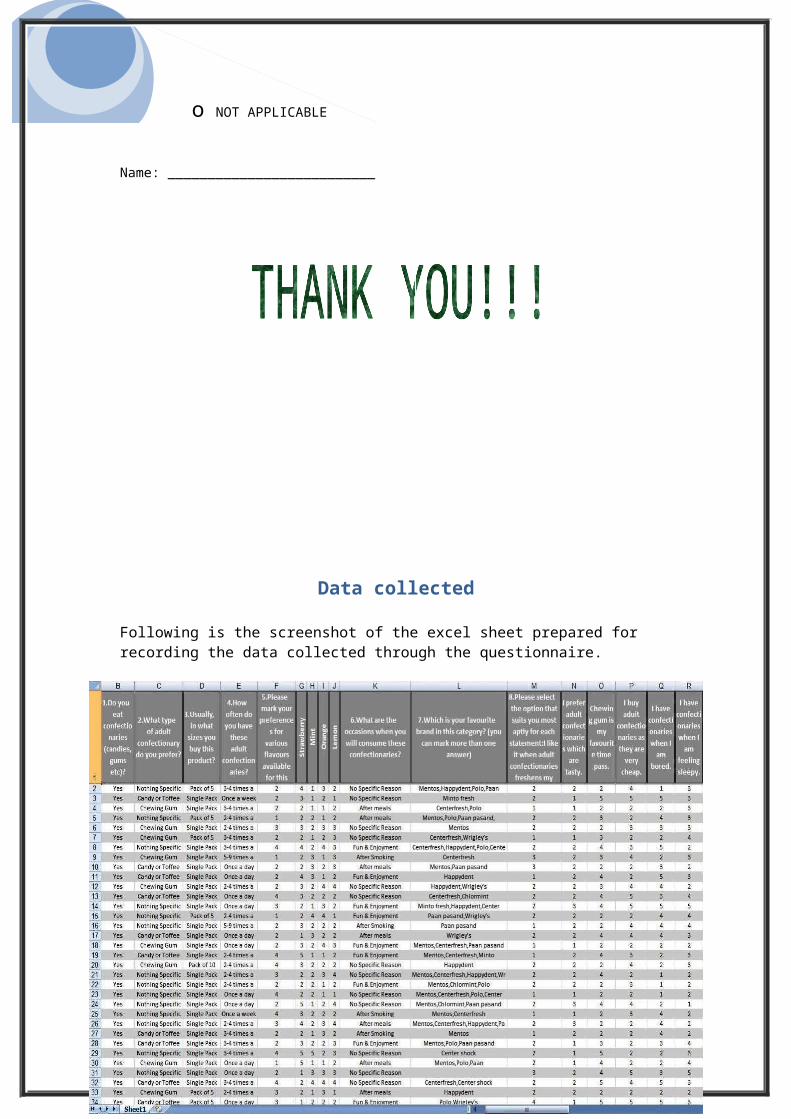
Data collected
Following is the screenshot of the excel sheet prepared for recording the data collected through the questionnaire.
Page 26
Page 27
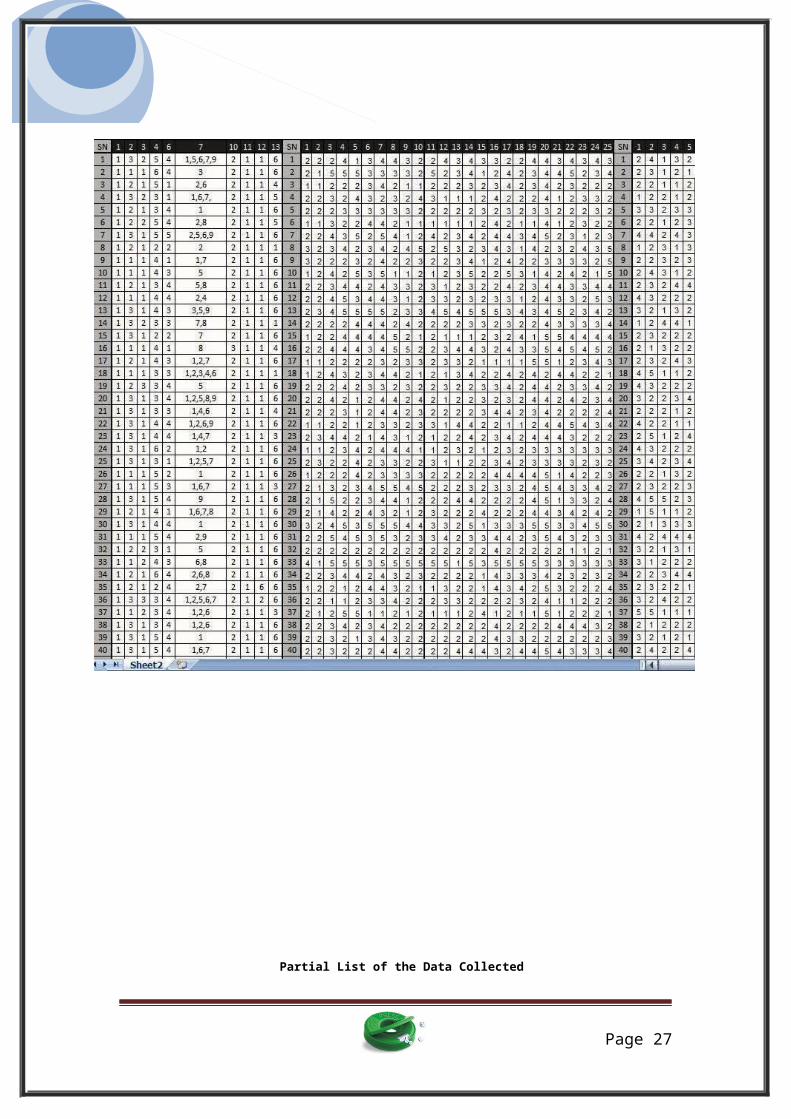
Partial List of the Data Collected
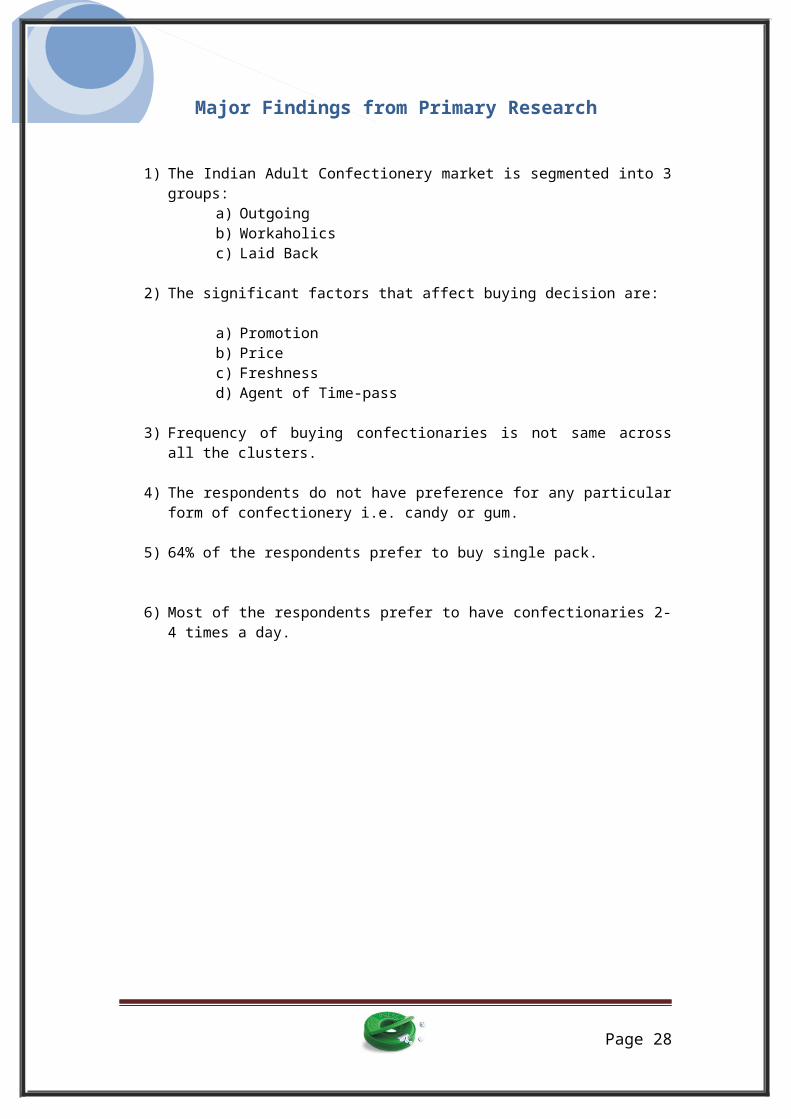
Major Findings from Primary Research
1) The Indian Adult Confectionery market is segmented into 3groups:
a) Outgoingb) Workaholicsc) Laid Back
2) The significant factors that affect buying decision are:
a) Promotionb) Pricec) Freshnessd) Agent of Time-pass
3) Frequency of buying confectionaries is not same acrossall the clusters.
4) The respondents do not have preference for any particularform of confectionery i.e. candy or gum.
5) 64% of the respondents prefer to buy single pack.
6) Most of the respondents prefer to have confectionaries 2-4 times a day.
Page 28
Data Analysis & Testing
Scale - Reliability Analysis
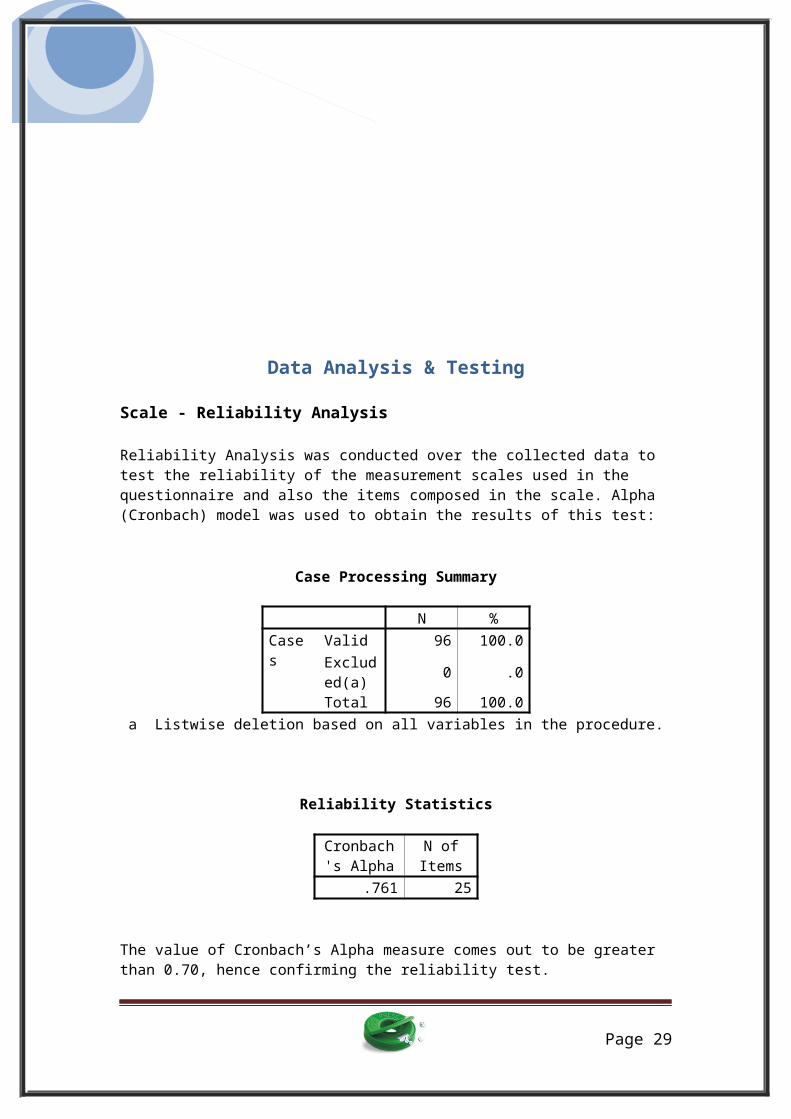
Reliability Analysis was conducted over the collected data to test the reliability of the measurement scales used in the questionnaire and also the items composed in the scale. Alpha (Cronbach) model was used to obtain the results of this test:
Case Processing Summary
N %Cases
Valid 96 100.0Excluded(a) 0 .0
Total 96 100.0a Listwise deletion based on all variables in the procedure.
Reliability Statistics
Cronbach's Alpha
N ofItems
.761 25
The value of Cronbach’s Alpha measure comes out to be greater than 0.70, hence confirming the reliability test.
Page 29
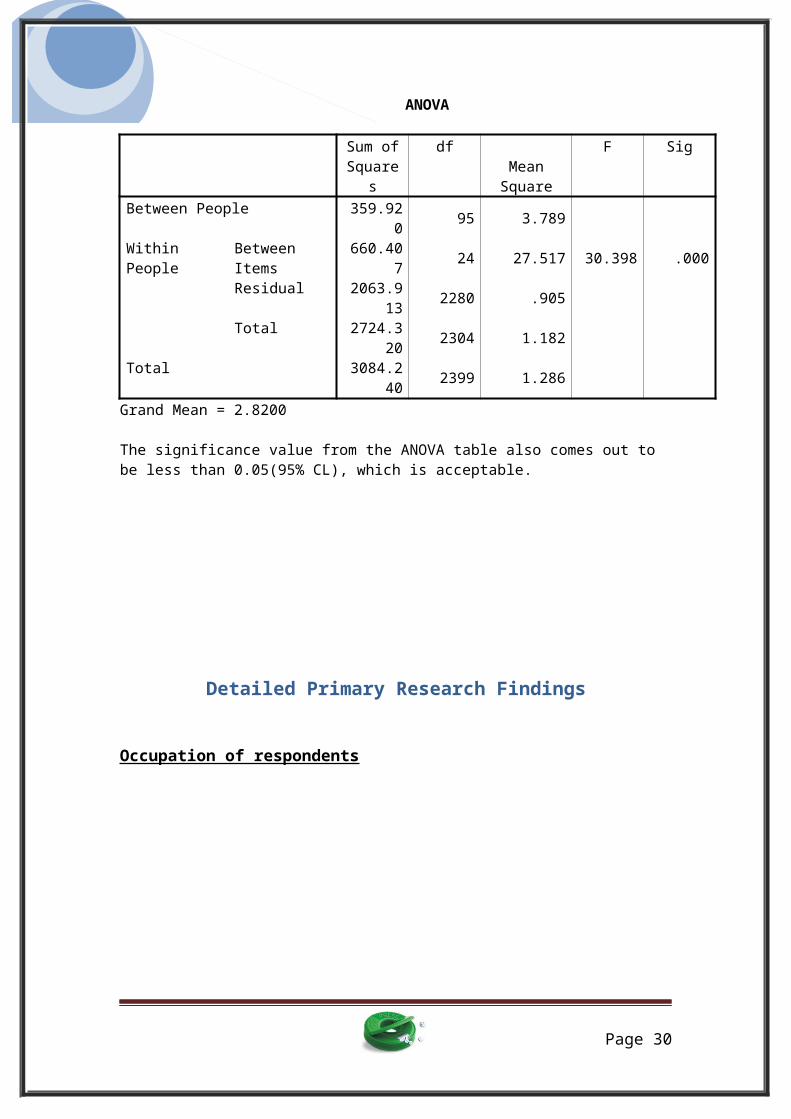
ANOVA
Sum ofSquare
s
dfMean
Square
F Sig
Between People 359.920 95 3.789
Within People
Between Items
660.407 24 27.517 30.398 .000
Residual 2063.913 2280 .905
Total 2724.320 2304 1.182
Total 3084.240 2399 1.286
Grand Mean = 2.8200
The significance value from the ANOVA table also comes out to be less than 0.05(95% CL), which is acceptable.
Detailed Primary Research Findings
Occupation of respondents
Page 30

89%
11%StudentsWorking Professionals
Preference for type of confectionery
24%
34%
42%
Preference for type of Confectionary
CandyChweing GumNothing Specific
Preference for sizes in which confectionaries are bought
Page 31
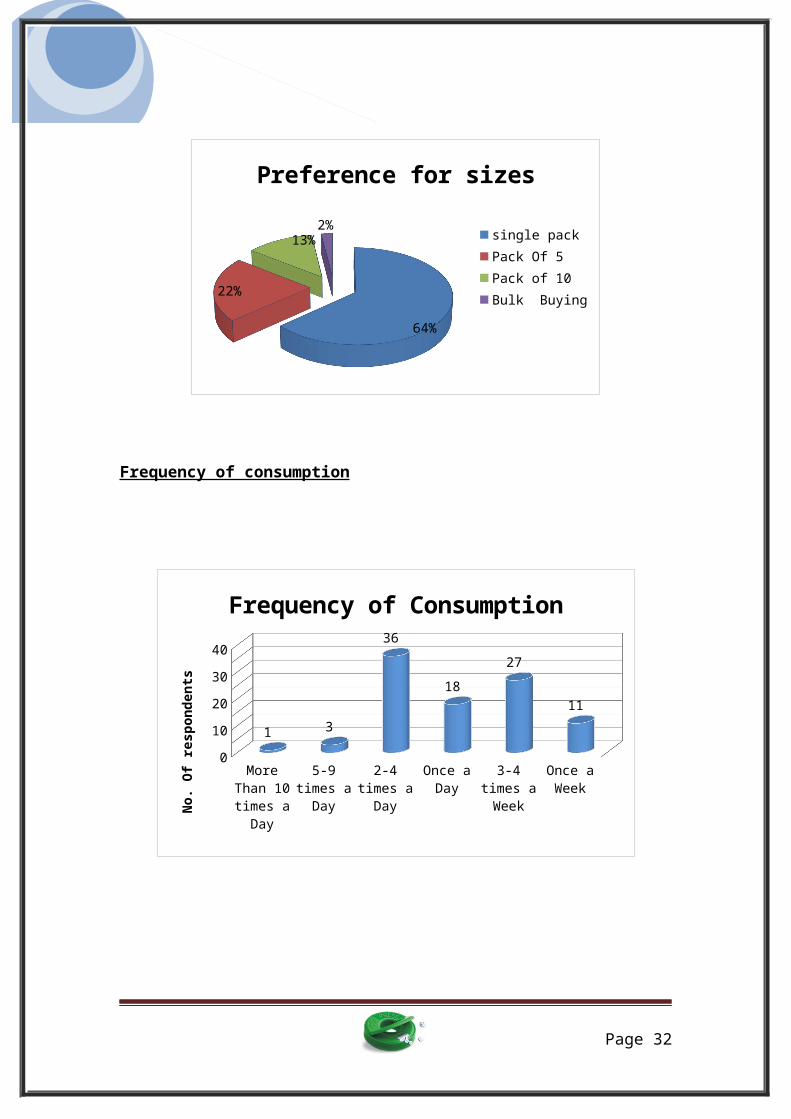
64%
22%
13%2%
Preference for sizes
single packPack Of 5Pack of 10Bulk Buying
Frequency of consumption
More Than 10 times a Day
5-9 times a Day
2-4 times a Day
Once a Day
3-4 times a Week
Once a Week
010
2030
40
1 3
36
1827
11
Frequency of Consumption
No.
Of r
espo
nden
ts
Page 32

Occasions of consumption
After Meals
After Smoking
Whenever I want fun
NO Specific Occasion
0102030405060
20
616
54
Occasions of Consumption
NO.
Of R
espo
nden
ts
Brand Preference
21%
15%
3%
7%14%14%
11%
10%4%2%
Brand Preference MentosCenterfreshMinto FreshChlormintHappydentPoloPaan PasandWrigley'sCentre ShockOthers
Page 33
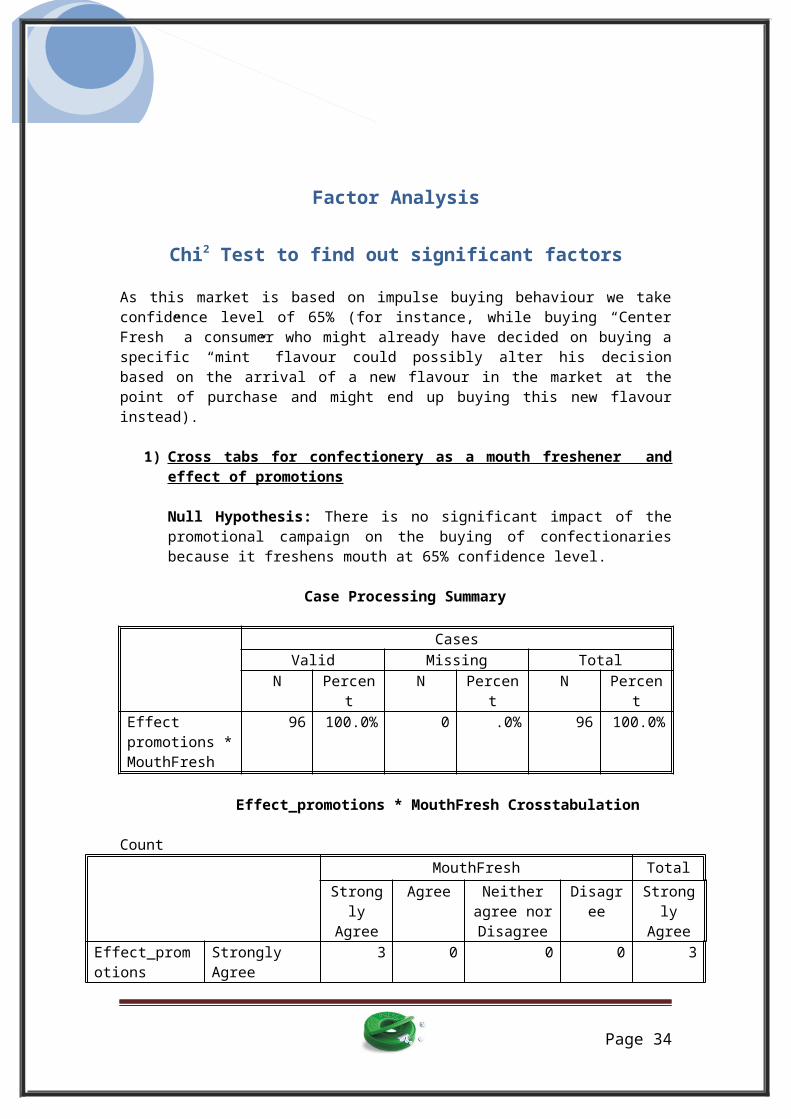
Factor Analysis
Chi2 Test to find out significant factors
As this market is based on impulse buying behaviour we takeconfidence level of 65% (for instance, while buying “CenterFresh” a consumer who might already have decided on buying aspecific “mint” flavour could possibly alter his decisionbased on the arrival of a new flavour in the market at thepoint of purchase and might end up buying this new flavourinstead).
1) Cross tabs for confectionery as a mouth freshener and effect of promotions
Null Hypothesis: There is no significant impact of thepromotional campaign on the buying of confectionariesbecause it freshens mouth at 65% confidence level.
Case Processing Summary
CasesValid Missing Total
N Percent
N Percent
N Percent
Effect promotions *MouthFresh
96 100.0% 0 .0% 96 100.0%
Effect_promotions * MouthFresh Crosstabulation
Count MouthFresh Total
Strongly
Agree
Agree Neitheragree norDisagree
Disagree
Strongly
AgreeEffect_promotions
Strongly Agree
3 0 0 0 3
Page 34
Agree 11 19 1 0 31Neither agree nor Disagree
7 17 3 1 28
Disagree 9 15 1 1 26Strongly Disagree
1 5 2 0 8
Total 31 56 7 2 96
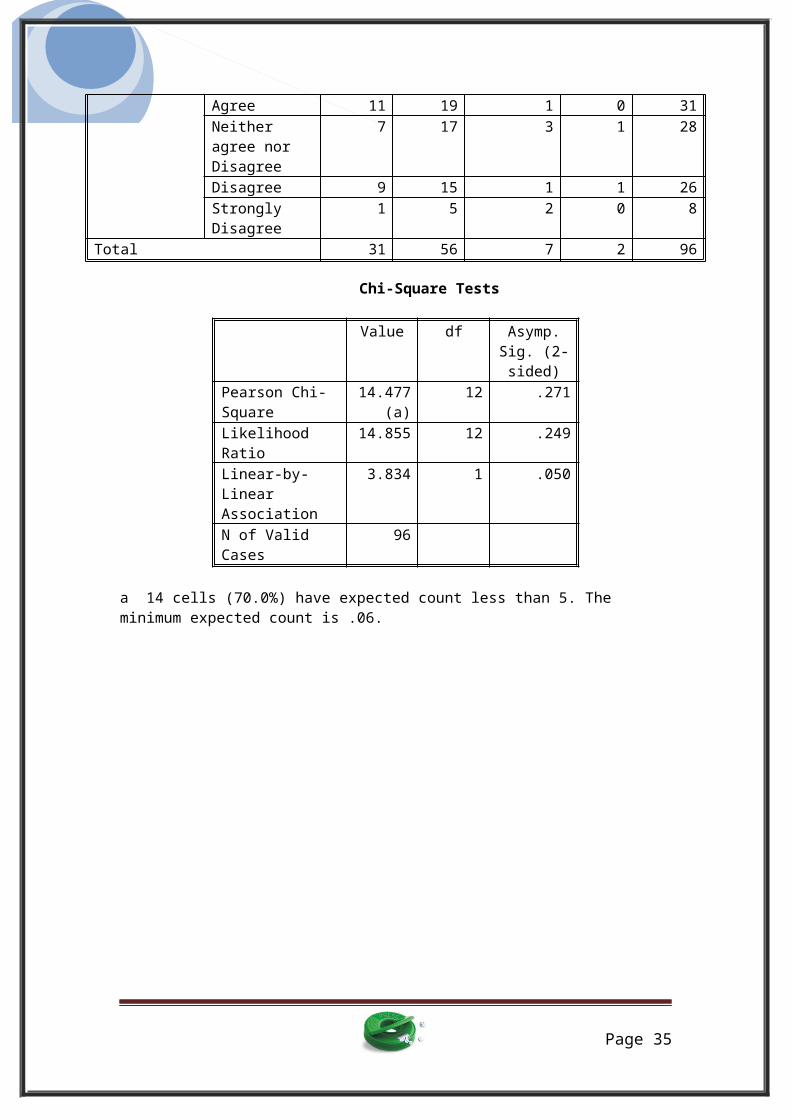
Chi-Square Tests
Value df Asymp.Sig. (2-sided)
Pearson Chi-Square
14.477(a)
12 .271
Likelihood Ratio
14.855 12 .249
Linear-by-Linear Association
3.834 1 .050
N of Valid Cases
96
a 14 cells (70.0%) have expected count less than 5. The minimum expected count is .06.
Page 35
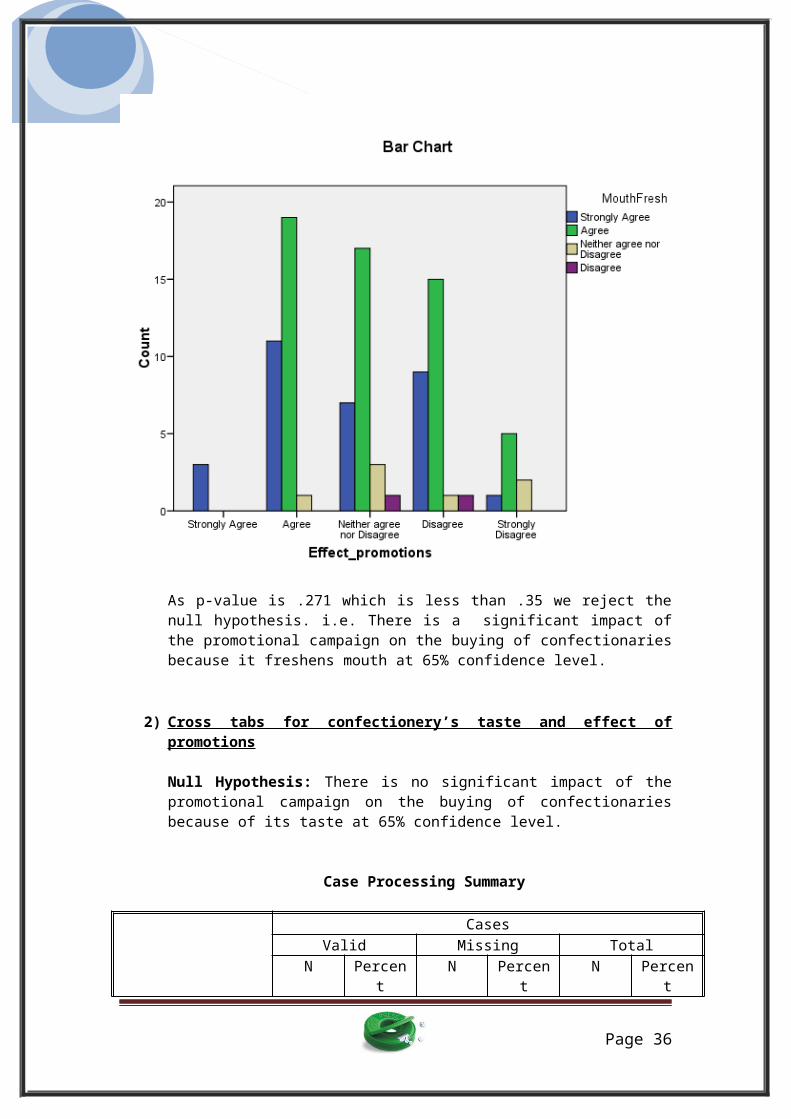
As p-value is .271 which is less than .35 we reject thenull hypothesis. i.e. There is a significant impact ofthe promotional campaign on the buying of confectionariesbecause it freshens mouth at 65% confidence level.
2) Cross tabs for confectionery’s taste and effect of promotions
Null Hypothesis: There is no significant impact of thepromotional campaign on the buying of confectionariesbecause of its taste at 65% confidence level.
Case Processing Summary
CasesValid Missing Total
N Percent
N Percent
N Percent
Page 36
Effect_promotions * Taste
96 100.0% 0 .0% 96 100.0%
Effect_promotions * Taste CrosstabulationCount
Taste TotalStrong
lyAgree
Agree Neitheragree norDisagree
Disagree
Strongly
AgreeEffect_promotions
Strongly Agree
1 2 0 0 3
Agree 7 19 4 1 31Neither agree nor Disagree
9 15 3 1 28
Disagree 7 17 2 0 26Strongly Disagree
1 5 2 0 8
Total 25 58 11 2 96
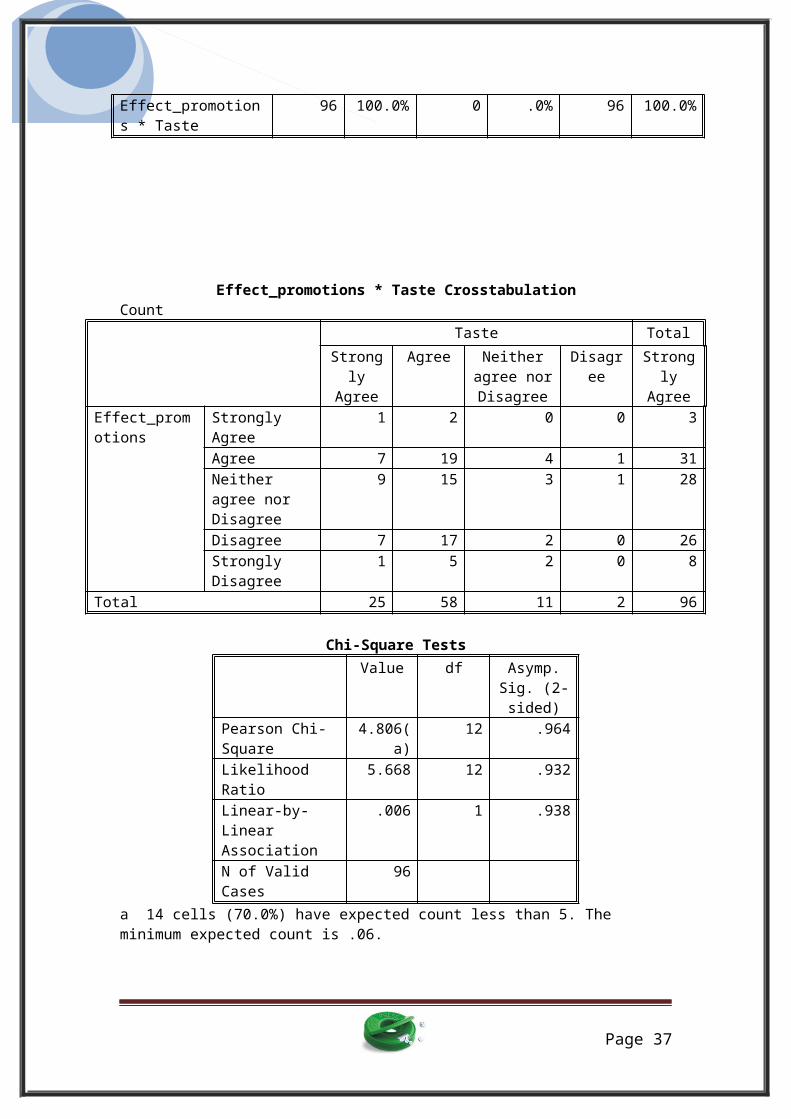
Chi-Square Tests Value df Asymp.
Sig. (2-sided)
Pearson Chi-Square
4.806(a)
12 .964
Likelihood Ratio
5.668 12 .932
Linear-by-Linear Association
.006 1 .938
N of Valid Cases
96
a 14 cells (70.0%) have expected count less than 5. The minimum expected count is .06.
Page 37
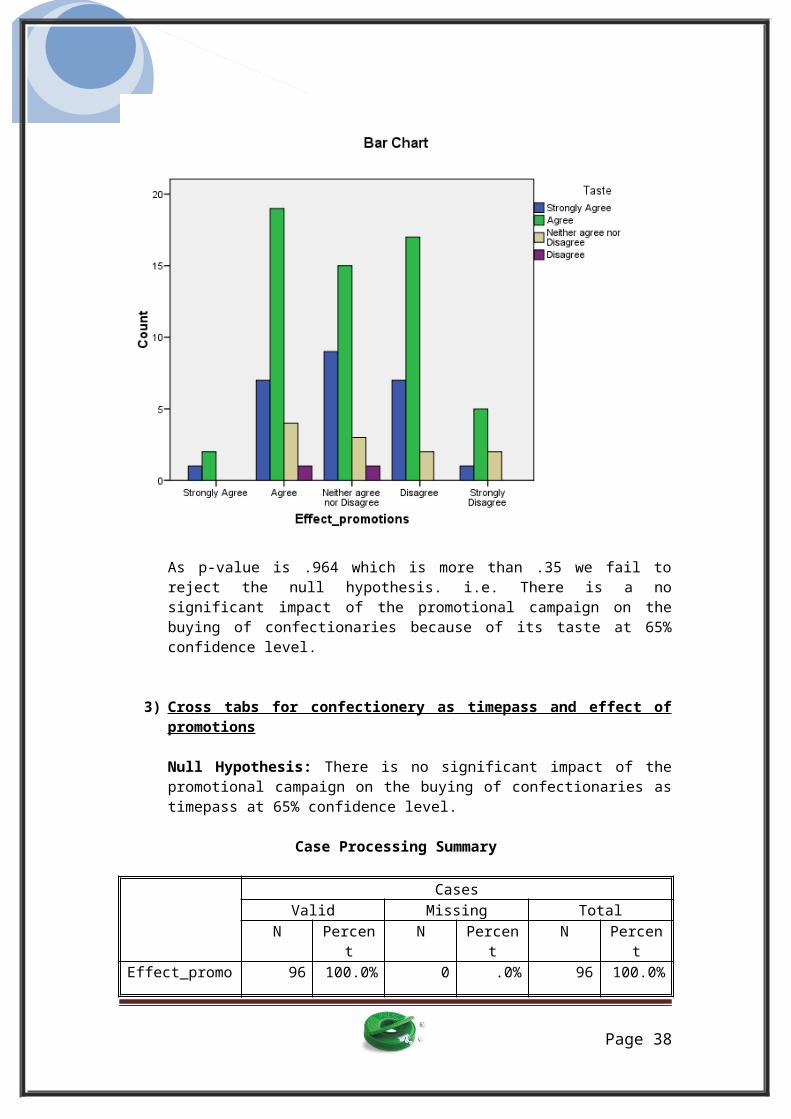
As p-value is .964 which is more than .35 we fail toreject the null hypothesis. i.e. There is a nosignificant impact of the promotional campaign on thebuying of confectionaries because of its taste at 65%confidence level.
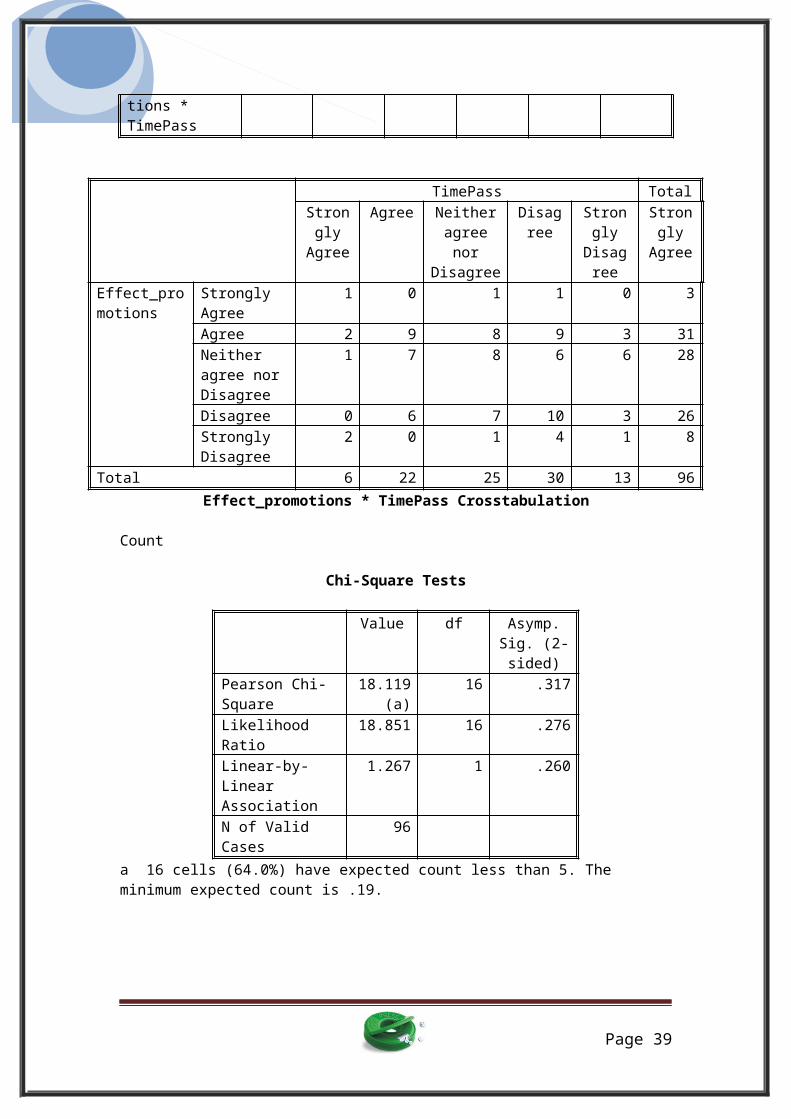
3) Cross tabs for confectionery as timepass and effect of promotions
Null Hypothesis: There is no significant impact of thepromotional campaign on the buying of confectionaries astimepass at 65% confidence level.
Case Processing Summary
CasesValid Missing Total
N Percent
N Percent
N Percent
Effect_promo 96 100.0% 0 .0% 96 100.0%
Page 38
tions * TimePass
TimePass TotalStrongly
Agree
Agree Neitheragreenor
Disagree
Disagree
Strongly
Disagree
StronglyAgree
Effect_promotions
Strongly Agree
1 0 1 1 0 3
Agree 2 9 8 9 3 31Neither agree nor Disagree
1 7 8 6 6 28
Disagree 0 6 7 10 3 26Strongly Disagree
2 0 1 4 1 8
Total 6 22 25 30 13 96Effect_promotions * TimePass Crosstabulation
Count
Chi-Square Tests
Value df Asymp.Sig. (2-sided)
Pearson Chi-Square
18.119(a)
16 .317
Likelihood Ratio
18.851 16 .276
Linear-by-Linear Association
1.267 1 .260
N of Valid Cases
96
a 16 cells (64.0%) have expected count less than 5. The minimum expected count is .19.
Page 39
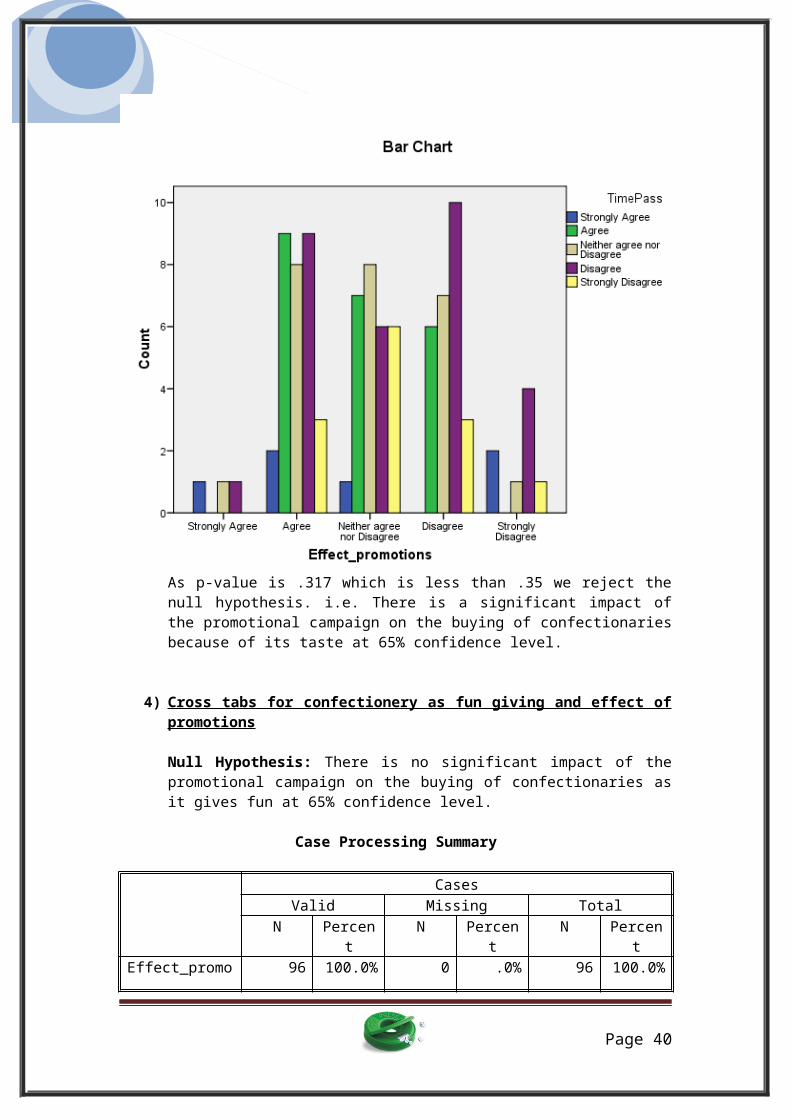
As p-value is .317 which is less than .35 we reject thenull hypothesis. i.e. There is a significant impact ofthe promotional campaign on the buying of confectionariesbecause of its taste at 65% confidence level.
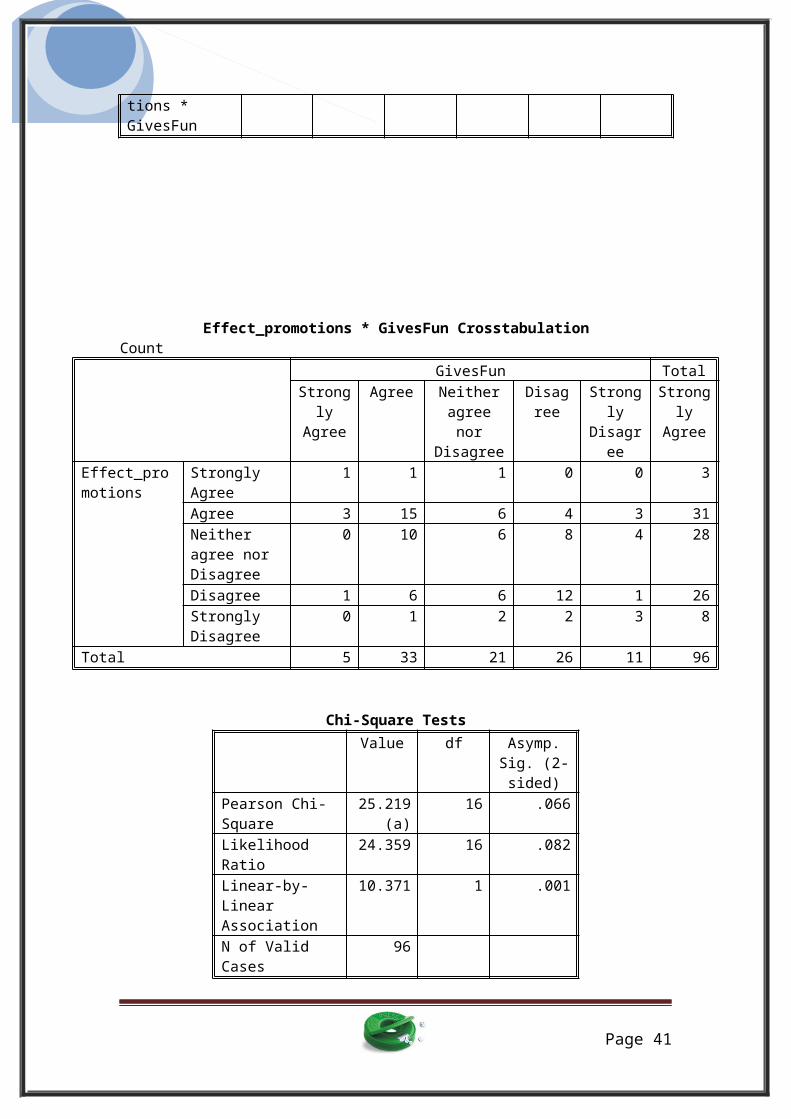
4) Cross tabs for confectionery as fun giving and effect of promotions
Null Hypothesis: There is no significant impact of thepromotional campaign on the buying of confectionaries asit gives fun at 65% confidence level.
Case Processing Summary
CasesValid Missing Total
N Percent
N Percent
N Percent
Effect_promo 96 100.0% 0 .0% 96 100.0%
Page 40
tions * GivesFun
Effect_promotions * GivesFun CrosstabulationCount
GivesFun TotalStrongly
Agree
Agree Neitheragreenor
Disagree
Disagree
Strongly
Disagree
Strongly
Agree
Effect_promotions
Strongly Agree
1 1 1 0 0 3
Agree 3 15 6 4 3 31Neither agree nor Disagree
0 10 6 8 4 28
Disagree 1 6 6 12 1 26Strongly Disagree
0 1 2 2 3 8
Total 5 33 21 26 11 96
Chi-Square Tests Value df Asymp.
Sig. (2-sided)
Pearson Chi-Square
25.219(a)
16 .066
Likelihood Ratio
24.359 16 .082
Linear-by-Linear Association
10.371 1 .001
N of Valid Cases
96
Page 41
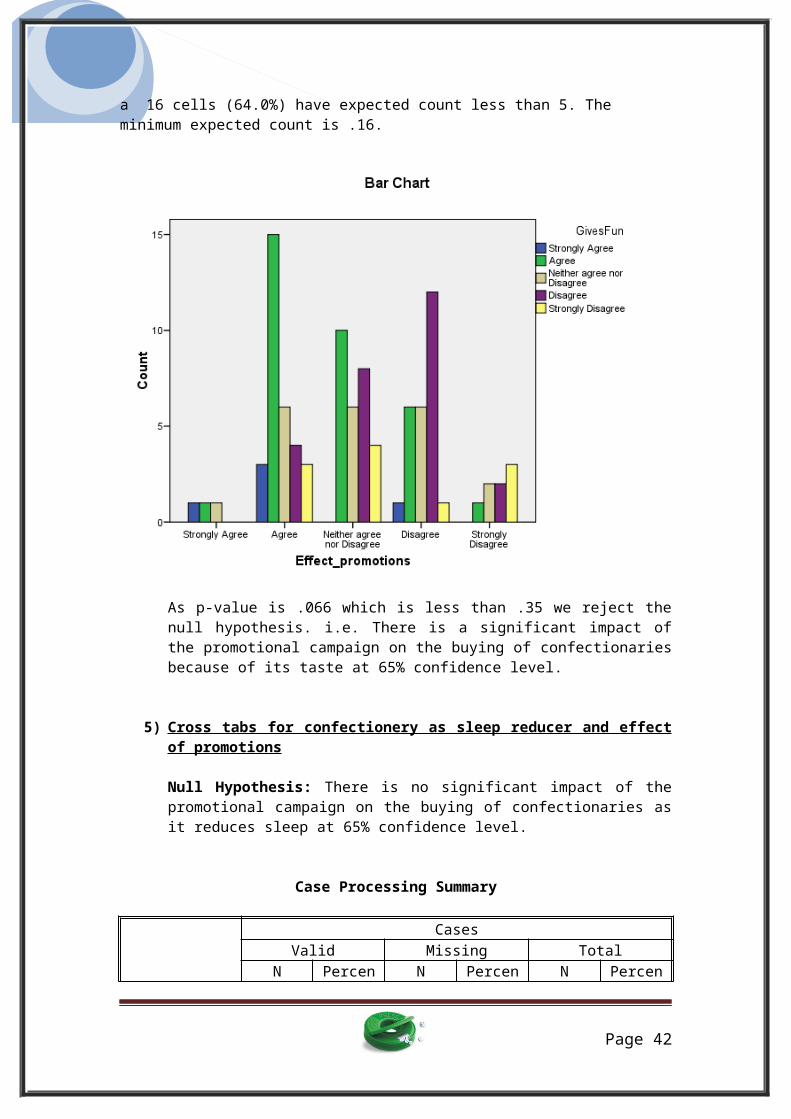
a 16 cells (64.0%) have expected count less than 5. The minimum expected count is .16.
As p-value is .066 which is less than .35 we reject thenull hypothesis. i.e. There is a significant impact ofthe promotional campaign on the buying of confectionariesbecause of its taste at 65% confidence level.
5) Cross tabs for confectionery as sleep reducer and effect of promotions
Null Hypothesis: There is no significant impact of thepromotional campaign on the buying of confectionaries asit reduces sleep at 65% confidence level.
Case Processing Summary
CasesValid Missing Total
N Percen N Percen N Percen
Page 42

t t tEffect_promotions * ReducesSleep
96 100.0% 0 .0% 96 100.0%
Effect_promotions * ReducesSleep Crosstabulation
Count ReducesSleep Total
Strongly
Agree
Agree Neitheragreenor
Disagree
Disagree
Strongly
Disagree
Strongly
Agree
Effect_promotions
Strongly Agree
1 0 0 1 1 3
Agree 3 13 5 8 2 31Neither agree norDisagree
2 9 4 7 6 28
Disagree 1 9 1 11 4 26Strongly Disagree
1 1 2 2 2 8
Total 8 32 12 29 15 96
Chi-Square Tests
Value df Asymp.Sig. (2-sided)
Pearson Chi-Square
14.363(a)
16 .572
Likelihood Ratio
15.587 16 .482
Linear-by-Linear Association
2.110 1 .146
N of Valid Cases
96
Page 43
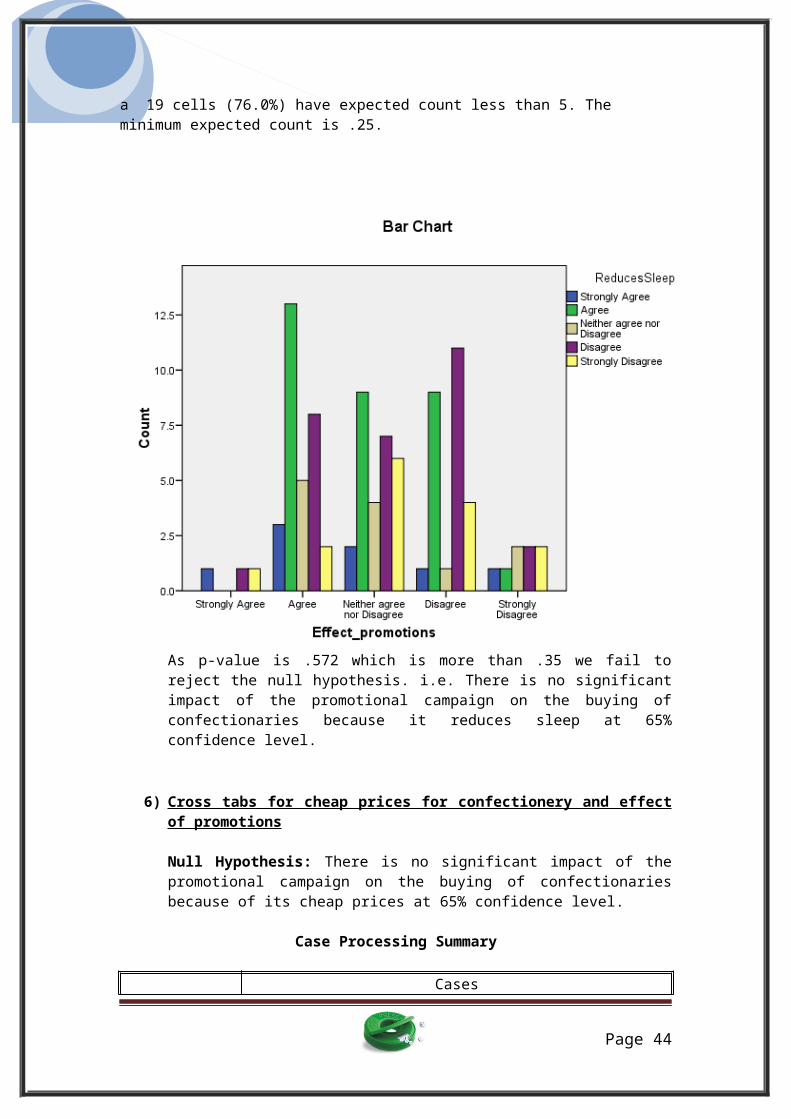
a 19 cells (76.0%) have expected count less than 5. The minimum expected count is .25.
As p-value is .572 which is more than .35 we fail toreject the null hypothesis. i.e. There is no significantimpact of the promotional campaign on the buying ofconfectionaries because it reduces sleep at 65%confidence level.
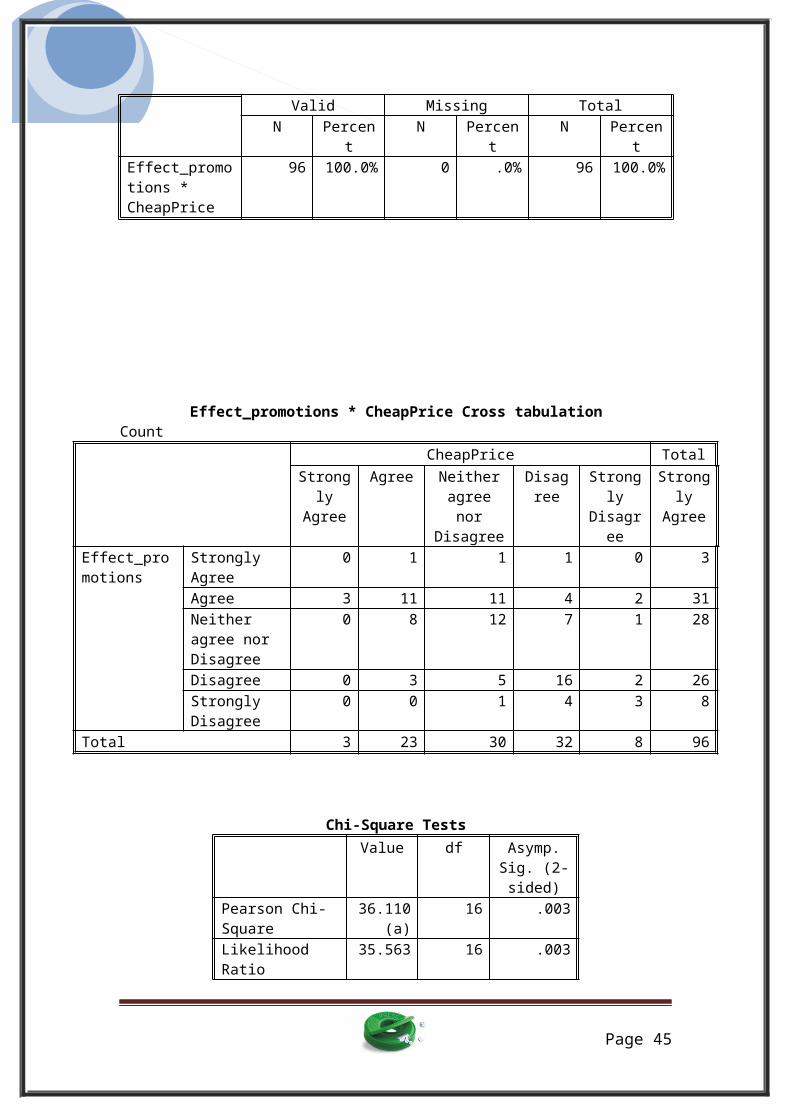
6) Cross tabs for cheap prices for confectionery and effect of promotions
Null Hypothesis: There is no significant impact of thepromotional campaign on the buying of confectionariesbecause of its cheap prices at 65% confidence level.
Case Processing Summary
Cases
Page 44
Valid Missing TotalN Percen
tN Percen
tN Percen
tEffect_promotions * CheapPrice
96 100.0% 0 .0% 96 100.0%
Effect_promotions * CheapPrice Cross tabulationCount
CheapPrice TotalStrongly
Agree
Agree Neitheragreenor
Disagree
Disagree
Strongly
Disagree
Strongly
Agree
Effect_promotions
Strongly Agree
0 1 1 1 0 3
Agree 3 11 11 4 2 31Neither agree nor Disagree
0 8 12 7 1 28
Disagree 0 3 5 16 2 26Strongly Disagree
0 0 1 4 3 8
Total 3 23 30 32 8 96
Chi-Square Tests Value df Asymp.
Sig. (2-sided)
Pearson Chi-Square
36.110(a)
16 .003
Likelihood Ratio
35.563 16 .003
Page 45
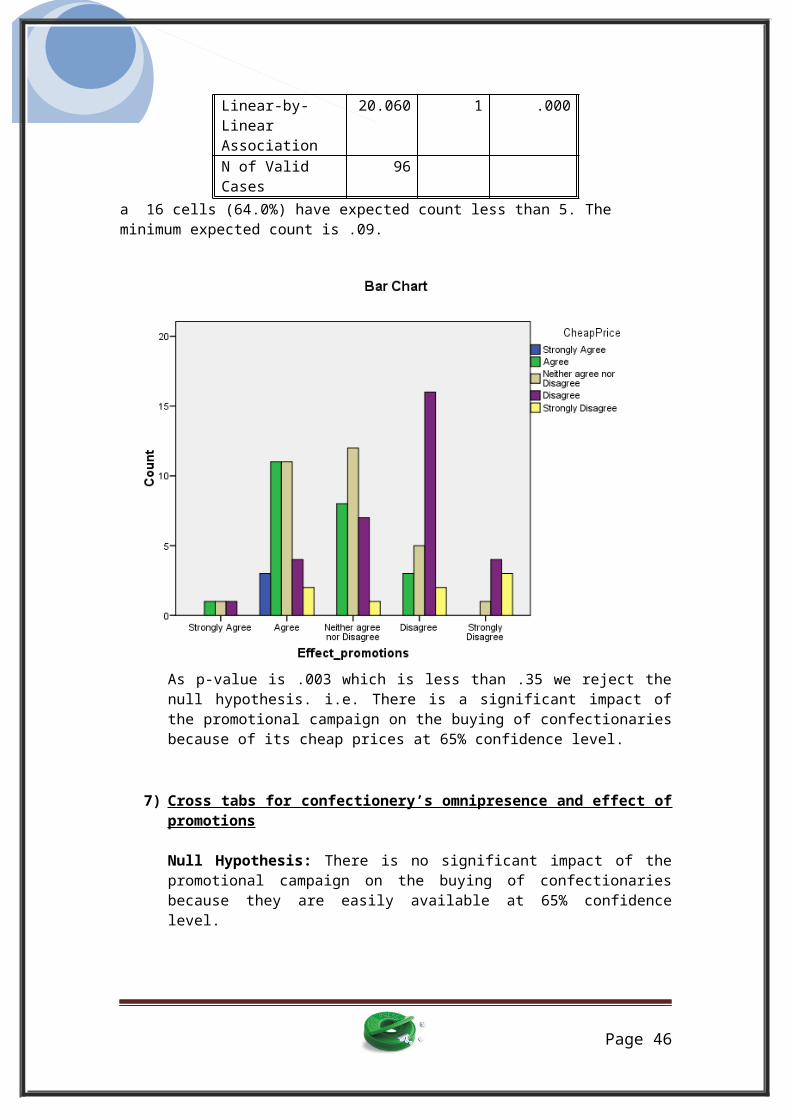
Linear-by-Linear Association
20.060 1 .000
N of Valid Cases
96
a 16 cells (64.0%) have expected count less than 5. The minimum expected count is .09.
As p-value is .003 which is less than .35 we reject thenull hypothesis. i.e. There is a significant impact ofthe promotional campaign on the buying of confectionariesbecause of its cheap prices at 65% confidence level.
7) Cross tabs for confectionery’s omnipresence and effect of promotions
Null Hypothesis: There is no significant impact of thepromotional campaign on the buying of confectionariesbecause they are easily available at 65% confidencelevel.
Page 46
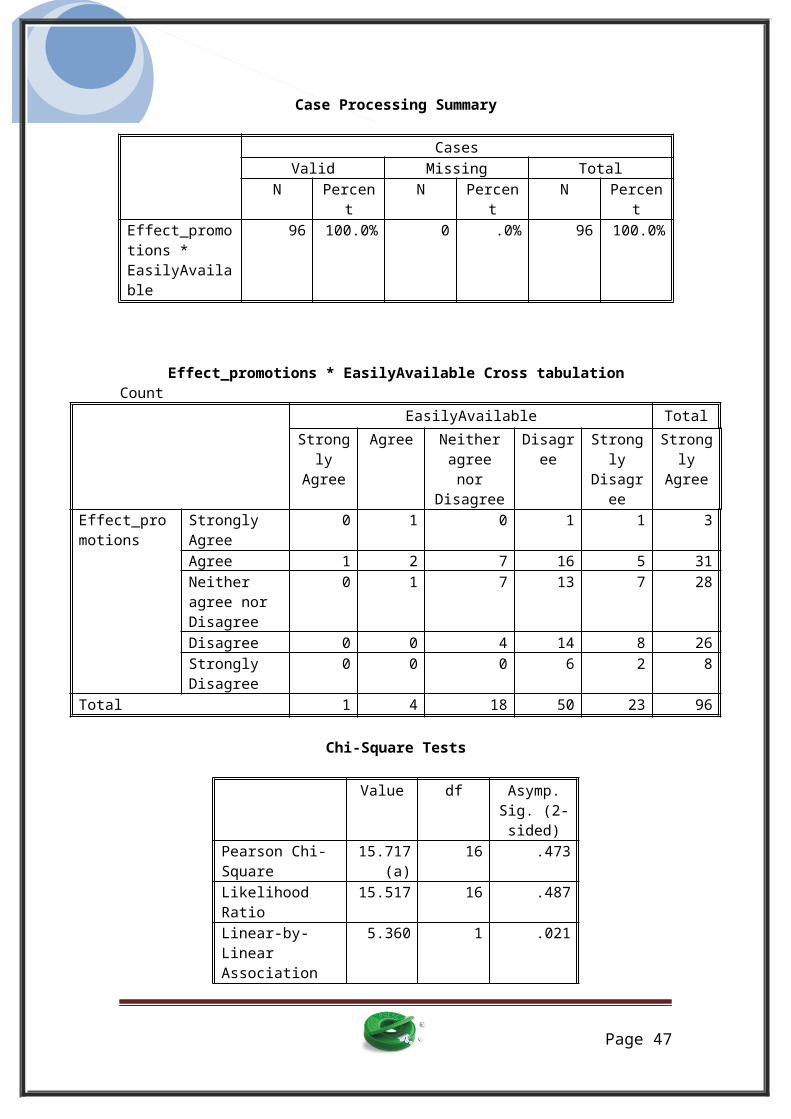
Case Processing Summary
CasesValid Missing Total
N Percent
N Percent
N Percent
Effect_promotions * EasilyAvailable
96 100.0% 0 .0% 96 100.0%
Effect_promotions * EasilyAvailable Cross tabulationCount
EasilyAvailable TotalStrongly
Agree
Agree Neitheragreenor
Disagree
Disagree
Strongly
Disagree
Strongly
Agree
Effect_promotions
Strongly Agree
0 1 0 1 1 3
Agree 1 2 7 16 5 31Neither agree nor Disagree
0 1 7 13 7 28
Disagree 0 0 4 14 8 26Strongly Disagree
0 0 0 6 2 8
Total 1 4 18 50 23 96
Chi-Square Tests
Value df Asymp.Sig. (2-sided)
Pearson Chi-Square
15.717(a)
16 .473
Likelihood Ratio
15.517 16 .487
Linear-by-Linear Association
5.360 1 .021
Page 47
N of Valid Cases
96
a 17 cells (68.0%) have expected count less than 5. Theminimum expected count is .03.
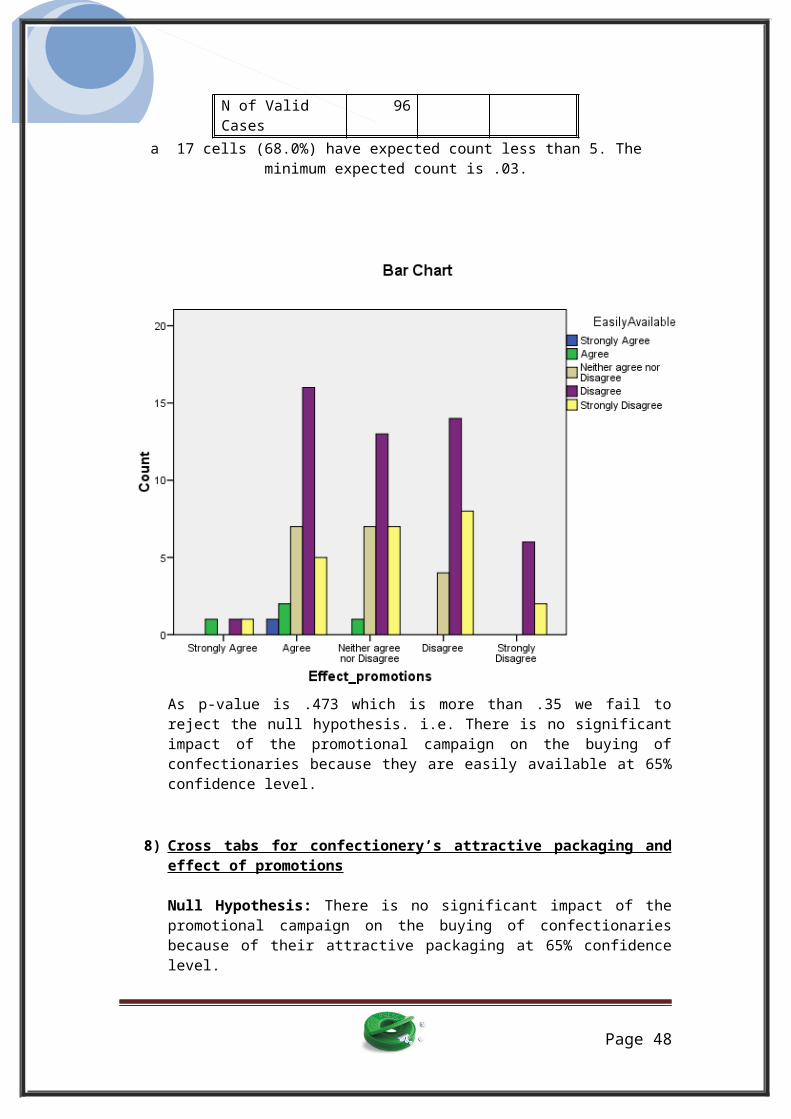
As p-value is .473 which is more than .35 we fail toreject the null hypothesis. i.e. There is no significantimpact of the promotional campaign on the buying ofconfectionaries because they are easily available at 65%confidence level.
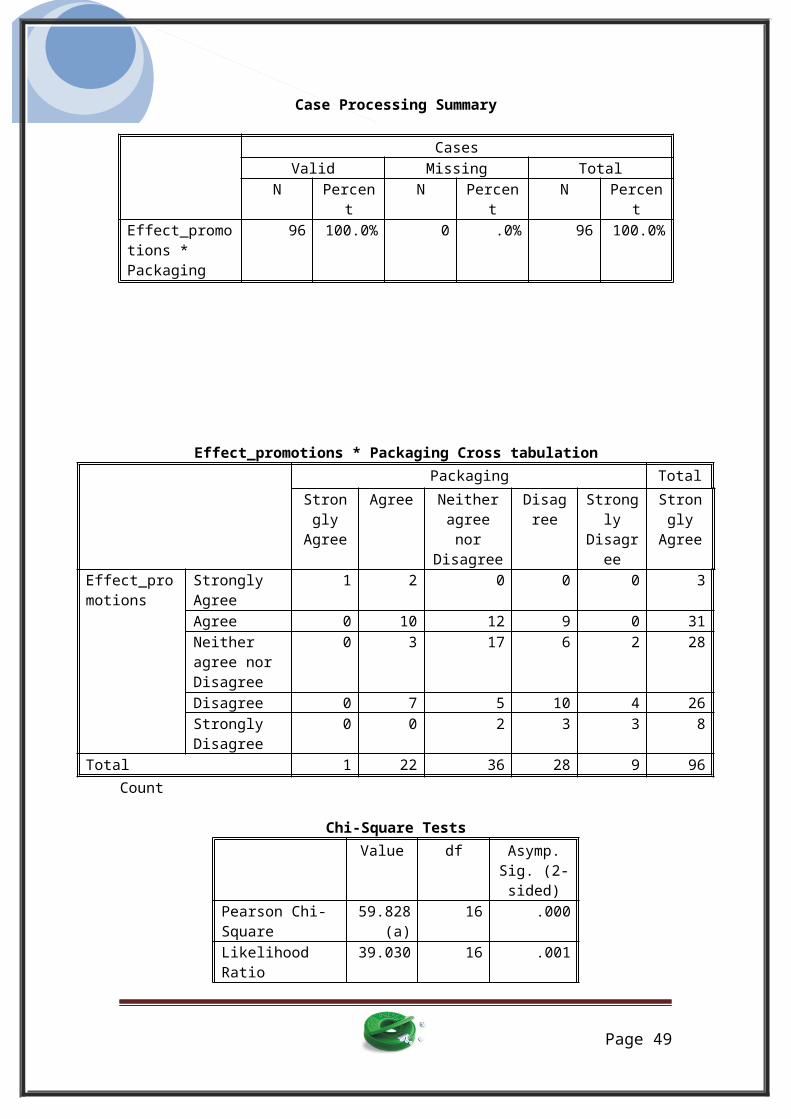
8) Cross tabs for confectionery’s attractive packaging and effect of promotions
Null Hypothesis: There is no significant impact of thepromotional campaign on the buying of confectionariesbecause of their attractive packaging at 65% confidencelevel.
Page 48
Case Processing Summary
CasesValid Missing Total
N Percent
N Percent
N Percent
Effect_promotions * Packaging
96 100.0% 0 .0% 96 100.0%
Effect_promotions * Packaging Cross tabulationPackaging Total
StronglyAgree
Agree Neitheragreenor
Disagree
Disagree
Strongly
Disagree
Strongly
Agree
Effect_promotions
Strongly Agree
1 2 0 0 0 3
Agree 0 10 12 9 0 31Neither agree nor Disagree
0 3 17 6 2 28
Disagree 0 7 5 10 4 26Strongly Disagree
0 0 2 3 3 8
Total 1 22 36 28 9 96Count
Chi-Square Tests Value df Asymp.
Sig. (2-sided)
Pearson Chi-Square
59.828(a)
16 .000
Likelihood Ratio
39.030 16 .001
Page 49
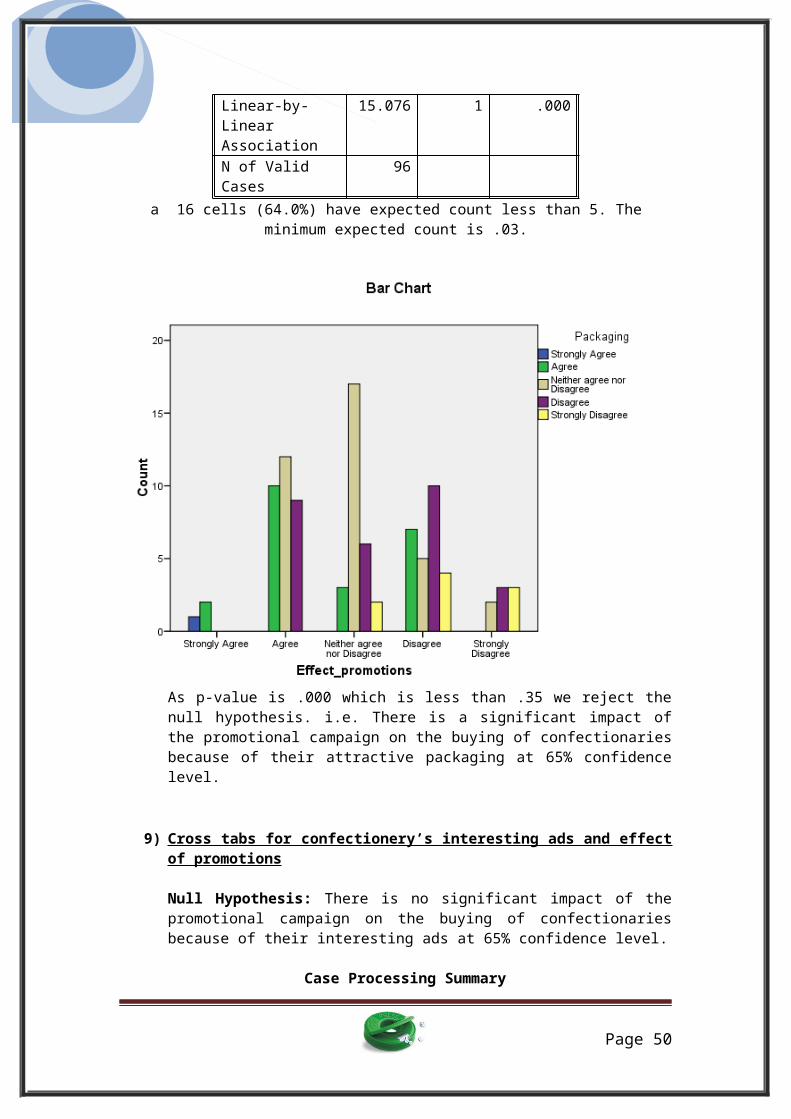
Linear-by-Linear Association
15.076 1 .000
N of Valid Cases
96
a 16 cells (64.0%) have expected count less than 5. Theminimum expected count is .03.
As p-value is .000 which is less than .35 we reject thenull hypothesis. i.e. There is a significant impact ofthe promotional campaign on the buying of confectionariesbecause of their attractive packaging at 65% confidencelevel.
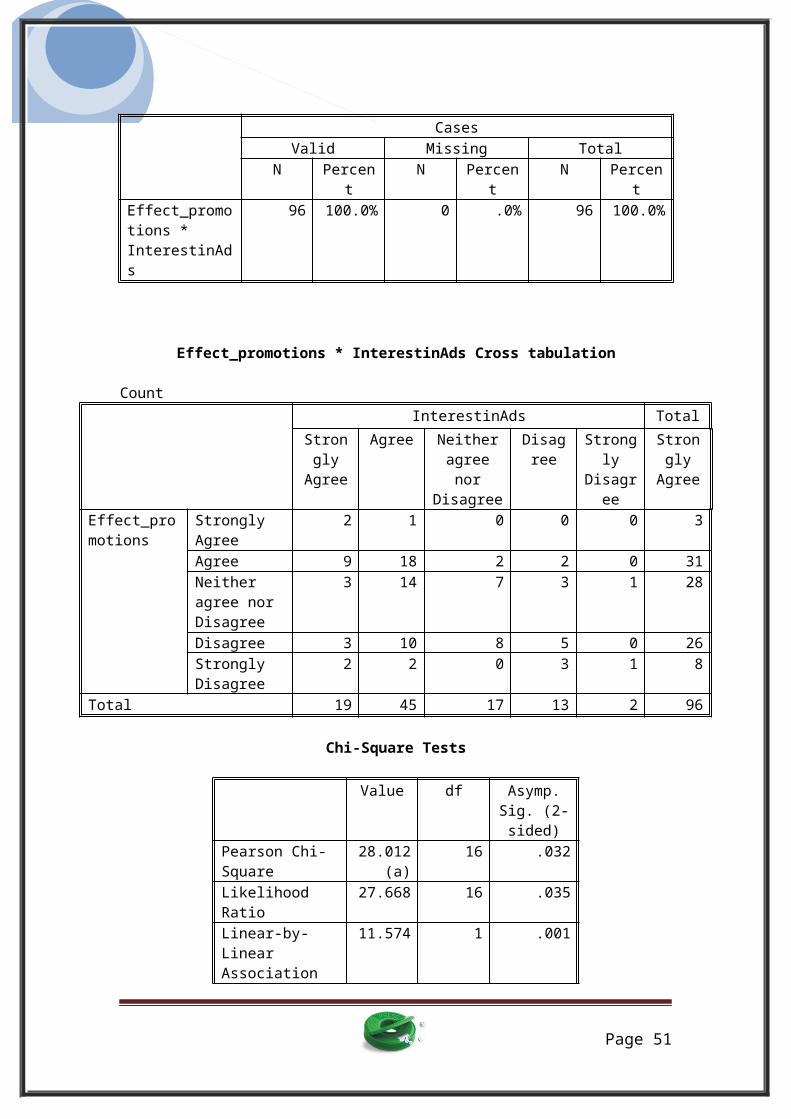
9) Cross tabs for confectionery’s interesting ads and effect of promotions
Null Hypothesis: There is no significant impact of thepromotional campaign on the buying of confectionariesbecause of their interesting ads at 65% confidence level.
Case Processing Summary
Page 50
CasesValid Missing Total
N Percent
N Percent
N Percent
Effect_promotions * InterestinAds
96 100.0% 0 .0% 96 100.0%
Effect_promotions * InterestinAds Cross tabulation
Count InterestinAds Total
StronglyAgree
Agree Neitheragreenor
Disagree
Disagree
Strongly
Disagree
Strongly
Agree
Effect_promotions
Strongly Agree
2 1 0 0 0 3
Agree 9 18 2 2 0 31Neither agree nor Disagree
3 14 7 3 1 28
Disagree 3 10 8 5 0 26Strongly Disagree
2 2 0 3 1 8
Total 19 45 17 13 2 96
Chi-Square Tests
Value df Asymp.Sig. (2-sided)
Pearson Chi-Square
28.012(a)
16 .032
Likelihood Ratio
27.668 16 .035
Linear-by-Linear Association
11.574 1 .001
Page 51
N of Valid Cases
96
a 18 cells (72.0%) have expected count less than 5. Theminimum expected count is .06.
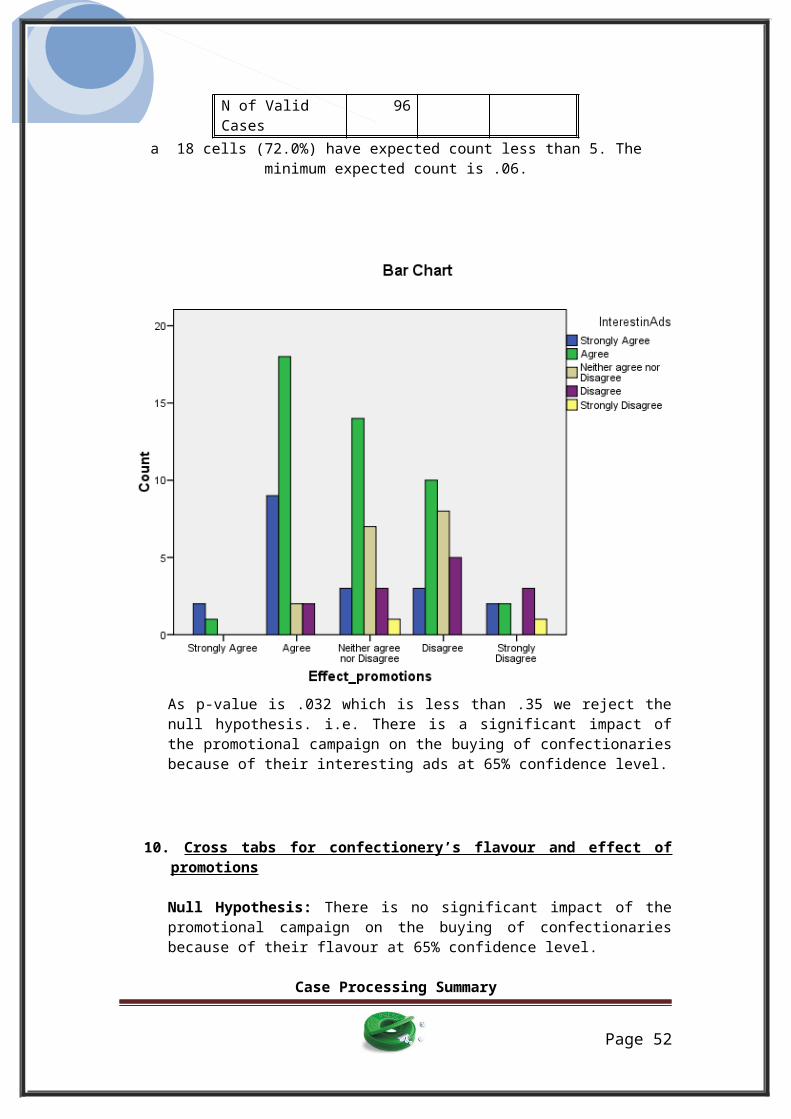
As p-value is .032 which is less than .35 we reject thenull hypothesis. i.e. There is a significant impact ofthe promotional campaign on the buying of confectionariesbecause of their interesting ads at 65% confidence level.
10. Cross tabs for confectionery’s flavour and effect ofpromotions
Null Hypothesis: There is no significant impact of thepromotional campaign on the buying of confectionariesbecause of their flavour at 65% confidence level.
Case Processing Summary
Page 52
CasesValid Missing Total
N Percent
N Percent
N Percent
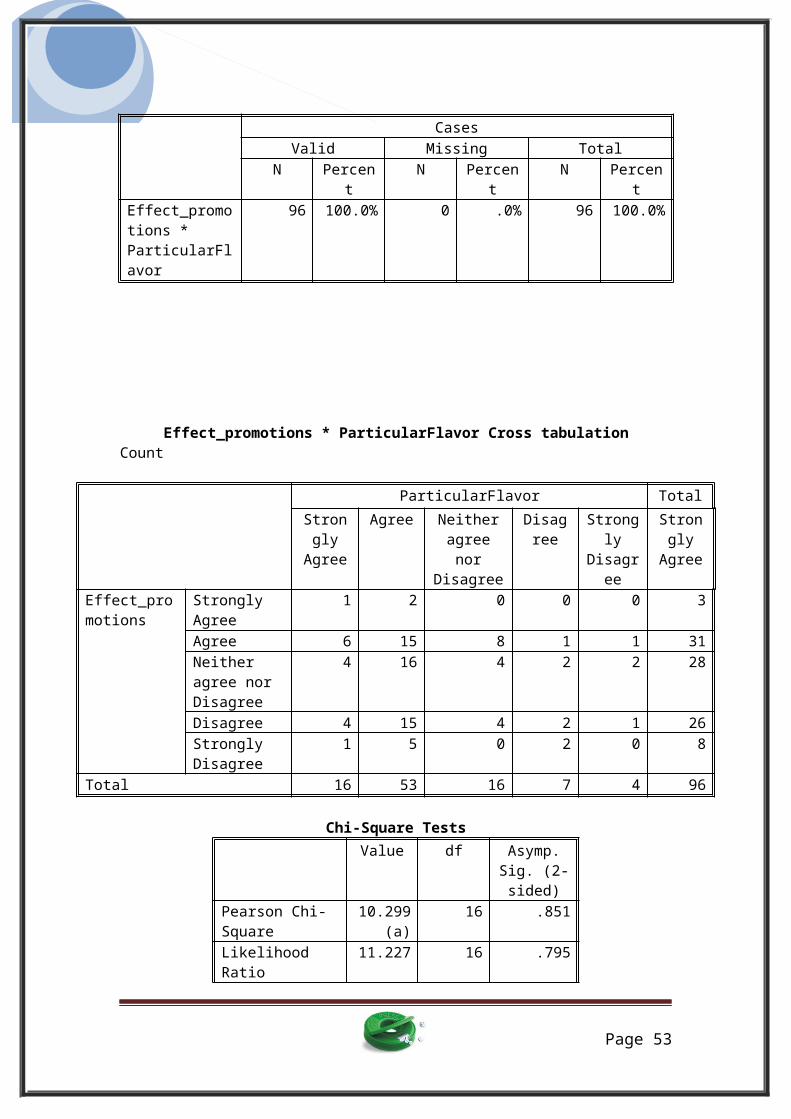
Effect_promotions * ParticularFlavor
96 100.0% 0 .0% 96 100.0%
Effect_promotions * ParticularFlavor Cross tabulationCount
ParticularFlavor TotalStronglyAgree
Agree Neitheragreenor
Disagree
Disagree
Strongly
Disagree
Strongly
Agree
Effect_promotions
Strongly Agree
1 2 0 0 0 3
Agree 6 15 8 1 1 31Neither agree nor Disagree
4 16 4 2 2 28
Disagree 4 15 4 2 1 26Strongly Disagree
1 5 0 2 0 8
Total 16 53 16 7 4 96
Chi-Square Tests Value df Asymp.
Sig. (2-sided)
Pearson Chi-Square
10.299(a)
16 .851
Likelihood Ratio
11.227 16 .795
Page 53
Linear-by-Linear Association
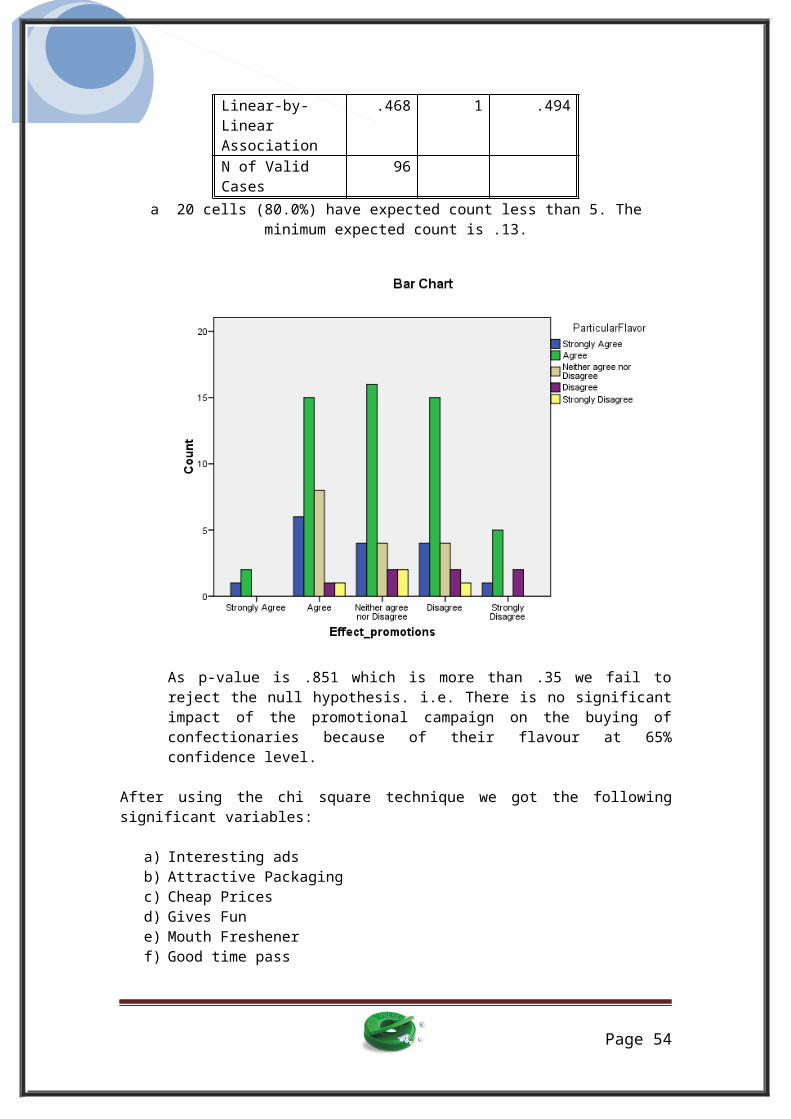
.468 1 .494
N of Valid Cases
96
a 20 cells (80.0%) have expected count less than 5. Theminimum expected count is .13.
As p-value is .851 which is more than .35 we fail toreject the null hypothesis. i.e. There is no significantimpact of the promotional campaign on the buying ofconfectionaries because of their flavour at 65%confidence level.
After using the chi square technique we got the followingsignificant variables:
a) Interesting adsb) Attractive Packagingc) Cheap Pricesd) Gives Fune) Mouth Freshenerf) Good time pass
Page 54
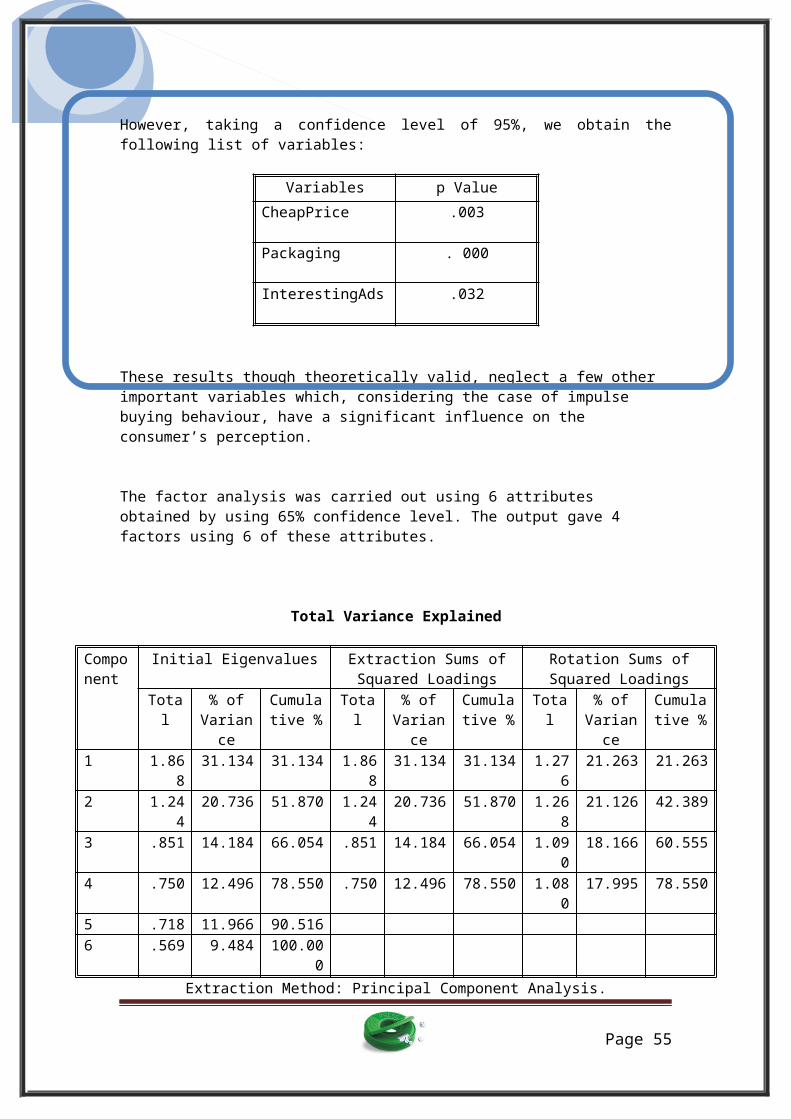
However, taking a confidence level of 95%, we obtain thefollowing list of variables:
Variables p ValueCheapPrice .003
Packaging . 000
InterestingAds .032
These results though theoretically valid, neglect a few other important variables which, considering the case of impulse buying behaviour, have a significant influence on the consumer’s perception.
The factor analysis was carried out using 6 attributes obtained by using 65% confidence level. The output gave 4 factors using 6 of these attributes.
Total Variance Explained
Component
Initial Eigenvalues Extraction Sums ofSquared Loadings
Rotation Sums ofSquared Loadings
Total
% ofVariance
Cumulative %
Total
% ofVariance
Cumulative %
Total
% ofVariance
Cumulative %
1 1.868
31.134 31.134 1.868
31.134 31.134 1.276
21.263 21.263
2 1.244
20.736 51.870 1.244
20.736 51.870 1.268
21.126 42.389
3 .851 14.184 66.054 .851 14.184 66.054 1.090
18.166 60.555
4 .750 12.496 78.550 .750 12.496 78.550 1.080
17.995 78.550
5 .718 11.966 90.5166 .569 9.484 100.00
0Extraction Method: Principal Component Analysis.
Page 55
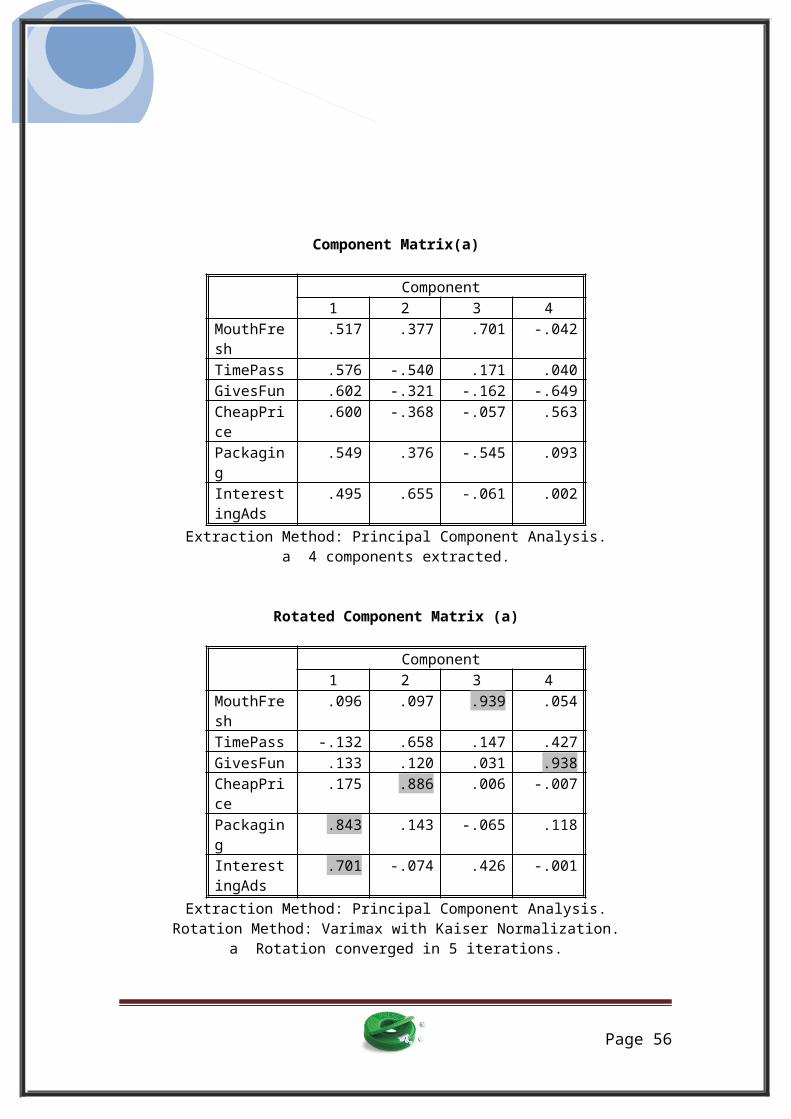
Component Matrix(a)
Component1 2 3 4
MouthFresh
.517 .377 .701 -.042
TimePass .576 -.540 .171 .040GivesFun .602 -.321 -.162 -.649CheapPrice
.600 -.368 -.057 .563
Packaging
.549 .376 -.545 .093
InterestingAds
.495 .655 -.061 .002
Extraction Method: Principal Component Analysis.a 4 components extracted.
Rotated Component Matrix (a)
Component1 2 3 4
MouthFresh
.096 .097 .939 .054
TimePass -.132 .658 .147 .427GivesFun .133 .120 .031 .938CheapPrice
.175 .886 .006 -.007
Packaging
.843 .143 -.065 .118
InterestingAds
.701 -.074 .426 -.001
Extraction Method: Principal Component Analysis.Rotation Method: Varimax with Kaiser Normalization.
a Rotation converged in 5 iterations.
Page 56
From the rotated component matrix we get 4 factors whichexplain 78% of the variation in the model. The components ofthe factors are as follows:
Component # Name Attributes1 Promotion Packaging, Interesting
Ads2 Price Cheap Price3 Freshness Mouth Fresh4 Time Pass Gives Fun
Perceptual Maps
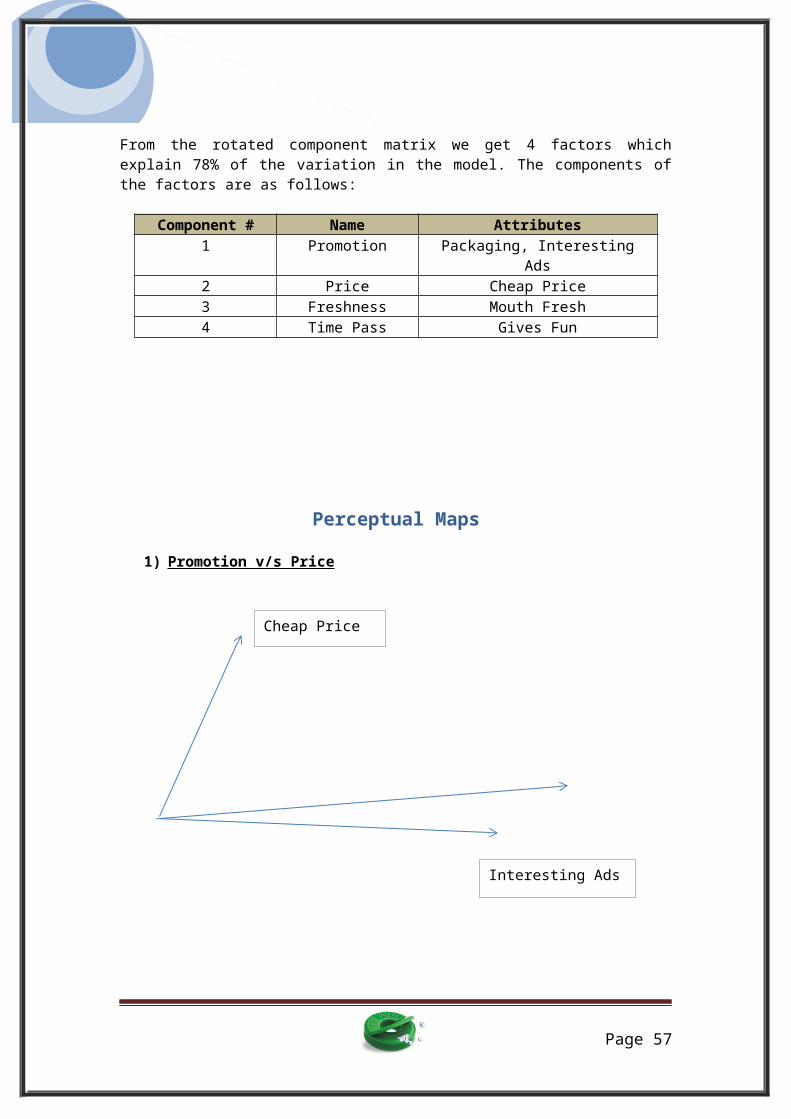
1) Promotion v/s Price
Page 57
Cheap Price
Interesting Ads
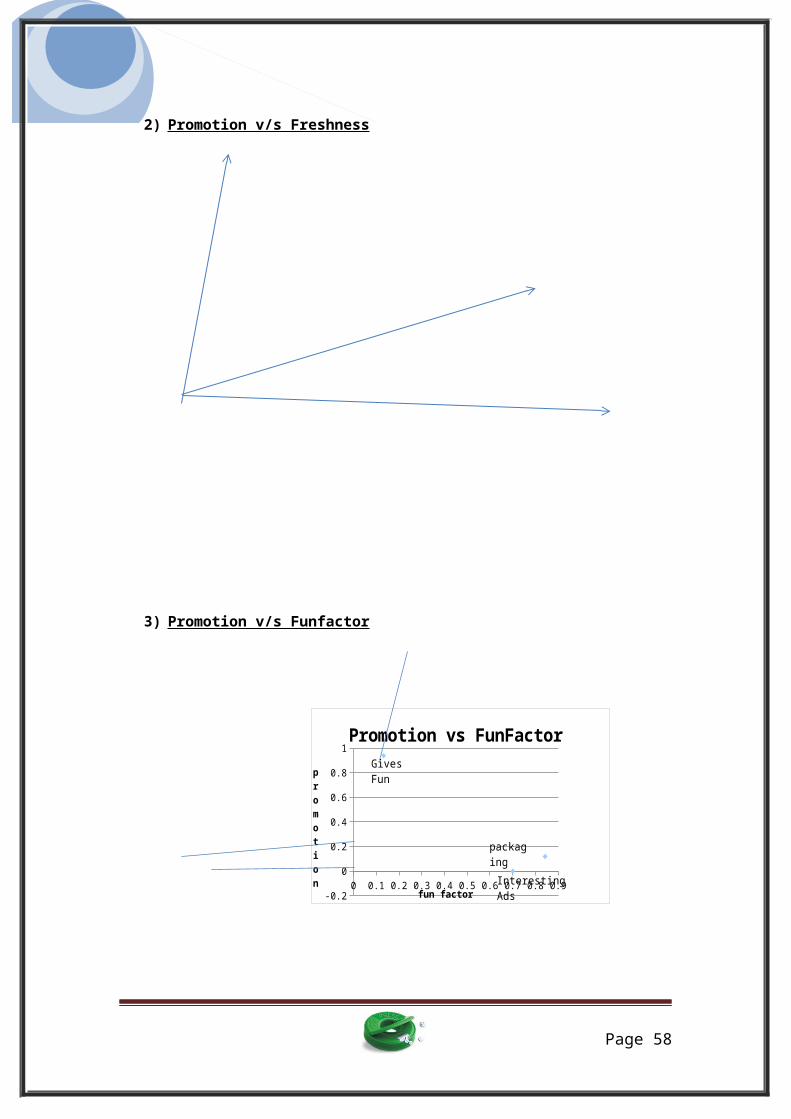
2) Promotion v/s Freshness
3) Promotion v/s Funfactor
0 0.1 0.2 0.3 0.4 0.5 0.6 0.7 0.8 0.9-0.2
0
0.2
0.4
0.6
0.8
1Promotion vs FunFactor
fun factor
promotion
Gives Fun
packagingInteresting Ads
Page 58
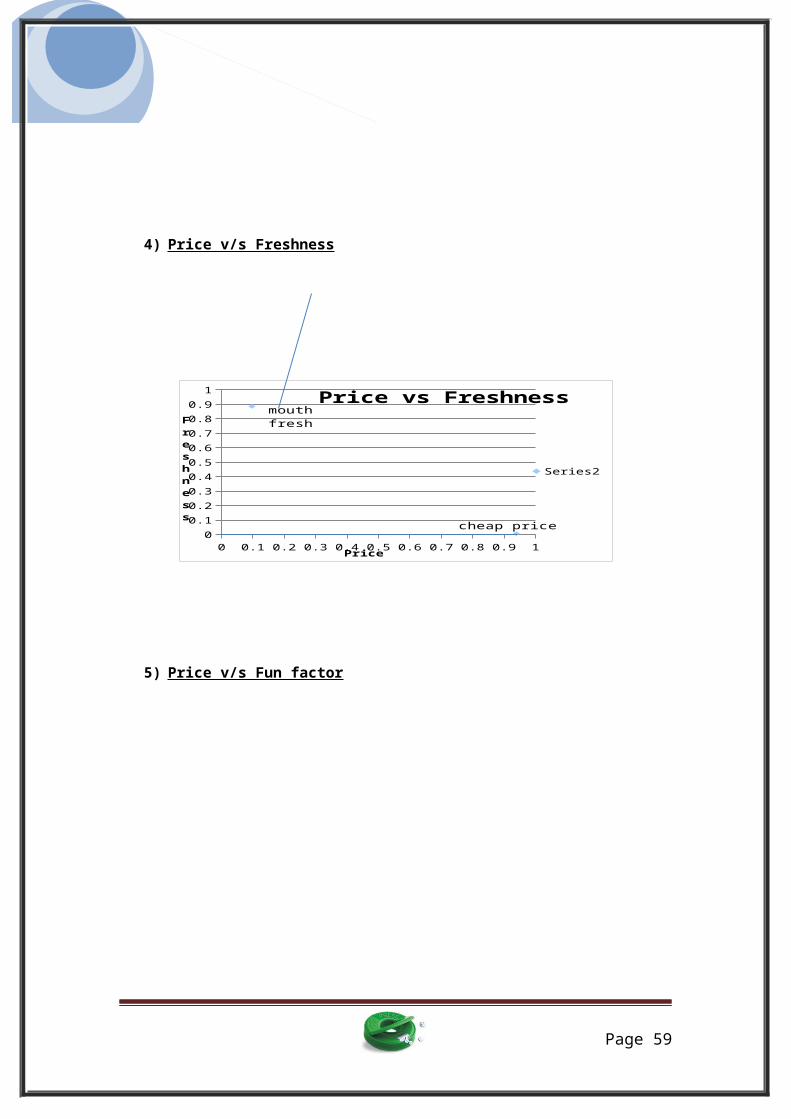
4) Price v/s Freshness
0 0.1 0.2 0.3 0.4 0.5 0.6 0.7 0.8 0.9 10
0.10.20.30.40.50.60.70.80.91 Price vs Freshness
Series2
Price
Freshness
mouth fresh
cheap price
5) Price v/s Fun factor
Page 59

0 0.1 0.2 0.3 0.4 0.5 0.6 0.7 0.8 0.9 1-0.20
0.20.40.60.81
Price vs Fun factor
Series2
price
fun factore
provides fun
chea p price
6) Fun Factor v/s Freshness
0 0.1 0.2 0.3 0.4 0.5 0.6 0.7 0.8 0.9 10
0.2
0.4
0.6
0.8
1
freshness vs fun factor
freshness
Fun factor
provides fun
mouth fresh
Page 60
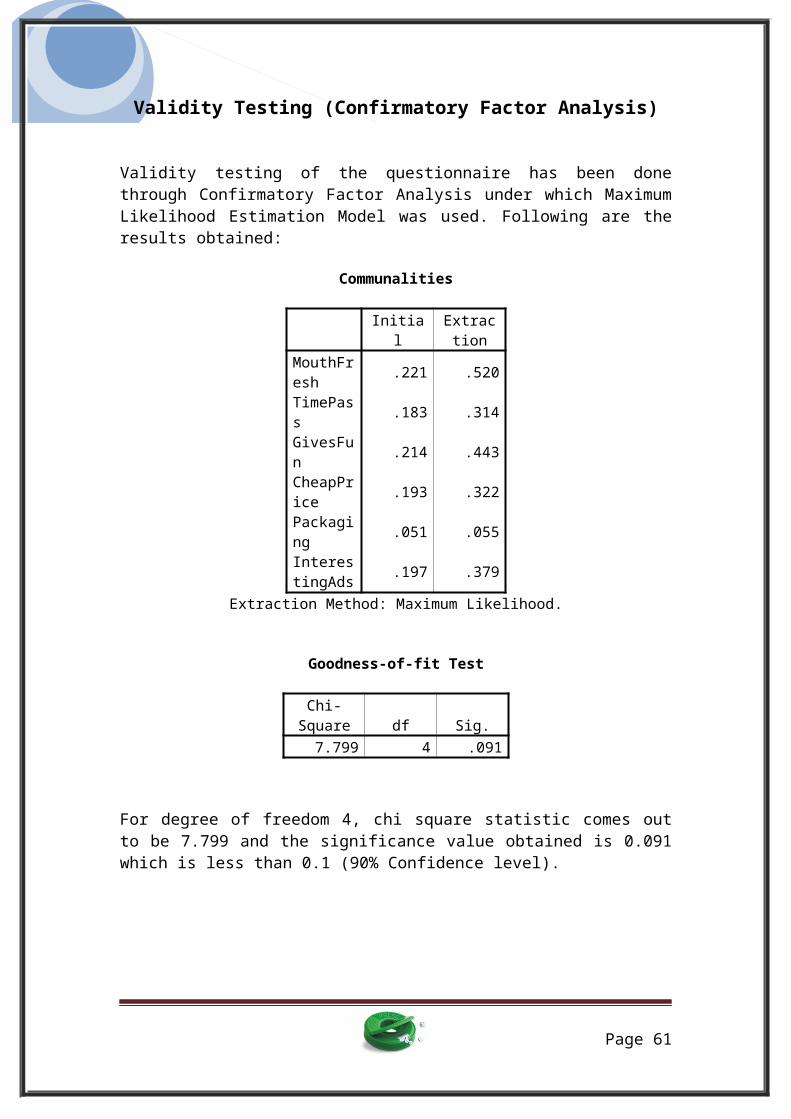
Validity Testing (Confirmatory Factor Analysis)
Validity testing of the questionnaire has been donethrough Confirmatory Factor Analysis under which MaximumLikelihood Estimation Model was used. Following are theresults obtained:
Communalities
Initia
lExtraction
MouthFresh .221 .520
TimePass .183 .314
GivesFun .214 .443
CheapPrice .193 .322
Packaging .051 .055
InterestingAds .197 .379
Extraction Method: Maximum Likelihood.
Goodness-of-fit Test
Chi-Square df Sig.7.799 4 .091
For degree of freedom 4, chi square statistic comes outto be 7.799 and the significance value obtained is 0.091which is less than 0.1 (90% Confidence level).
Page 61
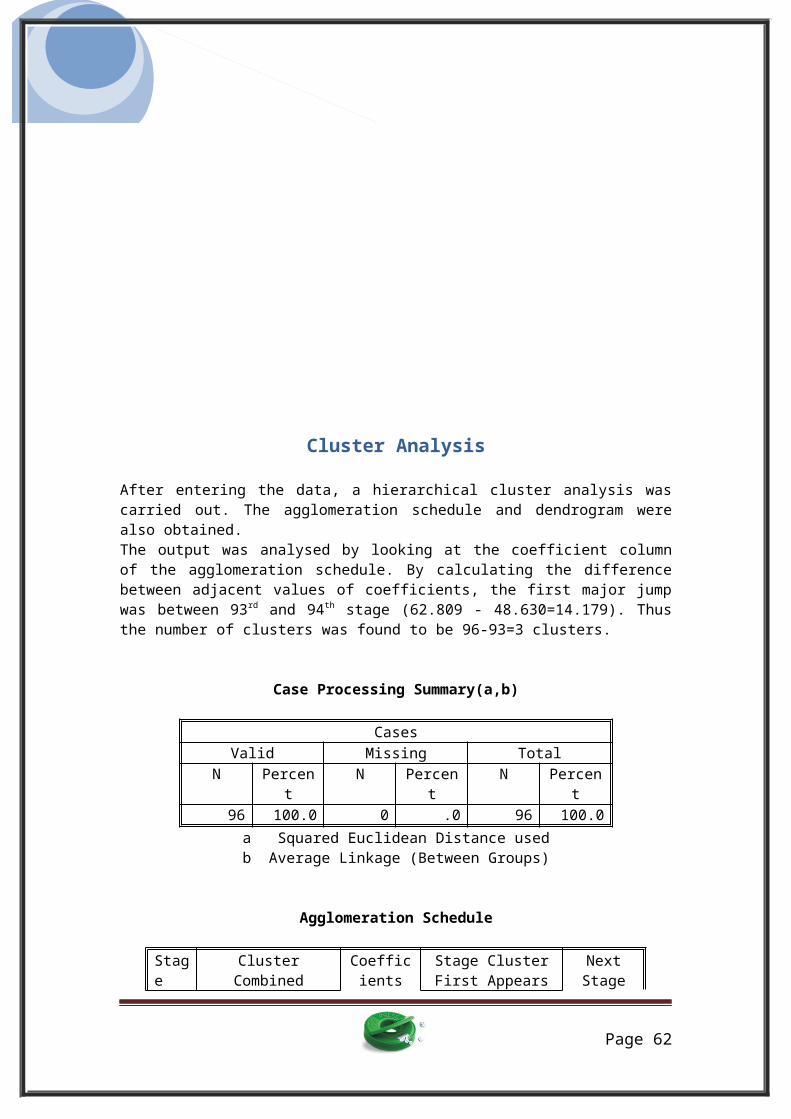
Cluster Analysis
After entering the data, a hierarchical cluster analysis wascarried out. The agglomeration schedule and dendrogram werealso obtained.The output was analysed by looking at the coefficient columnof the agglomeration schedule. By calculating the differencebetween adjacent values of coefficients, the first major jumpwas between 93rd and 94th stage (62.809 - 48.630=14.179). Thusthe number of clusters was found to be 96-93=3 clusters.
Case Processing Summary(a,b)
CasesValid Missing Total
N Percent
N Percent
N Percent
96 100.0 0 .0 96 100.0a Squared Euclidean Distance usedb Average Linkage (Between Groups)
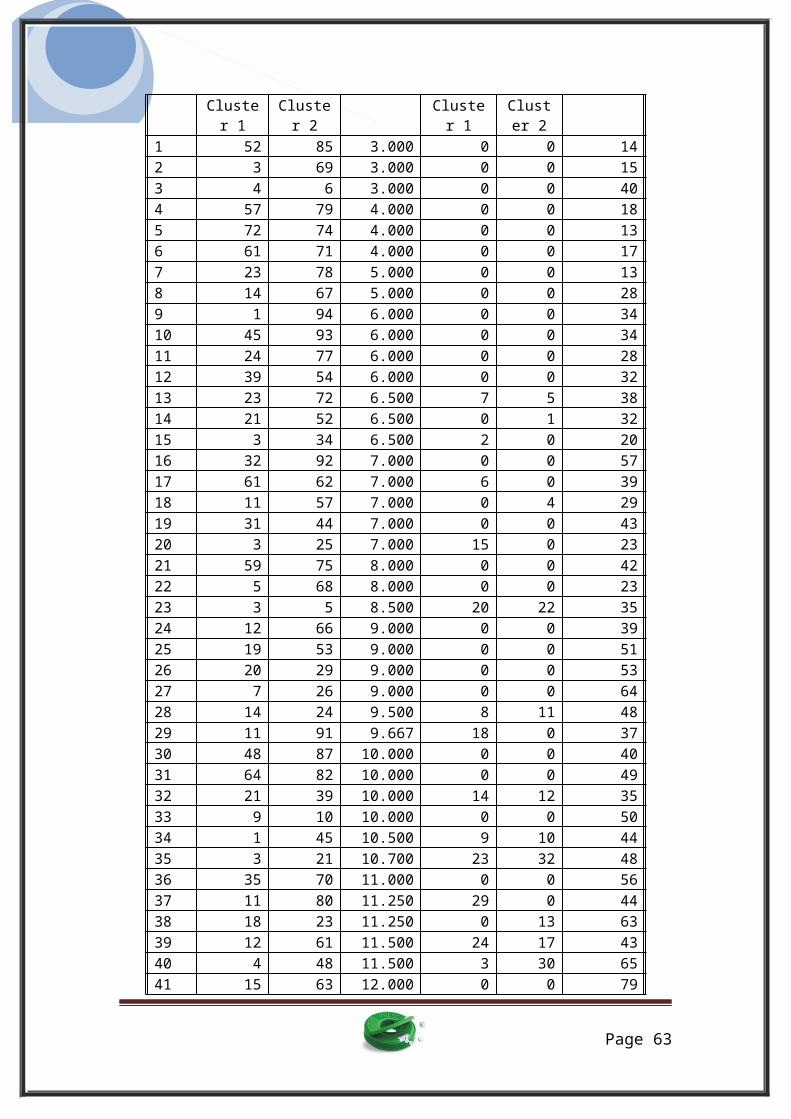
Agglomeration Schedule
Stage
ClusterCombined
Coefficients
Stage ClusterFirst Appears
NextStage
Page 62
Cluster 1
Cluster 2
Cluster 1
Cluster 2
1 52 85 3.000 0 0 142 3 69 3.000 0 0 153 4 6 3.000 0 0 404 57 79 4.000 0 0 185 72 74 4.000 0 0 136 61 71 4.000 0 0 177 23 78 5.000 0 0 138 14 67 5.000 0 0 289 1 94 6.000 0 0 3410 45 93 6.000 0 0 3411 24 77 6.000 0 0 2812 39 54 6.000 0 0 3213 23 72 6.500 7 5 3814 21 52 6.500 0 1 3215 3 34 6.500 2 0 2016 32 92 7.000 0 0 5717 61 62 7.000 6 0 3918 11 57 7.000 0 4 2919 31 44 7.000 0 0 4320 3 25 7.000 15 0 2321 59 75 8.000 0 0 4222 5 68 8.000 0 0 2323 3 5 8.500 20 22 3524 12 66 9.000 0 0 3925 19 53 9.000 0 0 5126 20 29 9.000 0 0 5327 7 26 9.000 0 0 6428 14 24 9.500 8 11 4829 11 91 9.667 18 0 3730 48 87 10.000 0 0 4031 64 82 10.000 0 0 4932 21 39 10.000 14 12 3533 9 10 10.000 0 0 5034 1 45 10.500 9 10 4435 3 21 10.700 23 32 4836 35 70 11.000 0 0 5637 11 80 11.250 29 0 4438 18 23 11.250 0 13 6339 12 61 11.500 24 17 4340 4 48 11.500 3 30 6541 15 63 12.000 0 0 79
Page 63

42 27 59 12.000 0 21 5543 12 31 12.900 39 19 5144 1 11 12.900 34 37 5945 16 65 13.000 0 0 7546 41 60 13.000 0 0 6247 43 55 13.000 0 0 5248 3 14 13.114 35 28 5349 64 83 14.000 31 0 6950 2 9 14.000 0 33 7751 12 19 14.214 43 25 5852 43 47 14.500 47 0 6753 3 20 14.700 48 26 5854 76 95 15.000 0 0 7555 27 56 15.000 42 0 6156 35 49 15.500 36 0 7657 32 36 15.500 16 0 6558 3 12 15.922 53 51 6359 1 30 16.556 44 0 6860 17 28 17.000 0 0 8561 27 90 17.250 55 0 7062 40 41 17.500 0 46 6863 3 18 18.462 58 38 6464 3 7 19.274 63 27 6965 4 32 19.417 40 57 7666 73 88 20.000 0 0 8567 43 84 20.000 52 0 8168 1 40 20.500 59 62 7069 3 64 20.505 64 49 7170 1 27 21.015 68 61 7171 1 3 21.608 70 69 7772 46 96 22.000 0 0 8673 38 81 22.000 0 0 7474 38 51 22.000 73 0 7875 16 76 23.000 45 54 8476 4 35 23.905 65 56 8077 1 2 24.827 71 50 7878 1 38 26.749 77 74 8079 15 86 27.000 41 0 9080 1 4 28.477 78 76 8281 8 43 29.500 0 67 8782 1 50 29.829 80 0 8783 13 33 30.000 0 0 9384 16 22 30.000 75 0 89
Page 64

85 17 73 30.500 60 66 8886 42 46 31.000 0 72 9187 1 8 32.749 82 81 8888 1 17 32.987 87 85 8989 1 16 34.723 88 84 9090 1 15 37.149 89 79 9191 1 42 38.723 90 86 9292 1 37 44.659 91 0 9393 1 13 48.630 92 83 9494 1 89 62.809 93 0 9595 1 58 73.642 94 0 0
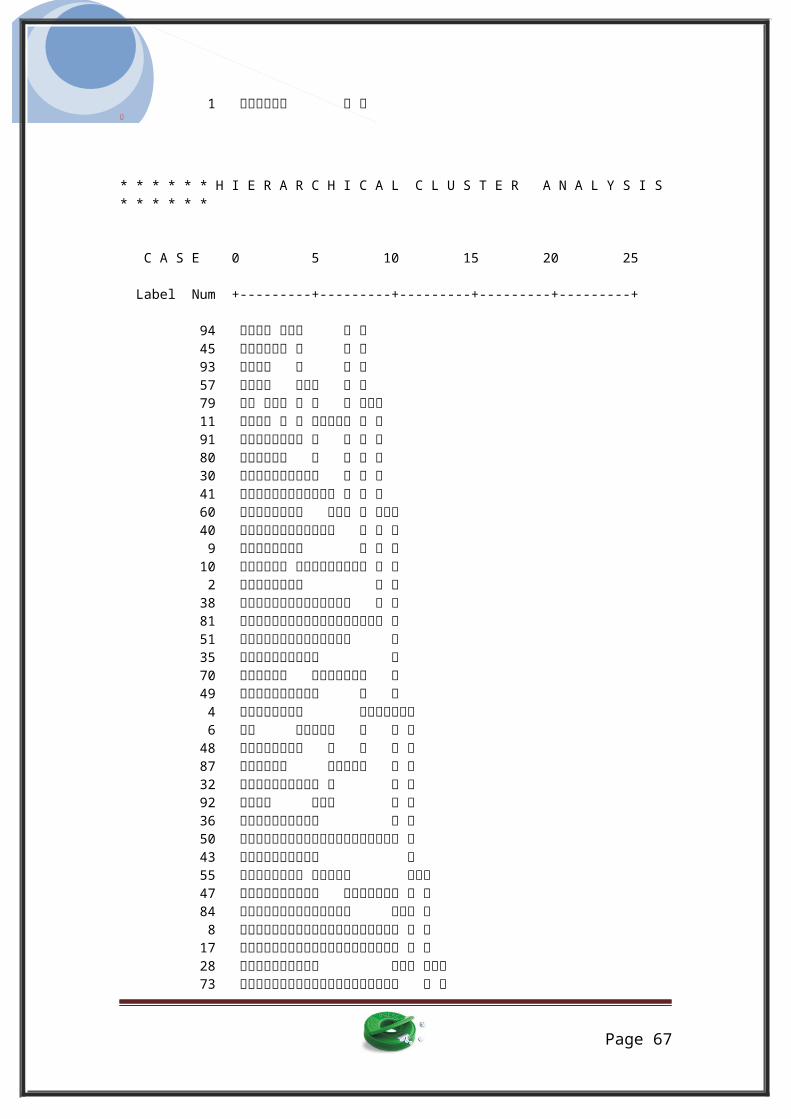
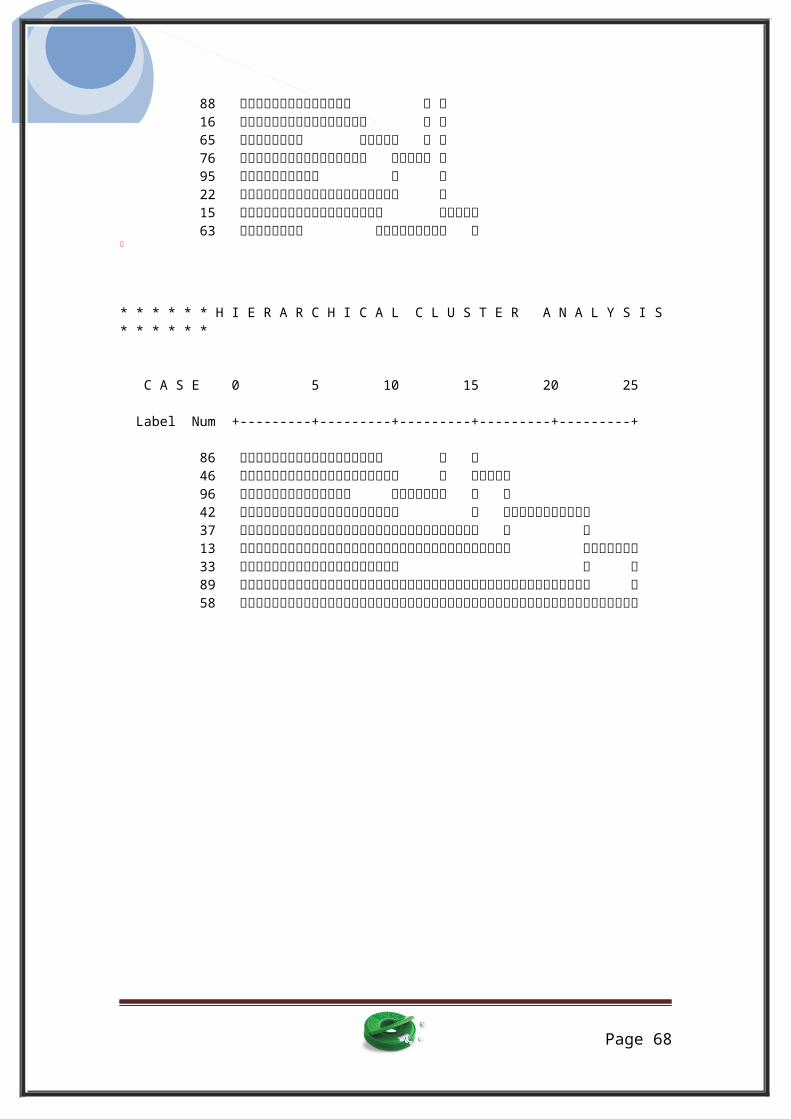
The dendrogram gives a graphical representation of the clusters formed.
* * * * * * H I E R A R C H I C A L C L U S T E R A N A L Y S I S* * * * * *
Page 65
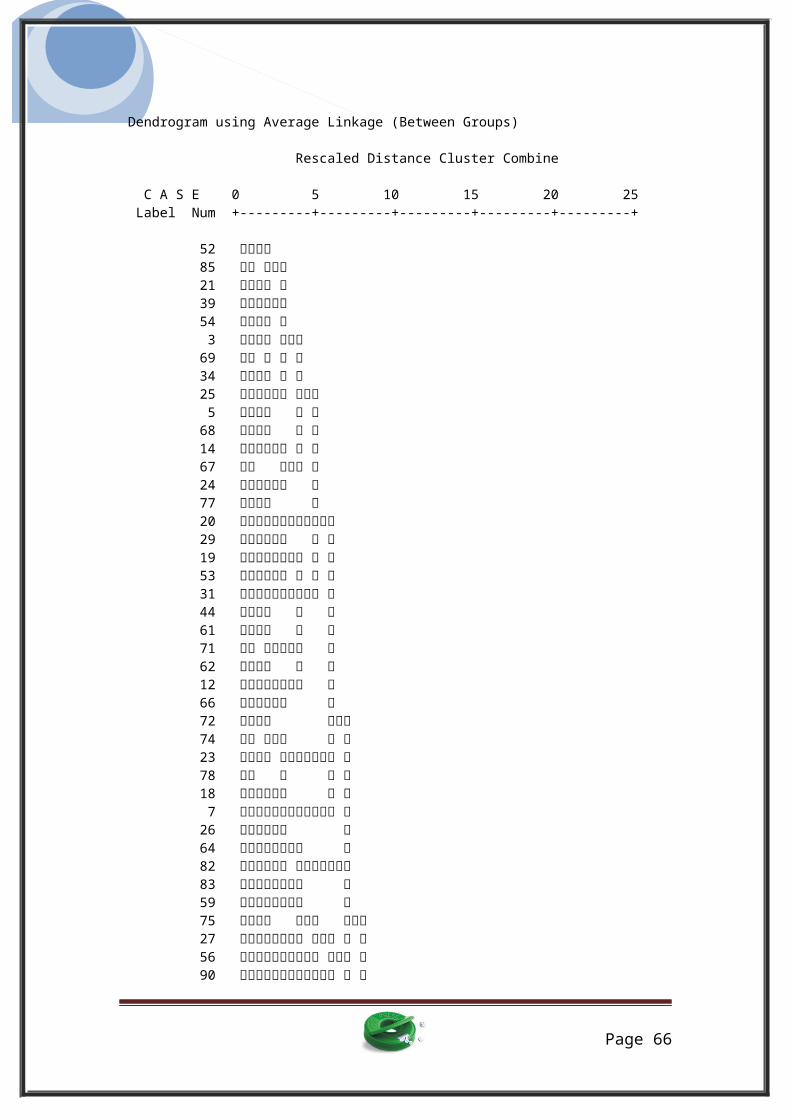
Dendrogram using Average Linkage (Between Groups)
Rescaled Distance Cluster Combine
C A S E 0 5 10 15 20 25 Label Num +---------+---------+---------+---------+---------+
52 85 21 39 54 3 69 34 25 5 68 14 67 24 77 20 29 19 53 31 44 61 71 62 12 66 72 74 23 78 18 7 26 64 82 83 59 75 27 56 90
Page 66
1
* * * * * * H I E R A R C H I C A L C L U S T E R A N A L Y S I S * * * * * *
C A S E 0 5 10 15 20 25
Label Num +---------+---------+---------+---------+---------+
94 45 93 57 79 11 91 80 30 41 60 40 9 10 2 38 81 51 35 70 49 4 6 48 87 32 92 36 50 43 55 47 84 8 17 28 73
Page 67
88 16 65 76 95 22 15 63
* * * * * * H I E R A R C H I C A L C L U S T E R A N A L Y S I S * * * * * *
C A S E 0 5 10 15 20 25
Label Num +---------+---------+---------+---------+---------+
86 46 96 42 37 13 33 89 58
Page 68

The K-means clustering method was used using the reference point as 3 clusters to obtain stable clusters.
Cluster Membership
Case Number
Cluster
Distance
1 1 2.4822 1 2.9693 2 1.5474 2 3.1755 2 1.9896 2 3.6857 1 3.1948 1 4.9159 1 3.44810 1 4.72411 1 2.59612 1 3.03913 1 5.57514 1 2.32215 3 4.96016 1 3.87417 3 4.59418 2 4.06419 2 2.88720 2 3.07521 2 2.45322 1 4.50323 1 2.71924 3 2.33225 2 1.82526 2 3.67727 1 2.52828 1 3.62229 1 3.56430 1 3.82931 1 2.89032 2 3.48533 1 5.36834 2 2.19835 3 3.406
Page 69
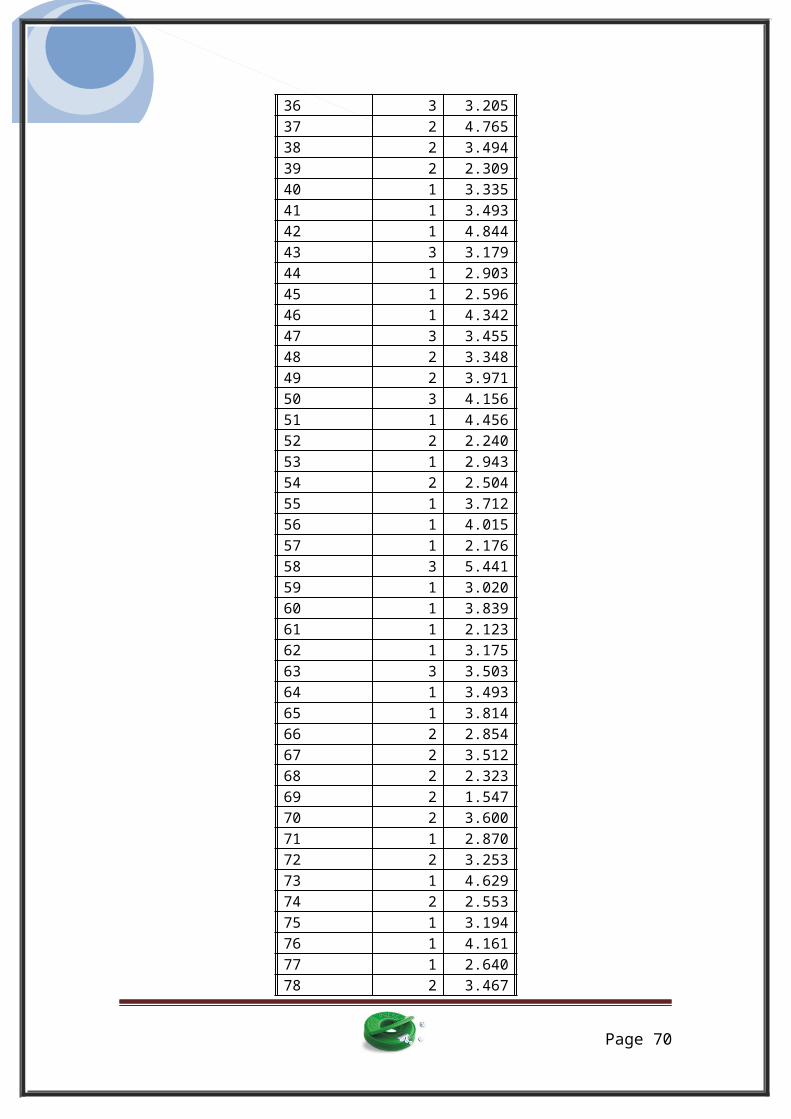
36 3 3.20537 2 4.76538 2 3.49439 2 2.30940 1 3.33541 1 3.49342 1 4.84443 3 3.17944 1 2.90345 1 2.59646 1 4.34247 3 3.45548 2 3.34849 2 3.97150 3 4.15651 1 4.45652 2 2.24053 1 2.94354 2 2.50455 1 3.71256 1 4.01557 1 2.17658 3 5.44159 1 3.02060 1 3.83961 1 2.12362 1 3.17563 3 3.50364 1 3.49365 1 3.81466 2 2.85467 2 3.51268 2 2.32369 2 1.54770 2 3.60071 1 2.87072 2 3.25373 1 4.62974 2 2.55375 1 3.19476 1 4.16177 1 2.64078 2 3.467
Page 70

79 1 2.44380 1 2.96981 2 3.89282 1 3.50483 1 3.92884 3 4.09585 2 2.29686 3 3.57487 2 2.95188 1 4.62589 2 6.26290 1 4.22591 1 3.14592 2 3.46793 1 2.45194 1 2.70495 1 3.82996 1 4.368
Final Cluster Centers
Cluster1 2 3
Conf_During_Break 2.46 1.75 3.17
Watch_Television_at_Leisure_time 2.63 1.81 3.00
Like_to_attend_Parties 3.81 2.44 2.00
Member_of_Social_Clubs 2.48 2.34 1.42
Health_Conscious 2.90 3.25 2.08Prefer_to_stay_at_home_most_times
3.31 3.28 2.33
Hectic_work_leaves_less_time_for_meals
2.44 2.13 3.33
Conf_are_healthy_food 3.44 2.66 2.33
Attractive_packaging_influence_p
4.10 3.28 3.75
Page 71
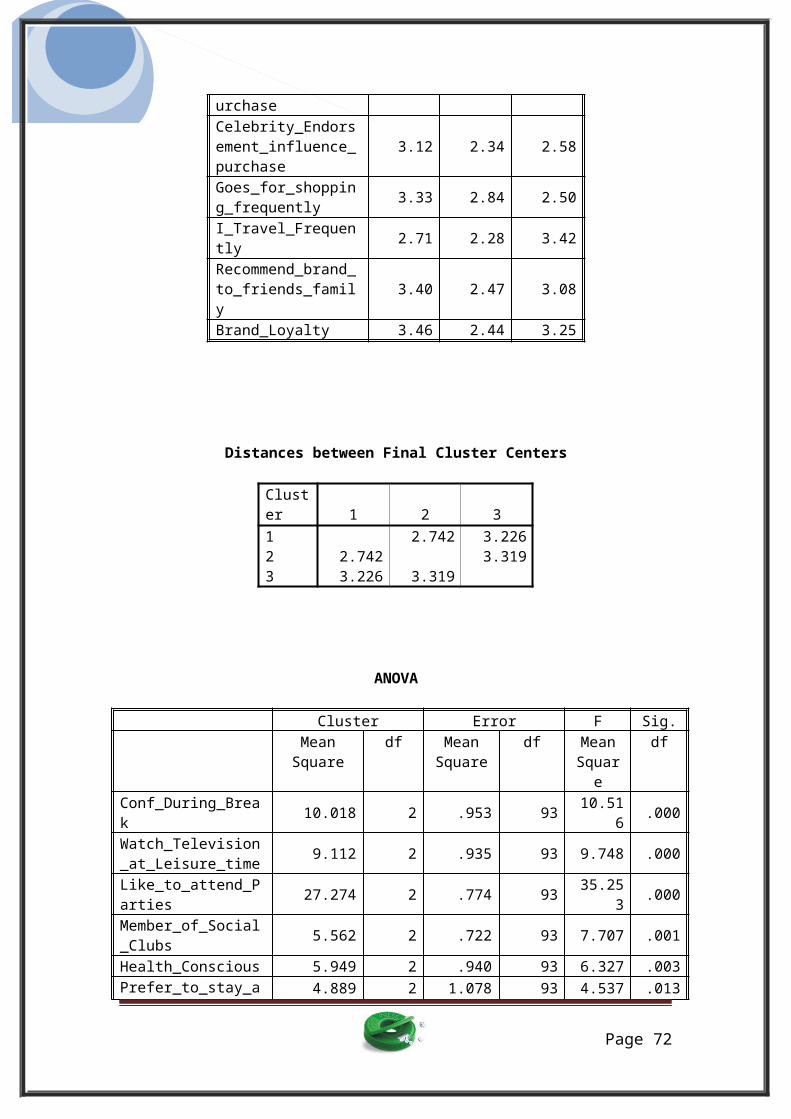
urchaseCelebrity_Endorsement_influence_purchase
3.12 2.34 2.58
Goes_for_shopping_frequently 3.33 2.84 2.50
I_Travel_Frequently 2.71 2.28 3.42
Recommend_brand_to_friends_family
3.40 2.47 3.08
Brand_Loyalty 3.46 2.44 3.25
Distances between Final Cluster Centers
Cluster 1 2 31 2.742 3.2262 2.742 3.3193 3.226 3.319
ANOVA
Cluster Error F Sig. Mean
Squaredf Mean
Squaredf Mean
Square
df
Conf_During_Break 10.018 2 .953 93 10.51
6 .000
Watch_Television_at_Leisure_time 9.112 2 .935 93 9.748 .000
Like_to_attend_Parties 27.274 2 .774 93 35.25
3 .000
Member_of_Social_Clubs 5.562 2 .722 93 7.707 .001
Health_Conscious 5.949 2 .940 93 6.327 .003Prefer_to_stay_a 4.889 2 1.078 93 4.537 .013
Page 72
t_home_most_timesHectic_work_leaves_less_time_for_meals
6.373 2 .806 93 7.903 .001
Conf_are_healthy_food 9.560 2 .932 93 10.25
4 .000
Attractive_packaging_influence_purchase
6.584 2 .788 93 8.361 .000
Celebrity_Endorsement_influence_purchase
6.195 2 1.048 93 5.913 .004
Goes_for_shopping_frequently 4.482 2 1.039 93 4.312 .016
I_Travel_Frequently 5.799 2 .818 93 7.091 .001
Recommend_brand_to_friends_family
8.667 2 .897 93 9.665 .000
Brand_Loyalty 10.554 2 1.087 93 9.713 .000
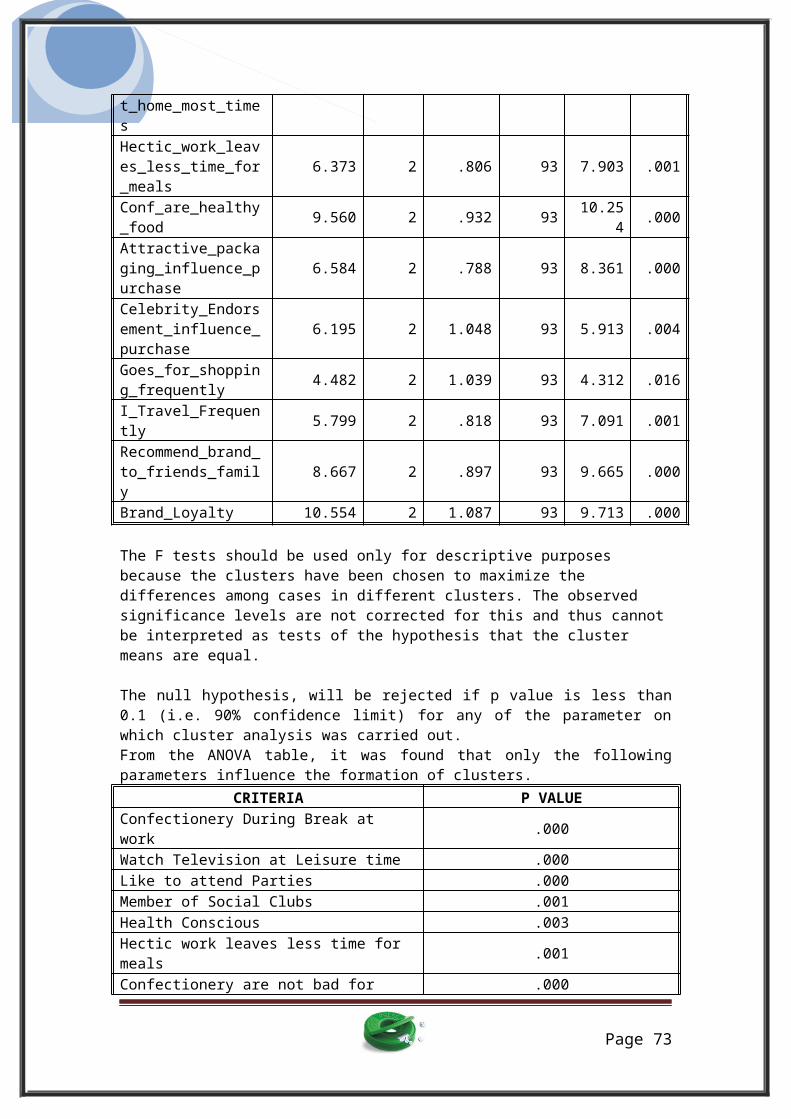
The F tests should be used only for descriptive purposes because the clusters have been chosen to maximize the differences among cases in different clusters. The observed significance levels are not corrected for this and thus cannotbe interpreted as tests of the hypothesis that the cluster means are equal.
The null hypothesis, will be rejected if p value is less than0.1 (i.e. 90% confidence limit) for any of the parameter onwhich cluster analysis was carried out.From the ANOVA table, it was found that only the followingparameters influence the formation of clusters.
CRITERIA P VALUEConfectionery During Break at work .000
Watch Television at Leisure time .000Like to attend Parties .000Member of Social Clubs .001Health Conscious .003Hectic work leaves less time for meals .001
Confectionery are not bad for .000
Page 73
healthAttractive packaging influence purchase .000
Celebrity Endorsement influence purchase .004
I travel frequently .001Recommend brand to friends/family .000Can go places to buy my brand .000
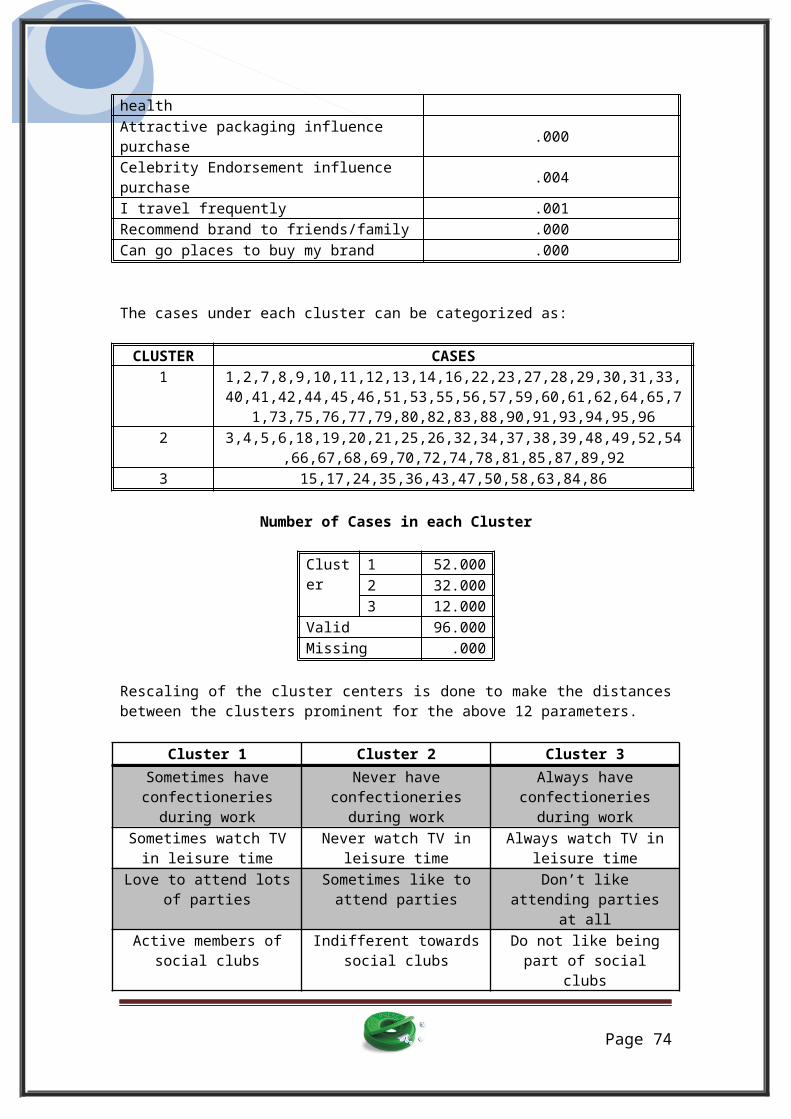
The cases under each cluster can be categorized as:
CLUSTER CASES1 1,2,7,8,9,10,11,12,13,14,16,22,23,27,28,29,30,31,33,
40,41,42,44,45,46,51,53,55,56,57,59,60,61,62,64,65,71,73,75,76,77,79,80,82,83,88,90,91,93,94,95,96
2 3,4,5,6,18,19,20,21,25,26,32,34,37,38,39,48,49,52,54,66,67,68,69,70,72,74,78,81,85,87,89,92
3 15,17,24,35,36,43,47,50,58,63,84,86
Number of Cases in each Cluster
Cluster
1 52.0002 32.0003 12.000
Valid 96.000Missing .000
Rescaling of the cluster centers is done to make the distancesbetween the clusters prominent for the above 12 parameters.
Cluster 1 Cluster 2 Cluster 3Sometimes haveconfectioneriesduring work
Never haveconfectioneries
during work
Always haveconfectioneries
during workSometimes watch TVin leisure time
Never watch TV inleisure time
Always watch TV inleisure time
Love to attend lotsof parties
Sometimes like toattend parties
Don’t likeattending parties
at allActive members of
social clubsIndifferent towards
social clubsDo not like beingpart of social
clubs
Page 74
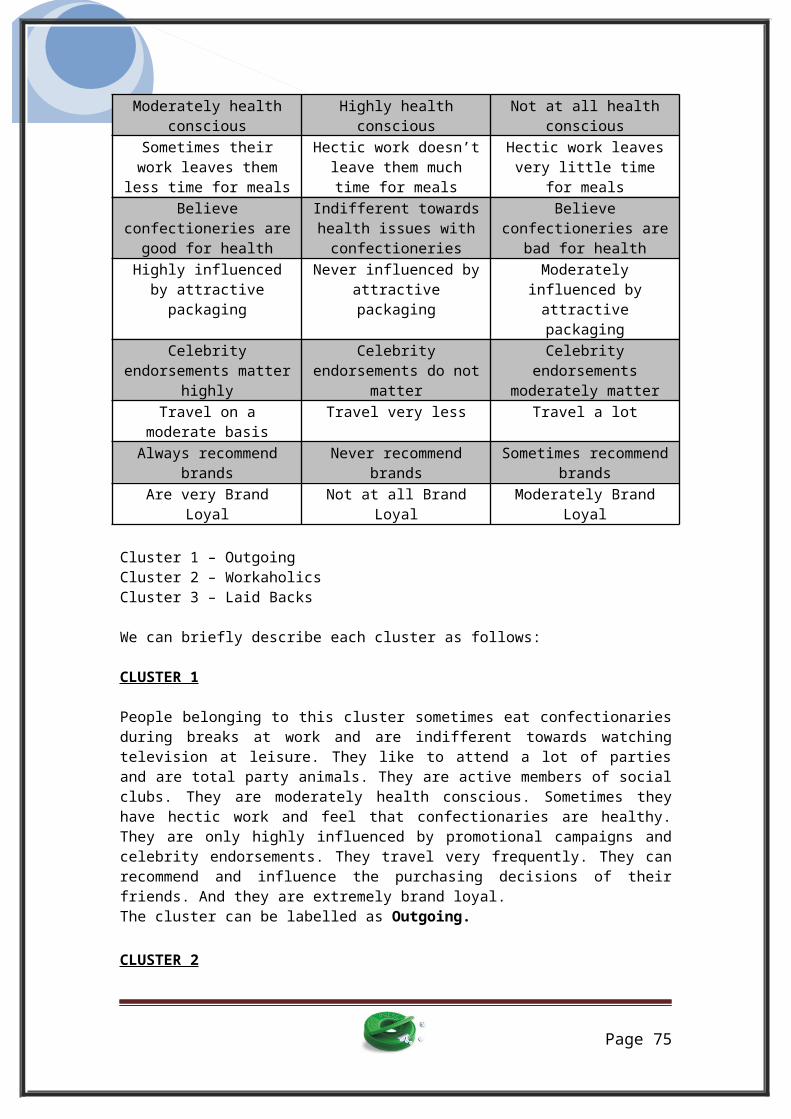
Moderately healthconscious
Highly healthconscious
Not at all healthconscious
Sometimes theirwork leaves them
less time for meals
Hectic work doesn’tleave them muchtime for meals
Hectic work leavesvery little time
for mealsBelieve
confectioneries aregood for health
Indifferent towardshealth issues withconfectioneries
Believeconfectioneries are
bad for healthHighly influencedby attractivepackaging
Never influenced byattractivepackaging
Moderatelyinfluenced byattractivepackaging
Celebrityendorsements matter
highly
Celebrityendorsements do not
matter
Celebrityendorsements
moderately matterTravel on a
moderate basisTravel very less Travel a lot
Always recommendbrands
Never recommendbrands
Sometimes recommendbrands
Are very BrandLoyal
Not at all BrandLoyal
Moderately BrandLoyal
Cluster 1 – OutgoingCluster 2 – WorkaholicsCluster 3 – Laid Backs
We can briefly describe each cluster as follows:
CLUSTER 1
People belonging to this cluster sometimes eat confectionariesduring breaks at work and are indifferent towards watchingtelevision at leisure. They like to attend a lot of partiesand are total party animals. They are active members of socialclubs. They are moderately health conscious. Sometimes theyhave hectic work and feel that confectionaries are healthy.They are only highly influenced by promotional campaigns andcelebrity endorsements. They travel very frequently. They canrecommend and influence the purchasing decisions of theirfriends. And they are extremely brand loyal.The cluster can be labelled as Outgoing.
CLUSTER 2
Page 75

People belonging to this cluster do not eat confectionaries atall during breaks at work nor do they watch television atleisure. They do not like to attend parties much, and theydon’t have any interest in social club membership. They arehighly health conscious. They have hectic work schedule. Theydo not think confectionaries are too bad for health. They arenot influenced by promotions. They don’t travel frequently.They are reluctant to recommending their brand to others. Andare not brand loyal. The cluster can be labelled as Workaholics.
CLUSTER 3
People belonging to this cluster eat confectionariesoccasionally during breaks at work and are very inclined towatch television at leisure. They do not like attendingparties too much, and are moderately not inclined towardstaking membership of social clubs. They are not healthconscious. They have an easy go schedule and never have ahectic work schedule. They feel that confectionaries are goodfor health. They rarely shop or travel. They are stronglyinfluenced by promotional campaigns and celebrityendorsements. They always recommend and influence thepurchasing decisions of their friends.The cluster can be labelled as Laid Back.
Page 76

Deliverables
The primary deliverable is the factors that provebeneficial in promoting the buying behavior of theconsumers in the adult confectionary market.
Page 77
Promotion PriceFreshnessAgent of Time pass
The study also presents segmentation of consumers basedon their lifestyle and buying behavior.
Summary & Conclusion
The mouth freshener toffees in India are a boomingindustry. Equally the mouth freshener brands available inthe market are on the rise. With big players like ITC,Dabur, Wrigleys, Cadbury, Perfetti Van Melle Indianmarket will be fraught with extremely stiff competition.The impulse nature of buying behaviour makes it eventough for the producer to predict the buying behaviour.
The data collection was done from a sample of 96 respondentswith the questionnaire being administered online. The analysiswas done by performing Chi Square test followed by Factor
Page 78
Cluster 1 - OutgoingCluster 2 - WorkaholicsCluster 3 - Laidback
Analysis. The findings reveal four major factors by which thebuying behavior of consumers is influenced.
Thus the report has helped to identify the segments into whichthe Indian confectionery market can be segmented. It has alsohighlighted the effect of promotions on major factorsessential in a confectionery to endear it to its targetconsumers.Also it has brought into focus the important trends in theconfectionery industry and market.
F1 – Promotion F2 – Price F3 – Freshness F4 – Agent
of Time pass
It also highlights and brings into focus the preferences ofthe consumers.The inclination and trends among consumers is amply reflected.
CONSTRAINTS:
1) The survey was conducted in certain parts of New Delhi,Gwalior. Villages and other prominent residential suburbswere not covered under this project.
2) The respondent mix was not evenly distributed underincome category, age and occupation.
Page 79
References
[1] - Market Research Reports, “Confectionery in India to2006”. Datamonitor. Jan 2002 [2] - Vrontis D., Vignali C., “Dairy Milk in France - Amarketing investigation of the situational environment”.British Food Journal. Bradford: 2001. Vol. 103, Iss. 4; pg.291[3] - Broadbent, Simon, Colman, Stephen, “AdvertisingEffectiveness: Across Brands”. Market Research Society.Journal of the Market Research Society. London: Jan 1986. Vol.28, Iss. 1; pg. 15, 10 pgs [4] – Andersson .E, Arvidsson .E, Lindström .C, “Coca-Cola orPepsi- that is the Question : A study about different factorsaffecting consumer preferences”. Publications from VäxjöUniversity. 2006[5] – Helium, “Does product packaging significantly influenceconsumer buying behavior?”, August. 2007,http://www.helium.com/items/[6] – Hannigan M., “Consumer Buying Behavior And The Role OfCoupons”. OP-Papers.com. New Jersey: 2005.[7] – MarketSensus, “Confectionery 2005 Market Research”. January 2005, www.marketsensus.com/[8] – Article Alley, “Promotional products can influence future buying behavior”, December 2008, http://www.articlealley.com/
Page 80