Country Report The Country Report Outline @BULLET I. Cultural Analysis @BULLET II. Economic Analysis...
45
Country Report The Country Report Outline • I. Cultural Analysis • II. Economic Analysis • III. Market Audit and Competitive Market Analysis • IV. Preliminary Marketing Plan I. Cultural Analysis Guideline I. Introduction Canada, the second largest country in the world, is a collection of ten fairly large provinces and three territories. Initially Canada was a colony of the United Kingdom but today it is a free nation. The National Flag of Canada holds a large red maple leaf in the middle with thick red borders on the two sides. Canada represents Federal Constitutional Monarchy with Parliamentary democracy. The official languages of the country are English and French. Canada is one of the richest countries of the world, and it is also one of the leading producers of several minerals. II. Brief discussion of the country’s relevant history The characteristics of Canadian Aboriginal societies included permanent settlements, agriculture, complex societal hierarchies, and trading networks. Some of these cultures had collapsed by the time European explorers arrived in the late 15th and early 16th centuries, and have only been discovered through archeological investigations. III. Geographical setting 1
Transcript of Country Report The Country Report Outline @BULLET I. Cultural Analysis @BULLET II. Economic Analysis...

Country Report
The Country Report Outline • I. Cultural Analysis • II. Economic Analysis• III. Market Audit and Competitive Market Analysis • IV. Preliminary Marketing Plan
I. Cultural Analysis
GuidelineI. Introduction
Canada, the second largest country in the world, is acollection of ten fairly large provinces and three territories.Initially Canada was a colony of the United Kingdom but today it isa free nation. The National Flag of Canada holds a large red mapleleaf in the middle with thick red borders on the two sides. Canadarepresents Federal Constitutional Monarchy with Parliamentarydemocracy. The official languages of the country are English andFrench. Canada is one of the richest countries of the world, and itis also one of the leading producers of several minerals.
II. Brief discussion of the country’s relevant history The characteristics of Canadian Aboriginal societies included
permanent settlements, agriculture, complex societal hierarchies,and trading networks. Some of these cultures had collapsed by thetime European explorers arrived in the late 15th and early 16thcenturies, and have only been discovered through archeologicalinvestigations.
III. Geographical setting
1

Second-largest country in world (after Russia); strategiclocation between Russia and US via north polar route; approximately90% of the population is concentrated within 160 km of the USborder; Canada has more fresh water than any other country andalmost 9% of Canadian territory is water; Canada has at least 2million and possibly over 3 million lakes - that is more than allother countries combined.
A. Location Northern North America, bordering the North Atlantic Ocean on the east, North Pacific Ocean on the west, and the Arctic Ocean on the north, north of the conterminous US.
B. Climate The weather in Canada varies dramatically dependingon your location within the country.
C. Topography Canada's topography is dominated by the Canadian Shield, an ice-scoured area of Precambrian rocks surrounding Hudson Bay and covering half the country.This vast region, with its store of forests, waterpower, and mineral resources, is being increasingly developed. East of the Shield is the maritime area, separated from the rest of Canada by low mountain ranges pierced by plains and river valleys, and including the island of Newfoundland andPrince Edward Island. South and southeast of the Shield are the Great Lakes–St. Lawrence lowlands, a fertile plain in the triangle bounded by the St. Lawrence River, Lake Ontario, and Georgian Bay. West of the Shield are the farmlands and ranching areas ofthe great central plains, some 1,300 km (800 mi) widealong the US border and tapering to about 160 km (100mi) at the mouth of the Mackenzie River. Toward the north of this section is a series of rich mining areas, and still farther north is the Mackenzie lowland, traversed by many lakes and rivers. The
2

westernmost region of Canada, extending from western Alberta to the Pacific Ocean, includes the Rocky Mountains, a plateau region, the coastal mountain range, and an inner sea passage separating the outer island groups from the fjord-lined coast. Mt. Logan, the highest peak in Canada, in the St. Elias Range near the Alaska border, is 5,959 m (19,551 ft) high. The Arctic islands constitute a large group extendingnorth of the Canadian mainland to within 885 km (550 mi) of the North Pole. They vary greatly in size and topography, with mountains, plateaus, fjords, and lowcoastal plains.
IV. Social institutions
The underlying goal of all social institutions is to satisfy individual needs and provide an orderly structure for the benefit of all society.Social institutions also provide a way for different agents of socialization to transmit important beliefs and attitudes to the population although distinct in their roles and overall purpose, social institutions perform the basic function of promoting social cohesion.
A. Family Family is the primary agent of socialization and the most important institution in Canadian societylike all institutions, it’s continuously adapting to changethe nuclear family was considered the ideal for many generations
3

today, Canadians are challenging the notion that nuclearfamilies are the only way children can properly be socialized as a result of changing attitudes toward parenting and marriage, the family is an institution that has grown to include lone-parents families, same0sex families, common-law, and blended familiesmore than any other institution, the family has demonstrated that diversity and tolerance are possible in a society as complex as Canada.Even with these changes, the family is still a dominant force directing Canadian society and other worldwide societiesIn all cultures, the institution of the family is responsible for promoting universal functions, such as regulation reproduction and sexual behaviour it’s also responsible for socializing and teaching the youngest members social norms daily, the family helps develop lifelong lessons, such as the importance of respect and obedienceThese skills are further explored when the student enters school—in this way, the family is seen as the blueprint for social norms and beliefs.In addition to all social and practical functions, the family is responsible for the economic maintenance and recreation of its members the changing face of Canadian families has left an indelible mark on whom we are as a nation; it also says something about our social values the family is the only institution to use nurturance andemotional support as a basis for all its relationshipsother institutions (religion) do so in a limited mannerthe family has the ability to nurture self-esteem, creativity, and self-confidence.The family is the foundation on which well-adjusted young adults emerge ready and capable of fully participating in other institutions and society itself.
4

B. Education
Each province is responsible for its own system ofeducation. While the systems differ in some details, thegeneral plan is the same for all provinces exceptQuébec, which has two parallel systems: one mainly forRoman Catholics and speakers of French, the otherprimarily for non-Catholics and speakers of English.Québec, Newfoundland, Alberta, Saskatchewan, and, to alesser extent, Ontario provide for public support ofchurch-affiliated schools.
1. The role of education in societyCanada also has numerous community colleges,teachers' colleges, technical institutes, nursingschools, and art schools. Adult education issponsored by universities, colleges, school boards,government departments, and voluntary associations,each of which has some other primary function. TheCanadian Broadcasting Corp., the National FilmBoard, and many museums, art galleries, andlibraries engage in adult education as part oftheir work. Instructors are represented by theCanadian Association of University Teachers, andstudents by the Canadian Federation of Students.
Primary education (quality, levels of development, etc.)In 1996, primary schools numbered 12,685. Therewere 148,565 teachers and 2,448,144 students inprimary schools.
Secondary education (quality, levels of development, etc.)The same year, secondary schools had 133,275teachers and 2,505,389 students.
Higher education (quality, levels of development, etc.)
5

As of the mid-1990s, there were some 60 degree-granting colleges and universities in Canada.There are provincial universities in allprovinces; other degree-granting institutions areprivate or connected with a religiousdenomination. In 1996, full-time enrollment inall higher-level institutions, colleges, anduniversities was 1,763,105. The federalgovernment operates one military college withdegree-granting powers conferred by the provinceof Ontario. Since 1977, the federal governmenthas contributed to post-secondary education bycash payments and tax transfers, independently ofprovincial program costs.
2. Literacy ratesVirtually the entire adult population is literate(96.6%). The age limits of compulsory schoolattendance are roughly from age 6 to age 16.
C. Political system
Under the British North America Act of 1867, whichunited the four original provinces of Québec, Ontario,Nova Scotia, and New Brunswick into one dominion underthe name of Canada, the federation was provided with apowerful central government, which, besides its areas ofexclusive authority, held residual authority in mattersbeyond the powers of local or private concernspecifically assigned to the provincial legislatures.
1. Political structureUnder the Constitution Act, the British sovereignremains sovereign of Canada and head of state; forthe most part, the personal participation of QueenElizabeth II in the function of the crown forCanada is reserved to such occasions as a royalvisit. The queen's personal representative in thefederal government is the governor-general,appointed by the crown on the advice of the primeminister of Canada; the governor-general is usually
6

appointed for a term of five years. Activeexecutive authority resides in the cabinet, orministry, headed by the prime minister.
2. Political parties
Bloc QuebecoisConservative Party of CanadaGreen PartyLiberal Party New Democratic Party
3. Special taxesAs with most industrialized democracies, Canada'stax system is complex, reflecting the impact ofnumerous social and economic policy goals. Since2000, the government has also been engaged in aFive-Year Tax Reduction Plan which aims by 2005 to,among other things, reduce the corporate tax rateto 21%, the tax rate to 23%, and to raise thelimits for the applicability of the various taxbrackets. In Canada, there are both federal andprovincial taxes on corporate income. Ontario,Quebec and Alberta administer their own corporatetax systems, but in the other provinces the federalgovernment levies both.
4. Role of local governmentCanada is made up of 10 provinces and threeterritories. Each province has a premier and alegislature. They function like those of thecentral government. However, the provincialparliaments are unicameral. In each province, thesovereign is represented by a lieutenant-governorappointed by the governor-general. The provincesare empowered to regulate their own affairs and
7
dispose of their own revenues. Civil and propertyrights, civil law, education, health, laborconditions, licenses, management and sale of publicland, municipal government, and direct provincialtaxation are within the jurisdiction of theprovinces. Although the federal government stillexercises considerable authority over the northernterritories, they now have elected legislativebodies. In the Yukon, the powers of the federalcommissioner have been greatly reduced, and thenewly formed Nunavut territory, an Inuit homeland,is semi-autonomous.
Each province is divided into municipalities, thenumber and structure of which vary from province toprovince. In Prince Edward Island, Nova Scotia, NewBrunswick, Ontario, and Québec the first order ofmunicipalities consists of counties, which arefurther subdivided into cities, towns, villages,and townships, although there are minor variations.In Newfoundland and the four western provincesthere are no counties; municipalities are eitherrural or urban, the latter being made up of cities,towns, and villages, but again with minorvariations. Municipalities are usually administeredby an elected council headed by a mayor, overseer,reeve, or warden. Local governments areincorporated by the provinces, and their powers andresponsibilities are specifically set forth inprovincial laws.
D. Legal system
Common law system except in Quebec where civil lawbased on the French civil code prevails
1. Organization of the judiciary system
8

2. Code, common, socialist, or Islamic-lawcountry?
3. Participation in patents, trademarks, andother conventions
4. Marketing Laws
V. Religion and aesthetics
A. Religion and other belief systemsBased on 1998 estimates, 82.1% of the Canadianpopulation belong to Christian denominations. RomanCatholics constitute the largest single group, with45.2% of the population. Other Catholic groups includeEastern Orthodox (1.4%) and Ukrainian Catholics (0.5%).Protestants make up 36.4% of the populace, including theUnited Church with 11.5%; Anglicans with 8.1%;Presbyterians with 2.4%; Lutherans with another 2.4%;Baptists with 2.5%; Pentecostals with 1.6%; and variousother Protestant denominations with 7.9%. Members ofother religions include Jews (1.2% of the population),Muslims (0.9%), Buddhists (0.6%), Hindus (0.6%), Sikhs(0.5%), parareligious faiths—including Scientology,
9

Kabalarianism, and Rastafarianism—(0.1%), and otherreligions (0.1%). Approximately 12.5% of the populationhas no religious affiliation.
Freedom of religion has beenspecifically protected since the enactment of theCanadian Bill of Rights in 1960, now incorporated intothe constitution.
VI. Living conditions
Money, while it cannot buy happiness, is an important means toachieving higher living standards. In Canada, the averagehousehold net-adjusted disposable income is 28 194 USD a year,more than the OECD average of 23 047 USD a year. But there is aconsiderable gap between the richest and poorest – the top 20%of the population earn more than five times as much as thebottom 20%.
In terms of employment, over 72% of people aged 15 to 64 inCanada have a paid job, more than the OECD employment averageof 66%. Some 75% of men are in paid work, compared with 69% ofwomen. People in Canada work 1 702 hours a year, less than theOECD average of 1 776 hours. Some 4% of employees work verylong hours, much lower than the OECD average of 9%, with 6% ofmen working very long hours compared with just 1% for women.
Having a good education is an important requisite for finding ajob. In Canada, 88% of adults aged 25-64 have earned theequivalent of a high-school degree, well above the OECD averageof 74%. This is truer of women than of men, as 87% of men havesuccessfully completed high-school compared with 90% of women.This reverses the OECD average picture, where men are slightlymore likely to have graduated high school. Canada is a top-performing country in terms of the quality of its educationalsystem. The average student scored 527 in reading literacy,maths and science in the OECD’s Programme for InternationalStudent Assessment (PISA). This score is higher than the OECDaverage of 497, making Canada one of the strongest OECDcountries in students’ skills. On average in Canada, girls
10

outperformed boys by 6 points, lower than the average OECD gapof 9 points.
In terms of health, life expectancy at birth in Canada is 81years, one year higher than the OECD average of 80 years. Lifeexpectancy for women is 83 years, compared with 79 for men. Thelevel of atmospheric PM10 – tiny air pollutant particles smallenough to enter and cause damage to the lungs – is 16micrograms per cubic meter, considerably lower than the OECDaverage of 22 micrograms per cubic meter. Canada also does wellin terms of water quality, as 89% of people say they aresatisfied with the quality of their water, more than the OECDaverage of 84%.
Concerning the public sphere, there is a strong sense ofcommunity but only moderate levels of civic participation inCanada, where 94% of people believe that they know someone theycould rely on in time of need, higher than the OECD average of90%. Voter turnout, a measure of public trust in government andof citizens’ participation in the political process, was 61%during recent elections; this figure is lower than the OECDaverage of 72%. There is little difference in voting levelsacross society; voter turnout for the top 20% of the populationis 63% and for the bottom 20% it is 60%, a much smallerdifference than the OECD average gap of 12 percentage pointsand suggesting there is broad inclusion in Canada’s democraticinstitutions.
In general; Canadians are more satisfied with their lives thanthe OECD average, with 82% of people saying they have morepositive experiences in an average day (feelings of rest, pridein accomplishment, enjoyment, etc) than negative ones (pain,worry, sadness, boredom, etc). This figure is higher than theOECD average of 80%.
A. Diet and nutrition
11

Per capitameatconsumption hasbeengraduallyincreasing in Canadatoreach 77.3 kg in2009, and isforecasttoreach 78.0 kg in 2013.Despitefluctuatingconsumptionvolumessince 1999,Americansconsistently consume moremeatthanCanadians, with per capitaconsumption at84.2 kg in 2009, withthatnumberexpectedtoreach 85.7kg in 2013. Whileboth are increases, projectionsfor2013 indicatethat Canadian consumption offreshmeatproductswillgrowby 1.6 kg overthe 1999value, as comparedtothe American increase of 2.5 kg.In bothcountrieschickenisthemost popular meat,followedbybeef, pork and thenturkey(StatisticsCanada 2009c; USDAEconomicResearchService 2010).
Bothcountries are experiencingsteadyincreases in percapita vegetable consumptionthat areprojectedtocontinue, butCanadians consumesignificantly more thantheir American neighbours. In2009, average per capitaconsumption of freshvegetables was 113.4 kg in Canada versus 67.5 kg inthe U.S., indicatingthattheaverage Canadian consumed45.9 kg more vegetables annuallythantheaverageAmerican. Canadianconsumersincreasedtheirannualfresh vegetableconsumptionby 2.6 kg since 1999, andAmericansbyjustover 2 kg.
Similar tothechangingfruitpreferencesmentionedabove,vegetableconsumptionismovingawayfromtraditionalitems, andtowardsthosethatrepresent moreethnicallydiverseflavoursorfunctionalhealthbenefits.Forexample, between 2001 and 2008 consumption ofcarrots and potatoesdeclinedby 21.3% and 2.5%respectively in Canada and by 9.3% and 16.7% intheUnitedStates. However, commoditiessuch aseggplant, asparagus and broccoli are ontherise. InCanada, these vegetables sawgains of 27.2%, 93.0%
12

and 4% respectivelybetween 2001 and 2008. In theU.S., eggplantconsumptionincreasedby 20.9%,asparagusby 45.5% and broccoliby 16.4%duringthissame time period (StatisticsCanada 2009c;USDA EconomicResearchService 2010).
B. Housing
There were more than 10 million occupied privatedwellings in Canada in the mid-1990s. Single detachedhomes are the predominant type of housing accommodation,although their relative numbers have gradually declinedin favor of multiple dwellings. As of 2001, about 56.8%of dwellings were single detached homes; 30.5% wereapartment buildings. As of the 2001 census, there wereabout 12,548,588 private dwellings throughout the
13

country with an average of 6.1 rooms per dwelling and anaverage of 2.5 people per household. The average costfor housing per month was about US $835 for homeownersand US $648 for renters.
In 1992, the federal government introduced the programsto promote home ownership: the First Home Insuranceinitiative and the Buyers' Home Plan.
C. Clothing
All but the wealthiest settlers wore clothing made inthe home, often of cloth spun in the home and wovendomestically or by professional local weavers. Stylestended to be conservative and to reflect rural Frenchor, later, English styles. In the mid-19th century, asmore ready-made clothing became available, fashionslowly became more accessible to the masses; however,most working-class attire continued to be made at home.Relatively small quantities of this clothing havesurvived because, as it wore out, it was recycled intoQUILTS and RUGS. In 1884 the first mail-order catalogue,the T. EATON COMPANY pamphlet, appeared, making recentstyles more accessible to everyone, even in remote ruralareas. This important development decreased thedifference between conservative rural and up-to-datefashionable dress.
E. Social security
The Canadian social securitysystemincorporates federallawonwelfareissuessuch as unemploymentinsurance andoldagesecurity, as well as provincial policies andprogrammesonwelfareissues, such as education, socialservices and social assistance.
14

TheCanadaBenefitswebsiteprovidesinformationonallthegovernmentbenefitsavailabletoresidents of Canada.Theseinclude, amongstothers, retirement, unemployment,disability and healthcarebenefits.
F. Health care
Canada adopted a national health insurance scheme in1971. It is administered regionally; each province runsa public insurance plan with the government contributingabout 40% of the cost (mostly from taxes). Governmentregulations ensure that private insurers can only offerparticular types of health care provision. Drug pricesare low. Most hospitals and doctors operate privately.Hospitals are paid by allocated budgets and doctorsreceive fees per treatment. The system offersconsiderable choice, but there is little competition andthe government has used rationing measures to limithealth care expenditures. Access to health care and costcontainment are good, but there are strains on thebudget, increased by an aging population. In 1997, theNational Forum on Health, created by the governmentthree years earlier, released a report on ways toimprove Canada's health system. It recommended severalinitiatives, including formation of a Health TransitionFund to support provincial and territorial healthprograms.
Major health planning is carried on by provincialgovernments, most of which offer substantial free carefor patients suffering from tuberculosis (7 casesreported per 100,000 people in 1999), poliomyelitis,venereal diseases, and certain types of cancer. Theyalso assume responsibility for mental health treatment.Municipalities are responsible for sanitation;communicable disease control; child, maternal, andschool health care; public health nursing; healtheducation; and vital statistics. In some cases, theysupply hospital care and medical service to the poor.
15

The federal government provides consultant andspecialist services to the provinces, assists in thefinancing of provincial programs, provides services toveterans and Indians, exercises control over thestandard and distribution of food and drugs, maintainsquarantine measures, and is responsible for carrying outcertain international health obligations. The federalDepartment of National Health and Welfare providesfinancial assistance for provincial health and hospitalservices through the National Health Program and forprovincial hospital insurance programs through theHospital Insurance and Diagnostic Services Act of 1957,under which the federal government shares the provinces'costs (since 1977, by means of tax transfers and cashpayments). By 1973, this program had been established inall provinces and territories, covering more than 99% ofthe total population of Canada. Federal and provincialgovernments contribute toward construction costs of newhospitals. Total health care expenditures for 1995 wereUS $1,899 per capita. Public insurance pays about 80% ofthe Canadian population's health bills. The totalexpenditure on health is second only to the UnitedStates, with an estimated 9.3% of GDP going towardhealth as of 1999.
VII. Language
English and French are the official languages of Canada andhave equal status and equal rights and privileges as to theiruse in all governmental institutions. The federal constitutionalso gives the English and French minorities the right topublicly funded education in their own language at the primaryand secondary levels, wherever the number of children warrantsit.
The constitution provides for bilingualism in the legislatureand courts of Québec, New Brunswick, and Manitoba. Althoughthere are no similarly entrenched constitutional rights inOntario and Saskatchewan, these provinces have made English andFrench the official languages of the courts. In 1984, theNorthwest Territories Council adopted an ordinance providingfor the use of aboriginal languages and establishing Englishand French as official languages.
16

English was proclaimed the sole official language of Manitobain 1890, and French was made the official language of Québec in1974. However, the 1890 Manitoba legislation was declaredunconstitutional in 1979, as was a Québec law passed in 1977declaring French to be the sole language of the legislature andthe courts.
Although Canada is frequently referred to as a bilingualcountry, only a minority are able to speak both English andFrench. In Québec, more than 80% of the people speak French asa native language; in the other provinces, most of the peoplespeak only English, although there are sizable proportions ofpeople able to speak French in New Brunswick and parts ofOntario and Manitoba. Some 60% of Canadians report that theironly mother tongue is English, and only about 24% say that isFrench. About 15% report a single mother tongue other thanEnglish or French. Italian, German, Chinese, Ukrainian,Portuguese, and Polish are spoken by small numbers of people.There are at least 58 different Indian languages and dialects,in 10 major language groups. Cree is the most common Indianlanguage.
II. Economic Analysis
GuidelineI. Introduction
The Canadian economy is the seventh largest among the westernindustrialized nations.Canada has changed from a countryproducing and exporting mainly primary products to one that isincreasingly producing and exporting manufactured goods. In the1980s, machinery and equipment joined automotive products amongthe country's leading exports; at the same time, the importanceof natural resource products declined (partly reflecting the1986 collapse of oil prices).
II. Population
17

A. Total
BirthratesIn 2011, there were 377,636 births in Canada, upslightly from the previous year when 377,213 wereborn. Both are lower than 2009, when there were380,863 births.
B. Distribution of population
1. Age 0-14 years: 15.6% (male 2,740,240/female 2,605,345)
15-24 years: 13% (male 2,300,624/female 2,175,492)
18

25-54 years: 41.8% (male 7,267,352/female 7,087,217)
55-64 years: 13.2% (male 2,235,990/female 2,278,691)
65 years and over: 16.4% (male 2,474,842/female 3,134,290) (2012 est.)
2. Sex at birth: 1.06 male(s)/female under 15 years: 1.05 male(s)/female 15-64 years: 1.02 male(s)/female 65 years and over: 0.79 male(s)/female total population: 0.98 male(s)/female (2011 est.)
3. Geographic areas (urban, suburban, and rural density and concentration)
4. Migration rates and patterns 5.65 migrant(s)/1,000 population (2012 est.)
5. Ethnic groupsBritish Isles origin 28%, French origin 23%, other European 15%, Amerindian 2%, other, mostly Asian, African, Arab 6%, mixed background 26%
III. Economic statistics and activity
A. Gross national product (GNP or GDP)The US Central Intelligence Agency (CIA) reports that in2002 Canada's gross domestic product (GDP) was estimatedat US $923 billion. The per capita GDP was estimated atUS $29,400. The annual growth rate of GDP was estimated
19

at 3.4%. The average inflation rate in 2002 was 2.2%.The CIA defines GDP as the value of all final goods andservices produced within a nation in a given year andcomputed on the basis of purchasing power parity (PPP)rather than value as measured on the basis of the rateof exchange. It was estimated that agriculture accountedfor 2% of GDP, industry 27%, and services 71%.
The World Bank reports that in 2001 per capita householdconsumption (in constant 1995 US dollars) was US$12,866. Household consumption includes expenditures ofindividuals, households, and nongovernmentalorganizations on goods and services, excluding purchasesof dwellings. It was estimated that for the same periodprivate consumption grew at an annual rate of 2%.Approximately 14% of household consumption was spent onfood, 10% on fuel, 4% on health care, and 21% oneducation. The richest 10% of the population accountedfor approximately 23.8% of household consumption and thepoorest 10% approximately 2.8%.
B. Minerals and resources The world's largest exporter of minerals and metals,Canada's mining sector was considered a pillar of theeconomy and a way of life for Canadians. Canada was theleading producer and exporter of potash (world's largestand richest reserves), the leading supplier of uranium,the second-largest producer of asbestos (possibly thelargest deposits) and sulfur (17% of world output and38% of world trade), the third-largest in titanium,platinum-group metals (PGMs) and mine zinc, fourth inaluminum (from imported oxide), fifth in copper, lead,silver, and gold, and among the leading producers ofnickel, salt, and nitrogen in ammonia. Yet, the countryonly recently began to fully develop many of its mostimportant mineral resources, and resources developedearlier continued to display great growth potential.This was reaffirmed by discoveries such as the huge andrich nickel, copper, and cobalt deposit at Voisey's Bay,and the Ekati diamond mines—diamond was expected to bethe most sought-after mineral in the country. Processedand unprocessed minerals, along with petroleum andnatural gas, were among Canada's top industries in 2002,
20

and aluminum was the sole nonfuel mineral product amongthe country's top export commodities. However, Canada'smineral industry was primarily export oriented, with asmuch as 90% of some commodities going to externalmarkets.
The minerals, metals, and energy sectors contributed8.7% of GDP—which grew by 4.1% in 2000 and 3.6% in 1999,a record growth among the Group of Seven economies—andmining played an integral part in Canada's new-technology-driven and knowledge-based economy. The valueof minerals production increased to US $84.2 billion in2000, the third consecutive record high (from US $54billion in 1999), mainly as a result of skyrocketingprices and substantial gains in the fuels sector. Thevalue of mine output of base and precious metals andnonmetals was US $18.5 billion. The value of metaloutput was US $11.1 billion, up from US $9.8 billion in1999, following three declining years. The higher priceof nickel in 2000 moved it ahead of gold and potash invalue. The price of PGM increased significantly in 2000,because of higher demand for use in autocatalysts.Exploration spending remained the same, after decreasingby 35% in 1999; the decrease was particularly apparentin the Northwest Territories, Ontario, and Quebec, whichtogether accounted for 60% of exploration expenditures.Exploration spending was expected to remain flat ordecline. For diamonds, though, spending was expected toincrease by 25%, with exploration spreading to most ofthe country, and bringing public excitement. The largermining companies continued to spend 80% of theirexploration budgets abroad.
In terms of value, the top nonfuel commodities in 2000were: nickel, US $2.4 billion, up from 1.6 in 1999(because of a higher realized price); gold, US $2billion; potash, US $1.7 billion, up from US $1.06billion in 1997; copper, US $1.7 billion, a 23.5% riseover 1999, reflecting stronger prices; zinc, US $1.6billion; iron ore, US $1.5 billion, up from US $1billion in 1997; cement, US $1.3 billion; and diamonds,US $600 million. Moderate declines in output led to adecreased value of production for silver (5.8%), uranium(7.7%), cobalt (10%), and lead (17.3%). Mineral andmineral product exports, including fuels, totaled US $49billion. Exports of nonfuel minerals in 2000 were valued
21

at US $44 billion (13% of all exports), up from US $32billion in 1997. Metals comprised 51% of mineral andmineral product exports; fuels, 37.3%; nonmetals, 10.3%;and structural and building materials, 1.4%. Iron ore,potash, and sulfur were exported to the United States,meeting 93% of its potash needs; copper concentrates toJapan; and iron ore and zinc to the EU. Exports ofmineral commodities and mineral-related products,including fuels, to the United States amounted to US$38.1 billion in 1999.
Mined nickel (metal content) output in 2000 was 181,027tons, down from 208,302 in 1998. The world's biggestnewsmaker in nickel continued to be Inco Ltd.'s nickel-copper-cobalt project at Voisey's Bay, which was delayedbecause of disputes involving exploration methods,environmental activism, aboriginal claims, financialstraits, and provincial politics. Proved reserves at thesite totaled 32 million tons (2.83% nickel and1.68%copper); indicated resources were 91 million tons (1.25%nickel, 0.59% copper); inferred resources, 14 milliontons (1.00% nickel, 0.70% copper). Inco operated mines,mills, smelters, and refineries in Sudbury that produced99,800 tons of nickel, and produced another 34,000 tonsin Thompson, Manitoba. Falconbridge Ltd. operated theCraig, Fraser, Lindsley, and Lockerby nickel-copper-cobalt mines near Sudbury, and the Raglan Mine innorthern Quebec; the concentrate then went to the firm'ssmelter near Sudbury and on to its refinery in Norway.Exploration by Nuinsco Resources Inc. in the Lac Rocherarea, northeast of Matagami, found strong nickel/coppermineralization. The country's total proven and probablereserves amounted to 5.7 million tons, of which Ontarioaccounted for 72%.
Gold output in 2000 was 153,781 kg, down from 171,376 in1997. Gold has lost some of its luster. Three minesopened, while 13 closed, a result of low gold pricesand/or depletion. Thirty-three mines were operating,accounting for 88% of Canada's output; the remaindercame from 19 base-metal mines and a number of placers.Ontario had 51% of the country's gold reserves, whichtotaled 1,415 tons (proven and probable), excludingmetal in placer deposits. Beginning in 1981, large newdeposits of gold ore were discovered at Hemlo, Ontario,north of Lake Superior; by 1991, more than 50% of
22

Ontario's gold production came from the three mines inthe Hemlo district. Gold production has fallen since thepeak of 177 tons in 1991.
Mined zinc output (metal content) was 935,686 tons, downfrom 1.22 million tons in 1996. Zinc markets recoveredin 2000, despite continued poor demand in Japan, slowgrowth in Europe, and increased mine productionworldwide. Hudson Bay Mining and Smelting Co. Ltd. beganan underground development program at its Chisel Northzinc deposit, at Chisel Lake, Manitoba, which included anew shaft to develop the "777 deposit" that contained14.5 million tons of proven and probable zinc reserves.Noranda completed development of the Bell Allard zinc-copper mine, Matagami district, northern Quebec, andexplored for further discoveries of copper-zincdeposits, which could counter exhaustion of the IsleDieu and Norita East zinc-copper mines, also inMatagami. The country's proven and probable reservestotaled 10.2 million tons, 35% of which was in NewBrunswick.
Mined copper output (metal content) was 623,451 tons in2000, 581,583 in 1999, and 703,245 in 1998. Thesoftening in copper prices in 1997–99 resulted in theclosure or suspension of the Highland Valley Copper andMyra Falls mines, the Mines Gaspé, and the Gibraltermine, in British Columbia. No new copper mines werescheduled to come onstream until 2002, and, althoughcopper production at Voisey's Bay was not imminent, itcould yield 99,000 tons per year of contained copper,keeping Canada a world leader. Proven and probablereserves for the country totaled 8.4 million tons, 50%of which was in Ontario, and 35% in British Columbia.
The output of iron ore and concentrate (metal content)was 22.74 million tons in 1999, down from 24.9 milliontons in 1997. Quebec Cartier Mining Co. produced 16.1million tons or iron ore; Iron Ore Co. of Canadaproduced 15.9 million tons of iron ore; and Wabash Minesturned out 5.3 million tons of iron ore pellets.Exploration continued in Roche Bay (NorthwestTerritories), the Peach River area of Alberta, andUngava Bay and Schefferville (Quebec). Total proven andprobable reserves in Canada were 1,261 million tons.
23

Mined silver output (metal content) was 1.16 million kg,down from 1.31 in 1996. Silver, the value of whoseoutput dropped by5.8% in 2000, was mainly a byproduct ofbase-metal and gold mining. Prime Resources Group'sEskay Creek gold mine, British Columbia, which startedoperations in 1995, produced 28% of the country's total.Proven and probable reserves in Canada totaled 15,738tons.
Lead output (metal content) was 152,765 tons, down from257,253 in 1996. Proven and probable reserves amountedto 1.85 million tons; 76% were in New Brunswick. Inaddition, Canada mined the metals antimony, arsenictrioxide, bismuth, cadmium, magnesium, molybdenum(121,000 tons of proven and probable reserves, all inBritish Columbia), pyrochlore, selenium, spodumene,tantalite (from Niobec, the world's third-largestproducer, and the only operating columbium mine in NorthAmerica), tellurium, and titanium. Calcium may have beenproduced as well.
Among industrial minerals, diamonds have been attractingmuch attention. Total output was 2.53 million carats in2000 and2.43 million in 1999, valued at US $600 millioneach year. Canada's first commercial production ofdiamonds—by BHP Diamonds Inc., in the Ekati Mine—beganin 1998, when production totaled 300,006 carats; 2000was Ekati's first full year of operation, and it hasbecame a factor in world markets. BHP Diamonds reportedthat the quality of diamonds recovered from the fivekimberlite pipes at its Lac de Gras property, northwestof Yellowknife, compared favorably with the best pipesin the world. De Beers, which bought 35% of Ekati'soutput, has discovered 220 kimberlites, several of whichhad the potential to become diamond mines; one, the SnapLake project, was due to be in full production by 2004,at a cost of US $1 billion, making it De Beers's firstmine outside of Africa, Canada's first underground mine,and the first kimberlite dike to be mined on a largescale. Diavik Diamond Mines Inc. proceeded, despitedelays over permits and land use, with plans for a 2-million-ton-per-year, four-kimberlite operationsouthwest of Ekati that was to begin operations by 2002,and was projected to produce 8 million carats in thefirst year of the mine's 16–22-year life—90% would be ofgem quality. More than 500 companies have been exploring
24
for diamonds, and 8,000 people were involved in diamonddrilling and its support services. The First CanadianDiamond Cutting Works, in Montreal, became the country'sfirst fully integrated cutting and polishing factory,with the aim of handling Canada's diamond production atlower cost than European competitors; artisans came fromBelgium.
Potash output was 9.1 million tons in 2000, up from 8.5in 1999. The 63%-government-owned Potash Corp. ofSaskatchewan Inc. was the largest publicly held potashproducer in the world, with an annual capacity of 8.2million tons, 61% of Canada's total capacity. An areaextending from central Saskatchewan southeast intoManitoba was probably the largest and richest reserve ofpotash in the world, and could probably supply all theworld's needs for 1,000 years. Known national reservesamounted to 14 billion tons.
Asbestos output in 2000 was 320,000 tons, down from506,000 in 1996. The world's largest deposits ofasbestos (including chrysotile, crocidolite, andamosite) were believed to be in a region of easternQuebec that included Thetford Mines and the town ofAsbestos. The Cassiar asbestos mine, after a six-yearsuspension, was to be back in production in 2000. Thenation's proven and probable reserves of fiber asbestostotaled 35.8 million tons.
Output totals for other industrial minerals in 2000were: salt, 11.9 million tons, down from 13.3 in 1998,with 264 million short tons of proven and probablereserves; sulfur, 9.36 million tons, with 130 milliontons of proven and probable reserves; nitrogen (contentof ammonia), 4.14 million tons; and sand and gravel,246.3 million tons. In addition, Canada producedamethyst, anhydrite, barite, brucite, hydraulic cement,clay and clay products, diatomite, dolomite, gypsum(482,000 tons of proven and probable reserves), jade,lime, mica (scrap and flake), nephelinesyenite, pyrite,pyrophyllite, pyrrhotite, silica (quartz), soapstone,sodium carbonate (soda ash), natural sodium sulfate(81.3 million tons of proven and probable reserves), andstone (including crushed, building, ornamental, andpaving). Canada also had capacities to produce graphiteand limestone.
25

Mining has been conducted in Canada since theseventeenth century, but the remarkably rapiddevelopment of mineral exploitation dates from the endof World War I. Petroleum has been found in the midwest;iron ore deposits in Labrador, Quebec, and Ontario; anduranium in Ontario and Saskatchewan. Ontario led theprovinces, producing 30.8% of nonfuel mineralcommodities, followed by Quebec (19.5%), Saskatchewan(11.9%), and British Columbia (11.2%).
Land use, which had not been given much attention, hasbecome an issue, with First Nation rights receivingconsideration. Canada's provincial governments regulatedmost aspects of exploration and mining, and theexceptions, the Yukon Territory and the NorthwestTerritories, have been accumulating more independentpowers. Federal agencies recently became able to reviewmining activity for environmental impact. Explorationfor metals and petroleum has tended to move north inrecent years, into the new territory Nunavut, which wascreated in 1999 out of the Northwest Territories;Nunavut included Baffin, Ellesmere, and the QueenElizabeth islands, one-fifth of Canada's landmass. TheInuit have generally been receptive to mining proposals,including the new Nanisivik lead-zinc mine on BaffinIsland, north of the Arctic Circle.
The Standards of Disclosure for Mineral Projects, whichwas to be enacted in 2001, covered all technical publicdisclosure on mineral projects and was intended topreserve Canada's preeminent position in world mining,exploration, development, and financing. The mineralindustry consisted of 3,000 domestic and 150 foreigncompanies; 10% were actively engaged in mining; theremainder were engaged in exploration, in advancedstages of development, or dormant, in search offinancing. More than 200 mine sites, including coalsites, were active, and 3,000 mines and quarriesproduced sand, gravel, and other construction materials.Total employment in mining and mineral manufacturing in2000, including coal, was 400,000, and 55,750 wereemployed in coal, metal, and nonmetal mining andquarrying. Most of the mineral industry was privatelyowned; an exception was government participation inpotash and petroleum, which were transitioning to
26

private ownership. Mining had the prospect ofdiversifying and strengthening Canada's economy. Canadawas well positioned in terms of its mineral-resourcebase and its access to markets in the United States.
F. Surface transportation
With such a vast land area, and with most productioninland, all forms of transportation are vital. Since1945, with the rapid growth of road, air, and pipelineservices, the trend has been away from railways forcarrying both freight and passengers. But because theycan supply all-weather transportation in large volumeover continental distances, railways are stillimportant. The federal government, through the CanadianTransport Commission, has allowed a few rate rises andhas insisted on a slow curtailment of services;nevertheless, the companies have traditionally operatedat a deficit or very low margin of profit because ofcompetition and rising costs. There were an estimated36,114 km (22,441 mi) of all standard gauge railways in2001. Two great continental systems operate about 90% ofthe railway facilities, the government-owned CanadianNational Railways (CNR), which was privatized in 1995,and the privately owned Canadian Pacific Ltd. (CP). Theycompete in some areas but cooperate where duplication ofservice is not profitable. In addition to their railwayoperations, CNR and CP maintain steamships and ferries,nationwide telegraph services, highway transportservices, and hotel chains.
The populated sections are generally well supplied withroads and highways, but because of difficult winterweather conditions, road maintenance is a recurring andexpensive task and puts a tremendous strain on road-building facilities. There are about 901,902 km (560,442
27

mi) of roads, 318,371 km (197,835 mi) of which is paved,including 16,571 km (10,297 mi) of expressways. The7,820-km (4,860-mi) paved Trans-Canada Highway, a C$500-million project financed jointly by the federal andprovincial governments, was completed in 1962. Canadaranks next to the United States in per capita use ofmotor transport, with one passenger car for every 2persons. Motor vehicles in use in 2000 totaled18,449,900, including 14,147,300 passenger cars and4,302,600 trucks, buses, and taxis.
Bounded by water except for the Alaskan and southernland boundaries with the United States, and with manyinland lakes and rivers that serve as traffic arteries,Canada makes much use of water transport in domestic aswell as foreign commerce. Canada has 3,000 km (1,864 mi)of waterways, including the Saint Lawrence Seaway.Canada has access to three oceans, Pacific, Atlantic,and Arctic. Canada's merchant fleet was comprised of 122ships, totaling 1,797,240 GRT, in 2002. Most overseascommerce is carried by foreign ships. Montréal isCanada's largest port and the world's largest grainport. Others among the many well-equipped ports areToronto, Hamilton, Port Arthur, and Fort William on theGreat Lakes, and Vancouver on the Pacific Coast. TheMontréal and lake ports are closed by ice from Decemberto April, during which time Halifax on the Atlantic andSaint John on the Bay of Fundy are the only AtlanticOcean traffic terminals.
The St. Lawrence Seaway and Power Project, constructedjointly by Canada and the United States, and its manycanals provide an 8-m (27-ft) navigation channel fromMontréal to Lake Superior. The Athabasca and Slaverivers and the Mackenzie, into which they flow, providean inland, seasonal water transportation system from theend of the railway in Alberta to the Arctic Ocean. TheYukon River is usually open from mid-May to mid-October.All Canadian inland waterways are open on equal terms tothe shipping of all nations.
Canada had 1,419 airports in 2001, including 507 withpermanent runways. Principal airports include CalgaryInternational at Calgary, Edmonton International atEdmonton, Halifax International at Halifax, LesterPearson at Toronto, Vancouver International at
28

Vancouver, Winnipeg International at Winnipeg, andDorval International and Mirabel International atMontreal. International air service is provided bygovernment-owned Air Canada and Canadian Airlines.Regional service is provided by some 570 smallercarriers. Air transport is the chief medium in thenorthern regions for passengers and freight. Canadianairlines transported 24,203,800 passengers in 2001.
G. Working conditions
One in three men and 40% of women hold jobs which arepart-time or temporary, not full-time, permanent jobs.Almost one in four adult workers in Canada today is lowpaid, earning less than the amount needed to keep even asingle person above the poverty line in a large urbancentre. Wages for the bottom half of the work force havebarely matched inflation for the past quarter-century asincreases in our national income have gone mainly tovery high income groups.
Growing wage inequality is the root cause of many socialproblems which communities confront on a daily basis.Anti-poverty groups have identified low wages andinsecure jobs as one of our nation’s key social andeconomic problems.
In thecurrent “Great Recession”, conditions arelikelytoworsen as growingnumbers of unemployedworkersare forcedto compete foralreadyinsecure and lowpaidjobs.
J. Foreign investment At the end of 2002, foreign direct investment (FDI) inCanada, which has increased steadily since the early
29

1950s and by an annual average of 9.9% over the past 10years, amounted to US $349.4 billion. This was only 4.7%above the level in 2001, the lowest rate of increasesince 1993. FDI inflow in 2002 was US $33.6 billion,about 20% lower than 2001. The US share in annual FDIinflow declined from 91% in 2001 to 74.7% in 2002. Thesecond largest source of inward FDI was the EuropeanUnion. Canada's relative share of global inward FDIremained unchanged in 2001 and 2002, at about 4% of theworld total. The inflow of foreign portfolio investment(foreign purchases of Canadian stocks and bonds)declined from US $30.1 billion to US $17.9 billion
Outward FDI by Canadians has grown at an even fasteraverage rate (14.6%) than inward FDI over the last 10years, although the rate of growth declined to 10.8% in2002. FDI assets held by Canadians reached US $432billion in 2002. Outward FDI flow was US $43.8 billiondown about 20% from 2001. Direct investments in theUnited States accounted for 47% of outward FDI, downfrom 60% in 2001. As in 2001, Canada accounted for about6% of the world total outward FDI in 2002. Outwardportfolio investment in 2002 was US $24.7 billion, downfrom US $37.7 billion in 2001 in 2002, up 10.8% from2001.
30

K. International trade statistics
31

L. Trade restrictions
The imposition of economics anctions against foreignStates and non-State actors remains an importantinstrument for the international community in theenforcement of international norms and laws. Sanctionscan encompass a wide variety of measures, includinglimitations on official and diplomatic contacts ortravel, the imposition of legal measures to restrictor
32
prohibit trade or other economic activity between Canadaand the target state, ortheseizureorfreezing ofpropertysituated in Canada. In order to maximize theeffectiveness of a sanctionsregime, particularly oneinvolving trade and economic measures, Canadian policyseeks to ensure that sanctions measures are appliedmultilaterally whenever possible.
IV. Developments in science and technology
In 1987–97, Canada had 2,719 scientists and engineers and 1,070technicians per million people engaged in scientific researchand development. In the same period, research and developmentexpenditures were estimated at about 1.7% of GNP. Approximatelyhalf of this expenditure is carried out by the business sector,much of it by the telecommunication equipment, aircraft, andbusiness machines industries. The federal government accountsfor about one-third of the total research and developmentactivity.
The Ministry of State for Science and Technology, establishedin 1971, is the chief federal policymaking body. In 1986, theNational Advisory Board for Science and Technology, chaired bythe prime minister, was created, and merged with the ministry.In the following year, a National Science and Technology Policy(NSTP) was approved by ministers of the federal, provincial,and territorial governments. The NSTP has emphasized a strongpush linking national research to national needs.
The Royal Society of Canada, founded in 1882 and headquarteredin Ottawa, is the most prestigious learned society; there are53 specialized societies in the fields of agriculture,medicine, science, and technology. The National ResearchCouncil of Canada, founded in 1916 and headquartered in Ottawa,coordinates research and development in the country; one of itsmajor facilities is the Dominion Astrophysical Observatory,established in 1918 at Victoria, British Columbia. TheGeological Survey of Canada (founded in 1842) is headquarteredin Ottawa.
The National Museum of Science and Technology in Ottawa,founded in 1967, shows Canada's role in science and technology.
33
The Ontario Science Centre, established in North York in 1965,has over 800 exhibits. In 1996, Canada had 49 universitiesoffering courses in basic and applied science. In 1987–97,science and engineering students accounted for 16% of collegeand university enrollments.
V. Channels of distribution (macro analysis)
The Canadian distribution channels are made up of NorthAmerican partners, butal so contain strong regional Canadianowned distributors. The U.S. owned distributors recognize thatthe Canadian market, with 90% of it’s population within 100miles of a US border, requires unique support due to regulatoryand language (Canadaisbi-lingual) issues along with a geographythat spans 5,000 miles from coast to coast.
KB Medland has a broadrange of principals who have strong brandnames desired by various end user markets. Our segmented salesapproach allows for each owner to be integrated and alignedwith distribution channels such as janitorial, medical,foodservice, office, industrial and safety. Althoughthese arethe primary channels, KB Medlandalso has strong communityconnections to assist any brand manufacturer an opportunity foraccess to other market channels.
Canadian distribution is constantly changing and KB Medlandprovides an experienced and skilled sales team to navigatethrough the clutter to drive profitable results for theprincipals they represent.
VI. Media
There were 118.5 million mainline telephones in Canada in 1999.As of 1997, there were about 4.2 million cellular phones inuse. The 10 public and private companies in Telecom Canadaprovide a major share of the nation's telecommunications
34

services, including all long-distance service, and linkregional networks across Canada. Telegraph services areoperated by the two transcontinental railroads and by thefederal government to outlying districts. All externaltelecommunication services are operated by the CanadianOverseas Telecommunication Corp., a crown agency. The PostOffice became a crown corporation in 1981.
The Broadcasting Act of 1968 entrusted the Canadian Radio-Television Commission with the regulation and supervision ofall aspects of the broadcasting system. The publicly ownedCanadian Broadcasting Corp. (CBC) provides the nationalbroadcasting service in Canada. Its radio and televisionfacilities extend from the Atlantic Ocean to the Pacific andnorth to the Arctic Circle. The CBC has broadcasting stationsin the principal cities and operates both English- and French-language national networks. Privately owned local stations formpart of the networks and provide alternative programs. As of1998, there were 535 AM broadcasting stations, 53 FM stations,and about 80 television stations. In 2000 there were 1,047radios and about 708 television sets for every 1,000 people.Radio Canada International, the CBC's shortwave service,broadcasts in seven languages to Europe, Africa, Latin America,Asia, the Middle East, the South Pacific, and the UnitedStates.
The Canadian communication satellites play an increasinglysignificant role in efforts to bring radio and televisionservices to the more remote parts of the country, particularlyin the north. Beginning in late 1980, a new television networkbegan broadcasting programs in the Inuit language viasatellite, offering viewers the opportunity to "talk back"through their television sets to people in other communities.As of May 1987, radio and television services reached 99% ofCanadian homes. A broadcasting policy announced in April 1983increased the quantity of Canadian content required inprogramming, established a fund to assist private andindependent producers, and relaxed licensing requirements forthe use of satellite earth-stations for radio and televisionreception.
In 2001, there were about 760 Internet service providersserving 14.4 million subscribers.
In 2002 there were over 100 major daily newspapers across thecountry. Although some newspapers in Montréal, Québec, Toronto,
35

Winnipeg, and Vancouver have more than local influence, mostcirculate only on a regional basis and have a limited number ofreaders. Rural areas are served by over 2,000 monthly andweekly publications. There are many consumer magazines, butonly Maclean's is truly national. Three large news-gatheringorganizations are the Canadian Press, a cooperatively owned andoperated venture, the British United Press, and United PressInternational of Canada.
Canada's leading newspapers (with their 2002 dailycirculations) include the following:
LANGUAGE CIRCULATIONToronto Star English 459,900Globe and Mail (Toronto) English 353,950National Post (Toronto) English 308,810Le Journal de Montréal French 262,660Toronto Sun English 230,620Vancouver Sun English 187,790La Presse (Montréal) French 182,660The Province (Vancouver) English 160,180Ottawa Citizen English 137,659The Gazette (Montréal) English 136,030Edmonton Journal English 134,550Winnipeg Free Press English 118,638Calgary Herald English 111,640The Hamilton Spectator English 105,750Le Journal de Québec French 93,880The London Free Press English 93,740The Chronicle-Herald (Halifax) English 92,170Le Soleil (Québec) French 80,900The law provides for freedom of expression, including speechand press, and the government supports these rights. Thebanning of journalists from reporting on some court cases untilafter a trial in concluded enjoys widespread public support, infavor of a defendant's right to a fair trial.
III. Market Audit and Competitive Market Analysis
36

GuidelineI. Introduction
II. The product
A. Evaluate the product as an innovation as itis perceived by the intended market
1. Relative advantage
2. Compatibility
3. Complexity
4. Trialability
5. Observability
B. Major problems and resistances to product acceptance based on the preceding evaluation
III. The market
A. Describe the market(s) in which the productis to be sold
1. Geographical region(s)
2. Forms of transportation and communication available in that (those)
37

region(s)
3. Consumer buying habits
a. Product-use
b. Product feature preferences
c. Shopping habits
4. Distribution of the product
a. Typical retail outlets
b. Product sales by other middlemen
5. Advertising and promotion
a. Advertising media usually used to reach your target market(s)
b. Sales promotions customarily used (sampling, coupons, etc.)
6. Pricing strategy
a. Customary markups
b. Types of discounts available
B. Compare and contrast your product and the competition’s product(s)
1. Competitor’s product(s)
a. Brand name
38

b. Features
c. Package
2. Competitor’s prices3. Competitor’s promotion and advertising methods
4. Competitor’s distribution channels
C. Market size writing
1. Estimated industry sales for the planning year
2. Estimated sales for your company for the planning year
D. Government participation in the marketplace
1. Agencies that can help you
2. Regulations you must follow
IV. Preliminary Marketing Plan
GuidelineI. The marketing plan
39

A. Marketing objectives
1. Target market(s) (specific description of the market)
2. Expected sales
3. Profit expectations
4. Market penetration and coverage
B. Product adaptation or modification
1. Core component2. Packaging component3. Support services component
C. Promotion mix
1. Advertisinga. Objectives
b. Media mix
c. Message
d. Costs
2. Sales promotions
a. Objectives
40

b. Coupons
c. Premiums
d. Costs
3. Personal selling
4. Other promotional methods
D. Distribution: From origin to destination
1. Port selection
a. Origin port
b. Destination port
2. Mode selection: Advantages/disadvantages ofeach mode
a. Railroads
b. Air carriers
c. Ocean carriers
d. Motor carriers
3. Packing
a. Marking and labeling regulations
b. Containerization
c. Costs
4. Documentation required
41

a. Bill of lading
b. Dock receipt
c. Air bill
d. Commercial invoice
e. Pro forma invoice
f. Shipper’s export declaration
g. Statement of origin
h. Special documentation
5. Insurance claims
6. Freight forwarder
E. Channels of distribution (micro analysis)
1. Retailers
a. Type and number of retail stores
b. Retail markups for products in each type ofretail store
c. Methods of operation for each type (cash/credit)
d. Scale of operation for each type (small/large)
2. Wholesale middlemen
42
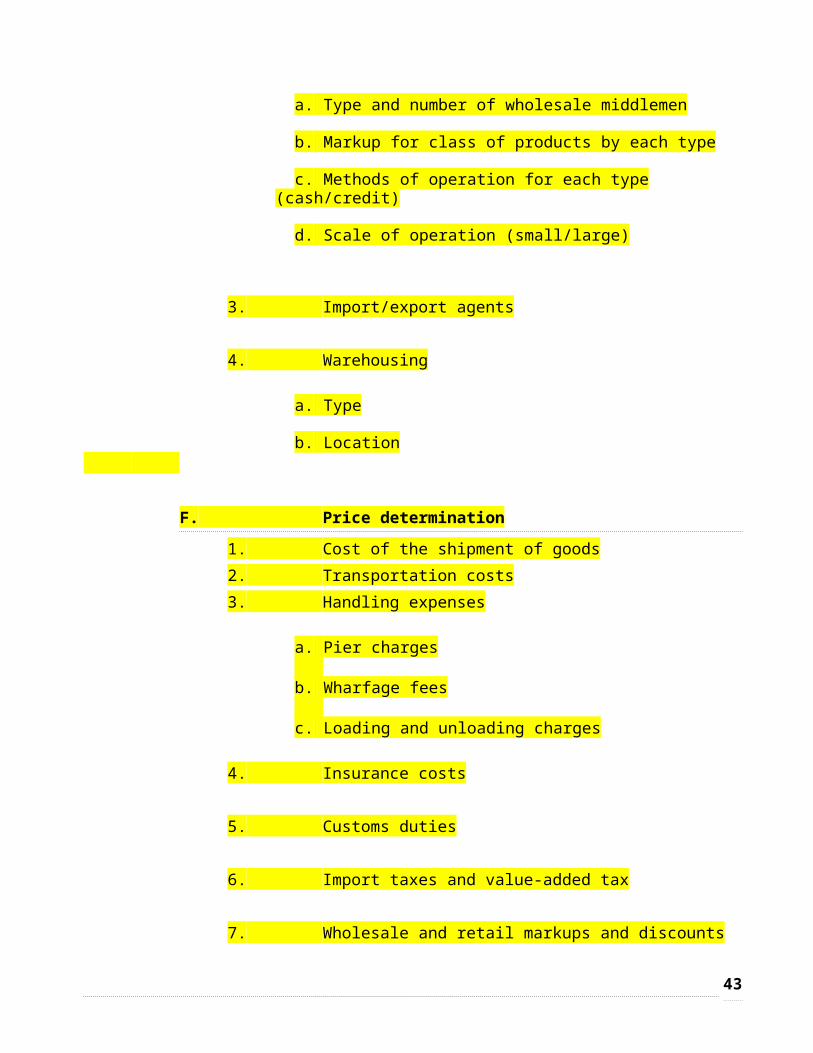
a. Type and number of wholesale middlemen
b. Markup for class of products by each type
c. Methods of operation for each type (cash/credit)
d. Scale of operation (small/large)
3. Import/export agents
4. Warehousing
a. Type
b. Location
F. Price determination 1. Cost of the shipment of goods2. Transportation costs3. Handling expenses
a. Pier charges
b. Wharfage fees
c. Loading and unloading charges
4. Insurance costs
5. Customs duties
6. Import taxes and value-added tax
7. Wholesale and retail markups and discounts
43

8. Company’s gross margins
9. Retail price
G. Terms of sale
1. INCOTERMS. EX works, FOB, FAS, C&F, CIF
2. Advantages/disadvantages of each
H. Methods of payment
1. Cash in advance
2. Open accounts
3. Consignment sales
4. Sight, time, or date drafts
5. Letters of credit
II. Pro forma financial statements and budgets
A. Marketing budget
1. Selling expense
2. Advertising/promotion expense
44

3. Distribution expense
4. Product cost
5. Other costs
B. Pro forma annual profit and loss statement (first year and fifth year)
III. Resource requirements
A. Finances
B. Personnel
C. Production capacity
IV. Executive summary
V. Sources of information
VI. Appendixes
45