THE SPIRIT LEVEL Why Greater Equality Makes Societies Stronger 'N, \ ■ @BULLET 4 @BULLET / @BULLET...
409
INTERNATIONAL BESTSELLER THE SPIRIT LEVEL ------------------- M ---------------------- Why Greater Equality Makes Societies Stronger 'N, \ ■ • 4 • / • ‘A \ RICHARD WILKINSON and KATE PICKETT Foreword by Robert B. Reich
-
Upload
independent -
Category
Documents
-
view
2 -
download
0
Transcript of THE SPIRIT LEVEL Why Greater Equality Makes Societies Stronger 'N, \ ■ @BULLET 4 @BULLET / @BULLET...

I N T E R N A T I O N A L B E S T S E L L E R
THE SPIRIT LEVEL
------------------- M ----------------------
Why Greater Equality Makes Societies Stronger
'N, \ ■ •4 • / • ‘A \
RICHARD WILKINSON and KATE PICKETTForeword by Robert B. Reich


‘Might be the most important book of the year.’ Guardian (UK)
‘Fascinating and deeply provoking . . . The Spirit Level does contain a powerful political message. It is impossible to read it
and not to be impressed by how often greater equality appears to be the answer, whatever happens to be the question. It provides a
connection between what otherwise look like disparate social problems.’
David Runciman, London Review o f Books (UK)
‘A compass to rebuild our societies . . . A shining vision.’ Johann Hari, Independent (UK)
‘A crucial contribution to the ideological argument . . . It provides a vital part of the intellectual manifesto on which
the battle for a better society can be fought.’Roy Hattersley, N ew Statesman (UK)
‘I recognize in this book a truth that most of us know in our bones. A fair society is an essential part of our wellbeing.’
Colette Douglas Home, Glasgow Herald
‘Compelling and shocking. All free marketers should be made to memorize it from cover to cover.’
Yasmin Alibhai-Brown, Independent (UK)
‘An impressive body of evidence, presented in an easily digestible form . . . It raises some big questions.’
Will Kymlicka, Globe and M ail (Canada)
‘Brave and imaginative . . . A far-reaching analysis.’ Michael Sargent, Nature
‘My bet to become the manifesto for the next ten years.’ Richard Gillis, Irish Times
‘A groundbreaking work and one that deserves the widest possible readership.’ Iain Ferguson, Socialist Review (UK)

‘Surprising . . . Upends the traditional debate about income inequality.’ Peter Wilson, The Australian
‘This is a book with a big idea, big enough to change political thinking . . . In half a page [The Spirit Level] tells you more about the pain of inequality than any play or novel could.’
John Carey, Sunday Times (UK)
‘The connection [between income inequality and dysfunctional societies] is spelt out with stark clarity in Richard Wilkinson and
Kate Pickett’s remarkable new book, The Spirit Level. Income inequality, they show beyond any doubt, is not just bad for those
at the bottom but for everyone.’Will Hutton, Observer (UK)
‘Richard Wilkinson and Kate Pickett put forward compelling evidence that income inequalities are at the root of a wide range
of health and social problems in society.’Niall Crowley, Irish Times Weekend Review
‘The evidence, here painstakingly marshaled, is hard to dispute.’ Economist (UK)
‘Many [New Statesman] readers will be inspired as I am by a new book, The Spirit Level . . . Wilkinson and Pickett compare
not only different countries, but also the 50 US states. They show that greater equality benefits not just the poor, but all
occupational groups . . . [The Spirit Level has] lots of graphs butno jargon.’
Peter Wilby, N ew Statesman (UK)
‘In this fascinating sociological study, the authors do an excellent job of presenting the research, analyzing nuances, and offering
policy suggestions for creating more equal and sustainable societies. For all readers, specialized or not, with an interest in
understanding the dynamics today between economic and social conditions.’
Library Journal

RICHARD WILKINSON AND KATE PICKETT
The Spirit Level
Why Greater Equality Makes Societies Stronger
B L O O M S B U R Y PR ESS N E W Y O R K • B E R L I N • L O N D O N • S Y D N E Y

C opyright © 2009, 2 0 10 by R ichard W ilkinson and K ate Pickett F orew ord copyright © 2 0 10 by R ob ert B. Reich
All rights reserved. N o p art o f this book m ay be used or reproduced in any m anner
w hatsoever w ithout written perm ission from the publisher except in the case o f brief
quotations em bodied in critical articles or review s. For in form ation address
B loom sbury Press, 17 5 Fifth Avenue, N ew Y o rk , N Y 10 0 10 .
Published by Bloom sbury Press, N ew Y o rk
A ll papers used by B loom sbury Press are natural, recyclable products m ade from
w ood grow n in w ell-m anaged forests. T he m anufacturing processes conform to
the environm ental regulations o f the country o f origin.
L i b r a r y o f C o n g r e s s C a t a l o g i n g - I n -P u b l i c a t i o n D a t a
W ilkinson, R ichard G .T h e spirit level : w hy greater equality m akes societies stronger /
R ichard W ilkinson and Kate Pickett.— 1s t A m erican ed.
p . cm.
Includes b ibliographical references and index.
ISBN 978-1-60819-036-2 (hardcover : a lk . paper)
. Equality. 2 . Social m obility. 3. Q uality o f life. 4. Social policy. I. Pickett, K ate. II. T itle .
H M 82 1.W 55 2009
30 6 .0 1— dc22
2009030428
First published in G reat Britain by Allen Lane,
a d ivision o f the Penguin G rou p , in 2009
First published in the United States by B loom sbury Press in 2 0 10
T h is paperback edition published in 2 0 1 1
Paperback ISBN : 978-1-6 0 819-34 1-7
3 5 7 9 10 8 6 4
T ypeset by R ow lan d Phototypesetting Ltd , Bury St Edm unds, Su ffo lk
Printed in the United States o f A m erica by Q uad/G raphics, Fairfield, Pennsylvania

F o r our parents D o n an d M arion C hapm an
G eorge an d M ary G u illem a rd


Contents
F o rew o rd , by R obert B. Reich ix
Preface xiii
A ckn ow ledgem en ts xvii
N o te on G raphs xix
P A R T O N E
M aterial Success, Social Failure
i The end o f an era 32 Poverty or inequality? 153 H o w inequality gets under the skin 3i
P A R T T W O
The Costs of Inequality
4 Com m unity life and social relations 495 M ental health and drug use 63
6 Physical health and life expectancy 737 O besity: w ider incom e gaps, w ider w aists 89
8 Educational perform ance 103
9 Teenage births: recycling deprivation 119
io V iolence: gaining respect 129
n Im prisonm ent and punishment 14512 Social m obility: unequal opportunities 157
P A R T T H R E E
A Better Society
13 D ysfunctional societies 173
14 O ur social inheritance 197
15 Equality and sustainability 2 17
1 6 Building the future 235
P ostscript - Research M eets Politics 273
The E qu a lity Trust 299
A p p en d ix 301
Sources o f D ata fo r the Indices o fH ealth an d Socia l P rob lem s 306
Statistics 310
R eferences 3 12
In d ex 343

Foreword
R O B E R T B. R E I C H
Professor o f Public Policy, University o f California Former U.S. Secretary o f Labor
Most American families are worse off today than they were three decades ago. The Great Recession of 2008-2009 destroyed the value of their homes, undermined their savings, and too often left them without jobs. But even before the Great Recession began, most Americans had gained little from the economic expansion that began almost three decades before. Today, the Great Recession notwithstanding, the U.S. economy is far larger than it was in 1980. But where has all the wealth gone? Mostly to the very top. The latest data shows that by 2007, America’s top 1 percent of earners received 23 percent of the nation’s total income—almost triple their 8 percent share in 1980.
This rapid trend toward inequality in America marks a significant reversal of the move toward income equality that began in the early part of the twentieth century and culminated during the middle decades of the century.
Yet inequality has not loomed large as a political issue. Even Barack Obama’s modest proposal to return income tax rates to where they stood in the 1990s prompted his 2008 Republican opponents to call him a socialist who wanted to spread the wealth. Once president, Obama’s even more modest proposal to limit the income tax deductions of the wealthy in order to pay for health care for all met fierce resistance from a Democratically controlled Congress.
If politicians have failed to grapple with the issue of inequality, few scholars have done better. Philosophers have had little to say on the subject. Some who would tax the rich to help the poor frame their arguments as utilitarian. Taking a hundred dollars from a rich person and giving it to a poor person would diminish the rich person’s happiness only slightly, they

argue, but greatly increase the happiness of the poor person. Others ground their arguments in terms of hypothetical consent. John Rawls defends redistribution on the grounds that most people would be in favor of it if they had no idea what their income would otherwise be.
Nor have economists, whom we might expect to focus attention on such a dramatic trend, expressed much concern about widening inequality. For the most part, economists concern themselves with efficiency and growth. In fact, some of them argue that wide inequality is a necessary, if not inevitable, consequence of a growing economy. A few worry that it cuts off opportunities among the children of the poor for productive lives'—but whether to distribute wealth more equally, or what might be gained from doing so, is a topic all but ignored by today’s economic researchers.
It has taken two experts from the field of public health to deliver a major study of the effects of inequality on society. Though Richard Wilkinson and Kate Pickett are British, their research explores the United States in depth, and their work is an important contribution to the debate our country needs.
The Spirit Level looks at the negative social effects of wide inequality— among them, more physical and mental illness not only among those at the lower ranks, but even those at the top of the scale. The authors find, not surprisingly, that where there are great disparities in wealth, there are heightened levels of social distrust. They argue convincingly that wide inequality is bad for a society, and that more equal societies tend to do better on many measures of social health and wealth.
But if wide inequality is socially dysfunctional, then why are certain countries, such as the United States, becoming so unequal? Largely because of the increasing gains to be had by being just a bit better than other competitors in a system becoming ever more competitive.
Consider executive pay. During the 1950s and ’60s, CEOs of major American companies took home about 25 to 30 times the wages of the typical worker. After the 1970s, the two pay scales diverged. In 1980, the big-company CEO took home roughly 40 times; by 1990, it was 100 times. By 2007, just before the Great Recession, CEO pay packages had ballooned to about 350 times what the typical worker earned. Recent supports suggest that the upward trajectory of executive pay, temporarily stopped by the economic meltdown, is on the verge of continuing. To make the comparison especially vivid, in 1968 the CEO of General Motors—then the largest company in the United States—took home around 66 times the pay and benefits of the typical GM worker at the time. In 2005, the CEO of Wal- Mart— by then the largest U.S. company—took home 900 times the pay and benefits of the typical Wal-Mart worker.

What explains this trajectory? Have top executives become greedier? Have corporate boards grown less responsible? Are CEOs more crooked? Are investors more docile? Is Wall Street more tractable? There’s no evidence to support any of these theories. Here’s a simpler explanation: Forty years ago, everyone’s pay in a big company—even pay at the top—was affected by bargains struck among big business, big labor, and, indirectly, government. Big companies and their unions directly negotiated pay scales for hourly workers, while white-collar workers understood that their pay grades were indirectly affected. Large corporations resembled civil service bureaucracies. Top executives in these huge companies had to maintain the good will of organized labor. They also had to maintain good relationships with public officials in order to be free to set wages and prices; to obtain regulatory permissions on fares, rates, or licenses; and to continue to secure government contracts. It would have been unseemly of them to draw very high salaries.
Since then, competition has intensified. With ever greater ease, rival companies can get access to similar low-cost suppliers from all over the world. They can streamline their operations with the same information technology their competitors use; they can cut their labor force and substitute similar software, culled from many of the same vendors. They can just as readily outsource hourly jobs abroad. They can get capital for new investment on much the same terms. They can gain access to distribution channels that are no less efficient, some of them even identical (Wal-Mart or other big- box retailers). They can attract shareholders by showing even slightly better performance, or the promise of it.
The dilemma facing so many companies is therefore how to beat rivals. Even a small advantage can make a huge difference to the bottom line. In economic terms, CEOs have become less like top bureaucrats and more like Hollywood celebrities or star athletes, who take a share of the house. Hollywood’s most popular celebrities now pull in around 15 percent of whatever the studios take in at the box office, and athletes are also getting a growing portion of sales. As the New Yorker’s James Surowiecki has reminded us, Mickey Mantle earned $60,000 in 1957. Carlos Beltran made $15 million in 2005. Even adjusting for inflation, Beltran got 40 times as much as Mantle. Clark Gable earned $ 100,000 a picture in the 1940s, which translates into roughly $800,000 today. Tom Hanks, by contrast, makes closer to $20 million per film. Movie studios and baseball teams find it profitable to pay these breathtaking sums because they’re still relatively small compared to the money these stars bring in and the profits they generate. Today’s big companies are paying their CEOs mammoth sums for much the same reason.

In the world of finance, the numbers are yet greater. Top investment bankers and traders take home even more than CEOs or most Hollywood stars. For the managers of twenty-six major hedge funds, the average take- home pay in 2005 was $363 million, a 45 percent increase over their average earnings the year before. The Wall Street meltdown took its toll on some of these hedge funds and their managers, but by the end of 2009 many were back.
This economic explanation for these startling levels of pay does not justify them socially or morally. It only means that in our roles as consumers and investors we implicitly think CEOs, star athletes, and Hollywood celebrities are worth it. As citizens, though, most of us disapprove. Polls continue to show that a great majority of Americans believes CEOs are overpaid, and that inequality of income and wealth is a large problem.
In short, our nation’s wealth is becoming even more concentrated at the top. It has become the financial equivalent of hydrodynamics: Large streams of income create even larger pools of wealth. The family of Wal-Mart founder Sam Walton has a combined fortune estimated to be about $90 billion. In 2005, Bill Gates was worth $46 billion; Warren Buffet, $44 billion. By contrast, the combined wealth of the bottom 40 percent of the United States population that year—some 120 million people—was estimated to be around $95 billion. Here again, the Great Recession of 2008-2009 took a toll; some of these billionaires’ fortunes were whittled down by 20 to 40 percent. But even then, they remained immense.
As citizens, we may feel that inequality on this scale cannot possibly be good for us, and Wilkinson and Pickett supply the evidence that confirms our gut sense of unease. Such inequality undermines the trust, solidarity, and mutuality on which responsibilities of citizenship depend. It creates a new aristocracy whose privileges perpetuate themselves over generations (one of the striking findings in these pages is that America now has less social mobility than many poorer countries). And it breeds cynicism among the rest of us.
This is not to say that the superrich are at fault. By and large, “ the market” is generating these outlandish results. But the market is a creation of public policies. And public policies, as the authors make clear, can reorganize the market to reverse these trends. The Spirit Level shows why the effort to do so is a vital one for the health of our society.
Berkeley, California July 2009
Xll

Preface
People usually exaggerate the importance of their own w ork and we w orry about claiming too much. But this book is not just another set of nostrums and prejudices about how to put the world to rights. The w ork we describe here comes out o f a very long period
of research (over fifty person-years between us) devoted, initially, to trying to understand the causes o f the big differences in life expectancy - the ‘health inequalities’ - between people at different levels in the social hierarchy in modern societies. The focal problem initially was to understand why health gets worse at every step down the social ladder, so that the poor are less healthy than those in the middle, who in turn are less healthy than those further up.
Like others who work on the social determinants of health, our training in epidemiology means that our methods are those used to trace the causes o f diseases in populations - trying to find out why one group o f people gets a particular disease while another group doesn’t, or to explain why some disease is becoming more common.
The same methods can, however, also be used to understand the causes o f other kinds of problems - not just health.
Just as the term ‘evidence-based medicine’ is used to describe current efforts to ensure that medical treatment is based on the best scientific evidence of what works and what does not, we thought o f calling this book ‘Evidence-based Politics’ . The research which underpins what we describe comes from a great many research teams in different universities and research organizations. Replicable methods have been used to study observable and objective outcomes, and peer-reviewed research reports have been published in academic,
scientific journals.

This does not mean that there is no guesswork. Results always have to be interpreted, but there are usually good reasons for favouring one interpretation over another. Initial theories and expectations are often called into question by later research findings which make it necessary to think again. We would like to take you on the journey we have travelled, signposted by crucial bits of evidence and leaving
out only the various culs-de-sac and wrong turnings that wasted so much time, to arrive at a better understanding of how we believe it is possible to improve the quality of life for everyone in modern societies. We shall set out the evidence and our reasons for interpreting it the way we do, so that you can judge for yourself.
At an intuitive level people have always recognized that inequality is socially corrosive. But there seemed little reason to think that levels o f inequality in developed societies differed enough to expect any measurable effects. The reasons which first led one of us to look for effects seem now largely irrelevant to the striking picture which has emerged. M any discoveries owe as much to luck as judgement.
The reason why the picture we present has not been put together until now is probably that much o f the data has only become available in recent years. With internationally comparable information not only on incomes and income distribution but also on different health and social problems, it could only have been a matter of time before someone came up with findings like ours. The emerging data
have allowed us, and other researchers, to analyse how societies differ, to discover how one factor is related to another, and to test theories more rigorously.
It is easy to imagine that discoveries are more rapidly accepted in the natural than in the social sciences - as if physical theories are somehow less controversial than theories about the social world. But the history o f the natural sciences is littered with painful personal disputes, which started o ff as theoretical disagreements but often lasted for the rest o f people’s lives. Controversies in the natural sciences are usually confined to the experts: most people do not have strong views on rival theories in particle physics. But they do have views on how society works. Social theories are partly theories about ourselves; indeed, they might almost be regarded as part of our selfawareness or self-consciousness of societies. While natural scientists
do not have to convince individual cells or atoms to accept their
theories, social theorists are up against a plethora o f individual views
and powerful vested interests.In 1847, Ignaz Semmelweiss discovered that if doctors washed
their hands before attending women in childbirth it dramatically reduced deaths from puerperal fever. But before his w ork could have
much benefit he had to persuade people - principally his medical colleagues - to change their behaviour. His real battle was not his initial discovery but what followed from it. His views were ridiculed and he was driven eventually to insanity and suicide. M uch of the medical profession did not take his w ork seriously until Louis
Pasteur and Joseph Lister had developed the germ theory of disease,
which explained why hygiene was important.We live in a pessimistic period. As well as being worried by the
likely consequences of global warm ing, it is easy to feel that many societies are, despite their material success, increasingly burdened by their social failings. And now, as if to add to our woes, we have
the economic recession and its aftermath of high unemployment. But the knowledge that we cannot carry on as we have, that change is necessary, is perhaps grounds for optimism: maybe we do, at last, have the chance to make a better world. The extraordinarily positive
reception o f the hardback editon o f this book confirms that there is a
widespread appetite for change and a desire to find positive solutions
to our problems.We have made only minor changes to this edition. Details of the
statistical sources, methods and results, from which we thought most readers would want to be spared, are now provided in an appendix for those with a taste for data. Chapter 13 , which is substantially about causation, has been slightly reorganized and strengthened. We have also expanded our discussion o f what has made societies substantially more or less equal in the past. Because we conclude that these changes have been driven by changes in political attitudes, we think it is a mistake to discuss policy as if it were a matter of finding the right technical fix. As there are really hundreds o f ways that societies can become more equal if they choose to, we have not nailed our colours to one or other set o f policies. W hat we need is not so much a clever solution as a society which recognizes the

benefits o f greater equality. If correct, the theory and evidence set out in this book tells us how to make substantial improvements
in the quality o f life for the vast majority of the population. Yet unless it is possible to change the w ay most people see the societies they live in, the theory will be stillborn. Public opinion will only support the necessary political changes if something like the perspective we outline in this book permeates the public mind. We have therefore set up a not-for-profit organization called The Equality Trust (described at the end of this book) to make the kind of evidence set out in the following pages better known and to suggest that there is a w ay out of the woods for us all.

Acknowledgements
We are grateful to Danny Dorling, Stuart Proffitt and Alison Quick for their careful reading and many helpful comments on our manu
script. We also thank M olly Scott Cato for her comments on
Chapter 15 , M ajid Ezzati for kindly sending us his corrected estimates o f body mass index for US states, and Stephen Bezruchka for helpful discussions.
We are also grateful to the Joseph Rowntree Charitable Trust,
especially Stephen Pittam, for supporting our efforts to disseminate
this research via The Equality Trust; and Kathryn Busby and Bill Kerry whose hard w ork has made it a going concern.
Richard Wilkinson would like to thank the University o f Nottingham and his former colleagues in the Division of Epidemiology and
Public Health for the freedom which allowed him to devote his time
to the research which went into this book. Kate Pickett thanks the University of York and her colleagues for their generous support.
Figures 3 .1 and 3.2 are reproduced by kind permission o f Jean Twenge. We are grateful to Cambridge University Press for permission to reproduce Figures 4.3 and 10 .1. Figure 6.1 is reproduced with permission from B M J Publishing group; Figure 6.7 with permission from Bryan Christie Design, L L C ; and Figure 15.3 with permission from the Econom ic Journal. All other Figures are our own, and can be freely reproduced with acknowledgement.
The cartoons on pp. 16 , 32, 64, 104, 1 18 , 130 , 146, 158 , 172 , 194, 2 14 and 230 are from w w w .C arto o n Sto ck .co m . G rateful acknow ledgem ent is given to them and to the fo llow in g for perm ission to reproduce cartoons: p. 2, copyright © A ndy Singer, 2007, politicalcartoons.com ; p. 48, copyright © The N e w Y orker
xvu

collection, 1996, Peter Steiner, cartoonbank.com; p. 74, copyright © Joseph Farris, cartoonbank.com; p .88, copyright © The N ew Yorker collection, 2005, Lee Lorenz, cartoonbank.com.

Note on Graphs
F A C T S F R O M F I G U R E S : H O W T O L O O K A T T H E G R A P H S I N T H I S B O O K
M ost o f the graphs that we use in this book are charts linking income inequality to different health and social problems. They show relationships, either: (i) internationally, comparing rich countries or (2) in the USA, comparing different states.
In all o f these graphs, we put income inequality along the horizontal line at the bottom (the x-axis), so societies with low levels of inequality are to the left, and societies with high levels o f inequality are towards the right of the graph.
The different health and social outcomes are shown on the vertical line (the y-axis) on the left side of the graph.
On most of the graphs, there are two features. First there is a scatter of points, either o f rich countries, or of US states, so that readers can see exactly how each society compares to others. Second,
there is a line, called a regression line, which shows the ‘best fit’ relationship between income inequality and the outcome on that graph. This line is not chosen by us, but is calculated by statistical software to give the line which best fits the trend through the data points. It is also possible to calculate how unlikely it is that the pattern we see could result from chance alone. We have only included a best fit line through the points if the relationship would be very unlikely to occur by chance. When a graph has no best fit line it means that there is no evidence of a relationship.
If the line slopes steeply upwards from left to right, it shows that the health or social outcome becomes more common in more

unequal societies. This pattern tends to occur with problems that we think of as bad, such as violence:
y-axis
x-axis
I f the line slopes steeply downwards from left to right, it shows that the health or social outcome is much less common in more unequal societies. We see this pattern for things that we think o f as good, such as trust:
y-axis
x-axis
A wider scatter o f points on the graph means that there are other important influences on the outcome. It may not mean that inequality is not a powerful influence, simply that other factors matter as well:

y-axis
x-axis
A narrow scattering of points means that there is a very close
relationship between inequality and the outcome and that inequality is an excellent predictor of the outcome:
y-axis
x-axis
Further details o f our methods can be found at: ww w.
equalitytrust.org.uk
o


P A R T O N E
Material Success, Social Failure


The end of an era
I care for riches, to make gifts to friends, or lead a sick man back to health with ease and plenty. Else small aid
is wealth for daily gladness; once a man be done with hunger, rich and poor are all as one. Euripides, Electra
It is a remarkable paradox that, at the pinnacle o f human material and technical achievement, we find ourselves anxiety-ridden, prone
to depression, worried about how others see us, unsure of our friendships, driven to consume and with little or no community life. Lacking the relaxed social contact and emotional satisfaction we all need, we seek com fort in over-eating, obsessive shopping and spend
ing, or become prey to excessive alcohol, psychoactive medicines and
illegal drugs.H ow is it that we have created so much mental and emotional
suffering despite levels of wealth and com fort unprecedented in human history? Often what we feel is missing is little more than time enjoying the company o f friends, yet even that can seem beyond
us. We talk as if our lives were a constant battle for psychological survival, struggling against stress and emotional exhaustion, but the truth is that the luxury and extravagance o f our lives is so great that
it threatens the planet.Research from the H arw ood Institute for Public Innovation
(commissioned by the M erck Fam ily Foundation) in the U SA shows that people feel that ‘materialism’ somehow comes between them and the satisfaction of their social needs. A report entitled Yearning fo r Balance, based on a nationwide survey o f Americans, concluded

that they were ‘deeply ambivalent about wealth and material gain’ .1* A large m ajority of people wanted society to ‘move aw ay from greed and excess toward a w ay o f life more centred on values, community, and fam ily’ . But they also felt that these priorities were not shared by most o f their fellow Americans, who, they believed, had become ‘increasingly atomized, selfish, and irresponsible’ . As a result they often felt isolated. However, the report says, that when brought together in focus groups to discuss these issues, people were ‘ surprised and excited to find that others share[d] their views’ . Rather than uniting us with others in a common cause, the unease we feel
about the loss o f social values and the w ay we are drawn into the
pursuit o f material gain is often experienced as if it were a purely private ambivalence which cuts us o ff from others.
M ainstream politics no longer taps into these issues and has abandoned the attempt to provide a shared vision capable o f inspir
ing us to create a better society. As voters, we have lost sight o f any collective belief that society could be different. Instead o f a better society, the only thing almost everyone strives for is to better their own position - as individuals - within the existing society.
The contrast between the material success and social failure of many rich countries is an important signpost. It suggests that, if we
are to gain further improvements in the real quality o f life, we need to shift attention from material standards and economic growth to w ays o f improving the psychological and social wellbeing o f whole societies. However, as soon as anything psychological is mentioned,
discussion tends to focus almost exclusively on individual remedies
and treatments. Political thinking seems to run into the sand.It is now possible to piece together a new, compelling and
coherent picture o f how we can release societies from the grip o f so much dysfunctional behaviour. A proper understanding o f what is
going on could transform politics and the quality o f life for all o f us.
It would change our experience o f the world around us, change what we vote for, and change what we demand from our politicians.
In this book we show that the quality o f social relations in a society is built on material foundations. The scale o f income differ
*Superscripts refer to numbered references listed at the end of the book.

ences has a powerful effect on how we relate to each other. Rather than blaming parents, religion, values, education or the penal system,
we will show that the scale o f inequality provides a powerful policy
lever on the psychological wellbeing o f all o f us. Just as it once took studies of weight gain in babies to show that interacting with a loving care-giver is crucial to child development, so it has taken studies o f death rates and of income distribution to show the social
needs o f adults and to demonstrate how societies can meet them.
Long before the financial crisis which gathered pace in the later part of zoo8, British politicians commenting on the decline of community or the rise of various forms o f anti-social behaviour, would sometimes refer to our ‘broken society’ . The financial collapse shifted attention to the broken economy, and while the broken
society was sometimes blamed on the behaviour of the poor, the
broken economy was widely attributed to the rich. Stimulated by the prospects o f ever bigger salaries and bonuses, those in charge o f some of the most trusted financial institutions threw caution to the wind and built houses o f cards which could stand only within
the protection of a thin speculative bubble. But the truth is that
both the broken society and the broken economy resulted from the growth of inequality.
W H E R E T H E E V I D E N C E L E A D S
We shall start by outlining the evidence which shows that we have got close to the end o f what economic growth can do for us. For thousands of years the best w ay of improving the quality of human life was to raise material living standards. When the w olf was never far from the door, good times were simply times of plenty. But for the vast majority of people in affluent countries the difficulties of life are no longer about filling our stomachs, having clean water and keeping warm. M ost o f us now wish we could eat less rather than more. And, for the first time in history, the poor are - on average - fatter than the rich. Economic growth, for so long the great engine
o f progress, has, in the rich countries, largely finished its w ork. N ot only have measures o f wellbeing and happiness ceased to rise with
economic growth but, as affluent societies have grown richer, there have been long-term rises in rates o f anxiety, depression and numerous other social problems. The populations o f rich countries have got to the end of a long historical journey.
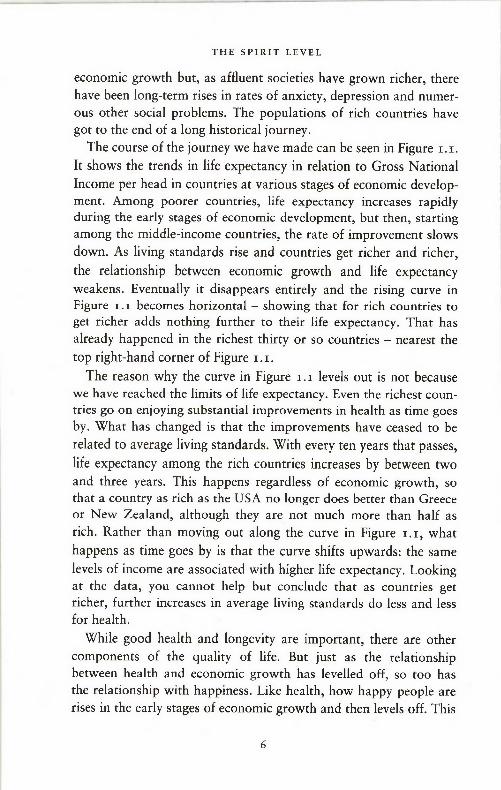
The course of the journey we have made can be seen in Figure i . i .
It shows the trends in life expectancy in relation to Gross National
Income per head in countries at various stages o f economic development. Am ong poorer countries, life expectancy increases rapidly during the early stages o f economic development, but then, starting among the middle-income countries, the rate o f improvement slows
down. As living standards rise and countries get richer and richer,
the relationship between economic growth and life expectancy weakens. Eventually it disappears entirely and the rising curve in Figure i . i becomes horizontal - showing that for rich countries to get richer adds nothing further to their life expectancy. That has already happened in the richest thirty or so countries - nearest the
top right-hand corner o f Figure i . i .
The reason why the curve in Figure i . i levels out is not because we have reached the limits o f life expectancy. Even the richest countries go on enjoying substantial improvements in health as time goes by. W hat has changed is that the improvements have ceased to be
related to average living standards. With every ten years that passes,
life expectancy among the rich countries increases by between two and three years. This happens regardless o f economic growth, so that a country as rich as the U SA no longer does better than Greece or N ew Zealand, although they are not much more than half as
rich. Rather than moving out along the curve in Figure i . i , what
happens as time goes by is that the curve shifts upwards: the same
levels o f income are associated with higher life expectancy. Looking at the data, you cannot help but conclude that as countries get richer, further increases in average living standards do less and less for health.
While good health and longevity are important, there are other components o f the quality of life. But just as the relationship between health and economic growth has levelled off, so too has the relationship with happiness. Like health, how happy people are rises in the early stages of economic growth and then levels off. This

Life
expe
ctan
cy
(yea
rs)
70-
60 -
50
40-
Australia IcelandSpain Sweden Canada Switzerland
Israel Italy France Austria„ Sineaoore . ■
Chile
Albania
Malta
Portugal
Barbados
Costa Rica Cuba
UruguayBelize Mexico Poland _OmanPanama v^roatia ,
M ontenegro ' J j 8 S £ l o ™ , ^ “ "s” vak,a
Serbia V«ne»ueU ch m aNicaragua Jamalca El Salvador Romania
r ,n r o i^ gyPt Philippines TurkeyGeorgia Morocco ™ jTnHnnpQia 1 * 1 reru
New Zealand Gi
Slovenia Czech Republic
Bahrain
___ ______ a l<" ’ rrance AustriaCyprus Greece Germany FinlancP1 Netherlands
UAE , IrelandKuwait Belgium ™ Denmark
Brunei
Qatar
----- o— morocco IraqIndonesia Honduras Thailand
Moldova Fiji Belarus GrenadaUzbekistan Micronesia
N. Korea A*erbaiian UkraineMongolia a£ “ tan Maldives Kazakhstan
a " Bolivia RussiaComoros Laos jncjja Guyana
Bangladesh Mauritania Senegal Nepal
Yemen TurkmenistanH aiti
M adagascar GhG am bia Togo Iraa c j Cambodia lracl Sudan .Eritrea Papua New GuineaKT- Gabon
Benin N « ' rGuinea
Congo DjiboutiMali
Hungary
Latvia Saudi ArabiaEstonia Bahamas
Trinidad & Tobago
Ethiopia £ en7.a _Tanzania Burk,n“ Fas°
ChadUganda Cameroon
BurundiCote d’Ivoire
Somalia Malawi Nigeria
Congo-DR Guinea-Bissau Liberia Rwanc a
CAR LesothoAfghanistan
Mozambique Sierra LeoneZimbabwe . . SwazilandAngola
_____ Zambia______________________
NamibiaSouth Africa
Equatorial Guinea
Botswana
I O O O O 2 0 0 0 0 3O O O O
National income per person ($)
4 0 0 0 0
Figure i . i Only in its early stages does economic development boost life expectancy.1
Norway
USA

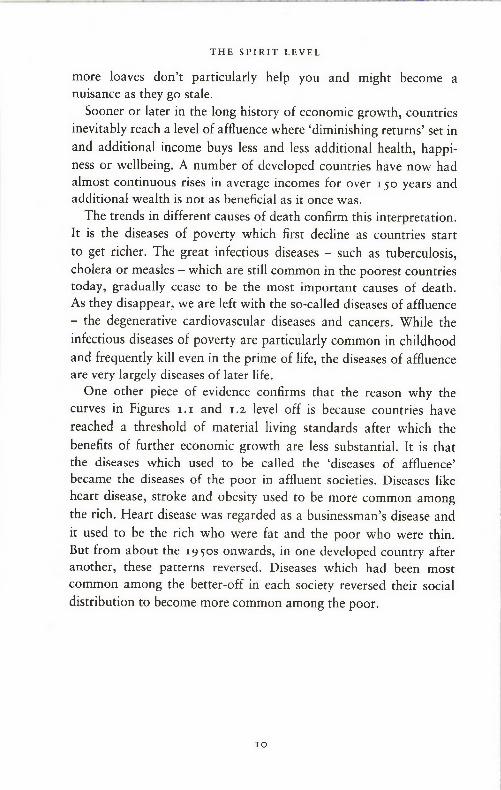
is a point made strongly by the economist, Richard Layard, in his
book on happiness.3 Figures on happiness in different countries are probably strongly affected by culture. In some societies not saying you are happy may sound like an admission o f failure, while in another claiming to be happy may sound self-satisfied and smug.
But, despite the difficulties, Figure 1 . 1 shows the ‘happiness curve’
levelling o ff in the richest countries in much the same w ay as life expectancy. In both cases the important gains are made in the earlier stages o f economic growth, but the richer a country gets, the less getting still richer adds to the population’s happiness. In these
graphs the curves for both happiness and life expectancy flatten off
at around $25 ,0 0 0 per capita, but there is some evidence that the
income level at which this occurs may rise over time.4The evidence that happiness levels fail to rise further as rich
countries get still richer does not come only from comparisons of different countries at a single point in time (as shown in Figure 1.2 ) .
In a few countries, such as Japan, the U SA and Britain, it is possible
to look at changes in happiness over sufficiently long periods of time to see whether they rise as a country gets richer. The evidence shows that happiness has not increased even over periods long enough for real incomes to have doubled. The same pattern has also been found
by researchers using other indicators o f wellbeing - such as the
‘measure o f economic welfare’ or the ‘genuine progress indicator’ ,
which try to calculate net benefits o f growth after removing costs like traffic congestion and pollution.
So whether we look at health, happiness or other measures of wellbeing there is a consistent picture. In poorer countries, economic development continues to be very important for human wellbeing.
Increases in their material living standards result in substantial improvements both in objective measures o f wellbeing like life expectancy, and in subjective ones like happiness. But as nations join the ranks o f the affluent developed countries, further rises in income count for less and less.
This is a predictable pattern. As you get more and more o f anything, each addition to what you have - whether loaves o f bread or cars - contributes less and less to your wellbeing. If you are hungry, a loaf o f bread is everything, but when your hunger is satisfied, many

Per
cent
‘ve
ry
happ
y’ or
‘qui
te
happ
y’
8 0 -
Nigeria
Philippines •Venezuela*
Algeria •Colombia Jordan* * • Brazil
Morocco Bosnia
• Uganda Azerbaijan _ . . . • China • Bangladesh
Pakistan*
Uruguay
South Africa
• Argentina
Croatia
• Poland
• Lithuaina
• Macedonia• Dominican Republic
Turkey •
• S. Korea
• Czech Republic
Slovenia*
Greece*
Netherlands Canada •Australia * ‘ . . Swi„ „ land
Sweden* Denmark • Belgium
Spain*
Germany*
Japan* Finland
60 -
Armenia * • Zimbabwe
• MoldovaRussian Federation •
Ukraine •
40---1--------------------------- 1---------------------------1-----------------------
2 0 0 0 0 3 0 0 0 0
National income per person ($)
IrelandNorway
United States
4 0 0 0 0
Figure i .z Happiness and average incomes (data for UK unavailable).5
more loaves don’t particularly help you and might become a nuisance as they go stale.
Sooner or later in the long history o f economic growth, countries
inevitably reach a level o f affluence where ‘diminishing returns’ set in
and additional income buys less and less additional health, happiness or wellbeing. A number o f developed countries have now had almost continuous rises in average incomes for over 15 0 years and additional wealth is not as beneficial as it once was.
The trends in different causes o f death confirm this interpretation. It is the diseases o f poverty which first decline as countries start
to get richer. The great infectious diseases - such as tuberculosis, cholera or measles - which are still common in the poorest countries today, gradually cease to be the most important causes o f death. As they disappear, we are left with the so-called diseases o f affluence- the degenerative cardiovascular diseases and cancers. While the
infectious diseases of poverty are particularly common in childhood
and frequently kill even in the prime o f life, the diseases o f affluence are very largely diseases o f later life.
One other piece o f evidence confirms that the reason why the curves in Figures 1 . 1 and 1 .2 level o ff is because countries have
reached a threshold o f material living standards after which the
benefits of further economic growth are less substantial. It is that the diseases which used to be called the ‘diseases of affluence’ became the diseases o f the poor in affluent societies. Diseases like heart disease, stroke and obesity used to be more common among
the rich. Heart disease was regarded as a businessman’s disease and
it used to be the rich who were fat and the poor who were thin. But from about the 19 50 s onwards, in one developed country after another, these patterns reversed. Diseases which had been most common among the better-off in each society reversed their social distribution to become more common among the poor.

T H E E N V I R O N M E N T A L L I M I T S T O G R O W T H
At the same time as the rich countries reach the end of the real benefits of economic growth, we have also had to recognize the problems o f global warm ing and the environmental limits to growth. The dramatic reductions in carbon emissions needed to prevent
runaw ay climate change and rises in sea levels may mean that even
present levels o f consumption are unsustainable - particularly if living standards in the poorer, developing, w orld are to rise as they need to. In Chapter 15 we shall discuss the w ays in which the perspective outlined in this book fits in with policies designed to reduce
global warming.
I N C O M E D I F F E R E N C E S W I T H I N A N D B E T W E E N S O C I E T I E S
We are the first generation to have to find new answers to the question of how we can make further improvements to the real quality o f human life. W hat should we turn to if not to economic growth? One o f the most powerful clues to the answer to this question comes from the fact that we are affected very differently by the income differences within our own society from the w ay we are affected by the differences in average income between one rich
society and another.In Chapters 4 - 1 2 we focus on a series o f health and social
problems like violence, mental illness, teenage births and educational failure, which within each country are all more common among the poor than the rich. As a result, it often looks as if the effect of higher incomes and living standards is to lift people out o f these problems. However, when we make comparisons between different societies, we find that these social problems have little or no relation to levels o f average incomes in a society.
Take health as an example. Instead o f looking at life expectancy across both rich and poor countries as in Figure 1 . 1 , look just at

the richest countries. Figure 1.3 shows just the rich countries and
confirms that among them some countries can be almost twice as
rich as others without any benefit to life expectancy. Yet within any o f them death rates are closely and systematically related to income. Figure 1 .4 shows the relation between death rates and income levels within the U SA . The death rates are for people in
zip code areas classified by the typical household income o f the area
in which they live. On the right are the richer zip code areas with lower death rates, and on the left are the poorer ones with higher death rates. Although we use American data to illustrate this, similar health gradients, of varying steepness, run across almost
every society. Higher incomes are related to lower death rates at
every level in society. Note that this is not simply a matter o f the poor having worse health than everyone else. W hat is so striking about Figure 1 .4 is how regular the health gradient is right across society - it is a gradient which affects us all.
Within each country, people’s health and happiness are related to
82
e0 51 8 0
78 ~
76
•Japan
• Sweden
• Israel , S Pain Australia* * Cana<la „France • • Switzerland
Italy. • Belgium
• Austria
• Norway
Greece • • New Zealand Germany % • Netherlands • Singapore
Ireland* • USA
• Denmark
• Portugal
25000 3OOOO 35000National income per person ($)
40000
Figure 1.3 Life expectancy is unrelated to differences in average income between rich countries.6

Poor Rich
Average income of US zip codes
Figure 1.4 Death rates are closely related to differences in income within societiesP
their incomes. Richer people tend, on average, to be healthier and happier than poorer people in the same society. But com paring rich countries it makes no difference whether on average people in one society are almost twice as rich as people in another.
W hat sense can we make of this paradox - that differences in
average income or living standards between whole populations or countries don’t matter at all, but income differences within those same populations matter very much indeed? There are two plausible explanations. One is that what matters in rich countries may not be your actual income level and living standard, but how you compare
with other people in the same society. Perhaps average standards don’t matter and what does is simply whether you are doing better or worse than other people - where you come in the social pecking order.
The other possibility is that the social gradient in health shown in
Figure 1.4 results not from the effects o f relative income or social status on health, but from the effects o f social mobility, sorting the healthy from the unhealthy. Perhaps the healthy tend to move up the social ladder and the unhealthy end up at the bottom.
This issue will be resolved in the next chapter. We shall see

whether compressing, or stretching out, the income differences in a
society matters. Do more and less equal societies suffer the same
overall burden of health and social problems?

Poverty or inequality?
Poverty is not a certain small amount of goods, nor is it just a relation between means and ends; above all it is a
relation between people. Poverty is a social status. . . It has grown . . . as an invidious distinction between classes . . .
Marshall Sahlins, Stone Age Economics
H O W M U C H I N E Q U A L I T Y ?
In the last chapter we saw that economic growth and increases in average incomes have ceased to contribute much to wellbeing in the rich countries. But we also saw that within societies health and social problems remain strongly associated with incomes. In this chapter
we will see whether the amount o f income inequality in a society
makes any difference.Figure 2 .1 shows how the size of income differences varies from
one developed country to another. At the top are the most equal countries and at the bottom are the most unequal. The length of the horizontal bars shows how much richer the richest 20 per cent of
the population is in each country compared to the poorest 20 per cent. Within countries such as Japan and some of the Scandinavian countries at the top o f the chart, the richest 20 per cent are less than four times as rich as the poorest 20 per cent. At the bottom of the chart are countries in which these differences are at least twice as big, including two in which the richest 20 per cent get about nine times as much as the poorest. Among the most unequal are Singapore, U SA , Portugal and the United Kingdom. (The figures are

Miss Smith, buy up the rights to the Bible and get that part changed about the rich man and the eye o f the needle

Japan ..................... ' "1
Finland 1
Norw aySweden ' | ™
Denmark 1
Belgium 1
Austria ......................................................................................................... 1
GermanyNetherlands
........................................................................................................................................................................." 1
Spain M
FranceCanada
SwitzerlandIrelandGreece .....................- 1
Italy . 1
Israel 1
N ew ZealandAustralia .................. ........... 1
UK - I 1 1 1 — l a a a i
Portugal ......................._ J
USA 1
Singapore " " .................... ......... ■ . ' " ■/ ' . |' • ' i : -------------------------------
o 2 4 6 8 10
Income gap
Figure z .i How much richer are the richest 20 per cent than the poorest zo per cent in each country?1
for household income, after taxes and benefits, adjusted for the number o f people in each household.)
There are lots o f w ays of measuring income inequality and they are all so closely related to each other that it doesn’t usually make much difference which you use. Instead of the top and bottom zo per cent, we could compare the top and bottom 10 or 30 per cent. Or we could have looked at the proportion o f all incomes which go to the poorer half o f the population. Typically, the poorest half o f the population get something like zo or 25 per cent of all incomes and the richest half get the remaining 75 or 80 per cent. Other more sophisticated measures include one called the Gini coefficient. It measures inequality across the whole society rather than simply comparing the
extremes. If all income went to one person (maximum inequality) and everyone else got nothing, the Gini coefficient would be equal

to i . If income was shared equally and everyone got exactly the same (perfect equality), the Gini would equal o. The lower its value, the more equal a society is. The most common values tend to be between 0.3 and 0.5. Another measure of inequality is called the Robin Hood Index because it tells you what proportion of a society’s income
would have to be taken from the rich and given to the poor to get complete equality.
To avoid being accused of picking and choosing our measures, our approach in this book has been to take measures provided by official agencies rather than calculating our own. We use the ratio of
the income received by the top to the bottom 20 per cent whenever
we are com paring inequality in different countries: it is easy to understand and it is one o f the measures provided ready-made by the United Nations. When com paring inequality in US states, we use the Gini coefficient: it is the most common measure, it is favoured by
economists and it is available from the US Census Bureau. In many
academic research papers we and others have used two different inequality measures in order to show that the choice of measures rarely has a significant effect on results.
D O E S T H E A M O U N T O F I N E Q U A L I T Y M A K E A D I F F E R E N C E ?
Having got to the end of what economic growth can do for the quality o f life and facing the problems o f environmental damage, what difference do the inequalities shown in Figure 2 .1 make?
It has been known for some years that poor health and violence are more common in more unequal societies. H ow ever, in the course o f our research we became aware that almost all problems which are more common at the bottom of the social ladder are more common in more unequal societies. It is not just ill-health and violence, but also, as we will show in later chapters, a host of other social problems. Alm ost all o f them contribute to the widespread concern that modern societies are, despite their affluence, social failures.
To see whether these problems were more common in more unequal countries, we collected internationally comparable data on

health and as many social problems as we could find reliable figures for. The list we ended up with included:
• level o f trust• mental illness (including drug and alcohol addiction)• life expectancy and infant mortality• obesity• children’s educational performance• teenage births• homicides• imprisonment rates• social mobility (not available for US states)
Occasionally what appear to be relationships between different things may arise spuriously or by chance. In order to be confident
that our findings were sound we also collected data for the same health and social problems - or as near as we could get to the same - for each o f the fifty states of the U SA . This allowed us to check whether or not problems were consistently related to inequality in these two independent settings. As Lyndon Johnson said, ‘America is not merely a nation, but a nation o f nations.’
To present the overall picture, we have combined all the health and social problem data for each country, and separately for each US state, to form an Index of Health and Social Problems for each
country and US state. Each item in the indexes carries the same
weight - so, for example, the score for mental health has as much influence on a society’s overall score as the homicide rate or the teenage birth rate. The result is an index showing how common all these health and social problems are in each country and each US state. Things such as life expectancy are reverse scored, so that on
every measure higher scores reflect worse outcomes. When looking at the Figures, the higher the score on the Index of Health and Social Problems, the worse things are. (For information on how we selected countries shown in the graphs we present in this book, please see the Appendix.)
We start by showing, in Figure 2.2, that there is a very strong tendency for ill-health and social problems to occur less frequently in

Income inequality
Figure 2.2 Health and social problems are closely related to inequality among rich countries.
the more equal countries. With increasing inequality (to the right on the horizontal axis), the higher is the score on our Index o f Health
and Social Problems. Health and social problems are indeed more common in countries with bigger income inequalities. The two are extraordinarily closely related - chance alone would almost never produce a scatter in which countries lined up like this.
To emphasize that the prevalence of poor health and social problems in whole societies really is related to inequality rather than
to average living standards, we show in Figure 2.3 the same index o f health and social problems but this time in relation to average incomes (National Income per person). It shows that there is no similarly clear trend towards better outcomes in richer countries. This confirms what we saw in Figures 1 . 1 and 1 .2 in the first chapter. H ow ever, as well as knowing that health and social problems are more common among the less w ell-off within each society (as shown in Figure 1.4 ), we now know that the overall burden o f these problems is much higher in more unequal societies.

Worse - • USA
C/5
6J JI S
0
• Portugal
a • UK
2G0C/5
-Ocas
JC
0)J= ,Uh
O
Greece •• New Zealand
• Spain
• Ireland Australia . .
France* • AustriaItaly* #Germany • Canada
* • Denmark Belgium
Finland* > Switzerland* Netherlands
Sweden*
Norway •
X<u
- aa Japan*
Better -
2 .0 0 0 0 25O O O 3 0 0 0 0 35O O O 4OOOO
National income per person ($)
Figure z.3 Health and social problems are only weakly related to national average income among rich countries.
To check whether these results are not just some odd fluke, let us see whether similar patterns also occur when we look at the fifty states o f the U SA . We were able to find data on almost exactly the same health and social problems for US states as we used in our international index. Figure 2.4 shows that the Index of Health and Social Problems is strongly related to the amount o f inequality in
each state, while Figure 2.5 shows that there is no clear relation between it and average income levels. The evidence from the U SA confirms the international picture. The position of the US in the international graph (Figure 2.2) shows that the high average income level in the US as a whole does nothing to reduce its health and social problems relative to other countries.
We should note that part of the reason why our index combining data for ten different health and social problems is so closely related to inequality is that combining them tends to emphasize what they have in common and downplays what they do not. In Chapters 4 - 1 2 we will examine whether each problem - taken on its own - is

Income inequality
Figure 2.4 Health and social problems are related to inequality in US states.
National income per person ($)
Figure 2.5 Health and social problems are only weakly related to average income in US states.

related to inequality and will discuss the various reasons why they might be caused by inequality.
This evidence cannot be dismissed as some statistical trick done with smoke and mirrors. W hat the close fit shown in Figure 2 .2 suggests is that a common element related to the prevalence o f all these health and social problems is indeed the amount of inequality in each country. All the data come from the most reputable sources - from the W orld Bank, the W orld Health Organization, the United N ations and the Organization for Economic Cooperation and Development (O E C D ), and others.
Could these relationships be the result o f some unrepresentative selection o f problems? To answer this we also used the ‘Index of child wellbeing in rich countries’ compiled by the United Nations Children’s Fund (U N IC E F ). It combines forty different indicators covering many different aspects of child wellbeing. (We removed the measure o f child relative poverty from it because it is, by definition, closely related to inequality.) Figure 2 .6 shows that child wellbeing is
Income inequality
Figure 2.6 The U N IC E F index o f child wellbeing in rich countries is related to inequality.

UN
ICEF
in
dex
of ch
ild
wel
lbei
ng
Better -
Worse -
20000 250 0 0 300 00 350 0 0 40000
National income per person ($)
F igu re 2 .7 The U N IC E F index o f child wellbeing is not related to Gross National Income per head in rich countries.
strongly related to inequality, and Figure 2.7 shows that it is not at
all related to average income in each country.
S O C I A L G R A D I E N T S
As we mentioned at the end of the last chapter, there are perhaps two widespread assumptions as to why people nearer the bottom of society suffer more problems. Either the circumstances people live in cause their problems, or people end up nearer the bottom of society because they are prone to problems which drag them down. The evidence we have seen in this chapter puts these issues in a new
light.Let’s first consider the view that society is a great sorting system
with people moving up or down the social ladder according to their personal characteristics and vulnerabilities. While things such as having poor health, doing badly at school or having a baby when
Sweden*
• Netherlands
Finland*
• Spain• Switzerland
Denmark*• Norway
• Greece• Portugal
Belgium Italy* • * Canada
•G erm an, . Ire|and Austria *
France • Australia •Japan
• Israel
• USA
• New Zealand
•U K

still a teenager all load the dice against your chances o f getting up the social ladder, sorting alone does nothing to explain w hy more unequal societies have more o f all these problems than less unequal ones. Social mobility may partly explain whether problems congregate at the bottom, but not why more unequal societies have more problems overall.
The view that social problems are caused directly by poor material conditions such as bad housing, poor diets, lack of educational opportunities and so on implies that richer developed societies would do better than the others. But this is a long w ay from the truth: some o f the richest countries do worst.
It is remarkable that these measures o f health and social problems in the two different settings, and of child wellbeing among rich countries, all tell so much the same story. The problems in rich countries are not caused by the society not being rich enough (or even by being
too rich) but by the scale of material differences between people within each society being too big. W hat matters is where we stand in relation to others in our own society.
O f course a small proportion of the least w ell-off people even in the richest countries sometimes find themselves without enough money for food. However, surveys of the 12 .6 per cent o f Americans
living below the federal poverty line (an absolute income level rather than a relative standard such as half the average income) show that 80 per cent o f them have air-conditioning, almost 75 per cent own at least one car or truck and around 33 per cent have a computer, a dishwasher or a second car. W hat this means is that when people
lack money for essentials such as food, it is usually a reflection of the strength o f their desire to live up to the prevailing standards. You may, for instance, feel it more important to maintain appearances by spending on clothes while stinting on food. We knew of a young
man w ho was unemployed and had spent a month’s income on a new mobile phone because he said girls ignored people who hadn’t got the right stuff. As Adam Smith emphasized, it is important to be able to present oneself creditably in society without the shame and stigma of apparent poverty.
However, just as the gradient in health ran right across society from top to bottom, the pressures o f inequality and of wanting to

keep up are not confined to a small minority who are poor. Instead,
the effects are - as we shall see - widespread in the population.
D I F F E R E N T P R O B L E M S - C O M M O N R O O T S
The health and social problems which we have found to be related to inequality tend to be treated by policy makers as if they were quite separate from one another, each needing separate services and remedies. We pay doctors and nurses to treat ill-health, police and prisons to deal with crime, remedial teachers and educational psychologists to tackle educational problems, and social workers, drug rehabilitation units, psychiatric services and health promotion experts to deal with a host o f other problems. These services are all expensive, and none of them is more than partially effective. For instance, differences in the quality o f medical care have less effect on people’s life expectancy than social differences in their risks o f getting some life-threatening disease in the first place. And even
when the various services are successful in stopping someone reoffending, in curing a cancer, getting someone o ff drugs or dealing with educational failure, we know that our societies are endlessly recreating these problems in each new generation. M eanwhile, all these problems are most common in the most deprived areas o f our
society and are many times more common in more unequal societies.
W H A T D O E S I N C O M E I N E Q U A L I T Y T E L L U S ?
Before proceeding, in the following chapters, to look at how the scale o f income differences may be related to other problems, we should say a few words about what we think income differences tell us about a society. Human beings have lived in every kind
of society, from the most egalitarian prehistoric hunting and gather
ing societies, to the most plutocratic dictatorships. Although modern market democracies fall into neither of those extremes, it is

reasonable to assume that there are differences in how hierarchical
they are. We believe that this is what income inequality is measuring. Where income differences are bigger, social distances are bigger and social stratification more important.
It would be nice to have lots o f different indicators o f the scale of hierarchy in different countries - to be able to compare inequalities not only in income, but also in wealth, education and power. It w ould also be interesting to see how they are related to social distances, to indicators o f status like people’s choice of clothes, music and films, or to the importance o f hierarchy and position. While
additional measures which can be compared between countries might become available in the future, at the moment we must rely simply on income inequality. But what is perhaps surprising is how much this measure tells us even on its own.
There are two important reasons for interpreting income in
equality in this w ay. The first pointer is that only the health and social problems which have strong social class gradients - becoming more common further down the social hierarchy - are more common in more unequal societies. This seems to be a general phenomenon: the steeper the social gradient a problem has within society, the more Strongly it will be related to inequality.8 This not only applies to each problem - to teenage birth rates or to children doing badly at school, for example - it looks as if it also applies to sex differences in the same problem. The reason why wom en’s obesity rates turn out- as we shall see - to be more closely related to inequality than men’s, seems to be that the social gradient in obesity is steeper among women than men. Health problems such as breast cancer, which are not usually more common among the less well off, are unrelated to inequality.9
The other pointer which suggests that income inequality reflects
how hierarchical societies are, became clear when we reviewed nearly 17 0 academic papers reporting different pieces o f research on the relationship between income inequality and health.10 The size of the areas over which researchers had measured inequality varied substantially. Some had calculated how much inequality there was in
local neighbourhoods and looked to see if it was related to average death rates in those neighbourhoods. Others had used whole towns

and cities as the units in which inequality and health were measured. Still others had looked at regions and states, or done international studies com paring whole countries. When we reviewed all this research, a clear pattern emerged. While there was overwhelming evidence that inequality was related to health when both were
measured in large areas (regions, states or whole countries), the
findings were much more mixed when inequality was measured in small local areas.
This makes perfect sense if we think about why health tends to be worse in more deprived local areas. W hat marks out the neighbour
hoods with poor health - where life expectancy may be as much as ten years shorter than in the healthiest neighbourhoods - is not of course the inequality within them. It is instead that they are unequal- or deprived - in relation to the rest o f society. W hat matters is the
extent o f inequality right across society.We concluded that, rather than telling us about some previously
unknown influence on health (or social problems), the scale of income differences in a society was telling us about the social hierarchy across which gradients in so many social outcomes occur. Because gradients in health and social problems reflect social status differences in culture and behaviour, it looks as if material inequality is probably central to those differences.
We should perhaps regard the scale of material inequalities in a society as providing the skeleton, or fram ework, round which class
and cultural differences are formed. Over time, crude differences in wealth gradually become overlaid by differences in clothing, aesthetic taste, education, sense o f self and all the other markers of class identity. Think, for instance, o f how the com paratively recent emergence o f huge income differences in Russia w ill come to affect its class structure. When the children of the new Russian oligarchs have grown up in grand houses, attended private schools and travelled the world, they will have developed all the cultural trappings of an upper class. A British Conservative politician was fam ously described by another as someone who ‘had to buy his own furniture’ . Although there has alw ays been prejudice against the nouveau riche, wealth does not remain new for ever: once the furniture is inherited it becomes old money. Even as far back as the eighteenth century, when

people thought that birth and breeding were what defined the upper
echelons o f society, if you lost your fortune you might maintain
status briefly as ‘genteel poor’ , but after a generation or so there would be little to distinguish you from the rest o f the poor. M oreover, as Jane Austen shows in both M ansfield Park and Sense and Sensibility, the consequences - whatever your birth - o f m arry
ing for love rather than money could be serious. Whether material
wealth is made or lost, you cannot long remain ‘a person of substance’ without it. And it is surely because material differences provide the fram ework round which social distinctions develop that people have often regarded inequality as socially divisive.
Q U A L I T Y O F L I F E F O R A L L A N D N A T I O N A L S T A N D A R D S
O F P E R F O R M A N C E
Having come to the end of what higher material living standards can offer us, we are the first generation to have to find other ways of improving the real quality o f life. The evidence shows that reducing inequality is the best w ay of improving the quality of the social environment, and so the real quality o f life, for all of us. As we shall see in Chapter 13 , this includes the better-off.
It is clear that greater equality, as well as improving the wellbeing o f the whole population, is also the key to national standards of achievement and how countries perform in lots o f different fields. When health inequalities first came to prominence on the public health agenda in the early 1980s, people would sometimes ask why there was so much fuss about inequalities. They argued that the task o f people working in public health was to raise overall standards of health as fast as possible. In relation to that, it was suggested that health inequalities were a side issue o f little relevance. We can now see that the situation may be almost the opposite o f that. National
standards o f health, and of other important outcomes which we shall discuss in later chapters, are substantially determined by the amount o f inequality in a society. If you want to know w hy one country does better or worse than another, the first thing to look

at is the extent o f inequality. There is not one policy for reducing inequality in health or the educational performance o f school children, and another for raising national standards o f performance. Reducing inequality is the best w ay of doing both. And if, for
instance, a country wants higher average levels o f educational achievement among its school children, it must address the underlying inequality which creates a steeper social gradient in educational achievement.
D E V E L O P I N G C O U N T R I E S
Before leaving this topic, we should emphasize that although inequality also matters in developing countries, it may do so for a different m ix o f reasons. In the rich countries, it is now the symbolic
importance o f wealth and possessions that matters. W hat purchases
say about status and identity is often more important than the goods themselves. Put crudely, second-rate goods are assumed to reflect second-rate people.
Possessions are markers o f status everywhere, but in poorer societies, where necessities are a much larger part o f consumption,
the reasons why more equal societies do better may have less to do with status issues and more to do with fewer people being denied access to food, clean water and shelter. It is only among the very richest countries that health and wellbeing are no longer related to
Gross National Income per person. In poorer countries it is still
essential to raise living standards and it is most important among the poorest. In those societies a more equal distribution o f resources will mean fewer people will be living in shanty towns, with dirty water and food insecurity, or trying to scrape a living from inadequate
land-holdings.
In the next chapter we will look in a little more detail at why people in the developed world are so sensitive to inequality that it can exert such a major effect on the psychological and social wellbeing o f modern populations.
How inequality gets under the skin
’Tis very certain that each man carries in his eye the exact indication of his rank in the immense scale of men, and we are always learning to read it.
Ralph Waldo Emerson, The Conduct o f Life
H ow is it that we are affected as strongly by inequality and our position within society as the data in the last chapter suggest? Before exploring - as we shall in the next nine chapters - the relations between inequality and a wide range o f social problems, including
those in our Index o f Health and Social Problems, we want to
suggest why human beings might be so sensitive to inequality.As inequality is an aspect o f the broad structure of societies, ex
planations of its effects involve showing how individuals are affected by the social structure. It is individuals - not the societies themselves
- who have poor health, are violent or become teenage mothers. Although individuals do not have an income distribution, they do have a relative income, social status or class position in the wider society. So in this chapter we will show the ways in which our individual sensitivity to the wider society explains why living in more unequal societies might have such profound effects.
To understand our vulnerability to inequality means discussing some o f our common psychological characteristics. Too often when we speak or write about these issues, people misinterpret our purpose. We are not suggesting that the problem is a matter of individual psychology, or that it is really people’s sensitivity, rather than the scale of inequality, that should be changed. The solution to


problems caused by inequality is not mass psychotherapy aimed at
making everyone less vulnerable. The best w ay of responding to the
harm done by high levels of inequality would be to reduce inequality
itself. Rather than requiring anti-anxiety drugs in the water supply or mass psychotherapy, what is most exciting about the picture we present is that it shows that reducing inequality would increase the wellbeing and quality o f life for all of us. Far from being inevitable
and unstoppable, the sense o f deterioration in social wellbeing and
the quality o f social relations in society is reversible. Understanding the effects o f inequality means that we suddenly have a policy handle on the wellbeing o f whole societies.
The powerful mechanisms which make people sensitive to inequality cannot be understood in terms either o f social structure or
o f individual psychology alone. Individual psychology and societal inequality relate to each other like lock and key. One reason why the effects of inequality have not been properly understood before is because o f a failure to understand the relationship between them.
T H E R I S E I N A N X I E T Y
Given the unprecedented material com fort and physical convenience o f modern societies, it might seem sensible to be sceptical of the way everyone talks of stress, as if life was barely survivable. However,
Jean Twenge, a psychologist at San Diego State University, has put together impressive evidence that we really are much more anxious than we used to be. By reviewing the large number o f studies of anxiety levels in the population carried out at different dates, she has documented very clear trends. She found 269 broadly comparable studies measuring anxiety levels in the U SA at various times between 19 5 2 and 19 9 3 .11 Together the surveys covered over 52,000 individuals. W hat they showed was a continuous upward trend throughout this forty-year period. Her results for men and women are shown in Figure 3 . 1 . Each dot in the graph shows the average level o f anxiety found in a study recorded against the date it was undertaken. The rising trend across so many studies is unmistakable. Whether she looked at college students or at children, Twenge found the same

C3Q<S)
oat-OJc<
3 1
QS £ . I
o& o
- 3
Women
1 9 5 0 1 9 5 5 i 9 6 0 1 9 6 5 1 9 7 0 1 9 7 5 1 9 8 0 1 9 8 5 1 9 9 0 1 9 9 5
Figure 3 .1 Rise in anxiety levels among US college students 19 5 2 -9 3 . Data from 269 samples covering 52,000 individuals.15 (Reproduced with kind permission from jean M. Twenge.)
pattern: the average college student at the end o f the period was more anxious than 85 per cent of the population at the beginning o f it and, even more staggering, by the late 19 8 0 s the average American child was more anxious than child psychiatric patients in the 19 50 s.
This evidence comes from the administration o f standardized

anxiety measures to samples o f the population. It cannot be ex
plained away by saying that people have become more aware of anxiety. The worsening trend also fits what we know has been happening in related conditions such as depression. Depression and anxiety are closely connected: people who suffer from one often suffer from the other, and psychiatrists sometimes treat the two con
ditions in similar w ays. There are now large numbers of studies
showing substantial increases in rates o f depression in developed countries. Some studies have looked at change over the last half century or so by comparing the experience o f one generation with another, while taking care to avoid pitfalls such as an increased
awareness leading to more frequent reporting of depression.12
Others have compared rates in studies which have followed up representative samples of the population born in different years. In Britain, for example, depression measured among people in their mid-zos was found to be twice as common in a study o f 10 ,0 0 0 or
so people born in 19 7 0 as it had been in a similar study carried out
earlier o f people in their mid-zos bom in 19 5 8 .13Reviews o f research conclude that people in many developed
countries have experienced substantial rises in anxiety and depression. Among adolescents, these have been accompanied by increases in the frequency o f behavioural problems, including crime, alcohol
and drugs.u >14 They ‘affected males and females, in all social classes
and all fam ily types’ .13It is important to understand what these rises in anxiety are
about before their relevance to inequality becomes clear. We are not suggesting that they were triggered by increased inequality. That
possibility can be discounted because the rises in anxiety and depres
sion seem to start well before the increases in inequality which in many countries took place during the last quarter of the twentieth century. (It is possible, however, that the trends between the 19 70 s and 1990 s may have been aggravated by increased inequality.)

S E L F - E S T E E M A N D S O C I A L I N S E C U R I T Y
An important clue to w hat lies behind the mental health trends comes from evidence that they were accompanied by a surprising rise in what at first was thought to be self-esteem. When compared over time, in much the same w ay as the trends in anxiety are shown in Figure 3 . 1 , standard measures o f self-esteem also showed a very clear long-term upward trend. It looked as if, despite the rising
anxiety levels, people were also taking a more positive view of themselves over time. They were, for instance, more likely to say they felt proud o f themselves; they were more likely to agree with statements such as ‘I am a person o f worth ’ ; and they seemed to have put aside
self-doubts and feelings that they were ‘useless’ or ‘no good at all’ .
Twenge says that in the 19 50 s only 1 2 per cent o f teenagers agreed
with the statement ‘I am an important person’ , but by the late 1980s this proportion had risen to 80 per cent.
So what could have been going on? People becoming much more self-confident doesn’t seem to fit with them also becoming much
more anxious and depressed. The answer turns out to be a picture of increasing anxieties about how we are seen and what others think o f us which has, in turn, produced a kind o f defensive attempt to shore up our confidence in the face o f those insecurities. The defence involves a kind o f self-promoting, insecure egotism which is easily
mistaken for high self-esteem. This might seem like a difficult set of
issues to pin down, particularly as we are talking about general trends in whole populations. But let us look briefly at the evidence which has accumulated since the self-esteem movement of the 1980s, which shows what has been happening.
Over the years, many research groups looking at individual
differences in self-esteem at a point in time (rather than at trends in population averages over time) began to notice two categories o f people who came out with high scores. In one category, high self-esteem went with positive outcomes and was associated with happiness, confidence, being able to accept criticism, an ability to
make friends, and so on. But as well as positive outcomes, studies

repeatedly found that there was another group who scored well on self-esteem measures. They were people who showed tendencies to
violence, to racism, who were insensitive to others and were bad at
personal relationships.The task was then to develop psychological tests which could dis
tinguish between people with a healthy and those with an unhealthy kind o f self-esteem. The healthier kind seemed to centre on a fairly well-founded sense o f confidence, with a reasonably accurate view
o f one’s strengths in different situations and an ability to recognize
one’s weaknesses. The other seemed to be prim arily defensive and involved a denial o f weaknesses, a kind o f internal attempt to talk oneself up and maintain a positive sense o f oneself in the face of threats to self-esteem. It was (and is) therefore fragile, like whistling in the dark, and reacts badly to criticism. People with insecure high
self-esteem tend to be insensitive to others and to show an excessive preoccupation with themselves, with success, and with their image and appearance in the eyes o f others. This unhealthy high self-esteem is often called ‘threatened egotism’, ‘ insecure high self-esteem’, or ‘narcissism’ . During the com paratively short time over which data are available to compare trends in narcissism without getting it mixed up with real self-esteem, Twenge has shown a rising trend. She found that by zoo 6, two-thirds o f American college students scored above what had been the average narcissism score in 19 8 2 . The recognition that what we have seen is the rise o f an insecure narcissism - particularly among young people - rather than a rise in genuine self-esteem now seems widely accepted.
T H R E A T S T O T H E S O C I A L S E L F
So the picture o f self-esteem rising along with anxiety levels isn’t true. It is now fairly clear that the rises in anxiety have been accompanied by rising narcissism and that the two have common roots. Both are caused by an increase in what has been called ‘social evaluative threat’ . There are now good pointers to the main sources o f stress in modern societies. As living with high levels o f stress is now recognized as harmful to health, researchers have spent a lot of

time trying to understand both how the body responds to stress and
what the most important sources of stress are in society at large. M uch o f the research has been focused on a central stress hormone called cortisol which can be easily measured in saliva or blood. Its release is triggered by the brain and it serves to prepare us physiologically for dealing with potential threats and emergencies. There
have now been numerous experiments in which volunteers have been invited to come into a laboratory to have their salivary cortisol levels measured while being exposed to some situation or task designed to be stressful. Different experiments have used different
stressors: some have tried asking volunteers to do a series o f arith
metic problems - sometimes publicly comparing results with those of
others - some have exposed them to loud noises or asked them to write about an unpleasant experience, or filmed them while doing a task. Because so many different kinds o f stressor have been used in these experiments, Sally Dickerson and M argaret Kemeny, both
psychologists at the University o f California, Los Angeles, realized
that they could use the results o f all these experiments to see what kinds o f stressors most reliably caused people’s cortisol levels to rise.16
They collected findings from 208 published reports of experiments
in which people’s cortisol levels were measured while they were
exposed to an experimental stressor. They classified all the different kinds o f stressor used in experiments and found that: ‘tasks that included a social-evaluative threat (such as threats to self-esteem or social status), in which others could negatively judge performance, particularly when the outcome o f the performance was uncontrol
lable, provoked larger and more reliable cortisol changes than
stressors without these particular threats’ (p. 377). Indeed, they suggested that ‘Human beings are driven to preserve the social self and are vigilant to threats that may jeopardize their social esteem or status’ (p. 357). Social evaluative threats were those which created the possibility for loss of esteem. They typically involved the
presence o f an evaluative audience in the experiment, a potential for
negative social comparison such as scoring worse than someone else, or having your performance videoed or recorded, so creating the potential for later evaluation. The highest cortisol responses came
when a social evaluative threat was combined with a task in which
participants could not avoid failure - for instance because the task was designed to be impossible, or because there was too little time, or they were simply told they were failing however they performed.
The finding that social evaluative threats are the stressors which get to us most powerfully fits well with the evidence of rising anxiety accompanied by a narcissistic defence o f an insecure self-image. As
Dickerson and Kemeny say, the ‘social self’ which we try to defend ‘reflects one’s esteem and status, and is largely based on others’ perception of one’s worth ’ (p. 357).
A quite separate strand o f health research corroborates and fills
out this picture. One of the most important recent developments in
our understanding of the factors exerting a major influence on health in rich countries has been the recognition of the importance of psychological stress. We will outline in Chapter 6 how frequent and/or prolonged stress affects the body, influencing many physio
logical systems, including the immune and cardiovascular systems.
But what matters to us in this chapter is that the most powerful sources of stress affecting health seem to fall into three intensely social categories: low social status, lack o f friends, and stress in early life. All have been shown, in many well-controlled studies, to be seriously detrimental to health and longevity.
M uch the most plausible interpretation of why these keep
cropping up as markers for stress in modern societies is that they all affect - or reflect - the extent to which we do or do not feel at ease and confident with each other. Insecurities which can come from a stressful early life have some similarities with the insecurities which can come from low social status, and each can exacerbate the effects
of the other. Friendship has a protective effect because we feel more secure and at ease with friends. Friends make you feel appreciated, they find you good company, enjoy your conversation - they like you. If, in contrast, we lack friends and feel avoided by others, then
few o f us are thick-skinned enough not to fall prey to self-doubts, to worries that people find us unattractive and boring, that they think we are stupid or socially inept.

P R I D E , S H A M E A N D S T A T U S
The psychoanalyst Alfred Adler said ‘To be human means to feel inferior.’ Perhaps he should have said ‘To be human means being highly sensitive about being regarded as inferior.’ Our sensitivity to such feelings makes it easy to understand the contrasting effects of high and low social status on confidence. H ow people see you matters. While it is o f course possible to be upper-class and still feel totally inadequate, or to be lower-class and full o f confidence, in general the further up the social ladder you are, the more help the world seems to give you in keeping the self-doubts at bay. If the social hierarchy is seen - as it often is - as if it were a ranking o f the human race by ability, then the outward signs o f success or failure (the better jobs, higher incomes, education, housing, car and clothes) all make a difference.
It’s hard to disregard social status because it comes so close to defining our worth and how much we are valued. To do well for yourself or to be successful is almost synonymous with moving up the social ladder. Higher status almost alw ays carries connotations
of being better, superior, more successful and more able. If you
don’t want to feel small, incapable, looked down on or inferior, it is not quite essential to avoid low social status, but the further up the social ladder you are, the easier it becomes to feel a sense o f pride, dignity and self-confidence. Social comparisons increasingly show
you in a positive light - whether they are comparisons of wealth,
education, job status, where you live, holidays, or any other markers o f success.
N ot only do advertisers play on our sensitivity to social com parisons, knowing we will tend to buy things which enhance how we
are seen, but, as we shall see in Chapter 10 , one o f the most common
causes o f violence, and one which plays a large part in explaining w hy violence is more common in more unequal societies, is that it is often triggered by loss o f face and humiliation when people feel looked down on and disrespected. By playing on our fears of being seen as o f less worth, advertisers may even contribute to the level of
violence in a society.

It was Thomas Scheff, emeritus professor of sociology at the University of California, Santa Barbara, who said that shame was
the social em otion.17 He meant almost exactly what Dickerson and Kemeny were referring to when they found that the most likely kinds o f stressors to raise levels of stress hormones were ‘ social evaluative threats’ . By ‘shame’ he meant the range of emotions to do with feeling foolish, stupid, ridiculous, inadequate, defective, incompetent, aw kw ard, exposed, vulnerable and insecure. Shame and its opposite,
pride, are rooted in the processes through which we internalize how we imagine others see us. Scheff called shame the social emotion because pride and shame provide the social evaluative feedback as we experience ourselves as if through others’ eyes. Pride is the
pleasure and shame the pain through which we are socialized, so that
we learn, from early childhood onwards, to behave in socially acceptable ways. N or of course does it stop in childhood: our sensitivity to shame continues to provide the basis for conform ity throughout adult life. People often find even the smallest infringement of social
norms in the presence of others causes so much embarrassment that
they are left wishing they could just disappear, or that the ground would sw allow them up.
Although the Dickerson and Kemeny study found that it was exposure to social evaluative threats which most reliably raised levels o f stress hormones, that does not tell us how frequently people
suffer from such anxieties. Are they a very common part o f everyday life, or only occasional? An answer to that question comes from the health research showing that low social status, lack o f friends, and a difficult early childhood are the most important markers of psychosocial stress in modern societies. If our interpretation o f these three factors is right, it suggests that these kinds of social anxiety
and insecurity are the most common sources of stress in modern societies. Helen Lewis, a psychoanalyst who drew people’s attention to shame emotions, thought she saw very frequent behavioural indications of shame or embarrassment - perhaps not much more than we would call a momentary feeling of awkwardness or selfconsciousness - when her patients gave an embarrassed laugh or hesitated at particular points while speaking in a w ay suggesting slight nervousness.18

F R O M C O M M U N I T Y T O M A S S S O C I E T Y
W hy have these social anxieties increased so dramatically over the last half century - as Tw enge’s studies showing rising levels of anxiety and fragile, narcissistic egos suggest they have? W hy does the social evaluative threat seem so great? A plausible explanation is the break-up o f the settled communities of the past. People used to grow up knowing, and being known by, many of the same people
all their lives. Although geographical mobility had been increasing
for several generations, the last half century has seen a particularly rapid rise. At the beginning of this period it was still common for people - in rural and urban areas alike - never to have travelled much beyond the boundaries o f their immediate city or village
community. M arried brothers and sisters, parents and grandparents,
tended to remain living nearby and the community consisted of people who had often known each other for much of their lives. But now that so many people move from where they grew up, know ledge of neighbours tends to be superficial or non-existent. People’s
sense o f identity used to be embedded in the community to which
they belonged, in people’s real knowledge of each other, but now it
is cast adrift in the anonymity o f mass society. Fam iliar faces have been replaced by a constant flux o f strangers. As a result, who we are, identity itself, is endlessly open to question.
The problem is shown even in the difficulty we have in distinguish
ing between the concept of the ‘esteem’ in which we may or may
not be held by others, and our own self-esteem. The evidence of our sensitivity to ‘social evaluative threat’ , coupled with Tw enge’s evidence o f long-term rises in anxiety and narcissism, suggests that we may - by the standards of any previous society - have become highly self-conscious, obsessed with how we appear to others,
worried that we might come across as unattractive, boring, stupid or whatever, and constantly trying to manage the impressions we make. And at the core o f our interactions with strangers is our concern at the social judgements and evaluations they might make: how do they rate us, did we give a good account of ourselves? This vulnerability

is part of the modern psychological condition and feeds directly into consumerism.
It is well known that these problems are particularly difficult for adolescents. While their sense o f themselves is most uncertain, they have to cope in schools o f a thousand or more o f their peers. It is hardly surprising that peer pressure becomes such a powerful force in their lives, that so many are dissatisfied with what they look like, or succumb to depression and self-harm.
I N E Q U A L I T Y I N C R E A S E S E V A L U A T I O N A N X I E T I E S
Although the rises in anxiety that seem to centre on social evaluation
pre-date the rise in inequality, it is not difficult to see how rising inequality and social status differences may impact on them. Rather than being entirely separate spheres, how much status and wealth people achieve - from unskilled low-paid w ork to success, money and pre-eminence - affects not only their sense o f themselves, but also how positively they are seen even by friends and family. Our need to feel valued and capable human beings means we crave positive feedback and often react with anger even to implied criticism. Social status carries the strongest messages o f superiority and inferiority, and social mobility is widely seen as a process by which people are sorted by ability. Indeed, in job applications and promotions, where discrimination by age, sex, race or religion is prohibited, it is the task o f the interview panel to discriminate between individuals exclusively by ability - just as long as they don’t make inferences from gender or skin colour, etc.
Greater inequality seems to heighten people’s social evaluation anxieties by increasing the importance o f social status. Instead of accepting each other as equals on the basis of our common humanity as we might in more equal settings, getting the measure o f each other becomes more important as status differences widen. We come to see social position as a more important feature of a person’s identity. Between strangers it may often be the dominant feature. As Ralph
W aldo Emerson, the nineteenth-century American philosopher, said,
‘ T is very certain that each man carries in his eye the exact indication o f his rank in the immense scale o f men, and we are alw ays learning to read it.’ 19 Indeed, psychological experiments suggest that we make judgements o f each other’s social status within the first few seconds of meeting.20 N o wonder first impressions count, and no
wonder we feel social evaluation anxieties!If inequalities are bigger, so that some people seem to count for
almost everything and others for practically nothing, where each one o f us is placed becomes more important. Greater inequality is likely to be accompanied by increased status competition and
increased status anxiety. It is not simply that where the stakes are
higher each o f us worries more about where he or she comes. It is also that we are likely to pay more attention to social status in how we assess each other. Surveys have found that when choosing prospective marriage partners, people in more unequal countries put
less emphasis on romantic considerations and more on criteria such
as financial prospects, status and ambition, than do people in less unequal societies.21
S E L F - P R O M O T I O N R E P L A C E S S E L F - D E P R E C A T I O N A N D M O D E S T Y
Com paring Japan with the U SA , that is, the most equal with almost the most unequal of the rich market democracies (see Figure 2 .1) , research has revealed a stark contrast between the w ay people see and present themselves to others in the two countries. In Japan,
people choose a much more self-deprecating and self-critical w ay
o f presenting themselves, which contrasts sharply with the much more self-enhancing style in the U SA . While Americans are more likely to attribute individual successes to their own abilities and their failures to external factors, the Japanese tend to do just the opposite.22 M ore than twenty studies in Japan have failed to find any evidence o f the more self-serving pattern of attributions common in the U SA . In Japan people tended to pass their successes o ff as if they were more a reflection of luck than o f judgement, while suggesting their failures are probably attributable to their own lack of

ability. This Japanese pattern was also found in Taiw an and China.Rather than getting too caught up in psychological terminology,
we would do well to see these patterns as differences in how far people value personal modesty, preferring to maintain social bonds by not using their successes to build themselves up as more able than others. As greater inequality increases status competition and social evaluative threat, egos have to be propped up by self-promoting
and self-enhancing strategies. M odesty easily becomes a casualty of inequality: we become outwardly tougher and harder in the face o f greater exposure to social evaluation anxieties, but inwardly - as the literature on narcissism suggests - probably more vulnerable, less able to take criticism, less good at personal relationships and less able to recognize our own faults.
L I B E R T Y , E Q U A L I T Y A N D F R A T E R N I T Y
The demand for ‘liberty, equality and fraternity’ during the French Revolution shows just how long the issues we have been discussing here have been recognized. The slogan focused attention on the dimensions o f social relations which matter most if we are to create a better society and make a difference to the real quality o f our lives. ‘Liberty’ meant not being subservient or beholden to the feudal nobility and landed aristocracy. It was liberty from the feudal shackles o f inferiority. Similarly, ‘ fraternity’ reflects a desire for greater mutuality and reciprocity in social relations. We raise the same issues when we talk about community, social cohesion or solidarity. Their importance to human wellbeing is demonstrated
repeatedly in research which shows how beneficial friendship and
involvement in community life is to health. ‘Equality’ comes into the picture as a precondition for getting the other two right. N ot only do large inequalities produce all the problems associated with social differences and the divisive class prejudices which go with them, but, as later chapters show, it also weakens community life, reduces trust, and increases violence.


P A R T T W O
The Costs of Inequality


Community life and social relations
Among the new objects that attracted my attention during my stay in the United States, none struck me with greater force than the equality of conditions. I easily perceived the enormous influence that this primary fact exercises on the workings of the society.
Alexis de Tocqueville, Democracy in America
In August 2005 Hurricane Katrina hit the G u lf Coast o f the southern United States, devastating cities in M ississippi and Louisiana, overwhelming flood protection systems, and leaving 80 per cent o f the city o f N ew Orleans under water. A mandatory evacuation order was issued for the city the day before the storm hit, but by that time most public transport had shut down and fuel and rental cars were unavailable. The city government set up ‘refuges o f last resort’
for people who couldn’t get out of N ew Orleans, including the Superdome, a vast sports arena, which ended up sheltering around26,000 people, despite sections o f its roof being ripped o ff by the storm. At least 1 ,8 3 6 people were killed by the hurricane, and another 700 people were missing and unaccounted for.
W hat captured the attention o f the w orld ’s media in the aftermath of the storm as much as the physical devastation - the flattened houses, flooded streets, collapsed highways and battered oil rigs - was what seemed like the complete breakdown of civilization in the city. There were numerous arrests and shoot-outs throughout the week following the hurricane. Television news screens showed desperate residents begging for help, for baby food, for medicine,

and then switched to images o f troops, cruising the flooded streets in
boats - not evacuating people, not bringing them supplies, but, fully armed with automatic weapons, looking for looters.
This response to the chaos in N ew Orleans led to widespread criticism and condemnation within the U S. M any alleged that the lack o f trust between law enforcement and military forces on the
one hand and the mostly poor, black citizens o f N ew Orleans on the other, reflected deeper issues of race and class. During a widely televised benefit concert for victims o f the hurricane, musician Kanye West, burst out: ‘I hate the w ay they portray us in the media. You see a white fam ily, it says, “ They’re looking for food .” Y ou see
a black fam ily, it says, “ They’re looting.’” As troops were mobilized
to go into the city, Louisiana Governor Kathleen Blanco said: ‘They have M i6 s and are locked and loaded. These troops know how to shoot and kill and I expect they w ill.’
The lack of trust on display during the rescue efforts in N ew
Orleans was also roundly condemned internationally. Countries around the world offered aid and assistance, while their news coverage was filled with criticism. We can contrast the w ay in which troops in N ew Orleans seemed to be used prim arily to control the population, with the rapid deployment o f unarmed soldiers in rescue and relief missions in China after the devastating earth
quake o f zoo8, a response widely applauded by the international community.
T H E E Q U A L I T Y O F C O N D I T I O N S
A very different vision of America is offered by one of its earliest observers. Alexis de Tocqueville travelled throughout the United States in 1 8 3 1 .23 He met presidents and ex-presidents, mayors, senators and judges, as well as ordinary citizens, and everywhere he went he was impressed by the ‘equality o f conditions’ (p. x i) , ‘the blending o f social ranks and the abolition o f privileges’ - the w ay that society was ‘one single mass’ (p. 725) (at least for whites). He wrote that ‘Americans of all ages, conditions, and all dispositions constantly unite together’ (p. 596), that ‘strangers readily congregate

in the same places and find neither danger nor advantage in telling each other freely what they think’ , their manner being ‘natural, open and unreserved’ (p. 6 56). And de Tocqueville points out the w ays in which Americans support one another in times of trouble:
Should some unforeseen accident occur on the public highway, people
run from all sides to help the victim; should some family fall foul of an unexpected disaster, a thousand strangers willingly open their purses . . .
( p . 6 6 1 )
De Tocqueville believed that the equality o f conditions he observed
had helped to develop and maintain trust among Americans.
W H A T ’ S T R U S T G O T T O D O W I T H I T ?
But does inequality corrode trust and divide people - government
from citizens, rich from poor, minority from m ajority? This chapter shows that the quality of social relations deteriorates in less equal societies.
Inequality, not surprisingly, is a powerful social divider, perhaps
because we all tend to use differences in living standards as markers
of status differences. We tend to choose our friends from among our near equals and have little to do with those much richer or much poorer. And when we have less to do with other kinds of people, it’ s harder for us to trust them. Our position in the social hierarchy affects who we see as part of the in-group and who as out-group - us
and them - so affecting our ability to identify with and empathize
with other people. Later in the book, w e’ll show that inequality not only has an impact on how much we look down on others because they have less than we do, but also affects other kinds o f discrimination, such as racism and sexism, with attitudes sometimes
justified by statements like ‘they just don’t live like us’ .De Tocqueville understood this point. A lifelong opponent of
slavery, he wrote about the exclusion of both African-Am ericans and N ative Americans from the liberty and equality enjoyed by other Americans.23 Slavery, he thought, could only be maintained because African-Am ericans were viewed as ‘other’ , so much so that ‘the

European is to other races what man himself is to the anim als’
(p. 3 7 1) . Empathy is only felt for those we view as equals, ‘the same
feeling for one another does not exist between the different classes’ (p. 650). Prejudice, thought de Tocqueville, was ‘an imaginary inequality’ which followed the ‘real inequality produced by wealth and the law ’ (p. 400).
Early socialists and others believed that material inequality was an obstacle to a wider human harmony, to a universal human brotherhood, sisterhood or comradeship. The data we present in this chapter suggest that this intuition was sound: inequality is divisive, and even small differences seem to make an important difference.
I N C O M E I N E Q U A L I T Y A N D T R U S T
Figures 4 .1 and 4 .2 show that levels o f trust between members o f the public are lower in countries and states where income differences
Income inequality
Figure 4 .1 The percentage o f people agreeing that ‘most people can be trusted’ is higher in more equal countries.

Income inequality
Figure 4.2 In more equal states more people agree that ‘most people can be trusted’. (Data available for only forty-one US states.)
are larger. These relationships are strong enough that w e can be confident that they are not due to chance. The international data
on trust in Figure 4 .1 com e from the European and W orld Values
Survey, a study designed to a llow international com parisons o f
values and norm s. In each country, random sam ples o f the popu
lation were asked whether or not they agreed w ith the statement:
‘M ost people can be trusted.’ The differences between countries are
large. People trust each other most in the Scandinavian countries and
the N etherlands; Sweden has the highest levels o f trust, w ith 66 per
cent o f people feeling that they can trust others. The low est level o f
trust is seen in Portugal, where only 10 per cent o f the population
believe that others can be trusted. So just w ithin these rich, m arket
dem ocracies, there are m ore than sixfo ld differences in levels o f
trust, and, as the graph show s, high levels o f trust are linked to low
levels o f inequality.
The data on trust w ithin the U S A , show n in Figure 4.2, are taken
from the federal governm ent’s G en era l Socia l S urvey, which has

been monitoring social change in America for more than a quarter of a century.24 In this survey, just as in the international surveys, people are asked whether or not they agree that most people can be trusted. Within the U SA , there are fourfold differences in trust between states. North Dakota has a level o f trust similar to that of Sweden -
67 per cent feel they can trust other people - whereas in Mississippi only 17 per cent of the population believe that people can be trusted. Just as with the international data, low levels o f trust among the United States are related to high inequality.
The important message in these graphs of trust and inequality is
that they indicate how different life must feel to people living in
these different societies. Imagine living somewhere where 90 per cent o f the population mistrusts one another and what that must mean for the quality o f everyday life - the interactions between people at w ork, on the street, in shops, in schools. In N orw ay it is not unusual
to see cafes with tables and chairs on the pavement and blankets left
out for people to use if they feel chilly while having a coffee. N obody worries about customers or passers-by stealing the blankets. M any people feel nostalgic for time past, when they could leave their doors unlocked, and trusted that a lost wallet would be handed in. O f all
large US cities, N ew Orleans is one of the most unequal. This was
the background to the tensions and mistrust in the scenes o f chaos after Hurricane Katrina that we described above.
C H I C K E N OR E G G ?
In the U SA , trust has fallen from a high o f 60 per cent in i960, to a low of less than 40 per cent by Z004.24 But does inequality create low levels of trust, or does mistrust create inequality? Which comes first? Political scientist Robert Putnam of H arvard University, in his book B ow lin g Alone, shows how inequality is related to ‘social
capital’ , by which he means the sum total o f people’s involvement in community life.25 He says:
Community and equality are mutually reinforcing . . . Social capital and economic equality moved in tandem through most of the twentieth

century. In terms of the distribution of wealth and income, America in the 1950s and 1960s was more egalitarian than it had been in more than a
century . . . those same decades were also the high point of social connectedness and civic engagement. Record highs in equality and social capital coincided . . . Conversely, the last third of the twentieth century was a time of growing inequality and eroding social capital . . . The timing of the two trends is striking: Sometime around 19 6 5-70 America reversed course and started becoming both less just economically and less well connected
socially and politically, (p. 359)
In another article, Putnam says:
the causal arrows are likely to run in both directions, with citizens in high social capital states likely to do more to reduce inequalities, and inequalities themselves likely to be socially divisive.26
Taking a more definite stance in his book, The M oral Foundations o f Trust, Eric Uslaner, a political scientist at the University of
M aryland, believes that it is inequality that affects trust, not the other w ay round.27 If we live in societies with more social capital, then we know more people as friends and neighbours and that might increase our trust o f people we know, people we feel are like us.
But Uslaner points out that the kind of trust that is being measured
in surveys such as the European and W orld Values Survey is trust of strangers, of people we don’t know, people who are often not like us. Using a wealth of data from different sources, he shows that people who trust others are optimists, with a strong sense o f control over their lives. The kind o f parenting that people receive also affects
their trust of other people.In a study with his colleague Bo Rothstein, Uslaner shows, using a
statistical test for causality, that inequality affects trust, but that there is ‘no direct effect of trust on inequality; rather, the causal direction starts with inequality’ .28’ p-45 Uslaner says that ‘ trust can
not thrive in an unequal w orld ’ and that income inequality is the ‘prime mover’ o f trust, with a stronger impact on trust than rates of unemployment, inflation or economic growth.27 It is not average levels of economic wellbeing that create trust, but economic equality. Uslaner’s graph showing that trust has declined in the U SA during a

Gini index of inequality
Figure 4.3 As inequality increased, so trust declined.27 -187
period in which inequality rapidly increased, is shown in Figure 4 .3.
The numbers on the graph show for each year (19 6 0 -9 8 ) the relation between the level o f trust and inequality in that year.
Changes in inequality and trust go together over the years. With greater inequality, people are less caring o f one another, there is less mutuality in relationships, people have to fend for themselves and get what they can - so, inevitably, there is less trust. Mistrust and inequality reinforce each other. As de Tocqueville pointed out, we are less likely to empathize with those not seen as equals; material differences serve to divide us socially.
T R U S T M A T T E R S
Both Putnam and Uslaner make the point that trust leads to cooperation. Uslaner shows that, in the U SA , people who trust others are more likely to donate time and money to helping other people. ‘Trusters’ also tend to believe in a common culture, that America is held together by shared values, that everybody should be treated with respect and tolerance. They are also supportive of the legal order.
Trust affects the wellbeing of individuals, as well as the wellbeing

of civic society. High levels o f trust mean that people feel secure,
they have less to w orry about, they see others as co-operative rather
than competitive. A number o f convincing studies in the USA have
linked trust to health - people with high levels o f trust live longer.29 In fact, people who trust others benefit from living in communities with generally high levels o f trust, whereas people who are less trusting o f others fare worse in such neighbourhoods.30
Trust, or lack o f it, meant the difference between life and death
for some people caught up in the chaotic aftermath o f Hurricane Katrina. Trust was also crucial for survival in the Chicago heatwave o f 19 9 5 . Sociologist Eric Klinenberg, in his book about the heatw ave,31 showed how poor African-Am ericans, living in areas with
low levels of trust and high levels o f crime, were too frightened to
open their windows or doors, or leave their homes to go to local cooling centres established by the city authorities. Neighbours didn’t check on neighbours, and hundreds o f elderly and vulnerable people died. In equally poor Hispanic neighbourhoods, characterized by high levels of trust and active community life, the risk o f death was
much lower.
R A I D E R S A N D M A V E R I C K S
Perhaps another marker of corroded social relations and lack of
trust among people was the rapid rise in the popularity o f the Sport Utility Vehicle (SUV) through the 1980s and 1990s. These vehicles are known in the U K by the derogatory term ‘Chelsea tractors’ - Chelsea being a rich area of London, the name draws attention to the silliness o f driving rugged off-road vehicles in busy urban areas.
But the vehicles themselves have names that evoke images of hunters and outdoorsmen - Outlander, Pathfinder, Cherokee, W rangler, etc. Others evoke an even tougher image, o f soldiers and w arriors, with names like Trooper, Defender, Shogun, Raider and Commander. These are vehicles for the ‘urban jungle’ , not the real thing.
N ot only did the popularity o f SU V s suggest a preoccupation with
looking tough, it also reflected growing mistrust, and the need to feel safe from others. Josh Lauer, in his paper, ‘Driven to extremes’ ,
asked why military ruggedness became prized above speed or sleekness, and what the rise of the SU V said about American society.32 He concluded that the trend reflected American attitudes towards crime and violence, an admiration for rugged individualism and the importance o f shutting oneself o ff from contact with others - mis
trust. These are not large vehicles born from a co-operative public
spiritedness and a desire to give lifts to hitch-hikers - hitch-hiking started to decline just as inequality started to rise in the 19 70 s. As one anthropologist has observed, people attempt to shield themselves from the threats o f a harsh and untrusting society ‘by riding in
SU V s, which look armoured, and by trying to appear as intimidat
ing as possible to potential attackers’ .33 Pollster M ichael Adams, writing about the contrasting values o f the U SA and Canada, pointed out that minivans outsell SU V s in Canada by two to one - the ratio is reversed in America (and Canada is o f course more equal
than Am erica).34 Accom panying the rise in SU V s were other signs of
Americans’ increasing uneasiness and fear o f one another: growing
numbers o f gated communities,35 and increasing sales o f home security systems.32 In more recent years, due to the steeply rising cost of filling their fuel tanks, sales of SU V s have declined, but people still want that rugged image - sales o f smaller, tough-looking ‘cross-over’
vehicles continue to rise.
W O M E N ’ S S T A T U S
In several respects, more unequal societies seem more masculine, at
least in terms of the stereotypes. When we put this to the test, we found that just as levels o f trust and social relations are affected by inequality, so too is the status o f women.
In the U SA , the Institute for W omen’s Policy Research produces
measures of the status o f women. Using these measures, researchers
at H arvard University showed that wom en’s status was linked to state-level income inequality.36 Three o f the measures are: wom en’s political participation, wom en’s employment and earnings, and wom en’s social and economic autonomy. When we combine these measures for each US state and relate them to state levels o f income

Inde
x of
w
omen
’s st
atus
Income inequality
Figure 4.4 Women's status and inequality in US states.
inequality, we also find that wom en’s status is significantly worse in more unequal states, although this is not a particularly strong relationship (Figure 4.4). The fairly wide scatter o f points around the line on the graph shows that factors besides inequality affect w om en’s status. Nevertheless, there is a tendency that cannot be put down to chance, for fewer women to vote or hold political office, for
women to earn less, and fewer women to complete college degrees in more unequal states.
Internationally we find the same thing, and we show this relationship in Figure 4 .5 . Combining measures o f the percentage o f women in the legislature, the m ale-fem ale income gap, and the percentage of women completing higher education to make an index o f wom en’s status, we find that more equal countries do significantly better.
Japan is conspicuous among the most equal countries in that wom en’s status is lower than we would expect given its level of inequality; Italy also has worse wom en’s status than expected, and Sweden does better. As with the scattering o f points on the American graph above, this shows that other factors are also influencing

Inde
x of
w
om
en’s
stat
us
Income inequality
Figure 4.5 Women’s status and inequality in rich countries.
wom en’s status. In both Japan and Italy women have traditionally had lower status than men, whereas Sweden has a long tradition of wom en’s rights and empowerment. But again, the link between income inequality and wom en’s status cannot be explained by
chance alone, and there is a tendency for wom en’s status to be better in more equal countries.
Epidemiologists have found that in US states where wom en’s status is higher, both men and women have lower death rates,36 and wom en’s status seems to matter for all women, whether rich or poor.37
T R U S T B E Y O N D B O R D E R S
N ot surprisingly, just as individuals who trust other people are more likely to give to charity, more equal countries are also more generous to poorer countries. The United N ations’ target for spending on foreign development aid is 0 .7 per cent o f Gross National Income.

Income inequality
Figure 4 .6 Spending on foreign aid and inequality in rich countries.
Only N orw ay, Sweden, Denmark and the Netherlands meet that target - indeed, they are generous beyond what the United Nations expects - and, as we show in Figure 4.6 using data from the O E C D ,38 more unequal countries spend significantly lower percentages o f their income on foreign aid. Japan and the U K might be seen as outliers on this graph. Perhaps Jap an ’s lower than expected spending on aid reflects its w ithdraw al from the international stage following the Second W orld W ar, and the U K ’s higher than expected spending reflects historical, colonial ties to many developing
countries.
W H A T W E H A V E L E A R N E D
In this chapter, we have shown that levels o f social trust are
connected to income inequality, but o f course showing a correlation is not the same thing as showing causality.
There are several reasons why we believe that equality is the

precondition for greater trust (although almost certainly there is a feedback loop between the two). One factor is the strength of the relationship, which is shown by the steepness of the lines in Figures 4 .1 and 4.2. People in Sweden are much more likely to trust each other than people in Portugal. Any alternative explanation would need to be just as strong, and in our own statistical models we find that neither poverty nor average standards o f living can explain our findings. We also see a consistent association among both the United States and the developed countries. Earlier we described how Uslaner and Rothstein used a statistical model to show the ordering
of inequality and trust: inequality affects trust, not the other w ay round. The relationships between inequality and wom en’s status and between inequality and foreign aid also add coherence and plausibility to our belief that inequality increases the social distance between different groups of people, making us less willing to see them as ‘us’ rather than ‘them’ .
In summary, we can think of trust as an important marker o f the ways in which greater material equality can help to create a cohesive, co-operative community, to the benefit o f all.

Mental health and drug use
It is no measure of health to be well adjusted to a profoundly sick society. Krishnamurti
M E N T A L I L L N E S S I N T H E UK A N D U S A
Children’s mental health now makes the front pages o f newspapers, Britain’s D aily M ail for example, under banner headlines such as
‘T H E D IS T U R B E D G E N E R A T IO N ’ . A million British children - one in ten between the ages o f 5 and 16 - are estimated to be mentally ill.39 It has been suggested that in any secondary school with 1,0 0 0 students, 50 will be severely depressed, 10 0 will be distressed, 1 0 - 2 0 will be suffering from obsessive-compulsive disorder and between 5 - 1 0 girls will have an eating disorder.40 This is
backed up by a 2008 report from the Good Childhood Inquiry, an independent inquiry commissioned by the Children’s Society.41 After surveying thousands of children, they report that increasing numbers o f children have mental health problems, over a quarter regularly
feeling depressed, mostly as a result o f family breakdown and peer
pressure.In the U SA , 6 per cent of children have been diagnosed with
Attention Deficit Hyperactivity Disorder, a behavioural syndrome characterized by serious distractibility, impulsivity and restlessness.42
In a national survey, almost 10 per cent of children aged 3 - 1 7 had moderate or severe difficulties in ‘the areas o f emotions, concentration, behaviour, or being able to get along with other people’ .43
And how are adults doing in these same two societies? In the U K ,

"We're all on the same wavelength. Everyone's on an anti-depressant!" w
ww
.Car
too
nSt
ock
.co
m

in a national survey conducted in 2000, 23 per cent o f adults had
either a neurotic disorder, a psychotic disorder, or were addicted to alcohol or drugs, 4 per cent of adults having more than one disorder.44 In 2005, doctors in England alone wrote 29 million prescriptions for anti-depressant drugs, costing over £400 million to the N ational Health Service.45 In the U SA , one in four adults have been
mentally ill in the past year and almost a quarter o f these episodes were severe; over their lifetime more than half will suffer from a mental illness.46 In 2003, the U SA spent $ 10 0 billion on mental health treatments.47
M E N T A L W E L L B E I N G
Before we turn to comparisons o f mental illness in other societies, it’s worth asking - what is a healthy mind?
M IN D , the N ational Association for M ental Health in the
U K , publishes a pamphlet called ‘H ow to Improve Y our Mental W ell-being’ . It begins with the premise that:
Good mental health isn’t something you have, but something you do. To
be mentally healthy you must value and accept yourself.48
It concludes that people who are mentally well are able to look after themselves, see themselves as valuable people and judge themselves by reasonable, rather than unrealistic, standards. People who don’t value themselves become frightened o f rejection; they keep others at
a distance, and get trapped in a vicious circle o f loneliness.It is also important to note that although people with mental
illness sometimes have changes in the levels of certain chemicals in their brains, nobody has shown that these are causes o f depression, rather than changes caused by depression. Similarly, although genetic vulnerability m ay underlie some mental illness, this can’t by itself explain the huge rises in illness in recent decades - our genes can’t change that fast.

A P P L E S A N D O R A N G E S ?
Can we really compare levels of mental illness in different countries? D on’t different cultures have different labels for mental disorders, and different standards of normality, or tolerance o f differences? Aren’t people in different societies more or less reluctant to admit to emotional problems, or drug use, or any stigmatized condition?
N ot surprisingly, it hasn’t alw ays been easy to get comparable
measures of how many people are suffering from mental illness in
different countries. But this began to get easier in the 1980s, when researchers developed diagnostic interviews - sets o f questions that could be asked by non-psychiatrists and non-psychologists, allowing researchers to measure on a large scale the numbers of people
meeting diagnostic criteria for different mental illnessess.
In 19 9 8 , the W orld Health Organization set up the W orld M ental Health Survey Consortium in an attempt to estimate the numbers o f people with mental illness in different countries, the severity of their illness and patterns o f treatment. Although their methods don’t
entirely overcome worries about cultural differences in interpreting
and responding to such questions, at least the same questions are being asked, in the same w ay, in different places. Among our set of rich developed countries, W H O surveys have been completed in nine: Belgium, France, Germany, Italy, Japan , Netherlands, N ew Zealand, Spain and the U S A .49' 50 Although not strictly comparable,
very similar national surveys give estimates o f the proportion o f the adult population with mental illness in another three countries - Australia,51 C anada52 and the U K .44
I N C O M E I N E Q U A L I T Y A N D M E N T A L I L L N E S S
In Figure 5 .1 we use these surveys to show the association in rich countries between income inequality and the proportion o f adults
who had been mentally ill in the twelve months prior to being inter
viewed. This is a strong relationship: a much higher percentage of

Figure 5 .1 More people suffer from mental illnesses in more unequal countries.
the population suffer from mental illness in more unequal countries.
Such a close relationship cannot be due to chance, indeed the coun
tries line up almost perfectly, with only Italy standing out as having lower levels of mental illness than we might expect, based on its level
o f income inequality.Just as we saw with levels of trust in the previous chapter, there
are big differences in the proportion of people with mental illness
(from 8 per cent to 26 per cent) between countries. In Germany, Italy, Japan and Spain, fewer than 1 in 10 people had been mentally ill within the previous year; in Australia, Canada, N ew Zealand and the U K the numbers are more than 1 in 5 people; and in the U SA , as we described above, more than 1 in 4. Overall, it looks as if differ
ences in inequality tally with more than threefold differences in the percentage o f people with mental illness in different countries.
For our nine countries with data from the W H O surveys, we can also look at sub-types o f mental illness, specifically anxiety disorders, mood disorders, impulse-control disorders and addictions, as

well as a measure o f severe mental illness. Anxiety disorders, impulse-control disorders and severe illness are all strongly correlated with inequality; mood disorders less so. We saw in Chapter 3
how anxiety has been increasing in developed countries in recent decades. Anxiety disorders represent the largest sub-group o f mental illness in all our countries. Indeed, the percentage of all mental illnesses that are anxiety disorders is itself significantly higher in
more unequal countries. Unfortunately, there are no international sources o f comparable data on the mental health o f children and adolescents.
Turning now to our other test-bed, the fifty states o f the U SA , we discovered something rather surprising. Alone among the numerous health and social problems we examine in this book, we found no relationship between adult male mental illness and income inequality
among the US states. State-specific estimates of mental illness are collected both by the United States Behavioral Risk Factor Surveillance Study and by the National Survey on Drug Use and Health, but the lack of a relationship between income inequality and mental illness among men was consistent in both sources.
However, income inequality is associated with mental illness in
adult women. It is not a particularly strong relationship, but too strong to be dismissed as chance. There is also a similar relationship with the mental health o f children. The National Survey of Children’s Health provides estimates o f the percentage of children in each state with ‘moderate or severe difficulties in the area of
emotions, concentration, behavior, or getting along with others’ .43 Although, as for adult women, the relationship with state inequality is not particularly strong, children’s mental health is significantly correlated with state levels o f income inequality.
There are several plausible explanations for the lack o f an association between the available measures o f adult mental health among men and inequality. In general, problems related to inequality have steep social gradients (becoming more common lower down the social ladder).8 Some indicators suggest that mental health in the U SA does not show a consistent social gradient. Whether the explan
ation for this lies in methods o f data collection, gender differences in
reporting mental illness, the apparent resilience of ethnic minority

12
% 8
4
oWhite Black American Asian Hispanic
Indian
Figure 5.2 US adults reporting frequent mental distress, 19 9 3 -2 0 0 1.53
populations to mental illness (see Figure 5.2), or a delay in being able to observe the effects of growing inequality, it is important to remember that, from an international perspective, levels o f mental
illness in the U SA as a whole are exactly what we would expect,
given its high overall level of inequality.
C L I N G I N G T O T H E L A D D E R
So why do more people tend to have mental health problems in more unequal places? Psychologist and journalist Oliver Jam es uses an analogy with infectious disease to explain the link. The ‘affluenza’
virus, according to Jam es, is a ‘set of values which increase our
vulnerability to emotional distress’ , which he believes is more common in affluent societies.54 It entails placing a high value on acquiring money and possessions, looking good in the eyes o f others and wanting to be famous. These kinds o f values place us at greater risk of depression, anxiety, substance abuse and personality disorder, and are closely related to those we discussed in Chapter 3. In another recent book on the same subject, philosopher Alain de Botton describes ‘status anxiety’ as ‘a w orry so pernicious as to be capable of ruining extended stretches of our lives’ . When we fail to maintain our position in the social hierarchy we are ‘condemned to consider the successful with bitterness and ourselves with shame’ .55

Economist Robert Frank observes the same phenomenon and calls it ‘luxury fever’.56 As inequality grows and the super-rich at the top
spend more and more on luxury goods, the desire for such things cascades down the income scale and the rest of us struggle to com pete and keep up. Advertisers play on this, making us dissatisfied with what we have, and encouraging invidious social comparisons.
Another economist, Richard Layard, describes our ‘addiction to income’ - the more we have, the more we feel we need and the more time we spend on striving for material wealth and possessions, at the expense o f our family life, relationships, and quality o f life.3
Given the importance o f social relationships for mental health, it
is not surprising that societies with low levels of trust and weaker community life are also those with worse mental health.
I N E Q U A L I T Y A N D I L L E G A L D R U G S
Low position in the social status hierarchy is painful to most people, so it comes as no surprise to find out that the use o f illegal drugs, such as cocaine, marijuana and heroin, is more common in more unequal societies.
Internationally, the United Nations Office on Drugs and Crime publishes a W orld D rug R eport,57 which contains separate data on the use o f opiates (such as heroin), cocaine, cannabis, ecstasy and
amphetamines. We combined these data to form a single index, giving each drug category the same weight so that the figures were not dominated by the use o f any one drug. We use this index in Figure 5 .3 , which shows a strong tendency for drug use to be more common in more unequal countries.
Within the United States, there is also a tendency for addiction to
illegal drugs and deaths from drug overdose to be higher in more unequal states.58

Inde
x of
drug
u
se
Income inequality
Figure 5.3 The use o f illegal drugs is more common in more unequal countries.
M O N K E Y B U S I N E S S
The importance o f social status to our mental wellbeing is reflected in the chemical behaviour of our brains. Serotonin and dopamine are among the chemicals that play important roles in the regulation of mood: in humans, low levels of dopamine and serotonin have been linked to depression and other mental disorders. Although we must be cautious in extrapolating to humans, studies in animals show that low social status affects levels of, and responses to, different chemicals in the brain.
In a clever experiment, researchers at W ake Forest School of Medicine in N orth Carolina took twenty macaque monkeys and housed them for a while in individual cages.59 They next housed the animals in groups o f four and observed the social hierarchies which developed in each group, noting which animals were dominant and which subordinate. They scanned the m onkey’s brains before and

after they were put into groups. N ext, they taught the monkeys that they could administer cocaine to themselves by pressing a lever - they could take as much or as little as they liked.
The results o f this experiment were remarkable. M onkeys that had become dominant had more dopamine activity in their brains than they had exhibited before becoming dominant, while monkeys that became subordinate when housed in groups showed no changes in their brain chemistry. The dominant monkeys took much less cocaine than the subordinate monkeys. In effect, the subordinate monkeys were medicating themselves against the impact o f their low social status. This kind of experimental evidence in monkeys adds plausibility to our inference that inequality is causally related to mental illness.
At the beginning o f this chapter we mentioned the huge number of
prescriptions written for mood-altering drugs in the U K and U SA ;
add these to the self-medicating users o f illegal drugs and we see the pain wrought by inequality on a very large scale.

Physical health and life expectancy
A sad soul can kill you quicker than a germ.John Steinbeck, Travels with Charley
M A T E R I A L A N D P S Y C H O S O C I A L D E T E R M I N A N T S O F H E A L T H
As societies have become richer and our circumstances have changed, so the diseases we suffer from and the most important causes o f health and illness have changed.
The history o f public health is one o f shifting ideas about the causes of disease.60-61 In the nineteenth century, reformers began to collect statistics which showed the burden o f ill-health and premature death suffered by the poor living in city slums. This led to the great reforms o f the Sanitary Movement. Drainage and sewage systems, rubbish collection, public baths and decent housing, safer
w orking conditions and improvements in food hygiene - all brought major improvements in population health, and life expectancy lengthened as people’s material standards o f living advanced.
As we described in Chapter i , when infectious diseases lost their hold as the major causes o f death, the industrialized w orld underwent a shift, known as the ‘epidemiological transition’ , and chronic diseases, such as heart disease and cancer, replaced infections as the major causes of death and poor health. During the greater part o f the twentieth century, the predominant approach to improving the health of populations was through ‘ lifestyle choices’ and ‘risk

“What do you mean, I have an ulcer? I give ulcers, I don’t get them!"

factors’ to prevent these chronic conditions. Smoking, high-fat diets,
exercise and alcohol were the focus o f attention.But in the latter part of the twentieth century, researchers began to
make some surprising discoveries about the determinants o f health. They had started to believe that stress was a cause o f chronic disease, particularly heart disease. Heart disease was then thought o f as the executive’s disease, caused by the excess stress experienced by
businessmen in responsible positions. The Whitehall I Study, a longterm follow-up study o f male civil servants, was set up in 19 6 7 to investigate the causes o f heart disease and other chronic illnesses. Researchers expected to find the highest risk of heart disease among men in the highest status jobs; instead, they found a strong inverse
association between position in the civil service hierarchy and death rates. M en in the lowest grade (messengers, doorkeepers, etc.) had a death rate three times higher than that o f men in the highest grade (administrators ).62~3
Further studies in Whitehall I, and a later study o f civil servants,
Whitehall II, which included wom en, have shown that low job status is not only related to a higher risk o f heart disease: it is also related to some cancers, chronic lung disease, gastrointestinal disease, depression, suicide, sickness absence from w ork, back pain and selfreported health.64~6 So was it low status itself that was causing worse
health, or could these relationships be explained by differences in
lifestyle between civil servants in different grades?Those in lower grades were indeed more likely to be obese, to
smoke, to have higher blood pressure and to be less physically active, but these risk factors explained only one-third o f their increased
risk o f deaths from heart disease.67 And of course factors such as
absolute poverty and unemployment cannot explain the findings, because everybody in these studies was in paid employment. O f all the factors that the Whitehall researchers have studied over the years, job stress and people’s sense of control over their w ork seem to make the most difference. There are now numerous studies that
show the same thing, in different societies and for most kinds of ill-health - low social status has a clear impact on physical health, and not just for people at the very bottom of the social hierarchy. As well as highlighting the importance o f social status, this is the other

important message from the Whitehall studies. There is a social gradient in health running right across society, and where we are placed in relation to other people matters; those above us have better
health, those below us have worse health, from the very bottom
to the very top.68 Understanding these health gradients means understanding why senior administrators live longer than those in professional and executive grades, as well as understanding the worse health profiles o f the poor.
Besides our sense o f control over our lives, other factors which make a difference to our physical health include our happiness, whether w e’re optimistic or pessimistic, and whether we feel hostile or aggressive towards other people. Our psychological wellbeing has a direct impact on our health, and w e’re less likely to feel in control, happy, optimistic, etc. if our social status is low.
It’s not just our social status and psychological wellbeing that
affects our health. The relationships we have with other people
matter too. This idea goes back as far as the w ork on suicide by Emile Durkheim, one of the founding fathers o f sociology, in the late nineteenth century.69 Durkheim showed that the suicide rates o f different countries and populations were related to how well
people were integrated into society and whether or not societies
were undergoing rapid change and turmoil. But it w asn ’t until the 19 70 s that epidemiologists began to investigate systematically how people’s social networks relate to health, showing that people with fewer friends were at higher risk o f death. Having friends, being married, belonging to a religious group or other association and
having people who will provide support, are all protective of health.70-71
Social support and social networks have also been linked both to the incidence o f cardiovascular disease and to recovery from
heart attacks. In a striking experiment, researchers have also shown
that people with friends are less likely to catch a cold when given the same measured exposure to the cold virus - in fact the more friends they had, the more resistant they were.72 Experiments have also shown that physical wounds heal faster if people have good relationships with their intimate partners.73
Social status and social integration are now well established as

important determinants o f population health and, increasingly,
researchers are also recognizing that stress in early life, in the womb
as well as in infancy and early childhood, has an important influence on people’s health throughout their lives.74-5 Stress in early life affects physical growth, emotional, social and cognitive development, as well as later health and health behaviours. And the socio
economic status o f the families in which children live also determines
their lifelong trajectories of health and development.76Taken together, social status, social networks and stress in early
childhood are what researchers label ‘psychosocial factors’ , and these are o f increasing importance in the rich, developed countries
where material living standards, as we described in Chapter i , are
now high enough to have ceased to be important direct determinants o f population health.
L I F E IS S H O R T W H E R E L I F E IS B R U T A L
Evolutionary psychologists M argo W ilson and M artin D aly were interested in whether adopting more impulsive and risky strategies w as an evolved response to more stressful circumstances in which life is likely to be shorter. In more threatening circumstances, then, more reckless strategies are perhaps necessary to gain status, maximize sexual opportunities, and enjoy at least some short-term gratifications. Perhaps only in more relaxed conditions, in which a longer life is assured, can people afford to plan for a long-term future.77 To test this hypothesis, they collected data on the murder rates for the seventy-seven community areas o f Chicago, and then they collected data on death rates for those same areas, subtracting all of the deaths caused by homicide. When they put the two together, they showed a rem arkably close relationship, seen in Figure 6. i - neighbourhoods with high homicide rates were also
neighbourhoods where people were dying younger from other causes as well. Something about these neighbourhoods seemed to be affecting both health and violence.
In Chapter 4 we showed how different developed countries and

Hom
icid
e ra
te
1 60
1 4 0
120
I O O
80
60
4 0
20
O5 0 5 5 6 0 6 5 7 0 7 5 8 0
M ale life expectancy at birth (years)
Figure 6.1 Homicide rates are related to male life expectancy in seventy - seven neighbourhoods in Chicago. (Calculation o f life expectancy included deaths from all causes except homicide.)77
US states vary in the levels o f social trust that people feel. There are
sixfold differences in levels of trust between developed countries and fourfold differences among US states. We mentioned that levels of trust have been linked to population health and, in fact, research on social cohesion and social capital has mushroomed over the past
ten years or so. M ore than forty papers on the links between health
and social capital have now been published.78In the United States, epidemiologist Ichiro Kawachi and his
colleagues at the H arvard School o f Public Health looked at death rates in thirty-nine states in which the General Social Surveys had
been conducted in the late 19 8 0 s.79 These surveys allowed them to count how many people in each state were members of voluntary
•
••
•
• •
• • • •• • •
••
• •• •
••
•••
• ••
• 1
• •
• •
• •
• •

organizations, such as church groups and unions. This measure of group membership turned out to be a strong predictor o f deaths
from all causes combined, as well as deaths from coronary heart dis
ease, cancers, and infant deaths. The higher the group membership, the lower the death rate.
Robert Putnam looked at social capital in relation to an index o f health and health care for the US states.25 This index included
information on such things as the percentage o f babies born with
low birthweight, the percentage o f mothers receiving antenatal care, many different death rates, expenditure on health care, the number of people with A ID S and cancer, immunization rates, use o f car safety belts, and numbers o f hospital beds, among other factors. The health index w as closely linked to social capital; states such as
M innesota and Vermont had high levels o f social capital and scored
high on the health index, states such as Louisiana and Nevada scored badly on both. Clearly, it’ s not just our individual social status that matters for health, the social connections between us matter too.
H E A L T H A N D W E A L T H
Let’s consider the health of two babies born into two different societies.
Baby A is born in one o f the richest countries in the world,
the U S A , home to more than half of the w orld ’s billionaires. It is a country that spends somewhere between 4 0 -5 0 per cent o f the w orld ’s total spending on health care, although it contains less than 5 per cent of the w orld ’s population. Spending on drug treatments and high-tech scanning equipment is particularly high. Doctors in
this country earn almost twice as much as doctors elsewhere and medical care is often described as the best in the world.
Baby B is born in one of the poorer o f the western democracies, Greece, where average income is not much more than half that of the U SA . Whereas America spends about $6 ,000 per person per year on health care, Greece spends less than $3,00 0 . This is in real terms, after taking into account the different costs of medical care.

And Greece has six times fewer high-tech scanners per person than
the U SA .Surely Baby B ’s chances of a long and healthy life are worse than
Baby A ’s?In fact, Baby A, born in the U SA , has a life expectancy o f 1 .2 years
less than Baby B, born in Greece. And Baby A has a 40 per cent
higher risk o f dying in the first year after birth than Baby B. Among developed countries, there are even bigger contrasts than the com parison w e ’ve used here: babies born in the U SA are twice as likely to die in their first year than babies in Japan , and the difference in
average life expectancy between the U SA and Sweden is three years,
between Portugal and Japan it is over five years. Some comparisons are even more shocking: in 19 9 0 , Colin M cC ord and H arold Freeman in the Department o f Surgery at Colum bia University calculated that black men in Harlem were less likely to reach the age
of 65 than men in Bangladesh.80
Among other things, our com parison between Baby A and Baby B
8 2 -
Q.X aj
Ji 78J
76
•Japan
•Sweden
Spain»# israe| Aus„ a|ia. 'Canada• France •Switzerland
Italy. Belgium •
•AustriaNew Zealand* "Greece # Netherlands* Germany
•Singapore Fin|and. UK
Ireland • U SA *
• Denmark
• Portugal
3 0 0 0 4 0 0 0 5 0 0 0
Health expenditure per person ($)
6 0 0 0
Figure 6.2 Life expectancy is unrelated to spending on health care in rich countries (currencies converted to reflect purchasing power).

shows that spending on health care and the availability of high-tech medical care are not related to population health. Figure 6.2 shows that, in rich countries, there is no relationship between the amount o f health spending per person and life expectancy.
T H E ‘ B I G I D E A ’
If average levels of income don’t matter, and spending on high-tech
health care doesn’t matter, what does? There are now a large
number o f studies o f income inequality and health that compare countries, American states, or other large regions, and the majority o f these studies show that more egalitarian societies tend to be healthier.10 This vast literature was given impetus by a study by one o f us, on inequality and death rates, published in the British M edical
Jo u rn al in 19 9 2 .81 In 19 9 6 , the editors o f that journal, commenting on further studies confirming the link between income inequality and health, wrote:
The big idea is that what matters in determining mortality and health in a society is less the overall wealth of that society and more how evenly
wealth is distributed. The more equally wealth is distributed the better the health of that society.82
Inequality is associated with lower life expectancy, higher rates of infant mortality, shorter height, poor self-reported health, low
birthweight, A ID S and depression. Figures 6 .3 -6 .6 show income inequality in relation to life expectancy for men and women, and to infant mortality - first for the rich countries, and then for the US states.
O f course, population averages hide the differences in health
within any population, and these can be even more dramatic than
the differences between countries. In the U K , health disparities have been a major item on the public health agenda for over twenty-five years, and the current N ational Health Service Plan states that ‘No injustice is greater than the inequalities in health which scar our
nation.’83 In the late 1990s the difference in life expectancy between
the lowest and highest social class groups was 7.3 years for men and

Infa
nt
deat
hs
per
iooo
liv
e bi
rths
Li
fe
expe
ctan
cy
in ye
ars
L ow High
Income inequality
Figure 6.3 Life expectancy is related to inequality in rich countries.
Low High
Income inequality
Figure 6.4 Infant mortality is related to inequality in rich countries.

Infa
nt
deat
hs
per
iooo
liv
e bi
rths
Li
fe
expe
ctan
cy
in ye
ars
Low High
Income inequality
Figure 6.5 Life expectancy is related to inequality in US states.
Low High
Income inequality
Figure 6.6 Infant mortality is related to inequality in US states.

7 years for wom en.84 Studies in the U SA often report even larger differences, such as a 28-year difference in life expectancy at age 16
between blacks and whites living in some of the poorest and some
of the richest areas.85-7 To have many years’ less life because you ’re working-class rather than professional - no one can argue about the serious injustice that these numbers represent. Note that, as the Whitehall study showed, these gaps cannot be explained aw ay by worse health behaviours among those lower down the social scale.88-90 W hat, then, if the cost o f that injustice is a three- or four- year shortening of average life expectancy if we live in a more unequal society?
We examined several different causes o f death to see which had the biggest class differences in health. We found that deaths among working-age adults, deaths from heart disease, and deaths from homicide had the biggest class differences. In contrast, death rates
from prostate cancer had small class differences and breast cancer death rates were completely unrelated to social class. Then we looked at how those different death rates were affected by income inequality, and found that those with big class differences were much more sensitive to inequality.8 We also found that living in a
more equal place benefited everybody, not just the poor. It’s worth repeating that health disparities are not simply a contrast between the ill-health o f the poor and the better health o f everybody else. Instead, they run right across society so that even the reasonably w ell-off have shorter lives than the very rich. Likewise, the benefits
o f greater equality spread right across society, improving health for
everyone - not just those at the bottom. In other words, at almost any level o f income, it’s better to live in a more equal place.
A dramatic example o f how reductions in inequality can lead to rapid improvements in health is the experience o f Britain during the
two world w ars.91 Increases in life expectancy for civilians during
the w ar decades were twice those seen throughout the rest o f the twentieth century. In the decades which contain the world wars, life expectancy increased between 6 and 7 years for men and women, whereas in the decades before, between and after, life expectancy increased by between 1 and 4 years. Although the nation’s
nutritional status improved with rationing in the Second W orld W ar,

this was not true for the First W orld W ar, and material living stan
dards declined during both wars. H ow ever, both wartimes were
characterized by full employment and considerably narrower income differences - the result of deliberate government policies to promote co-operation with the w ar effort. During the Second W orld W ar, for example, working-class incomes rose by 9 per cent, while incomes of the middle class fell by 7 per cent; rates o f relative poverty were
halved. The resulting sense o f camaraderie and social cohesion not
only led to better health - crime rates also fell.
U N D E R O U R S K I N
So how do the stresses o f adverse experiences in early life, of low social status and lack of social support make us unwell?92 The belief that the mind affects the body has been around since ancient times, and modern research has enhanced our understanding of the
ways in which stress increases the risk o f ill-health, and pleasure and
happiness promote wellbeing. The psyche affects the neural system and in turn the immune system - when w e’re stressed or depressed or feeling hostile, we are far more likely to develop a host o f bodily ills, including heart disease, infections and more rapid ageing.93
Stress disrupts our body’s balance, interferes with what biologists
call ‘homeostasis’ - the state w e’re in when everything is running smoothly and all our physiological processes are normal.
When we experience some kind o f acute stress and experience something traumatic, our bodies go into the fight-or-flight response.93 Energy stores are released, our blood vessels constrict, clotting factors are released into the bloodstream, anticipating injury, and
the heart and lungs w ork harder. Our senses and memory are enhanced and our immune system perks up. We are primed and ready to fight or run aw ay from whatever has caused the stress. If the emergency is over in a few minutes, this amazing response is healthy
and protective, but when we go on worrying for weeks or months
and stress becomes chronic, then our bodies are in a constant state of anticipation of some challenge or threat, and all those fight-or-flight responses become damaging.

The human body is superb at responding to the acute stress of a physical challenge, such as chasing down prey or escaping a predator. The circulatory, nervous and immune systems are mobilized
while the digestive and reproductive processes are suppressed. If the stress becomes chronic, though, the continual repetition of theses responses can cause major damage.
EFFECTS OF ACUTE STRESS
B ra in -------------------------Increased alertness and less perception o f pain
Adrenal g la n d s-------------Secrete horm ones that m obilize energy supplies
Reproductive organs — - Reproductive functions 2 tem porarily suppressed
Thym us gland and other immune tissues Immune system readied for possible injury
C irculatory system --------H eart beats faster, and blood vessels constrict to bring more oxygen to muscles
EFFECTS OF CHRONIC STRESS
BrainImpaired memory and increased risk o f depression
Thym us gland and other immune tissues Deteriorated immune response
C irculatory systemblood pressure
higher risk o fdisease
Figure 6.7 The biology o f stress.91
Chronic mobilization o f energy in the form o f glucose into the bloodstream can lead us to put on weight in the wrong places
(central obesity) and even to diabetes; chronic constriction o f blood
vessels and raised levels of blood-clotting factors can lead to hypertension and heart disease. While acute momentary stress perks up our immune system, chronic continuing stress suppresses immunity and can lead to growth failure in children, ovulation failure in women, erectile dysfunction in men and digestive problems for all of

us. Neurons in some areas o f the brain are damaged and cognitive
function declines. We have trouble sleeping. Chronic stress wears us
down and wears us out.In this chapter w e’ve shown that there is a strong relationship
between inequality and many different health outcomes, with a consistent picture in the U SA and developed countries. Our belief that this is a causal relationship is enhanced by the coherent picture
that emerges from research on the psychosocial determinants of health, and the social gradients in health in developed countries. Position in society matters, for health and alternative explanations, such as higher rates of smoking among the poor, don’t account for these gradients. There are now a number of studies showing that income inequality affects health, even after adjusting for people’s individual incomes.94 The dramatic changes in income differences in Britain during the two w orld wars were followed by rapid improvements in life expectancy. Similarly, in Japan , the influence o f the post-Second W orld W ar Allied occupation on demilitarization, democracy and redistribution o f wealth and power led to an
egalitarian economy and unrivalled improvements in population health.95 In contrast, Russia has experienced dramatic decreases in life expectancy since the early 1990 s, as it moved from a centrally planned to a market economy, accompanied by a rapid rise in income inequality.96 The biology o f chronic stress is a plausible pathw ay which helps us to understand why unequal societies are almost alw ays unhealthy societies.
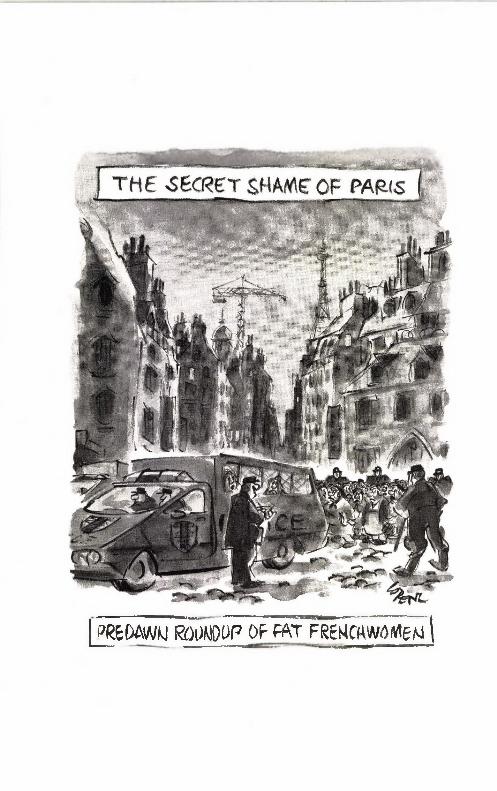
mmm la a iw u p o f p a t FRgnowfliweM 1

Obesity: wider income gaps, wider waists
Food is the most primitive form of comfort
Sheila Graham
Obesity is increasing rapidly throughout the developed world. In some countries rates have doubled in just a few years. Obesity is
measured by Body M ass Index (BM I)* to take height into account and avoid labelling people as overweight just because they are tall. The W orld Health Organization has set standards for using B M I to classify people as underweight (BM I < 18 .5 ), normal weight (BM I 18 .5 -2 4 .9 ) , overweight (BM I Z 5-29 .9 ) and obese (BM I >
30). In the U SA , in the late 19 70 s , close to half the population were overweight and 15 per cent were obese; now three-quarters o f the population are overweight, and close to a third are obese. In the U K in 19 8 0 , about 40 per cent o f the population were overweight and less than 10 per cent were obese; now two-thirds o f adults are overweight and more than a fifth are obese. 97- 100 This is a m ajor health crisis, because obesity is so bad for health - it increases the risk of
hypertension, type II diabetes, cardiovascular disease, gallbladder disease and some cancers. Trends in childhood obesity are now so serious that they are widely expected to lead to shorter life expectancies for today’s children. That would be the first reversal in life expectancy in many developed countries since governments started keeping track in the nineteenth century.101
Apart from the health consequences, obesity reduces emotional
*B M I = weight in kg/(height in m)2

and social wellbeing: overweight and obese adults and children suffer terribly. A 17-year-old from Illinois, weighing 409 lb (29 stone)
described her physical pain: ‘my heart aches in my chest and I have
arm pains and stuff and it gets scary’ .102 But just as hurtful are the memories she has o f other children calling her names at school, her restricted social life and her feeling that her body is ‘almost a prison to me’ .
Britain’s tabloid newspaper, the Sun , featured three obese children in the spring o f 20 0 7 .103-105 The youngest, a boy aged 8, weighed 2 18 lb ( 1 5. 5 stone) and was being bullied at school - when he
attended. His weight was so great that he often missed school due to his difficulties in walking there and back, and was exempt from wearing school uniform because none was available to fit him. His elder sister, aged 9, weighed 19 6 lb (14 stone) and was also being bullied and teased, by both children and adults. She said she found it ‘hard to breathe sometimes’ , and did not like ‘having to w ear ugly clothes’ and being unable to fit on the rides at amusement parks. Heaviest was the oldest boy who, at the age o f 1 2 , weighed 280 lbs (20 stone). He was desperately unhappy - expelled from two schools and suspended from a third, for lashing out at children who called
him names.
T H E ‘ O B E S O G E N I C ’ E N V I R O N M E N T
Many people believe that obesity is genetically determined, and genes do undoubtedly play a role in how susceptible different individuals are to becoming overweight. But the sudden rapid increase in obesity in many societies cannot be explained by genetic factors. The obesity epidemic is caused by changes in how we live. People often point to the changes in cost, ease of preparation and availability of energy-dense foods, to the spread of fast-food restaurants, the development of the microwave, and the decline in cooking skills. Others point to the decline in physical activity, both at work and in leisure time, increasing car use and the reduction in physical education programmes in schools. Modern life, it seems, conspires to

make us fat. If there was no more to it than that, then we might
expect to see more obesity among richer people, who are able to buy
more food, more cars, etc., and high levels o f obesity in all wealthy
societies.But this is not what happens. During the epidemiological tran
sition, which we discussed in Chapters i and 6, in which chronic diseases replaced infectious diseases as the leading causes of death,
obesity changed its social distribution. In the past the rich were fat
and the poor were thin, but in developed countries these patterns are now reversed.106 The W orld Health Organization set up a study in the 1980s to monitor trends in cardiovascular diseases, and the risk factors for these diseases, including obesity, in twenty-six countries. It found that, as rates o f obesity have increased, their social gradient
has steepened.107 By the early 1990s obesity w as more common
among poorer women, compared to richer women, in all twenty-six countries, and among poorer men in all except five. As journalist Polly Toynbee declared in a newspaper article in 2004: ‘Fat is a class issue.’ 108 Pointing to the high rates of obesity in the U SA and the low rates among the Scandinavian countries, which prove that we don’t find high levels o f obesity in all modern, rich societies, she suggested that income inequality might contribute to the obesity epidemic.
I N C O M E I N E Q U A L I T Y A N D O B E S I T Y
Figure 7 . 1 shows that levels o f obesity tend to be lower in countries where income differences are smaller. The data on obesity come from the International Obesity Task Force and show the proportion o f the adult population, both men and women, who are obese - a
Body M ass Index (BM I) o f more than 3 0 .109The differences between countries are large. In the U S A , just over
30 per cent of adults are obese; a level more than twelve times higher than Japan , where only 2.4 per cent o f adults are obese. Because these figures are for B M I, not just weight, they’re not due to differ
ences in average height.

Income inequality
Figure 7 .1 More adults are obese in more unequal countries.
The same pattern can be seen internationally for children (Figure 7.2). Our figures on the percentage o f young people aged 13 and 15
who are overweight, reported in the 2007 U N IC E F report on child
wellbeing, came originally from the W orld Health Organization’s Health Behaviour in School-age Children survey.110 There are no data for Australia, N ew Zealand or Japan from this survey, but the relationship with inequality is still strong enough to be sure it is not due to chance. The differences between countries are smaller for overweight children than for adult obesity. In the country with the
lowest level, the Netherlands, 7 .6 per cent of children aged 13 and 15 are overweight, which is one-third the rate in the U SA , where2 5 .1 per cent are overweight. (As these figures are based on children reporting their height and weight, rather than being measured, the true prevalence o f overweight is probably higher in all countries, but that shouldn’t make much difference to how they are related to inequality.)
Within the U SA , there are no states with levels of adult obesity lower than 20 per cent. Colorado has the lowest obesity prevalence,

Income inequality
Figure 7.2 More children are overweight in more unequal countries.
at 2 1 .5 per cent, compared to 34 per cent in Texas, which has the highest/' But the relationship with inequality is still strong enough for us to be confident it isn’t due to chance. Other researchers have found similar relationships. One study found that higher state-level income inequality was associated with abdominal weight gain in
men,111 others have found that income inequality increases the risk o f inactive lifestyles.112 Overweight among the poor seems to be particularly strongly associated with income inequality.
For children in the U SA , we obtained data from the National Survey o f Children’s Health (Figure 7.4). Just as for the international figures for children, these data are for overweight (rather than obese) children, aged 1 0 - 1 7 years. (The child’s height and weight are reported by the parent, or the adult who knows the child best.) The
"The data on adult obesity within the U SA were made available to us by Professor M ajid Ezzati from H arvard University School o f Public Health. Professor Ezzati bases his calculations o f the prevalence o f obesity in each state on actual measures o f height and weight.

Per
cent
ov
erw
eigh
t io
-i 7
-yea
r-ol
ds
Per
cent
ob
ese
Low High
Income inequality
Figure 7.3 More adults are obese in more unequal US states.113
Low High
Income inequality
Figure 7.4 More children are overweight in more unequal US states.

relationship with inequality is even stronger for children than for adults.
E A T I N G F O R C O M F O R T . . .
The pathways linking income inequality to obesity are likely to include calorie intake and physical activity. Indeed, our own research has shown that per capita calorie intake is higher in more unequal countries. This explained part o f the relationship between inequality and obesity, but less for women than for m en.114 Other
researchers have shown that income inequality in US states is related to physical inactivity.112 It seems that people in more unequal societies are eating more and exercising less. But in studies in Australia, the U K and Sweden the amount that people eat, and the
amount o f exercise they do, fails to fully account for social class
differences in weight gain and obesity.115-18
Calorie intake and exercise are only part o f the story. People with a long history o f stress seem to respond to food in different ways from people w ho are not stressed. Their bodies respond by depositing fat particularly round the middle, in the abdomen, rather
than lower down on hips and thighs.119-20 As we saw in Chapter 6, chronic stress affects the action of the hormone cortisol, and researchers have found differences in cortisol and psychological vulnerability to stress tests among men and women with high levels o f abdominal fat. People who accumulate fat around the middle are
at particularly high risk of obesity-associated illnesses.
The body’s stress reaction causes another problem. N ot only does it make us put on weight in the worst places, it can also increase our food intake and change our food choices, a pattern known as stress-eating or eating for comfort. In experiments with rats, when the animals are stressed they eat more sugar and fat. People who are chronically stressed tend either to over-eat and gain weight, or under-eat and lose weight. In a study in Finland, people whose eating was driven by stress ate sausages, hamburgers, pizza and chocolate, and drank more alcohol than other people.121
Scientists are starting to understand how com fort eating may be a

w ay we cope with particular changes in our physiology when we are chronically stressed, changes that go with feelings o f anxiety.122
The three obese children featured in the Sun newspaper, whom we described earlier, all seemed to have turned to com fort eating to deal with fam ily break-ups. The nine-year-old girl said, ‘Chocolate is the only thing I’m interested in. It’s the only thing I live for . . . when
I’m sad and worried I just eat.’ Her older brother gained 2 10 pounds (15 stone) in five years, after his parents divorced.
A number of years ago, the Wall Street jo u rn a l ran a series, ‘Deadly D iet’, on the nutrition problems o f Am erica’s inner cities.123 Among the overweight people they interviewed was a 1 3 -year-old girl living in a violent housing project (estate), who said that food
and T V were a w ay of calming her nerves. An unemployed wom an who knew that her diet and drinking were damaging her liver and
arteries, still figured she ‘might as well live high on the hog’ while she could. A grandmother bringing up her grandchildren because o f her daughter’s addiction to crack cocaine, said:
Before I was so upset that my daughter was on this crack I couldn’t eat. I turned to Pepsi - it was like a drug for me. I couldn’t function without it. I used to wake up with a Pepsi in my hand. A three-liter bottle would just see me through the day.
Recent research suggests that food stimulates the brains o f chronic over-eaters in just the same w ays that drugs stimulate the brains of
addicts.124-6 Studies using brain scans have shown that obese people
respond both to food and to feeling full differently from thin people.127
. . . E A T I N G ( O R N O T ) F O R S T A T U S
But food choices and diets aren’t just dictated by the w ay we feel - they’re also patterned by social factors. We make food choices for complicated cultural reasons - sometimes we like foods we grew up eating, which represent home to us, sometimes we w ant foods
that represent a lifestyle w e’re trying to achieve. We offer food to other people to show that we love them, or to show that w e’re

sophisticated, or that we can afford to be generous. Food has prob
ably alw ays played this role; it’s the necessary component o f the feast, with all o f its social meanings. But now, with the easy availability o f cheap, energy-dense foods, whatever social benefits might come from frequent feasting, they are, so to speak, outweighed by the drawbacks.
In the Wall Street Jo u rn a l’s ‘Deadly D iet’ series, a recent
immigrant from Puerto Rico describes how her fam ily used to live on an unchanging diet o f rice, beans, vegetables, pork and dried fish. Since moving to Chicago, they have enjoyed fizzy drinks, pizza, ham burgers, sugared breakfast cereals, hotdogs and ice-cream. ‘I can’t afford to buy the children expensive shoes or dresses . . . but food is
easier so I let them eat whatever they w ant.’ M ost o f all, the family enjoy going to fast-food restaurants and eat out twice a month, although the children would like to go more often. ‘We feel good when we go to those places . . . we feel like w e’re Americans, that
w e’re here and we belong here.’
A 17-year-old in N ew Jersey described how being able to buy fast food proves your financial status, shows that you have money in your pocket and are not having to wait for the welfare cheque at the end of the month.
A 37-year-old man said he spent half his wages on fast food. On the day he was interviewed he had been to M cD onalds three times
and was planning to go to Kentucky Fried Chicken and a Chinese take-out shop before the day was out. But the fast-food restaurants had a meaning for him that went well beyond the cheap food. Despite working, he was homeless and they had become his sanctuary:
He has no home of his own and shuttles between his aunt’s place in Brooklyn and a friend’s apartment in a Harlem housing project [estate]. ‘The atmosphere makes me feel comfortable and relaxed and you don’t have to rush,’ he says as he admires the hamburger restaurant’s shiny floors and the picture of George Washington Carver [a famous nineteenth- century black American] on a wall. Lulled by the soft piped-in music, he nods off for a moment and then adds: ‘ain’t no hip-hop, ain’t no profanity. The picture, the plants, the way people keep things neat here, it makes you feel like you’re in civilization.’
A member o f a Hispanic street gang eats all his meals at fast-food restaurants, boasting that he hasn’t eaten a meal at home since he
was 1 6:
Kids here don’t want to eat their mother’s food . . . everyone is tired of their mother’s food - rice and beans over and over. I wanted to live the life of a man. Fast food gets you status and respect.
F A T I S A F E M I N I N E I S S U E ?
Our own w ork, like the studies o f other researchers, shows that the relation between income inequality and obesity is stronger for women than for men. In the W orld Health Organization’s study
in twenty-six countries the social gradient in obesity is seen more
consistently, and tends to be steeper, for women than for men. In the
2003 Health Survey for England, the positive association between low socio-economic status and obesity is very clear for women but among men there is no association.128
It might be that these patterns result from obesity having a
stronger negative effect on social mobility for wom en, than for men.
M aybe obese young women suffer more discrimination in labour markets and the marriage market, than obese young men. Or maybe low social status is more of a risk factor for obesity in women than in men. T w o studies within British birth ‘cohorts’ offer some clues.
These studies are surveys o f large samples o f people born at the same time, and followed from birth. A study o f people born in 19 4 6 found that upwardly mobile men and women were less likely to be obese than those whose social class didn’t change between childhood and adulthood.129 In the 19 7 0 cohort obese women, but not men, were
more likely never to have had gainful employment and not to have a partner.130
In the U SA and in Britain, female obesity in adolescence has been linked to lower earnings in adulthood.131-2 Although not limited to women, a recent survey of more than 2,000 Human Resource professionals found that 93 per cent would favour a normal-weight
job applicant over an equally qualified overweight candidate. N early

50 per cent of these professionals felt that overweight people were
less productive; almost 33 per cent felt that obesity was a valid
reason not to hire somebody; and 40 per cent felt that overweight people lacked self-discipline.133
Although being overweight clearly hampers social mobility, our own analysis o f trends within women born in Britain in 19 7 0 suggests that this doesn’t explain the social gradient in obesity among
wom en and, even in middle age, low social class is linked to weight
gain.117
Y O U C A N N E V E R B E T O O R I C H O R T O O T H I N
Social class differences in the importance o f body size and in the body image towards which wom en aspire also seem to contribute to
the social gradient in obesity. In the past, wom en with voluptuous bodies were much admired, but in many modern, richer cultures, being thin signals high social class and attractiveness. British women in higher social classes are more likely to monitor their weight and to be dieting than women in lower social class groups, and are also more dissatisfied with their bodies.134 W omen who move down the
social scale seem to place less emphasis on thinness and are more
satisfied with their bodies. Changes in marital status also play a role: in a US study, wom en who married gained more weight than women w ho remained single or women who divorced or separated.135 And not all women want to be thin - for example in inner-city African- American communities, thinness can be associated with an image of poverty, hunger and being on welfare, as well as A ID S and drug
addiction. As one 19-year-old wom an put it:
I’ve been a voluptuous female all my life. If I start losing a lot of weight, people will think I’m on drugs . . . in the ghetto, you just can’t afford to
look too thin.
Her words are a reminder o f the ways in which social class is related to being overweight in the developing world, where only the affluent can afford to be fat. In wealthy countries, it looks as if women in

higher social classes are more likely to have aspirations to thinness and be more able to achieve them.
But while wom en’s body weight may be most affected by social factors, men are certainly not immune. A recent 12-year study of working-age men in the U SA found that if they became unemployed, they gained weight.136 When their annual income dropped they gained, on average, 5.5 lbs.
T H E T H R I F T Y P H E N O T Y P E
One additional idea that suggests a causal link between higher levels o f income inequality in a society and higher body weights is known as the ‘thrifty phenotype’ hypothesis. Put simply, this theory suggests that when a pregnant wom an is stressed, the development o f her unborn child is modified to prepare it for life in a stressful
environment. It isn’t yet clear whether stress hormones themselves do the damage, or whether stressed foetuses are less well nourished, or both things happen, but these ‘thrifty phenotype’ babies have a lower birthweight and a lower metabolic rate. In other words, they are adapted for an environment where food is scarce - they
are small and need less food. In conditions o f scarcity during our evolutionary past this adaptation would have been beneficial, but in our modern world, where stress during pregnancy is unlikely to be due to food shortages and babies are born into a world of plenty, it’s maladaptive. Babies with a thirfty phenotype in a world
where food is plentiful are more prone to obesity, to diabetes and to cardiovascular disease. As this book shows, societies with higher levels o f income inequality have higher levels o f mistrust, illness, status insecurity, violence and other stressors, so the thrifty phenotype may well be contributing to the high prevalence o f obesity in them.

T H E E Q U A L I T Y D I E T
It is clear that obesity and overweight are not problems confined to the poor. In the U S A , about i z per cent o f the population are poor,
but more than 75 per cent are overweight. In the U K , social class differences in w om en’s obesity can be seen all the w ay up the social ladder. While obesity affects only 16 per cent o f ‘higher managerial and professional’ women, just below them, 20 per cent o f lower managerial and professional women are obese. It’s hard to argue
in the face of these facts that the obesity epidemic is due to poor
nutritional knowledge among the uneducated. In a study of middle- aged British w om en,137 84 per cent knew they should be eating five fruits and vegetables each day, and another study showed that obese people are better than thinner people at guessing the calorie content
of snack foods.138Another piece o f evidence that it’ s relative, not absolute, levels of
income that matter for obesity comes from studies in which people are asked to describe subjectively their place in the social hierarchy. Researchers show subjects a diagram of a ladder and tell them that at the top are people with the highest status, and at the bottom people with the lowest status, and then ask them to place an ‘X ’ on
the ladder to mark their own standing. It has been shown that this measure of subjective social status is linked to an unhealthy pattern o f fat distribution139 and to obesity140 - in other words, obesity was more strongly related to people’s subjective sense of their status than to their actual education or income.
If we can observe that changes in societal income inequality are followed by changes in obesity, this would also be supportive evidence for a causal association. An example o f a society that has experienced a rapid increase in inequality is post-reunification Germany. After the fall of the Berlin W all, inequality increased in the
former East Germ any,141 and there is evidence from studies follow ing people over time that this social disruption led to increases in the body mass index of children, young adults and mothers.142
Health and social policies for obesity treatment and prevention tend to focus on the individual; these policies try to educate people

about the risks associated with being overweight, and try to coach them into better habits. But these approaches overlook the
reasons w h y people continue to live a sedentary lifestyle and eat an unhealthy diet, h o w these behaviours give com fort or status, w h y there is a social gradient in obesity, h o w depression and stress in pregnancy play a role. Because behaviour changes are easier for people w ho feel in control and in a good emotional state, lessening the burdens o f inequality could make an important contribution towards resolving the epidemic of obesity.

Educational performance
Our progress as a nation can be no swifter than our pro
gress in education. The human mind is our fundamental
resource.John F. Kennedy, Special message to the Congress
on Education, 20 February 19 6 1
Across the developed world, and across the political spectrum, everybody agrees about the importance o f education. It’ s good for society, which needs the contributions and economic productivity- not to mention the tax - of a skilled w orkforce, and it’s good for individuals. People with more education earn more, are more satisfied with their w ork and leisure time, are less likely to be unemployed, more likely to be healthy, less likely to be criminals, more likely to volunteer their time and vote in elections.143 In 2006, according to the US Department o f Labor, if you had been to high school but didn’t graduate with a diplom a, you earned an average of $ 4 19
per week. That sum rose to $595 if you had the diploma, up to $ 1 ,0 3 9 if you’d gone on to college and got a bachelor’s degree, and rose to over $ 1 ,2 0 0 for an advanced degree.144
T H E H O M E A D V A N T A G E
Although good schools make a difference, the biggest influence on educational attainment, how well a child performs in school and later in higher education, is fam ily background. In a report on the

/.C artoon Stock .com
n/r\


future of education in Britain, M elissa Benn and Fiona M illar
describe how:
One of the biggest problems facing British schools is the gap between rich and poor, and the enormous disparity in children’s home backgrounds and
the social and cultural capital they bring to the educational table.145, p-23
Children do better if their parents have higher incomes and more education themselves, and they do better if they come from homes where they have a place to study, where there are reference books and newspapers, and where education is valued.146 Parental involvement in children’s education is even more important.
So w hy, when all developed societies are committed to education and equality o f opportunity (at least in theory), do disadvantaged children do less well at school and miss out on the myriad benefits of education, however good the school system? As we shall see, some
societies come a lot closer to achieving equality o f opportunity than
others.
U N E Q U A L A T T A I N M E N T
Figure 8 .1 shows that international educational scores are closely related to income inequality and Figure 8.2 shows the same relationship for the U SA . M ore unequal countries and more unequal states have worse educational attainment - and these relationships are strong enough for us to be sure that they are not due to chance.
Com parable international data on educational achievement come from the Programme for International Student Assessment (PISA), which w as set up to administer standardized tests to 1 5 -year-olds in schools in different countries. The programme began in 43 countries in zooo, and assesses children every three years, typically testing between 4,500 and 10 ,0 0 0 children in each country each time; schools are randomly selected. P ISA tests 15-year-olds because they are coming to the end of com pulsory education in most countries. Each survey gives tests in reading, mathematical and scientific literacy. The goal is to test how well children can apply knowledge
and skills.

Income inequality
Figure 8.1 Maths and literacy scores o f 15-year-olds are lower in more unequal countries.148-9
Income inequality
Figure 8.z Maths and literacy scores o f eighth-graders are lower in more unequal US states.

For consistency with the data available for the U S, we combine
national average scores for reading and maths only and plot them
against income inequality (Figure 8 .1) . However, if scientific literacy scores are added in it makes little difference to the results. N o data were available for the U K from P ISA Z003, as too few schools agreed to take part in the survey to meet the P ISA standards. The
same strong international relationship with income inequality has
been shown for adult literacy scores as well, using data from the International Adult Literacy Survey.147
T o examine the same relationship among the fifty states o f the U S A , we combined maths and reading performance scores for
eighth-graders (aged around 14 years old) from the US Department
o f Education, N ational Center for Education Statistics for 2003 (Figure 8.2). The scores are significantly lower in states with wider income differences.
A s a further test, we looked at the proportion o f children dropping out of high school in the U SA . As Figure 8.3 shows, children are
much more likely to drop out o f school in more unequal states. The
Income inequality
Figure 8.3 More children drop out o f high school in more unequal US states.

states with the lowest drop-out rates are A laska, W yoming, Utah, Minnesota and N ew Hampshire, with drop-out rates around i z per cent. In three states, M ississippi, Louisiana and Kentucky, more than a quarter o f children drop out o f high school with no educational
qualifications.You might think that this striking association is due to absolute
poverty - that kids drop out o f high school more frequently in poor states, so that they can start earning sooner and contribute to the family budget. And it is true that high school drop-out rates are
higher in poor states, but poverty and inequality have independent
effects. Poverty does not explain the inequality effect. N o state has a poverty rate higher than 1 7 per cent but drop-out rates are above2.0 per cent in sixteen states and dropping out is not confined to the poor.
S T A N D A R D S O F P E R F O R M A N C E
It is often assumed that the desire to raise national standards of performance in fields such as education is quite separate from the
desire to reduce educational inequalities within a society. But the
truth may be almost the opposite o f this. It looks as if the achievement o f higher national standards o f educational performance may actually depend on reducing the social gradient in educational achievement in each country. Douglas W illms, professor o f education at the University of N ew Brunswick, Canada, has provided
striking illustrations of this.150 In Figure 8.4 we show the relation
between adult literacy scores from the International Adult Literacy Survey and their parents’ level o f education - in Finland, Belgium, the U K and the U SA .
This figure suggests that even if your parents are well educated -
and so presumably o f high social status - the country you live in
makes some difference to your educational success. But for those lower down the social scale with less well-educated parents, it makes a very much larger difference. An important point to note, looking at these four countries, is the steepness o f the social gradient - steepest
in the U SA and the U K where inequality is high, flatter in Finland

Lite
racy
sc
ore
school school higher
Parents’ education
Figure 8.4 Literacy scores in relation to parents’ education in four countries (data source: International Adult Literacy Survey).
and Belgium, which are more equal. It is also clear that an important influence on the average literacy scores - on national levels of achievement - in each o f these countries is the steepness o f the social
gradient. The U SA and U K will have low average scores, pulled down across the social gradient.
Willms has demonstrated that the pattern w e’ve shown in Figure 8.4 holds more widely - internationally among twelve developed countries, as well as among Canadian provinces and the states o f the U S A .151 As well as the tendency towards divergence -
larger differences at the bottom of the social gradient than at the top - he says ‘there is a strong inverse relationship between average proficiency levels and the slope of the socioeconomic gradients’ .
Epidemiologist Arjum and Siddiqi and colleagues have also looked at social gradients in reading literacy in 1 5 -year-olds, using data from
P ISA 2000 .152 They found that countries with a long history o f w elfare state provision did better and, like W illms, report that countries with higher average scores have smaller social differences in reading

literacy. Finland and Sweden have high average reading scores and low levels o f inequality in reading scores; Greece and Portugal have low average scores and a high degree o f inequality in reading literacy. Siddiqi and colleagues do, however, note some exceptions to this general pattern. N ew Zealand and the U K have high average
reading scores, but a high degree of social inequality in reading literacy. On the other hand N orw ay combines a rather mediocre average score with very little socio-economic inequality in reading literacy. One explanation offered by these researchers is that N ew Zealand and the U K have a greater proportion o f children w ho should sit the
tests, but do not, because they have dropped out, or are truants.
E D U C A T I O N A L W E L F A R E
Siddiqi and colleagues emphasize that high reading scores and low
social inequalities in reading literacy are found in nations ‘marked by stronger welfare provisions’ . This is a point we will return to in Chapter iz , when we look at public spending on education in relation to income inequality. But how else might income inequality
affect educational outcomes?One important connection is likely to be through the impact
of inequality on the quality of fam ily life and relationships. Social inequalities in early childhood development are entrenched long before the start o f formal education. We know a lot now about the importance o f the early years for later development - learning begins at birth and the first few years o f life are a critical period for brain
development. This early learning can be enhanced or inhibited by the environment in which a child grows up. A nationwide study in the U K found that, by the age o f three years, children from disadvantaged backgrounds were already educationally up to a year behind children from more privileged hom es.153
Essential for early learning is a stimulating social environment.
Babies and young children need to be in caring, responsive environments. They need to be talked to, loved and interacted with. They need opportunities to play, talk and explore their world, and they need to be encouraged within safe limits, rather than restricted in

their activities or punished. All o f these things are harder for parents and other care-givers to provide when they are poor, or stressed, or unsupported.
In Chapter 4 we described how the general quality of social relationships is lower in more unequal societies, and in Chapters 5
and 6 we showed how inequality is linked to poor physical and
mental health and more substance abuse. It’ s not a great leap then to think how life in a more hierarchical, mistrustful society might affect intimate, domestic relationships and fam ily life. Domestic conflict and violence, parental mental illness, poverty o f time and resources
will all combine to affect child development. The results o f these
stresses can perhaps be seen in an analysis by economists Robert Frank and Adam Levine, o f Cornell University. They showed that in the United States, counties that had the largest increases in income inequality were the same counties that experienced the largest rises
in divorce rates.154 Children living in low-income families experience
more fam ily conflict and disruption and are more likely to witness or experience violence, as well as to be living in more crowded, noisy and substandard housing155 - the quality o f the home environment is directly related to income.156 The w ay parents behave in response to relative poverty mediates its impact on children - there is evidence
that some families are resilient to such problems, while others react
with more punitive and unresponsive parenting, even to the extent of becoming neglectful or abusive.157-8 It is important, once again, to note that difficulties in fam ily relationships and parenting are not confined to the poor. Sociologist Annette Lareau describes how parenting differs between middle-class, working-class and poor families in America: there are key differences in the organization of daily life, the use of language, and the degree to which families are socially connected.159 We have found that within the U K Millennium Cohort Study, a large survey of children born in 2000 and 2 0 0 1,
even mothers in the second from the top social class group are more likely to report feeling incompetent as a parent or having a poor relationship with their children, compared to those in the topmost group.
Societies can do a lot to ameliorate the stresses on families and to support early childhood development. From the very start of life,

some societies do more than others to promote a secure attachment
between mother and infant through the provision o f paid maternity leave for mothers w ho w ork. Using data on the duration o f paid
maternity leave, provided by the Clearinghouse on International Developments in Child, Youth and Fam ily Policies at Columbia University, we found that more equal countries provided longer periods o f paid maternity leave.
Sweden provides parental leave (which can be divided between mothers and fathers) with 80 per cent wage replacement until the child is 18 months old; a further three months can be taken at a flat rate of pay, and then another three months o f unpaid leave on top of that. N orw ay gives parents (again either mother or father) a year of
leave at 80 per cent wage replacement, or forty-two weeks at 10 0 per cent. In contrast, the U SA and Australia provide no statutory entitlement to paid leave - in Australia parents can have a year of unpaid leave, in the U SA , twelve weeks.
As well as allowing parental leave, societies can improve the quality o f early childhood through the provision of family allow ances and tax benefits, social housing, health care, programmes to promote work/life balance, enforcing child support payments and,
perhaps most importantly, through the provision o f high-quality early childhood education. Early childhood education programmes can foster physical and cognitive development, as well as social and emotional development.160' 62 They can alter the long-term
trajectories of children’s lives, and cost-benefit analyses show that
they are high-yield investments. In experiments, disadvantaged children w ho have received high-quality early childhood education are less likely to need remedial education, less likely to become involved in crime, and they earn more as adults.160 All of this
adds up to a substantial return on government investments in such
programmes.

U N E Q U A L L E A R N I N G O P P O R T U N I T I E S
So far we have described ways in which greater inequality may affect children’s development through its impact on family life and relationships. But there is also evidence o f more direct effects of inequality on children’s cognitive abilities and learning.
In 2004, W orld Bank economists Karla H off and Priyanka Pandey reported the results o f a remarkable experiment.163 They took 3 2 1 high-caste and 3 2 1 low-caste r i to 12-year-old boys from scattered rural villages in India, and set them the task o f solving mazes. First, the boys did the puzzles without being aware o f each other’s caste. Under this condition the low-caste boys did just as well with the
mazes as the high-caste boys, indeed slightly better.Then, the experiment was repeated, but this time each boy was
asked to confirm an announcement o f his name, village, father’s and grandfather’s names, and caste. After this public announcement of caste, the boys did more mazes, and this time there was a large caste
gap in how well they did - the performance o f the low-caste boys dropped significantly (Figure 8.5).
This is striking evidence that performance and behaviour in an educational task can be profoundly affected by the w ay we feel we are seen and judged by others. When we expect to be viewed as inferior, our abilities seem to be diminished.
The same phenomenon has been demonstrated in experiments with white and black high-school students in America, most convincingly by social psychologists Claude Steele at Stanford University, and Joshua Aronson at N ew Y o rk University.164 In one study they administered a standardized test used for college students’ admission
to graduate programmes. In one condition, the students were told
that the test was a measure o f ability; in a second condition, the students were told that the test was not a measure o f ability. The white students performed equally under both conditions, but the black students performed much worse when they thought their abil
ity was being judged. Steele and Aronson labelled this effect ‘stereotype threat’ and it’ s now been shown that it is a general effect, which applies to sex differences as well as racial and ethnic differences.165

Num
ber
of m
azes
so
lved
6
Figure 8.5 The effect o f caste identity on performance in Indian school boys.163
Despite the w ork we mentioned on social anxiety and the effects
o f being judged negatively which we discussed in Chapter 3, it is
perhaps surprising how easily stereotypes and stereotype threats are
established, even in artificial conditions. Jane Elliott, an American schoolteacher, conducted an experiment with her students in 19 6 8 , in an effort to teach them about racial inequality and injustice.166 She told them that scientists had shown that people with blue eyes
were more intelligent and more likely to succeed than people with brown eyes, who were lazy and stupid. She divided her class into blue-eyed and brown-eyed groups, and gave the blue-eyed group extra privileges, praise and attention. The blue-eyed group quickly asserted its superiority over the brown-eyed children, treating them contemptuously, and their school performance improved. The brown-eyed group just as quickly adopted a submissive timidity, and their marks declined. After a few days, Elliott told the children she had got the information mixed up and that actually it was brown eyes that indicated superiority. The classroom situation rapidly reversed.
HI High caste
] Low caste
■■II
|___ |Caste Caste
unannounced announced

N ew developments in neurology provide biological explanations for how our learning is affected by our feelings.167 We learn best in
stimulating environments when we feel sure we can succeed. When we feel happy or confident our brains benefit from the release of dopamine, the reward chemical, which also helps with memory, attention and problem solving. We also benefit from serotonin which improves mood, and from adrenaline which helps us to perform at our best. When we feel threatened, helpless and stressed, our bodies are flooded by the hormone cortisol which inhibits our think
ing and memory. So inequalities o f the kind we have been describing in this chapter, in society and in our schools, have a direct and demonstrable effect on our brains, on our learning and educational achievement.
D I F F E R E N T S T R O K E S F O R D I F F E R E N T F O L K S
Another w ay in which inequality directly affects educational achievement is through its impact on the aspirations, norms and
values o f people who find themselves lower down the social hierarchy. While education is viewed by the middle class and by teachers and policy makers as the w ay upwards and outwards for the poor and w orking class, these values are not alw ays subscribed to by the poor and working class themselves.
In her 10 0 6 book Educational Failure and W orking Class White Children in Britain, anthropologist Gillian Evans describes the working-class culture of Bermondsey, in east London.168 She shows how the kinds o f activities expected of children in schools fit with the w ay middle-class parents expect their children to play and interact at home, but clash with the w ay in which working-class families care for, and interact with, their children. To a degree, working-class people resist the imposition o f education and middle-class values, because becoming educated would require them to give up ways of being that they value. One wom an tells Evans that being ‘com mon’ means ‘knowin’ ’ow to ’ave a good laugh ’cos you ’re not stuck up’ . The things that the women she describes like to talk about are their

families, their health, w ork and ways to get money, housework, relationships, shopping, sex and gossip. Talking about abstract ideas, books and culture, is seen as posh and pretentious. The children o f these working-class mothers are constrained by minimal rules in their homes. Evans describes children who are allowed to eat
and drink what they like, when they like; to smoke at home; to do
hom ework or not, as they please. ‘If they want to learn, they will, if they don’t, they w on ’t and that’s that.’ O f course these families want the best for their children, but that ‘best’ isn’t alw ays ‘education, education, education’ .
That poor and working-class children resist formal education and
middle-class values does not, o f course, mean that they have no aspirations or ambitions. In fact, when we first looked at data on children’s aspirations from a U N IC E F report on childhood w ellbeing,110 we were surprised at its relationship to income inequality (Figure 8.6). M ore children reported low aspirations in more equal
countries; in unequal countries children were more likely to have high aspirations. Some of this may be accounted for by the fact that in more equal societies, less-skilled w ork may be less stigmatized,
Income inequality
Figure 8.6 Aspirations o f 1 5 -year-olds and inequality in rich countries.

in comparison to more unequal societies where career choices are dominated by rather star-struck ideas o f financial success and images o f glamour and celebrity.
In more unequal countries, we found a larger gap between aspirations and actual opportunities and expectations. If we compare Figure 8 .1 on maths and reading scores in different countries to Figure 8.6, it is clear that aspirations are higher in countries where educational achievement is lower. M ore children might be aspiring to higher-status jobs, but fewer o f them will be qualified to get them. If inequality leads to unrealistic hopes it must also lead
to disappointment.Gillian Evans quotes a teacher at an inner-city prim ary school,
who summed up the corrosive effect o f inequality on children:
These kids don’t know they’re working class; they won’t know that until
they leave school and realize that the dreams they’ve nurtured through childhood can’t come true.168
In the next two chapters w e’ll show how young women and young men in more unequal societies respond to their low social status, and in Chapter 1 1 w e’ll return to the theme of education and life chances
when we examine the impact o f inequality on social mobility.

"Is this birds and bees chat going to take long? I'm late for my pre-natal class. "

Teenage births: recycling deprivation
Just saying ‘N o’ prevents teenage pregnancy the way ‘Have a nice day’ cures chronic depression.
Faye Wattleton, Conference speech, Seattle, 1988
In the summer o f zoo 5, three sisters hit the headlines o f Britain’s tabloid newspapers - all three were teenage mothers. The youngest was the first o f the girls to become pregnant and had her baby at the age o f 12 . ‘We were in bed at my mum’s house messing around and sex just sort o f happened,’ she said; ‘ I didn’t tell anyone because I was too scared and didn’t know what to do . . . I wish it had happened to someone else.’ 169 Soon after, the next older sister had a baby at age 14 . ‘It was just one o f those things. I thought it would never happen to m e,’ she said. ‘At first I wanted an abortion because I didn’t want to be like [my sister], but I couldn’t go through with it.’ The oldest sister, the last o f the girls to find out she was pregnant, gave birth aged 16 ; unlike her sisters she seemed to welcome motherhood. ‘I left school . . . as I w asn ’t really interested,’ she admitted, ‘all my friends were having babies and I wanted to be a mum, too ’ . At the time their stories became news, the girls were all living at home with their mother, sharing their bedrooms with their babies, the youngest two struggling with school, and all three trying to get by on social security benefits. With no qualifications and no support from the fathers o f their babies, their futures were bleak. Media
commentators and members of the public were quick to condemn the sisters and their mother, portraying them as feckless scroungers. ‘Meet the kid sisters . . . benefit bonanza’ . . . ‘ G irls’ babies are the

real victim s,’ exclaimed the newspapers.170-71 Their mother blamed the lack o f sex education in school.
W H Y I T M A T T E R S
The press furore brings society’s fears and concerns around teenage motherhood into sharp focus. Often described as ‘ babies having babies’ , teenage motherhood is seen as bad for the mother, bad for
the baby and bad for society.
There is no doubt that babies born to teenage mothers are more
likely to have low birthweight, to be born prematurely, to be at higher risk of dying in infancy and, as they grow up, to be at greater risk o f educational failure, juvenile crime and becoming teenage parents themselves.172-3 Girls who give birth as teenagers are more
likely to be poor and uneducated. But are all the bad things associ
ated with teenage birth really caused by the age o f the mother? Or are they simply a result o f the cultural w orld in which teenage mothers give birth?
This issue is hotly debated. On the one hand, some argue that teenage motherhood is not a health problem because young age is
not in itself a cause o f worse outcomes.174 In fact, among poor African-Am ericans, cumulative exposure to poverty and stress across their lifetimes compromises their health to such an extent that their babies do better if these women have their children at a young
age.175-6 This idea is known as ‘weathering’ and suggests that, for
poor and disadvantaged women, postponing pregnancy until later ages doesn’t actually mean that they have healthier babies. Others have shown that the children o f teenage mothers are more likely to end up excluded from mainstream society, with worse physical
and emotional health and more deprivation. This is true even after
taking account of other childhood circumstances such as social class, education, whether the parents were married or not, the parents’ personalities, and so on.177 But although we can sometimes separate out the influences o f maternal age and economic circumstances in research studies, in real life they often seem inextricably intertwined

and teenage motherhood is associated with an inter-generational cycle o f deprivation.178
But how exactly are young wom en’s individual experiences and choices - their personal choices about sleeping with their boyfriends, choices around contraception and abortion, choices about qualifications and careers, shaped by the society they live in? Like the issues discussed in earlier chapters, the teenage birth rate is strongly related to relative deprivation and to inequality.
B O R N U N E Q U A L
There are social class differences in both teenage conceptions and births but the differences are smaller for conceptions than for births, because middle-class young women are more likely to have abortions. Teenage birth rates are higher in communities that also have high divorce rates, low levels of trust and low social cohesion, high unemployment, poverty, and high crime rates. 173 It has been suggested by others that teenage motherhood is a choice that women make when they feel they have no other prospects for achieving the social credentials of adulthood, such as a stable intimate relationship or rewarding employment. 179 Sociologist Kristin Luker claims that it is ‘the discouraged among the disadvantaged’ who become teenage mothers. 180
But it is important to remember that it isn’t only poor young
women who become teenage mothers: like all the problems we have
looked at, inequality in teenage birth rates runs right across society. In Figure 9 .1 , we show the percentage of young British women who become teenage mothers in relation to household income. Each year almost 5 per cent of teenagers living in the poorest quarter o f homes have a first baby, four times the rate in the richest quarter. But even
in the second richest quarter o f households the rate is double that of the richest quarter (2.4 per cent and 1 .2 per cent). Similar patterns are seen in the United States. Although most o f these births are to older teenagers, aged 1 8 - 1 9 years, the pattern is evident, and even stronger, for the 15 -17 -y e a r-o ld s .

_G
I 4
c uH 2
4.8%
''
■ i ®
2 .9%
z.4%
i.z%
________1Poorestquarter
Household income
Richestquarter
Figure 9 .1 There is a gradient in teenage birth rates by household income, from poorest to richest.m
•h— -—----- ----------------------------------------------------------------------Low High
Income inequality
Figure 9.2 Teenage birth rates are higher in more unequal countries.185

Figure 9 .2 shows that the international teenage birth rates provided by U N IC E F 182 are related to income inequality and Figure
9.3 shows the same relationship for the fifty states o f the U SA , using teen pregnancy rates from the US National V ital Statistics System183 and the Alan Guttmacher Institute.184 There is a strong tendency for more unequal countries and more unequal states to have higher teenage birth rates - much too strong to be attributable to chance.
The U N IC E F report on teenage births showed that at least one
and a quarter million teenagers become pregnant each year in the rich O E C D countries and about three-quarters o f a million go on to become teenage m others.182 The differences in teen birth rates between countries are striking. The U SA and U K top the charts.
A t the top of the league in our usual group o f rich countries, the
U SA has a teenage birth rate of 5 2 .1 (per 1,0 0 0 women aged 1 5 - 1 9 ) , more than four times the EU average and more than ten times higher than that of Japan, which has a rate o f 4.6.
Rachel Gold and colleagues have studied income inequality and teenage births in the USA, and shown that teen birth rates are
Income inequality
Fgure 9.3 Teenage pregnancy rates are higher in more unequal US states.

highest in the most unequal, as well as the most relatively deprived counties. She also reported that the effect of inequality was strongest for the youngest mothers, those aged 1 5 - 1 7 years.186 For the US states, we show data for live births and abortions combined. There
are substantial differences in pregnancy rates between US states.
Mississippi has a rate close to twice that of Utah.We might expect patterns of conceptions, abortions and births to
be influenced by factors such as religion and ethnicity. W e’d expect predominantly Catholic countries to have high rates o f teenage births, because of low rates o f abortion. But, while predominantly
Catholic Portugal and Ireland have high rates that would indeed
fit this alternative explanation, Italy and Spain have unexpectedly low rates, although they are also predominantly Catholic. Within countries, different ethnic groups can have different cultures and values around sexuality, contraception, abortion, early marriage
and wom en’s roles in society. In the U SA , for example, Hispanic
and African-Am erican girls are almost twice as likely to be teenage mothers as white girls, and in the U K similarly, com paratively high rates are seen in the Bangladeshi and Caribbean communities.182 But, because these communities are minority populations, these differ
ences don’t actually have much impact on the ranking o f countries
and states by teenage pregnancy or birth rates, and so don’t affect our interpretation o f the link with inequality.
But hidden within the simple relationships revealed in Figures 9.2 and 9.3 are the real-life complexities o f what it means to be a teenage mother in any particular country. For example, in Japan,
Greece and Italy, more than half o f the teenagers giving birth are
married - in fact in Japan , 86 per cent o f teen mothers are married, whereas in the U SA , the U K and N ew Zealand, less than a quarter o f these mothers are m arried.182 So not only do these latter countries have higher overall rates o f teen births, but those births are more
likely to be associated with the broad range o f health and social
problems that we think o f as typical consequences o f early motherhood - problems that affect both the mother and the child. Within the U S A , Hispanic teenage mothers are more likely to be married than those from other ethnic groups, but they are also more likely to
be poor;187-8 the same is true for Bangladeshis in the U K .

So what do we know about who becomes a teenage mother that can help us understand this particular effect o f inequality?
T H E F A S T L A N E T O A D U L T H O O D
Interestingly, there is not much of a connection between teenage
birth rates and birth rates for women of all ages in rich countries.
The most unequal countries, the U S, U K , N ew Zealand and
Portugal, have much higher teenage birth rates relative to older wom en’s birth rates than the more equal countries, such as Japan, Sweden, N orw ay and Finland, which have teenage birth rates
that are lower relative to the rates o f birth o f older w om en.182 So
whatever drives teenage birth rates up in more unequal countries is unconnected with the factors driving overall fertility. Unequal societies affect teenage childbearing in particular.
A report from the Rowntree Foundation called Young P eople ’s Changing Routes to Independence, which compares how children born in 19 5 8 and 19 7 0 grew up, describes a ‘widening gap between
those on the fast and the slow lanes to adulthood’ .189 In the slow lane, young people born into families in the higher socio-economic classes spend a long time in education and career training, putting off marriage and childbearing until they are established as successful adults. For young people on the fast track, truncated education often
leads them into a disjointed pattern o f unemployment, low-paid w ork and training schemes, rather than an ordered, upward career trajectory.
As sociologists H ilary Graham and Elizabeth M cDerm ott point out, teenage motherhood is a pathw ay through which women
become excluded from the activities and connections o f the wider society, and a w ay in which generations become trapped by inequality.190 But as well as the constraints that relative poverty imposes on life chances for young people, there seem to be additional reasons w hy teenage motherhood is sensitive to degrees o f inequality in society.

E A R L Y M A T U R I T Y A N D A B S E N T F A T H E R S
The first o f these additional reasons was touched on in Chapter 8,
where we discussed the impact o f inequality on fam ily relationships
and stress in early life. Experiences in early childhood may be just as relevant to teenage motherhood as the educational and economic opportunities available to adolescents. In 19 9 1 , psychologist Ja y Belsky at the University o f London and his colleagues proposed a theory, based on evolutionary psychology, in which experiences in
early childhood would lead individuals towards either a quantity or a quality reproductive strategy, depending on how stressful their early experiences had been.191 They suggested that people who learned, while growing up, ‘to perceive others as untrustworthy, relationships as opportunistic and self-serving, and resources as
scarce and/or unpredictable’ would reach biological maturity earlier,
be sexually active earlier, be more likely to form short-term relationships and make less investment in parenting. In contrast, people who grow up learning ‘ to perceive others as trustworthy, relationships as enduring and mutually rewarding and resources more or less
constantly available’ would mature later, defer sexual activity, be
better at forming long-term relationships and invest more heavily in
their children’s development.In the w orld in which humans evolved, these different strategies
make sense. If you can’t rely on your mate or other people, and you
can’t rely on resources, then it may once have made sense to get
started early and have lots o f children - at least some will survive.
But if you can trust your partner and family to be committed to you and to provide for you, it makes sense to have fewer children and to devote more attention and resources to each one.
Rachel Gold and colleagues found that the relationship between
inequality and teenage birth rates in the U SA might be acting
through the impact o f inequality on social capital, which we discussed in Chapter 4 .192 Among US states, that is, those with lower levels of social cohesion, civic engagement and mutual trust - exactly

the conditions which might favour a quantity strategy - teenage birth rates are higher.
Several studies have also shown that early conflict and the absence o f a father do predict earlier maturation - girls in such a situation become physically mature and start their periods earlier than girls w ho grow up without those sources o f stress.193-4 And reaching
puberty earlier increases the likelihood o f girls becoming sexually
active at an early age and o f teenage m otherhood.195Father absence may be particularly important for teenage preg
nancy. In a study o f two large samples in the U SA and N ew Zealand, psychologist Bruce Ellis and his colleagues followed girls
from early childhood through to adulthood.196 In both countries,
the longer a father was absent from the fam ily, the more likely it
was that his daughter would have sex at a young age and become a teenage mother - and this strong effect could not be explained away by behavioural problems o f the girls, by fam ily stress, parenting style, socio-economic status, or by differences in the neighbourhoods
in which the girls grew up. So there may be deep-seated adaptive processes which lead from more stressful and unequal societies - perhaps particularly from low social status - to higher teenage birth rates. Unfortunately, while we can obtain international data on single-parent households, being a single parent means very different
things in different countries, and there are no international data that
tell us how many fathers are absent from their children’s lives.
W H A T A B O U T T H E D A D S ?
Throughout this chapter, w e’ve been discussing the problem of teenage parenting exclusively in terms of teenage mothers, but what about the fathers? Let’s return to the story of the three sisters. The father o f the 12-year-old girl’s baby left her shortly after his son was born. The boy named by the middle sister as the father of her little girl denied having sex with her and demanded a paternity test. And the 38-year-old father o f the oldest sister’s baby already had at least four other children.

Sociologists Graham and M cDerm ott discuss what has been learned from studies where researchers talk at length to young women about their experiences. W hat they show is that these sisters’
experiences with their babies’ fathers are typical.190 M otherhood is a w ay in which young women in deprived circumstances join adult social networks - networks which usually include their own mothers and other relatives, and these supportive networks help them transcend the social stigma of being a teenage mother. According to Graham and M cDerm ott, young women prioritize their relationships with the babies, over their often difficult relationships with the
babies’ fathers, because they feel this relationship is a ‘more certain source of intimacy than the heterosexual relationships they had . . . experienced’ .
Young men living in areas of high unemployment and low wages often can’t offer much in the w ay o f stability or support. In com
munities with high levels o f teenage motherhood, young men are
themselves trying to cope with the many difficulties that inequality inflicts on their lives, and young fatherhood adds to those stresses.

I O
Violence: gaining respect
Where justice is denied, where poverty is enforced, where ignorance prevails and where any one class is made to
feel that society is in an organized conspiracy to oppress, rob and degrade them, neither persons nor property will be safe.
Frederick Douglas, Speech on the 24th anniversary of emancipation, Washington, DC, 1886
As we began to write this chapter, violence w as in the headlines on both sides o f the Atlantic. In the U SA , an 1 8-year-old man with a shotgun entered a shopping mall in Salt Lake C ity, Utah, killing five
people and wounding four others, apparently at random, before
being shot dead by police. In the U K , there w as a wave o f killings in South London, including the murder o f three teenage boys in less than a fortnight. But perhaps the story that best illustrates what this chapter is about occurred in M arch 2006, in a quiet suburb o f Cincinnati, Ohio. Charles M artin, a 66-year-old, telephoned the
emergency services.197 ‘I just killed a kid,’ he told the operator, ‘I shot him with a goddamn 4 10 shotgun twice.’ M r M artin had shot his 15-year-old neighbour. The boy’s crime? He had run across M r M artin ’s lawn. ‘K id ’s just been giving me a bunch o f shit, making the other kids harass me and my place.’
Violence is a real w orry in many people’s lives. In the most recent British Crime Surveys, 35 per cent o f people said they were very worried or fairly worried about being a victim o f mugging, 33 per cent worried about physical attack, 24 per cent worried about rape,

"A n d f in a lly , w o u ld y o u sa y y o u r fe a r o f c r im e h a d in c re a se d ? "

and 13 per cent worried about racially motivated violence. M ore
than a quarter of the people who responded said they were worried about being insulted or pestered in public.198 Surveys in America and Australia report similar findings - in fact fear of crime and violence may be as big a problem as the actual level o f violence. Very few
people are victims o f violent crime, but fear of violence affects the
quality o f life of many more. Fear of violence disproportionately affects the vulnerable - the poor, women and minority groups.199 In many places, wom en feel nervous going out at night or coming home late; old people double-lock their doors and w on ’t open them to strangers. These are important infringements o f basic human
freedoms.People’s fears o f crime, violence and anti-social behaviour don’t
alw ays match up with rates and trends in crime and violence. A recent down-swing in homicide rates in America (which has now ended), was not matched by a reduction in people’s fear o f violence. We will return to recent trends later. First, let’ s turn our attention
to differences in rates of actual violence between different societies and look at some of the similarities and the differences between them.
In some w ays patterns o f violence are rem arkably consistent across time and space. In different places and at different times, violent acts are overwhelmingly perpetrated by men, and most o f those men are in their teens or early twenties. In her book, The A nt and the Peacock, philosopher and evolutionary psychologist Helena Cronin shows how closely correlated the age and sex characteristics
o f murderers are in different places.200 We reproduce her graph
showing murder rates, comparing Chicago with England and Wales (Figure 10 .1 ) . The age of the perpetrator is shown along the bottom; up the side is the murder rate, and there are separate lines for men and women. It is immediately apparent that murder rates peak in the late teens and early twenties for men, and that rates for women are much lower at all ages. The age and sex distribution is astonishingly
similar both in Chicago and in England and W ales. H ow ever, what is less obvious is that the scales on the left- and right-hand sides of the graph are very different. On the left-hand side o f the graph, the scale shows homicide rates per million people in England and

England and Wales Chicago
- 9 0 0- 8 0 0 - 7 0 0- 6 0 0
- 5 0 0 - 4 0 0 - 3 0 0 - 2 0 0 - 1 0 0 -o
,s°> y * I ? t f ' 1 ? & t? S1* b*' <o°> A°l tblx^ y ./ y ./v y .s~ y * .sk j >./> ./■ .a
Age of perpetrator (years)
Figure ro.r Homicides by age and sex o f perpetrator. England and Wales compared with Chicago.100
W ales, going from zero to 30. On the right-hand side, the scale
shows homicide rates in Chicago, and here the scale runs from zero to 900 murders per million. Despite the striking similarities in the patterns o f age and sex distribution, there is something fundamentally different in these places; the city o f Chicago had a murder rate
30 times higher than the rate in England and W ales. On top o f the
biological similarities there are huge environmental differences.Violent crimes are almost unknown in some societies. In the U SA ,
a child is killed by a gun every three hours. Despite having a much lower rate than the U SA , the U K is a violent society, compared to many other countries: over a million violent crimes were recorded in
2 0 0 5 -2 0 0 6 . And within any society, while it is generally young men
who are violent, most young men are not. Just as it is the discouraged and disadvantaged among young women who become teenage mothers, it is poor young men from disadvantaged neighbourhoods who are most likely to be both victims and perpetrators o f violence.Why?

‘ i f y o u a i n ’ t g o t p r i d e , Y O U G O T N O T H I N G . ,201’ p 29
Jam es Gilligan is a psychiatrist at H arvard M edical School, where
he directs the Center for the Study o f Violence, and has worked on
violence prevention for more than thirty years. He was in charge of
mental health services for the Massachusetts prison system for many years, and for most o f his years as a clinical psychiatrist he worked with the most violent of offenders in prisons and prison mental hospitals. In his books, Violence202 and Preventing V io len ce,201 he
argues that acts o f violence are ‘attempts to ward o ff or eliminate the feeling o f shame and humiliation - a feeling that is painful, and can even be intolerable and overwhelming - and replace it with its opposite, the feeling o f pride’ . Time after time, when talking to men who had committed violent offences, he discovered that the triggers
to violence had involved threats - or perceived threats - to pride,
acts that instigated feelings of humiliation or shame. Sometimes the incidents that led to violence seemed incredibly trivial, but they all evoked shame. A young neighbour walking disrespectfully across your immaculate lawn . . . the popular kids in the school harassing
you and calling you a faggot . . . being fired from your job . . . your
wom an leaving you for another man . . . someone looking at you ‘funny’ . . .
Gilligan goes so far as to say that he has ‘yet to see a serious act of violence that was not provoked by the experience of feeling shamed and humiliated . . . and that did not represent the attempt to . . .
undo this “ loss o f face’” .202’ p- 110 And we can all recognize these feelings, even if we would never go so far as to act on them. We recognize the stomach-clenching feelings of shame and em barrassment, the mortification that we feel burning us up when we make ourselves look foolish in the eyes of others. We know how important it is to feel liked, respected, and valued.203 But if all o f us feel these things, w hy is it predominantly among young men that those feelings escalate into violent acts?
Here the w ork o f evolutionary psychologists M argo W ilson and M artin D aly helps to make sense o f these patterns o f violence. In

their 1988 book H om icide204 and a wealth of books, chapters and articles since, they use statistical, anthropological and historical
data to show how young men have strong incentives to achieve and
maintain as high a social status as they can - because their success in sexual competition depends on status.77’ 205-8 While looks and physical attractiveness are more important for women, it is status that matters most for sexual success among men. Psychologist David Buss found that women value the financial status o f prospective partners roughly twice as much as men do.209 So while women try to enhance their sexual attractiveness with clothes and make-up, men compete for status. This explains not only why feeling put down, disrespected and humiliated are the most common trigger for violence; it also explains why most violence is between men - men have more to win or lose from having (or failing to gain) status. Reckless, even violent behaviour comes from young men at the
bottom of society, deprived o f all the markers o f status, who must struggle to maintain face and w hat little status they have, often reacting explosively when it is threatened.
But while it seems clear that the propensity for violence among young men lies partially in evolved psychological adaptations related
to sexual competition, most men are not violent. So what factors explain why some societies seem better than others at preventing or controlling these impulses to violence?
I N E Q U A L I T Y IS ‘ S T R U C T U R A L ’ V I O L E N C E
The simple answer is that increased inequality ups the stakes in the competition for status: status matters even more. The impact of
inequality on violence is even better established and accepted
than the other effects of inequality that we discuss in this book.203 In this chapter we show relationships between violence and inequality for the same countries and the same time period as we use in other chapters. M any similar graphs have been published by other
researchers, for other time periods or sets o f countries, including
one covering more than fifty countries between 19 7 0 and 19 9 4 from

researchers at the W orld Bank.207-210 A large body o f evidence shows a clear relationship between greater inequality and higher homicide rates. As early as 19 9 3 , criminologists Hsieh and Pugh wrote a review which included thirty-five analyses o f income inequality and violent crime.211 All but one found a positive link between the two -
as inequality increased so did violent crime. Homicides and assaults
were most closely associated with income inequality, and robbery and rape less so. We have found the same relationships when looking at more recently published studies.10 Homicides are more common in the more unequal areas in cities ranging from M anhattan to
Rio de Janeiro, and in the more unequal American states and cities
and Canadian provinces.Figure 10.2. shows that international homicide rates from the
United Nations Surveys on Crim e Trends and the Operations o f Crim inal Justice Systems212 are related to income inequality, and Figure 10 .3 shows the same relationship for the U SA , using homicide
rates from the Federal Bureau of Investigation.213 The differences
between some countries in the first graph are very large. The U SA is
Income inequality
Figure 10 .2 Homicides are more common in more unequal countries.

Income inequality
Figure 10 .3 Homicides are more common in more unequal US states.
once again at the top o f the league table of the rich countries. Its
murder rate is 64 per million, more than four times higher than the U K ( 15 per million) and more than twelve times higher than Japan, which has a rate o f only 5 .2 per million. T w o countries take rather unusual positions in this graph, compared to where they sit in many
o f our other chapters: Singapore has a much lower homicide rate
than we might expect, and Finland has a higher rate. Interestingly, although international relationships between gun ownership and violent crime are complicated (for instance, gun ownership is linked to murders involving female victims but not male victims),214 in the United Nations International Study on Firearm Regulation, Finland
had the highest proportion o f households with guns, and Singapore
had the lowest rate o f gun ownership.215 Despite these exceptions, the trend for more unequal countries to have higher homicide rates is well established.
In the U SA , although no data were available for W yoming, the relationship between inequality and homicides is still significant and
the differences between states are almost as great as the differences

between countries. Louisiana has a murder rate o f 10 7 per million,
more than seven times higher than that of N ew Hampshire and
Iow a, which are bottom of the league table with murder rates of 15 per million. The homicide rate in A laska is much higher than we would expect, given its relatively low inequality, and rates in N ew Y ork , Connecticut and M assachusetts are lower. In the United States, two out o f every three murders are committed with guns, and
homicide rates are higher in states where more people own guns.216 Am ong the states on our graph, A laska has the highest rate of gun ownership o f all, and N ew Y ork , Connecticut and M assachusetts are among the lowest.217 If we allow for gun ownership, we find a slightly stronger relationship between inequality and homicides.
H A V E N S I N A H E A R T L E S S W O R L D
We have already seen some features o f more unequal societies that help to tie violence to inequality - fam ily life counts, schools and neighbourhoods are important, and status competition matters.
In Chapter 8 we mentioned a study which found that divorce rates are higher in more unequal American counties. In his book, Life W ithout Father, sociologist D avid Popenoe describes how 60 per cent of Am erica’s rapists, 72 per cent o f juvenile murderers and
70 per cent of long-term prisoners grew up in fatherless homes.218 The effect of fatherlessness on delinquency and violence is only partly explained by these families being poorer. W hy do fathers matter so much?
One researcher has described the behaviour of boys and young men who grow up without fathers as ‘hypermasculine’ , with boys
engaging in ‘rigidly overcompensatory masculine behaviors’219, pp- 1-2- crimes against property and people, aggression and exploitation and short-term sexual conquests. This could be seen as the male version of the quantity versus quality strategy in human relationships that we described in relation to teenage mothers in Chapter 9.
The absence o f a father may predispose some boys to a different reproductive strategy: shifting the balance aw ay from long-term relationships and putting more emphasis on status competition.

Fathers can, o f course, act as positive role models for their sons. Fathers can teach boys, just by being present in the fam ily, the positive aspects o f manhood - how to relate to the opposite sex, how to be a responsible adult, how to be independent and assertive, yet
included with, and connected to, other people. Particularly import
ant is the w ay in which fathers can provide authority and discipline for teenage boys; without that security, young men are more influenced by their peers and more likely to engage in the kinds o f anti-social behaviour so often seen when groups o f young men get together. But fathers can also be negative role models. One study
found that, although children had more behavioural problems the
less time they had lived with their fathers, this was not true when the fathers themselves had behavioural problems.220 If the fathers engaged in anti-social behaviour, then their children were at higher risk when they spent m ore time living with them.
Perhaps most importantly, fathers love their children in a w ay that
studies show step-parents do not. This is not, o f course, to say that most step-fathers and other men don’t lovingly raise other men’s children, but on average children living with their biological fathers are less likely to be abused, less likely to be delinquent, less likely
to drop out o f school, less likely to be em otionally neglected. Psy
chiatrist Gilligan says o f the violent men he worked with201’ ?-36:
They had been subjected to a degree of child abuse that was off the scale of anything I had previously thought of describing with that term. Many had been beaten nearly to death, raped repeatedly or prostituted, or neglected to a life-threatening degree by parents too disabled to care for
their child. And of those who had not experienced these extremes of physical abuse or neglect, my colleagues and I found that they had experienced a degree of emotional abuse that had been just as damaging . . . in which they served as the scapegoat for whatever feelings of shame
and humiliation their parents had suffered and then attempted to rid themselves of by transferring them onto their child, by subjecting him to systematic and chronic shaming and humiliation, taunting and ridicule.
The increased fam ily breakdown and fam ily stress in unequal societies leads to inter-generational cycles o f violence, just as much as inter-generational cycles of teenage motherhood.

O f course it isn’t just the fam ily environment that can breed shame, humiliation and violence. Children experience things in their schools and in their neighbourhoods that influence the probability
that they will turn to violence when their status is threatened. The American high-school massacres have shown us the significance of bullying as a trigger to violence.221-2
In U N IC E F ’s 2007 report on child wellbeing in rich countries, there are measures o f how often young people in different countries were involved in physical fighting, had been the victim of bullying,
or found their peers were not ‘kind and helpful’ .110 We combined these three measures into an index o f children’s experiences of conflict and found that it w as significantly correlated with income inequality, as shown in Figure 10 .4 . In more unequal societies children experience more bullying, fights and conflict. And there is
no better predictor o f later violence than childhood violence.
Environmental influences on rates o f violence have been
Income inequality
Figure 10.4 There is more conflict between children in more unequal countries (based on percentages reporting fighting, bullying and finding peers not kind and helpful).

recognized for a long time. In the 19 40 s, sociologists o f the Chicago
School described how some neighbourhoods had persistent reputa
tions for violence over the years - different populations moved in and out but the same poor neighbourhoods remained dangerous, whoever was living in them.223 In Chicago, neighbourhoods are often identified with a particular ethnic group. So a neighbourhood which
might once have been an enclave o f Irish immigrants and their
descendants later becomes a Polish community, and later still a Latino neighbourhood. W hat the Chicago school sociologists drew attention to was the persistent effect of deprivation and poverty in poor neighbourhoods - on whoever lived there. In neighbourhoods
where people can’t trust one another, where there are high levels
o f fear and groups o f youths hanging around on street corners, neighbours w on ’t intervene for the common good - they feel helpless in the face o f public disturbance, drug dealing, prostitution, graffiti and litter. Sociologist Robert Sampson and colleagues at H arvard University have shown that violent crime rates are lower in cohesive
neighbourhoods where residents have close ties with one another and are willing to act for the common good, even taking into account factors such as poverty, prior violence, the concentration o f immigrants and residential stability.224 In the U SA poor neighbourhoods have become ghettos, ring-fenced and neglected by the
better-off who move out.225Although neighbours in areas with low levels o f trust (see Chap
ter 4) may feel less inclined to intervene for the common good, they seem to be more pugnacious. In B ow lin g A lone, sociologist Robert Putnam linked a measure o f aggression to levels o f social capital in US states. In a survey, people were asked to say whether they agreed
or disagreed with the sentence: ‘I ’d do better than average in a fist fight.’ Putnam says citizens in states with low social capital are ‘readier for a fight (perhaps because they need to be), and they are predisposed to mayhem’ .25’ p- 310 When we analyse this measure of pugnacity in relation to inequality within states, we find just as strong a relation as Putnam showed with social capital (Figure 10 .5 ).
So violence is most often a response to disrespect, humiliation and loss o f face, and is usually a male response to these triggers. Even within the most violent o f societies, most people don’t react violently

Income inequality
Figure 10.5 In less equal states more people think they would do better than average in a fist fight.
to these triggers because they have ways o f achieving and maintain
ing their self-respect and sense o f status in other ways. They might
have more o f the trappings o f status - a good education, nice houses and cars, good jobs, new clothes. They may have fam ily, friends and colleagues who esteem them, or qualifications they are proud of, or skills that are valued and valuable, or education that gives them status and hope for the future. As a result, although everybody experiences disrespect and humiliation at times, they don’t all
become violent; we all experience loss o f face but we don’t turn round and shoot somebody. In more unequal societies more people lack these protections and buffers. Shame and humiliation become more sensitive issues in more hierarchical societies: status becomes more important, status competition increases and more people are
deprived o f access to markers o f status and social success. And if your source o f pride is your immaculate lawn, you ’re going to be more than a bit annoyed when that pride gets trampled on.

P E A K S A N D T R O U G H S
Homicide rates in Am erica, after rising for decades, peaked in the early 1990s, then fell to their lowest level in the early zooos. In Z005, they started to rise again.226 Similarly, after peaking in the early 1990s, teenage pregnancy and birth rates began to fall in America, and the decline was particularly steep for African-Am ericans.227 But in zoo6, the teenage birth rate also started to rise again, and the biggest reversal was for African-Am erican wom en.228
Some people have tried to explain the decline in violence by pointing to changes in policing or drug use or access to guns, or even the ‘missing’ cohort o f young men w ho were not born because of increased access to abortion. Explanations for the fall in teenage birth rates focused on changes in the number o f teenagers who are
sexually active and increasing contraceptive use. But what influences
whether or not young people use drugs, buy guns, have sex or use contraception? W hy are homicides and teenage births now rising again? And how do these trends match up with changes in inequality? W hy have homicides and teenage births moved in parallel?
To examine this in more detail, we need data on recent short-term
fluctuations in overall income inequality in the U SA . The best data come from a collaborative team of researchers from the U SA , China and the U K , who have produced a series o f annual estimates.229 These show inequality rising through the 1980 s to a peak in the
early 1990s. The following decade saw an overall decline in in
equality, with an upturn since zooo. So there is a reasonable match between recent trends in homicides, teenage births and inequality - rising through the early 1990 s and declining for a decade or so, with a very recent upturn.
Although violence and teenage births are com plex issues and rates
in each can respond to lots o f other influences, the dow nward trends through the 1990 s were consistent with improvements in the relative incomes o f people at the very bottom o f the income distribution. The distribution o f income can be more stretched out over some parts of its range than others. A society may get more unequal because the poor are getting left further behind the middle, or because the rich

are pulling further ahead. And who suffers from low social status may also vary from one society to another. Among societies with the
same overall level o f inequality, in one it may be the elderly who
are most deprived relative to the rest o f society, in another it may be ethnic minority groups.
From the early 1990 s in America there was a particularly dramatic decline in relative poverty and unemployment for young people at
the bottom of the social hierarchy. Although the rich continued to
pull further aw ay from the bulk of the population, from the early 1990s the relative position o f the very poorest Americans began to improve.230-31 As violence and teenage births are so closely connected to relative deprivation and concentrated in the poorest areas,
it is what happens at the very bottom that matters most - hence the
trends in violence and teenage births.232These trends, during the 1990s, contrast with what had been
happening previously. The decades leading up to the 1990 s saw a long sustained deterioration in opportunities and status for young people at the bottom of both American and British society. In
the U S A , from about 19 7 0 through the early 1990 s, the earning position o f young men declined, and employment prospects for young people who dropped out of high school or who completed high school but didn’t go on to college worsened,233 and violence and teenage births increased. In a recent study, demographer Cynthia
Colen and her colleagues showed that falling levels of unemployment during the 19 9 0 s explained 85 per cent of the decline in rates of first births to 18 -19 -y e a r-o ld African-Am ericans.234 This w as the group experiencing the biggest drop in teen births. W elfare reform and changes in the availability o f abortion, in contrast, appeared to
have had little impact.In the U K , the impact o f the economic recession and widening
income differences during the 1980 s can also be traced in the homicide rate. As health geographer Danny Dorling pointed out, with respect to these trends:235, pp- 36-7
There is no natural level of murder . . . For murder rates to rise in particular places . . . people have to be made to feel more worthless. Then there are more fights, more brawls, more scuffles, more bottles and more

knifes and more young men die . . . These are the same young men who saw many of their counterparts, brought up in better circumstances and in different parts of Britain, gain good work, or university education, or both, and become richer than any similarly sized cohort of such young ages in British history.
In summary, we can see that the association between inequality and violence is strong and consistent; it’s been demonstrated in many different time periods and settings. Recent evidence of the close correlation between ups and downs in inequality and violence show that if inequality is lessened, levels of violence also decline.
And the evolutionary importance o f shame and humiliation provides
a plausible explanation o f why more unequal societies suffer more violence.

Imprisonment and punishment
The degree of civilization in a society can be judged by entering its prisons.
F y o d o r D o sto e v sk y , The House o f the Dead
In the U SA , prison populations have been increasing steadily since the early 19 70 s. In 19 7 8 there were over 450,000 people in jail, by 2005 there were over z million: the numbers had quadrupled. In the U K , the numbers have doubled since 19 9 0 , climbing from around46,000 to 80,000 in Z007. In fact, in February Z007, the U K ’s jails were so full that the Home Secretary wrote to judges, asking them to
send only the most serious criminals to prison.This contrasts sharply with what has been happening in some
other rich countries. Through the 1990s, the prison population was stable in Sweden and declined in Finland; it rose by only 8 per cent in Denmark, 9 per cent in Jap an .236 M ore recently, rates have been falling in Ireland, Austria, France and Germ any.237
C R I M E O R P U N I S H M E N T ?
The number of people locked up in prison is influenced by three
things: the rate at which crimes are actually committed, the tendency to send convicted criminals to prison for particular crimes, and the lengths o f prison sentences. Changes in any o f these three can lead to changes in the proportion of the population in prison at any point in

'.Car
too
nSt
ock
.co
m
time. W e’ve already described the tendency for violent crimes to be
more common in more unequal societies in Chapter 10 . W hat has
been happening to crime rates in the U SA and U K as rates o f imprisonment have skyrocketed?
Criminologists Alfred Blumstein and Allen Beck have examined the growth in the US prison population.238 Only i z per cent o f the
growth in state prisoners between 19 8 0 and 19 9 6 could be put down
to increases in criminal offending (dominated by a rise in drug- related crime). The other 88 per cent o f increased imprisonment was due to the increasing likelihood that convicted criminals were sent to prison rather than being given non-custodial sentences, and
to the increased length o f prison sentences. In federal prisons, longer
prison sentences are the main reason for the rise in the number of prisoners. ‘Three-strikes’ laws, minimum m andatory sentences and ‘truth-in-sentencing’ laws (i.e., no remission) mean that some convicted criminals are receiving long sentences for minor crimes. In
California in 2004, there were 360 people serving life sentences for
shoplifting.239In the U K , prison numbers have also grown because o f longer
sentences and the increased use of custodial sentences for offences that a few years ago would have been punished with a fine or community sentence.240 About forty prison sentences for shoplifting are
handed out every day in the U K . Crime rates in the U K were falling
as inexorably as imprisonment rates were rising.The prison system in the Netherlands has been described by
criminologist David Downes, professor emeritus of social administration at the London School of Economics.241 He describes how two-thirds of the difference between the low rate o f imprisonment
in the Netherlands and the much higher rate in the U K is due to the different use o f custodial sentences and the length of those sentences, rather than differences in rates o f crime.
Comparing different countries, M arc M auer of the Sentencing
Project242 shows that in the U SA , people are sent to prison more often, and for longer, for property and drug crimes than they are in Canada, West Germany and England and W ales. For example, in the U SA burglars received average sentences o f sixteen months, whereas in Canada the average sentence was five months. And variations in

crime rates didn’t explain more than a small amount o f the variation in rates o f imprisonment when researchers looked at Australia, N ew Zealand and a number o f European countries. If crime rates
can’t explain different rates of imprisonment, can inequality do better?
I M P R I S O N M E N T A N D I N E Q U A L I T Y
We used statistics on the proportion o f the population im
prisoned in different countries from the United Nations Survey on Crim e Trends and the O perations o f Crim inal Justice Systems.212 Figure i i . i shows (on a log scale) that more unequal countries have higher rates o f imprisonment than more equal countries.
In the U SA there are 576 people in prison per 10 0 ,0 0 0 , which is
more than four and a half times higher than the U K , at 12 4 per 10 0 ,0 0 0 , and more than fourteen times higher than Japan , which has a rate o f 40 per 100 ,000. Even if the U SA and Singapore are
Income inequality
Figure 1 1 . 1 More people are imprisoned in more unequal countries.1*9

Income inequality
Figure 1 1 .2 More people are imprisoned in more unequal US states.1*9
excluded as outliers, the relationship is robust among the remaining countries.
For the fifty states o f the U S A , figures for imprisonment in 19 9 7 -8
come from the US Department o f Justice, Bureau of Justice
Statistics.243 As Figure 1 1 . 2 shows, there is again a strong relationship
between imprisonment and inequality, and big differences between states - Louisiana imprisons people at more than six times the rate of Minnesota.
The other thing to notice on this graph is that states are shown
using two different symbols. The circles represent states that have
abolished the death penalty; diamonds are states which have retained it.
As we pointed out in Chapter 2, these relationships with inequality occur for problems which have steep social gradients within
societies. There is a strong social gradient in imprisonment, with
people o f lower class, income and education much more likely to be sent to prison than people higher up the social scale. The rarity of middle-class people being imprisoned is highlighted by the fact that

two sociologists at California State Polytechnic thought it worthwhile to publish a research paper describing a middle-class inmate’s adaptation to prison life.244
Racial and ethnic disparities in rates of imprisonment are one w ay
o f showing the inequalities in risk o f being imprisoned. In America,
the racial gap can be measured as the ratio between imprisonment rates for whites and blacks.245 H aw aii is the only state where the risk o f being imprisoned doesn’t seem to differ much by race. There, the risk o f being imprisoned if you are black is 1 .3 4 times as high as if you are white. In every other state o f the union ratios are greater
than 2. The ratio is 6.04 for the U SA as a whole and rises to 1 3 . 1 5
for N ew Jersey. There is a similar picture in the U K , where members o f ethnic minorities are much more likely to end up in prison.246 Are these ethnic inequalities a result o f ethnic disparities in rates of crimes committed? Research on young Americans suggests not.247
Twenty-five per cent o f white youths in America have committed
one violent offence by age 17 , compared to 36 per cent o f African- Americans, ethnic rates o f property crime are the same, and African- American youth commit fewer drug crimes. But African-Am erican youth are overwhelmingly more likely to be arrested, to be detained,
to be charged, to be charged as if an adult and to be imprisoned.
The same pattern is true for African-Am erican and Hispanic adults, who are treated more harshly than whites at every stage o f judicial proceedings.248 Facing the same charges, white defendants are far more likely to have the charges against them reduced, or to be offered ‘diversion’ - a deferment or suspension o f prosecution if the
offender agrees to certain conditions, such as completing a drug
rehabilitation programme.
D E G R E E S O F C I V I L I Z A T I O N
Prison data show us that more unequal societies are more punitive. There are other indicators o f this in the ways that offenders are treated in different penal systems. First, as Figure 1 1 . 2 shows, more unequal US states are more likely to retain the death penalty.
Second, how prisoners are treated seems to differ.

Discussing the Netherlands, David Downes describes how a group o f criminal lawyers, criminologists and psychiatrists came together
to influence the prison system. They believed that:
the offender must be treated as a thinking and feeling fellow human being, capable of responding to insights offered in the course of a dialogue . . . with therapeutic agents.241’ p-147
This philosophy has, he says, resulted in a prison system that
emphasizes treatment and rehabilitation. It allows home leave and interruptions to sentences, as well as extensive use of parole and pardons. Prisoners are housed in single cells, relations among prisoners and between prisoners and staff are good, and programmes for education, training and recreation are considered a
model o f best practice. Although the system has toughened up somewhat since the 1980 s in response to rising crime (mostly a consequence of rising rates of drug trafficking and the use of the Netherlands as a base for international organized crime), it remains
characteristically humane and decent.Japan is another country with a very low rate of imprisonment.
Prison environments there have been described as ‘havens of tranquillity’ .249 The Japanese judicial system exercises remarkable flexibility in prosecution and criminal proceedings. Offenders who confess to their crimes and express regret and a desire to reform are generally trusted to do so, by police, judges and the public at large.
One criminologist writes that:
the vast majority [of those prosecuted] . . . confess, display repentance, negotiate for their victims’ pardon and submit to the mercy of the authorities. In return they are treated with extraordinary leniency.250’ p-495
M any custodial sentences are suspended, even for serious crimes
that in other countries would lead to long mandatory sentences. Apparently, most prison inmates agree that their sentences are appropriate. Prisoners are housed in sleeping rooms holding up to eight people, and meals are taken in these small group settings. Prisoners w ork a forty-hour week and have access to training and
recreational activities. Discipline is strict, with exact rules o f conduct, but this seems to serve to maintain a calm atmosphere rather

than provoke an aggressive reaction. Prison staff are expected to act as moral educators and lay counsellors as well as guards.
The picture is far starker in the prison systems of the U SA . The harshness of the US prison systems at federal, state and county levels has led to repeated condemnations by such bodies as Amnesty
International,251-2 Hum an Rights W atch253-4 and the United Nations
Committee against Torture.255 Their concerns relate to such practices as the incarceration o f children in adult prisons, the treatment o f the mentally ill and learning disabled, the prevalence o f sexual assaults within prisons, the shackling o f wom en inmates during
childbirth, the use o f electro-shock devices to control prisoners,
the use o f prolonged solitary confinement and the brutality and ill- treatment sometimes perpetrated by police and prison guards, particularly against ethnic minorities, migrants and homosexuals.
Eminent American criminologist John Irwin has spent time
studying high-security prisons, county jails and Solano State Prison
in California, a medium-security facility housing around 6,000 prisoners, where prisoners are crowded together, with very limited access to recreation facilities or education, training or substance abuse programmes.256 He describes serious psychological harm done to prisoners, and their difficulties in coping with the world outside
when released, across all security levels and types o f institutions.
In some prisons, inmates are denied recreational activities, including television and sport activities. In others, prisoners have to pay for health care, as well as room and board. Some have brought back ‘prison stripe’ uniforms and chain gangs. ‘Am erica’s toughest
sh eriff, Jo e A rpaio, has become famous for his ‘tent city’ county jail
in the Arizona desert, where prisoners live under canvas, despite temperatures that can rise to I 3 0 ° F , and are fed on meals costing less than io p (20 cents) per head.257-*
Am erica’s development o f the ‘superm ax’ prison,201 facilities designed to create a permanent state o f social isolation, has been condemned by the United Nations Committee on Torture.255 Sometimes free-standing, but sometimes constructed as ‘prisons-within-prisons’ , these are facilities where prisoners are kept in solitary confinement for twenty-three hours out o f every day. Inmates leave their cells only for solitary exercise or showers. M edical anthropologist Lorna

Rhodes, who has worked in a superm ax, describes prisoners’ lives as characterized by ‘ lack of movement, stimulation and social
contact’ .259 Prisoners kept in such conditions often are (or become)
mentally ill and are unprepared for eventual release: they have no
meaningful w ork, get no training or education. Estimates vary, but as many as 40,000 people may be imprisoned under these conditions, and new supermax prisons continue to be built.
There is, of course, considerable variation in prison regimes within
the U SA . A recent report by the Committee on Safety and Abuse
in Am erica’s prisons gives a comprehensive picture of the problems of the system, and describes some of the more humane systems and practices.260 A health care initiative in M assachusetts provides continuity of care for prisoners within prison and in the community after their release. M aryland has an exem plary programme for
screening inmates for mental illness. Vermont ensures that prisoners
have access to low-cost telephone calls to maintain their contacts with the outside world. And in M innesota there is a high-security prison that emphasizes human contact, natural light and sensory stimulation, regular exercise and the need to treat inmates with
dignity and respect. If you look back at Figure 1 1 . 2 , you can see that
most o f these examples come from among the more equal US states.N ot only do the higher rates o f imprisonment in more unequal
societies seem to reflect more punitive sentencing rather than crime rates, but both the harshness of the prison systems and use o f capital
punishment point in the same direction.
D O E S P R I S O N W O R K ?
Perhaps a high rate of imprisonment, and a harsh system for dealing with criminals would seem worthwhile if prison worked to deter
crime and protect the p u b lic/ Instead, the consensus among experts worldwide seems to be that it doesn’t w ork very w ell.261-4 Prison
*John Irwin writes that while imprisonment is generally believed to have four ‘official’ purposes - retribution for crimes committed, deterrence, incapacitation o f dangerous criminals and the rehabilitation o f criminals, in fact three other purposes have shaped Am erica’s rates and conditions o f imprisonment. These ‘unofficial’

psychiatrist Jam es Gilligan says that the ‘m ost effective w ay to
turn a non-violent person into a violent one is to send him to prison ’ ,201> p- 117 In fact, imprisonment doesn’t seem to work as well now as it used to in the U S: parole violation and repeat offending are an increasing factor in the growth o f imprisonment rates. Between
19 8 0 and 19 9 6 , prison admissions for parole violations rose from
18 per cent to 35 per cent.238 Long sentences seem to be less of a deterrent than higher conviction rates, and the longer someone is incarcerated, the harder it is for them to adapt to life outside. Gilligan says that:
the criminal justice and penal systems have been operating under a huge
mistake, namely, the belief that punishment will deter, prevent or inhibit
violence, when in fact it is the most powerful stimulant of violence that we have yet discovered.201’ p- 116
Some efforts to use punishment systems to deter crime are not just
ineffective, they actually increase crime. In the U K , the introduction
o f Anti-Social Behaviour Orders (ASBO s) for delinquent youths has
been controversial, partly because they can criminalize behaviour that is otherwise law ful, but also because the acquisition o f an A SB O has come to be seen as a rite o f passage and badge o f honour among some young people.265-6
Although there seems to be a growing consensus among experts
that prison doesn’t w ork, it is difficult to find good, comparable data on re-offending rates in different countries. If a country imprisons a smaller proportion of its citizens, these are more likely to be hardened criminals than those imprisoned under a harsher regime.
So we might expect countries with lower overall rates o f imprison
ment to have higher rates o f re-offending. In fact, there appears to be a trend towards higher rates o f re-offending in more punitive systems (in the U SA and U K , re-offending rates are generally reported to be between 60 and 65 per cent) and lower rates in
purposes are class control - the need to protect honest middle-class citizens from the dangerous criminal underclass; scapegoating - diverting attention aw ay from more serious social problems (and here he singles out growing inequalities in wealth and income); and using the threat o f the dangerous class for political gain.256

less harsh environments (Sweden and Japan are reported to have
recidivism rates between 35 and 40 per cent).
H A R D E N I N G A T T I T U D E S
W e’ve seen that imprisonment rates are not determined by crime rates so much as by differences in official attitudes towards punishment versus rehabilitation and reform. In societies with greater inequality, where the social distances between people are greater,
where attitudes o f ‘us and them’ are more entrenched and where lack
of trust and fear o f crime are rife, public and policy makers alike are more willing to imprison people and adopt punitive attitudes towards the ‘criminal elements’ o f society. M ore unequal societies are harsher, tougher places. And as prison is not particularly effective for either deterrence or rehabilitation, then a society must only
be willing to maintain a high rate (and high cost) of imprisonment
for reasons unrelated to effectiveness.Societies that imprison more people also spend less of their wealth
on welfare for their citizens. This is true of the US states and also of O E C D countries.267-8 Criminologists David Downes and Kirstine
Hansen report that this phenomenon o f ‘penal expansion and
welfare contraction’ has become more pronounced over the past couple o f decades. In his book Crim e and Punishm ent in Am erica, published in 19 9 8 , sociologist Elliott Currie points out that, since 19 8 4 , the state o f California built only one new college but twenty-
one new prisons.264 In more unequal societies, money is diverted
aw ay from positive spending on welfare, education, etc., into the criminal and judicial systems. Am ong our group of rich countries, there is a significant correlation between income inequality and the number o f police and internal security officers per 10 0 ,00 0 people.212 Sweden employs 1 8 1 police per 10 0 ,00 0 people, while Portugal
has 450.Our impression is that, in more equal countries and societies,
legal and judicial systems, prosecution procedures and sentencing, as well as penal systems, are developed in consultation with experts - criminologists, lawyers, prison psychiatrists and psychologists, etc.,

and so reflect both theoretical and evidence-based considerations of what works to deter crime and rehabilitate offenders. In contrast,
more unequal countries and states seem to have developed legal
fram eworks and penal systems in response to media and political pressure, a desire to get tough on crime and be seen to be doing so, rather than on a considered reflection on what w orks and what doesn’t. John Silverman, writing for the U K ’s Economic and Social
Research Council, says that prisons are effective only ‘as a means of answering a sustained media battering with an apparent show of force’ .269 In conclusion, Downes and Hanson deserve to be quoted in full:268, pp- 4-5
A growing fear of crime and loss of confidence in the criminal justice system among the population, . . . made the general public more favourable towards harsh criminal justice policies. Thus, in certain countries, in particular the United States and to a lesser extent the United Kingdom - public demand for tougher and longer sentences has been met by public policy and election campaigns which have been fought and won on the grounds of the punitiveness of penal policy. In other countries, such as Sweden and Finland, where the government provides greater ‘insulation against emotions generated by moral panic and long-term cycles of tolerance and intolerance’ (Tonry, 1 999),270 citizens have been less likely to call for, and to support, harsher penal policies and the government has resisted the urge to implement such plans.

Social mobility: unequal opportunities
A ll the p eo p le lik e us are W e, an d e v e ry one else is
T h e y . R u d y a rd K ip lin g , We and They
In some historical and modern societies, social mobility has been virtually impossible. Where social status is determined by religious or legal systems, such as the Hindu caste system, the feudal systems
o f medieval Europe, or slavery, there is little or no opportunity
for people to move up or down the social ladder. But in modern market democracies, people can move up or down within their lifetime (intra-generational mobility) or offspring can move up and down relative to their parents (inter-generational mobility). The possibility of social mobility is what we mean when we talk about equality o f opportunity: the idea that anybody, by their own merits and hard w ork, can achieve a better social or economic position for themselves and their family. Unlike greater equality itself, equality o f opportunity is valued across the political spectrum, at least in theory. Even if they do nothing to actively promote social mobility, very few politicians would take a public stance against equal opportunity. So how mobile are our rich market
democracies?It’s not easy to measure social mobility in societies. Doing so
requires longitudinal data - studies that track people over time to see where they started from and where they end up. One convenient
w ay is to take incom e m obility as a measure o f social mobility: to see how much people’s incomes change over their lifetimes, or how much they earn in comparison to their parents. To measure

w w w .CartoonStock.<


inter-generational mobility these longitudinal studies need to cover periods of as much as thirty years, in order for the offspring to estab
lish their position in the income hierarchy. When we have income data for parents and offspring, social mobility can be measured as the correlation between the two. If the correlation between parent’s income and child’s income is high, that means that rich parents tend to have children who are also rich, and poor parents tend to have children who stay poor. When the correlation is low, children’s income is less influenced by whether their parents were rich or poor. (These comparisons are not affected by the fact that average incomes
are now higher than they used to be.)
L I K E F A T H E R , L I K E S O N ?
Com parable international data on inter-generational social mobility
are available for only a few o f our rich countries. We take our figures from a study by economist Jo Blanden and colleagues at the London School o f Economics.271 Using large, representative longitudinal studies for eight countries, these researchers were able to calculate social mobility as the correlation between fathers’ incomes when
their sons were born and sons’ incomes at age thirty. Despite having data for only eight countries, the relationship between inter- generational social mobility and income inequality is very strong. Figure i z . i shows that countries with bigger income differences tend to have much lower social mobility. In fact, far from enabling the
ideology o f the American Dream, the U SA has the lowest mobility
rate among these eight countries. The U K also has low social mobility, West Germ any comes in the middle, and Canada and the Scandinavian countries have much higher mobility.
With data for so few countries we need to be cautious, particularly
as there are no data o f this sort that allow us to estimate social mobility for each state and test the relationship with inequality independently in the U S A . But other observations, looking at changes in social mobility over time, public spending on education, changes in geographical segregation, the w ork o f sociologists on matters of
taste and psychologists on displaced aggression, and so-called group

Income inequality
Figure iz . i Social mobility is lower in more unequal countries.149
density effects on health, lend plausibility to the picture we see in Figure i z . i .
The first of these observations is that, after slowly increasing from 19 5 0 to 19 8 0 , social mobility in the U SA declined rapidly, as income differences widened dramatically in the later part o f the century.
Figure iz .z uses data from The State o f W orking Am erica 10 06/7 report. The height o f each column shows the power o f fathers’ income to determine the income of their sons, so shorter bars indicate more social mobility: fathers’ incomes are less predictive
o f sons’ incomes. Higher bars indicate less mobility: rich fathers are
more likely to have rich sons and poor fathers to have poor sons.Data from the 1980 s and 1990s show that about 36 per cent
o f children whose parents were in the bottom fifth of the wealth distribution end up in that same bottom fifth themselves as adults, and among children whose parents were in the top fifth for wealth,
3 6 per cent o f them can be found in the same top fifth.272 Those at the top can maintain their wealth and status, those at the bottom

■oQJcrt
■q, 4°X
1 9 5 0 i 9 6 0 1 9 7 0 1 9 8 0 1 9 9 0 2 0 0 0
Figure 12..2 Social mobility in the USA increased to 1980 and then decreased.272
find it difficult to climb up the income ladder, but there is more flexibility in the middle. Inter-generational social mobility has also
been falling in Britain over the time period that income differences
have widened.271A second observation that supports our belief that greater income
inequality reduces social mobility comes from data on spending on education. Education is generally thought o f as the main engine of social mobility in modern democracies - people with more education
earn more and have higher social status. We saw in Chapter 8 how inequality affects educational achievements and aspirations, but it’ s worth noting that, among the eight countries for which we have information about social mobility, public expenditure on education
(elementary/primary and high/secondary schools) is strongly linked to the degree o f income equality. In N orw ay, the most equal of the eight, almost all (97.8 per cent) spending on school education is public expenditure.273 In contrast, in the U SA , the least equal o f this group o f countries, only about two-thirds (68.2 per cent) of the spending on school education is public money. This is likely to have a substantial impact on social differences in access to higher education.

M O V I N G U P W A R D S , M O V I N G O U T
A third type of evidence that may confirm the correlation between income inequality and social mobility is the w ay in which greater
social distances become translated into greater geographical segregation between rich and poor in more unequal societies.
As inequality has increased since the 19 70 s in the U SA , so too has the geographical segregation of rich and poor.274 Political economist Paul Jargow sky has analysed data from the 19 7 0 , 19 8 0 and 19 9 0
US Census and shown that the residential concentration o f poverty
increased over that period.275-6 Neighbourhood concentration of poverty is a measure that tells us what proportion o f poor people in a city live in high-poverty areas. Jargow sky estimates that in 19 7 0 about one in four poor blacks lived in high-poverty neighbour
hoods, but by 19 9 0 that proportion had risen to one in three.
Am ong whites, poverty concentration doubled during the two decades, while income differences were widening. When poverty concentration is high, poor people are not only coping with their own poverty but also the consequences o f the poverty of their neighbours. Between the 19 9 0 and the 2000 census, Jargow sky reports a
decline in poverty concentration, particularly for black Americans in the inner cities, which goes along with the improvements in the relative position o f the very poorest Americans which we described at the end o f Chapter io .277 Even as poverty concentration has declined in the inner city, though, it has grown in the inner ring o f suburbs
and, with the recent economic downturn in America, Jargow sky warns that the gains o f the 1990s may have already been reversed.
A similar pattern o f segregation by poverty and wealth during a period o f increasing income differences has been taking place in the U K .278 The rich are willing to pay to live separately from the poor,279
and residential segregation along economic lines increased through
out the 1980s and 19 9 0 s.280 The image o f the ‘sink estate’ provokes just as clear a picture o f a deprived underclass as does the image of the ghetto and the barrio in the U SA .
Researchers on both sides o f the Atlantic are clear that increased income inequality is responsible for increasing the segregation o f rich

and poor.281-3 The concentration o f poor people in poor areas increases all kinds of stress, deprivation and difficulty - from increased commuting times for those who have to leave deprived communities to find w ork elsewhere, to increased risk o f traffic accidents, worse schools, poor levels o f services, exposure to gang violence, pollution and so on. Sociologist W illiam Julius W ilson, in his classic study of inner-city poverty, refers to poor people in poor neighbourhoods as the ‘truly disadvantaged’ .225 T w o studies from the U SA have shown that residential economic segregation increases people’s risk of dying, and one showed that more unequal cities were also more
economically segregated.284' 5 These processes w ill o f course feed
back into further reductions in social mobility.
M A T T E R S O F T A S T E - A N D C U L T U R E
So social mobility is lower and geographical segregation greater in
more unequal societies. It is as if greater inequality makes the social structure o f society more rigid and movement up and down the
social ladder more difficult.The w ork of French sociologist Pierre Bourdieu also helps us
to understand how social mobility becomes more limited within more hierarchical societies.286 He describes how material differences between people, the amount of money and resources they have, become overlaid with cultural markers of social difference, which become matters of snobbery and prejudice. We all use matters of taste as marks of distinction and social class - we judge people by their accent, clothing, language, choice o f reading matter, the television programmes they watch, the food they eat, the sports they play, the music they prefer, and their appreciation - or lack o f it -
o f art.M iddle-class and upper-class people have the right accents, know
how to behave in ‘polite society’ , know that education can enhance
their advantages. They pass all of this on to their children, so that they in turn w ill succeed in school and w ork, make good marriages, find high-paying jobs, etc. This is how elites become established and
maintain their elite status.

People can use markers o f distinction and class, their ‘good taste’ , to maintain their position, but throughout the social hierarchy
people also use discrimination and dow nward prejudice to prevent
those below them from improving their status. Despite the modern ideology o f equality o f opportunity, these matters o f taste and class still keep people in their place - stopping them from believing they
can better their position and sapping their confidence if they try. The
experiments on stereotype threat described in Chapter 8 show how strong the effects on performance can be. Bourdieu calls the actions by which the elite maintain their distinction sym bolic violence ; we might just as easily call them discrimination and snobbery. Although racial prejudice is widely condemned, class prejudice is, despite the similarities, rarely mentioned.
These social systems o f taste, which define what is highbrow and cultured, and what is low brow or popular, constantly shift in content but are alw ays with us. The examples that Bourdieu collected in the 1960 s seem very dated now, but illustrate the point. He found that different social class groups preferred different types o f music; the lower social class groups preferred the catchy tune o f the ‘Blue Danube’, while the upper classes expressed a preference for the
more ‘difficult’ ‘Well-Tempered C lavier’ . The upper classes preferred abstract art and experimental novels, while the lower classes liked representational pictures and a good plot. But if everybody starts to enjoy Bach and Picasso and Jam es Joyce, then upper-class taste will shift to appreciate something new - elitism is maintained by shifting
the boundaries. W hat Bourdieu is describing is an ‘economy of cultural goods’ , and inequalities in that economy affect people almost as profoundly as inequalities in income.
In her book, W atching the English, anthropologist Kate Fox describes the social class markers o f the English — in conversation,
homes, cars, clothes, food and m ore.287 Joseph Epstein does the same for the U SA in Snobbery: The Am erican Version.m Both books are amusing, as well as erudite, and it’ s difficult not to laugh at our own pretensions and the poor taste o f others.
In the U K , for example, you can tell if someone is working class,
middle class or upper class by whether they call their evening meal tea , dinner’ or ‘supper’ . By whether they call their mother ‘m am ’,

‘mum’ or ‘mummy’ , by whether they go out to a ‘do ’ , a ‘ function’ or
a ‘party’ , and so on.Snobbery, says Epstein, is ‘sitting in your B M W 74oi and feeling
quietly, assuredly better than the poor vulgarian . . . who pulls up next to you at the stoplight in his garish Cadillac. It is the calm pleasure with which you greet the news that the son of the woman you have just been introduced to is majoring in photojournalism at
Arizona State University while your own daughter is studying art
history at H arvard . . . ’ But snobbishness and taste turn out to be a zero-sum game. Epstein goes on to point out that another day, at another stoplight, a Bentley will pull up next to your pathetic B M W , and you may be introduced to a wom an whose son is studying
classics at O xford.The w ays in which class and taste and snobbery w ork to constrain
people’s opportunities and wellbeing are, in reality, painful and pervasive. They are forms of discrimination and social exclusion. In their 19 7 2 book, The H idden Injuries o f Class, sociologists Richard Sennett and Jonathan Cobb described the psychological damage
done to working-class men in Boston, who had come to view their failures to get on in the world as a result of their own inadequacies, resulting in feelings of hostility, resentment and shame.289 M ore recently, sociologist Simon Charlesworth, in an interview with a working-class man in Rotherham , in the English M idlands, is told
how ashamed the man feels encountering a middle-class w om an.290
Even without anything being said between them, he is immediately filled with a sense of his inferiority, becomes self-conscious and eventually hostile and angry:
I went in to the social [Social Security Office] the other day . . . there were chairs and a space next to this stuck-up cow, you know, slim, attractive,
middle class, and I didn’t want to sit with her, you feel you shouldn’t . . . I became all conscious, of my weight, I felt overweight, I start sweating, I start bungling, shuffling, I just thought ‘no, I’m not going to sit there, I don’t want to put her out’, I don’t want to feel that she’s put out, you
don’t want to bother them . . . you know you insult them . . . the way they look at you like they’re disgusted . . . they look at you like you’re invading their area . . . you know, straight away . . . you feel ‘I shouldn’t be there’

. . . it makes you not want to go out. What it is, it’s a form of violence . . . right, it’s like a barrier saying ‘listen low-life, don’t even [voice rises with pain and anger] come near me! . . . ‘What the fuck are you doing in my space . . . We pay to get away from scum like you . . . It fucking stresses you, you get exhausted . . . It’s everywhere . . . I mean, I clocked her
[looked at her] like they clock us, right, . . . and I thought ‘fuck me, I ain’t even sitting there’ . She would be uncomfortable, and it’ll embarrass me, you know, [voice rises in anger/pain.] . . . Just sitting there, you know what I’m trying to say? . . . It’s like a common understanding, you know how they feel, you feel it, I’m telling you . . . They are fuck all, they’ve got
nothing, but it’s that air about them you know, they’ve got the right body,
the clothes and everything, the confidence, the attitude, know what I mean.. . . We [sadly, voice drops] ain’t got it, we can’t have it. We walk in like we’ve been beaten, dragging our feet when we’re walking in . . . you feel like you want to hide . . .
T H E B I C Y C L I N G R E A C T I O N
Bigger differences in material wealth make status differences more important, and in more unequal societies the weight o f downward
prejudice is bound to be heavier; there is more social distance
between the ‘haves’ at the very top and the ‘have-nots’ at the bottom. In effect, greater inequality increases downward social prejudices. We maintain social status by showing superiority to those below. Those deprived of status try to regain it by taking it out on more vulnerable people below them. T w o lines o f doggerel capture these processes. The English say ‘The captain kicks the cabin
boy and the cabin boy kicks the cat’ , describing the dow nward flow ° f aggression and resentment, while a line from an American rhyme famously describes Boston as the place, ‘where the Lowells talk only to Cabots, and the Cabots talk only to G od ’ , invoking the snobbery
and social climbing o f people looking up to those above them.
When people react to a provocation from someone with higher status by redirecting their aggression on to someone o f lower status, psychologists label it displaced aggression.291 Exam ples include: the man who is berated by his boss and comes home and shouts at his

wife and children; the higher degree of aggression in workplaces where supervisors treat workers unfairly;292 the w ays in which
people in deprived communities react to an influx of foreign immi
grants;293-4 and the ways in which prisoners who are bullied turn on others below them - particularly sex offenders - in the prison
hierarchy.295In his book, The H ot H ouse, which describes life inside a high-
security prison in the U S, Pete Earley tells a story about a man in
prison with a life sentence for murder.296’ pp- 74-5 Bowles had been
incarcerated for the first time at the age o f 1 5 when he was sent to a juvenile reform atory. The day he arrived, an older, bigger boy came
up to him:
‘Hey, what size shoes do you wear?’ the boy asked.
‘Don’t know’ said Bowles‘Let me see one of ’em will ya?’ the boy asked politely.Bowles sat down on the floor and removed a shoe. The older boy took
off one of his own shoes and put on Bowles’s.‘How ’bout letting me see the other one?’‘I took off my other shoe and handed it to him,’ Bowles remembered,
‘and he puts it on and ties it and then walks over to this table and every
boy in the place starts laughing at me.That’s when I realized I am the butt of the joke.’
Bowles grabbed a pool cue and attacked the boy, for which he received a week o f hard labour. When a new boy arrived at the
reform atory the following week, ‘he too was confronted by a boy who demanded his shoes. Only this time it was Bowles w ho was taking advantage of the new kid. “ It was my turn to dish it out,” he
recalled. “ I had earned that right.’”In the same book, Earley tells almost exactly the same story again,
only this time he describes a man’s reaction to being sexually
assaulted and sodomized on his first night in a county jail at the age o f 1 6. Six years later, arrested in another town, he is put in a jail cell with a ‘kid, probably seventeen or so, and you know what I did? I fucked him.’296’ PP-430-31
Displaced aggression among non-human primates has been
labelled ‘the bicycling reaction’ . Primatologist Volker Summer
explains that the image being conjured up is o f someone on a racing bicycle, bowing to their superiors, while kicking down on those
beneath. He was describing how animals living in strict social hierarchies appease dominant animals and attack inferior ones. Psychologists Jim Sidanius and Felicia Pratto have suggested that human group conflict and oppression, such as racism and sexism,
stem from the w ay in which inequality gives rise to individual and institutional discrimination and the degree to which people are complicit or resistant to some social groups being dominant over others.297 In more unequal societies, more people are oriented towards dominance; in more egalitarian societies, more people are oriented towards inclusiveness and empathy.
Our final piece o f evidence that income inequality causes lower social mobility comes from research which helps to explain why stigmatized groups o f people living in more unequal societies can feel more com fortable when separated from the people who look down on them. In a powerful illustration o f how discrimination and
prejudice damage people’s wellbeing, research shows that the health o f ethnic minority groups who live in areas with more people like themselves is sometimes better than that o f their more affluent counterparts who live in areas with more o f the dominant ethnic group.298 This is called a ‘group density’ effect, and was first shown
in relation to mental illness. Studies in London, for example, have
shown a higher incidence o f schizophrenia among ethnic minorities living in neighbourhoods with fewer people like themselves,299 and the same has been shown for suicide300 and self-harm.301 M ore recently, studies in the United States have demonstrated the same effects for heart disease302-3 and low birthweight.304"8 Generally,
living in a poorer area is associated with worse health. Members of ethnic minorities who live in areas where there are few like themselves tend to be more affluent, and to live in better neighbourhoods, than those who live in areas with a higher concentration. So to find that these more ethnically isolated individuals are sometimes less healthy is surprising. The probable explanation is that, through the eyes o f the majority community, they become more aware o f belonging to a low-status minority group and perhaps encounter more frequent prejudice and discrimination and have less support. That

the psychological effects o f stigma are sometimes strong enough
to override the health benefits o f material advantage tells us a lot about the power of inequality and brings us back to the importance of social status, social support and friendship, and the influence of social anxiety and stigma discussed in Chapter 3.
Bigger income differences seem to solidify the social structure and
decrease the chances of upward mobility. Where there are greater inequalities of outcome, equal opportunity is a significantly more distant prospect.


P A R T T H R E E
A Better Society


*3
Dysfunctional societies
N o m an is a n Islan d , en tire o f itse lf; e v e ry m an is a p iece o f
the con tin en t, a p a rt o f the m ain .
John Donne, Meditation X V II
The last nine chapters have shown, among the rich developed countries and among the fifty states of the United States, that most o f the important health and social problems o f the rich world are more common in more unequal societies. In both settings the relationships are too strong to be dismissed as chance findings. The importance of these relationships can scarcely be overestimated. First, the differences between more and less equal societies are large- problems are anything from three times to ten times as common in the more unequal societies. Second, these differences are not differences between high- and low-risk groups within populations which might apply only to a small proportion o f the population, or just to the poor. Rather, they are differences between the prevalence of different problems which apply to whole populations.
D Y S F U N C T I O N A L S O C I E T I E S
One o f the points which emerge from Chapters 4 - 12 . is a tendency for some countries to do well on just about everything and others to do badly. Y<fl®can predict a country’s performance on one outcome from a knowledge o f others. If - for instance - a country does badly on health, you can predict with some confidence that it will also

imprison a larger proportion of its population, have more teenage
pregnancies, lower literacy scores, more obesity, worse mental health, and so on. Inequality seems to make countries socially dysfunctional across a wide range o f outcomes.
Internationally, at the healthy end of the distribution we alw ays
seem to find the Scandinavian countries and Japan. At the opposite
end, suffering high rates of most o f the health and social problems, are usually the U SA , Portugal and the U K . The same is true among the fifty states of the U SA . Among those that tend to perform well across the board are N ew Hampshire, M innesota, North Dakota
and Vermont, and among those which do least well are M ississippi,
Louisiana and Alabam a.
Figure 1 3 . 1 summarizes our findings. It is an exact copy of Figure 2 .2 . It shows again the relationship between inequality and our combined Index o f Health and Social Problems. This graph also shows that the relationship is not dependent on any particular group
o f countries - for instance those at either end of the distribution.
Income inequality
F ig u re 1 3 . 1 Health and social problems are more common in more unequal countries.

Instead it is robust across the range o f inequality found in the
developed market democracies. Even though we sometimes find less strong relationships among our analyses o f the fifty U S states, in the international analyses the U SA as a whole is just where its inequality would lead us to expect.
Though some countries’ figures are presumably more accurate
than others, it is clearly important that we do not cherry-pick the data. That is why we have used the same set o f inequality data, published by the United Nations, throughout. In the analyses of the American states we have used the US census data as published. H ow ever, even if someone had a strong objection to the figures for
one or other society, it would clearly not change the overall picture presented in Figure 1 3 . 1 . The same applies to the figures we use for all the health and social problems. Each set is as provided at source - we take them as published with no ifs or buts.
The only social problem we have encountered which tends to be
more common in more equal countries (but not significantly among
more equal states in the U SA ) is, perhaps surprisingly, suicide. The reasons for this are twofold. First, in some countries suicide is not more common lower down the social scale. In Britain a well-defined social gradient has only emerged in recent decades. Second, suicide is
often inversely related to homicide. There seems to be something in the psychological cliche that anger sometimes goes in and sometimes goes out: do you blame yourself or others for things that go wrong? In Chapter 3 we noted the rise in the tendency to blame the outside w orld - defensive narcissism - and the contrasts between the US and Japan. It is notable that in a paper on health in Harlem in N ew
Y o rk , suicide w as the only cause o f death which was less common there than in the rest o f the U S A .80
E V E R Y O N E B E N E F I T S
A common response to research findings in the social sciences is for people to say they are obvious, and then perhaps to add a little scornfully, that there was no need to do all that expensive w ork to tell us what we already knew. Very often, however, that sense o f knowing

only seeps in with the benefit of hindsight, after research results have been made known. Try asking people to predict the results
in advance and it is clear that all sorts o f different things can seem
perfectly plausible. H aving looked at the evidence in the preceding chapters o f how inequality is related to the prevalence o f so many problems, we hope that most readers will feel the picture makes immediate intuitive sense. Indeed, it may seem obvious that problems associated with relative deprivation should be more common in more unequal societies. However, if you ask people w hy greater equality reduces these problems, much the most common guess is that it must
be because more equal societies have fewer poor people. The assumption is that greater equality helps those at the bottom. As well as being only a minor part o f the proper explanation, it is an assumption which reflects our failure to recognize very important processes
affecting our lives and the societies we are part of. The truth is that
the vast m ajority o f the population is harmed by greater inequality.One of the clues, and one which we initially found surprising,
is just how big the differences between societies are in the rates of the various problems discussed in Chapters 4 - 1 2 . Across w hole
populations, rates o f mental illness are five times higher in the most
unequal compared to the least unequal societies. Similarly, in more unequal societies people are five times as likely to be imprisoned, six times as likely to be clinically obese, and murder rates may be many times higher. The reason why these differences are so big is, quite
simply, because the effects o f inequality are not confined just to the
least well-off: instead they affect the vast majority of the population. To take an example, the reason w hy life expectancy is 4.5 years shorter for the average American than it is for the average Japanese, is not prim arily because the poorest 10 per cent of Americans suffer
a life expectancy deficit ten times as large (i.e., forty-five years) while
the rest of the population does as well as the Japanese. As epidemiologist Michael M arm ot frequently points out, you could take aw ay all the health problems o f the poor and still leave most o f the problem of health inequalities untouched. Or, to look at it another
w ay, even if you take the death rates just o f white Americans, they still do worse - as we shall see in a moment - than the populations of most other developed countries.

Comparisons o f health in different groups o f the population in
more and less equal societies show that the benefits of greater equal
ity are very widespread. M ost recently, a study in the Jo u rn al o f the Am erican M edical Association compared health among middle-aged men in the U SA and England (not the whole U K ).315 To increase com parability the study was confined to the non-Hispanic white populations in both countries. People were divided into both income
and educational categories. In Figure 13 .2 rates o f diabetes, hyper
tension, cancer, lung disease and heart disease are shown in each of three educational categories - high, medium and low. The American rates are the darker bars in the background and those for England are the lighter ones in front. There is a consistent tendency for rates
of these conditions to be higher in the US than in England, not just among the less well-educated, but across all educational levels. The same was also true o f death rates and various biological markers such as blood pressure, cholesterol and stress measures.
Though this is only just apparent, the authors o f the study say
that the social class differences in health tend to be steeper in the
U SA than in England regardless of whether people are classified by income or education.316
L o w H igh L o w H igh L o w H igh L o w H igh L o w H igh
Diabetes Hypertension Cancer Lung disease Heart disease
Figure 13 .2 Rates o f illness are lower at both low and high educational levels in England compared to the USA.315

Dea
ths
per
100
,00
0
In that comparison, England was the more equal and the healtheir of the two countries. But there have also been similar com parisons of death rates in Sweden with those in England and W ales. To allow accurate comparisons, Swedish researchers classified a large number o f Swedish deaths according to the British occupational class classifi
cation. The classification runs from unskilled manual occupations in class V at the bottom, to professional occupations in class I at the top. Figure 13 .3 shows the differences they found in death rates for working-age men.317 Sweden, as the more equal of the two countries, had lower death rates in all occupational classes; so much so that
their highest death rates - in the lowest classes - are lower than the
highest class in England and Wales.Another similar study compared infant mortality rates in Sweden
with England and W ales.318 Infant deaths were classified by father’s occupation and occupations were again coded the same w ay in each
country. The results are shown in Figure 13 .4 . Deaths of babies born
to single parents, which cannot be coded by father’s occupation, are shown separately. Once again, the Swedish death rates are lower right across the society. (Note that as both these studies were published some time ago, the actual death rates they show are
considerably higher than the current ones.)
800
600
400
□ England and Wales 3] Sweden
Social class
Figure 13 .3 Death rates among working-age men are lower in all occupational classes in Sweden compared to England and Wales.317

inta
nt
deat
hs
per
1,00
0
Kngland and Wales
m Sweden
10 - —
'w High;mothers
Single Lowv
Father’s social class
F ig u re 1 3 . 4 Infant mortality rates are lower in all occupational classes in Sweden than in England and Wales.3ls
Comparisons have also been made between the more and less equal o f the fifty states of the U SA . Here too the benefits o f smaller income differences in the more equal states seem to spread across all income groups. One study concluded that ‘income inequality exerts a comparable effect across all population subgroups’ , whether
people are classified by education, race or income - so much so that
the authors suggested that inequality acted like a pollutant spread throughout society.319 In a study of our own, we looked at the relationship between median county income and death rates in all
counties of the U S A .8 We compared the relationship between county median income and county death rates according to whether the counties were in the twenty-five more equal states or the twenty-five less equal states. As Figure 13 -5 shows, in both the more and less equal states, poorer counties tended - as expected - to have higher death rates. H ow ever at all levels of income, death rates were lower in the twenty-five more equal states than in the twenty-five less equal
states. Com paring counties at each level of income showed that the benefits o f greater equality were largest in the poorer counties, but still existed even in the richest counties. In its essentials the picture is much like that shown in Figures L3.3 and 13 .4 comparing Sweden

Stan
dard
ized
m
orta
lity
rate
s
County median household income ($)
F ig u re 1 3 . 5 The relation between county median income and county death rates according to whether the counties are in the twenty-five more equal states or the twenty-five less equal states.
with England and Wales. Just as among US counties, where the benefits o f greater state equality extended to all income groups, so the benefits o f Sweden’s greater equality extended across all classes, but were biggest in the lowest classes.
Figure 8.4 in Chapter 8, which compared young people’s literacy scores across different countries according to their parents’ level o f education (and so indirectly according to the social status of their fam ily o f upbringing) also showed that the benefits o f greater equality extend throughout society. In more equal Finland and
Belgium the benefits o f greater equality were, once again, bigger at the bottom o f the social ladder than in less equal U K and U SA . But even the children o f parents with the very highest levels of education did better in Finland and Belgium than they did in the more unequal U K or U SA .
A question which is often asked is whether even the rich benefit

from greater equality. Perhaps, as John Donne said, ‘N o man is an
Island’ even from the effects o f inequality. The evidence we have
been discussing typically divides the population into three or four income or educational groups, or occasionally (as in Figure 13 .4 ) into six occupational classes. In those analyses it looks as if even the richest groups do benefit. But if, when we talk of ‘the rich’ , we
mean millionaires, celebrities, people in the media, running large
businesses or making the news, we can only guess how they might be affected. We might feel we live in a w orld peopled by faces and names which keep cropping up in the media, but such people actually make up only a tiny fraction of r per cent of the population
and they are just too small a proportion o f the population to
look at separately. W ithout data on such a small minority we can only guess whether or not they are likely to escape the increased violence, drugs or mental illness of more unequal societies. The lives and deaths of celebrities such as Britney Spears, John Lennon, Kurt Cobain, M arilyn M onroe, the assassinated Kennedy brothers,
Princess Diana or Princess M argaret, suggest they might not. W hat the studies do make clear, however, is that greater equality brings substantial gains even in the top occupational class and among the richest or best-educated quarter or third o f the population, which include the small minority o f the seriously rich. In short, whether we look at states or countries, the benefits o f greater equality seem to be shared across the vast m ajority of the population. Only because the benefits of greater equality are so widely shared can the differences in the rates of problems between societies be as large as it is.
As the research findings have come in over the years, the widespread nature of the benefits o f greater equality seemed at first so paradoxical that they called everything into question. Several attempts by international collaborative groups to compare health inequalities in different countries suggested that health inequalities did not differ very much from one country to another. This seemed inconsistent with the evidence that health was better in more equal societies. H ow could greater equality improve health unless it did so by narrowing the health differences between rich and poor? At the time this seemed a major stumbling block. N ow , however, we can see how the two sets o f findings are consistent. Smaller income

differences improve health for everyone, but make a bigger difference to the health o f the poor than the rich. If smaller income differences lead to roughly the same percentage reduction in death rates across
the whole society then, when measured in relative terms, the differ
ences in death rates between rich and poor will remain unchanged. Suppose death rates are 60 per 10 0 ,0 0 0 people in the bottom class and only 20 per 10 0 ,00 0 in the top one. If you then knock 50 per cent o ff death rates in all groups, you will have reduced the death rate by 30 in the bottom group and by 10 at the top. But although the poor have had much the biggest absolute decline in death rates, there is
still a threefold relative class difference in death rates. W hatever
the percentage reduction in death rates, as long as it applies right across society, it will make most difference to the poor but still leave relative measures o f the difference unchanged.
We can now see that the studies which once looked paradoxical
were in fact telling us something important about the effects of
greater equality. By suggesting that more and less equal societies contained similar relative health differentials within them, they were telling us that everyone receives roughly proportional benefits from greater equality. There are now several studies of this issue using data
for US states,8* 319>320 and at least five international ones, which pro
vide consistent evidence that, rather than being confined to the poor, the benefits o f greater equality are widely spread.1S2' 315’ 317>318’ 321
O T H E R E X P L A N A T I O N S ?
It is clear that there is something which affects how well or badly societies do across a wide range o f social problems, but how sure can we be that it is inequality? Before discussing whether inequality plays a causal role, let us first see whether there might be any quite different explanations.
Although people have occasionally suggested that it is the Englishspeaking countries which do badly, that doesn’t explain much of the evidence. For example, take mental health, where the worst performers among the countries for which there is comparable data are English-speaking. In Chapter 5 we showed that the highest rates

D Y S F U N C T I O N A L S O C I E T I E S
are in the U SA , followed in turn by Australia, U K , N ew Zealand and Canada. But even among those countries there is a very strong correlation between the prevalence of mental illness and inequality.
So inequality explains why English-speaking countries do badly, and it explains which ones do better or worse than others.
N or is it just the U SA and Britain, two countries which do have a lot in common, which do badly on most outcomes. Portugal also does badly. Its poor performance is consistent with its high levels of inequality, but Portugal and the U SA could hardly be less alike in other respects. H ow ever, the proof that these relationships are not simply a reflection o f something wrong with English-speaking cultures is that even if you delete them from Figure 1 3 . 1 (p. 174 ) there is still a close relationship between inequality and the Index of Health and Social Problems among the remaining countries. The
same applies to the dominance o f the N ordic countries at the other end of the distribution. They clearly share some important cultural characteristics. But, like the English speaking countries, if you delete them from Figure 1 3 . 1 , a strong relationship remains between inequality and the Index among the remaining countries.
Although that puts paid to the only obvious cultural explanations,
it’s worth pointing out some interesting contrasts between countries. For example, although Portugal does badly, Spain fares at least as well as the average - despite the fact that they share a border, they lived under dictators until the mid 19 70 s , and have m any other cultural similarities. Yet all that seems to be trumped by the differences in inequality. The country which does best of all is Japan , but Japan is, in other respects, as different as it could be from Sweden, which is the next best performer. Think o f the contrasting family structures and the position o f women in Japan and Sweden. In both cases these two countries come at opposite ends of the spectrum. Sweden has
a very high proportion of births outside marriage and women are
almost equally represented in politics. In Japan the opposite is true. There is a similar stark contrast between the proportion of women in paid employment in the two countries. Even how they get their greater equality is quite different. Sweden does it through redistributive taxes and benefits and a large welfare state. As a proportion of national income, public social expenditure in Japan is, in contrast to

Sweden, among the lowest of the m ajor developed countries. Japan gets its high degree o f equality not so much from redistribution as
from a greater equality o f market incomes, o f earnings before taxes and benefits. Yet despite the differences, both countries do well - as their narrow income differences, but almost nothing else, would lead us to expect.
This leads us to another important point: greater equality can be gained either by using taxes and benefits to redistribute very unequal incomes or by greater equality in gross incomes before taxes and benefits, which leaves less need for redistribution. So big government may not alw ays be necessary to gain the advantages o f a more equal
society. The same applies to other areas o f government expenditure.
For countries in our international analysis, we collected O E C D figures on public social expenditure as a proportion o f Gross Domestic Product and found it entirely unrelated to our Index of Flealth and Social Problems. Perhaps rather counter-intuitively, it
also made no difference to the association between inequality and
the Index. Part of the reason for this is that governments m ay spend either to prevent social problems or, where income differences have widened, to deal with the consequences.
Exam ples o f these contrasting routes to greater equality which we have seen in the international data can also be found among the
fifty states o f the U SA . Although the states which perform well are
dominated by ones which have more generous welfare provisions, the state which performs best is N ew Hampshire, which has among the lowest public social expenditure o f any state. Like Japan , it appears to get its high degree o f equality through an unusual equality o f market incomes. Research using data for US states which tried to see whether better welfare services explained the better performance o f more equal states found that although - in the US setting - services appear to make a difference, they do not account fully for why more equal states do so much better.309 The really important implication is that how a society becomes more equal is less important than whether or not it actually does so.

E T H N I C I T Y A N D I N E Q U A L I T Y
People sometimes wonder whether ethnic divisions in societies account for the relationship between inequality and the higher
frequency o f health and social problems. There are two reasons for
thinking that there might be a link. First is the idea that some ethnic groups are inherently less capable and more likely to have problems. This must be rejected because it is simply an expression of racial prejudice. The other, more serious, possibility is that minorities often do worse because they are excluded from the educational and job
opportunities needed to do well. In this view, prejudice against minorities might cause ethnic divisions to be associated with bigger income differences and, flowing from this, also with worse health and more frequent social problems. This would, however, produce a relation between income inequality and worse scores on our index
through very much the same processes as are responsible for the relationship wherever it occurs. Ethnic divisions may increase social exclusion and discrimination, but ill-health and social problems become more common the greater the relative deprivation people experience - whatever their ethnicity.
People nearer the bottom o f society almost alw ays face downward discrimination and prejudice. There are o f course important differences between what is seen as class prejudice in societies without ethnic divisions, and as racial prejudice where there are. Although the cultural marks o f class are derived inherently from status
differentiation, they are less indelible than differences in skin colour. But when differences in ethnicity, religion or language come to be seen as markers o f low social status and attract various downward prejudices, social divisions and discrimination may increase.
In the U SA , state income inequality is closely related to the
proportion of African-Am ericans in the state’s population. The states
with wider income differences tend to be those with larger African- American populations. The same states also have worse outcomes- for instance for health - among both the black and the white population. The ethnic divide increases prejudice and so widens income

differences. The result is that both communities suffer. Rather than
whites enjoying greater privileges resulting from a larger and less
well-paid black community, the consequence is that life expectancy is shorter among both black and white populations.
So the answer to the question as to whether what appear to be the effects o f inequality may actually be the result o f ethnic divisions is
that the two involve most o f the same processes and should not be seen as alternative explanations. The prejudice which often attaches to ethnic divisions may increase inequality and its effects. Where ethnic differences have become strongly associated with social status divisions, ethnic divisions may provide almost as good an indicator of the scale o f social status differentiation as income inequality. In this situation it has been claimed that income differences are trumped, statistically speaking, by ethnic differences in the U S A .310
However, other papers examining this claim have rejected it.311-13 The U S A , with its ethnic divisions, is only one o f a great many contexts in which the impact o f income inequality has been tested. We reviewed 16 8 published reports o f research examining the effect of inequality on health, and there are now around 200 in all.10 In many o f these (for example Portugal) there is no possibility that effects
could be attributed to ethnic divisions. An international study which included a measure o f each country’s ethnic m ix, found that it did not account for the tendency for more unequal societies to be less healthy.314
S I N G L E P A R E N T S
As we noted near the beginning o f this chapter, it is usually the same countries that do well and the same ones which do badly whatever
health or social problems we look at. The fact that so many quite different problems share the same international pattern implies that they have a common underlying cause. The question is whether that common cause is inequality. Another alternative possibility is that these problems might all be rooted in the breakdown o f the two-
parent fam ily as the unit in which children are brought up. There is a tendency to blame a wide range o f social problems on bad parenting

- particularly resulting from the increased prevalence o f single
parents.
Data comparing children brought up in single parent families with
those brought up by two parent families almost alw ays shows that the children o f single parents do less well. M ore controversial is the question o f how much this reflects differences in mothers’ education and maternal depression,397 how much is due to the tendency for
single parent families to be poorer, and how much results from less
good parent-child relationships. Usually all these factors are found to make substantial contributions.
The proportion o f parents who are single varies dramatically from one nation to another. In countries like Greece, only about 4 per cent
o f families with children are single parent families, but in others, like
the U SA , Britain and N ew Zealand, it rises to almost 30 per cent. Could this explain w hy children in some countries do less well than others? Rather than inequality, is the real issue the problems o f single parenthood? To find out, we looked to see if the U N IC E F index of child wellbeing was related to the proportion o f parents who were
single parents in each country. The surprising results are shown in
Figure 13 .6 . There is no connection between the proportion o f single parents and national standards of child wellbeing. This contrasts sharply with the strong relationship between child wellbeing and income inequality shown in Figure 2.6 (see p. 23).
That there is so little connection at the international level between
child wellbeing and the proportion of single parents is probably partly a reflection o f the extent to which welfare systems in some countries protect single parent families from poverty. Recent O E C D figures suggest that only 6 per cent of Swedish single parents with jobs, and 18 per cent o f those without, were in relative poverty, as against 36 and 92 per cent for the U SA .399 The figures for the U K are 7 per cent for single parents with jobs and 39 per cent for those without. The provision o f childcare which enables single parents to w ork must also be important.
Given the political controversies around the provision of state support to single parents, two points are worth noting. First, that it seems to be possible to safeguard children against most o f the adverse effects o f being brought up by lone parents, and second, that

Better -
£TD
ULtUJU
Worse -
Norway •• Spain
Italy • • Belgium • Canada
Ireland*Portugal. ‘ Austria
• France
• Germany
O 1 0 2 0 3 0
Lone parents as % of all households with dependent children
Figure 13 .6 Child wellbeing is not related to the proportion o f single parents.39*
denying state support does not seem to reduce the proportion of single parents.
D I F F E R E N T H I S T O R I E S
Another explanation sometimes suggested for w hy income inequality is related to health and social problems is that w hat matters is not
the inequality itself, but the historical factors which led societies to
become more or less equal in the first place - as if inequality stood, almost as a statistical monument, to a history o f division. This is most often suggested in relation to the U SA when people notice that the more unequal states are usually (but not always) the south
ern states o f the Confederacy with their histories of plantation economies dependent on slave labour. H ow ever, the degree of equality or inequality in every setting has its own particular history. If we look to see how Sweden became more equal, or how Britain and a number of other countries have recently become much less so,

or how the regions o f Russia or China developed varying amounts
of equality or inequality, we get different stories in every case. And
of course these different backgrounds are important: there is no doubt that there are, in each case, specific historical explanations of why some countries, states or regions are now more or less unequal than others. But the prevalence o f ill-health and o f social problems in
those societies is not simply a patternless reflection of so many
unique histories. It is instead patterned according to the amount of inequality which has resulted from those unique histories. What seems to matter therefore is not how societies got to where they are now, but w here - in terms of their level o f inequality - it is that they
have now got to.That does not mean that these relations with inequality are set in
stone for all time. W hat does change things is the stage o f economic development a society has reached. In this book our focus is exclusively on the rich developed societies. But it is clear that a number o f outcomes, including health and violence, are also related to
inequality in less developed countries. W hat happens during the course o f economic development is that some problems reverse their social gradients and this changes their associations with inequality. In poorer societies both obesity and heart disease are more common
among the rich, but as societies get richer they tend to reverse their
social distribution and become more common among the poor. As a result, we find that among poorer countries it is the more unequal ones which have more underweight people - the opposite o f the pattern among the rich countries shown in Chapter 7. The age of menarche also changes its social distribution during the course of economic development. When more of the poor were undernour
ished they reached sexual maturity later than girls in richer families. With the rise in living standards that pattern too has reversed - perhaps contributing to the gradient in teenage pregnancies described in Chapter 9. All in all, it looks as if economic growth and social status differences are the most powerful determinants of many aspects of
our lives.

C A U S A L I T Y
The relationships between inequality and poor health and social problems are too strong to be attributable to chance; they occur independently in both our test-beds; and those between inequality and both violence and health have been demonstrated a large number o f times in quite different settings, using data from different sources. But association on its own does not prove causality and,
even if there is a causal relationship, it doesn’t tell us what is cause
and what is effect.
The graphs we have shown have all been cross-sectional - that is, they have shown relationships at a particular point in time rather than as they change in each country over time. However these crosssectional relationships could only keep cropping up if som ehow they
changed together. If health and inequality went their separate ways and passed by only coincidentally, like ships in the night, we would not keep catching repeated glimpses o f them in close formation. There is usually not enough internationally com parable data to track relationships over time, but it has been possible to look at changes in
health and inequality. One study found that changes between L975 and 1985 in the proportion o f the population living on less than half the national average income among what were then the twelve members o f the European Union were significantly related to changes in life expectancy.81 Similarly, the decrease in life expectancy
in Eastern European countries in the six years following the collapse
o f communism ( 1989-95) w as shown to be greatest in the countries which saw the most rapid widening o f income differences. A longer- term and particularly striking example o f how income distribution and health change over time is the w ay in which the U SA and Japan
swapped places in the international league table o f life expectancy
in developed countries. In the 19 50 s, health in the U SA was only surpassed by a few countries. Japan on the other hand did badly. But by the 1980 s Japan had the highest life expectancy o f all developed countries and the U SA had slipped down the league and was well
on the w ay to its current position as number 30 in the developed
world. Crucially, Japanese income differences narrowed during the

forty years after the Second W orld W ar. Its health improved rapidly,
overtaking other countries, and its crime rate (almost alone among
developed countries) decreased. M eanwhile, US income differences widened from about 19 7 0 onwards.
Chapter 3 provided a general explanation o f w hy we are so sensitive to inequality, and in each o f Chapters 4 - 1 2 we have suggested
causal links specific to each health and social problem. Earlier in this
chapter we saw w hy cultural factors cannot be regarded as rival explanations o f the associations with inequality. W hat other explanation might there be if one wanted to reject the idea o f a causal relationship? Could inequality and each o f the social problems be caused by some other unknown factor?
W eak relationships may sometimes turn out to be a mere mirage
reflecting the influence o f some underlying factor, but that is much less plausible as an explanation of relationships as close as these. The fact that our Index is not significantly related to average incomes in either our international test-bed or among the US states almost certainly rules out any underlying factor directly related to material
living standards. Our analysis earlier in this chapter also rules out government social expenditure as a possible alternative explanation. As for other possible hidden factors, it seems unlikely that such an important causal factor will suddenly come to light which not only determines inequality but which also causes everything from poor health to obesity and high prison populations.
That leaves the question o f which w ay causality goes. Occasionally when we describe our findings people suggest that instead of inequality causing everything else, perhaps it all w orks the other w ay round and health and social problems cause bigger income differences. O f course, in the real w orld these things do not happen in clearly defined steps which would allow us to see which comes first. The limited evidence from studies o f changes over time tells us only that they tend to change together. Could it be that people who succumb to health or social problems suffer a loss o f income and that tends to increase inequality? Perhaps people who are sick or very overweight are less likely to have jobs or to be given promotion. Could this explain why countries with worse health and social problems are more unequal?
The short answer is no - or at least, not much. First, it doesn’t explain why societies that do badly on any particular health or social problem tend to do badly on all of them. If they are not all caused at least partly by the same thing, then there would be no reason why
countries which, for instance, have high obesity rates should also have high prison populations. Second, some of the health and social problems are unlikely to lead to serious loss o f income. Using the U N IC E F index we showed that many childhood outcomes were worse in more unequal countries. But low child wellbeing will not have a major influence on income inequality among adults.
N or could higher homicide rates be considered as a m ajor cause o f inequality even if the numbers were much higher. N o r for that matter could expanding prison populations lead to wider income differences - rather the reverse, because measures o f inequality are usually based on measures o f household income which leave
out institutionalized populations. Although it could be argued that
teenage parents might increase inequality because they are often single and poor, we have seen that even when more equal countries have a high proportion o f single parents that does not explain national differences in child wellbeing. This is partly because generous welfare systems ensure that very much smaller proportions of
them are in poverty than in more unequal countries.H ow ever, there is a more fundamental objection to the idea that
causality might go from social problems to inequality. Earlier in this chapter we showed that it was people at almost all income levels, not just the poor, who do worse in more unequal societies. Even when you compare groups o f people with the same income, you find that those in more unequal societies do worse than those on the same income in more equal societies. Though some more unequal societies have more poor people, most o f the relationship with inequality is, as we pointed out earlier, not explained by the poor: the effects are
much more widespread. So even if there is some loss of income
among those who are sick or affected by some social problem, this does not begin to explain why people who remain on perfectly good incomes still do worse in more unequal societies.
Another alternative approach is to suggest that the real cause is not income distribution but something more like changes in

ideology, a shift perhaps to a more individualistic economic philosophy or view of society, such as the so-called ‘neo-liberal’ thinking. Different ideologies will of course affect not only government policies but also decisions taken in economic institutions throughout society. They are one o f very many different factors which can affect
the scale of income differences. But to say that a change in ideology can affect income distribution is not at all the same as saying that it can also affect all the health and social problems we have discussed - regardless of what happens to income distribution. Although it does look as if neo-liberal policies widened income differences (see
Chapter 16 ) there w as no government intention to lower social
cohesion or to increase violence, teenage births, obesity, drug abuse and everything else. So while changes in government ideology may sometimes be among the causes o f changes in income distribution, this is not part of a package o f policies intended to increase the
prevalence of social problems. Their increase is, instead, an un
intended consequence of the changes in income distribution. Rather than challenging the causal role of inequality in increasing health and social problems, if governments understood the consequences of widening income differences they would be keener to prevent them.
Economists have never suggested that poor health and social problems were the real determinants of income inequality. Instead they have concentrated on the contributions of things like taxes and benefits, international competition, changing technology and the mix o f skills needed by industry. None of these is obviously connected to the frequency o f health and social problems. In Chapter 16 we shall
touch on the factors responsible for major changes in inequality in
different countries.A difficulty in proving causality is that we cannot experimentally
reduce the inequalities in half our sample o f countries and not in the others and then wait to see what happens. But purely observational
research can still produce powerful science - as astronomy shows. There are, however, some experimental studies which do support causality working in the w ay our argument suggests. Some of them have already been mentioned in earlier chapters. In Chapter 8 on education we described experiments which show how much people’s
performance is affected by being categorized as socially inferior.

Indian children from lower castes solved mazes just as well as those from higher castes - until their low caste was made known. Experi
ments in the United States have shown that African-Am erican students (but not white students) do less well when they are told a test is a test o f ability than they do on the same test when they are told it is not a test of ability. We also described the famous ‘blue-
eyes’ experiments with school children which showed the same processes at work.
Sometimes associations which are only observed among human beings can be shown to be causal in animal experiments. For
instance, studies o f civil servants show cardiovascular health declines with declining social status. But how can we tell whether the damage is caused by low social status rather than by poorer material conditions? Experiments with macaque monkeys make the answer clear. M acaques form status hierarchies but with captive colonies it is possible to ensure all animals live in the same material conditions: they are given the same diet and live in the same compounds. In addition, it is possible to manipulate social status by moving animals between groups. If you take low-status animals from different
groups and house them together, some have to become high-status. Similarly, if you put high-status animals together some will become low-status. Animals which move down in these conditions have been found to have a rapid build-up o f atherosclerosis in their arteries.322 Similar experiments also suggest a causal relationship between low
social status and the accumulation o f abdominal fat.323 In Chapter 5 we mentioned other animal experiments which showed that when cocaine w as made available to monkeys in these conditions, it was taken more by low social status animals - as if to offset their lower dopamine activity.59 Lastly, the prim ary importance of inequality
has been confirmed by researchers using statistical methods designed to check the causal pathw ays through which inequality affects levels o f trust or bullying in schools.27’ 400’ 402
Although we know of no experiments confirming the causality of the relation between inequality and violence, we invite anyone to go
into a poor part o f town and try random ly insulting a few people.
We have discussed the reasons for thinking that these links are causal from a number o f different perspectives. But as philosophers

of science, such as Sir K arl Popper, have emphasized, an essential
element in judging the success o f any theory is whether it makes successful predictions. A successful theory is one which predicts the existence o f previously unknown phenomena or relationships which can then be verified. The theory that more equal societies were healthier arose from one set of international data. There have now been a very large number o f tests (about 200) o f that theory in differ
ent settings. With the exception of studies which looked at inequality in small local areas, an overwhelming m ajority o f these tests confirmed the theory. Second, if the link is causal it implies that
there must be a mechanism. The search for a mechanism led to the
discovery that social relationships (as measured by social cohesion,
trust, involvement in community life and low levels o f violence) are better in more equal societies. This happened at a time when the importance of social relationships to health was beginning to be more widely recognized. Third, the theory that poor health might be
one of a range o f problems with social gradients related to inequality has been tested (initially on cause-specific death rates as described earlier in this chapter) and has since been amply confirmed in two different settings as we have described in Chapters 4 - 1 2 . Fourth, at a time when there was no reason to think that inequality had
psychosocial effects, the relation between health and equality seemed
to imply that inequality must be affecting health through psychosocial processes related to social differentiation. That inequality does have powerful psychosocial effects is now confirmed by its links (shown in earlier chapters) with the quality o f social relations and
numerous behavioural outcomes.It is very difficult to see how the enormous variations which exist
from one society to another in the level of problems associated with low social status can be explained without accepting that inequality is the common denominator, and a hugely damaging force.
Accepting this does not involve a huge theoretical leap. Tw o points should be kept in mind. First, the evidence merely confirms the common intuition that inequality is divisive and socially corrosive. Second, everyone knows that within our societies ill health and social problems are related to social status and are most common in the most deprived neighbourhoods. Though you could once have

been forgiven for thinking that this merely reflected a tendency for the vulnerable to end up at the bottom of society, it is now obvious that this fails to explain why these problems are so much more
common in more unequal societies. This book simply points out that if you increase the income and status differences related to these problems, then - unsurprisingly - the problems all become more common.

1 4
Our social inheritance
Gifts make friends and friends make gifts.Marshall Sahlins, Stone Age Economics
L O O K I N G B E F O R E L E A P I N G
Although attitudes to inequality have alw ays been central to the disagreement between the political right and left, few would not prefer a friendlier society, with less violence, better mental health, more involvement in community life - and so on. N ow that we have
shown that reducing inequality leads to a very much better society, the main sticking point is whether people believe greater equality is attainable. Our analysis has not of course compared existing societies with impossibly egalitarian imaginary ones: it is not about
utopias or the extent of human perfectibility. Everything we have seen comes from com parisons o f existing societies, and those societies have not been particularly unusual or odd ones. Instead, we have looked exclusively at differences between the w orld ’s richest and most successful economies, all o f which enjoy democratic institutions and freedom of speech. There can be no doubt whatso
ever that human beings are capable of living well in societies with
inequalities as small - for instance - as Japan and the N ordic countries. Far from being impractical, the implications o f our findings are probably more consistent with the institutional structures o f market democracy than some people - at either end o f the political spectrum
- would like to believe.Some may still feel hesitant to take the evidence at face value.

I can therefore conclude that the primates are indeed social animals,”

From the vantage point of more unequal countries, it may seem genuinely perplexing and difficult to understand how some, apparently similar, countries can function with so much less inequality. Evidence that material self-interest is the governing principle of human life seems to be everywhere. The efficiency of the market economy seems to prove that greed and avarice are, as economic theory assumes, the overriding human motivations. Even the burden of crime appears to spring from the difficulty o f stopping people breaking the rules to satisfy selfish desires. Signs of a caring, sharing,
human nature seem thin on the ground.Some of this scepticism might be allayed by a more fundamental
understanding of how we, as human beings, are damaged by inequality and have the capacity for something else. We need to understand how, without genetically re-engineering ourselves, greater
equality allows a more sociable human nature to emerge.
T W O S I D E S O F T H E C O I N
In our research for this book, social status and friendship have kept cropping up together, linked inextricably as a pair o f opposites.
First, they are linked as determinants of the health o f each individual. As we saw in Chapter 6, friendship and involvement in social life are highly protective of good health, while low social status, or bigger status differences and more inequality, are harmful. Second, the two are again linked as they vary in societies. We saw in Chapter 4 that as inequality increases, sociability as measured by the strength of community life, how much people trust each other, and the frequency o f violence, declines. They crop up together for a third time in people’s tendency to choose friends from among their near equals: larger differences in status or wealth create a social gulf
between people.W hat binds social status and friendship together in these different
ways? The explanation is simple. They represent the two opposite ways in which human beings can come together. Social status stratification, like ranking systems or pecking orders among animals, are fundamentally orderings based on power and coercion, on

privileged access to resources, regardless o f others’ needs. In its most naked and animal form , might is right and the weakest eat last.
Friendship is almost exactly the opposite kind o f relationship. It is about reciprocity, mutuality, sharing, social obligations, cooperation and recognition of each other’s needs. Gifts are symbols of friendship because they demonstrate that the giver and receiver do
not compete for access to necessities, but instead recognize and
respond to each other’s needs. In the well-chosen words of M arshall Sahlins, a social anthropologist, ‘gifts make friends and friends make gifts’ .324 Food-sharing and eating together carry the same symbolic message, and they do so particularly powerfully because food is the
most fundamental of all material necessities. In times o f scarcity,
competition for food has the potential to be extraordinarily socially destructive.
F R I E N D O R F O E
Social status and friendship are so important to us because they
reflect different w ays o f dealing with what is perhaps the most fundamental problem o f social organization and political life among animals and humans alike. Because members of the same species have the same needs as each other, they have the potential to be each
other’s worst rivals, competing for almost everything - for food,
shelter, sexual partners, a com fortable place to sit in the shade, a good nesting site - indeed for all scarce com forts and necessities. As a result, among very many species the most frequent conflicts take place not so much between members o f different species, despite the danger of predators, but between members o f the same species.
A low-status baboon has to spend much more time keeping out of the w ay o f a dominant baboon than in avoiding lions. M ost o f the bite marks and scars which subordinate animals bear come from more dominant members o f their own species. Y ou can see signs of rivalry within species all around us - you have only to watch birds at a garden feeder, or dogs fighting, or think o f the banned sport o f cock fighting: in each case the conflicts are within the species.
Hum an beings have to deal with the same problem. Writing in the
seventeenth century, Thom as Hobbes made the danger o f conflict,
caused by rivalry for scarce resources, the basis of his political philosophy.325 As we all have the same needs, competition for scarce necessities would lead to a continuous conflict o f ‘every man against every man’ . Hobbes believed that, because of this danger, the most important task o f government was simply to keep the peace. He assumed that, without the firm hand o f government, life ‘in a state of nature’ would be ‘solitary, poor, nasty, brutish, and short’ .
But perhaps Hobbes missed an important part of the story. As well as the potential for conflict, human beings have a unique potential to be each other’s best source o f co-operation, learning,
love and assistance of every kind. While there’s not much that
ostriches or otters can do for an injured member of their own species, among humans there is. But it’ s not just that we are able to give each other care and protection. Because most o f our abilities are learned, we depend on others for the acquisition o f our life skills.
Similarly, our unique capacity for specialization and division of labour means that human beings have an unrivalled potential to benefit from co-operation. So as well as the potential to be each other’s w orst rivals, we also have the potential to be each other’s greatest source of com fort and security.
We have become attentive to friendship and social status because
the quality of social relationships has alw ays been crucial to w ellbeing, determining whether other people are feared rivals or vital sources o f security, co-operation and support. So important are these dimensions o f social life that lack o f friends and low social status are
among the most important sources of chronic stress affecting the
health o f populations in rich countries today.Although Hobbes was right about the underlying problem o f the
dangers o f competition between members o f the same species, his view o f how societies managed before the development o f governments with the power to keep the peace w as very wide of the mark.
N ow that we have much more knowledge o f hunting and gathering societies it is clear that our ancestors did not live in a state o f continuous conflict. Instead, as Sahlins pointed out, they had other ways o f keeping the peace.324 To avoid the ‘warre o f each against all’ , social and economic life was based on systems o f gift exchange, food

sharing, and on a very high degree of equality. These served to
minimize animosity and keep relations sweet. Forms o f exchange involving direct expressions o f self-interest, such as buying and sell
ing or barter, were usually regarded as socially unacceptable and outlawed.
These patterns demonstrate the fundamental truth: systems of material or economic relations are systems o f social relations.
E C O N O M I C E X P E R I M E N T S
Economic theory has traditionally worked on the assumption that human behaviour could be explained largely in terms of an inherent tendency to maximize material self-interest. But a series o f experi
ments using economic games have now shown how far from the truth this is.
In the ‘ultimatum gam e’ , volunteers are random ly paired but remain anonymous to each other and do not meet. A known sum of money is given to the ‘proposer’ who then divides it as he or she pleases with the ‘responder’ . All the responders do is merely accept
or reject the offer. If rejected, neither partner gets anything, but if it is accepted, they each keep the shares o f money offered.
They play this game only once, so there is no point in rejecting a small offer to try to force the proposer to be more generous next time - they know there isn’t going to be a next time. In this situation,
self-interested responders should accept any offer, however derisory, and self-interested proposers should offer the smallest positive amount, just enough to ensure that a responder accepts it.
Although experiments show that this is exactly how chimpanzees behave,326 it is not w hat happens among human beings. In practice,
the average offer made by people in developed societies is usually between 43 and 48 per cent, with 50 per cent as the most common offer.327 At direct cost to ourselves, we come close to sharing equally even with people we never meet and will never interact with again.
Responders tend to reject offers below about 20 per cent. Rejected
offers are money which the responder chooses to lose in order to
punish the proposer and prevent them benefiting from making a

mean offer. The human desire to punish even at some personal cost has been called ‘altruistic punishment’ , and it plays an important
role in reinforcing co-operative behaviour and preventing people freeloading.
Although the studies of how people played the ultimatum game were not concerned with the levels o f inequality in each society, they are, nevertheless, about how equally or unequally people choose to divide money between themselves and someone else. They are con
cerned with what people feel is a proper w ay to treat others (even when there is no direct contact between them and they bear the cost of any generosity). The egalitarian preferences people reveal in the ultimatum game seem to fly in the face o f the actual inequalities in our societies.
C H I M P S A N D B O N O B O S
Some non-human primates are much more hierarchical than others. Looking at their different social systems, it often seems as if the amount o f conflict, the quality o f social relations and the relationship between the sexes are functions of how hierarchical they are. Human beings are not of course bound to any one social system. Our adaptability has enabled us to live in very different social structures, both very egalitarian and very hierarchical. But some of
the same effects o f hierarchy on other aspects o f our social systems still seem to be visible - even though the behavioural patterns are driven by culture rather than by instinct. Less hierarchical societies are less male-dominated so, as we saw in Chapter 4, the position of women is better. Similarly, the quality of social relations in more
equal societies is less hostile. People trust each other more and com
munity life is stronger (Chapter 4), there is less violence (Chapter 10) and punishment is less harsh (Chapter 1 1 ) .
Around six or seven million years ago the branch of the evolutionary tree from which we have emerged split from that which led to two different species o f ape: chimpanzees and bonobos. Genetically
we are equally closely related to both o f them, yet there are striking differences in their social behaviour and they illustrate sharply

contrasting ways o f solving the Hobbesian problem of the potential for conflict over scarce resources.
Bands of chimpanzees are headed by a dominant male who gains his position largely on the basis o f superior size, strength, and an
ability to form alliances - often including support from females.
Dominance hierarchies in any species are orderings of access to scarce resources, including - as far as males are concerned - reproductive access to females. Rankings within the dominance hierarchy are established and maintained through frequent contests, displays and assessments o f strength. In the words o f primatologists Frans de
W aal and Frans Lanting:
Chimpanzees go through elaborate rituals in which one individual communicates its status to the other. Particularly between adult males, one male will literally grovel in the dust, uttering panting grunts, while the other stands bipedally performing a mild intimidation display to make
clear who ranks above whom.328- p- 30
Bonobos, on the other hand, behave very differently. N ot only is there much less conflict between neighbouring groups of bonobos than between neighbouring groups o f chimps, but bonobos - again unlike chimps - have a high degree o f sex equality. Females are
at least as important as males, and dominance hierarchies are much
less pronounced. Although males are slightly larger than females, females are usually allowed to eat first. Often dubbed the ‘caring, sharing’ apes, they engage in sexual activity - including mutual masturbation - frequently and in any combination o f sexes and ages.
Sex has evolved not only to serve reproductive functions, but also to relieve tensions in situations which, in other species, might cause conflict. As de W aal says, ‘ sex is the glue o f bonobo society’ .329’ p- 99 It eases conflict, signals friendliness, and calms stressful situations. Bonobos use sex to solve the problem of how to avoid conflict over access to scarce resources. Feeding time is apparently the peak of
sexual activity. Even before food is thrown into their enclosure, male
bonobos get erections and males and females invite both opposite and same-sex partners for sex. Possible conflict over non-food resources is dealt with in the same w ay.
Although sexual activity is not a preliminary to feeding among

humans, eating is a peak o f sociality - whether in the form of shared
fam ily meals, meals with friends, feasts and banquets, or even in the religious symbolism o f sharing bread and wine at communion.
Summing up the behavioural difference between chimps and bonobos, de W aal and Lanting said: ‘If, o f the twin concepts of sex and power, the chimpanzee has an appetite for the second, the bonobo clearly has one for the first. The chimpanzee resolves sexual
issues (disputes) with power; the bonobo resolves power issues with sex.’328, p- 32 Perhaps as a result o f these differences, bonobos are, as research has shown, better at co-operative tasks than chimps.
So what makes the difference? Interestingly, a section o f D N A ,
known to be important in the regulation of social, sexual and
parenting behaviour, has been found to differ between chimps and bonobos.329 It is perhaps com forting to know that, at least in this section of D N A , humans have the bonobo rather than the chimp pattern, suggesting that our common ancestor may have had a
preference for making love rather than war.
T H E S O C I A L B R A I N
The fact that we can simultaneously agree with Sartre that ‘hell is
other people’ and also recognize that other people can be heaven, shows how deeply enmeshed in social life we are. Research looking for the most potent sources o f stress affecting the cardiovascular system concluded that ‘conflicts and tensions with other people are by far the most distressing events in daily life in terms o f both initial
and enduring effects on emotional wellbeing’ - more so than the demands o f w ork, money worries or other difficulties.330 The quality of our relations with other people has alw ays been so crucial not only to wellbeing, but also to survival and to reproductive success, that social interaction has been one o f the most powerful influences on the evolution o f the human brain.
A remarkable indication o f this is the impressively close relationship, first pointed out by the primatologist Robin Dunbar, between the normal group size of each species o f primate (whether they are solitary, go about in pairs, or in smaller or larger troupes) and the

proportion o f the brain made up o f the neocortex.331 The larger the group size, the more neocortex we seem to need to cope with social life. Our Palaeolithic ancestors usually lived in larger communities
than other primates, and the neocortex makes up a larger part o f our brains than it does of primates’ brains. Because its growth was key to the enlargement o f the human brain, the relationship suggests that the reason w hy we became clever may have been a response to the demands o f social life.
Human beings are - the w orld over - preoccupied with social
interaction, with what people have said, what they might have been thinking, whether they were kind, off-hand, rude . . . , w hy they behaved as they did, what their motivations were, and how we should respond. All that social processing depends on the acquisition o f a basic set o f social skills such as the ability to recognize and distinguish between faces, to use language, to infer each other’s
thoughts and feelings from body language, to recognize each other’s peculiarities, to understand and heed what are acceptable and unacceptable ways o f behaving in our society, to recognize and manage the impressions others form o f us, and of course a basic ability to make friends and to handle conflict. But the reasons w hy our
brains have developed as social organs to handle social interaction is
not just to provide amusement, but because o f the paramount importance o f getting our social relationships right. That is why we mind about them. The reason w hy other people can be heaven or hell is because they have the potential to be our worst rivals and
competitors as well as to be our best source o f co-operation, care
and security.
O U R D U A L I N H E R I T A N C E
Different forms o f social organization provide different selective environments. Characteristics which are successful in one setting may not be so in another. As a result, human beings have had to develop different mental tool-kits which equip them to operate both
in dominance hierarchies and in egalitarian societies. Dominance
and affiliative strategies are part o f our deep psychological make-up.

Through them we know how to make and keep friends, how to compete for status, and when each o f these two contrasting social
strategies is appropriate.Dominance strategies are almost certainly pre-human in origin.
They would not have been appropriate to life in the predominantly egalitarian societies o f Stone Age human hunters and gatherers. In pre-human dominance hierarchies we not only developed character
istics which help attain and express high status, but also strategies
for making the best o f low status if that turns out to be our lot. The danger, particularly for males in some species, is that low social status is an evolutionary dead end. To avoid that, a certain amount o f risk-taking and opportunism may be desirable.
Competing effectively for status requires much more than a desire
for high social status and an aversion to low status. It requires a high
degree of attentiveness to status differentials and the ability to make accurate social comparisons of strength and status: it is important to be able to distinguish accurately between winnable and unwinnable status conflicts. In many species life and limb often depend on
knowing when to back o ff and when to challenge a dominant animal for rank. M axim izing status depends on being seen as superior. This is fertile psychological ground for the development and expression of forms o f dow nward prejudice, discrimination and snobbishness intended to express superiority. And the more we feel devalued by those above us and the fewer status resources we have to fall back
on, the greater will be the desire to regain some sense o f self-worth by asserting superiority over any more vulnerable groups. This is likely to be the source o f the so-called ‘bicycling reaction’ mentioned in Chapter 1 2 - so called because it is as if people bow to their superiors while kicking down on inferiors.
Although it is often thought that the pursuit o f status is a par
ticularly masculine characteristic, we should not forget how much this is likely to be a response to the female preference for high-status males. As Henry Kissinger said: ‘Power is the ultimate aphrodisiac.’
Despite the modern impression o f the permanence and universality o f inequality, in the time-scale of human history and prehistory, it
is the current highly unequal societies which are exceptional. For over 90 per cent of our existence as human beings we lived, almost

exclusively, in highly egalitarian societies. For perhaps as much as
the last two million years, covering the vast m ajority o f the time we have been ‘anatomically modern’ (that is to say, looking much as we do now), human beings lived in rem arkably egalitarian hunting and gathering - or foraging - groups.332-5 M odern inequality arose and spread with the development o f agriculture. The characteristics which would have been selected as successful in more egalitarian societies would have been very different from those selected in dominance hierarchies.
Rather than reflecting an evolutionary outbreak o f selflessness,
studies of modern and recent hunter-gatherer societies suggest that
they maintained equality not only through the institutions o f food sharing and reciprocal gift exchange, but also through what have been called ‘counter-dominance strategies’ .331 Sharing was what has been described as ‘vigilant sharing’ , with people watching to see that they got their fair share. The counter-dominance strategies through
which these societies maintained their equality functioned almost
as alliances o f everyone against anyone whose behaviour threatened people’s sense o f their own autonomy and equality. The suggestion is that these strategies may have developed as a generalized form of the kind o f alliances which primatologists often describe being
formed between two or three animals to enable them to gang up on
and depose the dominant male. Observational studies o f modern and recent foraging societies suggest that counter-dominance strategies normally involve anything from teasing and ridicule to ostracism and violence, which are turned against anyone who tries to dominate others. An important point about these societies is that they show that the selfish desires o f individuals for greater wealth and pre
eminence can be contained or diverted to less socially damaging forms o f expression.
A number of psychological characteristics would have been selected to help us manage in egalitarian societies. These are likely to include our strong conception and valuation o f fairness, which makes it easier for people to reach agreement without conflict when sharing scarce resources. Visible even in young children, our concern for fairness sometimes seems so strong that we might wonder how it is that social systems with great inequality are tolerated. Similarly,

the sense o f indebtedness (now recognized as universal in human societies) which we experience after having received a gift, serves to prompt reciprocity and prevent freeloading, so sustaining friendship. As the experimental economic games which we discussed showed, there is also evidence that we can feel sufficiently infuriated by unfairness that we are willing to punish, even at some personal cost to ourselves.
Another characteristic which is perhaps important is our tendency to feel a common sense of identity and interdependence with those
with whom we share food and other resources as equals. They form the in-group, the ‘us’ , with whom we empathize and share a sense of identity. In various religious institutions and political organizations sharing has been used to create a sense o f brotherhood or sisterhood, and whether we say a society has an ‘extended’ or ‘nuclear’ family system is a matter of the extent o f the sharing group - whether more
distant relations have a call on each other’s resources. W riting in the middle of the nineteenth century, de Tocqueville believed that substantial differences in material living standards between people w as a formidable barrier to empathy.23 As we saw in Chapter 4, he thought the differences in material conditions prevented the French
nobility from empathizing with the sufferings of the peasantry, and also explained w hy American slave owners were so unaffected by the suffering o f their slaves. He also thought the strong community life he saw among whites on his visit to the U SA in 18 3 0 was a reflection o f what he called ‘the equality o f conditions’ .
A very important source of the close social integration in an
egalitarian community is the sense o f self-realization we can get when we successfully meet others’ needs. This is often seen as a mysterious quality, almost as if it were above explanation. It comes o f course from our need to feel valued by others. We gain a sense
o f being valued when we do things which others appreciate. The best w ay o f ensuring that we remained included in the co-operative hunting and gathering group and reducing the risk o f being cast out, ostracized, and preyed upon, was to do things which people appreciated. N ow adays, whether it is cooking a nice meal, telling jokes or providing for people’s needs in other w ays, it can give rise
to a sense of self-worth. It is this capacity - now most visible in

parenting - which, long before the development o f market mech
anisms and wage labour, enabled humans - almost uniquely - to
gain the benefits o f a division o f labour and specialization within co-operative groups o f interdependent individuals.
We have then social strategies to deal with very different kinds of social organization. At one extreme, dominance hierarchies are
about self-advancement and status competition. Individuals have
to be self-reliant and other people are encountered mainly as rivals for food and mates. A t the other extreme is mutual interdependence and co-operation, in which each person’s security depends on the
quality of their relationships with others, and a sense o f self-worth comes less from status than from the contribution made to the wellbeing o f others. Rather than the overt pursuit of material selfinterest, affiliative strategies depend on mutuality, reciprocity and the capacity for empathy and emotional bonding.
In practice, of course, god and mammon coexist in every society and the territory o f each varies depending on the sphere o f life, the economic system and on individual differences.
E A R L Y E X P E R I E N C E
So different are the kinds o f society which humans have had to cope with that the processes which adapt us to deal with any given social system start very early in life. Grow ing up in a society where you must be prepared to treat others with suspicion, watch your back and fight for what you can get, requires very different skills from those needed in a society where you depend on empathy, reciprocity
and co-operation. Psychologists and others have always told us
that the nature of a child’s early life affects the development of their personality and the kind of people they grow up to be in adult life. Exam ples o f a special capacity in early life to adapt to local environmental circumstances exist throughout animal and even plant life. In
humans, stress responses and processes shaping our emotional and mental characteristics go through a kind o f tuning, or programming, process which starts in the wom b and continues through early childhood. The levels o f stress which women experience in pregnancy

are passed on to affect the development o f babies before birth. Stress hormones cross the placental barrier and affect the baby’s hormone
levels and growth in the womb.
Also important in influencing children’s development is the stress they experience themselves in infancy. The quality o f care and nurture, the quality o f attachment and how much conflict there is, all affect stress hormones and the child’s emotional and cognitive
development. Although not yet identified in humans, sensitive
periods in early life may sometimes involve ‘epigenetic’ processes by which early exposures and experience may switch particular genes on or o ff to pattern development in the longer term. Differences in nursing behaviour in mother rats have been shown to affect gene expression in their offspring, so providing ways o f adapting to the
environment in the light o f early experience.336
In the past, there was a strong tendency simply to regard children who had had a very stressful early life as ‘damaged’ . But it looks increasingly as if what is happening is that early experience is being used to adapt the child to deal with contrasting kinds o f social reality. The emotional make-up which prepares you to live in a soci
ety in which you have to fend for yourself, watch your back and fight for every bit you can get, is very different from what is needed if you grow up in a society in which (to take the opposite extreme) you depend on empathy, reciprocity and co-operation, and in which your security depends on maintaining good relations with others. Children who experience more stress in early life may be more
aggressive, less empathetic, and probably better at dealing with conflict. In effect, early life serves to provide a taster o f the quality of social relations you are likely to have to cope with in adulthood.
So important are these processes that we need to see parenting as
part o f a system for passing on the adult’s experience of adversity
to the child. When people talk of poor parenting, or say people lack parenting skills, the truth is often that the w ay parents treat their children actually serves to pass on their experience o f adversity to the child. Although this is usually an unconscious process, in which
the parent simply feels short-tempered, depressed or at their w it’s
end, it is sometimes also conscious. In a recent court case, three women were found to have encouraged their toddlers to fight -

goading them to hit each other in the face and to kick a sibling who had fallen to the ground.337 The children’s grandmother showed no remorse, insisting that it ‘would harden them up’ . Given their experience of life, that was clearly what they thought was needed. M any studies have shown that forms o f behaviour experienced in
childhood tend to be mirrored in adulthood. Children who have, for
example, experienced violence or abuse are more likely to become abusing and violent when they reach adulthood.
The effects of early experience are long-lasting. Children stressed in early life, or whose mothers were stressed during pregnancy,
are more likely to suffer in middle and old age from a number of
stress-related diseases - including heart disease, diabetes and stroke.
The result is that some o f the effects of widening income differences in a society may not be short-lived. Increased inequality means that more families suffer the strains o f living on relatively low incomes, and numerous studies have shown the damaging effects on child
development. When parents experience more adversity, fam ily life
suffers, and the children grow up less empathetic but ready to deal with more antagonistic relationships.
M any of the problems which we have seen to be related to inequality involve adult responses to status competition. But we have
also found that a number o f problems affecting children are related
to inequality. These include juvenile conflict, poor peer relationships and educational performance at school, childhood obesity, infant mortality and teenage pregnancy. Problems such as these are likely to reflect the w ay the stresses o f a more unequal society - of low social status - have penetrated family life and relationships.
Inequality is associated with less good outcomes o f m any kinds
because it leads to a deterioration in the quality of relationships. An important part of the reason w hy countries such as Sweden, Finland and N orw ay score well on the U N IC E F index of child wellbeing is that their welfare systems have kept rates o f relative poverty low
among families.

M I R R O R N E U R O N S A N D E M P A T H Y
To view the pursuit o f greater equality as a process o f shoe-horning societies into an uncomfortably tight-fitting shoe reflects a failure to recognize our human social potential. If we understood our social needs and susceptibilities we would see that a less unequal society causes dramatically lower rates o f ill-health and social problems because it provides us with a better-fitting shoe.
M irror neurons are a striking example o f how our biology
establishes us as deeply social beings. When we watch someone doing something, m irror neurons in our brains fire as if to produce the same actions.338 The system is likely to have developed to serve learning by imitation. W atching a person doing a particular
sequence o f actions - one research paper uses the example of a
curtsey - as an external observer, does not tell you how to do it yourself nearly as well as if your brain was acting as i f you were making the same movements in sympathy. To do the same thing you need to experience it from inside.
Usually, o f course, there is no visible sign of the internal processes
of identification that enable us to put ourselves inside each other’s actions. However, the electrical activity triggered by these specialized neurons is detectable in the muscles. It has been suggested that similar processes might be behind our ability to empathize with each other and even behind the w ay people sometimes flinch while
watching a film if they see pain inflicted on someone else. We react as if it was happening to us.
Though equipped with the potential to empathize very closely with others, how much we develop and use this potential is again affected by early childhood.
O X Y T O C I N A N D T R U S T
Another example o f how our biology dovetails with the nature of social relations involves a hormone called oxytocin and its effects on
our willingness to trust each other. In Chapter 4 we saw that people

in more unequal societies were much less likely to trust each other.
Trust is o f course an important ingredient in any society, but it
becomes essential in modern developed societies with a high degree o f interdependence.
In many different species, oxytocin affects social attachment and bonding, both bonding between mother and child, and pair-
bonding between sexual partners. Its production is stimulated by
physical contact during sexual intercourse, in childbirth and in breastfeeding where it controls milk let-down. How ever, in a number o f mammalian species, including humans, it also has a role in social interaction more generally, affecting approach and avoidance
behaviour.The effects of oxytocin on people’s willingness to trust each other
was tested in an experiment involving a trust game.339 The results showed that those given oxytocin were much more likely to trust their partner. In similar experiments it was found that these effects worked both ways round: not only does receiving oxytocin make people more likely to trust, but being trusted also leads to increases in oxytocin. These effects were found even when the only evidence
o f trust or mistrust between people was the numerical decisions communicated through computer terminals.340
C O - O P E R A T I V E P L E A S U R E A N D P A I N F U L E X C L U S I O N
Other experiments have shown how the sense o f co-operation stimulates the reward centres in the brain. The experience o f mutual co-operation, even in the absence of face-to-face contact or real
communication, leads reliably to stimulation o f the reward centres. The researchers suggested that the neural reward networks serve to encourage reciprocity and mutuality while resisting the temptation to act selfishly.341
In contrast to the rewards o f co-operation, experiments using brain scans have shown that the pain o f social exclusion involves the same areas o f the brain as are stimulated when someone experiences physical pain. N aom i Eisenberger, a psychologist at U C L A , got
volunteers to play a computer bat-and-ball game with, as it seemed on the screen, two other participants.342 The program was arranged
so that after a while the other two virtual participants would start to pass the ball just between each other, so excluding the experimental subject. Brain scans showed that the areas o f the brain activated by this experience of exclusion were the same areas as are activated by physical pain. In various species o f monkeys these same brain areas
have been found to play a role in offspring calling for, and mothers providing, maternal protection.
These connections have alw ays been understood intuitively. When we talk about ‘hurt feelings’ or a ‘broken heart’ we recognize the connection between physical pain and the social pain caused by the breaking of close social bonds, by exclusion and ostracism.
Evolutionary psychologists have shown that the tendency to ostracize people who do not co-operate, and to exclude them from the shared proceeds of co-operation, is a powerful w ay o f maintaining high standards of co-operation.343 And, just as the ultimatum game showed that people were willing to punish a mean allocator by rejecting - at some cost to themselves - allocations that seemed unfair, so
we appear to have a desire to exclude people who do not co-operate.Social pain is o f course central to rejection and is the opposite of
the pleasures - discussed earlier - o f being valued or o f the sense of self-realization which can come from others’ appreciation o f what we have done for them. The powers o f inclusion and exclusion indicate our fundamental need for social integration and are, no doubt, part of the explanation of why friendship and social involvement are so protective o f health (Chapter 6).
Social class and status differences almost certainly cause similar forms o f social pain. Unfairness, inequality and the rejection of co-operation are all forms of exclusion. The experiments which demonstrated the performance effects o f being classified as inferior (which we saw in Chapter 8 among Indian children in different castes, in experiments with school children, and among African- American students told they were doing tests o f ability) indicated the
social pain related to exclusion. Part o f the same picture is the social
pain which sometimes triggers violence (Chapter 10 ) when people feel they are put down, humiliated or suffer loss of face.

For a species which thrives on friendship and enjoys co-operation and trust, which has a strong sense o f fairness, which is equipped with m irror neurons allowing us to learn our w ay of life through a process o f identification, it is clear that social structures which create relationships based on inequality, inferiority and social exclusion
must inflict a great deal o f social pain. In this light we can perhaps begin not only to see w hy more unequal societies are so socially dysfunctional but, through that, perhaps also to feel more confident that a more humane society m ay be a great deal more practical than the
highly unequal ones in which so many o f us live now.

1 5
Equality and sustainability
T h e one w h o dies w ith m o st to y s w in s.
US bumper sticker
Over the next generation or so, politics seem likely to be dominated either by efforts to prevent runaway global warm ing or, if they fail, by attempts to deal with its consequences. Carbon emissions per head in rich countries are between two and five times higher than the
w orld average. But cutting their emissions by a half or four-fifths will not be enough: world totals are already too high and allowances must be made for economic growth in poorer countries.
H ow might greater equality and policies to reduce carbon emissions go together? Given what inequality does to a society, and
particularly how it heightens competitive consumption, it looks not only as if the two are complementary, but also that governments may be unable to make big enough cuts in carbon emissions without also reducing inequality.
S U S T A I N A B I L I T Y A N D T H E Q U A L I T Y O F L I F E
Ever since the Brandt Report in 19 8 0 people have suggested that social and environmental sustainability go together. It is fortunate
that just when the human species discovers that the environment cannot absorb further increases in emissions, we also learn that further economic growth in the developed world no longer improves


Life
ex
pect
ancy
(y
ears
)
health, happiness or measures o f wellbeing. On top o f that, we have now seen that there are ways o f improving the quality o f life in rich countries without further economic growth.
But if we do not need to consume more, what would be the con
sequences of consuming less? W ould making the necessary cuts in carbon emissions mean reducing present material living standards below what people in the rich world could accept as an adequate quality o f life? Is sustainability compatible with retaining our quality o f life?
A starting point for answering this question is Figure 1 5 . 1 . It
shows life expectancy in relation to C 0 2 emissions per head o f population among rich and poor countries. Because carbon emissions tend to go up as societies get richer, it looks very like the relationship between life expectancy and National Income per person shown in
Figure 1 . 1 . However, what we can now see is that some countries
achieve life expectancies close to 80 years at a fraction o f the CO 2 emissions common in the richest countries. It should therefore be
8 0 -
7 0 -
60 -
5° -
4 0 -
Figure 15 . 1 Low infant mortality can be achieved without high carbon emissions,344
( Costa Rica \* Cuba*\ Chit
v • •• fGeorgia..^^ •
•Sri Lanka China'"*'. Colombia* • •
. a s .fidV .■>... . *PeruN“ * * . M r.,I .
•Jamaica * [V u8al •Slovenia
^ Croatia^, • Poland
Belgium f Israel , Norway
iermany** • Finland Denmark Ireland
• • Pakistan• Bangladesh •Nepal
•islfir••sen*► V •Mauriti
Ou
•Cote d'lv
Burkina Faso
V\, • Zambia
■ Ruanda
>OJ2
I5 10 15C O 2 emissions (metric tons per capita)

possible to make dramatic reductions in emissions in most rich countries without any loss o f health and wellbeing - even on the basis
o f current inefficient technology based mainly on non-renewable sources o f energy.
The circle in the top left hand corner of Figure 1 5 . 1 shows (again on the basis o f current technology) the area in which societies seem to be able to gain good health at the minimum environmental cost. As
the vertical line through the centre o f the circle is a rough estimate of world average C 0 2 emissions, the graph suggests that all countries of the w orld have the potential to achieve high life expectancies without exceeding current w orld C O 2 emissions.
But because current global emissions are already causing such rapid global warm ing, we need to reduce world emissions far below current levels. That can only be achieved by more energy efficient ways o f living and the development of sustainable sources o f energy. Such changes would shift the circle (marking the lowest environmental costs at which high levels o f health and wellbeing can be
achieved) leftwards and probably upwards.Another answer to the question whether sustainability is com
patible with retaining our high quality of life comes from the W orld W ildlife Fund (W W F). It analysed data relating the quality o f life in each country to the size o f the ecological footprint per head of population.345 To measure the quality of life they used the U N
Human Development Index (H DI) which combines life expectancy, education and Gross Domestic Product per capita. Figure 15 .2 uses W W F data to show the relation between each country’s ecological footprint per head and its score on the U N Human Development Index. Scarcely a single country combines a quality o f life (above the
W W F threshold o f 0.8 on the H D I) with an ecological footprint
which is globally sustainable. Cuba is the only one which does so. Despite its much lower income levels, its life expectancy and infant mortality rates are almost identical to those in the United States.
The fact that at least one country manages to combine acceptable living standards with a sustainable economy, proves that it can be
done. However, because the combination is achieved without access to the greenest and most fuel-efficient technology means it could be done more easily in countries with access to more advanced tech-

Ecol
ogic
al
toot
prin
t pe
r ca
pita
IO
8
6
4
2
O
nology than Cuba has. With the advantages of power generation from renewables, environmentally friendly new technologies and greater equality, we can be confident that it is possible to combine sustainability with a high quality o f life. Before leaving Figure 1 5.2 it is worth noting that much o f the reason w hy the highest scores on the H D I are achieved by countries with the largest ecological feet is merely a reflection of the fact that Gross Domestic Product per head is one of the components of the H D I.
R E D U C I N G C A R B O N E M I S S I O N S F A I R L Y
Im proving the real quality of our lives at lower levels o f consumption is only one of the contributions equality can make to reducing carbon emissions. There are two others. First, if policies to cut emissions are to gain public acceptance, they must be seen to
1_05
-o
3■a
' 15 j5
"o
1|5
Saudi Arabia •
•
• ^Lebanon • <
w 1 i j u 1 u # South Africa • • f ft World biocapacity available per person a ^ •[
• United Arab Emirates
• USA
Finland • • Canada•Kuwait Australia
• Estonia ®0 Sweden New Zealand •!§ # UK
Spain •_ . • • fM Ireland Russia
' # • J *Portugal •
' • Slovenia
• /• •I • • Costa Rica ■ i
. . . _ • Gambia Bmswana • • • M 1 ^ • •
S, * . " *7 .... Mali iajikistan
•Cuba
0.2 0.4 0.6 0.8 1
U N Hum an Development Index, 2003
Figure 15 .2 Human wellbeing and sustainability.3*5

be applied fairly. The richer you are and the more you spend, the more you are likely to contribute to global warm ing. The carbon emissions caused by the consumption of a rich person may be ten times as high as the consumption o f a poorer person in the same
society. If the rich are the worst offenders, then fair remedies must
surely affect them most. Policies that squeezed the poor while allow ing the rich to continue to produce much higher levels o f emissions would be unlikely to gain widespread public support.
A system o f individual carbon rations has been proposed as one w ay o f reducing carbon emissions fairly. The total permissible
level o f emissions can be divided by the population to give an equal
share, or quota, o f allowable emissions per head. There is an obvious parallel here with the egalitarian policies implemented in Britain during the Second W orld W ar: to gain public co-operation in the w ar effort, the burden had to be seen to be fairly shared. Titmuss regarded this as the rationale for the introduction o f rationing and
more progressive income taxes, as well as for subsidizing necessities
and taxing luxuries.346 One suggestion now is that people should use an electronic card to cover payments for fuel, power and air travel. Those using less than their ration would be able to sell their unused
allocation back to a carbon bank, from where it could then be
bought by richer people wanting to use more than their allocation of
fuel and power. Under such a system of ‘tradeable carbon quotas’ high consumers would be compensating low consumers, and income would be redistributed from rich to poor. In 20 0 6 the then Minister for the Environment in Britain, David M iliband, proposed such a system and a small trial was begun in Manchester in 2007. To safe
guard the poor it may be necessary to prevent people selling unused parts o f their ration till the end o f the period it covers, so only allowances already saved could be traded.

N E W T E C H N O L O G Y IS N O T E N O U G H O N I T S O W N
We might hope that new technology will save us from the rigours o f carbon rationing. However, although green innovations which
reduce fuel consumption and carbon emissions are an essential part
o f the change we need to make, they cannot solve the problem on
their own. Imagine that a new generation of car engines is introduced which halve fuel consumption. Driving would then be cheaper and that would save us money, but it is money which we would almost certainly spend on something else. We might spend it on
driving more, or on buying a bigger car, or on more power-hungry
electrical equipment - perhaps a bigger fridge-freezer. But however we spend the money put back in our pockets by more efficient car engines, our additional consumption will probably add to carbon emissions elsewhere and lose much o f the original environmental
benefit. The same logic applies in almost all areas. M ore power-
efficient washing machines or better insulated houses will help the environment; but they also cut our bills, and that immediately means we lose some of the environmental gain by spending the saved money on something else. As cars have become more fuel-efficient
we have chosen to drive further. As houses have become better insulated we have raised standards o f heating, and as we put in energy-saving light bulbs the chances are that we start to think it
doesn’t matter so much leaving them on.Because energy-saving innovations mean that we can buy more,
they are like economic growth. Though they give us higher material living standards for any level o f carbon emissions, much of the carbon savings get swallowed up by higher living standards. The only question is how much o f the benefits o f greener technology get eaten up in higher consumption. As many countries have adopted smaller, more fuel-efficient cars, national emissions have usually continued to rise despite the increased efficiency.

A S T E A D Y - S T A T E E C O N O M Y
It is clear that we have to move to something more like the steady- state economy first proposed by economist Herman D aly.347 But how do we do that when, as M urray Bookchin, the American social ecologist and libertarian philosopher, said, ‘Capitalism can no more be “ persuaded” to limit growth than a human being can be “ persuaded” to stop breathing’ ?348 When Daly developed the concept of a steady-state economy people were more concerned about using up
the earth’s finite mineral and agricultural resources than they were
with global warming. He suggested that we should have physical quotas on the extraction of minerals and that the use of the w orld ’s resources should be prevented from growing. Limiting world oil and coal production might turn out to be a very effective w ay o f limiting global warming. Innovation and change would then be concen
trated on using finite resources more effectively for the benefit of humankind.
Think o f material living standards as given by the stock o f goods in use, rather than the rate of flow from consumption to waste. The
faster things w ear out and need replacing, the more they contribute
to the flow and to waste. If material living standards depend on the
goods we have in use, then each thing that wears out is a subtraction from that. Rather than serving as consumers, helping business to keep sales up, we need incentives to build and maintain longer- lasting goods of every kind.
Clearly any system for tackling these problems has to treat rich and
poor countries differently. India, producing 1 .6 tonnes of carbon per person annually, cannot be treated the same as the U SA , producing24.0 per person. Any regulatory system has to include policies for ‘contraction and convergence’ or ‘cap and share’ . Both approaches
propose a year-on-year contraction in permitted emissions levels,
leading to an eventual convergence on equal per capita emissions across the planet.
It would be a mistake to think that a steady-state economy would mean stagnation and lack o f change. Paradoxically, the transition to a sustainable steady state economy would create huge demands

for innovation and change. Trying to get more from the limited resources available has alw ays been one of the fundamental drivers
o f innovation and technical change.349 Fixing limits on resource con
sumption and emissions would require innovation as never before. As we shall see in the next chapter, continued rapid technological advances, such as digitization, electronic communications and virtual systems, creating ‘weightless’ sectors of the economy, make it very much easier to combine high living standards with low resource
consumption and emissions.It is often suggested that invention and innovation go with
inequality and depend on the promise o f individual financial incentives. However, Figure 15 .3 suggests the contrary - that more equal societies tend to be more creative. It shows that there is a ten
dency for more patents to be granted per head o f population in more
equal societies than in less equal ones. Whether this is because talent goes undeveloped or wasted in more unequal societies, or whether hierarchy breeds conformity, is anyone’s guess. But it does suggest that greater equality will not make societies less adaptable.
4 0 -
• Finland
• Norway
• Sweden
• Austria
Switzerland*
• Ireland• N ew Zealand
6<D(X
g 1 0 -^3 Japan •
o -
H igh

The second link between greater equality and the prevention of global warm ing involves the consumerism which makes it so much
harder to contain economic activity within sustainable levels. Our
addiction to shopping and spending makes many people think that we have already lost the battle against global warming. As well as leading most o f us into an ostrich-like denial o f its implications for our w ay o f life, the strength o f our consumerist tendencies
has reduced governments to a state o f paralysis, too nervous of the
electorate to implement any policy capable o f making a real differ
ence. H ow are we to transform this culture and make it possible to reduce the threat to the planet?
Greater equality gives us the crucial key to reducing the cultural
pressure to consume. In a period when people seem to have been
less guarded, Henry W allich, a former governor o f the Federal
Reserve and professor of economics at Yale , said: ‘Grow th is a substitute for equality o f income. So long as there is growth there is hope, and that makes large income differentials tolerable.’350 But this relation holds both ways round. It is not simply that growth is
a substitute for equality, it is that greater equality makes growth
much less necessary. It is a precondition for a steady-state economy.A great deal of what drives consumption is status competition. For
most o f us it probably feels less like being competitive and more like a kind o f defensiveness: if we don’t raise our standards, we get left behind and everything starts to look dowdy, shabby and out o f date.
Robert Frank, an economist at Cornell University, has described
how standards are inherently relative and involve comparisons with others. In his book, Falling Behind: F lo w rising inequality harms the m iddle class (2007), he puts it like this:351
No one denies that a car experienced in 1950 as having brisk acceleration would seem sluggish to most drivers today. Similarly, a house of given size
is more likely to be viewed as spacious the larger it is relative to other houses in the same local environment. And an effective interview suit is one that compares favorably with those worn by other applicants for the

same job. In short, evaluation depends always and everywhere on context,
(pp. viii-ix)
The problem is that second-class goods make us look like second- class people. By comparison with the rich and famous, the rest of us appear second-rate and inferior, and the bigger the differences, the more noticeable and important they become. As inequality increases status competition, we have to struggle harder to keep up. While the rich may believe their willingness to spend huge sums on a watch, a car or some other luxury item reflects their appreciation of
the ‘attention to detail’ or ‘craftsmanship’ , what really makes the difference is what their purchases say about them relative to the rest o f us. As every advertiser knows, it serves to set them apart as people o f distinction - social distinction. Only the best people can have
nothing but the best.The other side o f this coin is that the consumption of the rich
reduces everyone else’s satisfaction with what they have, by showing it up as inferior - as less than the best. In his book, H appiness, Richard Layard, founder o f the Centre for Economic Performance at the London School o f Economics, treated this dissatisfaction
as a cost which the rich impose on the rest o f society.3 Rather as if it
were smoke from a factory chimney, he estimated the cost that the rich should pay for it. He w as, however, unaware o f the effects of inequality on the health and social problems which we have outlined. He based his calculations solely on the loss o f satisfaction,
or happiness, among the rest of the population and concluded that a
60 per cent tax rate on the better-off might cover that cost (presumably that should be over and above the tax rates other people pay).
The idea that inequality ratchets up the competitive pressure to consume is not just speculation. It has observable effects. While
inequality has been rising in the U SA and Britain, there has been a long-term decline in savings and a rise in debt. Robert Frank notes that in 19 9 8 , even though the American economy was booming as never before, one fam ily in sixty-eight filed for bankruptcy - four times the rate in the early 1980s before the most dramatic rises in inequality.351 By Z002, unpaid credit card debt was $9 ,000 for the average card-holder. Looking at changes over a ten-year period,

Frank found that bankruptcy rates rose most in parts of the U SA where inequality had risen m ost.154- 351 The growth of inequality made it harder for people to maintain standards relative to others. The increased pressure to consume led people to save less and borrow more to such an extent that the expansion of consumer demand became one of the main drivers o f the long economic boom
and financial speculation which ended in crisis. This fits well with the fact that spending on advertising also varies with inequality - in more unequal countries a higher proportion o f Gross Domestic Product is spent on advertising, with the U SA and N ew Zealand spending twice as much as N orw ay and Denmark.
Another indicator o f how inequality increases the pressure to consume comes from the w ay w orking hours vary in different countries in relation to inequality. A study o f working hours in O E C D countries by Sam Bowles, professor emeritus o f economics at the University o f Massachusetts, showed not only that more unequal countries tend to have longer working hours, but also that differences in working hours changed in line with changes in inequality over several decades.352 The relationship between greater inequality and longer working hours is shown in Figure 15 .3 . People in more unequal countries do the equivalent o f two or three months’ extra w ork a year. A loss o f the equivalent o f an extra eight or twelve weeks’ holiday is a high price to pay for inequality.
Another study, this time using data within the U SA , found that married women were more likely to go out to w ork if their sister’s husband earned more than their own husband.353 A similar study suggested that the decisions married women make about taking paid w ork are also affected by less personal inequalities: it looked
at women who were married to employed men and found that they
were more likely to take a job themselves if they lived in an area in which men’s incomes were more unequal.354
The evidence we have described from a number o f different sources on savings, debt, bankruptcy rates, spending on advertising
and working hours, all concurs with the view that inequality does
indeed increase the pressure to consume. If an important part of consumerism is driven by emulation, status competition, or simply having to run to keep up with everyone else, and is basically about

2100
2000
(A 1900M3O1800
O£§ 1700 GS
DO i ^ O On3Ul>
1500
1400
1 3 0 0
1 . 3 0 1.50 1 . 7 0 1 . 9 0 2 .10 Z . 3 0 2.50
Earnings inequality: ratio of rich to middle ($>0th:50th percentile)
F ig u re 1 5 .4 People work longer in more unequal societies.351
social appearances and position, this would explain w hy we continue to pursue economic growth despite its apparent lack of
benefits. If everyone wants more money because it improves selfimage and status in relation to others, then each person’s desire to be richer does not add up to a societal desire for economic growth. H ow much people’s desire for more income is really a desire for higher status has been demonstrated in a simple experiment. People
were asked to say whether they’d prefer to be less w ell-off than others in a rich society, or have a much lower income in a poorer society but be better-off than others. Fifty per cent of the participants thought they would trade as much as half their real income if they could live in a society in which they would be better o ff than
others.355 This shows how much we value status and explains why (as we saw in Chapter 2) the income differences within rich societies matter so much more than the income differences between them. Once we have enough o f the necessities o f life, it is the relativities which matter.
When Bowles and Park first demonstrated the relationship
Canada . •
U K O A
* * S
Norway O
O Germany
• •
O Netherlands
• / 0 Country average
• Annual data

between inequality and working hours (Figure 15 .3 ) , they quoted
Thorstein Veblen, who said: ‘The only practicable means o f im
pressing one’s pecuniary ability on the unsympathetic observers of one’s everyday life is an unremitting demonstration o f the ability to pay.’ Veblen’s Theory o f the Leisure Class, published in 18 9 9 , was the first m ajor w ork on the relationship between consumption and social stratification. It was he who introduced the term ‘conspicuous
consumption’ and emphasized the importance of ‘pecuniary emulation’ and ‘invidious com parisons’ .356 Because the advertising industry plays on insecurities about how we are seen, it has made us more aware o f the psychology o f consumption. But Veblen wrote long before we were so bombarded with advertising. So rather than blaming these problems entirely on advertising, we should recognize
that it simply amplifies and makes use o f vulnerabilities which are there anyw ay. Economists now use the term ‘Veblen effect’ to refer to the w ay goods are chosen for their social value rather than their usefulness. And research confirms that the tendency to look for goods which confer status and prestige is indeed stronger for things which are more visible to others.
Too often consumerism is regarded as if it reflected a fundamental human material self-interest and possessiveness. That, however, could hardly be further from the truth. Our almost neurotic need to shop and consume is instead a reflection of how deeply social we are.
Living in unequal and individualistic societies, we use possessions to
show ourselves in a good light, to make a positive impression, and to avoid appearing incompetent or inadequate in the eyes o f others. Consumerism shows how powerfully we are affected by each other. Once we have enough o f the basic necessities for comfort, possessions matter less and less in themselves, and are used more and
more for w hat they say about their owners. Ideally, our impressions
o f each other would depend on face-to-face interactions in the course o f community life, rather than on outward appearances in the absence o f real knowledge o f each other. That point takes us back to the discussion in Chapter 4 o f the evidence that inequality
weakens community life. The weakening o f community life and the growth o f consumerism are related.
If, to cut carbon emissions, we need to limit economic growth

severely in the rich countries, then it is important to know that
this does not mean sacrificing improvements in the real quality o f life
- in the quality of life as measured by health, happiness, friendship and community life, which really matters. However, rather than simply having fewer o f all the luxuries which substitute for and prevent us recognizing our more fundamental needs, inequality has to
be reduced simultaneously. We need to create more equal societies able to meet our real social needs. Instead of policies to deal with
global warm ing being experienced simply as imposing limits on the possibilities o f material satisfaction, they need to be coupled with egalitarian policies which steer us to new and more fundamental ways of improving the quality o f our lives. The change is about a
historic shift in the sources of human satisfaction from economic
growth to a more sociable society.In his speech accepting the 2007 Nobel Peace Prize on behalf of
the Intergovernmental Panel on Climate Change which he chairs, Rajendra Pachauri described how global warm ing would reduce agricultural yields, food and water supplies for hundreds o f millions
of people and so lead to increasing conflict. (He spoke before the contribution of biofuel crops to rising w orld food prices had been clearly recognized.) The task of responding adequately to the threat of global warm ing needs to be seen as bigger and more important than any of us. But if everyone - individuals, corporations, whole nations - feels it is almost their duty to get round regulations, to
exploit whatever loopholes they can (as has long been taken as the norm with taxation) then the task is lost. As we write, tankers of biofuels are crossing the Atlantic from Europe to the U SA and back in order to pick up the US government subsidy paid when small quantities of petroleum are added, which could just as well have
been added in Europe without every litre crossing the Atlantic twice. Reversing the intended effect of regulations for private gain is an expression o f the dominance o f attitudes which make it much harder to respond adequately to the threat o f global warming.
Tackling climate change depends on world co-operation like never
before: we cannot succeed if in practice everyone is trying to circumvent the regulations. Cheating on regulations and the pursuit of short-term sectional or self-interest becomes not just anti-social

but anti-humanity. Policies to reduce carbon emissions depend on a wider sense o f social responsibility, o f co-operation and publicspiritedness. Here again the evidence suggests that more equal societies do better. We have seen (Chapter 4) that they are more
socially cohesive and have higher levels of trust which foster publicspiritedness. We have also seen how this carries over into international relations: more equal societies give more in development aid and score better on the Global Peace Index. An indication that a greater sense of public responsibility in more equal countries might affect how societies respond to environmental issues can be seen in
Figure 15 .5 , which shows that they tend to recycle a higher pro
portion o f their waste. The data comes from Australia’s Planet A rk Foundation Trust.357 We show each country’s ranking for the proportion o f waste that they recycle. Another indication o f a stronger sense o f public responsibility comes from an international
survey of opinions o f business leaders. As our colleagues, Roberto
De Vogli and David Gimeno, pointed out, business leaders in more
Income inequality
Figure 15 .5 More equal countries recycle a higher proportion o f their waste.

equal countries are more strongly in favour of their governments
complying with international environmental agreements than busi
ness leaders in more unequal countries.404,405So rather than assuming that we are stuck with levels o f self
interested consumerism, individualism and materialism which must defeat any attempts to develop sustainable economic systems, we need to recognize that these are not fixed expressions o f human nature. Instead they reflect the characteristics of the societies in which
we find ourselves and vary even from one rich market democracy
to another. At the most fundamental level, what reducing inequality is about is shifting the balance from the divisive, self-interested consumerism driven by status competition, towards a more socially integrated and affiliative society. Greater equality can help us develop the public ethos and commitment to w orking together which we need
if we are going to solve the problems which threaten us all. As
wartime leaders knew, if a society has to pull together, policies must be seen to be fair and income differences have to be reduced.
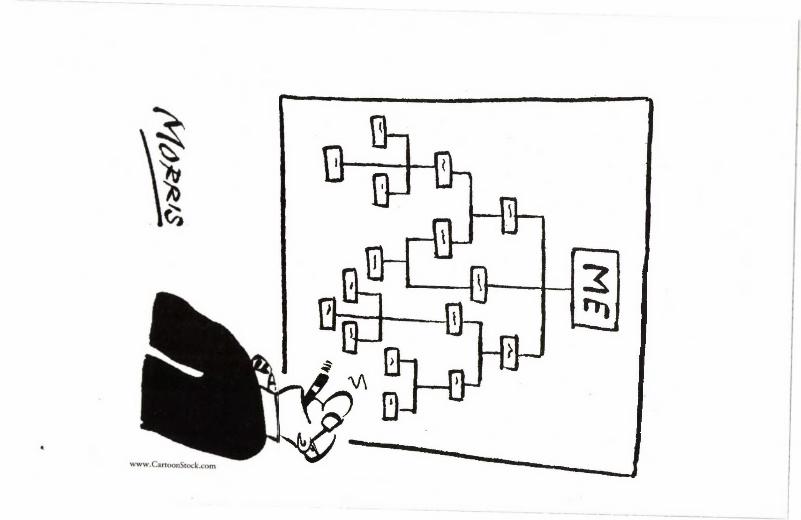

Building the future
Turning corporations loose and letting the profit motive run amok is not a prescription for a more liveable world.
Tom Scholz, Interview with the Sierra Club
Before discussing what should be done to make our societies more equal, it is worth pointing out that focusing attention on the in
equalities within them does not mean ignoring the international
inequalities between rich and poor countries. The evidence strongly suggests that narrowing income differences within rich countries will make them more responsive to the needs o f poorer countries. In Chapter 4 we showed (Figure 4.6) that more equal countries tend to
pay a higher proportion o f their national income in foreign aid.
Com pared to the most unequal countries, some o f the most equal devote four times the proportion o f their national income to aid. M ore unequal countries also seem to be more belligerent internationally. Inequality is related to worse scores on the G lobal Peace Index, which combines measures of militarization with measures of
domestic and international conflict, and measures of security, human
rights and stability. (It is produced by Visions of Hum anity in conjunction with the Economist Intelligence Unit.)358
If we turn instead to the part countries play in international trade agreements or, for instance, in negotiations on reducing carbon emissions, we find that more equal countries take positions on these
issues which are likely to be more beneficial to developing countries.It looks as if the inequalities which affect the w ay people treat
each other within their own societies also affect the norms and

expectations they bring to bear on international issues. Grow ing up and living in a more unequal society affects people’s assumptions about human nature. We have seen how inequality affects trust, community life and violence, and how - through the quality of
early life - it predisposes people to be more or less affiliative, empa- thetic or aggressive. O bviously these issues are closely related to the increased status competition and consumerism we discussed in the previous chapter. It implies that if we put our own houses in order, we may look more sympathetically on developing countries.
A T R A N S F O R M A T I O N
But how can we make our societies more equal? Talk about greater equality worries some people. Trying to allay these fears at a
N ational Policy Association conference on health inequalities in W ashington, one of us pointed out that as all the data came from rich developed market democracies and we were only talking about the differences between them, it surely w ouldn’t take a revolution
to put things right. But when It D oesn ’t Take a Revolution appeared
as the title o f the N ational Policy Association’s booklet from the
conference, it was surprising to find a few people who thought it would.
As Bill Kerry, one o f the founders o f the Equality Trust, put it, if we are going to achieve a major narrowing of income differences
while responding effectively to global warm ing, what is required
amounts to a transform ation of our societies, a transformation which will not be furthered by a departure from peaceful methods but one which is unlikely to be achieved by tinkering with minor policy options. A social movement for greater equality needs a sus
tained sense of direction and a view o f how we can achieve the
necessary economic and social changes. The key is to map out ways
in which the new society can begin to grow within and alongside the institutions it may gradually marginalize and replace. That is what making change is really about. Rather than simply waiting for government to do it for us, we have to start making it in our lives and in the institutions o f our society straight aw ay. W hat we need is

not one big revolution but a continuous stream of small changes in a consistent direction. And to give ourselves the best chance of making the necessary transformation o f society we need to remember that the aim is to make a more sociable society, which means avoiding the disruption and dislocation which increase insecurity and fear and so often end in a disastrous backlash. The aim is to increase people’s sense o f security and to reduce fear; to make everyone feel that a more equal society not only has room for them but also that it offers a more fulfilling life than is possible in a society dominated by hierarchy and inequality.
In the past, when arguments about inequality centred on the privations o f the poor and on what is fair, reducing inequality depended on coaxing or scaring the better-off into adopting a more altruistic attitude to the poor. But now we know that inequality affects so many outcomes, across so much o f society, all that has
changed. The transformation of our society is a project in which we all have a shared interest. Greater equality is the gatew ay to a society capable of improving the quality o f life for all of us and an essential step in the development o f a sustainable economic system.
It is often said that greater equality is impossible because people are not equal. But that is a confusion: equality does not mean being the same. People did not become the same when the principle of equality before the law was established. N or - as is often claimed - does reducing material inequality mean lowering standards or levelling to a common mediocrity. Wealth, particularly inherited
wealth, is a poor indicator o f genuine merit - hence George Bernard Shaw ’s assertion that: ‘Only where there is pecuniary equality can the distinction o f merit stand out.’359-p-71 Perhaps that makes Sweden a particularly suitable home for the system of N obel prizes.
We see no indication that standards of intellectual, artistic or
sporting achievement are lower in the more equal societies in our
analyses. Indeed, making a large part o f the population feel devalued can surely only lower standards. Although a baseball team is not a microcosm o f society, a well-controlled study o f over 1,6 0 0 players in twenty-nine teams over a nine-year period found that major league baseball teams with smaller income differences among players do significantly better than the more unequal ones.360 And we saw in

earlier chapters that more equal countries have higher overall levels
of attainment in many different fields.
T H E P O L I C Y F A I L U R E
Politics w as once seen as a w ay o f improving people’s social and emotional wellbeing by changing their economic circumstances. But over the last few decades the bigger picture has been lost. People are now more likely to see psychosocial wellbeing as dependent on what
can be done at the individual level, using cognitive behavioural therapy - one person at a time - or on providing support in early childhood, or on the reassertion o f religious or ‘fam ily’ values. However, it is now clear that income distribution provides policy makers with a w ay o f improving the psychosocial wellbeing of whole populations. Politicians have an opportunity to do genuine good.
Attempts to deal with health and social problems through the provision o f specialized services have proved expensive and, at best, only partially effective. Evaluations of even some o f the most important services, such as police and medical care, suggest that they are not among the most powerful determinants o f crime levels or standards of population health. Other services, such as social w ork or drug rehabilitation, exist to treat - or process - their various client groups, rather than to diminish the prevalence o f social problems. On the occasions when government agencies do announce policies ostensibly aimed at prevention - at decreasing obesity, reducing health inequalities, or trying to cut rates o f drug abuse - it usually looks more like a form of political window-dressing, a display of
good intentions, intended to give the impression o f a government
actively getting to grips with problems. Sometimes, when policies will obviously fall very far short of their targets, you wonder whether even those who formulated them, or who write the official documents, ever really believed their proposals would have any
measurable impact.Take health inequalities, for example. For ten years Britain has
had a government committed to narrowing the health gap between rich and poor. In an independent review of policy in different

countries, a Dutch expert said Britain w as ahead of other countries in implementing policies to reduce health inequalities.361 However, health inequalities in Britain have shown little or no tendency to decline. It is as if advisers and researchers o f all kinds knew, almost
unconsciously, that realistic solutions cannot be given serious consideration.
Rather than reducing inequality itself, the initiatives aimed at tackling health or social problems are nearly alw ays attempts to break the links between socio-economic disadvantage and the problems it produces. The unstated hope is that people - particularly the
poor - can carry on in the same circumstances, but will somehow no longer succumb to mental illness, teenage pregnancy, educational failure, obesity or drugs.
Every problem is seen as needing its own solution - unrelated to others. People are encouraged to take exercise, not to have un
protected sex, to say no to drugs, to try to relax, to sort out their w ork-life balance, and to give their children ‘quality’ time. The only thing that many o f these policies do have in common is that they often seem to be based on the belief that the poor need to be taught to be more sensible. The glaringly obvious fact that these problems
have common roots in inequality and relative deprivation disappears from view.
T R E N D S I N I N E Q U A L I T Y
Inequality has risen in many, but not all, developed countries over the last few decades. Figures 1 6 . 1 and 16 .2 show the widening gap between the incomes of rich and poor in Britain and the United States over a thirty-year period. The figures show the widening
gap between the top and bottom 10 per cent in each country. Both countries experienced very dramatic rises in inequality which peaked in the early 1990 s and have changed rather little since then. In both countries inequality remains at levels almost unprecedented since records began - certainly higher than it has been for several generations. Few other developed countries have shown quite such dramatic increases in inequality over this period, but only a very few

Risin
g ga
p be
twee
n ric
h an
d po
or,
rela
tive
to 19
75
Risin
g ga
p be
twee
n ric
h an
d po
oi;
rela
tive
to 19
75
Figure 16 .1 The widening gap between the incomes o f the richest and poorest 10 per cent in Britain 19 7 s (=1) to 2005-2006.
Figure 16 .2 The widening gap between the incomes o f the richest and poorest 10 per cent in the USA 1975 (=1) to 2004.

- such as The Netherlands - seem to have avoided them entirely. Others, like Sweden, which avoided them initially, have had steep rises since the early 1990s.
The figures showing widening income inequality in Britain and the United States leave no room for doubt that income differences do change substantially over time and that they are now not far short of 40 per cent greater than they were in the m id-1970s.
If things can change so rapidly, then there are good reasons to feel confident that we can create a society in which the real quality o f life and of human relationships is far higher than it is now.
Whenever governments have really wanted to increase equality, policies to do so have not been lacking. The historical evidence confirms the prim acy o f political will. Rather than greater equality waiting till well-meaning governments think they can afford to make societies more equal, governments have usually not pursued more egalitarian policies until they thought their survival depended on it.
In the early L990S a W orld Bank report pointed out that rapid economic growth in a number o f East Asian countries was underpinned by growing equality.366 In trying to explain w hy governments had adopted more egalitarian policies, the report said that it was because they faced crises o f legitimacy and needed to gain popular support. The governments in Taiw an and Hong Kong faced rival claims from the Communist Chinese government. South Korea faced North Korea, and the governments of Singapore and the Philippines faced guerrilla forces. Describing policy in these countries, John Page, writing in a L994 W orld Bank publication, said:
Very explicit mechanisms were used to demonstrate the intent that all would have a share of future wealth. Korea and Taiwan carried out comprehensive land reform programs; Indonesia used rice and fertilizer price policies to raise rural incomes; Malaysia introduced explicit wealth sharing programs to improve the lot of ethnic Malays vis-a-vis the better off ethnic Chinese; Hong Kong and Singapore undertook massive public housing programs; in several economies, governments assisted workers’ cooperatives and established programs to encourage small and mediumsized enterprises. Whatever the form, these programs demonstrated that the government intended for all to share in the benefits of growth.367

Japan owes its status as the most equal o f the developed countries
partly to the fact that the whole establishment had been humiliated
by defeat in the Second W orld W ar, and partly to the support for political and economic reconstruction - including drawing up a new constitution - provided by disinterested, and rem arkably far-sighted, American advisers w orking under General M acA rthur.95
Other examples o f increases in equality have similar origins.
Bism arck’s early development of forms o f social insurance were part o f his attempt to gain popular support for his project o f unifying the German states. Britain became substantially more equal during both the First and Second W orld W ars as part of an attempt to gain
support for the w ar effort by making people feel the burden o f war was equally shared. As Richard Titmuss put it: ‘If the cooperation of the masses was thought to be essential [to the w ar effort], then inequalities had to be reduced and the pyramid o f social stratification had to be flattened.’368
Sweden’s greater equality originated in the Social Democratic Party’s electoral victory in 19 3 2 which had been preceded by violent labour disputes in which troops had opened fire on sawmill workers. As prime minister almost continuously from 19 3 2 to 19 4 6 , Per Albin Hansson was able, during Swedish rearmament and the war, to push through his aim o f making Sweden ‘a classless society’ and
‘the people’s home’ .Turning now to examples o f where income differences have
widened rather than narrowed, the central role o f politics is no less clear. In Figures 1 6 . 1 and 16 .2 we saw the widening of income differences in Britain and the U SA which took place particularly during the 1980 s and early 1990s. Paul Krugm an, the N obel Prize winning economist, analyses the reasons for rising inequality in the U SA . He says that the conventional explanation is that it was driven by a rising demand for skilled labour, resulting mainly from the spread of information technology, and by the import o f cheap goods, such as textiles, replacing less skilled labour. However, he dismisses these
explanations saying that econometric research suggests that they are only a small part o f the picture. He also points out that factors such as these do not explain the runaway incomes at the top - for instance among C E O s - which was one o f the main features o f the growth in

inequality, and adds that although these forces have been at w ork in all rich countries, income differences widened in only some of them. Countries in which inequality did not increase during the 1980s and early ’90s include Canada, France, Japan , Netherlands, Spain and
Switzerland.406,407Confining his attention largely to the U SA , Krugm an argues that,
rather than market forces, rising inequality was driven by ‘changes in institutions, norms and political pow er’ . He emphasizes the w eakening of trade unions, the abandonment o f productivity sharing agreements, the influence o f the political right, and government changes in taxes and benefits. He could also have added the failure
to maintain adequate minimum wage legislation.Despite substantial differences between countries, the basic trends
in income distribution seen in the U SA throughout the twentieth century can be seen in many countries. After inequalities rose to a
peak just before the Great Crash o f 19 2 9 , they then narrowed so
dram atically in the later 19 3 0 s and early ’40s that the period is sometimes referred to as the ‘Great Com pression’ . Income differences then remained narrower until the later 19 70 s or the mid 1980s. They then started to widen rapidly again until just before the
most recent financial crash, where they reached levels o f inequality
not seen since just before the 19 2 9 crash.M ost research on changes in income distribution is concerned
with dividing up the components of the overall trends: how much is due to widening differences in earnings? H ow much to changes in taxes and benefits? H ow much is due to simultaneous growth in
workless and two-earner households? And then, at the next causal level down, how much of the widening differences in earnings is due to weaker trade unions and how much is due to a decline in demand for unskilled labour? But the truth is that the m ajor changes in income distribution in any country are almost never attributable
simply to market forces influencing wage rates. W hat we see instead is something much more like the changes in institutions, norms and the use of political power which Krugm an describes in the U SA. Differences in pre-tax earnings rise, tax rates are made less progressive, benefits are cut, the law is changed to weaken trade union powers and so on. Together these are a fairly clear sign o f a change

in norms and political outlook. If that were not so, and widening
differences in earnings were politically unacceptable, governments
would have acted to reduce rather than increase the differences. In Britain it was not until after the change of government in 19 9 7 that any such attempts were made.
There can be even less doubt about the political nature of the compression o f income differences before and during the Second W orld W ar. Against a backdrop of the Depression, unprecedented levels o f unemployment and growing signs o f social unrest, coupled, presumably, with a fear o f the spread o f communism, governments took action. In the U SA President Roosevelt inaugurated the N ew
Deal in the early L930S and, with the coming o f war, many governments reduced income differences even more dramatically.
If ‘market forces’ were the real drivers o f inequality, it is unlikely that the post-war settlement would have remained intact for three or four decades before income differences began to widen again more rapidly in the 1980s. The ending o f that consensus was very clearly related to a rightward shift in political opinion. The triumph of the new right extolling the benefits o f the free market and the dominance o f monetarist economics were enshrined in the political leadership of Reagan in the U SA and Thatcher in Britain. Communism had ceased to be a realistic threat and many governments privatized what had been state owned public utilities.
To recognize how political attitudes sweep across the international
scene, we have only to look at the w ay revolutionary upheavals of 18 4 8 shook half a dozen different European countries, or remember the radicalism o f the 1960 s, or how many communist governments collapsed in 19 8 9 -9 0 . An indicator that the widening income differences o f the 1980s resulted from another such change in the political
wind is that, with the exception o f Canada, they widened most
rapidly in English speaking countries - in Britain, the U SA , N ew Zealand and Australia - accompanied in each case by a free-market ideology and by policies designed to create a more ‘flexible’ labour force. Stronger linguistic and ideological connections meant that English speaking countries caught the disease quickly from each other and caught it badly.
A study which analysed trends in inequality during the 19 8 0 s and

1990s in Australia, Canada, Germ any, Japan , Sweden, the United Kingdom and the United States, found that the most important single factor was trade union membership.370 Although high levels o f un
employment weaken the bargaining power o f labour, in this study, declines in trade union membership were most closely associated with widening income differences.
N ot only the extent o f unionization but provisions for labour representation in companies are also likely to affect wage settlements. The Commission of the European Union requires minimum
standards o f representation and consultation for all larger companies but it is not clear how far practice in different countries conforms to what was intended. In Japan , however, there is often a much closer relationship between management and unions. Indeed, the Japanese Federation of Employers Association found that 15 per
cent o f the directors of large companies were former trade union
officials.371 In the countries o f the European Union the earnings of some 70 per cent o f employees are covered by collective agreements, compared to only 15 per cent in the U SA . At 35 per cent, the figure
for the U K is among the lowest in the EU.
D I F F E R E N T R O U T E S T O G R E A T E R E Q U A L I T Y
Rather than suggesting a particular route or set o f policies to narrow
income differences, it is probably better to point out that there are many different w ays o f reaching the same destination. In Chapter 13 we showed that although the more equal countries often get their greater equality through redistributive taxes and benefits and through a large welfare state, countries like Japan manage to achieve low levels of inequality before taxes and benefits. Japanese differences in gross earnings (before taxes and benefits) are smaller, so there is less need for large-scale redistribution. This is how Japan manages to be so much more equal than the U S, even though its social security transfers were a smaller proportion of G D P than
social security transfers in the U S A .362 Although, o f all the countries
included in our analyses, the U SA and Japan are at opposite

extremes in terms o f inequality, the proportion o f their G D P taken up by government social expenditure is small in both cases: they come second and third lowest o f the countries in our analysis.
Similar evidence that there are very different routes to greater equality can also be seen among the American states.363 The total tax burden in each state as a percentage of income is completely
unrelated to inequality. Because Vermont and N ew Hampshire are neighbouring N ew England states, the contrast between them is particularly striking. Vermont has the highest tax burden o f any state of the union, while N ew Hampshire has the second lowest - beaten only
by A laska. Yet N ew Hampshire has the best performance o f any state
on our Index o f Health and Social Problems and is closely followed by Vermont which is third best. They both also do well on equality: despite their radically different taxation, they are the fourth and sixth most equal states respectively. The need for redistribution depends on how unequal incomes are before taxes and benefits.
Both the international and US state comparisons send the same
message: there are quite different roads to the greater equality which improves health and reduces social problems. As we said in C hapter 1 3 , what matters is the level o f inequality you finish up with, not how you get it. However, in the figures there is also a clear warning for those who might want to place low public expenditure and taxation at the top of their list o f priorities. If you fail to avoid high
inequality, you will need more prisons and more police. You will have to deal with higher rates o f mental illness, drug abuse and every other kind o f problem. If keeping taxes and benefits down leads to wider income differences, the need to deal with the ensuing social ills may force you to raise public expenditure to cope.
There may be a choice between using public expenditure to cope with social harm where inequality is high, or to pay for real social benefits where it is low. An example o f this balance shifting in the wrong direction can be seen in the U SA during the period since 19 8 0 , when income inequality increased particularly rapidly. During
that period, public expenditure on prisons increased six times as fast
as public expenditure on education, and a number of states have now reached a point where they are spending as much public money on prisons as on higher education.364

N ot only would it be preferable to live in societies where money can be spent on education rather than on prisons, but policies to
support families in early childhood would have meant that many of those in prison would have been earning and paying taxes instead of being a burden on public funds. As we saw in Chapter 8, pre-school provisions can be a profitable long-term investment: children who
receive these services are less likely to need special education and,
when they reach adulthood, they are more likely to be earning and less likely to be dependent on welfare or to incur costs through crime.36S
It is tempting to say that there are two quite different paths to greater equality, one using taxes and benefits to redistribute income
from the rich to the poor, and the other achieving narrower differences in gross market incomes before any redistribution. But the two strategies are not mutually exclusive or inconsistent with each other. In the pursuit o f greater equality we should use both strategies: to rely on one without the other would be to fight inequality with one
arm tied behind your back. Nevertheless, it is worth remembering that the argument for greater equality is not necessarily an argument for big government. Given that there are many different ways of diminishing inequality, what matters is creating the necessary politi
cal will to pursue any o f them.
P O L I T I C A L W I L L
So if it all boils down to politics, how can we create the necessary political will to narrow income differences? The strength o f the
evidence that a more equal society is a better society has a key role to play in changing public opinion. M any people have a strong personal belief in greater equality and fairness, but these values have remained private intuitions which they fear others do not share. The advantage o f the growing body o f evidence of the harm inflicted by inequality is that it turns what were purely personal intuitions into publicly demonstrable facts. This will substantially increase the confidence o f those who have alw ays shared these values and encourage them to take action. In addition, some people will change their views

in the light o f the new evidence. M any people are seriously worried about the many signs o f social failure in our societies and search for explanations.
Political differences are more a reflection o f different beliefs about the solution to problems than o f disagreements about what the problems are. Alm ost everyone, regardless o f their politics, would prefer to live in a safer and more friendly society. Everyone will agree that a good society would have fewer of all the health and social problems we have looked at. The argument is therefore about solutions. Although people have suggested many ways of helping
individuals facing particular difficulties, the evidence presented in this book suggests that greater equality can address a wide range of problems across whole societies. And if greater equality is also an important component o f policies to tackle global warm ing, there is
much to recommend it. Recent research in Britain using focus groups
has shown that an understanding o f the effects o f inequality can have a powerful influence on people’s attitudes to it.408 Participants drawn from across the social and political spectrum were shown the evidence provided in this book on how inequality affects trust, child conflict, and mental illness. As well as finding the relationships
intuitively plausible, they were also moved by them. M any o f those
previously opposed to greater equality changed their minds. Even people who rejected appeals for greater fairness were in favour of greater equality when it was presented as part o f a social vision around improving the quality of life for everyone. In terms o f creat
ing the necessary political will, the evidence was regarded as one of the most important reasons for reducing inequality.
For several decades progressive politics have been seriously weakened by the loss o f any concept o f a better society. People have argued for piecemeal improvements in different areas of life,
campaigned against new environmental threats or for better treat
ment o f asylum seekers, and have demonstrated against military interventions. But nowhere is there a popular movement capable of inspiring people with a vision o f how to make society a substantially better place to live for the vast majority. W ithout that vision politics
will rarely provoke more than a yawn.
Yet most people do want change. In the first chapter o f this book

we referred to a research report called Yearning fo r Balance, which
showed that three-quarters or more of Americans felt that society
had lost touch with what really m attered.1 Consumerism and materialism, they felt, were winning out over more important values to do with friends, family and community. Although politicians recognize a deep-seated malaise, and so campaign for votes, saying that they stand for ‘change’ , they sometimes seem to have few ideas for change
which go deeper than differences in the personal images they project.
There is no suggestion that they have any view o f how to begin changing daily life into something more joyful and fulfilling.
Public opinion polls suggest that there is a substantial desire for narrower income differences. In Britain over the last twenty years
polls have shown that the proportion o f the population who think
that income differences are too big has averaged around 80 per cent and has rarely dipped below 75 per cent - even though most people underestimate how big income differences actually are. In the U SA , the 2005 M axw ell Poll on Civic Engagement reported that over 80 per cent of the population thought the extent of inequality was
a problem, and almost 60 per cent thought the government should try to reduce it. Gallup polls between 19 8 4 and 2003 which asked Americans whether income and wealth were fairly distributed or should be more evenly distributed, found that over 60 per cent of the population thought they should be more evenly distributed.369
C O R P O R A T E P O W E R - T H E E L E P H A N T I N T H E L I V I N G R O O M
Part o f the problem o f political will is the feeling that we do not have the means to make any difference. We may all decry the vast wealth of the super-rich, but what can we do? Unions can, as the evidence suggests, make some difference, but it is hard to escape the conclusion that the high levels of inequality in our societies reflect
the concentrations o f power in our economic institutions. The
institutions in which we are employed are, after all, the main source of income inequality. It is there that value is created and divided between the various gradations o f employees. It is there that the

inequities which necessitate redistribution are set up. And it is there that we are most explicitly placed in a rank-ordered hierarchy, superiors and inferiors, bosses and subordinates.
In 2007 chief executives of 365 o f the largest US companies
received well over 500 times the pay o f their average employee, and these differences were getting bigger. In many o f the top companies the chief executive is paid more in each day than the average worker is in a year. Am ong the Fortune 500 companies the pay gap in 2007 was close to ten times as big as it was in 19 8 0 , when the long rise in income inequality was just beginning.
Because the ratio o f C E O pay to average w orker pay varies
somuch between large and small companies and from one sector to another, it is difficult to compare like with like when making international comparisons. However, an attempt (from a respected source) to make such comparisons, suggests that ratios o f C E O
compensation to the pay of production workers in manufacturing
might be 1 6 : 1 in Japan , 2 l :l in Sweden, 3 1 : 1 in the U K and 4 4 :1 in the U S A .372
According to the annual survey o f chief executives’ pay carried out by the G uardian , boardroom pay in the 10 0 companies included in the Financial Times Stock Exchange index in Britain has risen in
successive years by 16 per cent, 13 per cent, 28 per cent and most
recently (20 0 6 -2 0 0 7) by 37 per cent at a period when inflation was rarely more than 2 per cent.373 The average pay (including bonuses) for the chief executives o f top companies stood at just under £2.9 million. After reviewing empirical research, the International Labour
Organization concluded that there is little or no evidence o f a rela
tionship between executive pay and company performance and suggested that these excessive salaries are likely to reflect the dominant bargaining position o f executives.374
Top business pay has far outstripped anything in the public sector.
In the U S A , the twenty highest-paid people w orking in public
traded corporations received almost 40 times as much as the twenty highest-paid people in the non-profit sector, and 200 times more than the twenty highest-paid generals or cabinet secretaries in the Federal Government.375
It seems likely that the denationalization o f m ajor industries and

the privatization o f large numbers of friendly societies, mutuals, building societies, provident societies and credit unions, which had been controlled by their members, may have made a substantial contribution to the widening income differences shown in Figures 16 .1 and 16 .2 . It was common practice for C E O s and other senior
managers to receive huge salary increases shortly after conversion to profit-making corporations. This probably explains some of the sharp rise in inequality which Figure 1 6 . 1 shows took place in Britain around the m id-1980s. British Telecom was privatized in 1 983 , British Gas in 19 8 6 , followed by a flood o f major companies
in 19 8 7 . The international extent o f the widening o f income in
equality is also consistent with a contribution from privatization.Numerous corporations are now bigger than many nation states.
In the words o f the United Nations Conference on Trade and Development (U N C T A D ):376
Twenty-nine of the world’s 100 largest economic entities are transnational corporations (TNCs), according to a new U N CTA D list that ranks both countries and TN C s on the basis of value added. Of the 200 T N C s with the highest assets abroad in 2000, Exxon is the biggest in terms of value
added ($63 billion). It ranks 45th on the new list, making it comparable in
economic size to the economies of Chile or Pakistan. Nigeria comes in just between DaimlerChrysler and General Electric, while Philip Morris is on a par with Tunisia, Slovakia and Guatemala.
Using different measures, other estimates suggest that half o f the
w orld ’s largest economies are multinationals, and that General M otors is bigger than Denmark, that Daim lerChrysler is bigger than Poland; Royal Dutch/Shell bigger than Venezuela, and Sony bigger than Pakistan. Like the aristocratic ownership o f huge tracts o f land, which in 1 7 9 1 Tom Paine attacked in his The Rights o f M an ,377 these productive assets remain effectively in the hands o f a very
few, very rich people, and make our claims to real democracy look pretty thin.
In Tom Paine’s lifetime the capitalist system w as in its infancy. As an advocate of equality and democracy, he focused his attack on the landed aristocracy, the nobility, the monarchy, and on their ownership of huge swathes of land. He seems to have assumed
that the market system, then involving mainly small traders and craftsmen, would remain small-scale, fairly egalitarian, and so compatible with democracy. H ad he foreseen how the development of huge multinational corporations would surpass the concentrations o f wealth and undemocratic power of his day, he would surely have included them in his sights. It is not possible to discuss ways of reducing income differences without discussing what can be done about these bastions of wealth, power and privilege.
The failed experiment with state ownership in the centrally planned economies o f the former Soviet Union and Eastern Europe was intended, among other things, to provide a solution to the problem o f the growing concentration o f productive power in private hands. But concentrating that power into the hands o f the state was not only sometimes hugely inefficient, but invited corruption, led to the denial o f important basic freedoms and harmed public life. That failure seems to have made us feel there are no workable alternatives to the standard capitalist model and prevented us thinking creatively about other more democratic and egalitarian methods. We blinker ourselves to the fact that there are lots o f alternatives, many of which are already part of our lives and flourishing all around us.
A L T E R N A T I V E S
In his book, Am erica B eyon d Capitalism : Reclaim ing our Wealth, our L iberty and our D em ocracy, G ar Alperovitz, a professor of political economy at the University of M aryland, summarizes the variety and scale o f the alternatives operating in the U S A .378 He emphasizes the huge size of the non-profit sector. In the twenty largest US cities almost 40 per cent o f the 200 largest enterprises are
non-profit organizations like universities and medical institutions. He mentions the 2,000 municipal electric utilities which supply 40 million Americans with electricity. Largely because they are not having to make profits for shareholders they are often cheaper - an
average of 1 r per cent cheaper, Alperovitz says - than profit-making
companies, and many pay particular attention to sustainability and the development of renewable sources of power. Also at the local

level, he discusses organizations like the 4,000 or so Community Development Corporations which support local communities by setting up low-income housing schemes, providing finance for local
businesses which they sometimes own and control. There are 48,000 co-ops in the US and some 12 0 million people are members of them. There are around 10 ,0 00 credit unions, with assets totalling $600 billion, providing financial services for 83 million Americans. Around 1,0 0 0 mutual insurance companies are owned by their policy-holders, and 30 per cent o f American farm products are marketed through co-operatives.
In Britain institutions like universities, hospitals and local government are also often the largest local employers. Because medical care and universities - like the rest o f education - are almost entirely publicly funded, they are governed by bodies accountable to the public. The governing bodies of O xford and Cam bridge colleges are democratically comprised of all fellows. Despite a stampede to cash
in the profits to be made by selling o ff friendly societies and mutuals, there are still 63 building societies (with over z,ooo branches and38,000 employees), 650 credit unions, 70 mutual insurance companies as well as 250 friendly societies in Britain, providing various
financial services to their members. There are almost 170 ,0 0 0
charities with a combined annual income o f over £44 billion. In 2007 the Co-operative Bank, with £40 billion o f assets, was recognized as the most corporately responsible com pany in the U K , according to Business in the Community, an influential charitable association of British companies. The recently revamped 6,300
Co-op shops still have a market share of about 5 per cent o f all food retailing and they remain the U K ’s largest ‘neighbourhood’ retailer with a share of almost 8 per cent of that market. Even Britain’s experience o f nationalized industries (which once covered electricity, gas, water, telephones, railways) was not all bad. Throughout the
19 50 s and 1960s, as the economist and journalist Will Hutton has
pointed out, productivity in the nationalized industries matched or exceeded the private sector.379 He says they began to get a bad name when governments raided their profits and held down their prices to help reduce inflationary pressures in the national economy.
The variety and vast scale o f this organizational experience

leaves no doubt that profit-making business is not the only effective
w ay people can w ork together to provide important services. It is a
truism - but nevertheless an important one - to say that the key difference between the kinds of organization we have listed and profit-making corporations is simply whether or not their prim ary purpose is to make money or to provide a service while remaining economically viable. Although some profit-making businesses have
high ethical standards, the institutional fram ework (and often cutthroat market pressures) seem to invite them into an exploitative relationship with society - hence perhaps why we have needed a ‘fair trade’ movement. Presumably because o f the motivational
difference, there is a strong impression that many o f the other forms o f organization allow institutions to develop a service ethic and to see their purpose as the furthering o f environmental and community interests. The fact that top salaries in the profit-making sector are several hundred times top political, judicial or military salaries is no doubt partly a reflection o f the profit-making motive.
W H A T C A N B E D O N E ?
So how can the inequality-generating forces in the profit-making sector be contained and democratized? H ow can they be adapted to fit in with the need to make our societies more equal? W hat can we do which cannot be easily reversed by an incoming government with opposing interests? When thinking about this we should keep in mind just how fundamental a turning point we have reached in human history. As we showed in Chapters i and 2, further improvements in the quality o f life no longer depend on further economic growth: the issue is now community and how we relate to each
other.One approach to tackling runaw ay pay rates at the top might be
to plug loopholes in the tax system, limit ‘business expenses’ , increase top tax rates, and even legislate to limit maximum pay in a
com pany to some multiple of the average or lowest paid. While such solutions may seem to be the only short-term option, they are very vulnerable to changes in government: even if effective tax changes

were devised and introduced, a new government with different political allegiances could simply reverse them all. Given the importance o f keeping inequality down, we need to find ways o f ensuring that greater equality is more deeply rooted in the fabric o f our societies and less vulnerable to the whim of successive governments. We need to address the. concentrations o f power at the heart o f the
economic life.An approach which would solve some o f the problems is demo
cratic employee-ownership. It not only avoids concentrating power in the hands o f the state, but evaluations suggest that it has major economic and social advantages over organizations owned and
controlled by outside investors in whose interests they act.
In many countries, governments use tax concessions to encourage employee share-ownership systems. They do so because it is assumed that share ownership improves com pany performance by reducing the opposition o f interests between employers and employees. In
the U K , share-ownership schemes now cover almost a quarter o f all
employees and some 15 or 20 per cent o f all U K companies.380-81 In the U S, the 2.001 T a x Law increased the tax advantages o f Employee Stock Ownership Plans (ESO Ps), and they now cover 8 million employees in 10 ,0 0 0 firms with an average employee-ownership of 1 5 - 2 0 per cent.382
However, many share-ownership schemes amount to little more than incentive schemes, intended to make employees more compliant with management and sometimes to provide a nest-egg for retirement. As a result, they are often seen as tokenism, rather than as a key to transforming the structure o f employment. This is why
research shows that employee share-ownership, on its own, is not enough to make much difference to company performance. Patrick Rooney, an economist at the universities o f Indiana and Purdue, found that employee share-ownership did not necessarily mean
that employees were more involved in the running o f the companies in which they w orked.383 He compared the extent o f employee participation in a wide range o f decisions in companies with and without employee share-ownership schemes. In general, employee involvement was low, but even in companies with employee share- ownership schemes staff members were often not informed or

consulted, and the m ajority of these companies did not enable employees to have a significant input into decision making.
To make a reliable difference to company performance, share- ownership has to be combined with more participative management methods.384-5 There have now been a number o f large and well- controlled studies - including those using before-and-after perform ance data for several hundred matched pairs o f companies386 - which demonstrate the economic benefits o f the combination o f employee share-ownership and participation.385-387 The studies show repeatedly that substantial performance benefits come only when employee share-ownership schemes are accompanied by more participatory management methods.380’ 383> 388-9 Research that looked at a large number o f British companies during the 1990s found that employee share-ownership, profit-sharing and participation each make an independent contribution to increased productivity.380 A review of
research concluded :385
We can say with certainty that when ownership and participative management are combined, substantial gains result. Ownership alone and participation alone, however, have at best, spotty or short-lived results,
(p. n ). . . the impact of participation in the absence of (share) ownership is
short-lived . . . Ownership seems to provide the cultural glue to keep participation going, (p. 3)
Studies o f how w ork affects health point in the same direction: as
we saw in Chapter 6 , people seem to thrive where they have more control over their w ork. Having control at work was the most successful single factor explaining threefold differences in death rates between senior and junior civil servants w orking in the same govern
ment offices in Britain.64 In practice, this probably has a lot to do
with a sense o f autonomy and not feeling so directly subordinated. The importance of control at w ork is now understood to involve a greater degree o f workplace democracy.390 There is, in addition, growing evidence that a sense o f unfairness at w ork is an important risk factor for poor health.391
The concept o f a company being owned by outside investors
has implications which look increasingly anachronistic. A smaller

and smaller part of the value o f a company is the value o f its build
ings, equipment and marketable assets. It is instead the value o f its employees. When companies are bought and sold, what is actually being bought and sold is, above all, its staff as a group o f people, with their assembled skills, abilities, and knowledge o f company systems and production methods. Only they have the ability to make
the com pany tick. And of course the concept o f a group o f people being bought and sold, and belonging to anyone but its own members, is a concept which is the very opposite o f democratic.
Should employees not have full control over their w ork and the distribution o f its earnings? And should external shareholders
really receive unearned income beyond agreed interest on capital? Participation, commitment, control and profit-sharing would be maximized if companies were 10 0 per cent employee-owned. Companies could raise capital through loans or mortgages, retaining control themselves. At the moment, only a tiny proportion o f the
money gambled on the Stock Exchange makes any contribution to helping companies buy productive assets. Indeed, over time the payment of dividends to external shareholders is a major drain on com pany profits which might have been used to improve their technology and equipment.
Robert Oakeshott, a British authority on employee-ownership, says that employee-ownership ‘entails a movement from business as a piece o f property to business as a w orking community’ .388’ p- 104
Companies change from being property to being communities when employees own a m ajority o f shares and so control the business. That is when management becomes responsible, not to outside shareholders with little interest in the com pany beyond returns on capital, but to the body o f employees. Then company meetings become occasions when management reports back to employees and has to deal with questions and discussion among people who have an intimate knowledge of what has gone right and what has
gone wrong in the preceding period, and what the remedies might be. The transformation after an employee buy-out from the usual top-down mentality can involve a long slow process o f people’s emancipation from the usual assumptions round class and ability
which make those in more junior positions feel themselves to be

inferior human beings. We discussed in Chapter 8 some o f the experimental evidence using race and caste to show how attributions
of inferior status can affect performance.
This process of adjustment and emancipation is described in Local Heroes, David Erdal’s account o f the employee buy-out o f Loch Fyne Oysters in Scotland.392 It is in part a process o f undoing the damage of class inequality, a process presumably made more difficult by the fact that such assumptions remain entrenched all around people in the rest o f their lives. H ow ever, the structures in
which we w ork are pivotal.
Co-operatives and employee buy-outs have often originated as responses to desperate circumstances in which traditional systems of ownership and management have failed. Employees have used them to avoid closures and unemployment in the most difficult market
circumstances. Even then they have sometimes succeeded beyond
expectations - as did Tow er Colliery in South Wales when, in 19 9 5 , miners used their redundancy money to buy the pit and ran it successfully until the coal was worked out thirteen years later. M any fully employee-owned companies have a proud record. Exam ples
include, or have included, the London Symphony Orchestra, Carl
Zeiss, United Airlines, Gore-tex, the Polaroid Corporation, and the John Lewis Partnership (one o f Britain’s most successful retailers with 68,000 employee-partners and annual sales o f £6-4bn). In the U SA , among the largest m ajority employee-owned companies are
Publix Supermarkets, Hy-vee Supermarkets, Science Applications
International Corporation (SA IC ), the international engineering and construction company C H z M Hill and Tribune which, among other media operations, publishes the Los Angeles Times and Chicago Tribune. These companies average 55,000 employees each.
One o f the best-known co-operative groups is the M ondragon Corporation in the Basque region o f Spain. Over half a century it has developed into a group o f over iz o employee-owned co-operatives with 40,000 worker-owners and sales o f $4.8 billion US dollars. M ondragon co-operatives are twice as profitable as other Spanish firms and have the highest labour productivity in the country.388 It is hard to explain some o f the successes unless a combination

of ownership and participation does indeed have the potential to
improve productivity by reducing the conflict o f interests.
For most o f the employed population it is at work that they interact most closely with people other than fam ily and have the potential to feel part o f a community. In Chapter 3 we saw evidence o f the huge rises in anxiety which have taken place over the last fifty or so years as community life has weakened under the impact o f growing
geographical and social mobility. While greater equality is associated with more cohesive communities and higher levels o f trust (see Chapter 4) and so may be expected to improve life in residential neighbourhoods, in the near future we are unlikely to regain the
benefits of the very close-knit residential communities of the past.
But at w ork there is the potential for people to find a nucleus of friendships and to feel valued. This potential is usually undermined by the hierarchical stratification of people into various gradations of order-givers and order-takers, which ensure that employees act not as a community, but as property, brought together and used to earn
a return on other people’s capital. One o f us recently visited two small companies soon after they had been bought by their employees. When staff were asked what difference it had made, the first thing office staff in both companies said in reply was that, when they went on to the shop floor, ‘people look you in the eye’ . Under the old
system, eye contact had been avoided.Employee-ownership has the advantage o f increasing equality
specifically by extending liberty and democracy. It is bottom-up rather than top-down. Although we don’t know what scale of income differences people would think fair, it seems likely that they
might agree that the chief executive of the com pany they w ork for should be paid a salary several times as big as their own - maybe three, or perhaps even ten, times as big. But it is unlikely that they would say several hundred times as big. Indeed, such huge differentials can probably only be maintained by denying any measure of economic democracy.
As long as the employee-owned sector remains only a small part of the whole economy, it cannot use very different pay scales from other companies. If employee-owned companies paid junior workers

more than other companies, and the most senior staff less, then the junior staff would never leave and senior ones would be harder to recruit. However, as the employee-owned sector became larger, people’s norms and values about what are appropriate rates o f pay
for different jobs, and what differentials are acceptable, would change. We might at least move towards the norms o f the public and non-profit sector. And if there was no longer a set o f hugely wealthy private sector bosses inviting comparisons and making people think such salaries could be justified, the non-profit sector might itself become more egalitarian. Perhaps it is time we moved aw ay from
a world in which people regard maximizing personal gains as a laudable aim in life.
David Erdal, former chair of the Tullis Russell Group and Director o f the Baxi Partnership, once studied the effects o f em ployment in co-operatives on the communities in which they were
situated.393 He compared three towns in northern Italy: Imola, which
has 25 per cent of its workforce employed in co-operatives, Faenza, where 16 per cent w ork in co-operatives, and Sassuolo where there are no co-operatives. On the basis o f rather a small survey and low response rates, he concluded that health, education, crime and social
participation were all better in the towns with a larger proportion of the population employed in co-operatives.
As a w ay of creating a more egalitarian society, employee- ownership and control have many advantages. First, it enables a process of social emancipation as people become members o f a team. Second, it puts the scale o f earning differentials ultimately under
democratic control: if the body o f employees want big income differentials they could choose to keep them. Third, it involves a very substantial redistribution o f wealth from external shareholders to employees and a simultaneous redistribution of the income from that wealth. In this context, that is a particularly important advantage.
Fourth, it improves productivity and so has a competitive advantage. Fifth, it increases the likelihood that people will regain the experience o f being part o f a community. And sixth, it is likely to improve sociability in the wider society. The real reward however, is not simply to have a few employee-owned companies in a society still dominated by a hierarchical ideology and status-seeking, but to have

a society o f people freer of those divisions. And that can only be achieved by a sustained campaign over several decades.
Rather than being compatible with just one system o f management and w ork organization, employee-ownership is highly flexible. It merely puts ultimate authority in the hands of employees to develop whatever systems they find w ork best. This enables systems to evolve to suit any situation. Systems o f w ork teams, o f directors elected for longer or shorter periods, o f departmental represen
tatives, o f com pany trustees, o f anything from weekly to annual com pany meetings, could all be tried from place to place. Power could be delegated, or exercised directly by the body o f voting employees. Gradually people would learn the strengths and w eak
nesses of different structures and what forms o f democracy best
fitted the public and private sectors and how to represent the interests o f consumers and local communities.
How ever, to ensure that the number o f employee-owned w orkplaces increases, it is essential that they are constituted - as they easily can be - in w ays which prevent employees from selling their
companies back to external shareholders. Although most are adequately protected, there have also been cases o f sell-outs in which companies have been lost to employee-ownership and control.
As a means o f transforming our societies, employee-ownership has the advantage that it can (and does) exist side by side with conventional business structures. N ew and old forms o f business can
coexist: with the right legal support and tax incentives the trans
formation o f society can start straight away. It enables us to embark on a fundamental transformation o f our society through an orderly transition, making the new society grow within the old. Governments can give additional incentives and support to encourage
employee share-ownership. Companies might be required to transfer a proportion o f shares each year, and retiring owners might sometimes be willing to pass their companies to employees.
Although employee-owned and controlled industry need not involve local community and consumer representatives on the
governing body, that is a fault which can easily be remedied. It might also be said in opposition to employee-ownership, that it does nothing about the basic am orality o f the market. The desire to earn
a bigger profit would still lead companies to act in anti-social w ays, however they were controlled. As well as some highly ethical companies operating in the market supporting fair trade, the environment, giving to local communities, etc., there are, at the same time, also companies trying to expand markets for tobacco in the
developing w orld in the sure knowledge that they will cause millions o f extra deaths. There are companies which have caused needless deaths by encouraging mothers in developing countries to buy powdered baby milk instead o f breast feeding, despite lack o f access to clean water or basic hygiene. There are others which continue to
destroy ecosystems, land and water supplies, to exploit mineral
resources where governments are too weak or corrupt to stand up to them, and still others use their patents to prevent life-saving drugs being sold at affordable prices in poorer countries.
There are reasons to think that employee-owned companies might
maintain higher standards o f m orality even with the profit motive.
In conventional employment people are specifically hired to w ork for purposes which are not their own. They are paid to use their expertise to whatever purpose their employer chooses. You might disagree with the purpose to which your w ork is being put, you might not even know what the purpose is, but you are not employed to have
opinions about such things and certainly not to express them. Such issues are not your concern. If you are hired to advise on how your com pany can expand its markets, improve profits, avoid press attention, the chances are that you are not being asked for an ethical opinion. You are hired to put your expertise to w ork to serve someone else’s purpose. N ot only are the purposes not your responsibility,
but as an employee you are likely to feel absolved from responsibility for them. This is why people have so often disclaimed responsibility for what they were doing by saying that they were ‘only carrying out orders’ . The famous M ilgram experiments showed that we have such a strong tendency to obey authority that it can result in us doing some
pretty aw ful things. In what was presented as a ‘learning’ experiment, M ilgram showed that people were willing to deliver w hat they believed were not only very painful, but also life-threatening electric shocks to a learning partner whenever the partner gave the wrong answer to a question. They did this at the request o f a man in a white

coat conducting the experiment, despite hearing what they thought were the screams caused by the shocks they delivered.394
H ow ever, within a fram ework o f employee-ownership and con
trol, people specifically regain ownership and control o f the purposes of their work. If, for instance, you get to know that some aspect of a design or manufacturing process is harming children’s health, you would want to change it and would probably start by finding out what colleagues thought about it. There would not be the same pressure to keep your doubts to yourself. N or would you be able to shrug it off, dismissing it as none of your business. Neither would you fear that your job would be in jeopardy if you raised aw kw ard questions. Although employee-owned firms would not be above all anti-social behaviour, it is likely that they would succeed in making it at least a little less common.
F R E E D O M A N D E Q U A L I T Y
The idea that we can’t have both liberty and equality seems to have
emerged during the Cold W ar. W hat the state-owned economies
o f Eastern Europe and the Soviet Union seemed to show was that greater equality could only be gained at the expense o f freedom. An important ideological cost o f the Cold W ar was that America gave up its historical commitment to equality. For the first Americans, as for Tom Paine, you couldn’t have true liberty without equality. Without
one you could not have the other. Slavery, as the simultaneous denial o f both, proved that rule. Equality was the bastion against arbitrary power. This was expressed in the historical demand for ‘N o taxation without representation’ , and ‘N o legislation without representation’ . The American Declaration of Independence says that all men are born equal and endowed with liberty as an inalienable right, just
as the French revolutionaries demanded liberty, equality, fraternity. The complementarity of liberty and equality has been proclaimed in the writings o f many democratic thinkers, including the social philosopher L. T. Hobhouse, who believed that liberty depended, in all its domains, on equality - equality before the law , equality of opportunity, equality o f parties to a contract.395

The scale of economic inequality which exists today is less an expression o f freedom and democracy as o f their denial. W ho, apart from the super-rich, would vote for multi-million dollar bonuses for the corporate and financial elite while denying adequate incomes to people who undertake so many essential and sometimes unpleasant tasks - such as caring for the elderly, collecting the trash, or working
in emergency services? The truth is that modern inequality exists because democracy is excluded from the economic sphere. It needs therefore to be dealt with by an extension of democracy into the w orkplace. We need to experiment with every form o f economic
democracy - employee ownership, producer and consumer co
operatives, employee representatives on company boards and so on.
R U N N I N G W I T H T H E T E C H N O L O G I C A L T I D E
In her book, The Weightless W orld, Diane Coyle points out that although people in most industrialized countries experienced something like a twentyfold increase in their real incomes during the twentieth century, the weight o f all that was produced at the end of the century was roughly the same as it had been at the beginning.396 She also says that the average weight o f one dollar’s worth of US exports (adjusted for inflation) fell by a half between 19 9 0 and 1996 . While the trend towards ‘weightlessness’ is partly a reflection o f the growth of the service sector and the ‘knowledge’ economy, it is also a reflection o f changing technology and the trend towards miniaturization. That so much o f modern consumption is actually lighter on the use o f material resources than it w as, is presumably good news for the environment. But the underlying nature of the changes contributing to weightlessness may also have important implications for equality.
Introductory economics courses teach students the distinction between the ‘fixed’ costs of production on the one hand, and
‘m arginal’ or variable costs on the other. Fixed costs are the costs of the factory buildings and machinery, and the variable costs are the additional costs o f making one more unit o f output - traditionally

made up largely of the costs of the additional labour and materials
needed, on the assumption that the plant and equipment are already
there. Economic theory says that prices in a competitive market should fall until they equal marginal (or variable) costs. Prices higher than that would mean that by producing and selling more, a manufacturer could still earn a little more profit, whereas at a lower price making even one more item would add more to costs than it gained in income from sales.
Throughout large swathes o f the modern economy technological change is rapidly reducing variable costs. For everything that can be copied digitally, additional copies cost little or nothing either to
produce or to distribute over the internet. This applies to all music,
to all computer software and games, to films, to all books and to the written word in any form, to all information and to pictures. That covers a large part of what is produced for entertainment and leisure, for education at all levels, and for many economic and professional applications o f computer software - whether for stock
control, statistical analysis or computer-aided design.So low are marginal costs o f digital products that there is a grow
ing ‘free’ sector. Efforts are made to enforce patents and copyright protection in an attempt to restrict access and enable companies to hold on to profits; but the logic of technological progress is difficult to resist. Systems o f copy protection codes are cracked and goods
‘liberated’ . In some cases free access is supported by advertising, in others it is genuinely free, as with ‘ freeware’ or ‘shareware’ com puter programmes. The internet has already provided free access to almost unlimited information, not only books, encyclopaedias,
dictionaries, newspapers, but increasingly to on-line journals. Whether legally or not, music and films are downloaded free. Some
service providers now provide unlimited free storage space. Phone calls can cost only a fraction of what they used to and, when using computer links, are increasingly free. Emails and instant messaging also provide effectively free communications.
Though less dramatic than in the digital economy, the trend towards rapidly diminishing variable costs may also apply to many other areas o f technology, including the products o f nanotechnology, biotechnology, electronically printed components and

genetic engineering. These new technologies hold out possibilities of more efficient solar power, cheaper medicines and more economical new materials.
From the point o f view of many o f the companies producing
digital products, the changes have not appeared as new opportunities for enhancing human life and enjoyment, but as profound threats to profits. Instead of maximizing the benefits o f the new technologies, we find ourselves with institutional structures which have fought to restrict this new potential. The dramatic lowering of variable costs puts a rapidly widening gap between the maximization of profit and the maximization o f public benefit. In this situation it is important that governments use their powers to aid the development of new institutional structures, not to prop up and defend the restrictions o f the old ones.
It used to be argued that goods for which the marginal costs were
close to zero were inherently public goods and should be made
publicly available. Before the digital era, bridges and roads were commonly used examples. Once society has incurred the capital costs o f making a bridge or road, maximum benefit from the initial investment is gained only if use is unrestricted by charging. Hence,
people should be allowed free access. The need to provide un
restricted free access in order to maximize the public benefit was offered as an economic explanation o f why roads and bridges were in public ownership - until governments began to try to recoup the costs o f road building by charging tolls.
Once the capital cost has been incurred, the more people sharing
the benefits the better. Where municipal investment provides local internet access, there is no need to restrict access to it. When the Victorians established free public libraries they recognized the same logic: a book can be read repeatedly at no extra cost. Perhaps we need public bodies and non-profits, funded from public revenue,
able to negotiate a price at which to buy access or copyrights for the nation. Perhaps we need international bodies able to negotiate free access to educational and business resources throughout the world. From the point o f view of society as a whole, the tendency for technological change to reduce marginal costs is rapidly tipping the
balance o f advantage aw ay from allowing profit-maximizing cor

porations to control the distribution of goods. Increasingly they can
only rely on the remnants of monopolistic power provided by patents or copyright. We need to find new w ays of paying organizations and individuals for life-enhancing research, creativity and innovation - the geese which lay the golden eggs - which does not then restrict access to the benefits. Perhaps we need charities to fund
the development of software for free worldwide use. We certainly
need a complete revision of copyright and patent laws so that those w ho produce valuable goods and services can be paid in w ays which do not restrict access to their products.
The question for politicians and the public is whether it is possible
to find ways o f paying corporations for their research and develop
ment without trying to police a pricing system which restricts access to the benefits o f what they have produced - benefits which may include life-saving drugs, agricultural innovations which could feed the hungry, and access to scientific and academic journals for
universities in the developing world. If it is correct to think that
new technology tends increasingly to lower variable costs, then this problem will become increasingly pressing.
Perhaps the logic moves us towards a society in which access to an ever-increasing range of goods is no longer tightly rationed by income, and our possessions cease to play such an important role in
social differentiation. We might hope that we will start to experience ourselves prim arily as unranked members o f the same society brought together in different combinations according to our various shared interests.
T H E F U T U R E O F E Q U A L I T Y
Caught up in day-to-day events, it is easy to forget that a longer view reveals an almost unstoppable historical trend towards greater equality. It runs like a river o f human progress from the first con
stitutional limitations on the ‘divine’ (and arbitrary) right o f kings, and continues on through the slow development o f democracy and the establishment of the principle o f equality before the law. It swells with the abolition o f slavery and is strengthened by the extension of

the franchise to include non-property-owners and women. It picks up pace with the development of free education, health services and systems of minimum income maintenance covering periods of unemployment and sickness. It runs on to include legislation to protect the rights o f employees and tenants, and legislation to prevent racial discrimination. It includes the decline o f forms of class deference. The abolition of capital and corporal punishment is also part o f it. So too is the growing agitation for greater equality of opportunity - regardless o f race, class, gender, sexual orientation and religion. We see it also in the increasing attention paid by lobby groups, social research and government statistical agencies to poverty and inequality over the last fifty years; and most recently we see it in the attempt to create a culture of mutual respect.
All are different manifestations o f grow ing equality. And, despite differences in political opinion, there are few people w ho, when
looking back on these historical developments, would not regard them all as welcome. The historical forces underlying them ensure that these are changes which a large m ajority will want to continue. That this river o f human progress is occasionally briefly dammed up, or we experience eddying currents, should not blind us to its
existence.The relationships between inequality and the prevalence o f health
and social problems shown in earlier chapters suggest that if the United States was to reduce its income inequality to something like the average o f the four most equal o f the rich countries (Japan,
N orw ay, Sweden and Finland), the proportion o f the population
feeling they could trust others might rise by 75 per cent - presumably with matching improvements in the quality o f community life; rates o f mental illness and obesity might similarly each be cut by almost two-thirds, teenage birth rates could be more than halved,
prison populations might be reduced by 75 per cent, and people
could live longer while working the equivalent o f two months less per year.
Similarly, if Britain became as equal as the same four countries, levels of trust might be expected to be two-thirds as high again as
they are now, mental illness might be more than halved, everyone
would get an additional year of life, teenage birth rates could fall to

one-third o f what they are now, homicide rates could fall by 75 per
cent, everyone could get the equivalent o f almost seven weeks extra
holiday a year, and the government could be closing prisons all over the country.
W hat is essential if we are to bring a better society into being is to develop a sustained movement committed to doing that. Policy
changes will need to be consistently devoted to this end over several
decades and that requires a society which knows where it wants to go. To help with this we provide - and will continue to provide - our research findings, graphs and other information on the Equality Trust’s web site (ww w .equalitytrust.org.uk).
The initial task is to gain a widespread public understanding of
w hat is at stake. But rather than allowing this to be just one more
idea that briefly gains attention before fashionable opinion moves on, we need to build a social movement committed to its realization. It must be taken up and pursued by a network o f equality groups meeting to share ideas and action everywhere, in homes and offices,
in trade unions and political parties, in churches and schools.
It needs also to be pursued by the pressure groups, charities and services concerned with the various issues which are related to equality, whether health or teenage births, prison populations or mental health, drugs or educational standards. And they need to be coupled with the urgent task o f dealing with global warming.
In all these settings we must speak out and explain the advantages o f a more equal society.
N o r should we allow ourselves to be cowed by the idea that higher taxes on the rich will lead to their mass emigration and economic catastrophe. We know that more egalitarian countries live well, with high living standards and much better social environments. We
know also that economic growth is not the yardstick by which everything else must be judged. Indeed we know that it no longer contributes to the real quality o f our lives and that consumerism is a danger to the planet. N or should we allow ourselves to believe that the rich are scarce and precious members o f a superior race of more
intelligent beings on whom the rest of us are dependent. That is merely the illusion that wealth and power create.
Rather than adopting an attitude o f gratitude towards the rich, we

need to recognize what a damaging effect they have on the social fabric. The financial meltdown of late 2008 and the resulting recession show us how dangerous huge salaries and bonuses at the top
can be. As well as leading those in charge o f our financial institutions
to adopt policies which put the wellbeing o f whole populations in jeopardy, the very existence o f the super-rich increased the pressure to consume as everyone else tried to keep up. The long speculative boom which preceded the financial crash was fuelled substantially by the growth o f consumers’ expenditure. Increased inequality
led people to reduce their savings, increase their bank overdrafts
and credit card debt, and arrange second mortgages to fund consumption. By adding to the speculative element in the cycles of economic boom and bust, great inequality shifts our attention from the pressing environmental and social problems and makes us w orry about unemployment, insecurity, and ‘how to get the economy
moving again’ . Reducing inequality would not only make the
economic system more stable, it would also make a major contribution to social and environmental sustainability.
M odern societies will depend increasingly on being creative, adaptable, inventive, well-informed and flexible communities, able
to respond generously to each other and to needs wherever they
arise. Those are characteristics not o f societies in hock to the rich, in which people are driven by status insecurities, but o f populations used to working together and respecting each other as equals. And, because we are trying to grow the new society within the old, our
values and the w ay we w ork must be part o f how we bring a new
society into being. But we must also try to bring about a shift in
public values so that instead o f inspiring admiration and envy, conspicuous consumption is seen as part o f the problem, a sign o f greed and unfairness which damages society and the planet.
M artin Luther King said, ‘The moral arc of the universe is long,
but it bends towards justice.’ Given that in human prehistory we
lived in rem arkably equal societies, maintaining a steady state - or sustainable - w ay o f life in w hat some have called ‘the original affluent society’ ,324 it is perhaps right to think o f it as an arc, curving back to very basic human principles o f fairness and equality which
we still regard as good manners in any normal social interaction.349

But at all stages, creating a more equal society involves people speaking their minds, making the case, organizing and campaigning.
It is impossible for governments not to influence income differ
ences. N ot only are they the largest employer in most countries, but almost every area o f economic and social policy affects income distribution. T a x and benefit policies are the most obvious way. Other influential areas of policy include minimum wage legislation, education policies, the management o f the national economy, whether unemployment is kept to low levels, whether different rates
o f V A T and sales taxes are applied to necessities and luxuries, provision o f public services, pension policies, inheritance taxes, negative income tax, basic income policies, child support, progressive consumption taxes,351 industrial policy, retraining schemes, and many more. But in this chapter we have also suggested more fundamental
changes to ensure that income differences are subject to democratic control and greater equality becomes more deeply rooted in the social fabric.
A t this stage, creating the political will to make society more equal is more important than pinning our colours to a particular set
o f policies to reduce inequality. Political will is dependent on the development of a vision o f a better society which is both achievable and inspiring. We hope we have shown that there is a better society to be won: a more equal society in which people are less divided by status and hierarchy; a society in which we regain a sense o f community, in which we overcome the threat o f global warm ing, in which we own and control our w ork democratically as part of a
community of colleagues, and share in the benefits o f a growing nonmonetized sector o f the economy. N or is this a utopian dream: the evidence shows that even small decreases in inequality, already a reality in some rich market democracies, make a very important difference to the quality of life. The task is now to develop a politics based on a recognition o f the kind o f society we need to create and committed to making use o f the institutional and technological opportunities to realize it.
A better society will not happen autom atically, regardless of whether or not we w ork for it. We can fail to prevent catastrophic global warm ing, we can allow our societies to become increasingly

anti-social and fail to understand the processes involved. We can fail to stand up to the tiny minority o f the rich whose misplaced idea
o f self-interest makes them feel threatened by a more democratic and egalitarian world. There will be problems and disagreements on the w ay - as there alw ays have been in the struggle for progress - but, with a broad conception of where we are going, the necessary
changes can be made.After several decades in which we have lived with the oppressive
sense that there is no alternative to the social and environmental failure o f modern societies, we can now regain the sense of optimism which comes from knowing that the problems can be solved. We
know that greater equality will help us rein in consumerism and ease the introduction o f policies to tackle global warm ing. We can see how the development o f modern technology makes profit-making institutions appear increasingly anti-social as they find themselves threatened by the rapidly expanding potential for public good which new technology offers. We are on the verge of creating a qualitatively better and more truly sociable society for all.
To sustain the necessary political w ill, we must remember that it falls to our generation to make one of the biggest transformations in human history. We have seen that the rich countries have got to the end o f the really important contributions which economic growth can make to the quality o f life and also that our future lies in improving the quality o f the social environment in our societies. The
role o f this book is to point out that greater equality is the material foundation on which better social relations are built.

Postscript - Research Meets Politics
T H E S P I R I T L E V E L D E B A T E
This book was first published in M arch 2009, about six months after the start o f the worst financial crisis since the Second W orld War. M uch o f the blame for the crisis was rightly attributed to the extraordinary risks taken by people in the financial sector whose
excesses were matched only by their grotesquely high salaries.
Though our research predates the crisis by many years, and its validity is unaffected by the crisis, the book’s generally positive reception clearly owes something to its timing. M any people who, before the crash, had assumed that huge salaries and bonuses reflected the
unique contributions and brilliance of their recipients, changed their
minds as they learned about the lack of relationship between performance and rewards.408
A N I D E A W H O S E T I M E H A S C O M E ?
But the reception o f the book cannot be wholly attributed to the moment at which it appeared. Since publication, we have - between us - given well over 350 lectures, in many different countries. We have spoken to civil servants, health authorities, academics, charities, faith groups, think tanks, professional associations, arts and literary festivals, trade unions, senior business people, community groups, royal societies, international agencies and political parties across the ideological spectrum. Although we have often been

invited to speak to groups which were pre-disposed to be sym pathetic to the idea of greater equality, that has not alw ays been the
case. Yet audiences have been so uniformly positive and appreciative that we have sensed there is an intellectual vacuum, a hunger for the
evidence we present - as if under the surface the world was full of closet egalitarians.
Three things seem likely to have contributed to this. First is a desire for an explanation o f why, amidst such unprecedented affluence, our societies are beset by such a worrying array of social problems. W hy are rates o f depression and anxiety so high? W hy is there
such widespread reliance on drugs and alcohol? And why is violence
so common? The second component is the evidence with which we started the book - that a very large m ajority o f the population feels that ‘consumerism’ or ‘materialism’ is something we get caught up in despite feeling it runs counter to our values and our desire for more
time with family and friends or in our community. Third, our analy
sis seems to confirm people’s intuition that inequality is divisive and socially corrosive. Again and again, people tell us they feel they have gained from the book a picture o f the world which is both quite new to them and yet somehow also immediately recognizable, a picture they feel they have been waiting for and which changes how they see
what is going on around them.A recent report confirms empirically the impression we have
received so strongly - that the general public is averse to the high levels of inequality in very unequal countries. In a random sample of over 5 ,500 Americans, researchers from Duke University and
H arvard University investigated views o f the distribution o f wealth (rather than income) in society.409 People were shown three pie charts illustrating three different distributions of wealth - one in which each fifth o f the population got the same, another which showed (unlabelled) the distribution of wealth in the USA and
another (also unlabelled) based on the distribution in Sweden.
Ninety-two per cent said they would prefer to live in a society with the Swedish distribution - and the percentage only varied from 89 to 93 per cent depending on whether they were rich or poor, Democrats or Republicans. When asked what they thought the dis

tribution o f wealth is in the USA, the average estimate was that the
richest 20 per cent o f Americans control 59 per cent o f the wealth. In
reality, they control 84 per cent. Asked what they thought the ideal distribution would be, people preferred the top 20 per cent to have 32 per cent of all wealth.
Nevertheless, as well as its very positive reception, the book has
attracted both thoughtful criticism and strident political attacks. The
main purpose o f this chapter is to respond to these before going on to discuss some new research findings. But before doing either, we would like to address a criticism made by several commentators which seems to be based on a misunderstanding.
W H O B E N E F I T S F R O M G R E A T E R E Q U A L I T Y ?
Some reviewers o f the book were not convinced that we had shown
that the vast m ajority o f the population benefited from greater
equality. They seemed to think that the evidence did no more than establish that average performance across the whole population is worse in more unequal societies.410
In a section running from p. 17 5 to p .18 2 we show no fewer than
five sets of data (and refer to another shown on p. 109) illustrating
that, whether you classify people by education, social class or income, people in each category are healthier (or have higher literacy scores) if they are in a more equal society than people in the same category of income, education or class in a less equal society. We also refer to studies which reach the same conclusions using statistical models which enable researchers to look at the effects o f inequality after con
trolling for the effects of all individual incomes throughout society.We do not argue that everyone in a more equal society does better
than everyone in a less equal one. We are not saying that even the lowest social class or the least well paid or educated category in a more equal society does better than the highest category in a less equal society. Rather, we show that when people in the same social class, at the same level of income or education, are compared across

countries, those in more equal societies do better. So at any given level o f personal income or education, someone’s quality o f life will be higher if he or she has the same level of income or education but
lives in a more equal society. That is what is shown in Figures 8.4,
13 .2 , 1 3 .3 , 13 .4 and 13 .5 . The conclusion is that greater equality
usually makes most difference to the least well off, but still produces some benefits for the well off.
As we pointed out on p .17 6 , the very large differences between more and less equal societies in the prevalence o f other social problems - including mental health, teenage births, trust, homicide
and imprisonment - suggest that this picture is not confined to the areas of health and literacy. The differences are usually much larger than would result if greater equality benefited only the least well off.
I N E Q U A L I T Y , C L A S S A N D S T A T U S
Academic sociologists have sometimes been surprised that the book focuses so exclusively on income inequality and pays little attention to the vast amount o f careful w ork now available on social class
classifications.411 We have great regard for much o f this w ork, but it
does not feature here because social class classifications have two weaknesses for the kind of analyses this book undertakes. First, because almost every country uses a different socioeconomic classification system, it is difficult to make comparisons between countries. For example, in early studies o f how health differences across the
social hierarchy in Sweden compared with those in England and
W ales, Swedish researchers had to re-classify the occupations of many thousands o f Swedes according to the British occupational class classification. We showed the results in Figures 13 .3 and 13 .4 . But even if social comparisons could be made consistently across
many different countries, there is a second more fundamental problem: few, if any, social class classifications would allow an assessment o f whether the gaps between groups are bigger or smaller in one country than another. Income differences, on the other hand, allow us not simply to categorize people into different classes, they also allow us to measure the size o f the differences within the

population. For all its imperfections as a measure o f status differentiation, income inequality tells us a lot about a society.
Answers to a number o f other points which are often raised when we give presentations on the book (including questions on ethnicity, immigration, the size o f countries, local inequalities and many more) are listed under Frequently Asked Questions on The Equality Trust web site at ww w .equalitytrust.org.uk.
F A I R C R I T I C I S M A N D F O U L A T T A C K S
Public health, with epidemiology at its centre, has a long record of political battle, from the nineteenth-century conflicts over the provision o f sewers and clean water, to modern legislation protecting peo
ple from dangerous exposures at w ork or in the environment more widely. The political battles come when the scientific evidence runs up against vested interests o f many different kinds - industrial, social and economic.
It is now almost universally accepted amongst scholars and practi
tioners o f public health that the most important determinants of health are social and economic circumstances. Geoffrey Rose, who was one of the most highly influential and respected epidemiologists o f the second half of the twentieth century, said, ‘medicine and politics cannot and should not be kept apart’ . Our growing understand
ing o f how human health and wellbeing are so deeply affected by social structure inevitably pushes science into politics.
Academics in every field o f course criticize each other’s w ork all the time: that is part o f the normal process o f scientific progress. Attacks clearly made for ideological reasons are quite different. Rather than controversies about research methods or interpretations o f the evi
dence being hammered out between colleagues who know the subject area, suddenly people who do not know the extensive research literature and have never made a contribution to it, use the media to try to convince the public that research findings are misleading rubbish.
Attempts to overthrow large bodies of scientific evidence that seem to have important political implications are now a well-established phenomenon. Tw o American academics, N aom i Oreskes and Erik

Conway, have recently described these tactics in their book, M erchants o f D oubt: H o w a H andful o f Scientists O bscured the Truth on Issues from Tobacco Sm oke to G loba l W arming.412 They describe the techniques used - often by the same people operating in a
number of quite different subjects - to give the impression that crucial
areas o f science affecting public policy are controversial, long after the implications of the science were quite clear. As a result, there have sometimes been substantial delays in the public response to pesticides, tobacco marketing, acid rain, the hole in the ozone layer, exposure to secondary smoke, and o f course global warming. It is characteristic of
the tactics o f these ‘merchants of doubt’ , that one of the attacks on
our book was written by someone who had recently written a diatribe against tobacco control and what is now the well-established evidence that secondary smoke is harmful to health. Fortunately the bans on smoking in public places (implemented in Scotland, parts of
the USA and Canada, Rome, Ireland, and England); which in each
case have been followed by declines in death rates and have saved thousands of lives, seem unlikely to be lifted in the light of his work.
W H Y T H E A T T A C K S F A I L
On the web site o f The Equality Trust we have provided a point-by-
point rebuttal of all the criticisms made by The T a x Payers’ Alliance, The Dem ocracy Institute and the Policy Exchange.413 As much of it is rather tedious, in this chapter we will describe only the broad outlines of the criticism and our responses.
Much the most important strategy o f our critics has been to treat the relationships we show between inequality and social problems as
if we were the only people ever to suggest such links. They then set about trying to cast doubt, one by one, on the relationships we show in our graphs, suggesting that they are a combination o f statistical flukes, the result o f a cunning selection of countries, or of choosing
problems to suit our argument. For example, they argue that the USA
should be excluded from one analysis, Japan or the Scandinavian countries from another, or that another relationship disappears if you add in poorer countries, and so on.

Regardless o f their merits in relation to our work, this strategy
means that these criticisms are largely piecemeal, ad hoc, and irrele
vant to the many other demonstrations o f similar relationships in different settings published in academic journals by other researchers. Because there are around 200 papers in peer-reviewed academic journals testing the relationship between income inequality and health in many different settings,10 more than 50 papers on violence and
inequality,210’ 211"414 and quite a number on inequality in relation to trust and social capital,400’ 415 it is now extremely difficult to argue credibly that these relationships don’t exist. Indeed, those who do so are almost always those who are making political attacks rather than any kind of academic criticism.
Academic discussion among those who know the literature in the field is now very largely confined to how the relationships should be interpreted. That is why (chapter 1 3 , from p .18 2 onwards) we discussed the strengths and weaknesses of possible alternative interpretations, before concluding that these relationships must reflect the
damage done by inequality. With few exceptions, we have previously subjected to peer review and published in academic journals almost everything we have shown in this book.
So what are the criticisms and how do we respond to them?
P I C K I N G A N D C H O O S I N G ?
Som e critics have suggested that w e are selective in the choice o f health and social problem s that w e exam ine.*16
The Spirit Level does not claim to explain every kind of social problem: it is specifically a theory of problems that have social gradients, gradients which make them more common further down the social ladder. So, for example, we would not expect alcohol use to increase with inequality because, in most countries, alcohol use does not increase lower down the social ladder. In contrast, alcohol abuse (for example binge drinking and alcoholism) does have a social gradient, and deaths from alcoholic liver disease are more common in more unequal US states.8 We have also shown that death rates such as breast and prostate cancer, which do not tend to become more common lower down the social ladder, are not

related to inequality.8 This contrasts sharply with deaths from causes such as heart disease which do have a strong social gradient.
The reason we included (in chapter z) an analysis of the relationship between the UNICEF Index of Child Wellbeing in Rich Countries and
income inequality was to show that our results were not a result of selecting problems to suit our argument. The UNICEF Index combines 40 different aspects of child wellbeing which we played no part in selecting, yet it behaves exactly like our own Index of Health and Social Problems - showing strong relationships with income inequality and none with aver
age national income.
W H I C H C O U N T R I E S ?
Critics have also suggested that w e selected countries arbitrarily to
suit our argum ent and should have included m ore, and poorer,
countries.416_7
The countries in our analyses result from the application of a strict set of criteria, applied with no departures or exceptions. Our source was the World Development Indicators Database, World Bank, April Z004. We
took the richest 50 countries for which the bank publishes figures on
Gross National Income per capita, ranked according to the ‘Atlas method’ used by the World Bank to classify countries into Low, Medium and High Income categories. From that list we excluded countries with no internationally comparable data on income inequality and those with populations
with fewer than 3 million (to avoid tax havens). That gave us our final
dataset of Z5 rich countries. We looked exclusively at the richest countries not because these relationships only exist among them, but because these countries are on the flat part of the curve at the top right in Figure 1 . 1 on p.7, where life expectancy is no longer related to differences in Gross National Income per head (GNIpc) and it is therefore easier to distinguish
the effects of relative and absolute levels of income.If we had also studied poorer countries two problems would have
arisen. First, comparable data on teenage births, mental illness, social mobility, social cohesion etc., are very rarely available for much poorer countries. Second, if we had included countries in which many people continue to have inadequate material resources so that increasing GNIpc is

still important, we would have had to control statistically for the log transformation of GNIpc in order to show the effect of inequality. In a book which we hope will be widely understood, this would have been a substan
tial increase in complexity for little gain. Nevertheless, if we had included poorer countries it would have made little difference to our results. Studies of life expectancy, infant mortality and homicide - for which data is usually available for poorer countries - show that greater equality is beneficial at all levels of economic development.10’ 418
To have ‘cherry-picked’ countries - as our critics suggest we did - according to whether their data for this or that social problem did or did
not fit our thesis, would have made the book a pointless exercise. Instead we had an absolute rule that we used the most reputable data sources and took the data for as many of our 25 countries as were available - warts and all. For example, we include Singapore in our analysis of infant mortality although it is a very significant outlier: it claims the lowest infant
mortality in the world despite being the most unequal country in our dataset (see Fig 6.4 on p.82).
If we had shown graphs of data collected by other researchers we would often have been able to show even stronger and more dramatic associations with inequality than already appear in the book.207-419 But had we
done so we would necessarily have been referring to different groups of countries in studies which use different measures of income inequality and that would properly have raised questions of comparability. On the contrary, we wanted to show that there is a consistent pattern running through the data for quite different problems. Our purpose was to analyse every health and social problem using the same inequality measures with
reference to the same set of countries, and then, to make quite sure, to double-check our findings by repeating the analyses on the 50 states of the USA.
The book therefore tries to show the relationships between income inequality and various health and social problems as simply and transparently as possible. The scatter graphs can be understood without any knowledge of mathematics or statistics. We point out in each chapter that our findings cannot be attributed to chance. Most readers should not feel any sense that there are mysterious areas where they cannot tell quite what is going on but, for those who want it, we provide more data and statistical detail at www.equalitytrust.org.uk

C U L T U R A L D I F F E R E N C E S ?
It has been suggested that the relationships w e show reflect d ifferences in national culture rather than the effects o f inequality .416
This criticism has been made in two forms. One is the suggestion that
income differences are an expression of underlying cultural differences, and it is these which are the real determinants of the health and social problems we examine. The other is that particular countries should be excluded from one or other analysis because they are culturally different
from the others.Rather than varying from better to worse on a single scale as income
inequality does, national cultures differ in an infinite number of quantitative and qualitative ways. In chapter 13 we mention the huge cultural differences between Sweden and Japan which, despite both performing well in our analyses, are poles apart in other ways - including the extent of women’s participation in the labour force and in politics, the dominance of the nuclear family, and whether their narrower income differences result from redistribution or narrower differences in earnings before taxes
and benefits.In contrast, Spain and Portugal have many cultural similarities and were
both dictatorships until the mid 1970s. Yet as we have seen throughout the book, Portugal is now much more unequal than Spain and consistently suffers more from most of the health and social problems we discuss. So it looks as if cultural differences (Sweden and Japan) don’t necessarily make societies perform differently in our analyses, and cultural similarities (Spain and Portugal) do not necessarily make them perform similarly. What matters is the scale of income differences almost regardless of other
aspects of culture.In addition, we know that in the second half of the twentieth century
the USA and Japan came close to swapping positions in the international league tables of life expectancy and income inequality. In the 1950s the USA was more equal than Japan and had better health. But as the USA became more unequal, Japan became less unequal, and Japanese life expectancy outstripped that in the USA to become the best in the world. If what matters is culture rather than inequality, how is it that the plethora

of cultural changes which took place in these two nations did nothing to
alter the relation between each countries’ burden of health and social
problems and its income inequality?The more you think about the suggestion that the relationships we show
are merely a mirage created by some underlying dimension of cultural difference, the less plausible it becomes. This unknown dimension of culture would not only have to cause physical and mental ill-health, school bully
ing, more punitive sentencing, obesity, teenage births and so on, but it would have to do so in proportion to the scale of income inequality.
The second use to which critics put the notion of cultural differences is to justify removing groups of countries at either the more or the less equal end of our analyses on the grounds that they are ‘culturally different’ from
the others. For example, arguments have been made for removing the
Scandinavian or English-speaking countries, or sometimes even both groups.416 Such wholesale deletions would remove crucial information which looks as if it might explain why some English-speaking countries do better on some social measures than others - for example why the USA
has more mental illness and teenage pregnancies than the UK, which in turn has more of both than New Zealand (and of course all the US states are English speaking). More fundamentally, however, national cultures are themselves powerfully determined by inequality because of its corrosive effects on trust, cohesion and community life.
O U T L I E R S , D A M N O U T L I E R S A N D S T A T I S T I C S
Som e critics have suggested that the relationships w e show are dependent on ‘outliers’.*16
As well as excluding countries on the grounds of cultural differences, it has also been suggested that some countries should be removed for the purely statistical reason that they are ‘outliers’ . In any of the graphs in our book, an outlier is a country or US state that is a long way from the line of best
fit between the countries or states. Good examples are Singapore in Figure 6.4 on p.82 (showing the relationship between income inequality and infant mortality) or Italy in Figure 5 .1 on p.67 (showing levels of mental

illness). There are established methods to calculate the influence a single data point has on the line of best fit on a graph, but no hard and fast statistical rules as to when outliers should be left out. We decided to keep all countries and states in our analyses for three reasons: first, they represent
real variation in population levels of health and social problems; second, because removing occasional data points would have invited the accusation that we were picking and choosing data points; and lastly because, as we said earlier, we wanted to show the consistency of the effects of inequality on different problems across the same group of countries.
Having mistakenly accused us of picking and choosing countries for
each analysis, our critics have also attempted to discredit some of the rela
tionships we show by selectively removing countries on the grounds that they are outliers. For example, one critic said that the Scandinavian countries were outliers in our analysis of inequality and foreign aid, but did not suggest removing Japan which, on that graph (Fig 4.6, p.61), is actually
more of an outlier.416 Removing the Scandinavian countries would mean
the relationship was no longer statistically significant, but removing Japan as well would restore its significance.
The same thing happens in the case of obesity. A critic suggested that we should remove the USA from the analysis on the grounds that it is an outlier
and doing so reduces the relationship to non-significance.416 But Greece is a
more distant outlier: remove Greece as well and the significant link between inequality and obesity is restored. For overweight children, the same critic removes the USA, but not Canada, which is again a more distant outlier. Remove both and once again the relationship is statistically significant.
Our results are, of course, sometimes sensitive to exclusions simply
because we are looking at a limited number of countries, but the fact that
so many relationships with inequality are statistically significant, despite the limits to the data, is an indication of how powerful the underlying relationships actually are.
These criticisms of the evidence that inequality affects wellbeing fail on
two grounds: they do nothing to dent either the hundreds of other pub
lished analyses of health and income inequality, nor our analyses of the 50 American states; and ultimately the suggested exclusions do not remove the associations we show. In Figure 1 3 . 1 (p. 174) we summarize our international evidence by combining all the health and social problems into one
index. Sweden, Norway, Finland, Japan, USA and UK - all the most equal

and unequal societies - can be removed all at once, and still there is a
highly significant relationship between social health and inequality among
the remaining countries.
In short, we believe that our data are very robust - and, as we said earlier, some of these relationships have been demonstrated many, many times before by other researchers in quite different settings. Research reports have shown for instance that income inequality is related to health
in the regions of Russia,420 the provinces of China421 or Japan,422 the
counties of Chile,423 or among rich and poor countries combined.418 Those who dislike our conclusions would no doubt want to remove various provinces, counties or countries from these reports too.
O T H E R F A C T O R S ?
It is sometimes suggested that w e should control for, or take account of, other factors that m ight explain the associations between income
inequality and health or social problem s - such as N ational Incom e per head, poverty, ethnicity, or w elfare services.416
There were several reasons why we chose not to include other factors. First, we wished to present the simplest and most understandable picture of the correlation between income inequality and health and social problems, so that readers could see the strength of the relationship for
themselves. Second, it is a fundamental methodological principle of epidemiological analysis that you should not control for factors which form part of the causal chain - in this case explaining how inequality causes a particular problem. For example, if we think - as we do - that societies with greater income inequality have worse health because poorer social relations increase chronic stress, then we would need to be cautious about how to analyse that particular causal sequence. Simply including measures of trust and social cohesion in a statistical model could remove the association between income inequality and health,400 even though it is likely that inequality actually leads to poorer health because it is socially divisive. Third, including factors that are unrelated to inequality, or to any particular problem, would simply create unnecessary ‘noise’ and be methodologically incorrect.

Nevertheless, many other studies of health and income inequality have controlled for poverty, average income, or each person’s individual income. Still others have made careful explorations of the interplay between income inequality and public spending, social capital and the ethnic composition of populations. We discussed these in chapter 13 and will return to some of
them in the section below on recent advances in research.
A point which can hardly be made too often is that the relationships between inequality and various health and social problems are not reducible to the direct effects o f people’s material living standards independent of inequality. N o one doubts that health is compromised
when a substantial proportion o f the population o f poorer countries
lack basic necessities. But when it comes to explaining the tendency for health to improve all the w ay up the social hierarchy even in rich countries (see Figure 1.4) the causes are less clear. The concept of ‘neomaterialism’ was invented as a counter to psychosocial explana
tions of this pattern. The idea was that health may continue to benefit
from higher levels of comfort and luxury all the w ay up the social
scale. Even if that were true, it would not explain why more equal societies are healthier. But Figure 1.3 shows life expectancy is no longer sensitive to living standards among the rich countries, Figure z.3 shows that this is also true o f our Index of Health and Social Problems,
and Figure 2.7 shows the same is true of the U N ICEF index o f child
wellbeing. Chapter 6 references a review of studies which have controlled not only for poverty but also for the effect o f each person’s income on their health before going on to test for an effect o f inequality. An important new review of such studies is also mentioned
below. Although it is easy to slip back into the conventional view that
material standards are o f primary importance and must somehow explain all that we attribute to inequality, we must bear in mind that this runs counter to a substantial body o f evidence.
T H E P R O O F O F T H E P U D D I N G
An important strength o f the evidence we present in this book is its remarkable consistency, which provides a coherent picture at two levels. It is not simply that almost all health and social problems which are related to social status show the same tendency to get worse when

Figures 1 7 . i and 17 .z The relationship between income inequality and mental illness in 8 rich countries (Fig i j . i ) was confirmed when new data become available for 4 additional countries (Fig 17.2).

there are bigger income differences: it is also that the data are consistent within each o f the health and social problems we look at. For example, when we found that more unequal societies have higher levels o f obesity (chapter 7) we thought calorie consumption levels should also be higher per person in those societies; and that indeed is
what the evidence showed.114 Similarly, when we found that educational scores are lower in more unequal societies, we also found that more young people in those societies are dropping out of school, are unemployed and not engaged in further training.424
In chapter 1 1 we said that the most important reason for the much
higher imprisonment rates in more unequal societies is more punitive sentencing. Since publication, we have investigated whether this also applies to children. We have found that the age o f criminal responsibility tends to be lower in more unequal societies, so children are more likely to be tried as adults.
The best test o f the validity o f a scientific theory, indeed a theory
of any kind, is whether or not it can make predictions o f things not already known that can later be verified. We have already discussed (p. 19 5 ) examples o f successful predictions which have come out of our theory that greater inequality increases problems with social gra
dients. We can draw attention to two more, both of which concern
relationships where we initially had very little data. In 2.006, when we first looked at the relationship between income inequality and levels of mental illness, internationally com parable estimates o f mental illness from the W orld Health Organization were available for
only eight rich, developed countries.425 When we published a prelim
inary analysis in an academic journal, critics suggested our findings
were dependent on the high levels o f inequality and mental illness in the USA. But by the time the first edition o f this book was published, com parable data on mental illness were available for four more countries. Rather than contradicting the tendency we had suggested
for mental health to be worse in more unequal countries, the new data filled in the gaps and confirmed that relationship - see Figures 1 7 . 1 and 17 .2 . The additional countries had rates o f mental illness close to those which their levels o f inequality would have predicted.
The same thing has happened in relation to measures of social mobility. When The Spirit L evel was first published, we had comparable

Income Inequality
Income Inequality
Figures 17 .3 and 17.4 The relationship between income inequality and social mobility in 8 rich countries (Fig 17 .2) was confirmed when new data became available for 3 additional countries (Fig 17.4).

measures of social mobility for only eight countries and some critics claimed that the relationship we showed between inequality and low levels of social mobility was spurious because we had too few countries to justify an analysis. We included it, despite initially having data from only eight countries, not only because it was a statistically significant relationship, but also because research reports show that social mobility slowed while income differences widened, and it seemed plausible that wider income differences would tend to reduce mobility. Since this book was published, new data on social mobility has become available
which include a further three countries.426 As Figures 17 .3 and 17 .4
show, the data for the additional countries provide a fuller and more robust estimate of the impact of inequality on social mobility, and confirm our original conclusions.
N E W E V I D E N C E
Death rates versus self-reported health
Since we finished writing The Spirit L evel in the spring of 2008, there
have been many more studies reporting relationships between inequality and health. Nine o f the new studies look specifically at rich, developed countries.427 35 Seven find, as we do, that health is worse in more unequal societies. The two that differ both look at income inequality in relation to self-reported health - where, instead of death rates,
people are typically asked to say whether their health has recently been
excellent, good, fair or poor.432-3 Although self-reported health is predictive of longevity within a country, comparisons between countries find that self-rated health is actually better in countries where life expectancy is lower: so rather than contradicting the relation between
greater inequality and worse health, the studies of self-reported health
tell us something about the w ay people perceive their health.436-7But w hy is self-rated health not related to levels o f actual health in
cross-country comparisons? Could it be that in more unequal societies, with more status competition, asserting that one has excellent or very good health might be part o f maintaining a hardier self
image? Or perhaps people in more equal societies are less inclined to

rate themselves at the top o f a scale? We can only guess. Such questions show the importance o f using objective measures o f health and
social problems in international comparisons.
Causal pathways
Three other important new pieces o f evidence have appeared recently, which tell us more about how the relation between income inequality and health works. One is a review of what are called
multi-level studies published in the British M edical Jo u rn a l,438 Multi-level studies look at income and health in two stages: first in terms o f the relation between each person’s individual income and health, and second to see if there is an additional effect o f inequality across each society as a whole. This review combines data from 26
multi-level studies with individual data for over 60 million people. It shows unequivocally that inequality has a damaging effect on health which cannot be attributed to how rich or poor people are in absolute terms, and concludes that even after controlling for individual incomes (including poverty) or education, reducing inequality in the O ECD countries alone would prevent upwards of 1 .5 million
deaths per year (almost 1 in 10 deaths among adults aged 15 -6 0 ). This is likely to be a conservative estimate because controlling for individual income will also control for individual social status which affects health and is a key component of inequality.
The second new piece of evidence, published in Social Science and
M edicine, adds to the small number o f studies looking at changes in inequality and health over time. All over the world, life expectancy continues to increase, but this study showed that those US states that had the biggest increases in income inequality between 19 7 0 and 2.000 had smaller improvements in life expectancy than other
states.439The third piece o f evidence, published in The Am erican Jou rn al o f
Public Health, is a study that tests how far the link between income inequality and health results from different levels o f trust or from different levels o f government spending on health services.415 This study confirmed what we suggested in chapter 6: that levels of trust are indeed part of the explanation, whereas spending on health care

is not. W ider income differences seem to erode trust, which in turn
seems to compromise healthy ageing.
Friendship and health
Throughout The Spirit L evel, we discuss the vital importance of
social relationships to human health and wellbeing and show that higher levels of income inequality damage the social fabric which contributes so much to healthy societies. N ow , a major new review o f the evidence from almost 15 0 studies confirms the important influence of social relationships on health.440 People with stronger
social relationships were half as likely to die during a study’s period
o f follow-up as those with weaker social ties. The authors o f the report found that the influence o f social relations on survival was at least as important as that of smoking, and much more important than heavy drinking, physical activity or obesity. The effects were strongest when researchers combined measures o f different kinds of relationships, such as marital status, feeling lonely, size o f social netw ork, participation in social activities, and so on.
Violence
As we described in Chapter 10 , there is a large and consistent body o f evidence on income inequality and violence. M ore recent studies continue to confirm this link. One study of 33 countries, published in 2 0 10 , also showed that social cohesion - as measured by levels of trust - seemed to provide the causal link between income inequality and homicide rates, whereas public spending on health and education did not.415
M artin D aly at M cM aster University in Canada has published an analysis o f whether the relation between inequality and violence among the 50 states o f the USA could - as some have suggested - be due to ‘ southern culture’ or ethnicity, rather than to inequality. He
showed that on the contrary, violence was related to inequality
among the southern and northern states considered separately, and that rates o f violence rose along with inequality amongst both black and white perpetrators o f violence.414

When we wrote The Spirit L evel, we knew of no other studies of
income inequality and child conflict, but a recent study o f 37 coun
tries finds higher levels of bullying in more unequal countries. Support from family and friends was associated with less bullying, but neither this nor differences in family wealth trumped the effect of income inequality.402
E Q U A L I T Y A N D S U S T A I N A B I L I T Y
The intertwined issues of equality, social justice, sustainability and economic balance are now receiving a great deal o f attention all over
the world. Environmental organizations such as Friends o f the Earth
and the W orld W ildlife Fund now campaign on inequality issues, including human rights and the fair distribution o f natural resources, and the U K ’s Green Party placed economic equality at the heart of its election manifesto in 2 0 l o .
Evidence continues to accumulate that more equal societies seem
to have lower carbon footprints and are in a better position to cope with the challenges o f climate change. M ore unequal countries have higher ecological footprints, produce more waste, consume more water and fly more air miles per capita.441 This may be because more equal societies seem to foster a greater sense of collective responsibility which is crucial for political action to address climate change. Business leaders in more equal countries are more likely to agree that their governments should cooperate with international environmental agreements than those in less equal countries.442 Leading policy specialists now suggest that global inequalities stand in the w ay of
cooperation on climate change.443
I N E Q U A L I T Y , T H E M A R K E T A N D D E M O C R A C Y
The weight of the evidence - our own and that o f many others - and its continued rapid accumulation, make the important link between income inequality and social dysfunction inescapable. But ill-founded

and politically motivated criticism can muddy the waters and leave people with the impression that the evidence is less clear than it is. Imagine if someone were to assert (with no justification whatsoever) that climate science had not taken account of, say, the effects of variations in the salinity o f different oceans. Unable to evaluate this
claim, the inexpert listener might assume that this w as an important factor, and that perhaps it had not been properly considered.
W hat often appear to be ‘balanced’ discussions in the media can be misleading. This happens even in areas o f science where the accumulation o f evidence leaves little legitimate room for doubt. For
example, if 98 per cent of climate change scientists agree on an issue, and 2 per cent disagree, then inviting one person from each camp to take part in a news programme or public debate can leave people with an impression that an issue is much more controversial than it is. Only those viewers or readers who are particularly diligent or
highly motivated will be able to pursue the issues in detail. Rather
than considering our replies to the political attacks on our w ork, we expect some who are opposed to greater equality will simply be content to imagine that the issue is ‘controversial’ and can now be safely ignored.
Perhaps the best tactic in this situation is to address the beliefs that
motivate the attacks. In M erchants o f D oubt, Oreskes and Conw ay suggest that the defence o f a kind o f free market fundamentalism is the most plausible explanation o f w hy the same individuals and institutions are often involved in attacks on research in areas as
diverse as tobacco control and the evidence on climate change. As
well as defending the free market, they see themselves as countering
tendencies to big government and protecting democracy.412 The same beliefs are likely to guide the attacks on the evidence o f the socially damaging effects of inequality.
If that is the motivation, then it is based on a serious misconcep
tion, one which is almost the opposite of the truth. Greater inequality actually increases the need for big government - for more police, more prisons, more health and social services o f every kind. M ost o f these services are expensive and only very partially effective, but we shall need them for ever if we continue to have the high levels
o f inequality that create the problems they are designed to deal

with. Several states of the USA now spend more on prisons than on higher education. In fact, one o f the best and most humane ways of achieving small government is by reducing inequality. Similarly, the assumption that greater equality can only be achieved through higher taxes and benefits, which presumably led The T a x Payers’ Alliance to publish its criticism of The Spirit L evel, is also a mistake.
We have been at pains to point out (in chapter 13 ) that some societies achieve greater equality with unusually low taxation because they have smaller earnings differences before taxes.
There are few things more corrosive of a properly functioning democracy and o f the market than corruption and unbridled greed.
Although the international measures o f corruption currently available were designed primarily to assess levels of corruption in poorer countries, they strongly suggest that one of the likely costs of greater inequality is increased corruption in government and society more widely.444 In chapter 4 we saw that trust and the strength of commu
nity life are weakened by inequality, and this is true not only of inter
personal trust, but also of trust in government - the difference between the attitude o f Americans and Scandinavians to their governments is well known. In addition, international data and data for the American states suggest people trust government less in more unequal
states.401’ 445 There is also evidence from societies where voting is not
compulsory (as it is for instance in Australia) that voter turn-out may be lower in more unequal countries.446 Whether or not this reflects a greater separation o f interests and an increasing sense o f ‘us and them’ between people at opposite ends of the social ladder, it certainly suggests that too much inequality is a threat to democracy.
Economists sometimes suggest that the market is like a demo
cratic voting system: our expenditure pattern is, in effect, our vote on how productive resources should be allocated between competing demands. If this is true, someone with twenty times the income of another effectively gets twenty times as many votes. As a result
inequality seriously distorts the ability o f economies to provide for
human needs: because the poor cannot afford better housing, their demand for it is ‘ineffective’ , yet the spending o f the rich ensures scarce productive assets are devoted instead to the production of
luxuries.
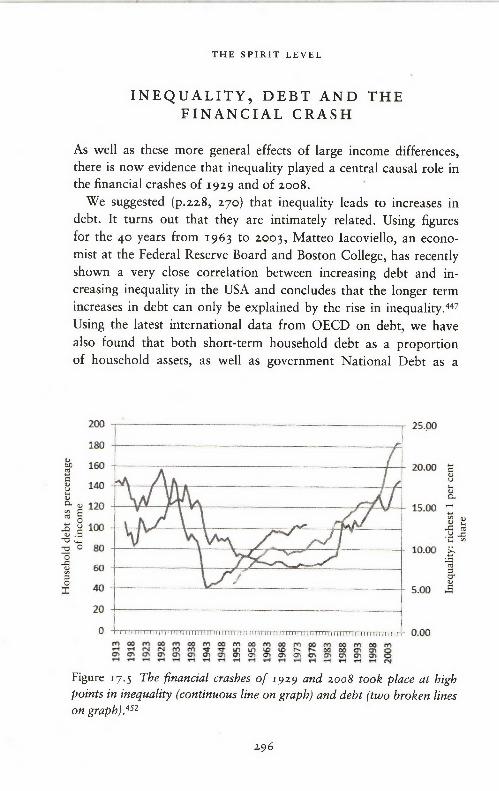
I N E Q U A L I T Y , D E B T A N D T H E F I N A N C I A L C R A S H
As well as these more general effects o f large income differences, there is now evidence that inequality played a central causal role in the financial crashes o f 19 2 9 and o f 2008.
We suggested (p.228, 270) that inequality leads to increases in debt. It turns out that they are intimately related. Using figures for the 40 years from 19 6 3 to 20 03, M atteo Iacoviello, an economist at the Federal Reserve Board and Boston College, has recently shown a very close correlation between increasing debt and increasing inequality in the USA and concludes that the longer term increases in debt can only be explained by the rise in inequality.447 Using the latest international data from O ECD on debt, we have
also found that both short-term household debt as a proportion of household assets, as well as government N ational Debt as a
Figure 17 .5 The financial crashes o f 1929 and 2008 took place at high points in inequality (continuous line on graph) and debt (two broken lines on graph).*51

proportion of Gross Domestic Product, are higher in more unequal
countries.448Aided by some of the world’s most respected economists, the story of
the w ay rising inequality and debt led to the financial crashes of 1929 and 2008 is well told in a documentary film called The Flaw .449 Both crashes happened at the two peaks of inequality in the last hundred years after long periods of rising inequality which had led to rapid increases in debt.450-1 As Figure 17 .5 shows, their trends over time are
strikingly similar. Robert Wade, professor of political economy at the
London School of Economics, estimates that growing inequality meant that in the years before the 2008 crash about 1.5 trillion dollars per year were being siphoned from the bottom 90 per cent of the US population to the top ten per cent.449 As a result, the richest people had more and more money to invest and to lend, but people outside the very
wealthiest category found it increasingly difficult to maintain their rela
tive incomes or realize their aspirations. Both for speculators and for ordinary householders rising property prices made investment in property look like a band wagon everyone had to get onto. People bought into the housing market wherever they could and remortgaged precariously as prices rose. The financial sector handling and speculating on these debts found its share of all US corporate profits rising from l 5 per cent in 1980 to 40 per cent in 2003. As the bubble grew bigger, the worse its eventual and inevitable burst became.
M A K I N G D E M O C R A C Y W O R K
Rather than being a threat to democracy and the market, reductions of inequality are surely an essential part of their defence. Greater equality will benefit even those who would deny the evidence.
N ear the beginning of this chapter we mentioned research that
showed that over 90 per cent o f the American population say they would prefer to live in a society with the income distribution which actually exists in Sweden rather than that o f the USA. Research in Britain also shows that people think income differences should be smaller, even though they dramatically underestimate how large they actually are. The world really is full o f people who have much more egalitarian preferences and a stronger sense of justice than we tend

to assume. Part o f the reason for this is that in recent decades most
people in the w orld ’s richest societies have been persuaded to doubt the validity and relevance o f egalitarian values. The rise o f neo-liberal political and economic thinking in the 1980 s and 1990s meant that egalitarian ideas disappeared from public debate and those with a strong sense of justice became - in effect - closet egalitarians.
It is now time egalitarians returned to the public arena. We need to do so confident that our intuitions have been validated and found to be truer than most o f us ever imagined. Because the evidence shows that few people are aware of the actual scale o f inequality and injus
tice in our societies, or recognize how it damages the vast majority of
the population, the first task is to provide education and information.Understanding these issues is already changing attitudes to
inequality among politicians. In Britain The Spirit L evel has been endorsed across the political spectrum. In a major speech at the end of 2009, David Cam eron, now the Conservative prime minister, said
The Spirit L evel showed ‘that among the richest countries, it’s the more unequal ones that do worse according to almost every quality o f life indicator . . . per capita GD P is much less significant for a country’s life expectancy, crime levels, literacy and health than the size o f the gap between the richest and poorest in the population . . . We all know , in our hearts, that as long as there is deep poverty living systematically side by side with great riches, we all remain the
poorer for it.’453 In September 2 0 10 , in his first major speech as leader of the Labour Party, Ed M iliband said ‘I do believe this country is too unequal and the gap between rich and poor doesn’t just harm the poor, it harms us all’454 and ‘ if you look round the w orld -
at the countries that are healthier, happier, more secure - they are
the more equal countries.’455 As Liberal Democrat ministers in the
coalition government, Vince Cable and Lynne Featherstone have signed a pledge committing themselves to reducing inequalities.456
W ords are a start, but changing policies and politics, changing the
w ay our societies organize themselves, will require the evidence to be recognized even more widely. Few tasks are more worthwhile than this: as we think The Spirit L evel shows, the health o f our democracies, our societies and their people, is truly dependent on greater equality.

The Equality Trust
If reading this book leaves you wanting to do something to help
reduce inequality, then please visit The Equality Trust web site at w w w.equalitytrust.org.uk. There you will find downloadable slides which we hope you will use, a downloadable lecture on D V D , short summaries of the evidence, answers to frequently asked questions, and suggestions for campaigning.
H aving discovered how seriously societies are damaged by great inequality we felt we had to do what we could to make the evidence better known. The Trust was set up as a not-for-profit organization to educate and campaign on the benefits of a more equal society. Its
w ork depends on donations from individuals and organizations sharing our vision.
We hope you will sign the Equality Charter, put your name down to receive the newsletter, make a donation, give us your ideas and join or form a local equality group. M ost o f all we hope you will use the evidence we have started to put together to spread the w ord and
convince others o f the need to reduce inequality. In politics, words are action.
The Equality Trust is not a large organization able to implement policies, run campaigns and orchestrate things on your behalf. Instead it aims to make people better informed and provide resources to stimulate and strengthen their own political and educational
activities - whether through talking to friends and colleagues, passing on our web address, writing blogs, local campaigning, sending letters to newspapers and politicians, or raising the issues in the mass media.
Our aim is to create a groundswell o f opinion in favour of great

T H E E Q U A L I T Y T R U S T
equality. W ithout that politicians can do very little. Egalitarian
sentiments are hidden close to the hearts o f vast numbers o f people
of all shades of political opinion. M ost people know how much we sacrifice to consumerism and know that there are few things nicer than relaxing with friends and equals. They also know that it is fam ily, friends and community that matter to happiness and know
that our present w ay o f life is ruining the planet. The culture o f the
last few decades has reduced us to closet egalitarians: it is time we came out o f the w oodw ork and set a course for sanity.

Appendix
H O W W E C H O S E C O U N T R I E S F O R O U R I N T E R N A T I O N A L C O M P A R I S O N S
First, we obtained a list o f the 50 richest countries in the w orld from the W orld Bank. The report we used was published in 2004 and is based on data from 2002.
Then we excluded countries with populations below 3 million, because we didn’t want to include tax havens like the Caym an Islands and M onaco. And we excluded countries without com parable data on income inequality, such as Iceland.
That left us with 23 rich countries:
Australia Greece PortugalAustria Ireland SingaporeBelgium Israel SpainCanada Italy SwedenDenmark Japan SwitzerlandFinland Netherlands United KingdomFrance N ew Zealand United States of AmericaGermany N orw ay

T H E 5 0 A M E R I C A N S T A T E S
In our figures, we label each American state with the two-letter abbreviation used by the US Postal Service. As these will be un
familiar to some international readers, here is a list o f the states and
their labels:
A L A B A M A A L M O N T A N A M T
A L A S K A A K N E B R A S K A N E
A R IZ O N A A Z N E V A D A N V
A R K A N S A S A R N E W H A M P S H IR E N HC A L IF O R N IA C A N E W JE R S E Y N JC O L O R A D O CO N E W M E X IC O N M
C O N N E C T IC U T C T N E W Y O R K N Y
D E L A W A R E D E N O R T H C A R O L IN A N C
F L O R ID A FL N O R T H D A K O T A N D
G E O R G IA G A O H IO O HH A W A II H I O K L A H O M A O KID A H O ID O R E G O N O R
IL L IN O IS IL P E N N S Y L V A N IA PA
IN D IA N A IN R H O D E IS L A N D R I
IO W A IA SO U T H C A R O L IN A SCK A N S A S KS S O U T H D A K O T A SDK E N T U C K Y K Y T E N N E S S E E T NL O U IS IA N A LA T E X A S T XM A IN E M E U T A H U T
M A R Y L A N D M D V E R M O N T V T
M A S S A C H U S E T T S M A V IR G IN IA V AM IC H IG A N M I W A S H IN G T O N W AM IN N E S O T A M N W E S T V IR G IN IA W VM ISS ISS IP P I M S W IS C O N S IN W I
M IS S O U R I M O W Y O M IN G W Y

In this book, for all international comparisons, we use the 20:20 ratio measure of income inequality from the United Nations Development Programme Human Development Indicators, 20 0 3-6 . As
survey dates vary for different countries (from 19 9 2 to 20 0 1), and as the lag time for effects will vary for the different outcomes we examine, we took the average across the reporting years 20 0 3-6 . For the US comparisons we use the 1999 state-level Gini coefficient based on household income produced by the US Census Bureau.
Data Sources
United Nations Development Program. Human development report. N ew Y ork: O xford University Press, 2003, 2004, 2005, 2006.
US Census Bureau. G in i ratios by state. 19 6 9 , 19 7 9 , 19 8 9 , 1999. W ashington, D C : US Census Bureau, 1999 (table S4).
D E V E L O P I N G T H E I N D E X O F H E A L T H A N D S O C I A L P R O B L E M S
T h e In te rn a tio n a l In d e x
The International Index has 10 components:
• Life expectancy (reverse coded)
• Teenage births• Obesity• M ental illness• Homicides• Imprisonment rates• M istrust• Social mobility (reverse coded)• Education (reverse coded)• Infant mortality rate
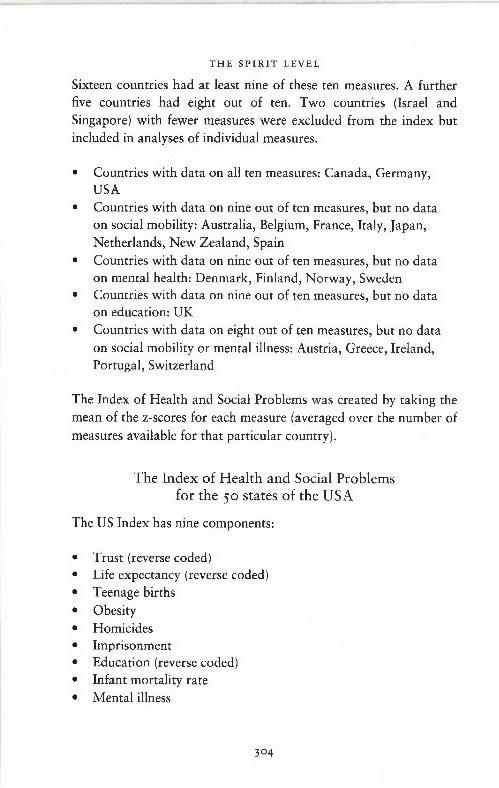
Sixteen countries had at least nine o f these ten measures. A further five countries had eight out o f ten. Tw o countries (Israel and Singapore) with fewer measures were excluded from the index but included in analyses o f individual measures.
• Countries with data on all ten measures: Canada, Germany,U SA
• Countries with data on nine out o f ten measures, but no data on social mobility: Australia, Belgium, France, Italy, Japan , Netherlands, N ew Zealand, Spain
• Countries with data on nine out o f ten measures, but no data on mental health: Denmark, Finland, N orw ay, Sweden
• Countries with data on nine out o f ten measures, but no data on education: U K
• Countries with data on eight out of ten measures, but no data
on social mobility or mental illness: Austria, Greece, Ireland, Portugal, Switzerland
The Index o f Health and Social Problems was created by taking the mean o f the z-scores for each measure (averaged over the number of
measures available for that particular country).
The Index of Health and Social Problems for the 50 states of the USA
The US Index has nine components:
• Trust (reverse coded)• Life expectancy (reverse coded)• Teenage births
• Obesity
• Homicides• Imprisonment• Education (reverse coded)
• Infant mortality rate• M ental illness

O f the 50 states, 40 have data for all eight measures.
Nine states are missing data on trust from the General Social Survey:
• A laska, Delaware, H aw aii, Idaho, M aine, N ebraska, N ew M exico, N evada, South Dakota
W yoming has data on trust, but not on homicides
The Index o f Health and Social Problems for the U SA was created
by taking the mean o f the z-scores for each measure (averaged over
the number of measures available for that particular state).

Sources of Data for the Indices of Health and Social ProblemsComponent International data US state data
Trust Per cent of people who
respond positively to the
statement ‘most people
can be trusted’
1999-zooi
World Values Survey1
Reverse-coded
Per cent of people who
respond positively to the
statement ‘most people can
be trusted’
1999
General Social Survey2
Reverse-coded
Life expectancy Life expectancy at birth
for men and women
Z004United Nations Human
Development Report3
Reverse-coded
Life expectancy at birth for
men and women
zooo
US Census Bureau,
Population Division4
Reverse-coded
Infant mortality Deaths in the first year of
life per 1,000 live births
zooo
World Bank5
Deaths in the first year of
life per 1,000 live births
2002US National Center for
Health Statistics6
Obesity Percentage of the
population with BMI >30,
averaged for men and
women
zooz
International Obesity
TaskForce7-8
Percentage of the
population with BMI >30,
averaged for men and
women
1999-zooz
Corrected estimates from
Prof Majid Ezzati, Harvard
University, based on
NHANES and BRFSS
surveys9

Component International data US state data
Mental illness Prevalence of mental
illness
2001-2003
W H O 10
Average number of days in
past month when mental
health was not good
1993-2001
BRFSS11
Education scores Combined average of
maths literacy and reading
literacy scores of 15-year-
olds
2000
OECD PISA12
Reverse-coded
Combined average of
maths and reading scores
for 8th graders
2003
US Department of
Education, National
Center for Education
Statistics13,14
Reverse-coded
Teenage birth rate Births per 1,000 women
aged 15-19 years
1998
UNICEF15
Births per 1,000 women
aged 15-19 years
2000
US National Vital Statistics16
Homicides Homicide rate per
100,000
Period average for
1990-2000
United Nations17
Homicide rate per
100,000
1999
FBI18
Imprisonment Prisoners per 100,000
United Nations17
Prisoners per 100,000
1997-8
US Department of
Justice19
Social mobility Correlation between
father and son’s income
30-year period data from
8 cohort studies
London School of
Economics20
N/A
Data Sources
1 . European Values Study Group and World Values Survey Association. European and World Values Survey Integrated Data File, 1 999-2001, Release 1 . Ann Arbor, M I: Inter-university Consortium for Political and Social Research, 2005.2. National Opinion Research Center. General Social Survey. Chicago: N O R C , 1999.3. United Nations Development Program. Human Development Report. New York: Oxford University Press, 2004.4. US Census Bureau. Population Division, Interim State Population Projections, Table 2. Internet release date: April 2 1 , 2005.5. World Bank. World Development Indicators (WDI) September 2006: ESDS International, (MIMAS) University of Manchester.6. US National Center for Health Statistics. Table 105, Statistical abstract of the United States. Washington, DC: C D C, 2006.7. International Obesity TaskForce. Obesity in Europe. London: International Obesity TaskForce in collaboration with the European Association for the Study of Obesity Task Forces, 2002.8. International Obesity TaskForce. Overweight and obese. London: International Obesity Taskforce, 2002.9. M. Ezzati, H. Martin, S. Skjold, S. Vander Hoorn, C. J. Murray. ‘Trends in national and state-level obesity in the USA after correction for selfreport bias: analysis of health surveys’ . / R Soc Med 2006; 99(5): 250-7.10 . K. Demyttenaere, R. Bruffaerts, J. Posada-Villa, I. Gasquet, V. Kovess, J. P. Lepine, et al. ‘Prevalence, severity, and unmet need for treatment of mental disorders in the World Health Organization World Mental Health Surveys’ . Jama 2004; 29 1(21): 2581-90.1 1 . H. S. Zahran, R. Kobau, D. G. Moriarty, M. M. Zack, J. Holt, R. Donehoo. ‘Health-related quality of life surveillance - United States, 1993-2002’ . M M W R Surveill Summ 2005; 54(4): 1-3 5 .ia . OECD . Education at a glance. O ECD Indicators, 2003.13 . US Department of Education N C fES. The Nation’s Report Card: Reading Highlights 2003. Washington, DC, 2004.14 . US Department of Education N C fES. The Nation’s Report Card: Mathematics Highlights 2003. Washington, DC, 2004.15 . U N ICEF Innocenti Research Centre. A league table o f teenage births in rich nations. Florence: Innocenti Report Card, 2001.16 . US Census Bureau. Statistical Abstract o f the United States: 2000 (120th Edition). Washington: Census Bureau, 2000.

17. United Nations Crime and Justice Information Network. Survey on Crime Trends and the Operations o f Criminal Justice Systems (Fifth, Sixth, Seventh, Eighth): United Nations, 2000.18 . Federal Bureau of Investigation. Crime in the United States 1999. Washington, DC: US Government Printing Office, 1999.19 . US Department of Justice BoJS. Incarceration rates for prisoners under State or Federal jurisdiction. File: corpop25.wki.20. J. Blanden, P. Gregg, S. Machin. Intergenerational mobility in Europe and North America. London: Centre for Economic Performance, London School of Economics, 2005.

Statistics
Pearson Correlation Coefficients (r) and Statistical Significance
(p-value) for Associations with Income Inequality.
Indicator International data r p-value
US data r p-value
Trust - 0 .66 < 0.0 1 -0 .7 0 < 0 .0 1
Life expectancy -0 .4 4 0.04 -0 .4 5 < 0 .0 1
Infant mortality 0.42 0.04 0.43 < 0 .0 1
Obesity 0 .57 <0.01 0.47 <0.01
M ental illness 0.73 < 0 .0 1 0 .18 0 .12
Education score -0 .4 5 0.04 -0 .4 7 .0 1
Teenage birth rate 0.73 < 0 .0 1 0.46 < 0 .0 1
Homicides 0.47 0.02 0.42 <0.01
Imprisonment 0.75 < 0 .0 1 0.48 < 0 .0 1
Social mobility 0.93 < 0.01 - -
Index 0.87 < 0 .0 1 0-59 < 0 .0 1
Overweight children 0.59 O.OI 0 .57 < 0 .0 1
Drugs index 0.63 < 0.01
Calorie intake 0.46 0.03
Public expenditure -0 .5 4 O.OIon health care
Child well-being - 0 .7 1 <0 .01 - 0 .5 1 < 0 .0 1
Triple education score -0 .4 4 0.04

Indicator International data US datar p-value r p-value
Child conflict 0.62 <0.01
Spending on foreign aid -0 .6 1 <0 .01
Recycling -0 .8 2 < 0 .0 1
Peace index - 0 .5 1 0 .0 1
Paid maternity leave -0 .5 5 0 .0 1
Advertising 0.73 < 0.01
Police 0 .52 0.04
Social expenditure -0 .4 5 0.04
W omen’s status -0 .4 4 0.04 -0 .3 0 0.03
Patents per capita - 0-49 0.02
Juvenile homicides 0.29 <0.05
High school drop-outs 0.79 < 0 .0 1
Child mental illness 0 .36 0 .0 1
Pugnacity 0.47 < 0 .0 1

References
i . The Harwood Group, Yearning for Balance: Views o f Americans on consumption, materialism, and the environment. Takoma Park, M D: Merck Family Fund, 1995.2.. United Nations Development Program, Human Development Report. New York: Oxford University Press, 2006.3. R. Layard, Happiness. London: Allen Lane, 2005.4. World Bank, World Development Report 19 9 3: Investing in health. Oxford: Oxford University Press, 1993.5. European Values Study Group and World Values Survey Association, European and World Values Survey Integrated Data File, 19 9 9 -20 0 1, Release 1 . Ann Arbor, M I: Inter-university Consortium for Political and Social Research, 2005.6 . United Nations Development Program, Human Development Report. New York: Oxford University Press, 2004.7. G. D. Smith, J. D. Neaton, D. Wentworth, R. Stamler and J. Stamler, ‘Socioeconomic differentials in mortality risk among men screened for the Multiple Risk Factor Intervention Trial: I. White men’, American Journal o f Public Health (1996) 86 (4): 486-96.8. R. G. Wilkinson and K. E. Pickett, ‘Income inequality and socioeconomic gradients in mortality’, American Journal o f Public Health (2008) 98 (4): 699-704.9. L. McLaren, ‘Socioeconomic status and obesity’, Epidemiologic Review (2007) 29: 29-48.10 . R. G. Wilkinson and K. E. Pickett, ‘Income inequality and population health: a review and explanation of the evidence’, Social Science and Medicine (2006) 62 (7): 1768 -84 .1 1 . J. M. Twenge, ‘The age of anxiety? Birth cohort change in anxiety and neuroticism, 19 5 2 - 19 9 3 ’ , Journal o f Personality and Social Psychology (2007) 79 (6): 10 0 7 -2 1 .

1 2 . M. Rutter and D. J. Smith, Psychosocial Disorders in Young People: Time trends and their causes. Chichester: Wiley, 1995.13 . S. Collishaw, B. Maughan, R. Goodman and A. Pickles, ‘Time trends in adolescent mental health’, Journal o f Child Psychology and Psychiatry(2004) 45 (8): 13 5 0 -6 2 .14 . B. Maughan, A. C. Iervolino and S. Collishaw, ‘Time trends in child and adolescent mental disorders’, Current Opinion in Psychiatry (2005) 18 (4): 3 8 1-5 .15 . J. M. Twenge, Generation Me. New York: Simon & Schuster, 2006.16 . S. S. Dickerson and M. E. Kemeny, ‘Acute stressors and cortisol responses: a theoretical integration and synthesis of laboratory research’, Psychological Bulletin (2004) 130 (3): 3 5 5 -9 1 .17 . T. J. Scheff, ‘Shame and conformity: the defense-emotion system’, American Sociological Review (1988) 53: 395-406.18. H. B. Lewis, The Role o f Shame in Symptom Formation. Hillsdale, N J: Erlbaum, 1987.19. R. W. Emerson, Conduct o f Life. New York: Cosimo, 2007.20. A. Kalma, ‘Hierarchisation and dominance assessment at first glance’, European Journal o f Social Psychology (1991) 2 1 (2): 16 5 -8 1 .2 1. F. Lim, M. H. Bond and M. K. Bond, ‘Linking societal and psychological factors to homicide rates across nations’, Journal o f Cross-Cultural Psychology (2005) 36 (5): 5 15 -3 6 .22. S. Kitayama, H. R. Markus, H. Matsumoto and V. Norasakkunkit, ‘Individual and collective processes in the construction of the self: selfenhancement in the United States and self-criticism in Japan’, Journal o f Personal and Social Psychology (1997) 72 (6): 12 4 5 -6 7 .23. A. de Tocqueville, Democracy in America. London: Penguin, 2003.24. National Opinion Research Center, General Social Survey. Chicago: N O R C , 1999-2004.25. R. D. Putnam, Bowling Alone: The collapse and revival o f American community. New York: Simon & Schuster, 2000.26. R. D. Putnam, ‘Social capital: measurement and consequences’, ISU M A : Canadian Journal o f Policy Research (2001) 2 (1): 4 1 - 5 1 .27. E. Uslaner, The Moral Foundations o f Trust. Cambridge: Cambridge University Press, 2002.28. B. Rothstein and E. Uslaner, ‘All for all: equality, corruption and social trust’, World Politics (2005) 58: 4 1 - 7 2 .29. J. C. Barefoot, K. E. Maynard, J. C. Beckham, B. H. Brummett,

K. Hooker and I. C. Siegler, ‘Trust, health, and longevity’, Journal o f Behavioral Medicine {1998) 2 1 (6): 5 17 -2 6 .30. S. V. Subramanian, D. J. Kim and I. Kawachi, ‘Social trust and selfrated health in US communities: a multilevel analysis’, Journal o f Urban Health (2002) 79 (4, Suppl. 1): S 2 1-3 4 .3 1 . E. Klinenberg, Heat Wave: A social autopsy o f disaster in Chicago. Chicago: University of Chicago Press, 2002.32. J. Lauer, ‘Driven to extremes: fear of crime and the rise of the sport utility vehicle in the United States’ , Crime, Media, Culture (2.005) 1: 149-68 .33. K. Bradsher, ‘The latest fashion: fear-of-crime design’ , New York Times, 23 July 2000.34. M. Adams, Fire and Ice. The United States, Canada and the myth o f converging values. Toronto: Penguin (Canada), 2003.35. E. J. Blakely and M. G. Snyder, Fortress America: Gated communities in the United States. Washington, DC: Brookings Institute Press,
199736. 1. Kawachi, B. P. Kennedy, V. Gupta and D. Prothrow-Stith, ‘Women’s status and the health of women and men: a view from the States’, Social Science and Medicine (1999) 48 (1): 2 1 - 3 2 .37. H. J. Jun, S. V. Subramanian, S. Gortmaker and I. Kawachi, ‘A multilevel analysis of women’s status and self-rated health in the United States’, Journal o f the American Medical Women’s Association (2004) 59 (3): 17 2 -8 0 .38. O EC D , International Development Statistics Online. O ECD . Stat: http://www.oecd.org/dataoecd/5 0/17/503 77 2 1 .htm, 2005.39. L. Clark and A. Dolan, ‘The disturbed generation’, Daily Mail, 20 June 2007.40. C. Donnellan, Mental Wellbeing. Cambridge: Independence Educational Publishers, 2004.4 1. The G ood Childhood Inquiry. Evidence Summary 5 - Health. London: Children’s Society, 2008.42 . J. M. Perrin, S. R. Bloom and S. L. Gortmaker, ‘The increase of childhood chronic conditions in the United States’, Journal o f the American Medical Association (2007) 297 (24): 2755-9 .43. Child and Adolescent Health Measurement Initiative. National Survey of Children’s Health. Data Resource Center on Child and Adolescent Health: http://www.childhealthdata.org (accessed 17 August 2006).44. Office for National Statistics, Psychiatric Morbidity among Adults Living in Private Households, 2000. London: H M SO , 2001.

45. Hansard (House of Commons Daily Debates). Written answers to questions. (2005) 439: 22 Nov. 2005: Column 1798W .46. R. C. Kessler, W. T. Chiu, O. Dernier, K. R. Merikangas and E. E. Walters, ‘Prevalence, severity, and comorbidity of 12-month DSM - IV disorders in the National Comorbidity Survey Replication’, Archives o f General Psychiatry (2005) 62 (6): 6 17 -2 7 .47. T. L. Mark, K. R. Levit, J. A. Buck, R. M. Coffey and R. Vandivort- Warren, ‘Mental health treatment expenditure trends, 19 8 6 -20 0 3 ’, Psychiatric Services (2007) 58 (8): 10 4 1-8 .48. D. Rowe, How to Improve your Mental Well-being. London: Mind,2002.49. K. Demyttenaere, R. Bruffaerts, J. Posada-Villa, I. Gasquet, V. Kovess, J. P. Lepine, M. C. Angermeyer, S. Bernert, G. de Girolamo, P. Morosini,G. Polidori, T. Kikkawa, N. Kawakami, Y. Ono, T. Takeshima, H. Uda, E. G. Karam, J. A. Fayyad, A. N. Karam, Z. N. Mneimneh, M. E. Medina- Mora, G. Borges, C. Lara, R. de Graaf, J. Ormel, O. Gureje, Y. Shen, Y . Huang, M. Zhang, J. Alonso, J. M. Haro, G. Vilagut, E. J. Bromet, S. Gluzman, C. Webb, R. C. Kessler, K. R. Merikangas, J. C. Anthony, M. R. von Korff, P. S. Wang, T. S. Brugha, S. Aguilar-Gaxiola, S. Lee,S. Heeringa, B. E. Pennell, A. M. Zaslavsky, T. B. Ustun and S. Chatterji, ‘Prevalence, severity, and unmet need for treatment of mental disorders in the World Health Organization World Mental Health Surveys’, Journal o f the American Medical Association (2004) 291 (21): 258 1-9 0 .50. J. E. Wells, M. A. Oakley Browne, K. M. Scott, M. A. McGee, J. Baxter and J. Kokaua, ‘Te Rau Hinengaro: the New Zealand Mental Health Survey: overview of methods and findings’, Australian and New Zealand Journal o f Psychiatry (2006) 40 (10): 835-44.5 1 . Australian Bureau of Statistics. National Health Survey, Mental Health, 2001. Canberra: Australian Bureau of Statistics, 2003.52. WHO International Consortium in Psychiatric Epidemiology, ‘Crossnational comparisons of the prevalences and correlates of mental disorders’, Bulletin o f the World Health Organization (2000) 78 (4): 4 13 -2 6 .53. Center for Disease Control and Prevention, ‘Self-reported frequent mental distress among adults - United States, 19 9 3 -2 0 0 1 ’ (2004) 53: 963-6 .54. O. James, Affluenza. London: Vermilion, 2007.55. A. de Botton, Status Anxiety. London: Hamish Hamilton, 2004.56 . R. H. Frank, Luxury Fever. New York: Free Press, 1999.57. United Nations Office on Drugs and Crime, World Drug Report. Vienna: UN Office on Drugs and Crime, 2007.

58 . Centers for Disease Control and Prevention. Compressed Mortality Files 1999-2002. http://wonder.cdc.gov/mortSQL.html (accessed 9 September 2008)59. D. Morgan, K. A, Grant, H. D. Gage, R. H. Mach, J. R. Kaplan,0 . Prioleau, S. FI. Nader, N. Buchheimer, R. L. Ehrenkaufer and M. A. Nader, ‘Social dominance in monkeys: dopamine Dz receptors and cocaine self-administration’, Nature Neuroscience (2002) 5 (2): 16 9 -74 .60. M. Susser and E. Susser, ‘Choosing a future for epidemiology: I. Eras and paradigms’, American Journal o f Public Health (1996) 86 (5): 668-73.6 1. M. Susser and E. Susser, ‘Choosing a future for epidemiology: II. From black box to Chinese boxes and eco-epidemiology’, American Journal o f Public Health (1996) 86 (5): 674-7.62. M. G. Marmot, A. M. Adelstein, N. Robinson and G. A. Rose, ‘Changing social-class distribution of heart disease’, British Medical Journal (1978) 2 (6145): 1 1 0 9 - 12 .63. M. G. Marmot, G. Rose, M. Shipley and P. J. Hamilton, ‘Employment grade and coronary heart disease in British civil servants’, Journal o f Epidemiology and Community Health (1978) 32 (4): 244-9.64. H. Bosma, M. G. Marmot, H. Hemingway, A. C. Nicholson, E. Brunner and S. A. Stansfeld, ‘Low job control and risk of coronary heart disease in Whitehall II (prospective cohort) study’, British Medical Journal (1997) 3 14 (7080): 558-65.65. M. G. Marmot, G. D. Smith, S. Stansfeld, C. Patel, F. North, J. Head,1. White, E. Brunner and A. Feeney, ‘Health inequalities among British civil servants: the Whitehall II study’, Lancet (1991) 337 (8754): 13 8 7 -9 3 .66. Council of Civil Service Unions/Cabinet Office, Work, Stress and Health: The Whitehall II Study. London: Public and Commercial Services Union, 2004.67. G. D. Smith, M. J. Shipley and G. Rose, ‘Magnitude and causes of socioeconomic differentials in mortality: further evidence from the Whitehall Study’, Journal o f Epidemiology and Community Health (1990)44 (4): 2.65-70.68. R. G. Wilkinson and M. Marmot, Social Determinants o f Health: The Solid Facts (2nd edition). Copenhagen: World Health Organization, Regional Office for Europe, 2006.69. E. Durkheim, Suicide. London: Routledge, 1952.70. L. Berkman and T. Glass, ‘Social integration, social networks, social support, and health’ , in L. Berkman and I. Kawachi, (eds), Social Epidemiology. New York: Oxford University Press, 2.000.

7 1. S. A. Stansfeld, ‘Social support and social cohesion’ , in M. Marmot and R. G. Wilkinson (eds), Social Determinants o f Health. Oxford: Oxford University Press, 2006.72. S. Cohen, ‘Keynote Presentation at the Eighth International Congress of Behavioral Medicine: The Pittsburgh common cold studies: psychosocial predictors of susceptibility to respiratory infectious illness’, International Journal o f Behavioral Medicine (2005) 12 (3): 1 2 3 - 3 1 .73. J. K. Kiecolt-Glaser, T. J. Loving, J. R. Stowell, W. B. Malarkey,S. Lemeshow, S. L. Dickinson and R. Glaser, ‘Hostile marital interactions, proinflammatory cytokine production, and wound healing, Archives o f General Psychiatry (2005) 62 (12): 13 7 7 -8 4 .74. W. T. Boyce, ‘Stress and child health: an overview’, Pediatric Annals (1985) 14 (8): 539-42.75. M. C. Holmes, ‘Early life stress can programme our health’, Journal o f Neuroendocrinology (2001) 13 (2): 1 1 1 - 1 2 .76. R. H. Bradley and R. F. Corwyn, ‘Socioeconomic status and child development’, Annual Review o f Psychology (2002) 53: 3 7 1-9 9 .77. M. Wilson and M. Daly, ‘Life expectancy, economic inequality, homicide, and reproductive timing in Chicago neighbourhoods’, British Medical Journal (1997) 3 14 (7089): 12 7 1 - 4 .78. M. K. Islam, J. Merlo, I. Kawachi, M. Lindstrom and U. G. Gerdtham, ‘Social capital and health: does egalitarianism matter? A literature review’, International Journal for Equity in Health (2006) 5 :3 .79. I. Kawachi, B. P. Kennedy, K. Lochner and D. Prothrow-Stith, ‘Social capital, income inequality, and mortality’, American Journal o f Public Health (1997) 87 (9): 14 9 1-8 .80. C. McCord and H. P. Freeman, ‘Excess mortality in Harlem’, New England Journal o f Medicine (1990) 322 (3): 17 3 -7 .8 1. R. G. Wilkinson, ‘Income distribution and life expectancy’, British Medical Journal (1992) 304 (6820): 16 5 -8 .82. Editor’s Choice, ‘The Big Idea’, British Medical Journal (1996) 3x2 (7037): o.83. Department of Health, The N H S Plan: A plan for investment, a plan for reform. London: HM SO , 2000.84. Office for National Statistics. ‘Trends in ONS Longitudinal Study estimates of life expectancy, by social class 19 7 2 -2 0 0 5 ’ . http://www. statistics.gov.uk/StatBase/Product.asp?vlnk=846o&More=Y (accessed 9 September 2008). .85. C. J. Murray, S. C. Kulkarni, C. Michaud, N. Tomijima, M. T. Bulzacchelli, T. J. Iandiorio and M. Ezzati, ‘Eight Americas: investigating

mortality disparities across races, counties, and race-counties in the United States’, Public Library o f Science Medicine (2006) 3 (9): e26o.86. A. T. Geronimus, J. Bound, T. A. Waidmann, C. G. Colen and D. Steffick, ‘Inequality in life expectancy, functional status, and active life expectancy across selected black and white populations in the United States’, Demography (2001) 38 (2): 2 2 7 -3 1 .87. G. K. Singh and M. Siahpush, ‘Widening socioeconomic inequalities in US life expectancy, 1980 -20 00 ’, International Journal o f Epidemiology (2006) 35 (4): 969-7988. P. M. Lantz, J. S. House, J . M. Lepkowski, D. R. Williams, R. P. Mero and J. Chen, ‘Socioeconomic factors, health behaviors, and mortality: results from a nationally representative prospective study of US adults’, Journal o f the American Medical Association (1998) 279 (21): 17 0 3 -8 .89. P. Makela, T. Valkonen and T. Martelin, ‘Contribution of deaths related to alcohol use to socioeconomic variation in mortality: register based follow up study’ , British Medical Journal (1997) 3 15 (7102): 2 1 1 - 1 6 .90. G. Rose and M. G. Marmot, ‘Social class and coronary heart disease’, British Heart Journal (1981) 45 (1): 1 3 - 1 9 .9 1. R. G. Wilkinson, Unhealthy Societies: The afflictions o f inequality. London: Routledge, 1996.92. R. Sapolsky, ‘Sick of poverty’ , Scientific American (2005) 293 (6): 92-9 .93. L. Vitetta, B. Anton, F. Cortizo and A. Sali, ‘Mind-body medicine: stress and its impact on overall health and longevity’, Annals o f the New York Academy o f Sciences (2005) 1057: 492-505.94. S. V. Subramanian and I. Kawachi, ‘Income inequality and health: what have we learned so far?’ Epidemiologic Review (2004) 26: 7 8 -9 1 .95. S. Bezruchka, T. Namekata and M. G. Sistrom, ‘Improving economic equality and health: the case of postwar Japan’, American Journal o f Public Health (2008) 98: 2 16 - 2 1 .96. P. Walberg, M. McKee, V. Shkolnikov, L. Chenet and D. A. Leon, ‘Economic change, crime, and mortality crisis in Russia: regional analysis’ , British Medical Journal (1998) 3 17 (7154): 3 12 - 18 .97. K. M. Flegal, M. D. Carroll, C. L. Ogden and C. L. Johnson, ‘Prevalence and trends in obesity among US adults’, Journal o f the American Medical Association (2002) 288: 17 2 3 -7 .98. International Obesity TaskForce, Obesity in Europe. London: International Obesity TaskForce in collaboration with the European Association for the Study of Obesity Task Forces, 2002.

99. World Health Organization, Report o f a jo int W H O /FAO Expert Consultation. Diet, nutrition and the prevention o f chronic diseases. Geneva: WHO Technical Report Series no. 9 16. W HO, 2002.100. C. L. Ogden, M. D. Carroll, L. R. Curtin, M. A. McDowell, C. J. Tabak and K. M. Flegal, ‘Prevalence of overweight and obesity in the United States, 1999-20 04 ’, Journal o f the American Medical Association (2006) 295 (13): 15 4 9 -5 5 .10 1 . S. J. Olshansky, D. J. Passaro, R. C. Hershow, J. Layden, B. A. Carnes, J. Brody, L. Hayflick, R. N. Butler, D. B. Allison and D. S. Ludwig, ‘A potential decline in life expectancy in the United States in the 21st century’, New England Journal o f Medicine (2005) 352 ( 11) : 1 13 8 -4 5 .102.. CBS News, ‘Teen slims down with gastric bypass: Surgery a growing trend among obese teenagers’ , CBS Broadcasting Inc. http://www. cbsnews.com/stories/2oo7/05/21/earlysh0w/health/main2830891.shtm/ ?Source=Search-story (accessed 15 September 2008).10 3 . G. Rollings, ‘ i4st boy - is this child abuse?’ Sun, 26 February 2007.104. B. Ashford and V. Wheeler, ‘Sam, aged 9, is i4st and size 18 ’, Sun,28 February 2007.105. A. Parker, ‘Daryl is 20 stone, aged just 1 2 ’, Sun, 2 March 2007.106. E. Brunner, M. Juneja and M. Marmot, ‘Abdominal obesity and disease are linked to social position’, British Medical Journal (1998) 316 : 308.107. A. Molarius, J. C. Seidell, S. Sans, J. Tuomilehto and K. Kuulasmaa, ‘Educational level, relative body weight and changes in their association over 10 years: an international perspective from the WHO M O N IC A project’, American Journal o f Public Health (2000) 90: 1260-86 .108. P. Toynbee, ‘Inequality is fattening’, Guardian, 28 May 2004.109. International Obesity Taskforce, Overweight and Obese. London: International Obesity Taskforce, 2002.1 10 . U N ICEF Innocenti Research Centre. Child Poverty in Perspective: An overview o f child well-being in rich countries. Florence: Innocenti Report Card, 2007.h i . H. S. Kahn, A. V. Patel, E. J. Jacobs, E. E. Calle, B. P. Kennedy andI. Kawachi, ‘Pathways between area-level income inequality and increased mortality in U.S. men’, Annals o f the N ew York Academy o f Sciences (1999) 896: 3 32 -4 .1 1 2 . A. V. Diez-Roux, B. G. Link and M. E. Northridge, ‘A multilevel analysis of income inequality and cardiovascular disease risk factors’, Social Science and Medicine (2000) 50 (5): 6 73-87 .1 1 3 . M. Ezzati, H. Martin, S. Skjold, S. vander Hoorn and C. J. Murray,

‘Trends in nadonal and state-level obesity in the USA after correction for self-report bias: analysis of health surveys’, Journal o f the Royal Society o f Medicine (2006) 99 (5): 250 -7 .1 14 . K. E. Pickett, S. Kelly, E. Brunner, T. Lobstein and R. G. Wilkinson, ‘Wider income gaps, wider waistbands? An ecological study of obesity and income inequality’, Journal o f Epidemiology and Community Health(2005) 59 (8): 670-4.1 1 5 . K. Ball, G. D. Mishra and D. Crawford, ‘Social factors and obesity: an investigation of the role of health behaviours’, International Journal o f Obesity and Related Metabolic Disorders (2003) 27 (3): 394-403.1 16 . E. J. Brunner, T. Chandola and M. G. Marmot, ‘Prospective effect of job strain on general and central obesity in the Whitehall II Study’, American Journal o f Epidemiology (2007) 165 (7): 828-37.1 1 7 . L. R. Purslow, E. H. Young, N. J. Wareham, N. Forouhi, E. J. Brunner, R. N. Luben, A. A. Welch, K. T. Khaw, S. A. Bingham and M. S. Sandhu, ‘Socioeconomic position and risk of short-term weight gain: prospective study of 14 ,6 19 middle-aged men and women’, BioMed Central Public Health (2008) 8: 1 1 2 .1 18 . S. P. Wamala, A. Wolk and K. Orth-Gomer, ‘Determinants of obesity in relation to socioeconomic status among middle-aged Swedish women’ , Preventive Medicine (1997) 26 (5 Pt 1): 734-44 .1 19 . P. Bjorntorp, ‘Do stress reactions cause abdominal obesity and comorbidities?’ Obesity Reviews (2001) 2 (2): 73-86 .120. V. Drapeau, F. Therrien, D. Richard and A. Tremblay, ‘Is visceral obesity a physiological adaptation to stress?’ Panminerva Medica (2003)45 (3): 18 9 -9 5 .12 1 . J. Laitinen, E. Ek and U. Sovio, ‘Stress-related eating and drinking behavior and body mass index and predictors of this behavior’, Preventive Medicine (2002) 34 (1): 29-39 .12 2 . M. F. Dallman, N. Pecoraro, S. F. Akana, S. E. La Fleur, F. Gomez,H. Houshyar, M. E. Bell, S. Bhatnagar, K. D. Laugero and S. Manalo, ‘Chronic stress and obesity: a new view of “ comfort food’” , Proceedings o f the National Academy o f Sciences USA (2003) 100 (20): 1 16 9 6 -7 0 1.12 3 . A. M. Freedman, ‘Deadly diet’, Wall Street Journal, 18 -2 0 December 1990.124. C. C. Hodgkins, K. S. Cahill, A. E. Seraphine, K. Frost-Pineda and M. S. Gold, ‘Adolescent drug addiction treatment and weight gain’, Journal o f Addictive Diseases (2004) 23 (3): 55-6 5 .125 . G. A. James, M. S. Gold and Y. Liu, ‘Interaction of satiety and

reward response to food stimulation’, Journal o f Addictive Diseases (2004) 23 (3): 2 3 -3 7 .126. K. D. Kleiner, M. S. Gold, K. Frost-Pineda, B. Lenz-Brunsman, M. G. Perri and W. S. Jacobs, ‘Body mass index and alcohol use’, Journal o f Addictive Diseases (2004) 23 (3): 10 5 - 18 .127. J. H. Gao, ‘Neuroimaging and obesity’, Obesity Reviews (2001)
9 ( 11) : 72-9- 3°-128. K. Sproston and P. Primatesta (eds), Health Survey for England2003. Vol. 2: Risk Factors for Cardiovascular Disease. London: HM SO,2004.129. C. Langenberg, R. Hardy, D. Kuh, E. Brunner and M. Wadsworth, ‘Central and total obesity in middle aged men and women in relation to lifetime socioeconomic status: evidence from a national birth cohort’, Journal o f Epidemiology and Community Health (2003) 57 (10): 8 16 -2 2 .130. R. M. Viner and T. J. Cole, ‘Adult socioeconomic, educational, social, and psychological outcomes of childhood obesity: a national birth cohort study’, British Medical Journal (2005) 330 (7504): 1354 .1 3 1 . S. L. Gortmaker, A. Must, J. M. Perrin, A. M. Sobol and W. H. Dietz, ‘Social and economic consequences of overweight in adolescence and young adulthood’, New England Journal o f Medicine (1993) 329 (14): 10 0 8 -12 .132 . J. D. Sargent and D. G. Blanchflower, ‘Obesity and stature in adolescence and earnings in young adulthood. Analysis of a British birth cohort’, Archives o f Pediatric and Adolescent Medicine (1994) 148 (7): 6 8 1-7 .133. D. Thomas, ‘Fattism is the last bastion of employee discrimination’, Personnel Today, 25 October 2005.134. J. Wardle and J. Griffith, ‘Socioeconomic status and weight control practices in British adults’, Journal o f Epidemiology and Community Health (2001) 55 (3): 18 5-9 0 .135. J. Sobal, B. Rauschenbach and E. A. Frongillo, ‘Marital status changes and body weight changes: a US longitudinal analysis’, Social Science and Medicine (2003) 56 (7): 15 4 3 -5 5 .136. T. Smith, C. Stoddard and M. Barnes, ‘Why the Poor Get Fat: Weight Gain and Economic Insecurity’ , School of Economic Sciences Working Paper, Washington State University: http://ideas.repec.0rg/p/wsu/wpaper/ tgsmith-2.html (accessed 15 September 2008).137. B. Fisher, D. Dowding, K. E. Pickett and F. Fylan, ‘Health promotion at NH S breast cancer screening clinics in the U K ’ , Health Promotion International (2007) 22 (2): 13 7 -4 5 .138. J. R. Speakman, H. Walker, L. Walker and D. M. Jackson,

‘Associations between BM I, social strata and the estimated energy content of foods’, Journal o f Obesity and Related Metabolic Disorders (2.005)29 (10): 12 8 1-8 .139 . N. E. Adler, E. S. Epel, G. Castellazzo and J. R. Ickovics, ‘Relationship of subjective and objective social status with psychological and physiological functioning: preliminary data in healthy white women’, Health Psychology (zooo) 19 (6): 586-92.140. E. Goodman, N. E. Adler, S. R. Daniels, J. A. Morrison, G. B. Slap and L. M. Dolan, ‘Impact of objective and subjective social status on obesity in a biracial cohort of adolescents’, Obesity Reviews (2003) 1 1 (8): 10 18-2 .6 .14 1 . B. Martin, ‘Income inequality in Germany during the 1980s and 1990s’, Review o f Income and Wealth (2000) 46 (1): 1 - 1 9 .142. V. Hesse, M. Voigt, A. Salzler, S. Steinberg, K. Friese, E. Keller, R. Gausche and R. Eisele, ‘Alterations in height, weight, and body mass index of newborns, children, and young adults in eastern Germany after German reunification’ , Journal o f Pediatrics (2003) 142 (3): 259-62.143. S. Baum and K. Payea, Education Pays: The benefits o f higher education for individuals and society. Washington, DC: College Board,2004.144. Bureau of Labor Statistics, Weekly and Hourly Earnings Data from the Current Population Survey. Washington, DC: US Department of Labor, 2007.145. M. Benn and F. Millar, A Comprehensive Future: Quality and equality for all our children. London: Compass, 2006.146. J. D. Teachman, ‘Family background, educational resources, and educational attainment’, American Sociological Review (1987) 52: 548-57.147. O ECD and Statistics Canada, Literacy in the Information Age: Final report o f the International Adult Literacy Survey. Paris: Organization for Economic Co-Operation and Development, 2000.148. R. Wilkinson and K. E. Pickett, ‘Health inequalities and the UK Presidency of the EU ’ , Lancet (2006) 367 (9517): 1 12 6 -8 .149. R. G. Wilkinson and K. E. Pickett, ‘The problems of relative deprivation: why some societies do better than others’, Social Science and Medicine (2007) 65 (9): 19 6 5-78 .150. J. D. Willms, ‘Quality and inequality in children’s literacy: the effects of families, schools, and communities’, in D. P. Keating and C. Hertzman (eds), Developmental Health and the Wealth o f Nations. New York: Guilford Press, 1999.1 5 1 . J. D. Willms, ‘Literacy proficiency of youth: evidence of converging

socioeconomic gradients’, International Journal o f Educational Research (2003) 39: 24 7-52 .15 2 . A. Siddiqi, I. Kawachi, L. Berkman, S. V. Subramanian and C. Hertzman, ‘Variation of socioeconomic gradients in children’s developmental health across advanced capitalist societies: analysis of 22 OECD nations’, International Journal o f Health Services (2007) 37 (1): 63-87.15 3 . Centre for Longitudinal Studies, Disadvantaged Children up to a Year Behind by the Age o f Three. London: Institute of Education, 2007.154. R. H. Frank and A. S. Levine, Expenditure Cascades. Cornell University mimeograph. Ithaca: Cornell University, 2005.155 . G. W. Evans and K. English, ‘The environment of poverty: multiple stressor exposure, psychophysiological stress, and socioemotional adjustment’, Child Development (2002) 73 (4): 12 38 -4 8 .156 . P. Garrett, N. Ng’andu and J. Ferron, ‘Poverty experiences of young children and the quality of their home environments’, Child Development (1994) 65 (2, Spec, no.): 3 3 1- 4 5 .157 . V. C. McLoyd, ‘The impact of economic hardship on black families and children: psychological distress, parenting, and socioemotional development’, Child Development (1990) 61 (2): 3 1 1 - 4 6 .158 . V. C. McLoyd and L. Wilson, ‘Maternal behavior, social support, and economic conditions as predictors of distress in children’, New Directions for Child and Adolescent Development (1990) 46: 49-69.159 . A. Lareau, ‘Invisible inequality: social class and childrearing in black families and white families’, American Sociological Review (2002) 67: 747- 76 .160. J. Currie, Welfare and the Well-being o f Children. Reading: Harwood Academic Publishers, 1995.16 1 . L. G. Irwin, A. Siddiqi and C. Hertzman, Early Childhood Development: A powerful equalizer. Geneva: World Health Organization Commission on Social Determinants of Health, 2007.162. U N ICEF Innocenti Research Centre, A League Table o f Educational Disadvantage in Rich Nations. Florence: Innocenti Report Card, 2002.163 . K. Hoff and P. Pandey, Belief Systems and Durable Inequalities: An experimental investigation o f Indian caste. Policy Research Working Paper. Washington, D C: World Bank, 2004.164. C. M. Steele and J. Aronson, ‘Stereotype threat and the intellectual test performance of African-Americans’ , Journal o f Personality and Social Psychology (1995) 69: 7 9 7 -8 11 .165. S. J. Spencer, C. M. Steele and D. M. Quinn, ‘Stereotype threat and

women’s math performance’ , Journal o f Experimental Social Psychology
(1999) 35 (1): 4- 2.81 66. W. Peters, A Class Divided: Then and now. New Haven: Yale University Press, 1987.167. J. Zull, The Art o f Changing the Brain: Enriching the practice o f teaching by exploring the biology o f learning. Sterling: Stylus Publishing, 2002.168. G. Evans. Educational Failure and Working Class White Children in Britain. Basingstoke: Palgrave, 2006.169. L. Atkinson, ‘Sorry, Mum, we’re all pregnant!’ Sneak (2005) Issue no. 162.170. J. Askill, ‘Meet the kid sisters’, Sun, 23 May 2005.1 7 1 . S. Carroll, ‘These girls’ babies are the real victims’, Daily Mirror, 25 May, 2005.172 . Committee on Adolescence AAoP, ‘Adolescent pregnancy - current trends and issues’, Pediatrics (1998) 10 3: 5 16 -2 0 .17 3 . Social Exclusion Unit, Teenage Pregnancy. London: HM SO , 1999.174 . D. A. Lawlor and M. Shaw, ‘Too much too young? Teenage pregnancy is not a public health problem’, International Journal o f Epidemiology (2002) 3 1 (3): 552-4 .17 5 . A. T. Geronimus, ‘The weathering hypothesis and the health of African-American women and infants: evidence and speculations’, Ethnicity and Disease (1992) 2 (3): 2 0 7 -2 1.176. A. T. Geronimus, ‘Black/white differences in the relationship of maternal age to birthweight: a population-based test of the weathering hypothesis’, Social Science and Medicine (1996) 42 (4): 589-97.177 . J. Hobcraft and K. Kiernan, ‘Childhood poverty, early motherhood and adult social exclusion’, British Journal o f Sociology (2001)
52- (3): 495- 5I 7-178 . J. Rich-Edwards, ‘Teen pregnancy is not a public health crisis in the United States. It is time we made it one’, International Journal o f Epidemiology (2002) 3 1 (3): 555-6 .179 . S. Cater and L. Coleman, ‘Planned’ Teenage Pregnancy: Views and experiences o f young people from poor and disadvantaged backgrounds. Bristol: Policy Press for the Joseph Rowntree Foundation, 2006.180. K. Luker, Dubious Conception. The politics o f teenage pregnancy. Cambridge, M A : Harvard University Press, 1996.18 1 . J. Ermisch and D. Pevalin, Who Has a Child as a Teenager? ISER Working Papers, Number 20 03-30 . Institute for Economic and Social Research, University of Essex, 2003.

182 . U N ICEF Innocenti Research Centre, A League Table o f Teenage Births in Rich Nations. Florence: Innocenti Report Card, 2001.183 . S. J. Ventura, T. J. Mathews and B. E. Hamilton, ‘Teenage births in the United States: trends, 19 9 1-2 0 0 0 , an update’, National Vital Statistics Reports (2002) 50 (9).184. Alan Guttmacher Institute, US Teenage Pregnancy Statistics Overall Trends, Trends by Race and Ethnicity and State-by-state Information. New York: A G I, Z004.185. K. E. Pickett, J. Mookherjee and R. G. Wilkinson, ‘Adolescent birth rates, total homicides, and income inequality in rich countries’, American Journal o f Public Health (2005) 95 (7): 1 1 8 1 - 3 .186. R. Gold, I. Kawachi, B. P. Kennedy, J. W. Lynch and F. A. Connell, ‘Ecological analysis of teen birth rates: association with community income and income inequality’, Maternal and Child Health Journal (2001) 5 (3): 16 1 - 7 .187. S. Ryan, K. Franzetta and J. Manlove, Hispanic Teen Pregnancy and Birth Rates: Looking behind the numbers. Washington, D C: Child Trends, 2005.188. M. Dickson, Latina Teen Pregnancy: Problems and prevention. Executive summary. Washington, D C: Population Resource Center, 2001.189. J. Bynner, P. Elias, A. McKnight, H. Pan and G. Pierre, Young People’s Changing Routes to Independence. York: Joseph Rowntree Foundation, 2002.190. H. Graham and E. McDermott, ‘Qualitative research and the evidence base of policy: insights from studies of teenage mothers in the U K ’ , Journal o f Social Policy (200J) 35: 2 1 - 3 7 .19 1 . J. Belsky, L. Steinberg and P. Draper, ‘Childhood experience, interpersonal development, and reproductive strategy: an evolutionary theory of socialization’ , Child Development (1991) 62 (4): 647-70.192. R. Gold, B. Kennedy, F. Connell and I. Kawachi, ‘Teen births, income inequality, and social capital: developing an understanding of the causal pathway’, Health and Place (2002) 8 (2): 7 7 -8 3 .193 . D. A. Coall and J. S. Chisholm, ‘Evolutionary perspectives on pregnancy: maternal age at menarche and infant birth weight’ , Social Science and Medicine (2003) 57 (10): 1 7 7 1 - 8 1 .194. T. E. Moffitt, A. Caspi, J. Belsky and P. A. Silva, ‘Childhood experience and the onset of menarche: a test of a sociobiological model’, Child Development (1992) 63 (1): 47-58 .195. ‘American Academy of Pediatrics Committee on Adolescence: Adolescent pregnancy’, Pediatrics (1989) 83 (1): 13 2 -4 .

196. B. J. Ellis, J . E. Bates, K. A. Dodge, D. M. Fergusson, L. J. Horwood, G. S. Pettit and L. Woodward, ‘Does father absence place daughters at special risk for early sexual activity and teenage pregnancy?’ Child Development (2003) 74 (3): 8 0 1- 2 1 .197. J. Borger, ‘Gunned down: the teenager who dared to walk across his neighbour’s prized lawn’, Guardian, 22 March 2006.198. J. Allen, Worry about Crime in England and Wales: Findings from the 2003/04 and 2004/05 British Crime Survey. London: Research Development and Statistics Directorate, Home Office, 2006.199. C. Hale, ‘Fear of crime: a review of the literature’, International Review o f Victimology (1996) 4: 7 9 -15 0 .2,00. H. Cronin, The Ant and the Peacock. Cambridge: Cambridge University Press, 19 9 1.20 1. J. Gilligan, Preventing Violence. New York: Thames & Hudson, 2001.202. J. Gilligan, Violence: Our deadly epidemic and its causes. New York: G. P. Putnam, 1996.203. R. Wilkinson, ‘Why is violence more common where inequality is greater?’ Annals o f the New York Academy o f Sciences (2004) 1036: 1 - 1 2 .204. M. Wilson and M. Daly, Homicide. Piscataway, N J: Aldine Transaction, 1988.205. M. Daly and M. Wilson, ‘Crime and conflict: homicide in evolutionary psychological perspective’, Crime and Justice (1997) 22: 5 1 - 10 0 .206. M. Daly and M. Wilson, ‘Risk-taking, intrasexual competition, and homicide’, Nebraska Symposium on Motivation (2001) 47: 1 - 3 6 .207. M. Daly, M. Wilson and S. Vasdev, ‘Income inequality and homicide rates in Canada and the United States’, Canadian Journal o f Public Health- Revue canadienne de criminologie (2001) 43 (2): 2 19 -36 .208. M. Wilson and M. Daly, ‘Competitiveness, risk-taking and violence: the young male syndrome’, Ethology and Sociobiology (1985) 6: 59 -73 .209. D. M. Buss, The Evolution o f Desire: Strategies o f human mating. New York: Basic Books, 1994.210. P. Fajnzylber, D. Lederman and N. Loayza, ‘Inequality and violent crime\ Journal o f Law and Economics (2002) 45: 1-4 0 .2 1 1 . C.-C. Hsieh and M. D. Pugh, ‘Poverty, income inequality, and violent crime: A meta-analysis of recent aggregate data studies’, Criminal Justice Review (1993) 18: 18 2 -2 0 2 .212. United Nations Crime and Justice Information Network, Survey on Crime Trends and the Operations o f Criminal Justice Systems (Fifth, Sixth, Seventh, Eighth). New York: United Nations, 2000.

2 13 . Federal Bureau of Investigation, Crime in the United States. Washington, D C: US Government Printing Office, 1990-2000.2 14 . M. Killias, J. van Kesteren and M. Rindlisbacher, ‘Guns, violent crime, and suicide in 2 1 countries’, Canadian Journal o f Criminology (2001) 43: 429-48.2x5. UN Commission on Crime Prevention and Criminal Justice, ‘Criminal justice reform and strengthening of legal institutions measures to regulate firearms’, in Secretary-General Report E/CN.15/1997/4. Vienna: United Nations, 1997.2 16 . M. Miller, D. Hemenway and D. Azrael, ‘State-level homicide victimization rates in the US in relation to survey measures of household firearm ownership, 2 0 0 1-2 0 0 3 ’, Social Science and Medicine (2007) 64 (3): 656-64.2 17 . ‘Behavioural Risk Factor Surveillance Survey. Survey Results 2001 for Nationwide: Firearms’ . North Carolina State Center for Health Statistics. http://www.schs.state.nc.us/SCHS/brfss/2001/us/firearm3.html (accessed 9 September 2008).2 18 . D. Popenoe, Life 'Without Father. New York: Free Press, 1996.219 . H. B. Biller, Fathers and Families: Paternal factors in child development. Westport, CT: Auburn House, 1993.220. S. R. Jaffee, T. E. Moffitt, A. Caspi and A. Taylor, ‘Life with (or without) father: the benefits of living with two biological parents depend on the father’s antisocial behavior’, Child Development (2003) 74(1): 10 9 -26 .2 2 1. M. Anderson, J. Kaufman, T. R. Simon, L. Barrios, L. Paulozzi, G. Ryan, R. Hammond, W. Modzeleski, T. Feucht and L. Potter, ‘School- associated violent deaths in the United States, 19 9 4 -19 9 9 ’ , Journal o f the American Medical Association (2001) 286 (21): 2695-702.222. M. R. Leary, R. M. Kowalski, L. Smith and S. Phillips, ‘Teasing, rejection, and violence: case studies of the school shootings’ , Aggressive Behavior (2003) 29: 2 0 2 -14 .223. C. Shaw and H. McKay, Juvenile Delinquency and Urban Areas. Chicago: University of Chicago Press, 1942.224. R. Sampson, S. Raudenbush and F. Earls, ‘Neighborhoods and violent crime: a multilevel study of collective efficacy’, Science (1997) 277: 9 18 -2 4 .225. W. J. Wilson, The Truly Disadvantaged: The inner city, the underclass, and public policy. Chicago: University of Chicago Press, 1987.226. Federal Bureau of Investigation, Crime in the United States 2006. Washington, DC: US Government Printing Office, 2006.

227. H. Boonstra, Teen Pregnancy: Trends and lessons learned. Guttmacher Report on Public Policy. Washington, D C: Alan Guttmacher Institute, 2002.228. B. E. Hamilton, J. A. Martin and S. J. Ventura, ‘Births: preliminary data for 2006’, National Vital Statistics Report (2007) 56 (7).229. R. V. Burkhauser, S. Feng and S. P. Jenkins, ‘Using the P90/P10 Index to Measure US Inequality Trends with Current Population Survey Data: A View from Inside the Census Bureau Vaults’, IZ A Discussion Paper No. 2839, available at Social Science Research Network: http://ssrn.com/abstract=998222 (accessed 9 September 2008).230. C. Cantave, M. Vanouse and R. Harrison, Trends in Poverty. Washington, DC: Center for Political and Economic Studies, 1999.2 3 1 . Child Trends DataBank, Children in Poverty. Washington, DC: Child Trends, 2003.232. A. Blumstein, F. P. Rivara and R. Rosenfeld, ‘The rise and decline of homicide - and why’, Annual Review o f Public Health (2000) 2 1: 5 0 5 -4 1.233. Annie E. Casey Foundation, KidsCount Databook. Baltimore, M D. Annie E. Casey Foundation, 1995.234. C. G. Colen, A. T. Geronimus and M. G. Phipps, ‘Getting a piece of the pie? The economic boom of the 1990s and declining teen birth rates in the United States’, Social Science and Medicine (2006) 63 (6): 15 3 1 - 4 5 .235. D. Dorling, ‘Prime suspect: murder in Britain’, in P. Hillyard,C. Pantazis, S. Tombs, D. Gordon and D. Dorling (eds), Criminal Obsessions: Why harm matters more than crime. London: Crime and Society Foundation, 2005.236. R. Walmsley. ‘An overview of world imprisonment: global prison populations, trends and solutions’, United Nations Programme Network Institutes Technical Assistance Workshop. Vienna, 2001.237. R. Walmsley, World Prison Population List (6th and 7th editions). London: International Centre for Prison Studies, King’s College, 2005 and 2006.238. A. Blumstein and A. J. Beck, ‘Population growth in US prisons, 19 8 0 -19 9 6 ’, Crime and Justice (1999) 26: 1 7 - 6 1 .239. E. Chemerinsky, ‘Life in prison for shoplifting: cruel and unusual punishment’, Human Rights (2004) 3 1 : 1 1 - 1 3 .240. M. Hough, J. Jacobson and A. Millie, The Decision to Imprison: Sentencing and the prison population. Rethinking crime and punishment. London: Prison Reform Trust, 2003.

24 1. D. Downes, ‘The buckling of the shields: Dutch penal policy 19 8 5 - 19 9 5 ’, in R. P. Weiss and N. South (eds), Comparing Prison Systems: Towards a comparative and international penology. Amsterdam: Gordon & Breach Publishers, 1998.242. M. Mauer, Comparative International Rates o f Incarceration: An examination o f causes and trends. Washington, DC: Sentencing Project, Z003.243. US Department of Justice, Bureau of Justice Statistics, ‘Incarceration rates for prisoners under State or Federal jurisdiction’, File: corpop25.wki. http://www.ojp.usdoj.gov/bjs/data/corpopz5.wk1 (accessed 30 March 2006).2.44. W. S. Wooden and A. O. Ballan, ‘Adaptation strategies and transient niches of one middle-class inmate in prison’, Psychological Reports (1996) 78 (3, Pt 1): 870.245. The Sentencing Project, State Rates o f Incarceration by Race. Washington, DC: Sentencing Project, 2004.246. R. Councell and J. Olagundoye. The Prison Population in 2.001: A statistical review. Home Office Findings 195. London: Home Office, 2003.247. Annie E. Casey Foundation, KidsCount Databook. Baltimore, MD: Annie E. Casey Foundation, 2008.248. Leadership Conference on Civil Rights and Leadership Conference on Civil Rights Education Fund, Justice on Trial: Racial disparities in the American criminal justice system. Washington, DC: LC C R /LC C R EF, 2000.249. E. H. Johnson. ‘The Japanese experience: effects of decreasing resort to imprisonment’, in R. P. Weiss and N. South (eds.), Comparing Prison Systems: Towards a comparative and international penology. Amsterdam: Gordon & Breach Publishers, 1998.250. J. O. Haley, ‘Confession, repentence and absolution’, in: M. Wright and B. Galoway (eds), Mediation and Criminal Justice. Newbury Park, CA: Sage, 1989.2 5 1. Amnesty International, Annual Report - United States o f America. London: Amnesty International, 2004.252. Human Rights Watch and Amnesty International, The Rest o f Their Lives: Life without parole for child offenders in the United States. New York: Human Rights Watch, 2005.253. Human Rights Watch, Cold Storage: Super-maximum security confinement in Indiana. New York: Human Rights Watch, 1997.254. Human Rights Watch, Red Onion State Prison: Super-maximum

security confinement in Virginia. New York: Human Rights Watch, 1999.255. United Nations Committee against Torture, Conclusions and Recommendations o f the Committee against Torture: United States o f America. Geneva: United Nations, 2006.256. J. Irwin, The Warehouse Prison: Disposal o f the new dangerous class. Cary, N C : Roxbury Publishing Company, 2005.257. Amnesty International, Ill-treatment o f Inmates in Maricopa County Jails, Arizona. London: Amnesty International, 1997.258. E. James, ‘A life again’, Guardian, 5 September 2005.259. L. A. Rhodes. ‘Can there be “ best practices” in supermax?’ in D. Jones (ed.), Humane Prisons. Oxford: Radcliffe Publishing, 2006.260. The Commission on Safety and Abuse in America’s Prisons, Confronting Confinement. New York: Vera Institute of Justice, 2006.261. P. Carter. Managing Offenders, Reducing Crime. Correctional Services Review. London: Prime Minister’s Strategy Unit, 2003.262. Home Office, Explaining Reconviction Rates: A critical analysis. Home Office Research Study 136 . London: Home Office, 1995.263. S. Henry, ‘On the Effectiveness of Prison as Punishment. Incarceration Nation: The warehousing of America’s poor’. Ivy Tech State College, South Bend, Indiana: http://www.is.wayne.edu/stuarthenry/ Effectiveness_of_Punishment.htm, 2003.264. E. Currie, Crime and Punishment in America. New York: Henry Holt & Co, 1998.265. Youth Justice Board, Anti-social Behaviour Orders (B289). London: Youth Justice Board for England and Wales, 2006.266. N C H , Tackling Anti-social Behaviour: Have we got it right? London: N C H Children’s Charities, 2006.267. K. Beckett and B. Western, ‘Governing social marginality’, inD. Garland (ed.), Mass Imprisonment: Social causes and consequences. London: Sage, 2001.268. D. Downes and K. Hansen, Welfare and Punishment: The relationship between welfare spending and imprisonment. London: Crime and Society Foundation, 2006.269. J. Silverman, ‘Does prison work?’ ESR C Society Today: Spotlights. http://www.esrc.ac.uk/ESRCInfoCentre/about/CI/CP/Our_Society_Today/ Sp0tlights-2oo6/prison.aspx?ComponentId= 1 6448&SourcePageId=i 6475 (accessed 9 September 2008).270. M. Tonry, ‘Why are US incarceration rates so high?’ Crime and Delinquency (1999) 45: 4 19 -3 7 .271. J. Blanden, P. Gregg and S. Machin, Intergenerational mobility in

Europe and North America. London: Centre for Economic Performance, London School of Economics, Z005.272. L. Mishel, J. Bernstein and S. Allegretto, The State o f Working America 1006/7. An Economic Policy Institute Book. Ithaca, N Y : ILR Press, an imprint of Cornell University Press, 2007.273. O ECD , Education at a Glance Z003. O E C D Indicators. Paris: O ECD , 2004.274. D. S. Massey, ‘The age of extremes: concentrated affluence and poverty in the twenty-first century’, Demography (1996) 33: 3 9 5 -4 12 .275. P. A. Jargowsky, ‘Take the money and run: economic segregation in U.S. metropolitan areas’, American Sociological Review (1996) 61 (6): 984-8.276. P. A. Jargowsky, Poverty and Place: Ghettos, barrios and the American city. New York: Russell Sage Foundation, 1997.277. P. A. Jargowsky, Stunning Progress, Hidden Problems: The dramatic decline o f concentrated poverty in the 1990s. The Living Cities Census Series. Washington, D C: Brookings Institution Press, 2003.278. D. Dorling, ‘Why Trevor is wrong about race ghettos’, Observer, 25 September 2005.279. D. Dorling, Human Geography o f the UK. London: Sage Publications, 2005.280. D. Dorling and P. Rees, ‘A nation still dividing: the British census and social polarization’, Environment and Planning (2003) 35: 12 8 7 - 3 13 .28 1. A. Berube, M ixed Communities in England. York: Joseph Rowntree Foundation, 2005.2 8 2 .1. Kawachi, ‘Income inequality and economic residential segregation’, Journal o f Epidemiology and Community Health (2002) 5 6 (3): 16 5 -6 .283. S. Mayer, How the Growth in Income Inequality Increased Economic Segregation. The Joint Center for Poverty Research Working Paper 235. Chicago: Northwestern University/University of Chicago, 2001.284. P. Lobmayer and R. G. Wilkinson, ‘Inequality, residential segregation by income, and mortality in US cities’ , Journal o f Epidemiology and Community Health (2002) 56 (3): 18 3 -7 .285. N. J. Waitzman and K. R. Smith, ‘Separate but lethal: the effects of economic segregation on mortality in metropolitan America’, Milbank Quarterly (1998) 76 (3): 3 4 1-7 3 .286. P. Bourdieu, Distinction: A social critique o f the judgement o f taste. London: Routledge, 1984.287. K. Fox, Watching the English: The hidden rules o f English behaviour. London: Hodder 8c Stoughton, 2004.

288. J. Epstein, Snobbery: The American version. New York: Houghton Mifflin Company, 2002.289. R. Sennett and J. Cobb, The Hidden Injuries o f Class. New York: Alfred A. Knopf, 197Z.290. S. J. Charlesworth, P. Gilfillan and R. G. Wilkinson, ‘Living inferiority’, British Medical Bulletin (Z004) 69: 49-60.29 1. A. Marcus-Newhall, W. C. Pedersen, M. Carlson and N. Miller, ‘Displaced aggression is alive and well: a meta-analytic review’, journal o f Personality and Social Psychology (zooo) 78 (4): 670-89.292,. R. A. Baron, J. H. Neumann and A. Geddes, ‘Social and personal determinants of workplace aggression: evidence for the impact of perceived injustice and the Type A behavior pattern’, Aggressive Behavior (1999) 25 (4): 28 1-9 6 .293. D. L. Horowitz, ‘Direct, displaced and cumulative ethnic aggression’, Comparative Politics (1973): 6 (1): 1 - 16 .294. H. Crawley, Evidence on Attitudes to Asylum and Immigration: What we know, don’t know and need to know. Working Paper No. Z3. Oxford: Centre on Migration, Policy and Society, University of Oxford, zoo 5.295. J. L. Ireland, Bullying among Prisoners: Evidence, research and intervention strategies. Hove: Brunner-Routledge, zooz.296. P. Earley, The Hot House: Life inside Leavenworth prison. New York: Bantam, 1992.297. J. Sidanius and F. Pratto, Social Dominance. Cambridge: Cambridge University Press, 1999.298. K. E. Pickett and R. G. Wilkinson, ‘People like us: ethnic group density effects on health’, Ethnicity and Health (zoo8) 13 (4): 3ZI-34.299. J. Boydell, J. van Os, K. McKenzie, J. Allardyce, R. Goel, R. G. McCreadie and R. M. Murray, ‘Incidence of schizophrenia in ethnic minorities in London: ecological study into interactions with environment’, British Medical Journal (zooi) 323 (7325): 1336-8.300. J. Neeleman and S. Wessely, ‘Ethnic minority suicide: a small area geographical study in south London’, Psychological Medicine (1999): 29 (2): 429-36.30 1. J. Neeleman, C. Wilson-Jones and S. Wessely, ‘Ethnic density and deliberate self-harm: a small area study in south east London’, Journal o f Epidemiology and Community Health (2001) 55: 85-90.302. J. Fang, S. Madhavan, W. Bosworth and M. H. Alderman, ‘Residential segregation and mortality in New York City’, Social Science and Medicine (1998) 47 (4): 469-76.303. L. Franzini and W. Spears, ‘Contributions of social context to

inequalities in years of life lost to heart disease in Texas, U SA ’, Social Science and Medicine (2003) 57 (10): 18 4 7 -6 1.304. C. M. Masi, L. C. Hawkley, Z . H. Piotrowski and K. E. Pickett, ‘Neighborhood economic disadvantage, violent crime, group density, and pregnancy outcomes in a diverse, urban population’, Social Science and Medicine (2007) 65 (12): 2440-57.305. K. E. Pickett, J. W. Collins, Jr., C. M. Masi and R. G. Wilkinson, ‘The effects of racial density and income incongruity on pregnancy outcomes’, Social Science and Medicine (2005) 60 (10): 2229-38.306. E. M. Roberts, ‘Neighborhood social environments and the distribution of low birthweight in Chicago’, American Journal o f Public Health (1997) 87 (4): 597-603.307. L. C. Vinikoor, J. S. Kaufman, R. F. MacLehose and B. A. Laraia, ‘Effects of racial density and income incongruity on pregnancy outcomes in less segregated communities’, Social Science and Medicine (2008) 66 (2): 255-9 .308. A. M. Jenny, K. C. Schoendorf and J. D. Parker, ‘The association between community context and mortality among Mexican-American infants’, Ethnicity and Disease (2001) n (4): 7 2 2 - 3 1 .309. J. R. Dunn, B. Burgess and N. A. Ross, ‘Income distribution, public services expenditures, and all cause mortality in US States’, Journal o f Epidemiology and Community Health (2005) 59 (9): 768-74.310. A. Deaton and D. Lubotsky, ‘Mortality, inequality and race in American cities and states’ , Social Science and Medicine (2003) 56 (6): 1 1 3 9 - 5 3 .3 1 1 . D. K. McLaughlin and C. S. Stokes, ‘Income inequality and mortality in US counties: does minority racial concentration matter?’ American Journal o f Public Health (2002) 92 (1): 9 9 -10 4 .312 . R. Ram, ‘Income inequality, poverty, and population health: evidence from recent data for the United States’, Social Science and Medicine (2005) 61 (12): 2568-76.313. S. V. Subramanian and I. Kawachi, ‘The association between state income inequality and worse health is not confounded by race’, International Journal o f Epidemiology (2003) 32 (6): 10 2 2 -8 .314. R. Ram, ‘Further examination of the cross-country association between income inequality and population health’, Social Science and Medicine (2006) 62 (3): 7 7 9 -9 1.315 . J. Banks, M. Marmot, Z . Oldfield and J. P. Smith, ‘Disease and disadvantage in the United States and in England’, Journal o f the American Medical Association (2006) 295 (17): 2037-45.
316 . J. Banks, M. Marmot, Z. Oldfield and J. P. Smith, ‘The SES Health Gradient on Both Sides of the Atlantic’ . N B ER Working Paper 12674. Cambridge, M A : National Bureau of Economic Research, 2007.3 17 . D. Vagero and O. Lundberg, ‘Health inequalities in Britain and Sweden’, Lancet (1989) 2 (8653): 35 -6 .3 18 . D. A. Leon, D. Vagero and P. O. Olausson, ‘Social class differences in infant mortality in Sweden: comparison with England and Wales’, British Medical Journal (1992) 305 (6855): 6 8 7-9 1.3 19 . S. V. Subramanian and I. Kawachi, ‘Whose health is affected by income inequality? A multilevel interaction analysis of contemporaneous and lagged effects of state income inequality on individual self-rated health in the United States’, Health and Place (2006) 12 (2): 14 1 -5 6 .320. M. Wolfson, G. Kaplan, J. Lynch, N. Ross and E. Backlund, ‘Relation between income inequality and mortality: empirical demonstration’, British Medical Journal (1999) 3 19 (7215): 9 5 3-5 .32 1. S. J. Babones, ‘Income inequality and population health: correlation and causality’, Social Science and Medicine (2008) 66 (7): 16 14 -2 6 .322. C. A. Shively and T. B. Clarkson, ‘Social status and coronary artery atherosclerosis in female monkeys’, Arteriosclerosis and Thrombosis (I 994) 14 (5>: 72 i ~ 6.323. C. A. Shively and T. B. Clarkson, ‘Regional obesity and coronary artery atherosclerosis in females: a non-human primate model’, Acta Medica Scandinavica, Supplement (1988) 723: 7 1 - 8 .324. M. Sahlins, Stone Age Economics. London: Routledge, 2003.325. T. Hobbes, Leviathan. Oxford: Oxford University Press, 1998.326. K. Jensen, J. Call and M. Tomasello, ‘Chimpanzees are rational maximisers in an ultimatum game’, Science (2007) 3 18 (5847): 10 7 -9 .327. J. Henrich, R. Boyd, S. Bowles, C. F. Camerer, E. Fehr, H. Gintis and R. McElreath, ‘Overview and synthesis’ , in J. Henrich, R. Boyd, S. Bowles, C. F. Camerer, E. Fehr and H. Gintis (eds), Foundations o f Human Sociality. Oxford: Oxford University Press, 2004.328. F. B. de Waal and F. Lanting, Bonobo: The forgotten ape. Berkeley: University of California Press, 1997.329. E. A. D. Hammock, L. J. Young, ‘Microsatellite instability generates diversity in brain and sociobehavioral traits’, Science (2005) 308 (5728): 16 30 -34 .330. J. B. Lassner, K. A. Matthews and C. M. Stoney, ‘Are cardiovascular reactors to asocial stress also reactors to social stress?’ Journal o f Personality and Social Psychology (1994) 66 (1): 69-77.3 3 1 . R. I. M. Dunbar, ‘Brains on two legs: group size and the evolution

of intelligence’, in F. B. de Waal (ed.), Tree o f Origin: What primate behavior can tell us about human social evolution. Cambridge, MA: Harvard University Press, 2001.332. C. Boehm, Hierarchy in the Forest: The evolution o f egalitarian behavior. Cambridge, M A: Harvard University Press, 1999.333. D. Erdal and A. Whiten, ‘Egalitarianism and Machiavellian intelligence in human evolution’, in P. Mellars and K. Gibson K. (eds), Modelling the Early Human Mind. Cambridge: McDonald Institute Monographs,
1996.334. R. G. Wilkinson, The Impact o f Inequality. New York: New Press,
2005.3 3 5 . J. Woodburn, ‘Egalitarian societies’, Man (1982) 17 : 4 3 1 - 5 1 .336. I. C. G. Weaver, N. Cervoni, F. A. Champagne, A. C. d’Alessio, S. Sharma, J. R. Seckl, S. Dymov, M. Szyf and M. J. Meaney, ‘Epigenetic programming by maternal behaviour’, Nature Neuroscience (2004)
7: 847-54.337. S. Morris, ‘Women laughed as they forced toddlers to take part in “ dog fight’” , Guardian, 2 1 April 2007.338. G. Rizzolatti and L. Craighero, ‘The mirror-neuron system’, Annual Review o f Neuroscience (2004) 27: 16 9 -72 .339. M. Kosfeld, M. Heinrichs, P. J. Zak, U. Fischbacher and E. Fehr, ‘Oxytocin increases trust in humans’, Nature (2005) 435: 673-6 .340. P. J. Zak, R. Kurzban and W. Matzner, ‘The neurobiology of trust’, Annals o f the New York Academy o f Sciences (2004) 1032 : 22 4 -7 .341. J. K. Rilling, G. A. Gutman, T. R. Zeh, G. Pagnoni, G. S. Berns and C. D. Kilts, ‘A neural basis for social cooperation’, Neuron (2002)
35: 395-405.342. N. I. Eisenberger and M. D. Lieberman, ‘Why rejection hurts’, Trends in Cognitive Science (2004) 8: 294-300.343. J. W. Ouwerkerk, P. A. M. van Lange and M. Gallucci, ‘Avoiding the social death penalty: ostracism and cooperation in social dilemmas’ , in K. D. Williams, J. P. Forgas and W. von Hippel (eds), The Social Outcast: Ostracism, social exclusion, rejection and bullying. New York:
Psychology Press, 2005.344. World Bank, World Development Indicators (WDI) September 2006. Economic and Social Data Service International, Manchester: Mimas.345. World Wildlife Fund, Living Planet Report 2.006. Gland, Switzerland: WWF International, 2007.346. R. M. Titmuss, Essays on the Welfare State. London: Unwin, 1958-

347. H. Daly, Steady-state Economics. Washington, D C: Island Press, 19 9 1.
348. M. Bookchin, The Ecology o f Freedom. Oakland, CA: A K Press, 2005.349. R. G. Wilkinson, Poverty and Progress. London: Methuen, 1973.350. H. C. Wallich, ‘Zero growth’, Newsweek, 24 January 1972.351. R. H. Frank, Falling Behind: H ow rising inequality harms the middle class. Berkeley, CA: University of California Press, 2007.352. S. Bowles and Y. Park, ‘Emulation, inequality, and work hours: was Thorsten Veblen right?’ Economic Journal (2005) 1 1 5 : F 39 7-F 4 12 .353- D. Neumark and A. Postlethwaite, ‘Relative income concerns and the rise in married women’s employment’, Journal o f Public Economics (1998) 70: 15 7 -8 3 .
354. Y. Park, Veblen Effects on Labor Supply. Male earnings inequality increases women’s labor force participation. New London, CT: Department of Economics, Connecticut College, 2004.355- S. J. Solnick and D. Hemenway, ‘Is more always better? A survey on positional concerns’, Journal o f Economic Behavior & Organization (1998) 37: 37 3-8 3 .
356 . T. Veblen, The Theory o f the Leisure Class. Oxford: Oxford University Press, 2007.357. Planet Ark, The Recycling Olympic Report. Sydney: Planet Ark Environmental Foundation, 2004.
358. Vision of Humanity, Global Peace Index: Methodology, results and findings. Cammeray, NSW : Vision of Humanity, 2007.359. G. B. Shaw, The Intelligent Woman’s Guide to Socialism and Capitalism. Edison, N J: Transaction Publishers, 2007.360. M. Bloom, ‘The performance effects of pay dispersion on individuals and organizations’, Academy o f Management Journal (1991) 42: 25-40 .
361. J. P. Mackenbach, ‘Socio-economic inequalities in health in Western Europe , in J. Siegrist and M. Marmot (eds), Social Inequalities in Health. Oxford: Oxford University Press, 2006.362. O ECD , Social Expenditure - Aggregated Data. Vol. 2008, OECD. Stat, 2001.
363 Tax Foundation, State and Local Tax Burdens Compared to Other US States, 1970 -20 07 . Washington, D C: Tax Foundation, 2007.364. Justice Policy Institute, Cellblocks or Classrooms? Washington, DC: Justice Policy Institute, 2002.365. L. J. Schweinhart and D. P. Weikart, ‘Success by empowerment:

the High/Scope Perry Preschool Study through age 27’ , Young Children
(1993) 49: 54~8.366. World Bank, The East Asian Miracle. Oxford: Oxford University
Press, 1993- .367. J. M. Page, ‘The East Asian miracle: an introduction’ , World
Development ( 1 9 9 4 ) 2 2 ( 4 ) : 6 15 -2 5 .368. R. M. Titmuss, ‘War and social policy’ , in R. M. Titmuss (ed.), Essays on the Welfare State (3rd edition). London: Unwin, 1976.369. L. McCall and J. Brash, What do Americans Think about Inequality?
Working Paper. New York: Demos, 2004.370. J. Weeks, Inequality Trends in Some Developed O E C D Countries. Working Paper No. 6. New York: United Nations Department of
Economic and Social Affairs, 2005.371. J. Benson, ‘A typology of Japanese enterprise unions’, British journal
o f Industrial Relations (1996) 34: 3 7 1-8 6 .372. L. Osberg and T. Smeeding, ‘ “ Fair” inequality? Attitudes to pay differentials: The United States in comparative perspective’ , American
Sociological Review (2006) 7 1 : 4 50 -73 .373. J. Finch, ‘The boardroom bonanza’, Guardian, 29 August 2007.374. International Labour Organization, ‘Income inequalities in the age of financial globalization’ , World o f Work Report 2008. Geneva: ILO, 2008.375. Institute for Policy Studies, Annual C E O Compensation Survey. Washington, D C: Institute for Policy Studies, 2007.376. United Nations Conference on Trade and Development, Are transnationals bigger than countries?’ Press release: TAD/INF/PR/47- Geneva: United Nations Conference on Trade and Development, 2002.377. T. Paine, The Rights o f Man. London: Penguin, 1984.378. G. Alperovitz, America beyond Capitalism. Hoboken, N J: Wiley,
2004. ,379. W. Hutton. ‘Let’s get rid of our silly fears of public ownership ,
Observer, 6 April 2008.380. M. J. Conyon and R. B. Freeman, Shared Modes o f Compensation and Firm Performance: UK Evidence. N B E R Working Paper W8448. Cambridge, M A: National Bureau of Economic Research, 2001.381. A. Pendleton and C. Brewster, ‘Portfolio workforce’, People
Management (2001) July: 38-40 . ^382. G. Gates, ‘Holding your own: the case for employee capitalism ,
Demos Quarterly (1996) 8: 8 -10 .383. P. M. Rooney, ‘Worker participation in employee owned firms’, Journal o f Economic Issues (1988) XXII (2): 4 5 1-8 .

384. J. L. Cotton, Employee Involvement: Methods for improving performance and work attitudes. Newbury Park, CA: Sage, 1993.385. National Center for Employee Ownership, Employee Ownership and Corporate Performance: A comprehensive review o f the evidence. Oakland, CA: National Center for Employee Ownership, 2004.386. J. Blasi, D. Kruse and A. Bernstein, In the Company o f Owners. New York: Basic Books, 2003.
387. P. A. Kardas, A. Scharf and J. Keogh, Wealth and Income Consequences o f Employee Ownership. Olympia, W A: Washington State Department of Community, Trade and Economic Development, 1998.
388. R. Oakeshott, Jobs and Fairness: The logic and experience o f employee ownership. Norwich: Michael Russell, 2000.
389. M. Quarrey and C. Rosen, ‘How well is employee ownership working?’ Harvard Business Review (1987) Sep.-Oct.: 12 6 -3 2 .39°- T. Theorell, Democracy at work and its relationship to health’, in P. Perrewe and D. E. Ganster (eds), Emotional and Physiological Processes and Intervention Strategies: Research in occupational stress and well being, Volume 3. Greenwich, CT: JA I Press, 2003.
391- R. de Vogli, J. E. Ferrie, T. Chandola, M. Kivimaki and M. G. Marmot, ‘Unfairness and health: evidence from the Whitehall II Study’, Journal o f Epidemiology and Community Health (2007) 61 (6): 5 1 3 - 18 . 392. D. Erdal, Local Heroes. London: Viking, 2008.393- D. Erdal, ‘The Psychology of Sharing: An evolutionary approach’ Unpublished PhD thesis, St Andrews, 2000.
394- S. Milgram, Obedience to Authority. New York: Harper, 1969.395- L. T. Hobhouse, Liberalism. London: Williams &c Norgate, 19 11 .396. D. Coyle, The Weightless World. Oxford: Capstone, 1997.'397- K. E. Kiernan, F. K. Mensah. ‘Poverty, maternal depression, family status and children’s cognitive and behavioural development in early childhood: A longitudinal study’. Journal o f Social Policy 2009; doi: 10.1017/S0047279409003250: 1-20.398. J. Bradshaw, N. Finch. A Comparison o f Child Benefit Packages in 22Countries. Table 2.2. London: Department for Work and Pensions, 2002.399- OECD. Society at a glance 2009: O E C D Social Indicators. OECD 2009.
400. I. Kawachi, B. P. Kennedy, K. Lochner, D. Prothrow-Stith. ‘Social capital, income inequality, and mortality’. Am J Public Health 1 9 9 7 - 87(9): 14 9 1-8 . ’
401. E. Uslaner. The moral foundations o f trust. Cambridge: Cambridge University Press, 2002.

402. F. J. Elgar, W. Craig, W. Boyce, A. Morgan, R. Vella-Zarb. ‘Income inequality and school bullying: Multilevel study of adolescents in 37
countries’ . Journal o f Adolescent Health 2009; 45(4): 351_ 9 -403. World Intellectual Property Organization. Intellectual property statistics, Publication A. Geneva: WIPO, zooi.404. Personal communication, R. De Vogli, D. Gimeno 2009.405. R. G. Wilkinson, K. E. Pickett. Equality and sustainability. London: London Sustainable Development Commission, 2009.406. J. Hills, T. Sefton, K. Stewart (eds). Towards a more equal society? Poverty, inequality and policy since 1 997. Bristol: Policy Press, 2009.407. P. Krugman. The Conscience o f a Liberal: Reclaiming America from the right. London: Penguin, 2009.408. L. Bamfield, T. Horton. Understanding attitudes to tackling economic inequality. York: Joseph Rowntree Foundation, 2009.409. M. I. Norton, D. Ariely, ‘Building a better America - one wealth quintile at a time’ , Perspectives on Psychological Science: in press.410. D. Runciman, London Review o f Books 2009, No. 29; 22 Oct. 2009.4 11 . J. H. Goldthorpe, ‘Analysing Social Inequality: A Critique of Two Recent Contributions from Economics and Epidemiology’, European Sociological Review, 2009; doi: I0.i093/esr/jcp046412. N. Oreskes, E. M. Conway, Merchants o f Doubt: How a Handful o f Scientists Obscured the Truth on Issues from Tobacco Smoke to Global Warming. New York: Bloomsbury, 2010.4 13 . The Equality Trust. The authors respond to questions about The Spirit Level’s analysis, http://www.equalitytrust.org.uk/resources/ response-to-questions 2010.4x4. M. Daly and M. Wilson, ‘Cultural inertia, economic incentives, and the persistence of “ southern violence’” , in Evolution, culture, and the human mind. Edited by M. Schaller, A. Norenzayan, S. Heine, T. Yamagishi and T. Kameda. New York: Psychology Press. (2010) Pp. 229-241.4 15 . F. J. Elgar, N. Aitken, ‘Income inequality, trust and homicide in 33 countries’, European Journal o f Public Health 2010 ; doi:io.i093/ eurpub/ckqo68.416. P. Saunders, Beware o f False Profits, Policy Exchange, London 2010.4 17. C. J. Snowdon, ‘The Spirit Level Delusion’ , Democracy Institute /
Little Dice, London 2010.418. S. Hales, P. Howden-Chapman, C. Salmond, A. Woodward, J. Mackenbach, ‘National infant mortality rates in relation to gross national product and distribution of income’, Lancet 1999; 354:2047.

419. N. A. Ross, M. C. Wolfson, J. R. Dunn, J. M. Berthelot, G. A. Kaplan, J. W. Lynch, ‘Relation between income inequality and mortality in Canada and in the United States: cross sectional assessment using census data and vital statistics’, British Medical Journal 2000; 320: 898-902.420. P. Walberg, M. McKee, V. Shkolnikov, L. Chenet, D. A. Leon, ‘Economic change, crime, and mortality crisis in Russia: regional analysis’, British Medical Journal 1998; 3 17 (7154) : 3 12 -8 .421. X. P e i, E. Rodriguez, ‘Provincial income inequality and self-reported health status in China during 19 9 1—7, Journal o f Epidemiology and Community Health 2006; 60:1065-9.422. Y. Ichida, K. Kondo, H. Hirai, T. Hanibuchi, G. Yoshikawa, C. Murata, ‘Social capital, income inequality and self-rated health in Chita peninsula, Japan: a multilevel analysis of older people in 25 communities’, Social Science & Medicine 2009; 69(4)1489-99.423. S. V. Subramanian, I. Delgado, L. Jadue, J. Vega, I. Kawachi, ‘Income inequality and health: multilevel analysis of Chilean communities’, Journal o f Epidemiology and Community Health 2oo3;57(u):844-8.424 - K- E. Pickett, R. G. Wilkinson, ‘Child wellbeing and income inequality in rich societies: ecological cross sectional study’, British Medical Journal 2007; 335 (7629):io8o.425. K. E. Pickett, O. W. James, R. G. Wilkinson. Income inequality and the prevalence of mental illness: a preliminary international analysis. J Epidemiol Community Health 2006; 60(7): 646-7.426. J. Blanden, How much can we learn from international comparisons of intergenerational mobility’, London: Centre for the Economics of Education, London School of Economics, 2009.427. S. J. Babones, ‘Income inequality and population health: Correlation and causality’, Social Science & Medicine 2008; 66(7): 16 14 -26 .428. D. Collison, C. Dey, G. Hannah, L. Stevenson, ‘Income inequality and child mortality in wealthy nations’, Journal o f Public Health 2007; 29(2): X14-7.429. F. J. Elgar, ‘Income Inequality, trust, and population health in 33 countries’, American Journal o f Public Health, doi: 10 .2 105/ AJPH .2009.189134.
430. V. Hildebrand, P. Van Kerm, ‘Income inequality and self-rated health status: evidence from the European Community Household Panel’, Demography 2009; 46(4): 805-25.431. A. J. Idrovo, M. Ruiz-Rodriguez, A. P. Manzano-Patino, ‘Beyond the income inequality hypothesis and human health: a worldwide exploration’, Revista Salude Publica 2010 ; 44(4): 695-702.

432. M. H. Jen, K. Jones, R. Johnston, ‘Compositional and contextual approaches to the study of health behaviour and outcomes: using multilevel modelling to evaluate Wilkinson’s income inequality hypothesis’, Health & Place 2009; i5 ( i) :i9 8 -z o 3 .433. M. H. Jen, K. Jones, R. Johnston, ‘Global variations in health: evaluating Wilkinson’s income inequality hypothesis using the World Values Survey’, Social Science & Medicine 2009; 68(4): 643-53.434. M. Karlsson, T. Nilsson, C. H. Lyttkens, G. Leeson, ‘Income inequality and health: importance of a cross-country perspective’, Social Science & Medicine 2010 ; 70(6): 875-85.435- D. Kim, I. Kawachi, S. V. Hoorn, M. Ezzati, ‘Is inequality at the heart of it? Cross-country associations of income inequality with cardiovascular diseases and risk factors’, Social Science & Medicine 2008; 66(8): 17 19 -3 2 .436. A. Barford, D. Dorling, K. E. Pickett, ‘Re-evaluating self-evaluation: A commentary on Jen, Jones, and Johnston (68: 4, 2009). Social Science & Medicine 2010 ; 70(4): 496-7.437. D. Dorling, A. Barford, ‘The inequality hypothesis: thesis, antithesis, and a synthesis?’ Health & Place 2009; 15(4): 116 6 -9 .438- N. Kondo, G. Sembajwe, I. Kawachi, R. M. van Dam, S. V. Subramanian, Z . Yamagata, ‘Income inequality, mortality, and self rated health: meta-analysis of multilevel studies’, British Medical Journal 2009;
339;b447I -439. A. Clarkwest, ‘Neo-materialist theory and the temporal relationship between income inequality and longevity change’, Social Science & Medicine 2008; 66 (9): 18 7 1-8 1 .440. J. Holt-Lunstad, T. B. Smith, J. B. Layton, ‘Social relationships and mortality risk: a meta-analytic review’. PLoS Medicine 2010; 7(7):eiooo3i6.441. D. Dorling, ‘Is more equal more green?’ Lecture to the Royal Geographical Society; 2010 ; London, http://sasi.group.shef.ac.uk/ presentations/rgs/.442. R. G. Wilkinson, K. E. Pickett, R. De Vogli, ‘A convenient truth’, British Medical Journal in press.443. J. T. Roberts, B. C. Parks, Climate o f Injustice: Global Inequality, North-South Politics and Climate Policy. Boston: The MIT Press, 2006.444. J-S. You, S. Khagram, ‘Comparative study of inequality and corruption’ , American Sociological Review 2005; 70: 136 -57 .445. I. Kawachi, B. P. Kennedy, ‘Socioeconomic determinants of health : Health and social cohesion: why care about income inequality?’ British Medical Journal 1997; 3 14 : 1037 .

446. B. Geysa, ‘Explaining voter turnout: A review of aggregate-level research’ Electoral Studies, 2006; 25(4): 637-663.447. M. Iacoviello, ‘Household debt and income inequality 1963 to 2003’, Journal o f Money, Credit and Banking 2008; 40:929-65.448. OECD StatExtracts 2008, 2009 http://stats.oecd.org/Index.aspx? DataSetCode=SNA http://www.oecdwash.org/PUBS/ELECTRONIC/ SAMPLES/natac_vol3_guide.pdf449. D. Sington, The Flaw: Dartmouth Films, 2010.450. B. Milanovic, ‘Income inequality and speculative investment by the rich and poor in America led to the financial meltdown’, Two Views on the Cause of the Global Crisis - Part I. YaleGlobal Online, 4 May 2009.451. D. Moss, ‘An Ounce of Prevention: Financial Regulation, Moral Hazard, and the End of “ Too Big to Fail” ’, Harvard Magazine, 2009; September-October 2009.452. P. Krugman, ‘Inequality and crises: coincidence or causation?’ http:// www.princeton.edu/~pkrugman/inequality_crises.pdf453- D. Cameron, the Guardian Hugo Young Lecture, 10 November 2009.454. E. Miliband, Victory speech, Labour Party Conference, Manchester 25 September 2010.455. E. Miliband, BBC Radio 4, Today, 12 July 2010.456. The Equality Trust, http://www.equalitytrust.org.uk/pledge/ signatories

Index
abdominal fat see obesity, central abortion 123-4, Z4Z> I 43 Adams, Michael 58 addictions 67
see also alcohol abuse; drug abuse
Adler, Alfred 40 adolescents:
and body image 43 and crime 35,129 , 13 1-2 , 137-8,
150, 154 depression and behavioural
problems 35, 43 education and inequality 105-8,
126fast and slow lanes to adulthood
125, 128 killings of and by 129, 137 levels of distress 43, 63 mental health 63, 68 obesity 98-9, 10 1 parenthood see teenage births and self-esteem 36, 43 sexual activity 119 , 12 1 , 12.6-7,
137, 142; see also teenage births
unemployment 143 see also teenagers
adrenaline 115
advertising 40, 228causing dissatisfaction 40, 70,
230and inequality 40, 70, 228 and luxury goods 70, 227 and social comparisons 40, 230
affiliative strategies 207, 210, 232 affluence:
‘affluenza’ virus 69 diseases of 10original ‘affluent society’ 270
African-Americans:arrest and detention rates 150 in Chicago heatwave 57 and crime 57, 150 de Tocqueville on 5 1-2 imprisonment rates 150 and income inequality 185 interstate comparisons 185-6 life expectancy 80, 84, 185 maternal age 120 poverty concentration 162 proportion in populations 185-6 and student ability tests 1 13 , 194,
215teenage births and pregnancy
120, 124, 142, 143 and thinness 99 trust, levels of 57

aggression:in children 2 1 1 - 12 displaced 159, 166-8 downward flow of 166 and health 76 and inequality 140 and social capital 140
agriculture 224, 231 co-operatives 253 developing countries 30 and global warming 231 and inequality 208
innovations 267 aid see foreign aid AIDS 81, 99 Alabama 149, 174 Alan Guttmacher Institute 123 Alaska:
homicide rate and inequality 137 taxation 246
alcohol abuse and addiction 3, 19, 35, 65, 75
Alperovitz, Gar 252 altruism:
‘altruistic punishment’ 203 enforcing 237 see also others
animals 95, 194, 202adapting to environment 210 and co-operation 201 epigenetic processes 2 1 1 ranking systems and social
organization 199-200, 204-5 anti-depressant drugs 65 anti-social behaviour 5, 13 1 , 138,
140Anti-Social Behaviour Orders
(ASBOs) 154 anxiety 33-7, 41, 168-9
and inequality 67-8
and narcissism 37, 39 rise in 33-7, 39, 43, 67-8, 259
aristocracy 45, 251 Arizona 152 Arpaio, Joe 152 ASBOSs 154Attention Deficit Hyperactivity
Disorder 63 Austen, Jane 29 Australia:
fear of crime 13 1 imprisonment rates 148
income differences 244 mental illness 67, 183 parental leave 112
Austria 145 autonomy see control
Bangladesh 80 Bangladeshis in UK 124 bankruptcy 227 behaviour changes 102 Belgium, literacy and equality
108-9, x8o belonging, sense of 97 Belsky, Jan 126 benefits 193, 245-6, 271
see also welfare Benn, Melissa, and Fiona Millar
105Bermondsey 1 15 - 16 bicycling reaction 166-8, 207 biofuels 231 birth 214
see also infants birthweight:
and group density effect 168 and inequality 81 and stress in pregnancy 100
Bismarck 242

black Americans see African- Americans
Blanco, Kathleen 50
Blanden, Jo 159 blood pressure 75
see also hypertension Blumstein, Alfred, and Allen Beck
147B M I see Body Mass Index
body image 99-100 Body Mass Index 89, 91 bonding 214 bonobos 2.03-4 Bookchin, Murray 224
Boston 165, 166 Botton, Alain de 69 Bourdieu, Pierre 163, 164 Bowles, Sam, and Y . Park 228,
229-30
brain: and group size 205-8 and social interaction 205-8,
2 13 -16 and stress 86-7, 87
Brandt Report 217 breast cancer 27, 84 breastfeeding 262 British Crime Surveys 129-31 British M edical Journal 81 ‘broken heart’ 215 ‘broken society’ 5 building societies 251, 253 bullying 90, 139 Buss, David 134 buying and selling 203
California 147, 152 calorie intake 95 Canada:
education 109
equality levels 58, 183 homicide rates 135 imprisonment rates 147 income differences 244 levels of trust and vehicle choice
58mental illness 67, 183 social mobility 159
cancer 10, 73
breast 27, 84causes and types of 75, 84 and class 84 death rates 79, 84 and education 177
prostate 84 cap and share 224 capital punishment see death
penalty capitalism:
alternatives to 252-4 early 251-2and economic growth 224
carbon emissions 217equality and 221-2 , 224, 231 rationing 221-2 reducing n , 22 1-2 , 232 see also global warming
cardiovascular disease 10, 194 and social integration 76 and thrifty phenotype 100 see also heart disease
Caribbean communities (UK) 124 Carl Zeiss 258 cars:
changing values 58, 226 and class and segregation 57-8,
164-5 fuel-efficient 223-4 ownership 25 as status markers 40, 57-8

cars: - cont.SUVs 57-8
Carver, George Washington 97 caste:
and performance 1 13 - 14 , 194 and social mobility 157
causality, inequality and: biological plausibility 179-82 confounding 175-7 , 190—91 education 108-10, 1 1 0 - 1 1 , 1 13 - 15 health and social problems
165-8, 183-7, 194 imprisonment 14 5-8 ,150 -53 mental illness 69-70, 7 1-2 obesity 95-8, 100 predictive power 195 reverse causality 54-6, 6 1-2 ,
184-8, 19 1-3
social evaluative threat 37-41 social mobility 159-69 stress and health 84, 85-7 teenage births 133-4 trust 54-6, 6 1-2
violence 127-8 celebrities 18 1
see also rich people charities 253
and inequality 60 Charlesworth, Simon 165
Chicago: heatwave (1995) 57 homicide and other death rates
77- 8, 13 1 neighbourhoods and ethnic
groups 140 Chicago School sociologists 140 child development see children Child Wellbeing, U N IC E F
index/report 23-4, 92, 192 on children’s aspirations 1 15 - 16
incomes 23-4inequality 23-4, 25, 1 15 - 16 , 139,
192, 212 obesity 92violence and conflict 139
childbirth 214 children:
abuse (physical and emotional) h i , 138
anxiety levels 33-4, 63 ‘damaged’ 2 1 1development (emotional, social
and cognitive) 7 7 ,1 10 - 12 early years learning and
development 5, 1 10 - 1 1 , 2 10 - 1 1 , 247
and fairness 208 and family breakdown 63, 96,
h i growth 77imprisonment of 152 infectious diseases 10 mental health 63, 68
neglect 1 1 1 , 138 obesity 89-90, 92-3, 96, 10 1,
212pride and shame in 41 relative poverty 23 social relations 2 1 1 stress see stress, in early life and violence and conflict i n ,
*37> 139-4°, 2 1 1 - 1 2 see also educational
performance; infant mortality; parenting
Chile 251chimpanzees 202, 203-5 China:
Communist government 241 2008 earthquake 50

inequality 142, 179 modesty 45
civic engagement 55, 126, 249 see also community life
civil servants, health of 75-6, 84, 194, 256
class:based on material inequality
26-9‘classless society’ aim 242 cultural differences 28, 163-6,
185and death rates 84, 178, 182 decline of deference 267-8 and education 1 13 - 17 ,12 5 and employee buy-outs 258 and employment 165-6, 258 and health 10, 84, 177—8, 215 hostility 129, 165-6 identity 28and imprisonment 14 9 -5 0 ,154m and life expectancy 81-4 markers 28, 163-6, 185 and obesity see obesity and parenting m prejudices 45, 52, 163-6, 185 and social status 40 see also social mobility
climate change see carbonemissions; global warming
clothes 27, 14 1, 218 co-operation:
and the brain 2 14 -15
experiments in 202-3, 2'I 4- I 5 and global warming 231-3 human potential for 201 maintaining 215 and self-realization 209-10 without contact 214 see also trust
Co-operative Bank and stores (UK) 253
co-operatives 252-3, 258, 260 cocaine 70, 72, 96,194
cognitive behavioural therapy 238 cold virus 76
see also immune system Colen, Cynthia 143 Colorado 92-3 communism 190, 244
see also state ownership communities:
decline and break-up of 5, 42 with high trust levels 57 replaced by mass society 42
Community Development Corporations 253
community life:and consumerism 229-30 and inequality 45, 70, 195, 199,
230involvement in 45, 56-7, 78-9,
103, 199, 215, 230; see also social capital; voluntary activities
and mental health 70 companies see corporations comparisons, invidious 70, 230 competition:
international 193 for resources 200-201, 204-5 for status see status
Confederate states 188 confidence see self-esteem conflict:
avoiding 201-2, 204-5 children and see children and health see stress and resources 202, 204 see also status, competition

Connecticut 137 consumption and consumerism:
competitive 2 17 -19 , 228, 230, 270 ‘conspicuous’ 43, 230 and financial crash 270 and inequality 217, 224 and new technology 264 restraining 269-70 and social needs 230 and social stratification 230 spending addiction 3, 43, 226,
230taxation and 271
see also goods contraception 142 contraction and convergence 224 control, sense of:
and behaviour changes 102
and health 75-6, 256 conviction rates 154 copying, digital 265 corporal punishment 268 corporations 233, 249-52
democracy and 256-8 and the environment 262 ethical issues 254, 261-2 and new technologies 264-7 size of 251see also executive incomes
corruption 252, 262 cortisol 38-9, 9 5 ,1 15 counter-dominance strategies
208Coyle, Diane 264 credit cards see indebtedness credit unions 251, 253 crime:
deterrence and reduction 155-6, 238
drug-related 147
education and 112 environmental differences 132 ethnic minorities and 150 and fatherlessness 137 fear of 54, 57-8, 129-30, 156 fluctuations in 85, 132, 147, 190 high-school massacres 139
and inequality 4 5 ,134 -7 , 140-41,
142, 143-4, i 47, i 5°> 155,194, 199
organized 15 1property 5 4 ,12 9 ,13 5 ,13 7 ,14 7 ,
150repeat offending and recidivism
15 4 - 5and social cohesion 85 and trust 57 in world wars 85 youth see adolescents
Cronin, Helena 13 1 Cuba 220cultural markers 163-6, 185 Currie, Elliott 155
DaimlerChrysler 251 Daly, Herman 224 de Tocqueville, Alexis:
on equality 49, 50-52, 56, 209 on slavery 5 1-2 , 209
de Waal, Frans, and Frans Lanting 204-5
death penalty: abolition 268and inequality 149, 150, 153
death rates:economic segration and 163 and inequality 27, 60, 178-80,
182, 195international comparisons 176,
178-9

and low status 75-6, 84, 178 related to income and
disadvantage i2 - r3 , 163, 178-80
and social needs 5 women’s 60 see also suicide
debt:bankruptcy 228 and consumption 270 credit-card 270 financial 228
Declaration of Independence 263
delinquency, juvenile see adolescents
democracy: and capitalism 251-2 development of 267-8 institutions 197 and large corporations 251 workplace 256-8
denationalization 250 Denmark 251
advertising 228 foreign aid 60 prison population 145 see also Scandinavian countries
depression 35, 71 causes of 65, 75children and adolescents 35, 43,
63and inequality and low status 35,
65, 75, 81 research 35, 68see also anxiety; mental illness
deprivation/disadvantage: and high-quality education
112problems related to 176, 239
and teenage motherhood 12 1-5 , 128
see also neighbourhoods developed countries 30, 35
see also rich countries developing/less developed countries
30equal countries and 61, 235-7 heart disease 189 inequality in 30, 189 and new technologies 267 obesity 99,189 social class 99 UK and 61 violence 189see also foreign aid; poorer
countries development aid see foreign aid diabetes 100
and education 177 stress and 86, 100, 212
Dickerson, Sally, and Margaret Kemeny 38-9, 4X
diet:and inequality 10 1-2 modern 75, 90-91, 96-8 and obesity see food and social problems 25 and status 97-8 ,163 and stress 95-6 in world wars 84-5 see also food
digital products 264-5 digitization 225 disadvantage see deprivation;
neighbourhoods disasters, reactions to:
Chicago 57 China 51early Americans 51
disasters, reactions to: - cont.Hurricane Katrina 50-51, 54
discrimination: class see snobbery damage to wellbeing 168 in employment 43 and ethnicity 185 opposition to '268
taste 165see also racism; social exclusion
distinction, social 227 division of labour 201, 210 divorce:
children and 96, i n and inequality i n , 137 and obesity 99
domestic conflict i n see also family
dominance:among animals 200, 202-5 hierarchies see hierarchies and inequality 168 strategies 207
Donne, John 173, 18 1 dopamine 7 1-2 , 1 15 , 194 Dorling, Danny 143 Dostoevsky, Fyodor 145 Douglas, Frederick 129 Downes, David 147, 15 1 Downes, David, and Kirstine
Hansen 155-6 drop-outs (school) 10 7 -8 ,13 8 ,14 3 drug abuse and addiction 3, 19, 65,
70-72, 96, 99 adolescents 35 celebrities 18 1dealing and trafficking 140, 15 1 death from overdose 70 drug-related crimes 147, 150 governments and 193, 238, 239
and inequality 70-71, 246 rehabilitation programmes 150,
238stimulation of the brain 96 and violence 142
drugs (medical) 262, 266, 267 drugs (recreational) see drug abuse
and addictions Dunbar, Robin 205 Durkheim, Emile 76
Earley, Pete 167 early human evolution and
societies 26, 201-2 , 204-5,
206-7, 2°6 -7 , 2 I5> z7°East Asia 241Eastern European countries:
inequality in 190 life expectancy 190 state ownership 252, 263
eating disorders 63, 95-6 see also food
ecological footprints 220, 221 economic development:
and happiness 6-10 and inequality 189, 237 and innovation 225 and life expectancy 6-7
economic downturn see financial crisis
economic experiments 202-3 economic growth:
benefits and costs of 8-10, 2 17 -18 , 228—30, 269-70
as determinant 189 end of benefits of 5-14 , 254, 272 environmental issues 8, 231 and inequality 228 limits on 1 1in poorer countries 217

and quality of life 1 1 - 14 , 23 1-3 and trust 55
economic institutions see financial institutions
economists, and inequality 193 ecosystems, destruction of 262 education:
benefits of 103, 177 early childhood programmes
112 , 247 equality see educational
opportunity and health 103, 177 higher 59-60, 16 1 importance of 103, 115 and new technologies 262-6 public spending on 159, 16 1, 247 school drop-out rates 107-8, 138,
143and social mobility 159, 16 1 and status 16 1 women and 59-60
educational opportunity:access to higher education 59,
16 1equality of 105-8, 1 12 international comparisons 105-7,
179and social problems 25
educational performance 19, 10 3-17 and family background 103-4,
138and imprisonment 149 and inequality 19, 30, 108-10,
143, 16 1, 212, standards of 108-10
egalitarian policies and societies
197alternatives to capitalism 251-3 early 201, 207-8, 270
evolution and 206-10, 237, 239 and global warming 231 wartime Britain 222 see also equal/more equal
societies Eisenberger, Naomi 214 elderly people 143
in Chicago heatwave 57 fear of strangers 13 1
electronic communications 225, 265 elitism 164 Elliott, Jane 114 Ellis, Bruce 127 embarrassment 41, 133
see also shame and humiliation Emerson, Ralph Waldo 31, 43-4 empathy:
in childhood 2 1 1 , 213and equality 168and inequality 51, 56and mirror neurons 213strategies for 210with those not ‘like us’ 51, 56,
209employee-ownership schemes
255-63and employee buy-outs 257-8,
261ethical standards in 261-3 and local communities 261 regulating sale of shares 261 types of 260-61
employment see unemployment;work
emulation 228-30 England 177-80
see also United Kingdom English-speaking countries:
inequality 183 mental health 183

environmental issues see carbon emissions; global warming
epidemiological transition 73 epidemiology xiii epigenetic processes 2 1 1 Epstein, Joseph 164-5 equal/more equal societies 26,
173-7 achievement in 237-6 benefits for all inhabitants 84,
176, 179-80 and the environment 232, 235
inclusiveness and empathy in 168 international policies 235 poor people in 176 see also hunter gatherers
equality:attainability 197, 2 13 , 267-8 benefits from improving 29-30,
33, 62, 10 2 ,17 5 -8 2 ,19 2 of conditions 50-51, 209 and counter-dominance
strategies 208 early societies and 200 and economic growth 226 and government changes
2-5 4 -5
groups committed to xv, 242, 269and human differences 237as ideal 45 ,197of incomes 18, 55and liberty 263and merit 237of opportunity see equality of
opportunity responses to 236-7 routes to 184, 197, 2 13 , 236-7 and sustainability 2 17 -3 1 unstoppable trend 267-8
equality of opportunity 263, 267-8
ideology of/distant prospect 157, 164, 169
and social mobility 157 ,16 9 Equality Trust xv, xxi, 269 Erdal, David 258, 260 ethnic differences 1 13 , 150 ethnic minorities 143
discrimination and social exclusion 185-6
exclusion from education and employment 185
and group density effect 168-9
income differences 185-7 and inequality 185-6 and mental illness 68-9, 168
ethnicity:and health 186 and inequality 179 ,18 5 -7 and status 185-7 and teenage births 124
Euripides 3European and World Values
Survey 53
Evans, Gillian 1 15 - 17 evidence-based medicine/politics xiii evolution see early human
evolution exchange, forms of 202-3 executive incomes 249-51, 254,
259-60, 269-70 exercise/physical activity, lack of
7 5
and low status 75 and obesity 90, 95, 102
experiments 1 13 - 14 , 194 economic 202-3, 2.09 in obedience 262 on students 1 13 - 15 , 194, 215 in trust 214
Ezzati, Professor M ajid 93m

face, loss of see shame and humiliation
fair trade 254, 261 fairness:
basic human principle 242, 270 evolution of 208-9
family:breakdown 63, 96, i n , 137 and education see educational
performance ‘extended’ or ‘nuclear’ systems
209and inequality 1 10 - 12 , 126, 138,
212support measures 112 , 247 values 238and violence i n , 137
fathersabsent 126-7, I 37- 8 biological compared with step
parents 138 important roles of 137-8 negative roles 138 and social mobility 159 teenage 127-8
fearof crime see crime reducing 237 see also mistrust
feudalism 45and social mobility 157
fight-or-flight response 85 financial crisis (2008) 5 ,16 2 , 228,
270financial institutions 5, 249
non-profit 250, 252-3 privatization 251, 253
Finland: child wellbeing 212 equality 180, 268
gun ownership 136 homicide rate 136 literacy 108-10, 180 penal policies 145, 156 stress and eating 95 teenage births 125 see also Scandinavian countries
food:and biofuel crops 231 cheap, energy-dense 91, 97 as comfort 89, 95, 95-6 insecurity 30 malnutrition 189 modern habits 3, 75, 90-91, 96-8 and obesity 90-91, 100-102 rising prices 231 sharing and eating together 96,
200, 202-3, 2°8j 209 social benefits and drawbacks
97and status 199 see also agriculture; diet
foraging societies 208 see also hunter gatherers
foreign aid 61, 232and inequality 60-61, 232, 235
Fortune 500 companies 250 Fox, Kate 164 France 145franchise, extension of 268 Frank, Robert 70, 226, 227 Frank, Robert, and Adam Levine
i nfraternity 45, 52, 209, 263 ‘free’ sector 265 freedom 252, 263
of speech 197 French Revolution 45, 209, 263 friendly societies 251, 253 friendship 3, 65, 197-202, 207-10

friendship: - cont. and death rates 76 and health 39, 45, 65, 76,169,
202, 2.15 preference for near equals 51,
199and social status 199-202 strategies for 206, 207-10 and work 259see also trust; social relations
Gallup polls 249 gated communities 48, 58 gender differences see sex/gender
differences General Social Survey:
on death rates 78-9 on trust levels 53-4
geographical mobility 42, 259 geographical segregation 159,
162-3 Germany:
body-mass index changes 10 1 imprisonment rates 147 inequalities after reunification
101mental illness 67 prison population 145 social insurance 242 social mobility 159 unification 242
gifts:and equality and peace-keeping
201-2, 208-9 and friendship 197, 200, 209
Gilligan, James 13 3 ,14 8 , 154 Gini coefficient of inequality 17 -18 ,
56Global Peace Index 232, 235 global warming 217-32 , 271
attitudes to 230-31 concern about 223 defiance of regulations 230-31 and economic growth n , 2 17 -3 1 equality movement and 269, 271 and inequality 270 see also carbon emissions
Gold, Rachel 123-4,Good Childhood Inquiry 63 goods:
changing evaluation of 227, 230 economy of cultural 164 luxury 70, 227perceived as second-rate 30, 227 striving for 70, 227 valued for status and prestige
30, 70, 218, 227, 230-31 visibility of 230 see also consumption and
consumerism Gore-tex 258 governments:
and corporations 262 and early childhood programmes
1 12and employee ownership 261,
270as employers 263 and global warming 226, 230-31 and new technologies 265-6 and poverty 268
gradients: class 27health 12 - 13 , 27social 12 - 13 , 24- 55 z7t 68, 76, 91,
98, 99, 108, 149, 175-82, 195 graffiti and litter 140 Graham, Hilary, and Elizabeth
McDermott 125, 128 Graham, Sheila 89

graphs:cross-sectional 190 interpreting x ix -xx i
‘Great Crash’ (1929) 243 Greece:
health care and incomes 79 infant mortality 80 life expectancy 6-7, 79-80 literacy n o teenage births 124
greed and avarice 199 group conflict 168 group density effects 159-60, 168-9 group membership 79 group size 205-8 growth see height and growth Guatemala 251 gun ownership 136-7, 142
Hansson, Albin 242 happiness levels:
changes over time 8 cultural differences 8 economic growth and 6-10 and health 76 and incomes see income
inequality see also wellbeing
Harlem 80, 9 7,175 Hawaii 150HDI see United Nations Human
Development Index health:
and class see class determinants of 73-7 and education 103, 177 and income see income
inequality inequalities xiii, 28-9, 73-87,
177-80, 238-9
and social relationships 76-7, 195, 202
and stress see stress and trust see trust
Health Behaviour in School-age Children survey 92
health care 26, 79-81 doctors’ incomes 79-80 free 268and health and social problems
238high tech 79-81 inequalities in 79-81, 81-4
health and social problems index 19-22, 185-6, 192, 267-8
and average incomes 191 and inequality i j y , 195 for nations 19 -2 1 and public social expenditure
184, 19 1 US states 19, 2 1-2
Health Survey for England 98 heart disease:
and class or status 10, 73-6, 85,
177and death rates 79, 84 and education 177 and group density effect 168 and stress 75, 86, 212 see also cardiovascular disease
height and growth failure and inequality 81 and stress 86
hierarchies:among animals see primates at work 249-50, 259 and confidence 40 dominance 203-10 employers and 249, 259 evolution and 206-7

hierarchies: - cont. importance of 27 lack of data 27 low position in 69, 70, 75-6 in prison 167 and social mobility 163 and social systems 203
Hispanic people 177 and community life 57 and food 97-8 and judicial processes 150 teenage births and poverty 124 trust, levels of 57
Hobbes, Thomas 201, 204 Hobhouse, L. T. 263 Hoff, Karla, and Priyanka Pandey
113homeless people 97 homeostasis 85homicide rates 19, 77-8, 13 1-2
age and sex 13 1-2 and class 84 fluctuations 13 1 , 142 and inequality 135-7 , 142, 192 international comparisons 13 1-2 ,
135-7 suicide and 175 use of guns 137
Hong Kong 241 hormones see stress housing problems 25, i n Hsieh, C .-C ., and M . D. Pugh 135 human brother/sisterhood see
fraternity human nature and inequality 199 human resource professionals 98-9 Human Rights Watch 152 humiliation see shame and
humiliation hunter gatherers 26, 201-2, 207-10
see also early human evolution Hurricane Katrina 49-50, 54, 57 Hutton, Will 253 hypertension 75, 86, 177
Iceland 267 identity:
class 28and in-groups 209 social 42
illegal drugs see drug abuse and addiction
immigrants 140, 167, 248
immune system 85-6 imprisonment 19, 145-56
as deterrent 153-6 factors affecting 145-8, 155, 192,
246international comparisons
145-50, i 54- 5> 176 limited effectiveness of 154-5,
247purposes of 15 3 -4 ^ rates of see prison populations re-offending rates 154-5 social gradient 149
inclusiveness, and equality 168 income:
aspirations for 13 , 229 and education 103 growth in 5-10and health and social problems
2 1-2 , 19 1-2 and obesity 100 see also executive incomes;
income differences; pay; wealth
income differences and inequality 179, 184, 192-3, 249-52, 259, 271

and basis of social hierarchy z 6-9
changes in 142, 160, 169, 184, 234-6, 239, 249, 250-51
and children’s aspirations 1 16 - 17 de Tocqueville on 5 1-2 employers and 242 governments and 5, 183-4,
192-3, 241 and health and happiness 8,
1 1 - 14 . I 5, 20-22, 27-30, 87, r68, 177, 183-6, 182, 212, 227, 229-30
measures of 15 -18 and psychosocial wellbeing 5,
238routes to narrower difference
183-4, 241—2 and trust 45, 51-62 varying patterns 142-3 in wartime 85, 233 within societies vs. between
societies n - 14 , 229, 235 see also inequality
income mobility see social mobility indebtedness, sense of 209
see also gifts India:
caste and performance 19 1, 194, 215
and emissions 224 individualism:
and consumerism 230 and SUVs 58
Indonesia 241 inequality:
changes in 35, 69, 142-4, 162, 228, 239-41
and class 26-7 economic growth and 226
and the environment 232-3, 325 ethnic divisions and 185-6 and happiness 227 historical explanations for 188-9 in human history 207-8 and international policies 235-6 and police numbers 155 and recycling 232-3 and women’s status 58-60 and working hours 228 see also income differences
infant mortality 19, 81-4, 178-9 and carbon emissions 219 and class 178-9and inequality 81, 178, 212, 219 international comparisons 80,
81-4, 178-9, 220 infants:
birth and breeding vs. wealth 29 and stress 77, 2 10 - n see also birthweight; children;
infant mortality infectious diseases:
as cause of death 10, 73 poverty and social status and 10,
73, 85 inferiority:
feelings of 40, 43, 1 13 - 15 , 165-6, 2 15-16 ; see also shame
feudal shackles as 45 and possessions 227
inflation: and inequality 55 and nationalized industries 253
insecurity:and consumption 230 personal and social 37 reducing 237-6, 270
Institute for Women’s Policy Research 58

I N D E X
interdependence 209-10 International Adult Literacy Survey
107, 108 international comparisons xix
data for 190, 267 internal and international
inequalities 235 see also under topics
International Labour Organization 250
International Obesity Task Force
91international relations 227-8 internet 265interpersonal tensions 205 Iowa 137 Ireland:
prison population 145 teenage births 124
Irwin, John 152 Israel 267, 268 Italy:
co-operatives 260 mental illness 67 teenage births 124 women’s status 59-60
James, Oliver 69 Japan:
births outside marriage 183 crime rate 190equality 15 - 17 , 44, 59~6o, 87,
174, 183, 184, 197, 241-2,245-6, 268
executives’ pay 250 and foreign aid 61 happiness levels 8 homicide rates 136 imprisonment and judicial
system 145, 148, 15 1-2
improvements in economy and health 87, 190
infant mortality 80 life expectancy 176, 190 mental illness 67 modesty and blame 4 4-5,175 obesity 91postwar reconstruction 62, 87,
242public social expenditure 183 redistribution of wealth and
power 87, 183-4, 24I , 245 teenage births and marriages
123-5women’s status 59-60, 183
Jargow sky, Paul 162 job status:
and confidence 40 and self-worth 43
John Lewis Partnership 258 Johnson, Lyndon B. 19 judicial systems:
international comparisons 15 1-3 and minorities 150
Kawachi, Ichiro 78 Kennedy, John F. 103, 181 Kennedy, Robert 181 Kerry, Bill 236 King, Martin Luther 270 Kipling, Rudyard 157 Kissinger, Henry 207 Klinenberg, Eric 57 ‘knowledge’ economy 264 Krugman, Paul 242-3
land-ownership 30, 251 language 206
and social class ^ 3 - 5 , 185 Lareau, Annette n 1

I N D E X
Lauer, Josh 57-8 law:
equality before 237, 263, 267 respect for 5 6 source of inequality 52
Layard, Richard 8, 70, 227 learning by imitation 213 learning disabled people 152 Lennon, John 18 1 Lewis, Helen 41 liberty 45, 5 1, 263 life expectancy xiii, 6-7, n - 1 3 , 19,
73-87, 220 and childhood obesity 89 and economic development 6-7 and health care 80-81 and homicide rates 78-9 and income differences 190 and inequality 79-85, 176 international comparisons 79-84,
220medical and social factors in 26,
73- 7, 79- 8i premature death and inequality
73in richest countries n - 1 3 in world wars 84-5, 87
lifestyle 73, 75-6, 84 Lister, Joseph xv literacy:
adolescents 109-10, 180 adults 107, 108-10
living standards:and economic growth 6-10,
29-30 as goods in use 224 and population health 77 pressure to maintain 25-6, 219 and sustainability 219, 224 and trust 62
in world wars 85 Loch Fyne Oysters 258 London Symphony Orchestra
258 Louisiana:
homicide rate 137 imprisonment rate 149 inequality and health and social
problems 149, 174 social capital levels 79
low-skilled work 116 - 17 Luker, Kristin 12 1 luxury 3
goods 70, 227 taxing 222, 271 see also consumption and
consumerism
MacArthur, General 242 McCord, Colin, and Harold
Freeman 80 Malaysia 241male dominance 204-5, 2°8
see also dominance management methods,
participative 255-6 market economy/system 252
and inequality 199 mechanisms 210
Marmot, Michael 176 marriage:
choices 29, 44 and class 125, 163 in equal and less equal societies
44and health 76 and obesity 99 romantic vs. financial
considerations 29, 44 and women’s work 228

Martin, Charles 129 Maryland 153 mass society 42 Massachusetts:
health care for prisoners 153 homicide rate 137
material differences, scale of: and social divisions 56 and social problems 25
materialism 3-4, 249 maternity leave 1 12 maturity, early 126-7 Mauer, M arc 147M axwell Poll on Civic Engagement
249
media 156medical care see health care mediocrity, and equality 237 men see fathers; male dominance;
sex/gender differences menarche 189mental health see mental illness;
wellbeing
mental illness 19, 63-72, 183 chemical changes in 65, 7 1-2 and child development i n cultural differences in 66 and group density effect 168 and inequality 63-72, 67-9, 176,
183, 246international comparisons 66-9,
176, 183 measures of 66 in prisons 152-3 rises in 65 see also depression
Merck Family Foundation 3 middle class:
and criminals i54n. and education i n , 115
and imprisonment 149-50 income levels in world wars 85 and inequality 226 and parenting i n status markers 163-4
middle-income countries 6-7 Milgram, S. 262 Miliband, David 222 militarization/militarism 47-8, 235
demonstrations against 248 M IN D (National Association for
Mental Health) 65 miniaturization 264 minimum wage legislation 243, 271 Minnesota:
equality in 153 humane prison regime 153
imprisonment rate 149 inequality and health and social
problems 174 social capital levels 79
minorities see ethnic minorities mirror neurons 213 Mississippi:
inequality and health and social problems 174
teenage pregnancies 124 trust, levels of 53-4
mistrust 57-8 and child development i n , 210 and fear of crime see crime and pugnacity 140-41 and reproductive strategies 126 and violence 140 see also trust
modesty 44-5Mondragon Corporation 258 monkeys:
maternal protection 215 status and stress among 7 1-2 , 194
mood disorders 67-8 mood-altering drugs 65, 72 mortgages 270mothers see parents; teenage births multinationals 251 murder see homicide music, as class and status indicator
27, 164 mutuals 251, 253
nanotechnology 265 National Center for Education
Statistics 107 National Health Service 65 National Health Service Plan 81 National Policy Association 236 National Survey of Children’s
Health 68, 93 National Survey on Drug Use and
Health 68 nationalized industries 253 Native Americans, de Tocqueville
and 51 neglect see children neighbourhoods:
cohesive 140, 259 concentration of poverty 162 deprived/disadvantaged 28, 84,
12 1 , 125, 132, 140, 163, 168 and ethnic groups 140 trust levels 57, 259 and violence 137, 140
neighbourliness 57 ‘neo-liberal’ thinking, and
inequality 193 neocortex 206 Netherlands, The:
crime 15 1 equality 236 foreign aid 61
obesity 92prison system 147, 150 trust, levels of 52-3
neurology, and learning environments 115
Nevada 79New Brunswick, University of 108 New Hampshire:
homicide rate 137 inequality and health and social
problems 174, 184, 246 taxation 246
New Jersey 150 New Orleans 49-50, 54, 57 New York 137
see also Harlem N ew Zealand:
advertising 228 imprisonment rates 148 income differences 244 life expectancy 6-7 literacy n o mental illness 67, 183 teenage births 124-5, I27
Nigeria 251 Nobel prizes 231, 237 non-monetized sector 271 non-profit organizations 252-4
pay in 259 Nordic countries 197
see also Scandinavian countries North Dakota:
inequality and health and social problems 174
trust, levels of 53-4 North Korea 241 Norway:
advertising 228 equality 16 1, 268 foreign aid 60

Norway: - cont. literacy n o parental leave 112 public spending on welfare and
education 16 1, 212 teenage births 125 trust, levels of 54 see also Scandinavian countries
nutrition see diet
Oakeshott, Robin 257 obedience 262obesity (and overweight) 10, 19,
89-102 causes of 90-91, 100-102 central (abdominal fat) 86, 95,
194childhood see children and class 10, 9 1, 95-6, 99-102 emotional and social
consequences 89-90 and employment/earnings 98-9,
10 0 ,10 1 - 2 ,19 1 and genetic factors 90 illnesses associated with 89, 95 and imprisonment rates 192 and income 91, 99, 10 1-2 inequality and 9 1-5 , 98-9, 176,
189, 238, 239, 240 international comparisons 9 1-3 ,
98, 176 and low status 75, 98-9 and marriage 98
and self-discipline 99 sex differences in relation to
inequality 27, 98-9 social distribution 91 social factors in 96-8 social gradient and 27 and thrifty phenotype 100
treatment and prevention 10 1-2 , 238
in women see women see also poor people; rich people
obsessive-compulsive disorder
63occupational classes 179-81 O EC D see Organization for
Economic Cooperation and Development
oligarchs, Russian 28 optimism 55, 76 Organization for Economic
Cooperation and Development (OECD) 23
foreign aid comparisons 61 imprisonment rates in 155 public social expenditure data
184working hours in 228
others, attitudes to: and health 76 and low social status 76 and stressors 38-9, 42-3, 57-8
oxytocin 2 13 - 14
Pachauri, Rajendra 231 Page, John 241pain, social and emotional like
physical 214-5 Paine, Tom 251-2 , 263 Pakistan 251 parental leave 112 parenting:
and education see educational performance
and experience in early years 126 ‘poor’ 2 1 1providing experience of adversity
2 1 1 - 12

I N D E Xreflecting altruism 210 and trust 55 see also parents
parents:attitudes to poverty h i feelings of inadequacy n 1 and inequality m - 1 2 level of education 10 8 -10 ,18 0 maternal protection 215 postponing parenthood 120,
126-7 single 127, 179, 192 step-parents 138 and stress m - 1 2 see also fathers; parenting;
teenage births parole 15 1 , 154participation, employee 255-6, 258 Pasteur, Louis xv patents 262 pay:
limiting 254 top 245, 249, 254 see also income
peace-keeping 201-2 sexual activity as 204
pecking orders 199-201and health and social problems
13see also social status
peer pressure 43, 63, 138 personal relationship problems:
and inequality 45 and self-esteem 37
pessimism 76 petroleum 231 Philip Morris 251 Philippines 241 physical activity see exercise physical education 90
PISA see Programme for International Student Assessment
Polaroid Corporation 258 policing:
inequality and 155, 246 and social problems 238 and violence 142
policy makers, and health and social problems 26
political will 247-9, 264 politicians:
and a better society 4 and ‘change’ 249 and crime i54n., 156 and equality 157, 197, 247-9, 269,
271and inequality 5, 197, 238
polls (public opinion) 249 poor people:
blamed for broken society 5 causes of their problems n , 24-6 and education n , 1 15 - 17 ‘genteel poor’ 29 and ill-health 10, 73, 17 7 ,18 1-2 ,
239and imprisonment 149 and life expectancy 80-85 obesity among 5, 10 and parenting m - 1 2 proportion of all incomes 17 spending choices 25 and violence 1 1 , 13 1-2 , 194 see also poorer countries;
poverty poorer countries:
benefits of equality in 30 drug companies and 262 and life expectancy 6-7, 8 needs of 235
poorer countries: - cont. and wellbeing 8 see also developing/less
developed countries Popenoe, David 137 Popper, Sir Karl 195 population health 77, 202
and health care 81, 238 and social factors 76-7
Portugal:health and social problems 183 inequality 15, 183, 186, 179 infant mortality 80 literacy n o police numbers 155 teenage births 124-5 trust, levels of 52-3, 62
position, indicators of 27 see also hierarchies
possessions:coveting 30, 69-70 as markers of status 30 see also goods
poverty:and child development and
wellbeing m , 212 concentration of 162 defined 15 fluctuations in 143 inner-city 162-3 and pregnancy 120 and school drop-out rates 108 in Second World War 85 and trust 57, 62 see also poor people; poorer
countries power:
as aphrodisiac 207 arbitrary 263
pre-school programmes 112 , 247
prehistoric man see early human evolution; hunter gatherers
prejudices 45, 52, 168downward 164, 166, 185, 207 see also class; racial prejudice;
snobbery pride 133-4 , I4I primates 198, 203-5, 2°8
aggression and hierarchies among 167-8, 203-5
prison see imprisonment; prison populations; prisons
prison populations 19, 145-50 and fatherlessness 137 fluctuations 145, 192 and inequality 148-50, 19 1-2 international comparisons
145-50 juveniles 167 sex offenders 167
prisons:abuses and bullying in 152-3 , 167 conditions 150-53 education, treatment and
rehabilitation in 15 1-3 , 155-6 over-crowding 145 public expenditure on 247 sexual abuse in 167
privatization 251 productive power, ownership of
productivity 103, 258, 260 profit, and new technologies
265-7profit-making organizations 252-3,
272reducing inequality in 254-63
Programme for International Student Assessment (PISA)io 5- 7, 109

progress, human 197, 267-8 provident societies 251 psychosocial factors:
definition 77 and health 87 and inequality 195
psychosocial wellbeing: for individuals and whole
populations j , 238 need for 4-5 politicians and 4, 238
psychotherapy 33 puberty 126-7, x89 public goods, and new
technologies 266 public sector pay 250 public social expenditure 183-4,
246and inequality 184, 237
Publix Supermarkets 258
punishment 154-5, 203>Putnam, Robert 54-5, 56, 140
quality of life see economic growth
racial differences: in imprisonment rates 150 perceptions of 1 13 - 14
racism and racial prejudice 185 and inequality 5 1-2 , 168 racial discrimination 43, 185, 268 and self-esteem 37 see also violence (racially
motivated) ranking see animals; hierarchies rape 129, 138
and fatherlessness 137 and inequality 135
rationing 222-3 Reagan, Ronald 244
recessions:1980s 1432008 see financial crisis
recidivism see imprisonment reciprocity 209, 210, 214 recycling, and inequality 232-3 redistribution of wealth and power
87, 183-4, 241-2, 245 in Japan 87,183 , 241-2, 245 in Sweden 18 3 ,18 4
regression line xix rejection see social exclusion religion:
and death rates 79 decline of discrimination 43,
268and equality 269 and food sharing 205 and health 76and psychosocial wellbeing 238 sharing in 209 and social mobility 157 and social status 185 and teenage births 124
reproductive difficulties see stress reproductive strategies 126-7, J 37>
204-5 research:
experimental see experiments health 27-8and inequality 27-8, 193, 267 poverty 267 responses to 175-6
resources:exploitation of 262 limiting consumption 224-5 rivalry for 201, 204-5
respect 40, 133-4, I4I , 2 I 5, reverse causality see causality Rhodes, Lorna 152-3
rich countries 100, 267environmental policies 224-5,
235and happiness 8-10, 69-70 health care 81-4health and social problems 25-6,
z7life expectancy 6-7, n - 1 3 , 81-5 mental health 35, 64-70 teenage births 123 trust, levels of 52-3 and women 57-60
rich people:benefits from equality 180-2 cost to society of 227, 269-70 and global warming 222 and inequality 69-70, 18 1-2 , 229 motivation of 227, 229 obesity among 5 ,10 proportion of all incomes 17 and reducing living standards
219standing up to 269-70, 272 tax proposals 227, 269 see also luxury
rights, for employees and tenants268
Rio de Janeiro 135 risk-taking 5, 77, 207 rivalry see competition Robin Hood Index 19 Roman Catholics 124 Rooney, Patrick 255 Roosevelt 244 Rothstein, Bo 55, 62
see also Uslaner, Eric Royal Dutch/Shell 251 Russia:
inequality and history 189 life expectancy 87
new income differences and class structure 28, 87, 189
Soviet 252
Sahlins, Marshall 15, 197, 200, 201 Sampson, Robert 140 Sanitary Movement 73 Sartre, Jean-Paul 205 satisfaction see happiness savings, decline in 228, 270 Scandinavian countries:
equality 174, 183
income inequality 15 ,17 4 obesity 91 social mobility 159 trust, levels of 52-3
scapegoating i54n.Scheff, Thomas 41 schizophrenia 168 Scholz, Tom 235 schools:
and obese children 90 and violence 137, 139 see also education; educational
performance Science Applications International
Corporation 258 sea level, rises in 1 1 self-criticism 44-5 self-deprecation see modesty self-esteem 36-7, 38-9, 65
and esteem of others 42-3 healthy and unhealthy 37, 45, 65,
207result of co-operation 209-10 and social status 40,164 types of 37, 44-5
self-harm 43self-image, preoccupation with 37,
69, 99-100

self-interest:and consumerism 230, 232 experiments in 202-3 as governing principle 199, 202 restraining 202, 208, 210, 214
self-realization from co-operation209-10, 215
self-reported health problems 75, 81
self-worth see self-esteem Semmelweiss, Ignaz xv Sennett, Richard, and Jonathan
Cobb 165 sentences (penal):
length of 145-7, 154 minimum mandatory 147 no-remission 147 non-custodial 147 see also death sentence
serotonin 7 1, 115 sex discrimination 43, 268 sex education 120 sex equality among primates 204 sex offenders 167 sex/gender differences:
homicide rates 13 1-2 mental illness 68-9 obesity 95, 98-100 social gradient in health and
social problems 27 and ‘stereotype threat’ 1 13
sexism and inequality 51, 168 sexual activity:
competing for mates 134, 210 and food 204 and status 134 see also adolescents
shame and humiliation 4 1, 129, 133-4, 208
loss of face 40, 133-4 , 2 1 5
and parenting 138 as social emotion 41 and status 69
and violence 1 3 3 - 4 , I4°~4I ) x44> 215
working-class men 165 young men 1 3 3 - 4 , I 38) 1 4 0 - 4 1 ,
144share-ownership schemes 255-6 shared values 4,56 shareholders, external:
limiting unearned income of 257 redistribution away from 260,
261shareware 265Shaw, George Bernard 237shoplifting 147shopping, obsessive 3, 70, 226, 230
see also consumption sickness:
benefits 268 and low status 75
Sidanius, Jim , and Felicia Pratto 168
Siddiqi, Arjumand 109-10 Silverman, John 156 Singapore 241
gun ownership 136 homicide rate 136 income inequality 15 prison population 148-9
single parents see parents slavery 5 1-2 , 157, 188, 209, 267 Slovakia 251 Smith, Adam 25 smoking:
as cause of disease 75 and low status 75, 87
snobbery 163-6, 207 as zero-sum game 165

sociability:increasing 237, 260 measures of 45, 56, 78-9, 103,
199; see also trust social capital:
and aggression 140 defined 79 and health 78 and inequality 54-6, 126
social class see class social cohesion 45, 78, 84, 215
governments and 193 and inequality 195, 259 and teenage births 126-7 in world wars 8 5
social comparisons, invidious 70, 229
Social Democratic Party (Sweden) 242
social differentiation and inequality
i 95social distinctions 28-9 social evaluation/social evaluative
threats 37, 38-9, 4 1-2 , 43, 45 social exclusion 2 14 -15
snobbery as 165 see also ethnic minorities
social expenditure see public social expenditure
social gradients see gradients social insurance 242 social interaction:
humans’ preoccupation with205-6
oxytocin and 214 social involvement see community
lifesocial life, and evolution of brain
206social mobility 19, 24-5, 157-69
and ability 43changing rates of 160-61, 259 and health 13 , 259 and income mobility 157-9 and inequality 159-61, 163-9 inter- and intra-generational
157-9international comparisons
159-61 measuring 19, 157-9 and obesity 98-9 see also sorting system
social needs 1-3 , 230 social networks 76-7 social organization 200
social strategies to deal with206-10
social problems: changing with changes in income
distribution 193 and material conditions 25 search for solutions 240 see also health and social
problems social relations:
built on material foundations
4-5and child development m - 1 2 and health see health inequality and 51-62, 195 and mental health 70
social security transfers 246 social self, preservation of 38-9 social status 13 , 39-41, 199-201
competition see status and confidence levels 40-41, 43-4 and ethnicity 185-6 and health 75-7, 85-7, 169,
199-200, 207 importance of 39, 40-41, 7 1-2

I N D E X
and inequality 13 , 188, 199-200 and literacy 180 stratification 199-200 threats to 38-9 see also status
social strategies see social organization
social stratification 229, 242 social support 76, 85, 169 social theorists x iv-xv social trust see trust social work 238 socialists 52 societies:
as failures 18 types of 26
solar power 266 solitary confinement 152-3 sorting system, society as 24-5,
43South Korea 242 Soviet Union (former) 252, 263
see also Russia Spain 258
mental illness 67 teenage births 124
Sports Utility Vehicles 57-8 state ownership 244, 252, 263 State o f Working America 2006/7,
The 160 status:
anxiety and insecurity 44, 69, 97-8, 100, 10 1
competition 4 4 -5 ,16 4 ,19 4 ,207-8, 208, 209, 210, 227, 257
deprivation of 166 and health 194, 199, 207 and inequality 134, 137, 14 1, 199,
215, 225, 227, 257 markers 28, 30, 40, 57-8, 134,
14 1, 163-6; see also goods men and 134, 140-41 social see social status
steady-state economies 224-5, 2 7° Steele, Claude, and Joshua
Aronson 113 Steinbeck, John 73 stereotypes and stereotype threats
1 13 - 14 , 164 stigma 168-169
see also shame and humiliation stress:
chronic and acute 85-7, 96 in early life 39, 63, 77, 85, 100,
126, 2 10 - 1 1 , 2 1 1 and health 37-8, 41, 75, 85-7,
201, 205, 212 hormones 38-9, 95, 100, 115 , 2 1 1 levels see anxiety and obesity and food intake 95-6 and pregnancy 77, 100, 120,
2 10 - 11and reproductive issues 86,126,
205responses to 37-9 and risk-taking 77 sources of 37-9, 41, 63 stress-related diseases 86, 212 stressors, research into 38-9, 41 in unborn children 77 and weight loss 95
students:anxiety levels 33-4 experimental research on 19 1,
194and narcissism 37
success 40, 69 see also status
suicide 175international comparisons 76, 175

suicide: - cont.and low status 75, 76 social gradient 175
Summer, Volker 167-8 ‘supermax prisons’ 152-3 support networks see social
networks Survey on Crime Trends and the
Operations o f Criminal Justice Systems 135, 148
sustainability 2 17 -3 1 , 252, 270 SUVs 57-8 Sweden:
births outside marriage 183 child wellbeing 212 death rates 178equality 178-80, 183, 188, 241,
242, 268 executives’ pay 250 foreign aid 60imprisonment and re-offending
i 45, i 55, i 57 infant mortality 80, 178-9 literacy n o parental leave 112 police numbers 155 teenage births 125 trust, levels of 52-4, 62 welfare and redistributive taxes
183women’s status 59-60, 183 see also Scandinavian countries
Taiwan 45, 241 taste 164 taxation:
avoidance 231and employee ownership 255,
261inheritance 271
progressive 222, 271 and redistribution X83, 193, 271 and reducing inequality 254-5 and representation 263 of rich people 227, 254, 269 VA T and sales taxes 264-7, Z7J-
technologies 220-24, 272changes and innovations 193, 225 new 220-24, 272 and sustainability 220
teenage births 19, 118 -28, 138, 193 absent fathers and 127 benefits of 12 0 ,12 1 , 12 8 data comparisons 19, 12 1-5 ,
126-7, I 42 disadvantages of 120-2 1, 124-8 fluctuations in rates of 142, 143 and inequality 27, 120-28, 142,
189 ,192, 2X2, 239 and marriage 124 young fathers 127-8
teenagers see adolescents; teenage births
Texas 93Thatcher, Margaret 244 thinness 99-100 ‘three-strikes’ laws 147 ‘thrifty phenotype’ 100 Titmuss, R. M . 222, 242 tobacco 262 Tower Colliery 258 Toynbee, Polly 91 trade unions 79, 243, 245, 269 tradeable carbon quotas 222 transnational corporations (TN Cs)
2.51trust 19, 51-62, 213-4 ,
in 19th-century America 51benefits of 56-7causes of change in 54-6

and choice of vehicle 57-8 experiments in 214 and fear of crime see crime and health 57inequality and 4 5 ,5 1-6 2 , 195,
203, 259, 268 levels of 19, 52-6, 77-8 lost wallet test 54 and oxytocin 2 13 - 14 and reproductive strategies 126-7 unlocked doors 54 see also mistrust
‘truth-in-sentencing’ laws 147 Tunisia 251 Twenge, Jean M . 33-4
on anxiety and depression 33-4,
42-on narcissism 37, 42 on self-esteem 36
UK see United Kingdom U K Millennium Cohort Study i n ultimatum game 202-3 U N C T A D see United Nations
Conference on Trade and Development
underweight 189 unemployment:
benefit 268 and education 103 and employee buy-outs 258 fluctuations 143and inequality 55, 125, 192, 263,
271 policies 271 and weight gain 100 see also employment
unfairness 206, 256, 270 U N IC E F see United Nations
Children’s Fund
United Airlines 258 United Kingdom:
crime and violence 129-32, 147, 156
depression in 35 drug abuse and addiction 65, 71 education and child development
105, 107, 110 - 12 employee participation schemes
256ethnic minorities and
imprisonment 150 executive pay 250 foreign aid and colonial ties 61 happiness levels 8 health inequalities 8 1-4 ,177-80 ,
238-9homicide rates 136, 144, 269 inequality 15 , 143-4, I ^ i, i74>
177-80, 188, 242, 245, 249-52,269
life expectancy 81-4, 85, 268 literacy rates 108-10 mental health 35, 63-5, 67, 183,
268nationalized industries 253 non-profit sector 250, 251 obesity and overweight 90, 95,
96, 98-9, 10 1 .penal policies 145, 147, 154, 156,
268residential segregation of rich
and poor 162-3 social class markers 164 social mobility 159-61 teenage births and parenthood
119-20, 122-7, 268-9 trust levels 52, 268 working class sense of injury
165-6

United Kingdom: - cont. working hours 268 in world wars 84-5, 242 see also England
United Nations: data 23, 175foreign development aid targets
60-61see also Survey on Crime Trends
United Nations Children’s Fund (U N ICEF):
on teenage births 123 see also Child Wellbeing
United Nations Committee against Torture 152
United Nations Conference on Trade and Development 251
United Nations HumanDevelopment Index 220-21
United Nations Office on Drugs and Crime 70
United States of America: advertising 228 alternatives to capitalism in
252—4 anxiety levels 33-5 and biofuels 231 death rates 12 - 13 , 178-9 and emissions 224 equality, historical commitment
to 49, 54-5, 263 executive pay 250 fear of crime 13 1 federal poverty line 25 geographical segregation in 162-3 happiness levels 8 health 79 -8 1,19 0 high-school massacres 139 historical explanations for
divisions 188
homicide rates 13 1 , 142 income differences 12 - 13 , I9°>
220, 244, 249, 268 inequality 15, 174, 185-6, 190,
220, 239-40 infant mortality 80, 8 1-5, 220 and Japan 242
life expectancy 6-7, 79-80, 81-5, 176 ,190 , 220, 268
literacy rates 108-10 mental health 63-5, 153, 183 narcissism and blame 44-5, 175 non-profit sector 250, 252-3 obesity and overweight 89, 91,
95-6, 96, 98-10 1, 268 parental leave 112 prison and judicial system
MJ-SQ* i 5i - 3> 155- 6, 247,2169 public spending on education
16 1, 247 self-promotion 44-5 shared values 56 social expenditure 246 social mobility 159-61 suicide rates 175
teenage births 122-7, 143, 2.68 top salaries 250 trust, levels of 52-6, 268 working class sense of failure 165 working hours 228, 268
universities and higher education 59-60, 16 1, 252, 267
US Census Bureau 18 US Department of Justice, Bureau
of Justice Statistics 149 US National Vital Statistics System
123USA see United States of America Uslaner, Eric 55-6, 62 Utah 124

utopias 197, 271
Veblen, Thorstein, and Veblen effect 230
Venezuela 251 Vermont:
inequality and health and social problems 174, 246
phone calls for prisoners 153 social capital levels 79 taxation 246
violence 129-44bullying as predictor of 139 and celebrities 18 1 environmental influences on
139-41 and fatherlessness 137 fear of 58 ,129 -3 1 fluctuations in 143-4 in foraging societies 208 governments and 193 and imprisonment 154 and inequality 45, 134-7, 140-41,
14^ 14 3 -4 , 190, i9 5 , i9 9 international comparisons 13 1-2 ,
134- 7, 139- 40, 150 preventing or controlling 134-6,
142and punishment 154 racially motivated 13 1 random shootings 129 and self-esteem 37 symbolic 164 triggers of 40, 215
virtual systems 225 Visions of Humanity 235 voluntary activities 56, 78-9, 103
wage labour 210Wake Forest School of Medicine 71
Wales 178-90 Wallich, Henry 226 waste see recycling water supplies 30, 231, 262 Wattleton, Faye 119 wealth:
attitudes to 4, 30, 69-70 differences in 27, 164-6, 199 in foraging societies 208 gain or loss of 29, 43,
69-70 and merit 237
‘weathering’ 120 ‘weightlessness’ 225, 264 welfare spending:
and child wellbeing 212 and education 110 - 12 and imprisonment rates 155 and teenage births 143, 193
welfare states 183, 241 wellbeing:
children’s see Child Wellbeing economic 8, 55 indicators 8international comparisons 220 mental health 65 and physical health 76, 205 and sustainability 218-9 see also psychosocial wellbeing
West Germany 147, 159 see also Germany
West, Kanye 50 Whitehall Studies 75-6, 84 Willms, Douglas 108-9 Wilson, M argo, and Martin Daly
77, 133-4 Wilson, William Julius 163 women:
body image 99-100death rates and inequality 60

women: - cont.differences in treatment see
sex/gender differences earnings 58-9 employment 58-9, 75, 228 homicide rates 13 1-2 and husbands’ income 228 and men’s status X34 mental illness and inequality 68 obesity and overweight 27, 91,
95; 98-100, ior political participation 58-9, 268 preference for high-status males
134, 204 and prospective partners 134 social and economic
empowerment 58-60 status and inequality 58-60, 203,
228, 268 and violence 13 1
work:aggression at 167 demands of 205 and health 256 relationships at 259 safety improvements 73 working hours 228 workplace democracy 256 see also employment; sickness
absence working class:
and education i n , 1 15 - 17 feelings of failure and inferiority
165-6and middle-class values
1 15 - 16 and parenting i n in world wars 85
World Bank 23, 135, 241 World Drug Report 70
World Health Organization 66 on cardiovascular diseases 91 and mental illness 66 and obesity 89, 98
World Mental Health Survey Consortium 66
World War, First 84-5, 87 World War, Second 84-5, 87, 242 world wars, co-operation and
equality in 85, 242 World Wildlife Fund (WWF) 220 wound healing 76
Yearning for Balance 3-4, 249 young people see adolescents


Richard Wilkinson has played a formative role in international research on the social determinants of health. He studied economic history at the London School of Economics before training in epidemiology and is Professor Emeritus at the University of Nottingham Medical School, Honorary Professor at University College London and Visiting Professor at the University of York.
Kate Pickett is Professor of Epidemiology at the University of York and a National Institute for Health Research Career Scientist. She studied physical anthropology at Cambridge, nutritional sciences at Cornell and epidemiology at the University of California - Berkeley.
They live in North Yorkshire.


R E V I S E D A N D U P D A T E D
" An important book . . . [W ilkinson and Pickett] argue that gross inequality
tears at the human psyche, creating anxiety, distrust and an array of
mental and physical ailments— and they cite mountains of data to support
their argum ent." — NICHOLAS D. KRISTOF, N EW YORK TIMES"In our time, [the] idea of universal opportunity is once again under assault
for working people of every race . . . If you want more evidence,
get your hands on this book, The Spirit Level."
— BILL MOYERS O N BILL MOYERS JOURNAL"The evidence, here painstakingly m arshaled, is hard to dispute."
. — ECONOMISTWhy do Americans mistrust their fellow citizens more than the Japanese do? Why do we have higher rates of teenage pregnancy than the French? Why
do we have more homicides than the Spanish, Australians, and Danes put
together? The answer may be this simple: We have more inequality.
This groundbreaking book, based on years of research, provides hard evidence to show:
• How almost every measure of well-being-from life expectancy to mental illness, violence to illiteracy—is affected less by how wealthy a society is than by how unequal it is
• W hy societies with a bigger gap between rich and poor are worse for everyone in them-including the well-off
• How we can find positive solutions and move toward a happier, fairer future
Urgent, provocative, and genuinely uplifting, The Spirit Level has been heralded as providing a new way of thinking about ourselves and our communities. It will change the way you see the world.
R IC H A R D W ILKIN SO N has played a formative role in international research
on inequality, and his work has been published in ten languages. He is professor emeritus at the University of Nottingham M edical School.
KATE PICKET is a professor of epidemiology at the University of York and a National Institute for Health Research career scientist.
CURRENT AFFAIRS/U .S. $ 18 .00
C over design: Patti Ratchford C over photograph: G andee Vasan
C /1 Available as aneBook V
ISBN:III III III 51800
781608 193417 lUDIIIIIIwww.bloomsburypress.com