EVER STRONGER - AnnualReports.com
182
EVER BETTER EVER STRONGER ANNUAL REPORT 2018 Solutions for a safer world
-
Upload
khangminh22 -
Category
Documents
-
view
7 -
download
0
Transcript of EVER STRONGER - AnnualReports.com

EVER BETTEREVER STRONGER
ANNUAL REPORT 2018
Solutions for a safer world

Intertek is going from strength to strength, making consistent progress in both strategy and performance.
We have scale positions in attractive end-markets with a high-margin and strongly cash-generative earnings model and we are benefitting from higher demand from our customers for our global Total Quality Assurance (‘TQA’) solutions.
We are on a good-to-great journey and we firmly believe in continuous improvement to take Intertek to greater heights. Our ‘Ever Better’ approach to operational discipline makes Intertek Ever Stronger, every day.
The world of our clients is getting more and more complex and companies are increasing their focus on risk, which creates ever bigger growth opportunities for Intertek given our unique TQA value proposition.
Leveraging these ever bigger growth opportunities ahead with our ‘Ever Better’ operational discipline in everything we do, and continually innovating to provide our clients with solutions for a safer world, we are confident in our ability to deliver sustained progress moving forward.
OUR TQA CUSTOMER PROMISE
Intertek Total Quality Assurance expertise, delivered consistently with precision, pace and passion, enabling our customers to power ahead safely.

INTERTEK AT A GLANCE
OUR PURPOSEBringing quality and safety to life
OUR VISIONTo be the world’s most trusted partner for Quality Assurance
OUR VALUES• We are a global family that
values diversity
• We always do the right thing with precision, pace and passion
• We create sustainable growth for All
• We trust each other and have fun winning together
• We own and shape our future
A PURPOSE-LED VISION MAKING THE WORLD A BETTER AND SAFER PLACE
OUR SERVICESIntertek’s innovation-led, end-to-end Total Quality Assurance (‘TQA’) proposition helps organisations operate safely, effectively and with complete peace of mind in an increasingly complex, fast-changing world. As the global pioneers in the Quality Assurance industry, we are the only company in the world that delivers – on a truly global scale – a fully integrated portfolio of Assurance, Testing, Inspection and Certification services.
ASSURANCEEnabling our customers to identify
and mitigate intrinsic risk in their operations, their supply and distribution
chains and quality management systems.
TESTINGEvaluating how our customers’ products and services meet and exceed quality, safety, sustainability and performance standards.
INSPECTIONValidating the specifications, value and safety of our customers’ raw materials,
products and assets.
CERTIFICATIONFormally confirming that our customers’ products and services meet all trusted external and internal standards.

OUR SECTORSBy focusing on the three sectors of Products, Trade and Resources, we concentrate the full power of our innovation capabilities onto those attractive growth and high-margin sectors where we deliver most value for our customers.
Read more in our Operating Reviews on pages 44 to 51
PRODUCTS
77% of profit
TRADE
17% of profit
RESOURCES
6% of profit
OUR GLOBAL NETWORKThe world of our customers is growing ever more complex. Our presence in more than 100 countries worldwide, keeps us close to all our customers, understanding their challenges, developing the insights that inspire innovation and continuously delivering a superior customer service.
Structural drivers include quality solutions and sustainability demand, R&D, regulation, brand and supply chain expansion and risk management.
REVENUE
£1,680m ADJUSTED OPERATING PROFIT
£371m STATUTORY OPERATING PROFIT
£345m
Structural drivers include global GDP growth, quality and quantity control requirements during transportation.
REVENUE
£642m ADJUSTED OPERATING PROFIT
£83m STATUTORY OPERATING PROFIT
£78m
Structural drivers include capex and opex investment, increased resources activity and long-term demand for energy.
REVENUE
£479m ADJUSTED OPERATING PROFIT
£28m STATUTORY OPERATING PROFIT
£13m
1,000+LABORATORIES AND OFFICES
3,000+AUDITORS
100,000+AUDITS
44,000+EMPLOYEES
100+COUNTRIES
80+LANGUAGES

FINANCIAL HIGHLIGHTS
REVENUE
£2,801m(2017: £2,769m)
1.2%
4.7%
ADJUSTED OPERATING PROFIT1,2
£482m(2017: £468m)
3.0%
6.9%
ADJUSTED OPERATING MARGIN1,2
17.2%(2017: 16.9%)
30bps
40bps
ADJUSTED DILUTED EARNINGS PER SHARE1,2
198.3p(2017: 191.6p)
3.5%
7.7%
FREE CASH FLOW (RESTATED)2,4
£351m(2017: £342m)
2.6%
ORGANIC REVENUE1
£2,770m(2017: £2,764m)
0.2%
3.7%
STATUTORY OPERATING PROFIT
£436m(2017: £423m)
3.2%
7.2%
STATUTORY OPERATING MARGIN
15.6%(2017: 15.3%)
30bps
40bps
STATUTORY DILUTED EARNINGS PER SHARE
174.7p(2017: 176.3p)
0.9%
3.2%
DIVIDEND PER SHARE3
99.1p(2017: 71.3p)
39.0%
1. Definitions of the above metrics and constant currency are set out on page 52.
2. Adjusted operating profit, adjusted diluted earnings per share (‘EPS’) and adjusted free cash flow, which are non-GAAP measures, are stated before Separately Disclosed Items, which are described in note 3 to the financial statements. Reconciliations between statutory and adjusted measures, as well as Return on Invested Capital and cash conversion, are shown in the Financial review on pages 60 to 65.
3. Dividend per share for 2018 is based on the interim dividend paid of 31.9p (2017: 23.5p) plus the proposed final dividend of 67.2p (2017: 47.8p).
4 Free cash flow has been restated for 2017 as explained on page 64.
OVERVIEWIntertek at a Glance IFCFinancial Highlights 1
STRATEGIC REPORTEver Better, Ever Stronger – Solutions for a safer world 2Chief Executive Officer’s review 14Executive Management Team 20Sustainability report – Solutions for a better world 22Operating reviews 44KPIs – Measuring our strategy 52Principal risks and uncertainties and Long-term Viability statement 54Financial review 60
DIRECTORS’ REPORT Chairman’s introduction 66Corporate Governance 68Board of Directors 74Nomination Committee 80Audit Committee 83Remuneration report 89Other statutory information 110Statement of Directors’ responsibilities 113
FINANCIAL STATEMENTS Contents 114Consolidated primary statements 115Notes to the financial statements 120Intertek Group plc – Company 164 primary statements and notes
OTHERIndependent Auditor’s Report 169Shareholder and corporate information 176
Continued progress in revenue, margin and cash reflecting the Group’s performance management discipline, focused on margin-accretive revenue growth and cash conversion.
IN THIS REPORT
Actual rates
Constant currency1
• Group revenue growth of +4.7% at constant currency rates, +1.2% at actual rates
• Solid organic revenue growth at constant rates of 3.7%: Products +5.2%, Trade +2.2%, Resources +0.3%
• Portfolio strength and performance management discipline driving margin progression: adjusted +40bps at constant rates, +30bps at actual rates
• Adjusted operating profit of £482m, an increase of 6.9% at constant rates and 3.0% at actual rates
• Statutory operating profit of £436m, an increase of 7.2% at constant rates and 3.2% at actual rates
• Strong adjusted diluted EPS growth: adjusted +7.7% at constant rates, +3.5% at actual rates; statutory +3.2% at constant rates, (0.9)% at actual rates
• Full year dividend per share of 99.1p, an increase of 39.0%
• Free cash flow (restated) of £351m, +2.6% year on year
• Statutory net profit after tax of £305m, an increase of 3.8% at constant rates and a decrease of 0.4% at actual rates
Intertek Group plc Annual Report and Accounts 2018 1
Strategic Report

• Position Intertek as the leading Quality Assurance provider
• Build brand awareness across sectors and geographies
• Create a compelling Total Quality Assurance brand positioning
• Build customer loyalty and win new customers
• Consistently deliver TQA customer service
• Develop innovative ATIC solutions
• Prioritise business lines, geographies and service areas
• Invest in areas with good growth and good margin prospects
• Apply disciplined resource, capital and people allocation
• Continuously improve to drive productivity
• Deliver best-in-class management to reduce span of performance
• Eliminate non-essential costs – facilities/offices/processes/ purchasing
• Increase existing account penetration
• Drive ATIC-selling
• Accelerate business development with new accounts
OUR 5 STRATEGIC PRIORITIESMOVING THE CENTRE OF GRAVITY OF THE COMPANY TOWARDS HIGH-GROWTH, HIGH-MARGIN SECTORS
DIFFERENTIATED TQA BRAND
PROPOSITION
SUPERIOR CUSTOMER
SERVICE
EFFECTIVE SALES
STRATEGY
GROWTH AND MARGIN-
ACCRETIVE PORTFOLIO
OPERATIONAL EXCELLENCE
OUR 5X5 DIFFERENTIATED STRATEGY FOR GROWTH
DIFFERENTIATED
STRATEG
Y FOR GROWTH
DIFFERENTI
ATED
STR
ATEG
Y FO
R GR
OW
TH 5
Intertek Group plc Annual Report and Accounts 20182
Strategic Report | Ever Better, Ever Stronger – Solutions for a safer world

• Strong entrepreneurial culture
• Customer-centric mindset
• Engagement at all levels
• Performance management with financial and non-financial metrics
• Forecast and review processes focused on margin-accretive revenue growth with strong cash conversion
• Improve customer experience
• Leverage back-office synergies
• Upgrade business intelligence system
• Invest in capability
• Aligned reward system
• Promote internal growth
• Sustainable growth for customers and shareholders
• Importance of sustainability for the community
• Right balance between performance and sustainability
LIVING OUR CUSTOMER-
CENTRIC CULTURE
DISCIPLINED PERFORMANCE MANAGEMENT
SUPERIOR TECHNOLOGY
ENERGISING OUR PEOPLE
DELIVERING SUSTAINABLE
RESULTS
OUR 5 STRATEGIC ENABLERS
DIFFERENTIATED
STRATEG
Y FOR GROWTH
DIFFERENTI
ATED
STR
ATEG
Y FO
R GR
OW
TH 5
OUR GOALS• Fully engaged employees
working in a safe environment
• Superior customer service in Assurance, Testing, Inspection and Certification
• Margin-accretive revenue growth based on GDP+ organic growth
• Strong cash conversion from operations
• Accretive, disciplined capital allocation policy
Intertek Group plc Annual Report and Accounts 2018 3
Strategic Report
A MORE COMPLEX WORLD BRINGS EVER BIGGER OPPORTUNITIES FOR INTERTEK
Intertek Group plc Annual Report and Accounts 20184
Strategic Report | Ever Better, Ever Stronger – Solutions for a safer world

Intertek Group plc Annual Report and Accounts 2018 5
Strategic Report

GDP AGNOSTIC GROWTH DRIVERS
GLOBAL, REGIONAL
AND LOCAL TRADE
GROWTH
GLOBAL GROWTH
DRIVERS IN THE ENERGY
SECTOR
PRODUCTS TRADE RESOURCES
EVER BIGGER OPPORTUNITIES TO ACCELERATE GROWTH
Products: delivering quality-assurance solutions for end-products, components, processes and supply chains. Demand driven by increasing brand and SKU numbers, increased safety requirements and regulation, faster innovation, growing consumer focus on sustainability and greater focus on risk management.
See our Products case studies on page 45 and 47
We offer ATIC solutions to clients operating in three attractive sectors of the economy.
Trade: assuring that every product shipped meets all relevant regulatory, safety and quality standards. Demand driven by population and GDP growth, the development of regional trade, increased focus on traceability and growth in port and transport infrastructure.
See our Trade case study on page 49
Resources: forming, establishing, maintaining and assuring our customers’ operating assets and processes. Demand driven by long-term energy demand, supply chain risk management, sustainability of energy supply, infrastructure investments, growth in alternative energy and focus on health and safety.
See our Resources case study on page 51
60%OF REVENUE
77%OF PROFIT
• Increased number of Brands & SKUs
• Increased regulation
• Improvements in safety, performance and quality
• Faster innovation cycle
• Increased consumer focus on sustainable products
• Increased corporation focus on risk management
23%OF REVENUE
17%OF PROFIT
• Population growth
• Development of regional trade
• Increased focus on traceability
• GDP growth
• Growth in transport infrastructure
• Growth in port infrastructure
17%OF REVENUE
6%OF PROFIT
• Long-term demand for energy
• Supply chain risk management
• Sustainability of energy supply
• Investment in infrastructure
• Growth in alternative energy
• Focus on health and safety
ATTRACTIVE STRUCTURAL GROWTH DRIVERS
Intertek Group plc Annual Report and Accounts 20186
Strategic Report | Ever Better, Ever Stronger – Solutions for a safer world

The world never stands still and the corporate environment in which our clients operate is becoming more complex every day. With ever growing complexity, our customers face unprecedented levels of risk across every element of their businesses.
Intertek’s ATIC services are mission-critical for our customers to manage risk across their supply and distribution chains.
CYBERSECURITYA booming cybercrime economy has resulted in $1.5 trillion in illicit profits being acquired, laundered, spent and reinvested by cybercriminals.
PRODUCT QUALITYGlobally, product recalls are on the rise. In a five-year period, the number of products recalled increased by nearly 40%. Tougher regulations, global supply chains, materials from fewer suppliers and greater consumer awareness are contributing to a rise in recalls.
SUSTAINABILITYIn 2016, cities generated 2.0 billion tonnes of solid waste. This is forecast to increase by 70% to 3.4 billion tonnes by 2050.
FOOD FRAUDIt is believed that food fraud may affect 10% of all commercially sold food products, with a potential cost of $10-15 billion to the global food industry every year.
The global Quality Assurance market offers exciting growth opportunities for Intertek. With the Total Quality Assurance (‘TQA’) market poised for growth due to supply chain expansion across the world and an increasing focus on TQA, Intertek is moving beyond the established US$250 billion ATIC market to a much larger addressable opportunity.
By leveraging our global leadership position, attractive structural growth drivers and innovative ATIC solutions, we enable our clients to thrive in a complex world.
UNTAPPED POTENTIAL
$200bnCURRENTLY IN-HOUSE
$50bnCURRENTLY
OUTSOURCED
GLOBAL ATIC MARKET
EVER BIGGER GROWTH OPPORTUNITIES
Intertek Group plc Annual Report and Accounts 2018 7
Strategic Report
EVER GROWING CORPORATE COMPLEXITY

EVER BETTER EVER STRONGER
PRODUCT AND SERVICE OFFERING
We listen to over 7,000 customers every month and have a deep commitment to building on the strengths of our existing products and services, developing innovative solutions to better support their needs. Delivering the peace of mind our customers require to power ahead, confidently and safely, is one of the five core pillars of our differentiated strategy for growth. Our rigorous approach to analysing customer data helps to harness the resulting insights to develop compelling innovations across our ATIC services, with the customer at the heart of everything we do.
SALES MANAGEMENT
Making Intertek Ever Better, Ever Stronger means delivering margin-accretive revenue growth. We have applied a structured approach to selling across five Sales Goals as we apply an Ever Better approach across the organisation to sales planning: Customer Retention, Customer Penetration, ATIC-selling, New Customer Wins and Customer Outsourcing.
We have made continuous progress over the past four years, capitalising on our strengths and implementing our 5x5 differentiated strategy for growth.
Leveraging the ever bigger growth opportunities ahead with our ‘Ever Better’ operational discipline in everything we do, we are confident in our ability to deliver sustained progress moving forwards.
The world of our clients is getting more and more complex and companies are increasing their focus on risk, which creates ever bigger growth opportunities for Intertek given our unique TQA value proposition that offers systemic end-to-end ATIC services: Assurance + Testing + Inspection + Certification.
We are on a good-to-great journey and we firmly believe in continuous improvement to take Intertek to greater heights. Our ‘Ever Better’ operational discipline is making Intertek ever stronger, every day.
From our strong base, we see opportunities to continuously improve on our value creation levers.
Intertek Group plc Annual Report and Accounts 20188
Strategic Report | Ever Better, Ever Stronger – Solutions for a safer world

OPERATIONS MANAGEMENT
We measure progress against a range of operational metrics and use data intelligence to understand our customer service levels, turnaround times and to create a positive atmosphere where our people feel fully engaged in a safe working environment. A dedicated focus on quality across every site, every month, throughout the business, underpins our operational and health and safety excellence, ultimately ensuring that our customers receive a superior service.
MARGIN MANAGEMENT
Our 5x5 differentiated strategy for growth is based on moving the centre of gravity of the Group towards the high-growth and high-margin sectors in our industry. We adopt a margin-accretive portfolio management strategy, focused on the most attractive growth areas. This is complemented by a systemic approach to performance management across all business lines, countries and sites based on leading and lagging indicators.
CASH MANAGEMENT
Operating a high-quality earnings model with a disciplined approach to capital allocation, powers our strong cash performance management, ensuring we are able to deliver strong cash conversion from operations and robust free cash flow. This in turn enables us to seek out attractive new high-return markets, meeting growing customer demand through insight and innovation and driving a business that’s Ever Better, Ever Stronger.
Intertek Group plc Annual Report and Accounts 2018 9
Strategic Report

Always delivering a superior and continuously improving customer service is central to achieving our vision of being the world’s most trusted Quality Assurance partner. It is to ensure this service excellence that we have built an entrepreneurial culture supported by world-class data intelligence and disciplined operations at all our 1,000+ laboratories.
Since 2015, we have used the Net Promoter Score (‘NPS’) process to listen to our customers.
With 7,000+ customer interviews conducted every month, it keeps us laser-focused on delivering an Ever Better service. Across all touchpoints this is a positive reinforcement that we are delivering on our TQA Customer Promise.
INTERTEK DELIVERS A SUPERIOR CUSTOMER SERVICE
TOTAL QUALITY ASSURANCE
Our TQA value proposition gives our clients the ATIC Advantage, our TIC Expertise plus our Assurance Differentiation.
CUSTOMER CENTRICITYWe work with our customers every day to develop and deliver the bespoke, customer-focused solutions they need to operate safely and sustainably. It is by listening and responding to their needs and challenges that we continuously improve and strengthen our TQA proposition, evolving our own business to be Ever Better, Ever Stronger.
NET PROMOTER SCORE (‘NPS’)The NPS programme gives us the opportunity to capture feedback from our customers. We capture key metrics at every site monthly, which provides us with a rich set of insights. Upon completion of a project, our TQA experts talk to customers to hear their views on their experience, the solution itself and the quality of customer service.
DATA INTELLIGENCEWe use these insights to drive faster and more effective solutions which have a direct and positive impact on customer satisfaction and loyalty, ensuring that all actions are driven by deep customer insight and understanding. We use the data intelligence to consistently deliver our services with zero defects.
TQA VALUE DELIVERYOn-time delivery and turnaround time comprise two of the key metrics underpinning our 5x5 strategy and metrics. We constantly invite customer feedback on this area, helping us innovate for greater speed and enhanced precision to deliver on our TQA Customer Promise.
Intertek Group plc Annual Report and Accounts 201810
Strategic Report | Ever Better, Ever Stronger – Solutions for a safer world
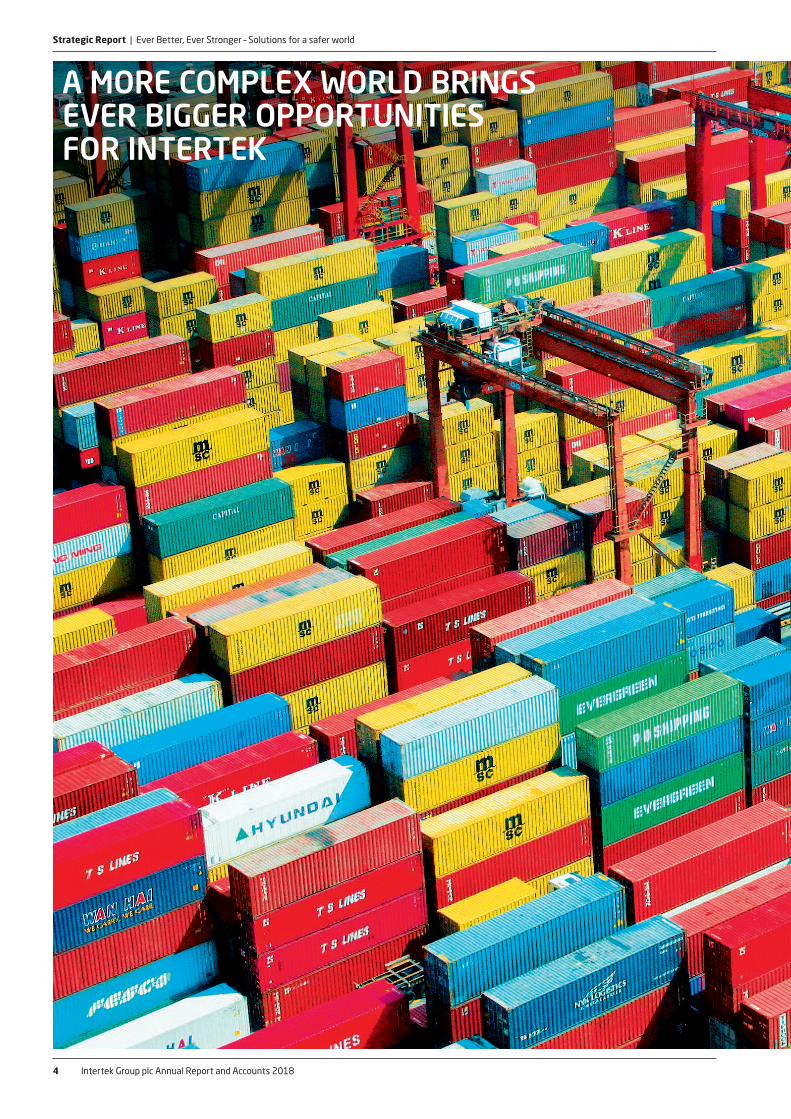
EVER BETTER SERVICE THROUGH INNOVATION
In an exciting market with attractive structural drivers and with corporations facing ever growing complexity, our Ever Better approach to innovation is supporting our clients to thrive and is creating growth opportunities for Intertek.
A more complex corporate world means more growth opportunities for Intertek as we support our clients through Ever Better solutions and customer service.
We innovate in our markets and business lines through the insights generated from our TQA experts and customer feedback through our 7,000+ monthly NPS interviews.
Intertek’s services, across areas including Sustainability and CyberSecurity, Product Assurance and Food Safety, are mission-critical in reducing risk and generating sustainable success for our clients.
WE HAVE THREE CATEGORIES OF INNOVATION:
Develop new breakthrough products and services
BREAKTHROUGH
ADJACENT Develop new products
and services
Strengthen existing products and services
CORE
BREAKTHROUGH Technology that enables solutions to create new markets
ADJACENT Expanding into fast-growing and high-margin areas
CORE Building on the strengths of existing products and services
Read more about how we are constantly innovating in our Operating Reviews on pages 44 to 51
Intertek Group plc Annual Report and Accounts 2018 11
Strategic Report

1. OUR SERVICES
Intertek’s earnings model is based on our value proposition of providing customers in the Products, Trade and Resources sectors across 100+ countries with high-quality Assurance, Testing, Inspection and Certification services.
OUR HIGH-QUALITY EARNINGS MODEL
In today’s complex and competitive global trading environment, our Total Quality Assurance services help more organisations operate more safely, more effectively and with greater peace of mind, everyday.
TESTING INSPECTION CERTIFICATION
2. OUR SECTORS
TRADEThree global Business Lines with similar mid- to long-term structural growth drivers: Caleb Brett (Cargo & Analytical Assessment), Government & Trade Services and AgriWorld.
GDP GROWTH
ASSURANCE
PRODUCTS Focused on ensuring the quality and safety of physical components and products, as well as minimising risk through assessing the operating processes and quality management systems of our customers.
GDP+
RESOURCESHelping customers in the Oil & Gas and Mining industries gain peace of mind that their projects will proceed on time and their assets will continue to operate with a lower risk of technical failure or delay.
LONG-TERM GROWTH
We focus our operations and expertise on three global sectors: Products, Trade and Resources. Each consists of Business Lines with similar mid- to long-term structural growth drivers.
These growth drivers are detailed on page 6 of this report
Intertek Group plc Annual Report and Accounts 201812
Strategic Report | Ever Better, Ever Stronger – Solutions for a safer world

3. SUSTAINABLE VALUE CREATION
Intertek’s approach to sustainable value creation is based on the virtuous economics of our business model. Year after year, their compounding effect supports strong and sustainable value creation for our shareholders.
GDP+ ORGANICREVENUE GROWTH
MARGIN–ACCRETIVEREVENUEGROWTH
INVESTMENTSIN ATTRACTIVEGROWTH AND
MARGIN SECTORSWITH CAPEX /
M&A
STRONG FREECASH FLOW
DISCIPLINEDCAPITAL
ALLOCATION
INTERTEKVIRTUOUS ECONOMICS
Strategic Report
13Intertek Group plc Annual Report and Accounts 2018
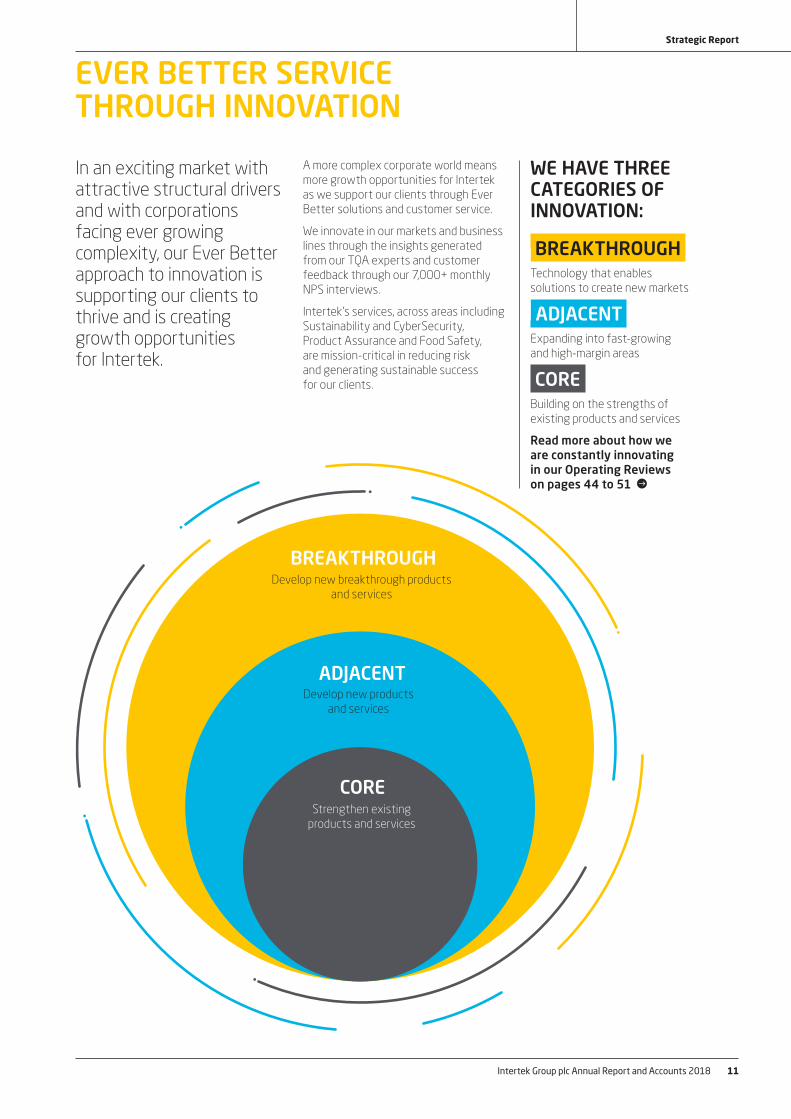
CHIEF EXECUTIVE OFFICER’S REVIEW
André LacroixChief Executive Officer
Ever Better, Ever Stronger Intertek with Total Quality Assurance.”
by 90%. This progress, combined with disciplined capital allocation, has delivered a strong ROIC of 22.7% between 2015 and 2018.
The strength of our results demonstrates the attractive growth opportunities in our industry, Intertek’s high-quality earnings model and the effectiveness of our 5x5 differentiated strategy for growth.
We are on a good-to-great journey and we firmly believe in continuous improvement to take Intertek to greater heights. Said differently, our Ever Better operational discipline is what makes Intertek Ever Stronger, every day.
The world of our clients is getting more and more complex and companies are increasing their focus on risk, which creates ever bigger growth opportunities for Intertek given our unique TQA value proposition that offers systemic end-to-end ATIC services.
Leveraging the ever bigger growth opportunities ahead with our Ever Better operational discipline in everything we do, we are confident in our ability to deliver sustained progress moving forward.
Building on our strengths, we see opportunities to make continuous progress to deliver sustainable shareholder value creation with our differentiated service offering fuelled by margin-accretive innovations; our customer-centric approach to sales management; our operational excellence discipline; our systemic margin and cash management; our end-to-end sustainability agenda and our deep engagement activities inside the organisation.
Intertek is going from strength to strength, making consistent progress on strategy and performance. We are benefitting from higher demand from our customers for global Total Quality Assurance solutions in our Products, Trade and Resources divisions.
In 2018 we have seen broad-based revenue growth acceleration with 3.7% organic revenue growth at constant rates with continuing robust performance in our Products division and performance improvement in Trade and Resources. The recent acquisitions in high-margin and high-growth areas performed well.
The Group has delivered a strong margin and free cash flow in 2018, with a diluted EPS growth of 7.7% at constant currency, being 1.6x faster than revenue, and a strong cash conversion of 126%. In line with our new dividend policy that targets a payout ratio of circa 50%, and fuelled by our high-margin and strongly cash-generative earnings model, we have announced a full year dividend of 99.1p, an increase of 39.0%.
We have made continuous progress since 2015, capitalising on our strengths and implementing our 5x5 differentiated strategy for growth.
We are offering our clients a superior customer service with our unique ATIC value proposition and we have grown our revenues and operating profit respectively by 34% and 49% between 2014 and 2018 enabling us to deliver an operating margin of 17.2%, a progression of 170bps during the period. Further, we have continued our working capital intensity and our free cash flow has increased
REVENUE
+1.2% +4.7%ADJUSTED OPERATING PROFIT
+3.0% +6.9%ADJUSTED OPERATING MARGIN
+30bps +40bpsADJUSTED EPS
+3.5% +7.7%WORKING CAPITAL
(20.7)%ADJUSTED FREE CASH FLOW
+3.9%DIVIDEND
+39.0%Read more about our financial performance on page 60
Actual rates Constant rates
Intertek Group plc Annual Report and Accounts 201814
Strategic Report | Chief Executive Officer’s review

We are confident that Intertek will continue to lead the industry through our Ever Better operational discipline approach, to make the company Ever Stronger.
A PURPOSE-LED ORGANISATIONEveryone inside the organisation is passionate about what we have already achieved, and we are now focused on making Intertek Ever Better, as we believe this is the way for Intertek to become Ever Stronger.
We are driven by a powerful and meaningful purpose – to bring Quality and Safety to life in a way that makes the world a better and safer place for everybody.
This is important to all our people, as having a meaningful and positive impact on existing and future generations and the future state of society is an enormous source of energy and a critical driver of engagement.
Intertek has a rich history having led the industry for more than 130 years and having contributed to the greater good of society by raising quality and safety standards across all industries.
We operate a decentralised operating culture putting the customer first with strong values that have been built step-by-step, and these values guide our behaviours every single day underpinning a high energy culture that connects every single colleague.
Our values are inspirational to all of us and enable us to make the right decisions to drive sustainable growth for All.
Our Values are:
• we are a global family that values diversity;
• we always do the right thing with precision, pace and passion;
• we trust each other and have fun winning together;
• we own and shape our future; and
• we create sustainable growth for All.
I will cover a range of areas in this year’s review, including:
• our views on how Quality Assurance is evolving, creating ever bigger growth opportunities for Intertek;
RESEARCH AND DEVELOPMENT
RAW MATERIALS SOURCING
CONSUMER MANAGEMENT
DISTRIBUTION AND RETAIL CHANNELS
MANUFACTURING
COMPONENT SUPPLIERS
TRANSPORTATION
Intertek Total Quality Assurance expertise, delivered consistently with precision, pace and passion,
enabling our customers to power ahead safely.
OUR TQA VALUE PROPOSITION • our 5x5 growth strategy positioning us as the world’s only global provider of truly integrated, end-to-end Assurance, Testing, Inspection and Certification (ATIC) services;
• our focus on innovation to accelerate growth as we help our clients resolve the increased complexities of their operations by taking a systemic risk-based approach to Quality Assurance ;
• how our Ever Better continuous improvement approach is making Intertek Ever Stronger with our Ever Better operational discipline; and
• how this is creating sustainable value for our shareholders.
EVER BIGGER OPPORTUNITIESFirst, let’s remind ourselves of the sheer scale of the market in which we operate. The global quality assurance market is considered to be worth approximately US$250 billion. Of this, we estimate that only 20 per cent is currently outsourced. That means there is an exciting opportunity to capture a share of the US$200 billion that is currently managed in-house.
The global trading landscape has changed considerably over the last 50 years, with the proportion of international trade rising from around 25 per cent in the 1960’s to almost 60 per cent of global GDP today. This major structural change has fundamentally altered how companies operate.
No longer do companies solely produce locally for local customers. Instead, corporations have embraced the value of opportunities provided by low-cost sourcing from across the world, enabling them to remain focused on their own core competencies.
While this has been beneficial, it has also brought about a significant increase in complexity for corporations in every industry, working with multi-tiered supply chains that expose them to increasing levels of risk and uncertainty.
At the same time, the rise of consumer-led demand in emerging markets, and the growth of e-commerce and other channels, have radically transformed sourcing and distribution chains too. And, with consumers seeking greater variety, better quality and faster delivery, risk has
Intertek Group plc Annual Report and Accounts 2018 15
Strategic Report

been heightened at every point of the value chain, from R&D, raw materials sourcing, component supply, manufacturing, transportation, distribution and retail to the point where a product enters the consumer’s hands.
The positive news for Intertek is that this phenomenon is driving demand from corporations in all industries across the world for quality assurance that is systemic. Having gained this insight some years ago, we are still the only global company that is truly leveraging this world-shift in the need for Testing, Inspection and Certification (‘TIC’) alone, to the additional demand for end-to-end Assurance (‘A’) that only our ATIC value proposition provides.
This is a vital step forward and Intertek has redefined the industry from TIC to ATIC. While TIC provides quality and safety controls in high-risk areas of a corporation’s activities, Intertek Total Quality Assurance additionally delivers an end-to-end assessment of its clients’ quality and safety processes. In this way, we help organisations address the complexity of what it takes to move towards a zero-failure rate in their operations. TQA is becoming mission-critical for our customers, and every conversation with them again reinforces the need for ATIC solutions.
So we see the market opportunity to be even greater than the US$250 billion, driven by new risks emerging from ever growing corporate complexity. Intertek is in pole position to attract a substantial share of the increasing TQA activity in which companies will need to invest during the years ahead. Our focus on the highest levels of customer service and our global network of more than 1,000 laboratories and offices and over 44,000 people in more than 100 countries will enable us to meet their needs and help them thrive in an increasingly complex world, no matter the continuing pace of change.
SEIZING THE OPPORTUNITIESTo capture this exciting growth opportunity, in 2015 we launched our good-to-great 5x5 strategy (see page 2). Its purpose is to move the centre of gravity of the Group towards the attractive growth and margin areas in the quality assurance market and deliver sustainable growth for All.
Our people are at the heart of our strategy. They deliver against our key priority of delivering superior customer service by living our values and customer-centric culture every day.
A highly important factor in achieving this is our unique, decentralised organisational structure with our people located in our 1,000+ laboratories across the world.
We ensure that our people are close to our customers, driving innovation from the frontline to ensure the solutions we provide are exactly what our customers and their customers need. This ensures that taking an innovative approach is embedded as an intrinsic part of our value proposition, which is truly exciting for our future.
The role of environmental, social and corporate governance (‘ESG’) in our own business is a fundamental aspect of this. It is core to everything we do, as is our ability to help our customers deliver against their own sustainability priorities. Critically, it matters to our people, it matters to our customers and of course, it matters to their end-consumers.
As a purpose-led company, sustainability is core to our business, enabling us to deliver value for all our stakeholders.
INTERTEK TQA SUPERIOR SERVICEIntertek’s business model offers systemic ATIC solutions across the three divisions of ‘Products’, ‘Trade’ and ‘Resources’, with each benefitting from its own set of structural growth drivers. These range from the expansion of supply chains within the Products division, to the increased focus on traceability in Trade and growth in alternative energy within Resources.
Moreover, no business today is immune to the increasing complexity of the operating environment in which we all work. It’s driven by the expansion of global trading relationships and supply chains, demand for higher quality and choice, increasingly vocal consumers on social media and growing regulatory demands. One of the most important drivers is a greater focus on sustainability, championed by a confident and ‘tech-savvy’ millennial generation.
Structural changes in sourcing and distribution mean that global organisations require expert assistance to navigate these challenges across their entire supply chain operations.
Intertek delivers a unique, systemic end-to-end approach to risk management, delivering TQA solutions across quality and safety processes, including assuring the training and performance of people. Today, systemic end-to-end ATIC solutions are becoming increasingly essential for companies everywhere as they seek to control risk at every point of the value chain. The attractive structural drivers underpinning our business, combined with the growing complexity facing our customers, together form the basis of what is a truly exciting opportunity to deliver margin-accretive revenue growth based on GDP+ organic growth over the mid- to long-term.
And the pace of change will continue to accelerate. Developments such as artificial intelligence (‘AI’), the internet of things (‘IoT’), blockchain, the sharing economy, autonomous and electric vehicles, the growing middle classes, ageing populations and much more are all forcing companies to adapt. Risk will grow at the same accelerating rate.
Growth in new products drives quality risks. For example, analysis of trends over more than 20 years in the US shows that there is a 90 per cent correlation between the number of new vehicles launched and the number of vehicles recalled. The same is happening in other industries – in every country across the world, the rising rate of hacking is the main driving force behind increased data breaches. And safety concerns in the food industry are also growing fast, from allergic reactions caused by unlisted ingredients to deliberate food sabotage.
To add further to forces like these, the relentless pressure on businesses to launch new products and services to meet burgeoning demand is causing many organisations to launch new product lines without adequate operating systems or checks and balances in place. New and
CEO'S REVIEWcontinued
Our focus is on making further progress on all fronts, with an Ever Better approach to what we do, every day, to make us Ever Stronger.”
Intertek Group plc Annual Report and Accounts 201816
Strategic Report | Chief Executive Officer’s review

IDEATE
EVALUATE
DEVELOP
PILOT
SCALE-UP
KAIZEN
INSIGHT
1
2
3
4
5
6
7
innovative products require new and innovative TQA solutions.
This is one area where our focus on innovation really counts – identifying new requirements and creating solutions, often before our customers are aware of the need.
Our unique, end-to-end, systemic approach to quality assurance, delivered through our global laboratory network, is helping corporations to mitigate these and many other causes of risk. Our constant focus on innovation to address existing and future risks is at the heart of our ability to mitigate new risks on the horizon.
LEADING CUSTOMER INSIGHTS The real fuel for innovation is insight – deeply understanding what our customers need and want – to drive our new ATIC solutions. It’s to develop this insight that we are such avid users of data, with the ability to access world-class customer intelligence site-by-site from anywhere across our global network.
We are obsessed with understanding our customers’ needs and how we can deliver Ever Better solutions to meet their developing requirements. To achieve this, we carry out 7,000+ customer interviews every single month. Every day, I and all members of our senior management team receive an email containing real-time customer feedback from around the world. And we actively use this feedback to continuously improve the services we deliver.
I am also determined that at a senior level we gain first-hand understanding of our customers and our people who most regularly interact with them. This is why I spend around 50% of my time in the markets where we operate, meeting our customers and our TQA experts, and the other 50% participating in performance reviews to maximise our knowledge and understanding.
We are constantly harnessing our customer insights and data to drive innovative solutions.
THRIVING THROUGH INNOVATIONIntertek, always the pioneer, has led the industry with our TQA value proposition. Now, increasing corporate complexity is presenting opportunities for us to accelerate our growth by delivering our ATIC services to our customers with innovative solutions for today and tomorrow.
Intertek has a proven track record of using insight and innovation to anticipate the growing needs of our clients, and this approach forms the bedrock of our entrepreneurial culture. So important, that during 2018 we have appointed a Chief ATIC Innovation Officer and are running a company-wide focus on innovation for the whole of 2019 and beyond.
Our considered and focused approach to innovation uses a three-tiered method, working alongside our internal seven-step ATIC innovation process, which helps us to accelerate our growth.
First, in what we call our ‘Core’ focus, we seek to build on the strengths of our existing products and services, ever improving them for our existing markets and customers. Secondly, we aim to develop new products and services for rapid-growth, high-margin markets that are ‘Adjacent’ to those we already serve. Thirdly, we aim to create ‘Breakthrough’ products and services that enable us to create new attractive markets and target emerging customer needs.
Across all three areas, we work closely with our customers, often face-to-face, to scope and develop new solutions that better serve their needs. Let me provide some examples.
Recent developments to our Core offering include innovations in our Resources
THE SEVEN-STEP ATIC INNOVATION PROCESS
Generate some great new ideas
What can you do with these ideas?
How will it work?
How can you make it happen?
Prove your ideas work in the real world
Let’s make this happen!
Continually evolve and improve your idea
Our global network of sustainability experts helps customers achieve their sustainability goals. Read more on page 22
Intertek Group plc Annual Report and Accounts 2018 17
Strategic Report

sector. In one, we have brought together technologies including 3D laser scanning and non-destructive testing to create Intertek DeepView 3DTM, a new solution that radically reduces the time and costs involved in inspecting safety-critical equipment in the offshore industries. See page 51 for details.
Another innovation from the Core is Intertek PipeAware, our unique pipeline quality verification solution, which offers pipeline owners and operators traceability and easy access to the inspection, testing and material data needed to make informed decisions that ensure pipelines operate safely and efficiently.
Extending our TQA reach, Intertek’s Voice of the Customer leverages our customers’ consumer feedback to create holistic product assurance plans, addressing safety, quality and perception concerns with actionable insights.
As a purpose-led company, sustainability is core to our business, enabling us to deliver value for all stakeholders. It is because of this that one of the Adjacent innovations we launched during the year was our sustainability service offerings, under one Sustainability brand, where our global network of experts help our customers to manage risk. We not only provide valuable insight into companies’ current sustainability needs, we also identify emerging trends, enabling our customers to move towards a ‘circular economy’ model, reducing any negative social and environmental impacts and mitigating reputational risk.
As IoT transforms the world in which we live, in the area of product network security, our Intertek ‘Connected World’ proposition addresses the emerging security risks and performance challenges of today’s sophisticated networks throughout the product life cycle. Additionally, our cybersecurity services address growing cyberthreats as part of our systemic approach to risk mitigation. See page 47 for more details.
As supply chains and distribution channels become increasingly complex, driving employee operational excellence is becoming increasingly challenging for organisations. During the year, we made a key acquisition (Alchemy) in the emerging area of ‘People Assurance’, enabling us to leverage our existing Assurance expertise and global scale to close critical skills-gaps through training, engagement and cultural reinforcement among clients’ frontline employees across the world. See details on page 45.
We are truly excited about the potential of People Assurance as a high-quality service with scalable solutions that can be rolled out across many different industries and geographies.
So, innovating to help our customers reduce risk by managing complexity more easily is at the heart of our growth plans, enabling us to pursue our strategy of shifting the Company’s centre of gravity to high-growth, high-margin markets. Over the last three years, this has involved massive growth in excess of 100 per cent in the Assurance side of our business, from 10 per cent of our total revenue in 2015 to 16 per cent of revenue in 2018. This is where we have delivered the majority of our organic growth – the touchstone by which we measure our progress.
We have also seen our Products division grow as a proportion of our business overall, to a point where today it is responsible for generating some 60 per cent of our revenues and around 75 per cent of our profits. It is one of the fundamental strengths of the Group.
But our core strength is, and always will be, the way in which our people combine passion and innovation with customer commitment to create a single unbeatable asset. This is a vital element of our entrepreneurial, customer-centric culture, and we do everything we can to nurture it across the organisation.
ACCRETIVE PORTFOLIO MANAGEMENTOur 5x5 strategy focusing Intertek’s centre of gravity on high-margin, high-return sectors drives our margin-accretive approach to portfolio management, guiding where we invest for growth. We categorise these areas as four key strategic priorities:
• First, to grow those scale businesses, such as Softlines, Hardlines and Electrical, where we are already market leaders. The scale involved means any increase in penetration is a powerful driver of profitability.
• Next comes a set of businesses from which we see our fastest growth emerging in the next few years, including Business and People Assurance, Food, Connected World and Sustainability.
• Third, in all corporations there will be businesses where there is room for improvement. Due to the current phase of the Resources cycle, our Industry Services operations are focused on improving revenue and margin.
• Our M&A focus is targeted tightly on companies with attractive growth and margin prospects, strong IP and market positions and a highly cash-generative business model. Since 2015, acquisitions have added more than £300 million to Intertek’s annual revenues and given us ownership of several sector-leading innovations that we are now bringing to a wider market.
We underpin our approach to portfolio management with our highly disciplined and systemic approach to performance management, targeting leading and lagging indicators. It addresses a range of key financial metrics, from revenue growth, margin and customer profitability to capital allocation and investments in growth. Our operational metrics include particularly powerful leading indicators, like marketing leads, customer retention and customer acquisitions.
EVER BETTER OPERATIONAL DISCIPLINE Across every area of the business, we are on a journey of constant improvement. We have made consistent progress in 2015, 2016, 2017 and 2018 across our product and service offering, sales, cash and margin management and in our operational excellence.
Our ‘good-to-great’ journey driven by our 5x5 growth strategy is on track but we are not stopping there.
With plenty in reserve, our focus is on continuously improving and making further progress on all fronts, leveraging the tremendous growth opportunities across our divisions with an Ever Better approach to what we do, every day, to
Read more on our Alchemy acquisition on page 45
CEO'S REVIEWcontinued
Intertek Group plc Annual Report and Accounts 201818
Strategic Report | Chief Executive Officer’s review

make us Ever Stronger: our differentiated service-offering with margin-accretive innovations; a customer-centric approach to sales with our unique ATIC offering ; continuous progress in operational excellence, value creation opportunity in margin and cash management, an innovative approach to sustainability and an exciting growth agenda for all of our colleagues.
Becoming an Ever Better, Ever Stronger business is only possible through continuous improvement and innovation across every facet of the business. It is this mentality which unites everyone at Intertek towards achieving the common goal of making the world a better and safer place. We have made good progress along this path and the future is even more exciting, as we leverage growth opportunities to enable our clients to power ahead with total peace of mind.
A HIGH-QUALITY EARNINGS MODELThat brings me to the very core of what makes us so successful – our high-margin, strongly cash-generative earnings model, based on the delivery of our unique TQA value proposition. Our ability to profitably deliver ATIC services to customers operating in the structurally attractive Products, Trade and Resources economic sectors is based on our capital-light business model and entrepreneurial culture, which enable us to respond quickly to new growth opportunities.
To maximise returns, we continue to invest in margin-accretive innovation as we have discussed, which is driving GDP+ organic revenue growth across the Group in real terms. As a result, our adjusted operating margin and free cash flow are both growing substantially, while working capital as a percentage of revenue is reducing. Particularly pleasing is our adjusted return on invested capital where our progress is excellent.
We will invest in organic growth and acquire businesses with strong growth and margin prospects. At the same time, we will continue our policy of making index-leading shareholder returns and focus on delivering a balance sheet with the flexibility we need to meet our ambitions.
AN EVER STRONGER INTERTEKI am pleased that after three years on our good-to-great journey, we are on track both in terms of performance and
strategic progress having delivered sustainable shareholder value and having established a leading position at the forefront of the world’s growing market for systemic, end-to-end TQA services.
The growth prospects ahead are truly exciting and the increased focus of corporations on risks to deliver sustainable performance is creating ever bigger growth opportunities for our TQA services.
Our 5x5 strategic goals represent the pillars underpinning our priorities as we move forward in our industry.
Our core purpose of bringing Quality and Safety to life will be achieved through our fully engaged employees whose entrepreneurial spirit is able to flourish.
We will provide a superior ATIC customer service by harnessing our global laboratory network, effectively enabling our innovators and technicians to become a global network of subject matter experts.
Delivering margin-accretive revenue growth will enable us to maintain our outstanding record of delivering strong returns for our shareholders.
Our strong cash conversion from operations and systemic working capital management, underpinned by the Group’s highly cash-generative earnings model will deliver strong returns.
Through our accretive, disciplined capital allocation policy, we will continue to seek out and secure acquisition targets that are providing breakthroughs in areas that interest our customers, which we can scale up to offer through our global operations.
The growth prospects ahead for all stakeholders are highly energising and we are truly excited about our good-to-great journey ahead.
We are confident that Intertek will continue to lead the industry with our unique TQA services.
We are committed to delivering sustainable value creation with our Ever Better operational discipline making the company Ever Stronger.
André LacroixChief Executive Officer
Read more about how we are supporting our customers with our innovative ATIC solutions.
PRODUCTSRead more on page 44
TRADERead more on page 48
RESOURCESRead more on page 50
INNOVATING ACROSS OUR BUSINESS
Intertek Group plc Annual Report and Accounts 2018 19
Strategic Report

EXECUTIVE MANAGEMENT TEAM
1 André Lacroix Chief Executive Officer
See full biography on page 74
2 Ross McCluskey Chief Financial Officer
See full biography on page 74
3 Diane Bitzel Chief Information Officer
Joined Intertek in May 2018 as Chief Information Officer. Diane has over 22 years of global management experience, particularly in the areas of IT strategy, operations and management, HR transformation, and business strategy and process implementation. Diane’s previous roles include CIO for global life science and food companies including Syngenta AG, Apetito AG and Lonza Group, as well as a senior leader in management consulting for leading organisations including Capgemini. Diane has a MSc in Maths, a PhD. from Heidelberg University and an MBA from Bocconi University.
4 Ann-Michele Bowlin Chief ATIC Innovation Officer
Joined Intertek in 2009. Ann-Michele leads Intertek’s ATIC Global Innovation Strategy. She was previously Chief Information Officer, responsible for IT business processes, infrastructure and cybersecurity. She joined Intertek from Ernst & Young consulting where she led shared services transformation programmes. Prior to Ernst & Young, Ann-Michele held leadership and operations roles in technology companies, including Hotels.com, and in the manufacturing and services sectors.
5 Alex Buehler Executive Vice President,
Global Resources
Joined Intertek in 2017. Alex has responsibility for Global Resources, comprising our business lines of Industry Services and Minerals. Prior to joining Intertek, Alex was President and CEO of Energy Maintenance Services (‘EMS’) and before this held senior executive management positions at Energy Recovery and Insituform Technologies, Inc. (now Aegion Corporation) in both the US and Europe. Alex has a BSc in Civil Engineering and an MBA in Finance.
5
10 11
1
7
12
2
8
3
9
4 6
1413
Intertek Group plc Annual Report and Accounts 201820
Strategic Report | Executive Management Team
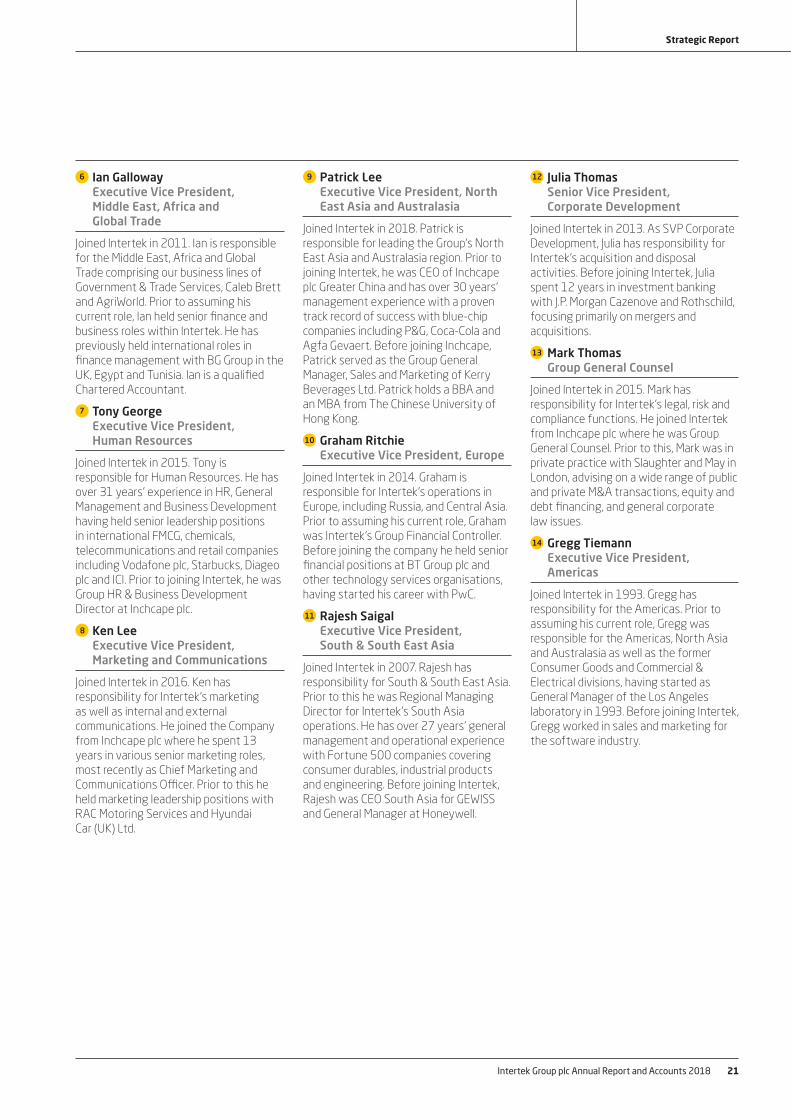
6 Ian Galloway Executive Vice President,
Middle East, Africa and Global Trade
Joined Intertek in 2011. Ian is responsible for the Middle East, Africa and Global Trade comprising our business lines of Government & Trade Services, Caleb Brett and AgriWorld. Prior to assuming his current role, Ian held senior finance and business roles within Intertek. He has previously held international roles in finance management with BG Group in the UK, Egypt and Tunisia. Ian is a qualified Chartered Accountant.
7 Tony George Executive Vice President,
Human Resources
Joined Intertek in 2015. Tony is responsible for Human Resources. He has over 31 years' experience in HR, General Management and Business Development having held senior leadership positions in international FMCG, chemicals, telecommunications and retail companies including Vodafone plc, Starbucks, Diageo plc and ICI. Prior to joining Intertek, he was Group HR & Business Development Director at Inchcape plc.
8 Ken Lee Executive Vice President,
Marketing and Communications
Joined Intertek in 2016. Ken has responsibility for Intertek’s marketing as well as internal and external communications. He joined the Company from Inchcape plc where he spent 13 years in various senior marketing roles, most recently as Chief Marketing and Communications Officer. Prior to this he held marketing leadership positions with RAC Motoring Services and Hyundai Car (UK) Ltd.
9 Patrick Lee Executive Vice President, North East Asia and Australasia
Joined Intertek in 2018. Patrick is responsible for leading the Group's North East Asia and Australasia region. Prior to joining Intertek, he was CEO of Inchcape plc Greater China and has over 30 years' management experience with a proven track record of success with blue-chip companies including P&G, Coca-Cola and Agfa Gevaert. Before joining Inchcape, Patrick served as the Group General Manager, Sales and Marketing of Kerry Beverages Ltd. Patrick holds a BBA and an MBA from The Chinese University of Hong Kong.
10 Graham Ritchie Executive Vice President, Europe
Joined Intertek in 2014. Graham is responsible for Intertek’s operations in Europe, including Russia, and Central Asia. Prior to assuming his current role, Graham was Intertek’s Group Financial Controller. Before joining the company he held senior financial positions at BT Group plc and other technology services organisations, having started his career with PwC.
11 Rajesh Saigal Executive Vice President,
South & South East Asia
Joined Intertek in 2007. Rajesh has responsibility for South & South East Asia. Prior to this he was Regional Managing Director for Intertek’s South Asia operations. He has over 27 years’ general management and operational experience with Fortune 500 companies covering consumer durables, industrial products and engineering. Before joining Intertek, Rajesh was CEO South Asia for GEWISS and General Manager at Honeywell.
12 Julia Thomas Senior Vice President,
Corporate Development
Joined Intertek in 2013. As SVP Corporate Development, Julia has responsibility for Intertek's acquisition and disposal activities. Before joining Intertek, Julia spent 12 years in investment banking with J.P. Morgan Cazenove and Rothschild, focusing primarily on mergers and acquisitions.
13 Mark Thomas Group General Counsel
Joined Intertek in 2015. Mark has responsibility for Intertek’s legal, risk and compliance functions. He joined Intertek from Inchcape plc where he was Group General Counsel. Prior to this, Mark was in private practice with Slaughter and May in London, advising on a wide range of public and private M&A transactions, equity and debt financing, and general corporate law issues.
14 Gregg Tiemann Executive Vice President,
Americas
Joined Intertek in 1993. Gregg has responsibility for the Americas. Prior to assuming his current role, Gregg was responsible for the Americas, North Asia and Australasia as well as the former Consumer Goods and Commercial & Electrical divisions, having started as General Manager of the Los Angeles laboratory in 1993. Before joining Intertek, Gregg worked in sales and marketing for the software industry.
Intertek Group plc Annual Report and Accounts 2018 21
Strategic Report

Intertek Group plc Annual Report and Accounts 201822 Intertek Group plc Annual Report and Accounts 201822
Strategic Report | Sustainability report – Solutions for a better world
SOLUTIONS FOR A BETTER WORLD
Our sustainability priorities aligned with our 5x5 differentiated strategy for growth.
As a Total Quality Assurance provider, we are in a strong position, given our global scale and expertise, to support the sustainability objectives of our customers with our industry-leading Sustainability value proposition. Whilst supporting our clients, we are also focused on generating a positive impact for our stakeholders – the communities in which we operate, our customers, our people, our investors, and our suppliers. Our objective is to create sustainable growth for all.
OUR PURPOSEBRINGING QUALITY
AND SAFETY TO LIFE
OUR VISIONTO BE THE WORLD'S
MOST TRUSTED PARTNER FOR QUALITY
ASSURANCE
OUR VALUES
WE OWN AND SHAPE
OUR FUTURE
WE ALWAYS DO
THE RIGHT THING WITH PRECISION,
PACE AND PASSION
WE ARE A GLOBAL FAMILY THAT VALUES
DIVERSITY
WE TRUST EACH OTHER
AND HAVE FUN WINNING
TOGETHER
WE CREATE SUSTAINABLE
GROWTH FOR ALL

Intertek Group plc Annual Report and Accounts 2018 23
Strategic Report
Intertek Group plc Annual Report and Accounts 2018 23
Strategic Report
OURSUSTAINABILITY
PRIORITIES
1SUPPORTING OUR CLIENTS’
SUSTAINABILITY PRIORITIES
2POSITIVE IMPACT ON OUR PEOPLE, SUPPLIERS AND COMMUNITIES
3COMPREHENSIVE NON-FINANCIAL
ESG KPIS
4ALIGNING TO THE UN SUSTAINABLE
GOALS
5CORE TO
EVERYTHING WE DO
OUR SUSTAINABILITY BRANDOur integrated global services mean Intertek is uniquely placed to help organisations understand, achieve and validate their existing and emerging sustainability goals.
OUR STAKEHOLDERS
OUR INVESTORS
OUR CUSTOMERS
OUR PEOPLE
OUR COMMUNITIES
OUR SUPPLIERS

Intertek Group plc Annual Report and Accounts 201824 Intertek Group plc Annual Report and Accounts 201824
Strategic Report | Sustainability report – Solutions for a better world
OUR TQA VALUE PROPOSITION
world. We are passionate about progressing our sustainability agenda as well as helping our customers progress their own sustainability agendas.
We are proud to lead the global quality assurance industry responsibly, energised about how we contribute to society, and how what we do at Intertek positively impacts everyone’s lives today - and the lives of those that will follow.
Making the world a better and safer place is what guides us every single day. True to our Ever Better discipline, we are deeply committed to minimising our environmental impacts, to operating with integrity by doing business the right way, and to pursuing our corporate social responsibility (CSR) activities
SUSTAINABILITY REPORT
through living our strong values everyday everywhere.
In our 2018 report, we share how our dedicated colleagues around the world work passionately to make significant progress on the sustainability priorities we articulated last year.
Furthermore, we share how, through our global network of sustainability experts, clients have come to rely on us to help them understand, achieve and validate their own sustainability goals, both existing and emerging.
As the world’s only complete Total Quality Assurance (TQA) solution provider, Intertek is ideally positioned to support its customers’ sustainability priorities by helping them manage and mitigate risk, operate effectively and act responsibly across their global operations.
Our customers trust us to evaluate the quality, safety and sustainability of their products, operations and services which helps them protect their brands and gain competitive advantage.
This is particularly important to me, as creating sustainable growth for all is one of our core values and is the guiding principle we pursue on a daily basis to bring quality, safety and sustainability to life inside the operations of our clients.
SUSTAINABLE SOLUTIONS FOR A CHANGING WORLDAs new risks emerge in a fast-changing and increasingly complex world, we continue to seek and explore new and innovative ways of helping customers improve the quality, safety and sustainability of their products and services.
At Intertek, our purpose is to make the world a better and safer place by bringing quality and safety to life. This is the true meaning of what we stand for.
‘Doing business the right way’ is core to our differentiated 5x5 strategy that creates sustainable value and growth opportunities for all our stakeholders - our clients and their customers, our employees, our investors, and the communities across the world where we operate.
Sustainability is truly important for our people and Intertek operations around the
2 POSITIVE IMPACT ON OUR PEOPLE, SUPPLIERS AND COMMUNITIES
1 SUPPORTING OUR CLIENTS’
SUSTAINABILITY PRIORITIES
5 CORE TO
EVERYTHING WE DO
4 ALIGNING TO THE UN SUSTAINABLE
GOALS
3 COMPREHENSIVE NON-FINANCIAL
ESG KPISOURSUSTAINABILITY
PRIORITIES
André LacroixChief Executive Officer
We are a purpose-led organisation where sustainability is at the heart of what guides us every single day.”

Intertek Group plc Annual Report and Accounts 2018 25
Strategic Report
Intertek Group plc Annual Report and Accounts 2018 25
Strategic Report
During 2018, new regulatory developments created the need to develop innovative sustainability solutions based, for instance, on the announcement by the UK Government of a new mandatory Streamlined Energy and Carbon Reporting (SECR) framework; the heightened prevalence of ‘duty of care’ legislation in France; and the newly updated California Proposition 65 List of restricted chemicals.
Over recent years, sustainability issues have dramatically grown in importance as drivers of consumer choice. In fact, according to research from Nielsen, 73% of global millennials are willing to pay a price premium for sustainable offerings.
Within this broad context, we have deepened our focus inside the organisation and I am proud about the excellent progress on all aspects of our sustainability agenda in 2018, based on the five priorities we defined last year.
1 Supporting our clients’ sustainability priorities
We have launched a global Intertek Sustainability brand to improve the awareness of our industry-leading sustainable solutions. We recognise the need for the customers of our clients to be sure about the sustainability of products and services they buy and we have developed a set of Intertek Sustainability certification marks. We launched our first Sustainability marks – Clean Air certification and Zero Waste to Landfill certification – in September 2018 (see customer story on page 27).
2 Positive impact on our people, our suppliers and communities
Our sustainability agenda is very energising for our colleagues and the progress we have made is commendable: we have broadened our company-wide network of Sustainability Champions; we have rolled-out globally our ‘10X Way!’ training programme to accelerate the growth of our people; we have reported on our UK gender pay gap for the first time; we have seen good progress on our health and safety monitoring and during my visits around the Group I have been inspired by the quality of our local community activities.
3 Comprehensive non-financial ESG KPIs
In our 2017 Sustainability Report, we showed how sustainability is embedded
into our Group strategy. We have improved our environmental reporting which enabled us to improve our Investor Relations engagement activities with institutions that pursue sustainable investment strategies. We also benchmarked our environmental, social, governance (ESG) performance and we were delighted to be recognised by the MSCI, with a rating of AAA.
4 Aligning to the UN Sustainable Development Goals (UN SDGs)
Measuring progress on a regular basis is central to our company performance management approach based on factual leading and lagging indicators. We developed our reporting progress on the UN SDGs for our core Business Lines and Countries, effectively engaging employees and leaders with the appropriate ESG metrics.
5 Core to everything we doTo lead by example and ensure continuous progress, I chair our monthly Sustainability Committee and I receive regular reports on the progress of every sustainability priority, covering internal initiatives as well as the sustainability services we offer to our clients. Our Board is deeply engaged and kept up to date on our progress.
Each of our Countries and Business Lines define their own sustainability agendas, which are tied to our Group priorities and focused on their local operations and communities.
During 2018, we have broadened our network of Sustainability Champions across our Countries and Business Lines and we have encouraged our Sustainability Champions to focus on all aspects of our sustainability agenda, true to our Ever Better discipline.
In 2019 and beyond, we will continue to deliver progress on our own sustainability agenda – and to help our clients progress on theirs.
We strongly believe that making the world better and safer by bringing quality, safety and sustainability to life is the true meaning of what we stand for.
André LacroixChief Executive Officer
IN THIS SECTION:
Strategic Report
OUR SUSTAINABILITY VALUE PROPOSITIONRead more on page 26
Supporting our customers’ sustainability needs with our industry-leading sustainability value proposition
OUR PEOPLERead more on page 28
Ensuring our people are engaged, inspired, energised and working in a safe environment
OUR COMMUNITIESRead more on page 32
Engaging and partnering with the local communities in which we operate
OUR ENVIRONMENTRead more on page 34
Demonstrating our commitment to reducing the environmental impact of our operations
TRACKING OUR PROGRESS WITH THE UN SDGSRead more on page 40
Demonstrating our alignment with the United Nations Sustainable Development Goals
OUR SUSTAINABILITY GOVERNANCE Read more on page 42
Making continuous progress in sustainability through an appropriate organisational focus

Intertek Group plc Annual Report and Accounts 201826 Intertek Group plc Annual Report and Accounts 201826
Strategic Report | Sustainability report – Solutions for a better world
OUR SUSTAINABILITY VALUE PROPOSITION
SUPPLY CHAIN RESILIENCE
EXTENDED PRODUCERRESPONSIBILITY
LIFE CYCLE ASSESSMENT
VOC CERTIFICATION
INGREDIENTTRANSPARENCY
AUDITING
ENVIRONMENTAL TESTING
REPORTING & DATA ASSURANCE
RESPONSIBLE SOURCING
ECO-LABELLING &RECYCLABILITY
GLOBAL SUSTAINABILITY
SERVICES
TOTAL QUALITY. ASSURED.
ATIC solutions extending beyond quality and compliance to deliver sustainable solutions for every industry.
ASSURANCEIntertek’s sustainability assurance services offer a solutions-driven and holistic approach to adoption of increasingly prominent environmental, social and economic best practices.
TESTINGIncreased scrutiny and demand for transparency and safety of products, food, chemicals, packaging and processes has led to the necessity for testing and analysis services that support and validate sustainable claims.
INSPECTIONOur inspections help clients protect their financial, branding and legal interests throughout the value chain.
CERTIFICATIONIntertek’s certification and verification programmes help customers to ensure that their products, assets, processes and services meet leading standards and requirements.
Companies are increasingly facing challenges driven by growing complexities in their operations, sourcing, manufacturing and distribution. As consumers’ expectations of corporate responsibility evolve, demand is growing for Total Quality Assurance (TQA) solutions that enable organisations across a wide range of sectors to keep ahead of emerging sustainability requirements.
Through our global network of sustainability experts and integrated ATIC solutions, Intertek is uniquely placed to help organisations understand, achieve and validate their existing and emerging sustainability goals.
Our passion for the sustainability agenda, proven supply chain expertise, global network and on-the-ground local knowledge means we can give our customers increased transparency to help them manage the social, ethical and environmental risks in their processes
As the world’s only complete Total Quality Assurance provider, Intertek is ideally positioned to support its customers‘ existing and emerging sustainability priorities by helping them identify, manage and mitigate risk, operate effectively and act responsibly across their global operations.
and supply chains. At the same time, we support their ability to operate effectively and act responsibly.
In this section, we provide highlights of the ATIC sustainability solutions Intertek offers and specific programmes we launched in 2018 to address the needs of our clients.
We list full details of our sustainability value proposition on our website at www.intertek.com/sustainability/services.
Our customers trust us to ensure quality, safety and sustainability in their business, to protect their brands and to help them gain competitive advantage. We not only provide valuable insight into our clients’ current sustainability needs. We also identify emerging trends, enabling our customers to manage sustainability that is material to their business and to safeguard their reputation. Intertek’s TQA promise extends to our ATIC sustainability services, applicable to all industries and sectors.
INTEGRATED GLOBAL SUSTAINABILITY SERVICES
At Intertek our integrated global services offer everything our clients need to manage emerging sustainability requirements for products, assets, materials, processes and organisations.
Read more at www.intertek.com/sustainability

Intertek Group plc Annual Report and Accounts 2018 27
Strategic Report
Intertek Group plc Annual Report and Accounts 2018 27
Strategic Report
OUR SUSTAINABILITY BRAND We have offered sustainability services for over 20 years, and in June 2018, we officially unveiled our new Intertek Sustainability brand at the Sustainable Brands (SB’18) conference in Vancouver. This brand serves to communicate Intertek’s sustainability proposition to the market, helping our clients understand, achieve and validate their social and environmental goals.
The launch highlighted the strength of our existing ATIC sustainability services and provided a platform to introduce new programmes being developed to meet continuously evolving demands. Sustainability is core to our business and true to our Ever Better discipline. We are constantly evaluating and improving our own processes and initiatives, as well as the services we offer our customers.
An internal programme is in place to harness the power of Intertek’s global network of experts and maintain the consistency and quality of our sustainability services. In 2018, Intertek sustainability teams developed an internal and centralised location on our Group intranet to provide access to resources, templates and programmes. ATIC toolkits, describing sustainability services, have been developed across all Intertek Business Lines and are available to all colleagues to ensure we can connect customers to the support and services they need. Training of Intertek employees on existing and new sustainability services is underway, with continued emphasis throughout 2019.
SUSTAINABILITY SERVICES: SCIENCE-BASED METRICS AND MATERIALITYOur sustainability services are now integrated and delivered under the new Intertek Sustainability brand. These services support the growing demand from companies to measure, track, evaluate and report those sustainability metrics that are material to their business. Intertek enables clients to navigate reporting frameworks and evaluate data accordingly, whether for reporting or to meet reduction targets and regulatory requirements. For example, as part of its commitment to sustainability, Mitsubishi Electric Sales Canada (MESCA) retained Intertek to evaluate its Scope 1, Scope 2 and material categories in Scope 3 greenhouse gas (GHG) emissions for their entire product sales network.
SUSTAINABILITY CERTIFICATION MARKIn addition to the Sustainability brand, Intertek launched the Sustainability certification mark in 2018 to serve as the identifier of the Sustainability certification schemes we deliver through our innovative ATIC solutions.
SUSTAINABILITY CERTIFICATION MARK: CLEAN AIRFormerly known as ‘ETL Environmental VOC Certification’, Clean Air uses a global network of ISO 17025-accredited testing labs to validate the level of volatile organic compound (VOC) emissions from products such as flooring, furniture, drywall, paint and foam insulation.
One of the first programmes to be inaugurated into the new Intertek Sustainability mark, the Clean Air mark
responds to growing client demand for product testing solutions that support better indoor air quality. Manufacturer Purple Mattress uses the Intertek Clean Air certification mark to demonstrate that there are no emissions from its bedding products that may harm purchasers or their families.
SUSTAINABILITY CERTIFICATION MARK: ZERO WASTE TO LANDFILL Zero Waste to Landfill, a programme developed and executed through Intertek’s Business Assurance team, uses the Intertek Sustainability certification mark to help clients display their compliance with and their continued commitment to the programme. The Electrolux plant in São Carlos (Brazil) has achieved the highest-level certification (‘Zero Waste’) for diverting 99.9% of its waste from landfill. It is a proud adopter of the programme and the Intertek Sustainability certification mark.
ACQUIRING LEADING COMPANIES FURTHER STRENGTHENS CYBER SECURITY CAPABILITIESFollowing the acquisitions of Acumen and EWA Canada in 2017, Intertek further strengthened its cyber security capabilities during 2018 with the acquisition of NTA Monitor, a leading network security and assurance services provider that is based in the UK and Malaysia. This acquisition builds Intertek’s presence, both in the UK and globally, within the security assurance and certification market.
LOGO LOGO VERIFIED
ZERO WASTE TO LANDFILL
THIS PRODUCT WAS MANUFACTURED IN A ZERO WASTE TO LANDFILL
CERTIFIED FACILITY
CERTIFIEDCLEAN AIR GOLD
Sustainability brand launch

Intertek Group plc Annual Report and Accounts 201828 Intertek Group plc Annual Report and Accounts 201828
Strategic Report | Sustainability report – Solutions for a better world
OUR PEOPLE
We are focused on ensuring that our strategy and culture give our people the right platform, not only to grow and develop their careers, but also to be involved in socially responsible activities that support our purpose to make the world a better place by bringing quality and safety to life everyday.
Our 44,720 passionate Intertek people deliver sustainable value through unmatched expertise and quality of work for our customers globally and on a daily basis. They contribute to the success of our customers’ products, services and operations, enabling us to succeed in our vision of being the world’s most trusted partner for Quality Assurance.
To achieve this, our 5x5 differentiated strategy energises our people to take Intertek to new heights, to deliver our customer promise and live our values. We foster a company culture where our people are recognised for being inspired to find innovative ways of continually developing services and solutions for our customers.
In this section, we detail the ways in which we seek to engage and inspire our people, ensuring the frameworks are in place for them to succeed in a safe working environment and ultimately making them proud to work for Intertek.
Energising, inspiring and engaging our talented peopleTo seize the exciting growth opportunities arising from our Total Quality Assurance (TQA) value proposition, we continually invest in the growth of our people. We aim to hire, inspire, engage and retain the best people to power our 5x5 strategy, providing them with the skills to grow our business. With an Ever Better mindset we encourage them continuously to learn new skills that help them advance their careers and deliver our customer promise. Our talent-mapping process is critical to our future success in delivering our
strategy and fostering our culture and values throughout Intertek.
Training Following the successful launch of our ‘The 10X Way!’ training to Intertek leaders in 2017, we continued the global roll out of this unique programme to over 36,000 of our people in 2018. The content of the training workshops was based on internal feedback that identified the key development needs across the business, with a focus on delivering support, tools and skills to drive 10X Performance.
The continued roll out of the training across the entire organisation aims to ensure everyone has the tools, processes and principles to create sustainable growth for all. To supplement the face-to-face event, embed learning and consistently deliver the message, we also developed eLearning modules, available to all our 44,720 employees via our digital Learning Management System.
In order to further support a highly engaged and high-performing workforce of experts, we continue to embed our performance and growth conversation with ‘My 10X Journey’, which replaced our previous appraisal process. This transformational new development plan creates better quality conversations during performance reviews, helping to better clarify expectations, foster continual improvement and inspire individual progress.
In addition to ‘The 10X Way!’, we provide a range of in-house and external learning opportunities to provide employees with the skills and expertise they need to deliver our TQA brand promise. We operate across a wide range of sectors requiring different types of technical training, education and support, including apprenticeships and internship programmes, as well as college degrees and professional qualifications.
ROLLED OUT TO OVER
36,000INTERTEK COLLEAGUES
Sarah Administration
GrahamProject Support Leader
JincyOperations Coordinator Assistant
44,720EMPLOYEES

Intertek Group plc Annual Report and Accounts 2018 29
Strategic Report
Intertek Group plc Annual Report and Accounts 2018 29
Strategic Report
UK Living WageIn the UK, we were accredited in April 2018 as a Real Living Wage employer, in accordance with the guidelines of the Living Wage Foundation. We will continue to align our directly employed staff with the Real Living Wage UK, and are working towards aligning third-party contractor staff with the recommended guidelines.
INCLUSION, DIVERSITY AND GENDER EQUALITYTo live our values and be sustainable and inclusive global family that values diversity, we apply all employment policies and practices in a way that is informed, fair and objective. This covers all policies relating to recruitment, promotion, reward, working conditions and performance management.
Our inclusion and diversity policy eliminates discrimination to ensure that our employees are treated fairly, feeling respected and included in our workplaces. We are committed to maintaining the highest standards of fairness, respect and safety. We adhere to the principles of the UN Convention on Human Rights and the International Labour Organization’s core conventions.
We recognise the importance of gender diversity, not only in management but across all levels of our business. In line with the Hampton-Alexander Review, as well as supporting gender diversity on our Board, in June 2018 we contributed our data on the gender balance across our senior executive team and their direct reports:
2017 2018Male Female Male Female
Board 7 3 7 3
Executive ManagementTeam (Exec)
11 2 11 3
Direct reports (DR) 91 19 95 24
Combined: Exec + DR
102 21 106 27
Data submitted as at 30 June 2018.
We will continue to promote and endorse fair, consistent and thoughtful working practices that are in accordance with our values.
At Intertek, we are proud to be an equal opportunities employer. We consider all qualified applicants for employment regardless of gender, ethnicity, religion, age, disabilities and other protected characteristics.
We reach out to prospective employees in a variety of ways, depending on location and role, in compliance with local regulations for fair recruitment practices and equal opportunities. We post vacancies on our website (intertek.com/careers) and employ various ways of sourcing talented people. These include recruitment agencies, social media, printed advertisements, employee referrals, professional bodies and associations, schools, colleges and universities. To offer people career growth and progression within the Group, we seek wherever possible to fill vacancies from within the Company first.
UK GENDER PAY GAPThe gender pay gap measures the difference between the pay and bonuses of men and women across an organisation, irrespective of role and level of seniority. This is different to equal pay, which is the legal requirement to pay the same to men and women who are doing equal work. At Intertek, men and women are paid equally for doing equivalent roles.
Following the publication of our gender pay gap results in 2018, we committed to a number of measures to ensure we provide an energising workplace, free of any gender bias, where employees can flourish based on their talent and effort. To strengthen this, we ensure that our shortlists of external-hire candidates have a balance of gender diversity. We also provide flexible working where possible and provide mentorship to women to address the gap in gender numbers at senior levels. It is vital that our workforce represents the best available talent, reflects the communities in which we operate and is free of gender or other biases. We remain committed to equality.
Male
Female
12,437 20,893 11,390
9,044 3,393 12,185 8,708 7,753 3,637
Americas Asia EMEA (inc. Central)
INTERTEK TQA EXPERTS BY REGION
INTERTEK TQA EXPERTS BY GENDER
35% 65%
Male (28,982)
Female (15,738)
Intertek’s gender diversity reflects the industries and qualification profiles typical of individuals working in the countries and business lines in which we operate.
2016201520142013 2017 2018
42,45241,43438,40736,864 43,9062,5672,1662,0932,184 2,769
44,7202,801
Revenue (£m)
Headcount
REVENUE AND HEADCOUNT
WE OWN AND SHAPE
OUR FUTURE
WE ALWAYS DO THE RIGHT THING WITH PRECISION, PACE AND PASSION
WE ARE A GLOBAL FAMILY THAT VALUES
DIVERSITY
WE TRUST EACH OTHER
AND HAVE FUN WINNING
TOGETHER
WE CREATE SUSTAINABLE
GROWTH FOR ALL
OUR VALUES

Intertek Group plc Annual Report and Accounts 201830 Intertek Group plc Annual Report and Accounts 201830
Strategic Report | Sustainability report – Solutions for a better world
OUR PEOPLEcontinued
Ethics, integrity and professional conduct A vital part of ‘Doing Business the Right Way’ is our commitment to upholding the highest standards of integrity and professional ethics. This commitment is embedded in the Group’s culture through the integrity principles set out in our Code of Ethics (‘the Code’), available at www.intertek.com/investors/ governance/code-of-ethics. This also covers health and safety, anti-bribery, labour and human rights.
We have a culture in which all issues relevant to our professional conduct and our Code of Ethics can be raised and discussed openly without recrimination. We operate a strict zero-tolerance policy regarding any breach of our Code of Ethics and any behaviour that fails to meet our expected standards of integrity as a trusted leader in the quality assurance industry.
To support this policy in action, all people working for, or on behalf of Intertek are required to sign our Code of Ethics upon joining the Company or before commencing work on our behalf. This confirms their acceptance of the high standards expected of them in all business dealings. The Code sets clear expectations that people working for our business must act at all times with integrity and in an open, honest, ethical and socially responsible manner.
Intertek employees or people acting on Intertek’s behalf are responsible for
DOING BUSINESS THE RIGHT WAYOur vision to be the world’s most trusted partner for Quality Assurance is at the heart of everything we do at Intertek. We can only deliver that vision if we operate with integrity to maintain the trust and confidence of all of our stakeholders, including our shareholders, our customers, our people and the communities and environment in which we operate. Integral to this is ‘Doing Business the Right Way’; our internal risk, control, compliance and quality programme.
At Intertek, ‘Doing Business the Right Way’ means living our values, having the highest standards of ethics and integrity in how we conduct ourselves every day, everywhere and in every situation. The programme includes processes, tools and training to ensure that:
• our people work in a safe and inclusive environment,
• the services we provide and the contracts we enter into are delivered with integrity and in line with our commitment to Total Quality,
• every colleague commits to the highest standards of professional conduct; and
• we deliver sustainable growth by managing our risks and doing the right thing for the longer term.
applying the Code in their own job role, their part of the business and location.
To support their continuing understanding, all of our people are required to complete our comprehensive online ‘Doing Business the Right Way’ training course annually. This training covers the Code and other important professional conduct areas, such as data security and operational controls. When completing the training, all employees are required to sign a certificate confirming their understanding that any breaches of the Code will result in disciplinary action that may include summary dismissal of the employee concerned.
Whistleblowing hotline To empower our people and stakeholders to voice any concerns about breaches of the Code or of any of our policies (including our Labour and Human Rights Policy and Modern Slavery Policy), we have a well-publicised hotline which can be used by all employees, contractors and others representing Intertek, or by third parties such as our customers or people who are affected by our operations.
This whistleblowing hotline is run by an independent, external provider. It is multi-language and is accessible by phone and by email to all employees 24 hours a day. Those concerned are encouraged to report any conduct, compliance, integrity or ethical concerns using the hotline. Information posters are present in all of our sites.
Intertek ensures that our colleagues are fully engaged in a safe working environment

Intertek Group plc Annual Report and Accounts 2018 31
Strategic Report
Intertek Group plc Annual Report and Accounts 2018 31
Strategic Report
2018 2017 % change
Hazard Observation 9,155 7,758 18%Near Miss 2,207 2,544 (13)%First Aid 1,094 874 25%Lost time incidents 137 104 32%Medical treatment incidents 149 180 (17)%Fatalities 1 1 –Total recordable incident rate (TRIR)* 0.65 0.70 (5)bps
* Rates refer to the number of lost time incidents (LTIs), medical treatment incidents (MTIs) and fatalities occurring per 200,000 hours worked.
Note: Overall total recordable incidents (TRI) increased by 2, but would have shown a reduction in like-for-like reporting. In 2018 we have included data for our acquired environmental service company, ABC Analitic.
If a report is made to the hotline, it is followed up by Intertek’s Compliance officers. Our Group Compliance function, which is independent of our operational businesses and reports directly to our Group General Counsel, fully investigates all reports received. Provided there is no conflict of interest, all reports are also notified immediately to our Group Ethics & Compliance Committee, which consists of our CEO, CFO, EVP for HR and Group General Counsel. This ensures the effective resolution both of individual issues and of any systemic or process improvements that can be made to address them.
During 2018, 158 reports of non-compliance with the Code were made to our hotline. Of those reports, 45 were substantiated and required remedial action. Of those substantiated claims:
• there were no substantiated grievances relating to human rights, labour practices or societal impact breaches;
• there were no environmental incidents;
• there were no reported violations of the rights of indigenous people; and
• there were no cases of discrimination.
HEALTH AND SAFETYA key corporate goal is to ensure that our people are fully engaged in a safe working environment. Managing the health, safety and welfare of our people, clients and third parties connected with the business is therefore a top priority for us. Intertek is committed to the continuous review and improvement of its health and safety performance and works towards achieving zero incidents.
During 2018 we aligned our recent acquisitions’ Health and Safety (H&S) processes with our own to ensure complete visibility of H&S incidents across
the Group. We also implemented further H&S processes, enabling all Intertek sites to report and track relevant activities with our updated Global H&S Platform.
In 2018, we continued to grow the number of proactive Hazard Observations we recorded, broadening engagement across all countries and achieving an overall reduction in our total recordable incident rate (TRIR) of 5bps. It is encouraging that our TRIR continues to reduce year on year.
We believe our move to proactive reporting of Hazard Observations has led to improved health, safety and environmental (HSE) awareness at our locations, resulting in incidents previously recorded as ‘Near Miss’ being more accurately recorded as Hazard Observations. We believe that the increases seen in First Aid incident reporting are also linked with greater awareness and reporting overall. First Aid is a very clear type of incident and is now being reported more comprehensively.
We are constantly improving our tracking and reporting. During 2018, we improved the time for reporting and reviewing incidents, meaning that we can respond more quickly and avoid future issues earlier. Our monthly reporting is now enhanced and richer, including ratios of Hazard Observations with relation to employee headcount for example. Sadly, one fatality was recorded in China. This occurred when a project manager fell down a hoisting shaft on a construction site.
We go to great lengths to train all our employees on health and safety matters, including as part of our induction process emergency response procedures, intervention and reporting of accidents, incidents and near misses. Where relevant, all employees and contractors are provided with personal protection equipment when performing work for the Company.
To ensure that we can operate safely, there is a dedicated fire warden, first-aider and health and safety representative at each Intertek location. These representatives are empowered not only to investigate incidents and implement preventative and corrective actions, but also to disseminate safety information through training and continual improvement programmes to target identified specific areas of concern.
SUPPORTING OUR CLIENTS IN HEALTH AND SAFETYPeople Assurance servicesIn 2018, Intertek expanded its People Assurance services with the acquisition of Alchemy Systems, a leading Software-as-a-Service (SaaS) company.
Alchemy offers software learning and compliance solutions for the food industry. In a world of increasingly complex supply chains and distribution channels, employees are key in driving operational excellence in multi-site organisations. There is therefore a growing demand for bespoke People Assurance solutions to identify, monitor and efficiently close critical skills gaps among frontline employees. These solutions offer an efficient and innovative platform to help our clients achieve their sustainability goals, especially in food safety and workplace safety and compliance.
17%REDUCTION IN MEDICAL TREATMENT INCIDENTS
Intertek is committed to the continuous review and improvement of its health and safety performance and works towards achieving zero incidents.”

Intertek Group plc Annual Report and Accounts 201832 Intertek Group plc Annual Report and Accounts 201832
Strategic Report | Sustainability report – Solutions for a better world
OUR COMMUNITIES
Creative Day for Social Good in Canada
Supporting rural schools in Turkey
CSR event to support the elderly in Hong Kong
The role we play in supporting more sustainable communities in which we operate is vital to the success of our business. Fostering good relationships provides benefits beyond reputation, in areas including recruitment, local education and engagement. This is because our passionate and dedicated colleagues are proud of improving the lives of the people and communities around them.
In this section, we have selected some examples from across the world to show how our passionate Intertek colleagues have engaged with and supported local communities during 2018.
CANADA: CREATIVE DAY FOR SOCIAL GOOD – ALCHEMY SYSTEMSIntertek’s newly acquired People Assurance business Alchemy Systems, in partnership with Capacity Canada, Conestoga College, Him & Her, Manulife Financial and the local creative community, provides free marketing communications work to charities from across Canada through Creative Day for Social Good (CD4SG).
CD4SG brings together teams of art directors, writers, account managers and other creative professionals who donate their time for two days. They guide graphic design and public relations students from Conestoga College through the professional creative process.
HONG KONG: SUPPORT CLIENT’S CHARITY EVENTAlthough Hong Kong is one of the wealthiest cities in the world, income disparity is increasing and the city’s wealth gap is at its widest in 45 years. Our colleagues at Intertek in Hong Kong were happy to join their client, A.S. Watson, in taking time to visit elderly care homes. Everyone who took part is proud to have had the opportunity to assist people in need and take part in a valued client’s key charity event.
HONG KONG: ACTION TO RECYCLE PLASTIC WASTEIntertek Hong Kong took part in the ‘10 Tonne Challenge’, a city-wide plastic recycling initiative supported by the Hong Kong Environmental Protection Department. A large recycling station was placed in Intertek’s Hong Kong office to ensure our 1,300 colleagues recycle their used plastic. The plastic waste collected will be remade into tote bags and other products. The recycling process and tote bag production also provide work opportunities for the community, and the proceeds from the sale of the bags are donated to support the elderly and the poor.
TURKEY: SUPPORT RURAL SCHOOLS Intertek Turkey supports an ongoing initiative for local schools in poorer rural regions through employee donations. Volunteers from across the business liaise with schools to collect and then circulate a list of much needed items to all employees. In 2018, following this communication, Intertek Turkey employees donated supplies including stationery, toys, educational materials, reading books, shoes, boots and coats to the schools. Thanks to the combined efforts of all, and the generous donations, more than 100 students were helped as a result of the programme.
UK: REUSABLE WATER BOTTLES FOR ALL CALEB BRETT EMPLOYEESTo reduce the impact of single-use plastic products on the environment, all employees at Caleb Brett in the UK have been issued with branded multi-use water bottles to use at home as well as at work. Simultaneously, the company removed single-use cups from all sites. Managers have also been asked to look at other alternatives to single-use water bottles, including water coolers and good quality tap water.
100STUDENTS WERE SUPPORTED BY OUR PROGRAMME FOR RURAL SCHOOLS IN TURKEY

Intertek Group plc Annual Report and Accounts 2018 33
Strategic Report
Intertek Group plc Annual Report and Accounts 2018 33
Strategic Report
TAIWAN: SUPPORTING MARINE HABITATS AND WILDLIFE During 2018, colleagues in Taiwan took part in several activities focused on the preservation of marine wildlife. This included 100 Intertek employees participating in coastal clean-up activities over a weekend, as well as delivering sustainable management services to clients designed to reduce marine pollution and protect coastal ecosystems.
TAIWAN: BUTTERFLY HABITAT CONSERVATION In November, Intertek colleagues and their families teamed up with The Butterfly Conservation Society of Taiwan to protect habitat in the Jian-nang butterfly garden in Taipei. The Intertek team worked to clear away overgrowing plants around the park, providing space for more butterfly-friendly vines and plants to thrive. Butterflies play key roles in plant pollination, and help to promote natural ecological balance. On the day of the event, volunteers from the Society were on hand to provide insights on the importance of environmental conservation.
40INTERTEK TAIWAN COLLEAGUES VOLUNTEER TO PROTECT LOCAL BUTTERFLY HABITAT
400AID PACKAGES PROVIDED BY INTERTEK FOR FLOOD SURVIVORS IN KERALA
Butterfly Habitat Conservation in Taiwan
Supporting flood relief efforts in Kerala
SURINAME: CALEB BRETT SPONSORS KNOWLEDGE AND EDUCATIONIntertek Caleb Brett was one of the Gold Sponsors for the Petroleum Engineering Student Chapter at the Anton de Kom University in Suriname, when it participated in the 2018 PetroBowl competition – a quiz challenge between different universities relating to competencies, expertise and technical knowledge in the Oil & Gas industry.
CHINA: FUNDING EDUCATION FOR THE POOR2018 is the 11th year in which Intertek China has campaigned to raise funds for poor students in Chongming District, Shanghai. Over this time, Intertek colleagues have provided 30 students with support and financial assistance, from primary school through to university.
KERALA: PROVIDING RELIEF FOLLOWING FLOODINGIn August 2018, severe flooding caused havoc in the Southern Indian state of Kerala, leading to widespread destruction of property and the tragic loss of close to 500 lives.
Intertek colleagues responded to the needs of survivors following the disaster, with voluntary deductions from their monthly salary and the provision of clothes, food, medicines, toiletries and more. Our facilities team consolidated these donations into more than 400 aid packages for distribution across the most affected villages of Annamanada and Poovathussery and the nearby town of Salakudi.
RAISING FUNDS TO PROTECT WOMEN AT RISK OF TRAFFICKINGThe Intertek team based in Allentown, Pennsylvania, notably engaged with Women At Risk (WAR) International during 2018. This Michigan based non-profit organisation creates ‘circles of protection’ around people at risk, using a range of culturally sensitive projects and partnership to fund and provide safe places to heal from abuse, trafficking and other forms of exploitation. The Intertek team sold unique items made by women at risk and people rescued from slavery, raising over US$1,000 – enough to pay for more than three months in an overseas safe house for a woman rescued from trafficking.
Women at risk: ‘Circles of protection’ 30STUDENTS IN CHINA HAVE RECEIVED SUPPORT AND FINANCIAL ASSISTANCE FROM PRIMARY SCHOOL THROUGH TO UNIVERSITY

Intertek Group plc Annual Report and Accounts 201834 Intertek Group plc Annual Report and Accounts 201834
Strategic Report | Sustainability report – Solutions for a better world
OUR ENVIRONMENT
Our environmental mission is to provide a better quality of life today and a more environmentally responsible world tomorrow. We will do this by continually improving our business performance in line with our Ever Better discipline to minimise the impact of our operations on the environment.
OUR APPROACHIntertek’s focus is deeply committed to minimising our environmental impact. To do so, we monitor site-level activities across a range of environmental metrics and work with our sites to reduce energy consumption and limit greenhouse gas (GHG) emissions. Intertek plays an important role in raising awareness of climate change and national resource constraints among its employees, suppliers and customers. As such, our aim is to improve operational and natural-resource efficiency in a consistent manner across all our sites.
Last year, Intertek implemented a Global Sustainability Environmental Software platform. This is optimised specifically to provide Intertek with the reporting, analytics and auditability to support site-level sustainability initiatives and corporate reporting.
Our teams globally regularly upload and monitor their data within the environmental software. This provides them with the deep intelligence they
OUR DATAOur annual GHG reporting cycle runs from 1 October 2017 to 30 September 2018. The corresponding average number of employees for this period was 44,255.
Due to the wider scope and depth of reporting from 2017 onwards, and the increased attention to detail and diligence across all Intertek sites, we made continual refinements to our environmental data during 2018. This has resulted in a restatement to our 2017 base year, reducing CO2 per employee from 5.08 to 4.42.
As a Total Quality Assurance (TQA) provider, we carry out testing on behalf of our clients which involves the direct consumption of fuel or the direct release of emissions through testing procedures. Our clients require the tests we perform to help them determine the safety, quality and environmental efficiency of their products. While this increases our overall Group reported emissions, it has a positive longer-term impact on the item being tested.
need to understand their local environmental impact. That enables them to assess how they can manage their consumption through:
• utilising renewable energy sources,
• implementing green waste management practices,
• carrying out efficient water management,
• minimising business travel; and
• operating quality management systems.
To support this effort, our Environmental and Climate Change policy is implemented by country management to ensure compliance with local guidelines and regulations.
Through setting meaningful objective targets and tracking accurately, we can ensure that we are minimising our environmental footprint while providing our key stakeholders with the data they need to understand our performance.
Intertek’s environmental software allows for site-level energy tracking to reduce carbon emissions”
492INTERTEK SITES IMPROVED THEIR NATURAL RESOURCE EFFICIENCY

Intertek Group plc Annual Report and Accounts 2018 35
Strategic Report
Intertek Group plc Annual Report and Accounts 2018 35
Strategic Report
For 2018, Intertek’s electricity consumption was reported to be 242,485 MWh (5.48 MWh per employee). Gas consumption was reported to be 64,796 MWh (1.46 MWh per employee).
In 2017 we set our first emissions target which was to reduce CO2 emissions per employee by 5% by 2020 versus our 2017 base year. Our progress during 2018 resulted in an overall reduction in emissions of 3.8% whilst at the same time we saw a growth in employee headcount of 3.3%, as such our CO2 per employee reduced by 6.9%. As a result of this reduction we are extending our target to be a 5% decrease in CO2 per employee from 2018 to 2023.
Intertek’s reporting complies with the methodologies outlined by the GHG Protocol ‘Corporate Accounting and Reporting Standard’, ISO 140064-1, and the UK Government’s ‘Environmental Reporting Guidelines: including mandatory greenhouse gas emissions reporting guidance’.
In compliance with the above standards, Intertek uses the most up-to-date GHG
emission factors available for each country and type of activity. The emission factors are sourced from the relevant government department in each country. Where local emission factors are not available, the platform uses default emission factors provided by the International Energy Agency (IEA), GHG Protocol, the UK’s Department for Environment, Food and Rural Affairs (DEFRA) and the US Environmental Protection Agency (US EPA).
SCOPE 3 MATERIALITY ASSESSMENTAs part of our ongoing improvements to our environmental data tracking and reporting, during 2018 we engaged with a reputable third-party vendor to carry out a materiality assessment to determine which Scope 3 emissions, as defined by the GHG Protocol, are relevant to Intertek.
The relevance of each of the 15 categories was established based on the Intertek business model. Data was then collected and analysed to assess the materiality of those that were determined to be relevant. The available information and data from each relevant category was then used to calculate an estimate of the
CO2e1 emissions from activities for which Intertek is responsible include:
GHG Emissions (tonnes of CO2e)1
2018 2017(restated)
Scope 1 Fugitive Emissions 5,034 4,993
Mobile Combustion – Owned Fleet 25,637 24,357
Stationary Combustion 24,715 24,877
Scope 2 Purchased and Used Electricity (location-based) 117,706 121,376
Purchased and Used Electricity (market-based) 124,269 126,527
Purchased Heat and Steam 1,625 1,573
Scope 3 Energy-Related Activities 7,616 12,274
Total emissions (location-based) 182,333 189,451
Total emissions (market-based) 188,896 194,602
Outside of scope Biomass 628 947
Fugitive Emissions 2,512 3,457Total emissions (location-based) including outside of scope 185,473 193,855Total emissions (market-based) including outside of scope 192,036 199,006
Intensity ratio – Scope 1,2,3 emissions
CO2 per employee (location-based) 4.12 4.42
CO2 per employee (market-based) 4.27 4.54
Average # of employees during reported period 44,255 42,828
1. CO2e – Carbon dioxide equivalent.
Intertek uses the most up-to-date GHG emission factors available for each country.”
242,485 MWhTOTAL ELECTRICITY CONSUMPTION IN 2018
5.48 MWhPER EMPLOYEE

Intertek Group plc Annual Report and Accounts 201836 Intertek Group plc Annual Report and Accounts 201836
Strategic Report | Sustainability report – Solutions for a better world
OUR ENVIRONMENTcontinued
CATEGORY RELEVANCE MATERIAL DETAILS
1. Purchased Good & Services Emissions associated with goods and services that Intertek procures through routine operational expenditure
2. Fuel and Energy-Related Activities Emissions associated with transmission losses from electricity
3. Employee Commuting Emissions associated with employees commuting to work
4. Capital Goods Emissions associated with goods and services that Intertek procures through capital expenditure
5. Business Travel Emissions from travel undertaken by employees on company business
6. Upstream Transportation & Distribution
– Emissions associated with shipping and transportation of goods
7. Waste Generated in Operations – Emissions associated with disposal of waste generated
8. Upstream Leased Assets – Not considered relevant due to limited sub-leasing of Intertek assets
9. Downstream Transportation & Distribution
– Not considered relevant due to Intertek being a service provider
10. Processing of Sold Products – Not considered relevant due to Intertek being a service provider
11. Use of Sold Products – Not considered relevant due to Intertek being a service provider
12. End-of-Life Treatment of Sold Products
– Not considered relevant due to Intertek being a service provider
13. Downstream Leased Assets – Not considered relevant due to limited sub-leasing of Intertek assets
14. Franchises – Not considered relevant due to no franchises in operation
15. Investments – Intertek has employee pension schemes but due to their external management, under GHG guidelines these can be excluded
total global emissions in those categories.
The review established that Scope 3 emissions are a material portion of Intertek’s total footprint. As such, the materiality of each GHG Protocol category was set as 5% of total Scope 3 emissions in order to ensure that future data gathering and reduction strategies will be focused on the most impactful areas.
After determining that seven categories were relevant to Intertek, five were deemed to be material as they each represent more than 5% of the total Scope 3 emissions. During 2019, Scope 3 data under the five material categories will be assessed in further detail with the objective of reporting on these categories as part of Intertek’s future global emissions reporting.
Purchased Goods & Services
Fuel and Energy-Related Activities
Employee Commuting
Capital Goods
Business Travel
Upstream Transportation & Distribution
Waste Generated in Operations 5% materialityThreshold
ASSESSMENT OF INTERTEK SCOPE 3 MATERIALITY

Intertek Group plc Annual Report and Accounts 2018 37
Strategic Report
Intertek Group plc Annual Report and Accounts 2018 37
Strategic Report
SUPPORTING OUR CLIENTS IN ENVIRONMENTAL MANAGEMENTOur Sustainability Services provide multiple ways in which we can support our clients achieve their environmental monitoring and management goals:
LCA evaluation of products
Life Cycle Assessment Life Cycle Assessment (LCA) has emerged as an essential and widely recognised framework to understand and measure the environmental and carbon impacts of a product, material or process. LCA tools can be leveraged to support value chain decision-making, production optimisation, innovation in design and end-of-life management. Intertek is working with a popular global e-commerce company to assess the cradle-to-grave impacts of their core product. The evaluation offers insight into the environmental impacts and avoided impacts associated with the product from the selection of materials and shipping networks to recycling, reuse and end-of-life management. Environmentally conscious and accountable business practices are essential to our client’s vision and they intend to use the science-based metrics from the LCA to continuously improve their impacts and meet corporate sustainability goals.
Experts evaluating GHG data
Carbon Footprint Assessment for Mitsubishi Electric Sales Canada (MESCA)As part of the global push to reduce GHG emissions, organisations are assessing their carbon impacts through science-based metrics that provide accurate and reliable information to key decision-makers and stakeholders.
Intertek’s sustainability teams are working with companies to determine or validate their GHG emissions throughout their entire value chain and achieve carbon-reduction targets. As an example, Intertek’s sustainability experts have been retained by Mitsubishi Electric Sales Canada to collect data, calculate and report their Scope 1, 2 and 3 GHG emissions for the country’s entire sales network. Intertek is collecting and evaluating data, not only for regional sales offices, but also such Scope 3 categories as the upstream purchase of goods and transportation, business travel and employee commuting as well as the downstream distribution network and use. The project involves supporting internal teams to collect the correct information, to perform technical reviews of data and calculations in accordance with the GHG Protocol and ISO standards, and to prepare a report outlining the science-based metrics. Mitsubishi Electric Sales Canada is undertaking this in-depth analysis as part of its corporate sustainability initiatives and carbon reduction goals.
Management of wastewater
Wastewater global regulatory requirements study for RocheIntertek worked with F. Hoffmann-La Roche Ltd in Switzerland to identify wastewater pollutant discharge limits in multiple jurisdictions worldwide. Managing the prevention of wastewater pollution from industrial, institutional and commercial sources is an important environmental mechanism to protect fresh and groundwater resources against harmful and restricted substances. Municipalities and regional jurisdictions across the world regulate and enforce specific concentrations of subject pollutants and substances that can be discharged into the sanitary sewer to protect important infrastructure, human health and impacts on the environment. As a global healthcare business, this company is a leader in sustainability and committed to promoting healthy lives and wellbeing for all.
Intertek’s research into regulation preventing wastewater pollution ensures access to information on key environmental regulatory mechanisms that are crucial to Roche’s customers’ operations. It also provides insight into evolving sustainability targets across various jurisdictions.
PET plastic resin
Novel approach to PET plastic manufacturingAs part of its strong commitment to sustainability, OCTAL, a global PET resin manufacturer, has developed innovative and efficient means of producing PET plastic that reduces environmental impact through an overall reduction in carbon emissions.
Intertek worked with OCTAL to carry out a carbon footprint analysis, demonstrating its novel approach to PET manufacture and new technologies. OCTAL also enlisted Intertek to evaluate the environmental impacts associated with end-of-life recycling. This contrasts with traditional disposal via landfill and demonstrates the effectiveness of the recycling programme in reducing the overall carbon footprint of PET plastic products.
Intertek worked with OCTAL to carry out a carbon footprint analysis, demonstrating its novel approach to PET manufacture and new technologies.”

Intertek Group plc Annual Report and Accounts 201838 Intertek Group plc Annual Report and Accounts 201838
Strategic Report | Sustainability report – Solutions for a better world
OUR GLOBAL ENVIRONMENTAL ACHIEVEMENTS 2018
As we operate a decentralised business model, it’s our local teams who look for ways to become more environmentally efficient and reduce the impact of operations. Here we provide some examples of these achievements in 2018. Through actively performance managing our GHG emissions in 2019, we hope to make further improvements.
OUR ENVIRONMENTcontinued
38
1 TRANSPORTATION TECHNOLOGIES, UK
Intertek Transportation Technologies UK was awarded certification to the ISO 14001 Environmental Management and to BS OHSAS 18001 Occupational Health and Safety Management standards.
2 MALTA
Intertek in Malta moved offices in August 2018. The new office is equipped with double glazing apertures and LED lighting.
3 CANADA, BC OPERATIONS, COMMODITIES
In Canada, Intertek partnered with a plastic recycling company to recycle all used sample bags.
4 INTERTEK CALEB BRETT DENMARK, KALUNDBORG
In Denmark, Intertek recycles cooling water during RON petroleum analysis.
5 DOMINICAN REPUBLICIn the Dominican Republic the Accuvio system is used to monitor petrol and electricity consumption.
6 TURKEYIn Turkey feasibility studies are underway for a solar energy project.
7 GHANA, TARKWA MINERALSIn Ghana, Intertek planted 500 trees on site.
8 AUSTRALIA, HONG KONG, JAPAN, NEW ZEALAND, SOUTH KOREA, TAIWAN
Intertek upgraded to LED lighting in labs in these countries.
13
2
4
5
6
78
Intertek Group plc Annual Report and Accounts 2018
Strategic Report | Sustainability report – Solutions for a better world

Intertek Group plc Annual Report and Accounts 2018 39
Strategic Report
Intertek Group plc Annual Report and Accounts 2018 39
Strategic Report
INDEPENDENT ASSURANCE STATEMENT TO INTERTEK GROUP PLC MANAGEMENTWe have performed a limited assurance engagement on selected performance data presented on page 35 of the Intertek Group plc (“Intertek Group”) Annual Report 2018 (“the Report”).
Respective responsibilitiesIntertek Group management is responsible for the collection and presentation of the information within the Report. Intertek Group management is also responsible for the design, implementation and maintenance of internal controls relevant to the preparation of the Report, so that it is free from material misstatement, whether due to fraud or error.
Our responsibility, in accordance with our engagement terms with Intertek Group management, is to carry out a ‘limited level’ assurance engagement on the selected data (“the Subject Matter Information”) outlined under the following headings in the Report:
• Greenhouse gas emissions – scope 1;
• Greenhouse gas emissions – scope 2; and
• Greenhouse gas emissions – intensity ratio.
We do not accept or assume any responsibility for any other purpose or to any other person or organisation. Any reliance any such third party may place on the Report is entirely at its own risk.
Our assurance engagement has been planned and performed in accordance with the International Standard for Assurance Engagements (ISAE) 3000 Revised, Assurance Engagements Other Than Audits or Reviews of Historical Financial Information. The Report has been evaluated against the following criteria (collectively “the Criteria”):
Completeness • Whether all material data sources have
been included and that boundary definitions have been appropriately interpreted and applied.
Consistency• Whether the Intertek Group scope and
definitions for the Subject Matter Information have been consistently applied to the data.
Accuracy• Whether site and business-level data
have been accurately collated by Intertek Group management at a Global level.
• Whether there is supporting information for the data reported by sites and businesses to Intertek Group management at a Global level.
Summary of work performedThe procedures we performed were based on our professional judgement and included the steps outlined below:
1. Interviewed a selection of management to understand the management of greenhouse gas data within the organisation.
2. Reviewed a selection of management documentation and reporting tools including guidance documents.
3. Performed a review of the Accuvio online data collection tool, including testing outputs and selected conversions made within the tool.
4. Reviewed underlying documentation for a sample of site-level data points.
5. Reviewed and challenged the validation and collation processes undertaken by Intertek Group management in relation to the Subject Matter Information.
6. Reviewed the Report for the appropriate presentation of the Subject Matter Information, including the discussion of limitations and assumptions relating to the data presented.
Limitations of our reviewOur evidence gathering procedures were designed to obtain a ‘limited level’ of assurance (as set out in ISAE3000 (Revised)) on which to base our conclusions. The extent of evidence gathering procedures performed is less than that of a reasonable assurance engagement (such as a financial audit) and therefore a lower level of assurance is provided.
Completion of our testing activities has involved placing reliance on Intertek Group’s controls for managing and reporting sustainability information, with the degree of reliance informed by
the results of our review of the effectiveness of these controls. We have not sought to review systems and controls at Intertek Group beyond those used for selected data (defined as the Subject Matter Information above).
The scope of our engagement was limited to the reporting period, and therefore 2018 performance only.
The responsibility for the prevention and detection of fraud, error and non-compliance with laws or regulations rests with Intertek Group management. Our work should not be relied upon to disclose all such material misstatements, frauds, errors or instances of non-compliance that may exist.
ConclusionBased on the procedures we have performed and the evidence we have obtained, nothing has come to our attention that causes us to believe that the Subject Matter Information was not prepared, in all material respects, in accordance with the Criteria, which were applied by management.
Our independence We have implemented measures to comply with the applicable independence and professional competence rules as articulated by the IFAC Code of Ethics for Professional Accountants and ISQC11. EY’s independence policies apply to the firm, partners and professional staff. These policies prohibit any financial interests in our clients that would or might be seen to impair independence. Each year, partners and staff are required to confirm their compliance with the firm’s policies.
We confirm annually to Intertek Group whether there have been any events, including the provision of prohibited services that could impair our independence or objectivity. There were no such events or services in 2018. Our assurance team has been drawn from our global Climate Change and Sustainability Services Practice, which undertakes engagements similar to this with a number of significant UK and international businesses.
Ernst & Young LLP London 4 March 2019
1. Parts A and B of the IESBA Code, and the International Standard on Quality Control 1 (ISQC1).

Intertek Group plc Annual Report and Accounts 201840 Intertek Group plc Annual Report and Accounts 201840
Strategic Report | Sustainability report – Solutions for a better world
TRACKING OUR PROGRESS WITH THE UN SDGs
As a purpose-led organisation and Total Quality Assurance provider, we are in a strong position to align with each of the United Nations Sustainable Development Goals (‘UN SDGs’). This is due both to the internal activities we carry out for our people, our communities and the environment, and to the sustainability services we provide to our customers.
We use the UN SDGs as a third party, independent framework to track our Country and Business Line progress in sustainability. In our 2017 report, we announced that from 2018 each of our major Business Lines and Countries will provide quarterly updates on their progress towards achieving the UN SDGs that they have chosen to align with and embed in their daily activities.
A wide and impressive range of goals is targeted across the organisation. Quantitative and qualitative reporting demonstrated during the year how our countries have contributed to the goals.
Here we provide an overview of many of the Group’s activities across all the UN SDGs. We also include examples of highlights from the year on a selection of the goals, from both an internal and a client services perspective.
LOOKING AHEADWe will continue to update stakeholders on our progress on the UN SDGs, providing annual examples of our activities across different Business Lines and Countries, both from an internal and a client perspective.
• Charity and community support initiatives
• Food testing services for our clients
• Colleague health and wellbeing programmes
• 10X training and development for Intertek colleagues
• Community education support initiatives
• Workplace Gender Equality report Australia
• EDGE certifications provided to clients in Australia
• Real-time inequality monitoring system in France
• Water quality testing services for our clients
• Intertek China partners WWF
• Commitment to UK Living Wage
• Charity and community support initiatives
• Installation of Stem Battery Solution in US
• Intertek certified several leading regional quality alliances in China
• Environmental audits, training and services for our clients
• Charity and community support initiatives
• Commitment to ‘Doing Business the Right Way’
• Commitment to inclusion and diversity policy
• Charity and community support initiatives
• Waste initiatives in the US, Australia, UK, Hong Kong
• Verifying new sustainable materials in Hong Kong
• Supporting sustainable production of plastics
• Environmental audit services for clients
• Environmental monitoring and control in Intertek locations
• Fitting labs with LED lighting
• Charity and community support initiatives
• Charity and community support initiatives
• Commitment to ‘Doing Business the Right Way’
• Global network of Sustainability Champions drive engagement with UN SDGs locally
• Charity and community support initiatives
INTERTEK ACTIVITIES ALIGNED TO ALL UN SDGs

Intertek Group plc Annual Report and Accounts 2018 41
Strategic Report
Intertek Group plc Annual Report and Accounts 2018 41
Strategic Report
MAKING OUR OWN PROGRESS WITH THE UN SDGs…
…AND SUPPORTING CLIENTS’ PROGRESS WITH OUR SUSTAINABILITY SERVICES
INSTALLATION OF A STEM BATTERY SOLUTIONThe United States has a significant role to play in Intertek’s energy use and how we are meeting the carbon reduction goals outlined in this report.
We therefore continue to implement better ways for all of our US-based locations to reduce their energy consumption. These activities are fully aligned to the Affordable and Clean Energy goal, focusing on energy efficiency projects and clean energy purchasing options.
In October 2018, Intertek’s Lake Forest California site installed a Stem battery system which is designed to reduce peak energy demand. This battery storage system also plays a part in strengthening the California electricity grid by supporting renewable energy in the state.
REDUCING GENDER INEQUALITY Intertek first produced a Gender Pay Gap report in 2017 for its UK operations. We are highly committed to reducing the pay gap and improving our gender balance across the whole organisation globally.
We have, for example, ensured compliant reporting to the Australian Government Workplace Gender Equality Agency and implemented a permanent system to monitor inequalities in France.
In addition, we provide our clients with key auditing services for Gender Equality, such as Economic Dividends for Gender Equality (EDGE). Intertek is the first certification body fully approved to certify companies against the EDGE standard, which is the only global assessment methodology and business certification standard for gender equality.
CLIMATE ACTIONABC Analitic, Intertek’s leading environmental services company based in Mexico, received the government’s Certificate of Environmental Compliance in June. In achieving this, we reaffirmed our commitment to caring for and preserving the environment. The Certification in Environmental Compliance is an evaluation strategy used to help improve the quality of sustainable processes, products and services.
WATER QUALITY TESTING SERVICESOur wide range of water testing services assists clients operating in all water-related sectors, including water utilities, industry, Oil & Gas, ports and harbours, food, power generation, desalination and pharmaceuticals. We help our clients use practical technologies to explore water properties and produce quality improvements.
Partnership with WWF ChinaIntertek China established a partnership with the World Wide Fund for Nature (WWF China) in 2017, and since then has participated in a project called ‘WWF Water Management Innovation Action’. By providing water management solutions to the textile industry, Intertek aims to improve corporations’ water use efficiency within their value chain and pollutant discharge conditions, as well as reducing water related crises and adverse environmental impacts in manufacturing operations. We continue to offer training services to increase textile companies’ water risk awareness.
Responding to crisis averts environmental disasterWhen several dead manatees were spotted in rivers in the Mexican state
of Tabasco, a team from Intertek ABC Analitic quickly rose to the challenge of testing the water for toxins. When no high levels of toxic substances were found through conventional approaches, the team needed to develop and implement a series of entirely new tests in just five days.
Because our labs are capable of quickly processing the complex matrices required in these instances, our involvement was mission-critical in enabling local government bodies to make informed decisions and act quickly to prevent wider environmental impacts.
RESPONSIBLE PRODUCT PRODUCTION Intertek is at the forefront of ensuring the safe and sustainable execution and delivery of products to their intended markets. Our capabilities in a range of industries – including electrical and electronic products, medical devices, IT and telecoms, toys and games, juvenile products, textiles and apparel, food and more – give clients access to an interconnected knowledge base that provides solutions to everything from regulatory issues to supply chain challenges.
Total Quality Assurance validation of sustainable material In Hong Kong, our client manufactures Chitosan yarn, a sustainable new material that’s based on a natural compound derived from the shells of crab and shellfish. Intertek has created a unique and innovative testing method both to verify the material’s existence within yarn and to assure its recycling lifecycle. This Total Quality Assurance solution validates the material’s anti-bacterial, odour repellent and biodegradable properties.
First ‘Water Footprint’ Green Leaf Mark awardedA product developed by the Ming Fai Group, the leading company in the Chinese hotel industry’s consumer goods sector, has received the first water footprint Green Leaf mark. The Reeco product reduces the foam produced in the laundry process, cutting washing time and water consumption to reflect the key importance of addressing water scarcity. The Green Leaf mark award follows Intertek’s work evaluating the life cycle of the Reeco product, from manufacture to implementation.

Intertek Group plc Annual Report and Accounts 201842 Intertek Group plc Annual Report and Accounts 201842
Strategic Report | Sustainability report – Solutions for a better world
At Intertek, sustainability is core to our business and everything we do. We are constantly evaluating and improving our processes, both in the services that we offer to our customers and in our own business processes and initiatives.
In 2017 we established a set of five Group sustainability priorities, linked to our 5x5 differentiated strategy for growth. We further developed these over 2018, under the leadership of the Sustainability Operating Committee.
THE SUSTAINABILITY OPERATING COMMITTEEThe purpose of the Sustainability Operating Committee (the ‘Committee’) is to advance Intertek’s initiatives, both in our external sustainability services for clients and our internal sustainability activities. The core elements the Committee focuses on include:
• Oversight of the development of Intertek’s sustainability service offerings;
• Oversight of the progress made on internal sustainability activities, including Intertek’s environmental footprint, GHG emissions, contribution to the UN SDGs, tracking and reporting of key ESG metrics and reporting to the Executive Management Team and the Board.
To enhance engagement across our sustainability initiatives, the Committee is supported by a network of Sustainability Champions across our major Countries and Business Lines. Their roles include:
OUR SUSTAINABILITY GOVERNANCE
Country network:• Seeking opportunities to act
sustainably, through energy efficiency and cost reductions across energy, water and waste usage.
• Engaging with people locally to drive positive behaviours throughout the organisation as well as through encouraging sustainability engagement with local stakeholders.
• Maintaining best-in-class internal labour and human rights practices, activity monitoring and improving social sustainability metrics.
Business Line network:• Engaging the sales organisation within
the Business Line to ensure it is aware of all the sustainability services that can be offered to customers.
• Working with colleagues globally to help develop our suite of sustainability services.
• Helping to generate new and innovative ways of offering sustainability services to our customers.
We aim to expand this network over time to include more Countries and Business Lines, enhancing engagement across our business in sustainability activities.
Our people are passionate about their work and are proud to be involved in activities which generate a positive impact for society and the environment. Each of our Countries and Business Lines defines its own sustainability agenda, tied to our Group priorities. This ensures that the objectives and activities being performed locally are understood, and that we benefit from best practice globally.
RESPONSIBLE INVESTMENTGenerating sustainable, long-term returns is a key enabler of our 5x5 strategy for growth. We achieve this by means of a Responsible Investment (‘RI’) approach. RI includes the evaluation of ‘ESG’ risks as part of the investment process.
ESG due diligence forms a key part of our acquisition review process. We also use it when assessing capital expenditure decisions on new and innovative ATIC services. We ensure that we have identified potential ESG risks and have in place corresponding mitigation plans and remedies. Our investment process, in line with our overall Group strategy, ensures that we maintain the right balance between performance and sustainability.
As appropriate, acquired businesses will be provided with access to our Group Environmental Data Software and will be required to submit their environmental data as part of the ongoing reporting cycle.
SUPPORTING OUR CLIENTS –ETHICAL SOURCING FORUMOur Sustainability value proposition also supports our clients in their supply chain risk assessments.
Since 2001, Intertek’s Global Business Assurance business line has leveraged its supply chain expertise in shaping the Ethical Sourcing Forum (ESF). This is an industry-leading event focused on supply chain social responsibility and responsible/ethical sourcing. The conference’s main theme, ‘Be Part of the Solution’, emphasises ESF’s role in the continuously improving and ever-changing areas of working conditions, human rights and environmental conditions in the supply chain.
Sustainability Operating Committee
Group CEO
Board Executive Management Team
Sustainability Data Social & HR Sustainability Lead External Reporting Sustainability Services
Country Champions: 15 countries
Updates monthly
Updates monthly
Business Line Champions: 10 BLs
Updatesannually
Updatesquarterly
SUSTAINABILITY NETWORK

Intertek Group plc Annual Report and Accounts 2018 43
Strategic Report
Intertek Group plc Annual Report and Accounts 2018 43
Strategic Report
REPORTING REQUIREMENT
POLICIES AND STANDARDS WHICH GOVERN OUR APPROACH
IMPLEMENTATION, OUTCOMES AND ADDITIONAL INFORMATION
Environmental matters
• Environmental and Climate Change Policy1
• GHG Protocol’s: ‘Corporate Accounting and Reporting Standard’ and ‘Corporate Value Chain (Scope 3) Standard’
• ISO 140064-1• UK Government’s ‘Environmental Reporting Guidelines: including
mandatory greenhouse gas emissions reporting guidance’
Our Environment – pages 34 to 39
Employees • Board Diversity Policy• Code of Ethics2
• Group Health & Safety Policy1
• Hampton-Alexander Review• Inclusion and Diversity Policy2
• International Labour Organization’s Core Conventions• UK Gender Pay Gap• UK Real Living Wage
Our People – pages 28 to 31 Nomination Committee – pages 80 to 82
Social matters • Our Approach to CSR1
• Integrated Global Sustainability ServicesOur Communities – pages 32 to 33 Our Sustainability Value Proposition – pages 26 to 27
Human rights • Labour and Human Rights Policy1 • Modern Slavery Statement2 • Modern Slavery Policy2
• Privacy Policy2
• UN Convention on Human Rights
Our People – pages 28 to 31
Anti-corruption andanti-bribery
• Anti-Bribery Policy2
• Anti-Bribery External Relationships Policy2
• Whistleblowing Hotline
Principal Risks and Uncertainties – pages 54 to 59 Accountability – page 83 to 88 Our People – pages 28 to 31
Description of principal risks and impact of business activity Principal Risks and Uncertainties – pages 54 to 59
Description of the business model Our 5x5 Strategy – pages 2 to 3 Our Earnings Model – pages 12 to 13
Non-financial key performance indicators Our People – pages 28 to 31 Our Environment – pages 34 to 39
1. Certain Group Policies and internal standards and guidelines are not published externally. 2. Certain Group Policies and internal standards and guidelines are published on our website, www.intertek.com.
NON-FINANCIAL INFORMATION STATEMENTWe aim to comply with non-financial reporting requirements contained in sections 414CA and 414CB of the Companies Act 2006. The below table, and information it refers to, is intended to assist stakeholders in understanding our position on key non-financial matters. This builds on existing reporting under the following frameworks: Global Reporting Initiative, Guidance on the Strategic Report (UK FRC) and UN Sustainable Development Goals.
In 2018 we held two ESF events, one in New York and one in London. These covered, among other topics, Modern Slavery and hidden labour risks in the UK and US, as well as global supply chain trends.
In the UK, a panel of industry experts who were invited to speak and take part in roundtable discussions included:
• Ethical Trade Manager, Sainsbury’s Group;
• Head of Global Ethical Policy, BBC Studios;
• Director of Operations, Gangmasters Labour Abuse Authority;
• Human Rights, Modern Slavery and Responsible Sourcing Consultant; and
• Intertek Group General Counsel and Head of Risk & Compliance.
The forum provided an opportunity for senior compliance and ethical sourcing representatives from UK brands and retailers to discuss and learn about the risks of sourcing from the UK, especially around the subject of worker exploitation. This topic is important because the current access to a labour market via labour agencies is increasing organisational risks such as compromised brand reputation and reduced visibility and control during sourcing and due diligence practices.
In the US, the panel included a representative of the US government, Senior Policy Advisor Forced Labour Programmes, US department of Homeland Security Investigations, providing different perspectives on business and government initiatives.
Going forward, the Intertek Business Assurance team will build on these events. It is scheduling future Ethical Sourcing Forums in 2019 in key sourcing markets.
Global Reporting Initiative (GRI) guidelines provide a recommended framework and indicators for reporting. A table outlining the GRI standard disclosures is provided on our corporate website at www.intertek.com/about/corporate-responsibility/.
All data used for performance indicators is representative of the GRI Guidelines.

BUSINESS LINES
Softlines
Hardlines
Electrical & Connected World
Business Assurance
PRODUCTS
Excellent performance with strong margin-accretive revenue growth
Transportation Technologies
Food
Chemicals & Pharma
Building & Construction
STRATEGY Our Total Quality Assurance value proposition provides a systemic approach to support the Quality Assurance efforts of our Products-related customers in each of the areas of their operations. To do this we leverage our global network of accredited facilities and world-leading technical experts to help our clients meet high-quality safety, regulatory and brand standards, develop new products, materials and technologies and ultimately assist them in getting their products to market quicker, in order to continually meet evolving consumer demands.
INNOVATIONWe continue to invest in innovation to deliver a superior customer service in our Products-related businesses:
360º Brand Assurance and E-Reputation• Customer Insight: Our Food Industry
customers are taking an increasingly holistic approach to risk in their supply chain and organisation; with the rise of social media, detailed E-Reputation monitoring is becoming a key part of their risk management and mitigation strategies
• Food innovation: Intertek has developed a unique TQA solution providing an end-to-end mapping of
INTERTEK VALUE PROPOSITIONOur Products-related businesses consist of business lines that are focused on ensuring the quality and safety of physical components and products, as well as minimising risk through assessing the operating processes and quality management systems of our customers.
As a trusted partner to the world’s leading retailers, manufacturers and distributors, the division supports a wide range of industries including textiles, footwear, toys, hardlines, home appliances, consumer electronics, information and communication technology, automotive, aerospace, lighting, building products, industrial and renewable energy products, food and hospitality, healthcare and beauty, and pharmaceuticals.
Across these industries we provide a wide range of ATIC services including, laboratory safety, quality and performance testing, second-party supplier auditing, sustainability analysis, product assurance, vendor compliance, people assurance, process performance analysis, facility plant and equipment verification and third-party certification.
FINANCIAL HIGHLIGHTS 2018
2018£m
2017£m
Change at actual
rates
Change at constant
rates
Revenue 1,680.2 1,625.5 3.4% 6.6%
Organic revenue 1,654.4 1,620.6 2.1% 5.2%
Adjusted operating profit 371.0 350.5 5.8% 9.5%
Adjusted operating margin 22.1% 21.6% 50bps 60bps
Statutory operating profit 344.5 335.5 2.7%
Statutory operating margin 20.5% 20.6% (10)bps
REVENUE
£1,680.2mADJUSTED OPERATING PROFIT
£371.0mSTATUTORY OPERATING PROFIT
£344.5m
Intertek Group plc Annual Report and Accounts 201844
Strategic Report | Operating reviews

EVER BETTER SOLUTIONS PEOPLE ASSURANCE
INSIG
HT
In a world of increasingly complex supply chains and distribution channels, employees are key in driving operational excellence. As corporations around the world increase their focus on quality, safety, productivity and compliance, our clients are seeking ‘People Assurance’ solutions that enable them to identify, monitor and close skills gaps amongst employees – particularly frontline employees. These services are mission-critical for our clients to deliver the highest standards in customer service. As we engage with our clients and as we continue to build our Business Assurance services, we acquired Alchemy Systems, a leading People Assurance specialist with a unique Software as a Solution (‘SaaS’) offering.
INN
OVATIO
N
Alchemy’s cloud-based technology platforms, industry-specific training content, and bespoke employee communications programmes help identify and close skills gaps quickly and efficiently. Alchemy engages with over three million frontline employees at 50,000 locations around the world to drive safety, operational excellence, and customer service. The Alchemy, Wisetail, Ontrack, and Catalyst platforms are scalable across multiple industries and ensure an organisation’s workforce is empowered with the right knowledge and confidence to consistently perform their jobs in the right way.
TQA
SOLU
TION
SAssurance
EVER
BETTER
Intertek’s People Assurance solutions are industry-agnostic and uniquely designed to address the skill gaps and increase the level of engagement to empower employees to work at their maximum potential. We continue to use customer insights, data and innovation to expand our Assurance proposition, together with our scale position in 100+ countries with our TQA experts operating at a local level. We can now offer People Assurance solutions to our global client base across multiple industries to continue to drive operational excellence and mitigate risk.
Intertek Group plc Annual Report and Accounts 2018 45
Strategic Report

network to rapidly assess the material risk components
• Customer benefit: Thanks to our accelerated screening programme, our customer was able to enter the market successfully and faster than they had expected, benefitting from Intertek’s proprietary technology, lab network and efficient assurance approach
2018 PERFORMANCEIn 2018 our Products business delivered an excellent performance with strong margin-accretive revenue growth.
Our organic revenue growth at constant rates was 5.2%, driven by broad-based revenue growth across business lines and geographies. We delivered strong adjusted operating profit of £371m, up 9.5% at constant currency enabling us to deliver a margin of 22.1%, up 60bps versus last year:
• Our Softlines business reported solid organic growth performance. We are leveraging the investments we have made to support the expansion of our customers into new markets and to seize the exciting growth opportunities in the footwear sector. We continue to benefit from strong demand from our customers for chemical testing as well as from a greater number of brands and SKUs.
• Our Hardlines and Toy business continues to take advantage of our strong global account relationships, the expansion of our customers’ supply chains into new markets and our innovative technology for factory inspections. We delivered good organic revenue growth performance across our main markets of China, Hong Kong, India and Vietnam.
• Our Transportation Technologies business delivered double digit organic revenue growth as we capitalise on our clients’ investments in new powertrains to lower emissions and increase fuel efficiency.
• Our Business Assurance business delivered strong organic revenue growth as we continue to benefit from the increased focus of corporations on risk management, resulting in strong growth in Supply Chain Audits and increased consumer and government focus on ethical and sustainable supply.
our customers’ E-Reputation and Operational data to deliver tailored 360º Brand Assurance Reports
• Customer benefit: Our customers now have a 360º view of the risk areas across their food service site networks, as well as ATIC action plans to mitigate those risks
First and Only Oligonucleotide Expert Centre Globally• Customer insight: Our customers’
ground-breaking research and development into DNA- or RNA-based therapeutics (oligonucleotides) needs highly experienced analytical scientists and state-of-the-art technology to enable efficient drug development for the treatment of diseases including cancer, neurodegenerative disorder and cardiovascular diseases
• Chemicals and Pharma innovation: In the UK, Intertek has established a unique, dedicated centre for regulatory-driven analytical development and quality control support for oligonucleotide therapeutics, offering unrivalled product specific expertise to our global clients. Our world leading oligonucleotide scientists provide innovative and comprehensive analytical support throughout the pharmaceutical development life cycle
• Customer benefit: With access to Intertek’s world leading subject matter experts and specialist analytical technology, we empower our clients to ensure the safety, purity and quality of their oligonucleotide products through highly efficient development support, helping them to bring their treatments to the market, and to the patients that need it, faster
Accelerated Screening of Restricted Substances• Customer insight: Our customer, a
luxury watch manufacturer, urgently needed to determine whether their product contained any of 950+ banned substances before they could enter a new market
• Assurance innovation: We provided an accelerated screening programme, supported by our proprietary Material Risk Database, which contains 50,000+ data points. Through the programme, we assessed each product component’s risk of containing a banned substance. We then mobilised our extensive lab
• We delivered robust organic revenue growth in our Electrical & Connected World business driven by higher regulatory standards in energy efficiency and by the increased demand for wireless devices and cybersecurity.
• We continue to benefit from the increased focus of corporations on food safety and delivered robust organic revenue growth in our Food business.
• We delivered robust organic revenue growth in our Chemicals & Pharma business as we continue to leverage the structural growth opportunities in the healthcare markets in both developed and emerging economies and we benefited from the increased focus on product safety and traceability.
• Driven by the growing demand for more environmentally friendly and higher quality buildings and infrastructure in the US market, our Building & Construction business reported robust organic revenue growth.
2019 OUTLOOKWe expect our Products division to benefit from good organic revenue growth at constant currency.
MID- TO LONG-TERM OUTLOOKOur Products division will benefit from mid- to long-term structural growth drivers including product variety, brand and supply chain expansion, product innovation and regulation, the growing demand for quality and sustainability from developed and emerging economies, the acceleration of e-commerce as a sales channel, and the increased corporate focus on risk.
PRODUCTScontinued
Intertek Group plc Annual Report and Accounts 201846
Strategic Report | Operating reviews

INSIG
HT
In recent years, cybercrime has grown from a threat to corporations’ IT systems, to one that permeates every element of operations. Everything from automated manufacturing sites to the connected products sold to customers is affected. This is a new dimension of risk for consumer goods as diverse as lightbulbs to fridges, vehicles to pacemakers. In addition to the familiar requirements of electrical, physical and chemical safety testing is now added cybersecurity assurance, of which clients rarely have significant experience. Intertek’s Connected World business has a deep knowledge of product cybersecurity. We help clients to mitigate new and ever-evolving risks. This allows their customers – securely – to experience the benefits connectivity brings to their daily lives.
INN
OVATIO
N
Intertek’s Connected World provides cybersecurity solutions for clients based on risk factors of specific products and systems. Our testing for the medical device sector (to which Intertek already provides extensive services for electrical safety testing) is at the forefront of product cybersecurity. Connectivity brings huge advantages to both individual patients, such as real-time remote monitoring and diagnosis, and society more broadly as medical Big Data collected from connected devices speeds the development of new medicines. However, the associated risks are significant, from data privacy concerns about individuals’ most sensitive information being accessed through to fatal risks associated with compromised embedded devices.
To help clients launch products which harness these huge benefits of connectivity whilst mitigating the risks, Intertek provides a range of services from basic penetration tests through to full evaluation under US Food and Drug Administration guidelines. Work on products as diverse as surgical robots to hospital monitoring equipment help our clients eliminate security flaws and launch successful products.
TQA
SOLU
TION
SEV
ER B
ETTER
Regulators are increasingly focusing on product cybersecurity in addition to existing data privacy laws. Notably EU and Californian regulation is expected in H2 2019 and Q1 2020 respectively. Intertek is ready to help all our clients meet these challenges, with support at every point in their product life cycle. In addition to securing the physical product, Intertek’s Network Security businesses provide a range of cybertesting such as penetration tests and social engineering. These tests provide assurance over data generated by connected products held in the cloud and test the security of underlying IT systems. In this way Intertek helps clients’ protect their businesses against all facets of cybercrime.
EVER BETTER SOLUTIONS CONNECTED WORLD
Assurance Testing Inspection Certification
Intertek Group plc Annual Report and Accounts 2018 47
Strategic Report

BUSINESS LINES
Caleb Brett (Cargo/AA)
Government & Trade Services
AgriWorld
TRADE
to optimise the return on our customers’ cargoes and help them resolve difficult technical challenges. Our independent product assessments provide peace of mind to our government clients that the quality of products imported into the country meet their standards and import processes.
INNOVATIONWe continue to invest in innovation to deliver a superior customer service in our Trade-related businesses:
Rapid Response to Extreme Weather Events• Customer insight: With the increase
in extreme weather events and the effects of climate change, our insurance industry customers are finding that large and complex ‘Catastrophic Loss’ claims are becoming more frequent. The ability of our customers to manage their risks quickly and safely is vital when dealing with these claims
• Trade innovation: Intertek has created a unique ‘rapid response’ solution to requests for support on these large and complex claims, attending the site within 24 hours and working to assess safety, environmental impacts and to advise on remedial strategies in mitigating the loss
INTERTEK VALUE PROPOSITIONOur Trade division consists of three Global Business Lines with differing services and customers, but similar mid- to long-term structural growth drivers:
• Our Cargo/AA business, newly rebranded Caleb Brett, provides cargo inspection, analytical assessment, calibration and related research and technical services to the world’s petroleum and biofuels industries.
• Our Government & Trade Services (‘GTS’) business provides inspection services to governments and regulatory bodies to support trade activities that help the flow of goods across borders, predominantly in the Middle East, Africa and South America.
• Our AgriWorld business provides analytical and testing services to global agricultural trading companies and growers.
STRATEGY Our Total Quality Assurance value proposition assists our Trade-related customers in protecting the value and quality of their products during their custody-transfer, storage and transportation, globally, 24/7. Our expertise, service innovations and advanced analytical capabilities allow us
Solid performance with an acceleration in the second half of the year
• Customer benefit: With Intertek’s support, our insurance industry customers are able to mitigate catastrophic losses faster than ever before, while continuing to ensure safety and compliance
ScanCal Laser Scanning • Customer insight: For Intertek’s Caleb
Brett customers, accurate and timely storage tank stock measurement is key for robust stock management, allowing them to identify stock losses and loading issues. However, traditional volumetric approaches can interrupt operations and cause safety risks
• Caleb Brett innovation: Intertek’s proprietary ScanCal platform uses laser scanning technology to collect and analyse minutely detailed calibration imaging in real time, avoiding interrupting operations, cutting calibration time by over 90% and reducing safety risks
• Customer benefit: Our customers’ newfound ability to identify issues quickly, accurately and without stopping operations, has allowed them to realise significant operational efficiency gains
Scanning Electron Microscopy• Customer insight: When the extreme
wear conditions of our customers’
FINANCIAL HIGHLIGHTS 2018
2018£m
2017£m
Change at actual
rates
Change at constant
rates
Revenue 642.1 647.8 (0.9)% 3.1%
Organic revenue 636.5 647.8 (1.7)% 2.2%
Adjusted operating profit 83.4 88.7 (6.0)% (1.3)%
Adjusted operating margin 13.0% 13.7% (70)bps (60)bps
Statutory operating profit 78.3 82.8 (5.4)%
Statutory operating margin 12.2% 12.8% (60)bps
REVENUE
£642.1mADJUSTED OPERATING PROFIT
£83.4mSTATUTORY OPERATING PROFIT
£78.3m
Intertek Group plc Annual Report and Accounts 201848
Strategic Report | Operating reviews

mechanical equipment cause concern, they look to Intertek to determine how this debris was produced and whether this has implications for the life expectancy of the equipment
• Caleb Brett innovation: Our experts have leveraged cutting edge Scanning Electron Microscope technology, not normally used for this purpose, in an innovative new way. Using this technology, our experts can analyse the wear debris with unprecedented accuracy
• Customer benefit: With this new level of accuracy, our customers can take maintenance and replacement decisions with confidence, with greater certainty on the condition of their equipment and the potential impact of any damage on the quality of the end product and safety of their staff
2018 PERFORMANCEOur Trade-related businesses delivered an organic revenue growth of 2.2% at constant rates, driven by broad-based revenue growth across business lines and geographies and we delivered an adjusted operating profit of £83.4m, down 1.3% at constant currency driven by portfolio mix.
• Our Caleb Brett business reported solid organic revenue growth, reflecting the structural growth drivers in the Crude Oil and Refined Product global trading market.
• Benefiting from new contracts, our Government & Trade Services business delivered robust organic revenue growth.
• Our AgriWorld business delivered an organic revenue lower than last year due to lower export activities in a few markets that benefited from strong trading activity in 2017.
2019 OUTLOOKWe expect our Trade-related businesses to benefit from good organic performance at constant currency.
MID- TO LONG-TERM OUTLOOKOur Trade division will continue to benefit from both regional and global trade-flow growth, as well as the increased customer focus on quality, quantity controls and supply chain risk management.
EVER BETTER SOLUTIONS INTERTEK INTERPRETTM
INSIG
HT
As the global demand for energy increases, so too does the need to ensure complex hydrocarbon compounds are accurately analysed and effectively utilised.
Oil and gas companies are looking for innovative solutions to help them improve efficiency and data accuracy during hydrocarbon processing within production and refining environments. Rapid access to composition measurement data, characterisation analysis and evaluation are critical for increasing productivity, reducing costs, improving efficiency and growing profits. This customer insight led Intertek to develop the innovative ‘Interpret’ software solution.
INN
OVATIO
N
Interpret was developed to give clients rapid access to the vital data required to make informed decisions on product quality, saving time and cost while maximising margins. This game-changing breakthrough has led us to create a vast database of the world’s crude oils, radically streamlining the processes involved in analysing crude oil chemistry.
By leveraging expertise from across Intertek we enable refineries to accurately predict, in real time, the economics of the oil they refine. This is truly a new layer of specialist support and domain expertise, from our centres of excellence in Aberdeen and oil industry hubs across the world, including Houston, Rotterdam and Singapore.
Intertek is the only company in the world that combines global modelling expertise, technically advanced software and a vast crude oil database to enable real-time, traceable insight on crude oil compositions.
TQA
SOLU
TION
S
Assurance
EVER
BETTER
By combining these insights to deliver one unique solution, Interpret provides our clients with faster, real-time data to make informed decisions on product quality and quantity. This solution is being used by increasingly more major refineries around the world as it provides them with a tangible competitive advantage. Given the high scalability of the Interpret platform Intertek can help its clients not only in the oil and gas sector but also in other industries.
Intertek Group plc Annual Report and Accounts 2018 49
Strategic Report

FINANCIAL HIGHLIGHTS 2018
2018£m
2017£m
Change at actual
rates
Change at constant
rates
Revenue 478.9 495.8 (3.4)% 0.3%
Organic revenue 478.9 495.8 (3.4)% 0.3%
Adjusted operating profit 27.4 28.5 (3.9)% (0.4)%
Adjusted operating margin 5.7% 5.7% 0bps (10)bps
Statutory operating profit 13.4 4.4 204.5%
Statutory operating margin 2.8% 0.9% 190bps
BUSINESS LINES
Industry Services
Minerals
RESOURCES
STRATEGYOur Total Quality Assurance value proposition allows us to help customers gain peace of mind that their projects will proceed on time and their assets will continue to operate with a lower risk of technical failure or delay. Our broad range of services allows us to assist clients in protecting the quantity and quality of their mined and drilled products, improve safety and reduce commercial risk in the trading environment.
INNOVATIONWe continue to invest in innovation to deliver a superior customer service in our Resources-related businesses:
Microwave Interferometry • Customer insight: A major
petrochemical customer had a vast network of fibre-reinforced plastic piping systems in urgent need of integrity assessments
• Industry Services innovation: Intertek’s experts developed a new inspection solution based on an innovative application of the advanced technique of Microwave Interferometry, allowing for rapid and precise microwave scanning of the pipelines, delivering substantial integrity assessment productivity gains
INTERTEK VALUE PROPOSITIONOur Resources division consists of two Business Lines with differing services and customers, but both demonstrating similar cyclical growth characteristics:
• Our Industry Services business uses in-depth knowledge of the oil, gas, nuclear and power industries to provide a diverse range of Total Quality Assurance solutions to optimise the use of customers’ assets and minimise the risk in their supply chains. Some of our key services include technical inspection, asset integrity management, analytical testing and ongoing training services.
• Our Minerals business provides a broad range of ATIC service solutions to the mining and minerals exploration industries, covering the resource supply chain from exploration and resource development, through to production, shipping and commercial settlement.
Improved performance following several years of challenging trading conditions
• Customer benefit: Our customer gained assurance over the integrity of their piping quickly and without having to stop operations
Ultrasonic Sensors Incorporated into Intertek Aware• Customer insight: Our Oil and Gas
customers monitor the corrosion of their equipment to determine its life expectancy and to prevent failures. Traditional inspection methods are manual, involving shutting down equipment, and can present safety risks when equipment is hard to reach
• Industry Services innovation: Intertek’s experts place remote ultrasonic sensors on our customers’ equipment in precisely the right areas to measure the rate of corrosion with the greatest accuracy. The data is automatically fed into Intertek’s proprietary Aware software, where it is analysed to predict when the equipment should be replaced, before failures occur
• Customer benefit: Intertek’s innovative approach removes the need for operations to be interrupted and the risk to safety. Our Aware software empowers our customers to predict equipment corrosion rates in real time, allowing for timely repairs or replacement
REVENUE
£478.9mADJUSTED OPERATING PROFIT
£27.4mSTATUTORY OPERATING PROFIT
£13.4m
Intertek Group plc Annual Report and Accounts 201850
Strategic Report | Operating reviews

Extreme Conditions Simulation• Customer insight: Our Oil Industry
customers see managing corrosion as vital in protecting our environment from damaging oil spills. The injection of corrosion inhibitor chemicals is an important corrosion control strategy
• Industry Services innovation: To test whether our customers’ corrosion inhibitors will perform reliably, our experts have developed advanced test methods and equipment to simulate worst-case operating conditions, through manipulating factors including brine chemistries, flow rates, temperature, acid gas partial pressures and pipeline condition
• Customer benefit: Our customers can continue their production operations with the confidence that the environment and their equipment are protected
2018 PERFORMANCEOur Resources-related businesses reported an organic revenue growth of 0.3% at constant rates. We delivered an adjusted operating profit of £27.4m, and our disciplined approach to cost control enabled us to report an operating margin that was broadly stable:
• The revenue from Capex Inspection Services was lower than last year and our Opex Maintenance Services continued to benefit from stable volume in a price competitive environment.
• Accelerating the trend seen in 2017, we saw robust growth in demand for testing activities in the Minerals business.
2019 OUTLOOKWe expect to deliver a solid organic revenue growth in our Resources division.
MID- TO LONG-TERM OUTLOOKOur Resources division will grow in the mid- to long-term as we benefit from investments in the exploration and production of Oil and Minerals to meet the demand of the growing population around the world.
EVER BETTER SOLUTIONS INTERTEK DEEPVIEW 3DTM
INSIG
HT
In the complex world of offshore oil and gas production, the time and costs involved in inspecting safety-critical equipment are major issues for drilling contractors and operators. To gain a competitive edge, they require access to precise, digital data on equipment condition that helps monitor performance and improve safety. Under traditional inspection and maintenance programmes, key components often need to be broken down and taken onshore in a time-consuming inspection process. This ties up mission-critical and expensive resources, while the transportation contributes significantly to a company’s carbon footprint.
INN
OVATIO
N
Following in-depth customer conversations drawing on TQA expertise from across our ATIC value chain, Intertek developed a practical, lower-cost process to enable rapid on-deck inspections. DeepView 3D TM is a new, innovative inspection methodology that combines 3D laser scanning and precise metrology data with advanced non-destructive testing (‘NDT’) results that are then joined in 3D space. By combining established technologies to create an innovative new solution, DeepView 3D TM produces a digital equipment condition record, while reducing typical inspection time and significantly minimising a company's environmental impact.
In addition, over time this new solution allows clients to move away from time-based maintenance to a more efficient condition-based programme, generating significant cost savings.
TQA
SOLU
TION
S
Inspection
EVER
BETTER
Using innovation and cutting-edge technologies, Intertek now sets a new standard for digital mechanical integrity data and condition assessment of critical drilling and offshore operational assets.
This margin-accretive, differentiated solution will also allow Intertek to diversify into other areas that involve expensive and hazardous testing requirements, including the aerospace, nuclear, defence, automotive and construction industries. As a result, DeepView 3D TM has generated considerable interest amongst existing and new clients in the oil and gas industry.
Intertek Group plc Annual Report and Accounts 2018 51
Strategic Report

Disciplined performance management focused on margin-accretive revenue growth with strong cash conversion and accretive capital allocation to drive strong returns on invested capital.
KPIs – MEASURING OUR STRATEGY
REVENUE# (£m)
Revenue growth measures how well the Group is expanding its business, and includes currency impacts.
1.2%
4.7%
2,769
2,8012018
2017
OPERATING PROFIT1,# (£m)
Measures profitability of the Group and includes currency impacts.
3.0%
6.9%
3.2%
2018
2017 468
482
423
436
DILUTED EARNINGS PER SHARE1 (pence)
A key measure of value creation for the Board and for shareholders.
3.5%
7.7%
0.9%
191.6
198.3
176.3
174.72018
2017
CASH FLOW FROM OPERATIONS1 (£m)
Shows the ability of the Group to turn profit into cash.
1.1%
0.3%
596
603
579
5812018
2017
FINANCIALThe Group uses a variety of key performance indicators (‘KPIs’) to monitor performance and measure the financial impact of the Group’s strategy. Where applicable, KPIs are based on Adjusted measures in order to provide a meaningful and consistent year-on-year comparison. An explanation and reconciliation of Statutory to Adjusted performance measures is given on pages 62 and 63.
Non-financial KPIs are shown in the Sustainability report on pages 22 to 43.
DEFINITIONS• Constant currency rates (‘CCY’): Growth at constant
exchange rates compares both 2018 and 2017 figures at the average and year-end exchange rates for 2018, in order to remove the impact of currency translation from the Group’s growth figures.
• Organic: Organic measures are used in order to present the Group’s results excluding the results of acquisitions and disposals made since 1 January 2017.
• Operating Profit: Revenue less Operating costs.
• Operating Margin: Operating Profit divided by Revenue.
• Return on Invested Capital: Adjusted Operating Profit less Adjusted Taxes divided by Invested Capital.
• Adjusted Taxes: Adjusted income tax divided by Adjusted Profit Before Tax multiplied by Adjusted Operating Profit.
• Invested Capital: Net Assets less Tax balances, Net debt and Net pension liabilities.
• Diluted Earnings per Share: Profit for the year attributable to equity shareholders of the Company divided by the Diluted weighted average number of shares (see Note 7 to the financial statements).
• Cash flow from Operations: see Group cash flow statement on page 119.
Adjusted actual rates
Adjusted constant rates
Statutory actual rates
2018 Adjusted
2017 Adjusted
Proforma excluding Alchemy
Statutory
Intertek Group plc Annual Report and Accounts 201852
Strategic Report | KPIs – Measuring our strategy

ORGANIC REVENUE (£m)
Revenue growth, excluding acquisitions and disposals.
0.2%
3.7%
2,764
2,7702018
2017
OPERATING MARGIN1 (%)
Margin measures profitability as a proportion of revenue.
30bps
40bps
30bps
16.9
17.2
15.3
15.62018
2017
DIVIDEND PER SHARE2 (pence)
Dividend per share measures returns provided to shareholders.
39.0%
71.3
99.12018
2017
RETURN ON INVESTED CAPITAL AT CONSTANT EXCHANGE RATES3,# (%)
Measures how effectively the Group generates profit from its invested capital.
20.6% 26.9%
(excl. Alchemy)
24.9
20.6 26.92018
2017
IN THIS SECTION
# Revenue, Adjusted Operating Profit and Return on Invested Capital (‘ROIC’) are recalculated using 2017 exchange rates to form the basis for Executive Director remuneration, as described in more detail on pages 98 to 99.
1. Adjusted operating profit, adjusted operating margin, adjusted cash flow from operations and adjusted diluted earnings per share are stated before Separately Disclosed Items, which are described on pages 62 to 63. There is no difference between adjusted and statutory revenue.
2. Dividend per share is based on the interim dividend of 31.9p (2017: 23.5p) plus the proposed final dividend of 67.2p (2017: 47.8p).
3. 2017 ROIC has been prepared using 2018 average exchange rates for Adjusted Operating Profit and Adjusted Tax, and year end 2018 exchange rates for Invested Capital. 2017 ROIC at actual rates was 26.7%.
This section demonstrates the Group’s performance against Key Performance Indicators, summarises the Group’s principal risks and uncertainties and provides commentary on the financial performance of the Group in 2018.
KPIsRead more on page 52
PRINCIPAL RISKS AND UNCERTAINTIESRead more on page 54
FINANCIAL REVIEWRead more on page 60
Intertek Group plc Annual Report and Accounts 2018 53
Strategic Report

PRINCIPAL RISKS AND UNCERTAINTIES
detailed on the following pages including a commentary on how the Group mitigates these risks. These risks and uncertainties do not appear in any particular order of potential materiality or probability of occurrence.
There may be other risks that are currently unknown or regarded as immaterial which could turn out to be material. Any of these risks could have the potential to impact the performance of the Group, its assets, liquidity, capital resources and its reputation.
Our principal risks continue to evolve in response to our changing risk environment. We have added Brexit as a risk this year because of the continuing political uncertainty. We have considered the risks presented by Brexit based on potential scenarios. As part of our risk planning, we have taken steps to relocate our UK-based Notified Bodies to other EU member states as Brexit will have a direct impact on the ability of UK-based Notified Bodies to issue EC certificates for products being sold in the EU markets. Although we are keeping Brexit developments under review, we do not at this stage perceive any material risk to the Company’s viability arising from Brexit.
Two previous risks are no longer identified as principal risks for 2018: litigation risk is no longer seen as a principal risk on a standalone basis as it is a sub-set of the quality and reputation risks; we believe our facilities risk has reduced based on our business continuity planning work.
LONG-TERM VIABILITY STATEMENT In accordance with provision C.2.2 of the UK Corporate Governance Code, the Directors have assessed the viability of the Group over a five-year period to 31 December 2023, by carrying out a robust assessment of the potential impact of the principal risks and uncertainties on the Group’s current position, including those that would threaten the Group’s business model, future performance, solvency or liquidity. This is documented on the following pages.
The Directors have determined that a five-year period is an appropriate period over which to provide the viability statement of the Group, as the Group’s strategic review covers a five-year period.
This section sets out a description of the principal risks and uncertainties that could have a material adverse effect on the Group’s strategy, performance, results, financial condition and reputation.
RISK FRAMEWORKThe Board has overall responsibility for the establishment and oversight of the Group’s risk management framework. This work is complemented by the Group Risk Committee, whose purpose is to manage, assess and promote the continuous improvement of the Group’s risk management, controls and assurance systems. This risk governance framework is described in more detail in the Directors’ Report on pages 83 to 88.
The Head of Internal Audit and the Group General Counsel, who report to the Chief Financial Officer and Chief Executive Officer respectively, have accountability for reporting the key risks that the Group faces, the controls and assurance processes in place and any mitigating actions or controls. Both roles report to the Audit Committee, attend its meetings and meet with individual members each year as required.
Risks are formally identified and recorded in a risk register for the significant countries and for each business line and support function. The risk register is updated at least twice each year and is used to plan the Group’s internal audit and risk strategy.
In addition to the risk register, all senior executives and their direct reports are required to complete an annual return to confirm that management controls have been effectively applied during the year. The return covers Sales, Operations, IT, Finance and People.
PRINCIPAL RISKS The Group is affected by a number of risk factors, some of which, including macroeconomic and industry-specific cyclical risks, are outside the Group’s control. Some risks are particular to Intertek’s operations. The principal risks of which the Group is aware are
Operational
PRINCIPAL RISK CONTEXT POSSIBLE IMPACT MITIGATION 2018 UPDATE
Reputation Reputation is key to the Group maintaining and growing its business. Reputation risk can occur in a number of ways: directly as the result of the actions of the Group or a Group company itself; indirectly due to the actions of an employee or employees; or through the actions of other parties, such as joint venture partners, suppliers, customers or other industry participants.
• Failure to meet financial performance expectations.• Exposure to material legal claims, associated costs
and wasted management time.• Destruction of shareholder value.• Loss of existing or new business.• Loss of key staff.
• Quality Management Systems; adherence to these is regularly audited and reviewed by external parties, including accreditation bodies.
• Risk Management Framework and associated controls and assurance processes, including contractual review and liability caps where appropriate.
• Code of Ethics which is communicated to all staff, who undergo regular training.• Zero-tolerance approach with regard to any inappropriate behaviour by any
individual employed by the Group, or acting on the Group’s behalf.• Whistleblowing programme, monitored by the Audit Committee, where staff are
encouraged to report, without risk, any fraudulent or other activity likely to adversely affect the reputation of the Group.
• Relationship management and communication with external stakeholders.
• This risk remains stable compared with 2017.• The Group continues to invest in staff development,
quality systems and standard processes to prevent operational failures.
Customer Service A failure to focus on customer needs, to provide customer innovation or to deliver our services in accordance with our customers’ expectations and our customer promise.
• May lead to customer dissatisfaction and customer loss.• Gradual erosion of market share and reputation if
competitors are perceived to have better, more responsive or more consistent service offerings.
• Net Promoter Score (‘NPS’) customer satisfaction, customer sales trends and turnaround time tracking.
• Global and Local Key Account Management (‘GKAM’/’LKAM’) initiatives in place.• Customer feedback meetings.• Customer claims/complaints reporting.
• This risk remains stable compared with 2017.
Intertek Group plc Annual Report and Accounts 201854
Strategic Report | Principal risks and uncertainties and Long-term Viability statement

Operational
PRINCIPAL RISK CONTEXT POSSIBLE IMPACT MITIGATION 2018 UPDATE
Reputation Reputation is key to the Group maintaining and growing its business. Reputation risk can occur in a number of ways: directly as the result of the actions of the Group or a Group company itself; indirectly due to the actions of an employee or employees; or through the actions of other parties, such as joint venture partners, suppliers, customers or other industry participants.
• Failure to meet financial performance expectations.• Exposure to material legal claims, associated costs
and wasted management time.• Destruction of shareholder value.• Loss of existing or new business.• Loss of key staff.
• Quality Management Systems; adherence to these is regularly audited and reviewed by external parties, including accreditation bodies.
• Risk Management Framework and associated controls and assurance processes, including contractual review and liability caps where appropriate.
• Code of Ethics which is communicated to all staff, who undergo regular training.• Zero-tolerance approach with regard to any inappropriate behaviour by any
individual employed by the Group, or acting on the Group’s behalf.• Whistleblowing programme, monitored by the Audit Committee, where staff are
encouraged to report, without risk, any fraudulent or other activity likely to adversely affect the reputation of the Group.
• Relationship management and communication with external stakeholders.
• This risk remains stable compared with 2017.• The Group continues to invest in staff development,
quality systems and standard processes to prevent operational failures.
Customer Service A failure to focus on customer needs, to provide customer innovation or to deliver our services in accordance with our customers’ expectations and our customer promise.
• May lead to customer dissatisfaction and customer loss.• Gradual erosion of market share and reputation if
competitors are perceived to have better, more responsive or more consistent service offerings.
• Net Promoter Score (‘NPS’) customer satisfaction, customer sales trends and turnaround time tracking.
• Global and Local Key Account Management (‘GKAM’/’LKAM’) initiatives in place.• Customer feedback meetings.• Customer claims/complaints reporting.
• This risk remains stable compared with 2017.
SCENARIO ASSOCIATED PRINCIPAL RISKS DESCRIPTION
Regulatory environment change • Industry and competitive landscape• Customer service• Regulatory and political change• People retention • Reputation• Brexit
Failure to identify, understand and respond to regulatory or political changes results in loss of revenue, profitability, market share and/or adversely changes the competitive landscape.
Customer service issue • Industry and competitive landscape• Customer service• Business ethics• People retention • Reputation• Brexit
Failure to respond/adapt to a customer service issue leads to a loss of key customers and detrimentally impacts reputation.
Ethical and/or quality breach • Customer service• Business ethics• People retention• Financial risk • Operational health, safety and security• Reputation• Brexit
An ethical and/or quality breach leads to litigation (including significant fines and debarment from certain territories / activities), reputational damage, loss of accreditation and erosion of customer confidence.
IT systems breach • Customer service • People retention • IT systems and data security• Reputation• Brexit
A serious data security / IT systems breach results in a significant financial penalty and a loss of reputation among customers.
Furthermore, the Directors believe the five-year period appropriately reflects the average business cycles of the business lines in which the Group operates, particularly in relation to capital expenditure investment horizons.
In addition to the bottom-up strategic review process where the prospects of each business line are reviewed, an assessment has been made of the potential operational and financial impacts on the Group of the principal risks and uncertainties outlined in the following pages. The Directors have also assessed certain combinations of these principal risks and uncertainties in a number of severe, but plausible, scenarios, as well as the effectiveness of any mitigating actions.
The Group has a broad customer base across its multiple business lines and in its different geographic regions, and is supported by a robust Balance Sheet and strong operational cash flows. The Board considers that the diverse nature of business lines and geographies in which the Group operates significantly mitigates the impact that any of these scenarios might have on the Group’s viability.
Based on this assessment, the Directors confirm that they have a reasonable expectation that the Company will be able to continue in operation and meet its liabilities as they fall due over the period to 31 December 2023. The statement on going concern is in the Directors’ Report on page 88.
Intertek Group plc Annual Report and Accounts 2018 55
Strategic Report

PRINCIPAL RISKS AND UNCERTAINTIEScontinued
Operational
PRINCIPAL RISK CONTEXT POSSIBLE IMPACT MITIGATION 2018 UPDATE
People Retention The Group operates in specialised sectors and needs to attract and retain employees with relevant experience and knowledge in order to take advantage of all growth opportunities.
• Poor management succession.• Lack of continuity.• Failure to optimise growth.• Impact on quality, reputation and customer confidence.• Loss of talent to competitors and lost market share.
• HR strategy policies and systems.• Development and reward programme to retain and motivate employees.• Succession planning to ensure effective continuation of leadership
and expertise.
• This risk remains stable compared with 2017.
Operational Health, Safety and Security
Any health and safety incident arising from our activities. This could result in injury to Intertek’s employees, sub-contractors, customers and/or any other stakeholders affected.
• Individual or multiple injuries to employees and others.• Litigation or legal/regulatory enforcement action
(including prosecution) leading to reputational damage.• Loss of accreditation.• Erosion of customer confidence.
• Quality management and associated controls, including safety training, appropriate PPE (Personal Protective Equipment), Health & Safety policies (including due diligence on sub-contractors), meetings and communication.
• Avoiding fatalities, accidents and hazardous situations is paramount. It is expected that Intertek employees will operate to the highest standards of health and safety at all times and there are controls in place to reduce incidents.
• This risk remains stable compared with 2017.
Industry and Competitive Landscape
A failure to identify, manage and take advantage of emerging and future risks. Examples include the opportunities provided by new markets and customers, a failure to innovate in terms of serviceoffering and delivery, the challenge of radically new and different business models, and the failure to foresee the impact of, or adequately respond to and comply with, changing or new laws and regulations. Macroeconomic factors such as a global/market downturn and contraction/changing requirements in certain sectors.
• Failure to maximise revenue opportunities.• Failure to take advantage of new opportunities.• Lack of ability to respond flexibly.• Erosion of market share.• Impact on share price.• Failure to respond to macroeconomic factors.• Sanctions and fines for non-compliance with
new laws, etc.
• GKAM and LKAM initiatives in place.• Diversification of customer base.• Focus on new services and acquisitions.• Tracking new laws and regulations.• Regular strategic and business line reviews.• Development of ATIC-selling initiatives.• NPS customer research to understand customer satisfaction.
• This risk remains stable compared with 2017.• The Group’s results have been impacted by the lower
levels of capital expenditure in the energy sector, driven by lower oil prices, but more than offset by the diverse nature of the Group and its ability to grow revenue and manage the cost base.
UK Withdrawal from the EU (Brexit)
Flow of goods and services: increased friction at customs points could disrupt our customers’ “just in time” supply chains in the short-term or lead to changes in global supply chains in the mid- to longer-term. People: restrictions on the free movement of people between the UK and EU could make it more difficult to attract and retain talent in those markets. Regulatory environment: de-harmonisation relating to product or manufacturing standards could increase the regulatory burden on our customers and have an impact their investment decisions.
• Reduced work volumes or delays in anticipated customer orders.
• Longer-term changes in global supply chains could lead to a need to refocus our service offering or delivery locations to align optimally with customer requirements and to remain competitive.
• A failure to attract and retain talent could lead to a failure to optimise growth.
• A failure to identify, understand and align our service offering and delivery with additional or diverging regulatory barriers could lead to a loss of revenue / profitability / market share.
• Monitoring of legal / regulatory / political developments affecting Group companies and our ability to operate.
• Engagement with customers to monitor developments, views and feedback.• Monitoring of media and public statements by customers / regulatory bodies /
other stakeholders.• Liaising with UK Government departments to gather intelligence and explore
opportunities to support.• Brexit planning to mitigate impacts on Notified Bodies, people and customer
service delivery.• Access to market sector analysis from advisers.• Prioritised investment in growth / strategic areas.
• This has been added as a new risk as political uncertainty remains.
• Brexit has a direct impact on our U.K. Notified Bodies and we have taken steps to relocate these businesses to address that risk.
• We continue to monitor developments.
IT Systems and Data Security
Systems integrity: major IT systems integrity issue, or data security breach, either due to internal or external factors such as deliberate interference or power shortages/cuts etc.Systems functionality: a failure to define the right IT strategies, maintain existing IT systems or implement new IT systems with the required functionality and which are fit for purpose, in each case to support the Group’s growth, innovation and competitive customer offering.Data security: a failure to adequately protect the Group’s confidential information, customer confidential information or the personal data of the Group’s employees, customers or other stakeholders.
• Loss of revenue due to down time.• Potential loss of sensitive data with associated legal
implications, including regulatory sanctions and potential fines.
• Potential costs of IT systems replacement and repair.• Loss of customer confidence.• Damage to reputation.• Loss of revenue/profitability if we fail to adopt an IT
investment strategy which supports the Group’s growth, innovation and customer offering.
• Information systems policy and governance structure.• Regular system maintenance.• Backup systems in place.• Disaster recovery plans that are constantly tested and improved to minimise
the impact if a failure does occur.• Global Information Security policies in place (IT, Data Protection, Cyber Security).• Adherence to IT finance systems controls (part of Core Mandatory Controls
(‘CMCs’)).• Adherence to IT general controls.• Internal and external audit testing.
• This risk remains stable compared with 2017.• Additional work being undertaken to ensure
continued adherence to the EU’s General Data Protection Regulation since implementation in May 2018.
Intertek Group plc Annual Report and Accounts 201856
Strategic Report | Principal risks and uncertainties and Long-term Viability statement
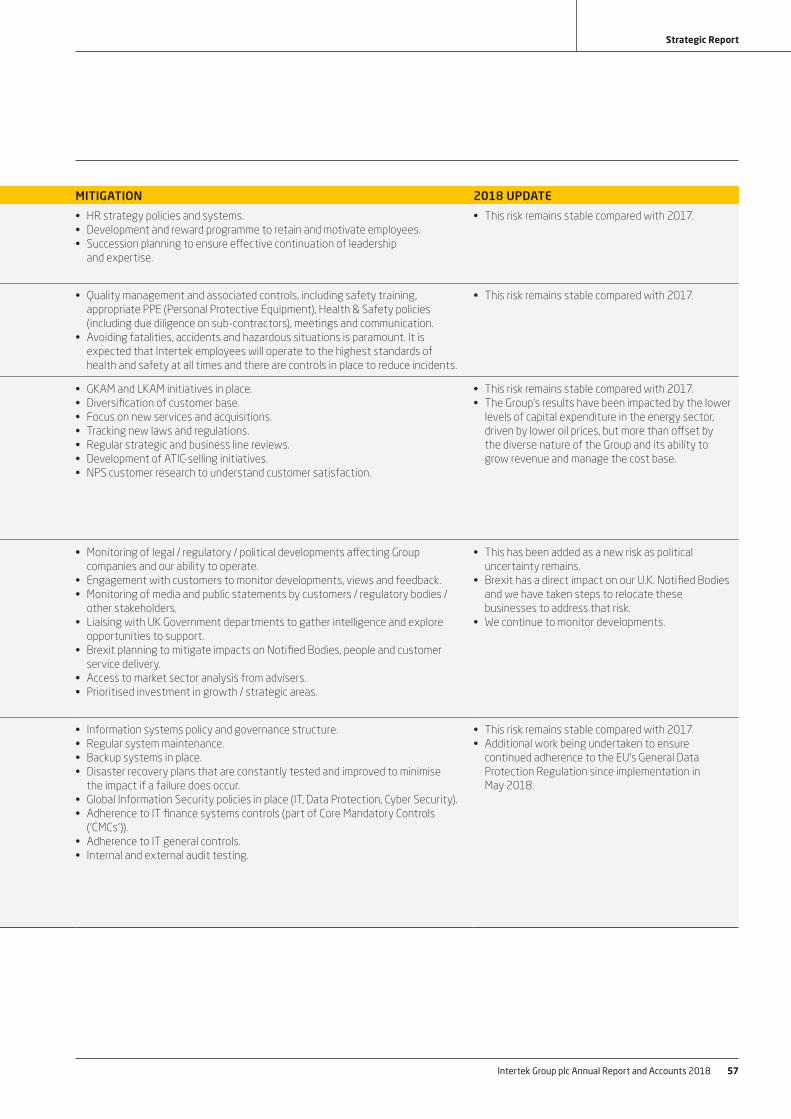
Operational
PRINCIPAL RISK CONTEXT POSSIBLE IMPACT MITIGATION 2018 UPDATE
People Retention The Group operates in specialised sectors and needs to attract and retain employees with relevant experience and knowledge in order to take advantage of all growth opportunities.
• Poor management succession.• Lack of continuity.• Failure to optimise growth.• Impact on quality, reputation and customer confidence.• Loss of talent to competitors and lost market share.
• HR strategy policies and systems.• Development and reward programme to retain and motivate employees.• Succession planning to ensure effective continuation of leadership
and expertise.
• This risk remains stable compared with 2017.
Operational Health, Safety and Security
Any health and safety incident arising from our activities. This could result in injury to Intertek’s employees, sub-contractors, customers and/or any other stakeholders affected.
• Individual or multiple injuries to employees and others.• Litigation or legal/regulatory enforcement action
(including prosecution) leading to reputational damage.• Loss of accreditation.• Erosion of customer confidence.
• Quality management and associated controls, including safety training, appropriate PPE (Personal Protective Equipment), Health & Safety policies (including due diligence on sub-contractors), meetings and communication.
• Avoiding fatalities, accidents and hazardous situations is paramount. It is expected that Intertek employees will operate to the highest standards of health and safety at all times and there are controls in place to reduce incidents.
• This risk remains stable compared with 2017.
Industry and Competitive Landscape
A failure to identify, manage and take advantage of emerging and future risks. Examples include the opportunities provided by new markets and customers, a failure to innovate in terms of serviceoffering and delivery, the challenge of radically new and different business models, and the failure to foresee the impact of, or adequately respond to and comply with, changing or new laws and regulations. Macroeconomic factors such as a global/market downturn and contraction/changing requirements in certain sectors.
• Failure to maximise revenue opportunities.• Failure to take advantage of new opportunities.• Lack of ability to respond flexibly.• Erosion of market share.• Impact on share price.• Failure to respond to macroeconomic factors.• Sanctions and fines for non-compliance with
new laws, etc.
• GKAM and LKAM initiatives in place.• Diversification of customer base.• Focus on new services and acquisitions.• Tracking new laws and regulations.• Regular strategic and business line reviews.• Development of ATIC-selling initiatives.• NPS customer research to understand customer satisfaction.
• This risk remains stable compared with 2017.• The Group’s results have been impacted by the lower
levels of capital expenditure in the energy sector, driven by lower oil prices, but more than offset by the diverse nature of the Group and its ability to grow revenue and manage the cost base.
UK Withdrawal from the EU (Brexit)
Flow of goods and services: increased friction at customs points could disrupt our customers’ “just in time” supply chains in the short-term or lead to changes in global supply chains in the mid- to longer-term. People: restrictions on the free movement of people between the UK and EU could make it more difficult to attract and retain talent in those markets. Regulatory environment: de-harmonisation relating to product or manufacturing standards could increase the regulatory burden on our customers and have an impact their investment decisions.
• Reduced work volumes or delays in anticipated customer orders.
• Longer-term changes in global supply chains could lead to a need to refocus our service offering or delivery locations to align optimally with customer requirements and to remain competitive.
• A failure to attract and retain talent could lead to a failure to optimise growth.
• A failure to identify, understand and align our service offering and delivery with additional or diverging regulatory barriers could lead to a loss of revenue / profitability / market share.
• Monitoring of legal / regulatory / political developments affecting Group companies and our ability to operate.
• Engagement with customers to monitor developments, views and feedback.• Monitoring of media and public statements by customers / regulatory bodies /
other stakeholders.• Liaising with UK Government departments to gather intelligence and explore
opportunities to support.• Brexit planning to mitigate impacts on Notified Bodies, people and customer
service delivery.• Access to market sector analysis from advisers.• Prioritised investment in growth / strategic areas.
• This has been added as a new risk as political uncertainty remains.
• Brexit has a direct impact on our U.K. Notified Bodies and we have taken steps to relocate these businesses to address that risk.
• We continue to monitor developments.
IT Systems and Data Security
Systems integrity: major IT systems integrity issue, or data security breach, either due to internal or external factors such as deliberate interference or power shortages/cuts etc.Systems functionality: a failure to define the right IT strategies, maintain existing IT systems or implement new IT systems with the required functionality and which are fit for purpose, in each case to support the Group’s growth, innovation and competitive customer offering.Data security: a failure to adequately protect the Group’s confidential information, customer confidential information or the personal data of the Group’s employees, customers or other stakeholders.
• Loss of revenue due to down time.• Potential loss of sensitive data with associated legal
implications, including regulatory sanctions and potential fines.
• Potential costs of IT systems replacement and repair.• Loss of customer confidence.• Damage to reputation.• Loss of revenue/profitability if we fail to adopt an IT
investment strategy which supports the Group’s growth, innovation and customer offering.
• Information systems policy and governance structure.• Regular system maintenance.• Backup systems in place.• Disaster recovery plans that are constantly tested and improved to minimise
the impact if a failure does occur.• Global Information Security policies in place (IT, Data Protection, Cyber Security).• Adherence to IT finance systems controls (part of Core Mandatory Controls
(‘CMCs’)).• Adherence to IT general controls.• Internal and external audit testing.
• This risk remains stable compared with 2017.• Additional work being undertaken to ensure
continued adherence to the EU’s General Data Protection Regulation since implementation in May 2018.
Intertek Group plc Annual Report and Accounts 2018 57
Strategic Report

PRINCIPAL RISKS AND UNCERTAINTIEScontinued
Legal and Regulatory
PRINCIPAL RISK CONTEXT POSSIBLE IMPACT MITIGATION 2018 UPDATE
Business Ethics Non-compliance with Intertek’s Code of Ethics (‘Code’) and/or related laws such as anti-bribery, anti-money laundering, and fair competition legislation. Non- compliance could be either accidental or deliberate, and committed either by our people or sub-contractors who must also abide by the Code.
• Litigation, including significant fines and debarment from certain territories/activities.
• Reputational damage.• Loss of accreditation.• Erosion of customer confidence.• Impact on share price.
• Annual Code of Ethics training and sign-off requirement.• Whistleblowing programme, monitored by the Group Risk Committee,
where staff are encouraged to report, without risk, any fraudulent or other activity likely to adversely affect the reputation of the Group.
• Enhanced processes for engagement with suppliers and third parties.• Zero-tolerance approach with regard to any inappropriate behaviour by any
individual employed by the Group, or acting on the Group’s behalf.• The Group employs local people in each country who are aware of local legal
and regulatory requirements. There are also extensive internal compliance and audit systems to facilitate compliance. Expert advice is taken in areas where regulations are uncertain.
• The Group continues to dedicate resources to ensure compliance with the UK Bribery Act and all other anti-bribery legislation, and internal policy.
• This risk remains stable compared with 2017.• Ongoing annual confirmations ensure that staff
verify compliance with the Code of Ethics.• Local compliance officers perform due diligence on
sub-contractors to check that they have signed the Group’s Code.
• During 2018, 158 (2017: 202) non-compliance issues were reported through the whistleblowing hotline and other routes. All were investigated with 45 (2017: 36) substantiated and corrective action taken.
Regulatory and Political Landscape
A failure to identify and respond appropriately to a change in law and/or regulation, or to a political decision, event or condition which could impact demand for the Group’s services or the Group’s ability to grow, innovate and/or provide a competitive customer offering in any existing or new industry sector or market.
• Loss of revenue, profitability and/or market share.• Increase to costs of operations, reduction in profitability.• Reduction in the attractiveness of investment in specific
business, sectors or markets and/or adverse change the competitive landscape.
• Monitoring of regulatory environment and political developments.• Analysis of impact of regulatory and political changes on operational SOPs
and Group policies.• Membership of relevant associations, e.g. IFIA with related advocacy and
liaison activities.
• This risk remains stable compared with 2017.
Financial
Financial Risk Risk of theft, fraud or financial misstatement by employees. On acquisitions or investments, the financial risk or exposure arising from due diligence, integration or performance delivery failures.
• Financial losses with a direct impact on the bottom line.• Large-scale losses can affect financial results.• Potential legal proceedings leading to costs and or
management time.• Corresponding loss of value and reputation could result
in funding being withdrawn or provided at higher interest rates.
• Possible adverse publicity.
• The Group has financial, management and systems controls in place to ensure that the Group’s assets are protected from major financial risks.
• Adherence to Authorities Grid (which sets approval limits for financial transactions).
• Legal, financial and other due diligence on M&A and other investments.• A detailed system of financial reporting is in place to ensure that monthly
financial results are thoroughly reviewed. The Group also operates a rigorous programme of internal audits and management reviews. Independent external auditors review the Group’s half-year results and audit the Group’s annual financial statements.
• This risk remains stable compared with 2017. • ‘Doing Business the Right Way’ established as core
principle within Intertek.• Review and update of core mandatory controls for
year-end compliance certification.
Intertek Group plc Annual Report and Accounts 201858
Strategic Report | Principal risks and uncertainties and Long-term Viability statement

Legal and Regulatory
PRINCIPAL RISK CONTEXT POSSIBLE IMPACT MITIGATION 2018 UPDATE
Business Ethics Non-compliance with Intertek’s Code of Ethics (‘Code’) and/or related laws such as anti-bribery, anti-money laundering, and fair competition legislation. Non- compliance could be either accidental or deliberate, and committed either by our people or sub-contractors who must also abide by the Code.
• Litigation, including significant fines and debarment from certain territories/activities.
• Reputational damage.• Loss of accreditation.• Erosion of customer confidence.• Impact on share price.
• Annual Code of Ethics training and sign-off requirement.• Whistleblowing programme, monitored by the Group Risk Committee,
where staff are encouraged to report, without risk, any fraudulent or other activity likely to adversely affect the reputation of the Group.
• Enhanced processes for engagement with suppliers and third parties.• Zero-tolerance approach with regard to any inappropriate behaviour by any
individual employed by the Group, or acting on the Group’s behalf.• The Group employs local people in each country who are aware of local legal
and regulatory requirements. There are also extensive internal compliance and audit systems to facilitate compliance. Expert advice is taken in areas where regulations are uncertain.
• The Group continues to dedicate resources to ensure compliance with the UK Bribery Act and all other anti-bribery legislation, and internal policy.
• This risk remains stable compared with 2017.• Ongoing annual confirmations ensure that staff
verify compliance with the Code of Ethics.• Local compliance officers perform due diligence on
sub-contractors to check that they have signed the Group’s Code.
• During 2018, 158 (2017: 202) non-compliance issues were reported through the whistleblowing hotline and other routes. All were investigated with 45 (2017: 36) substantiated and corrective action taken.
Regulatory and Political Landscape
A failure to identify and respond appropriately to a change in law and/or regulation, or to a political decision, event or condition which could impact demand for the Group’s services or the Group’s ability to grow, innovate and/or provide a competitive customer offering in any existing or new industry sector or market.
• Loss of revenue, profitability and/or market share.• Increase to costs of operations, reduction in profitability.• Reduction in the attractiveness of investment in specific
business, sectors or markets and/or adverse change the competitive landscape.
• Monitoring of regulatory environment and political developments.• Analysis of impact of regulatory and political changes on operational SOPs
and Group policies.• Membership of relevant associations, e.g. IFIA with related advocacy and
liaison activities.
• This risk remains stable compared with 2017.
Financial
Financial Risk Risk of theft, fraud or financial misstatement by employees. On acquisitions or investments, the financial risk or exposure arising from due diligence, integration or performance delivery failures.
• Financial losses with a direct impact on the bottom line.• Large-scale losses can affect financial results.• Potential legal proceedings leading to costs and or
management time.• Corresponding loss of value and reputation could result
in funding being withdrawn or provided at higher interest rates.
• Possible adverse publicity.
• The Group has financial, management and systems controls in place to ensure that the Group’s assets are protected from major financial risks.
• Adherence to Authorities Grid (which sets approval limits for financial transactions).
• Legal, financial and other due diligence on M&A and other investments.• A detailed system of financial reporting is in place to ensure that monthly
financial results are thoroughly reviewed. The Group also operates a rigorous programme of internal audits and management reviews. Independent external auditors review the Group’s half-year results and audit the Group’s annual financial statements.
• This risk remains stable compared with 2017. • ‘Doing Business the Right Way’ established as core
principle within Intertek.• Review and update of core mandatory controls for
year-end compliance certification.
Intertek Group plc Annual Report and Accounts 2018 59
Strategic Report

+1.2% +4.7%Revenue up to £2,801m
+39.0%Dividend per share
+3.0% +6.9%Adjusted operating profit up to £482m
+3.2% +7.2%Statutory operating profit up to £436m
+30bps +40bpsAdjusted operating margin up to 17.2%
+30bps +40bpsStatutory operating margin up to 15.6%
+3.5% +7.7%Adjusted diluted EPS
(0.9)% +3.2%Statutory diluted EPS
£389mAcquisitions
£113mOrganic investment spend
£110m (20.7)%Working capital
3.9% (110)bpsWorking capital % revenue
Actual rates Constant rates
CONSOLIDATED INCOME STATEMENT COMMENTARY Revenue for the year was £2,801.2m, up 1.2% (up 4.7% at constant exchange rates), with organic revenue growth of 3.7% at constant exchange rates.
The Group’s organic revenue reflected 5.2% growth in the Products division and 2.2% growth in the Trade division, while trading conditions in our Resources division resulted in a stable revenue performance in 2018.
The Group’s adjusted operating profit was £481.8m, up 3.0% on the prior year (up 6.9% at constant exchange rates).
The adjusted operating margin was 17.2%, an increase of 40bps from the prior year at constant exchange rates, representing a record for the Group. Adjusted organic operating margin at constant rates increased by 30bps as we benefited from positive operating leverage and margin-accretive divisional mix. It is also pleasing to note the positive contribution of acquisitions to the Group, which added 10bps to margin in 2018.
In March 2016, the Group announced its 5x5 differentiated strategy for growth and our implementation continued at pace in 2018, and after three years we are now over halfway through our portfolio review. Consistent with the delivery of our 5x5 strategy for growth enablers, we also continued to refine our organisational structure to effectively support our business model. In line with this, a £13.6m restructuring cost has been recognised in Separately Disclosed Items (SDIs) in the year, which impacted 18 business units in the year, taking the total programme to 76 business units.
The Group’s statutory operating profit for the year was £436.2m (2017: £422.7m), with statutory operating margin of 15.6%, up 30bps on the prior year. The Group’s statutory profit for the year after tax was £305.2m (2017: £306.4m) reflecting higher SDIs in the year and an increased tax charge.
Improved organic revenue growth and a focus on cost and operational initiatives delivered a record margin for the Group.
We have continued to make strong progress in the delivery of our 5x5 differentiated strategy for growth. In 2018, we accelerated organic revenue growth, further improved operating profit margin to a record 17.2% and delivered strong EPS growth. Our focus on cash and balance sheet efficiency delivered strong cash conversion and continued improvements in ROIC on an underlying basis.”
Ross McCluskeyChief Financial Officer
FINANCIAL REVIEW
Intertek Group plc Annual Report and Accounts 201860
Strategic Report | Financial review

NET FINANCING COSTSThe Group benefitted from a lower adjusted net financing cost of £25.3m (2017: £28.9m) in the year. Adjusted net financing costs pre-foreign exchange movements declined by £0.1m in the year to £26.8m (2017: £26.9m), despite the acquisition of Alchemy in August 2018. Foreign exchange movements resulted in a gain of £1.5m in the year (2017: £2.0m loss). The statutory net financing cost of £31.7m included £6.4m (2017: £0.5m) relating to SDIs.
TAXThe Group effective tax rate on adjusted profit before income tax was 24.7% (2017: 24.5%) reflecting the unwind of the one-off 2017 benefit from the US tax reforms being offset by the recognition of additional deferred tax assets. The adjusted tax charge, which excludes the impact of SDIs, is £112.8m (2017: £107.5m).
The statutory tax charge, including the impact of SDIs, of £99.3m (2017: £86.9m), equates to an effective rate of 24.5% (2017: 22.1%) and the cash tax on adjusted results is 20.4% (2017: 23.0%).
RESULTS FOR THE YEAR
Key financials2018
£m2017
£m
Revenue 2,801.2 2,769.1Adjusted Group operating profit 481.8 467.7Adjusted diluted EPS 198.3p 191.6pStatutory Group operating profit 436.2 422.7Statutory diluted EPS 174.7p 176.3pAdjusted profit after tax 343.7 331.3Statutory profit after tax 305.2 306.4Adjusted cash flow from operations 602.9 596.1Statutory cash flow from operations 580.9 579.2Dividend per share 99.1p 71.3pDividends paid in the year 128.3 107.0
The underlying performance of the business, by division, is shown in the table below:
Revenue Adjusted operating profit
Notes2018
£m
Change atactual rates
%
Change atconstant
rates%
2018£m
Change atactual rates
%
Change atconstant
rates%
Products 2 1,680.2 3.4 6.6 371.0 5.8 9.5Trade 2 642.1 (0.9) 3.1 83.4 (6.0) (1.3)Resources 2 478.9 (3.4) 0.3 27.4 (3.9) (0.4)Group total 2,801.2 1.2 4.7 481.8 3.0 6.9Net financing costs 14 (25.3)Adjusted profit before income tax 456.5 4.0 8.3Adjusted Income tax expense 6 112.8Adjusted profit for the year 343.7 3.7 8.0Adjusted diluted EPS 7 198.3p 3.5 7.7
FIVE-YEAR PERFORMANCE Adjusted Diluted EPS1 (pence)
+7.4% CAGR3
Dividend per Share2 (pence)
+16.6% CAGR3
1. Presentation of results: To provide readers with a clear and consistent presentation of the underlying operating performance of the Group’s business, some figures discussed in this review are presented before Separately Disclosed Items (see note 3 of the financial statements). A reconciliation between Adjusted and Statutory performance measures is set out overleaf.
2. Dividend per share for 2018 is based on the interim dividend paid of 31.9p (2017: 23.5p) plus the proposed final dividend of 67.2p (2017: 47.8p).
3. CAGR represents the compound annual growth rate from 2013 to 2018.
138.6
132.1
140.7
167.7
191.6
198.3
2014
2013
2015
2016
2018
2017
46.0
49.1
52.3
62.4
71.3
99.1
2014
2013
2015
2016
2018
2017
Intertek Group plc Annual Report and Accounts 2018 61
Strategic Report

EARNINGS PER SHAREThe Group delivered adjusted diluted earnings per share (‘EPS’) of 198.3p (2017: 191.6p). Diluted EPS after SDIs was 174.7p (2017: 176.3p), and basic EPS was 176.8p (2017: 178.6p).
DIVIDENDIn line with our new dividend policy that targets a payout of circa 50%, the Board recommends a full-year dividend of 99.1p per share, an increase of 39%. This recommendation reflects the Group’s earnings progression, strong financial position and the Board’s confidence in the Group’s structural growth drivers into the future.
The full-year dividend of 99.1p represents a total cost of £159.9m or 50% of adjusted profit attributable to shareholders of the Group for 2018 (2017: £115.1m and 37%). The dividend is covered 2.0 times by earnings (2017: 2.7 times), based on adjusted diluted earnings per share divided by dividend per share.
5X5 STRATEGY IMPLEMENTATIONIn March 2016, the Group announced its 5x5 differentiated strategy for growth, with the aim to move the centre of gravity of the Company towards high-growth, high-margin areas in its industry, which included two strategic priorities relevant to the operational structure of the business:
• to operate a portfolio that delivers focused growth amongst the business lines, countries and services, including a strategic review of underperforming business units.
• to deliver operational excellence in every operation to drive productivity, including re-engineering of unnecessary processes and layers and the refinement of our organisational structure.
During the year, the Group has continued to implement certain non-recurring action plans identified through the portfolio review in specific country and/or business line combinations, consistent with the 5x5 strategy, with a resulting charge of £13.6m in the year. These activities included the termination of certain business lines in some countries; the closure and consolidation of business line locations in certain countries; the reorganisation of various management structures either in-country or across multiple countries in a region; or the fundamental reorganisation of global business lines including direct staff, management and support function structures.
Restructuring charges are included in the SDI section below, in instances where they have been specifically identified as part of the portfolio review, are non-recurring and meet the IAS 37 criteria, in contrast to restructuring costs for ongoing standard cost-efficiency and cost-saving opportunities, which are incurred within adjusted results.
PENSIONSThe Group’s net pension liabilities reduced to £12.5m (2017: £17.8m) driven by periodic update to our actuarial assumptions.
The Group has noted the recent High Court ruling regarding guaranteed minimum pension liabilities and our work to quantify the impact is underway, although it is not expected to be meaningful.
In 2018, the Group recorded a £5.4m (2017: nil) pension curtailment gain on the UK defined benefit scheme.
SEPARATELY DISCLOSED ITEMS (‘SDIs’)A number of items are separately disclosed in the financial statements as exclusion of these items provides readers with a clear and consistent presentation of the underlying operating performance of the Group’s business. Reconciliations of the Statutory to Adjusted measures are given below.
When applicable, these SDIs include amortisation of acquisition intangibles; impairment of goodwill and other assets; the profit or loss on disposals of businesses or other significant fixed assets; costs related to acquisition activity; the cost of any fundamental restructuring of a business; material claims and settlements; significant recycling of amounts from equity to the income statement; and unrealised market or fair value gains or losses on financial assets or liabilities, including contingent consideration.
Adjusted operating profit excludes the amortisation of acquired intangible assets, primarily customer relationships, as we do not believe that the amortisation charge in the Income Statement provides useful information about the cash costs of running our business as these assets will be supported and maintained by the ongoing marketing and promotional expenditure, which is already reflected in operating costs. Amortisation of software, however, is included in adjusted operating profit as it is similar in nature to other capital expenditure. The costs of any restructuring as part of our 5x5 differentiated strategy for growth are excluded from adjusted operating profit where they represent fundamental changes in individual operations around the Group as a result of the portfolio activities discussed above and are not expected to recur in those operations. The impairment of goodwill and other assets that by their nature or size are not expected to recur, the profit and loss on disposals of businesses or other significant assets and the costs associated with successful, active or aborted acquisitions are excluded from adjusted operating profit in order to provide useful information regarding the underlying performance of the Group’s operations.
The SDIs charge for 2018 comprises amortisation of acquisition intangibles of £24.6m (2017: £16.0m); acquisition costs relating to successful, active or aborted acquisitions of £8.5m (2017: £3.2m); restructuring costs (as described above) of £13.6m (2017: £12.4m); and gain on disposal of subsidiaries and associates of £1.1m (2017: £nil).
2018 RECONCILIATION OF STATUTORY TO ADJUSTED PERFORMANCE MEASURES£m Statutory SDIs Adjusted
Revenue 2,801.2 – 2,801.2Operating profit 436.2 45.6 481.8Operating margin (%) 15.6% 1.6% 17.2% Net financing costs (31.7) 6.4 (25.3) Income tax expense (99.3) (13.5) (112.8)Profit for the year 305.2 38.5 343.7 Cash flow from operations 580.9 22.0 602.9
Basic EPS (p) 176.8p 23.9p 200.7pDiluted EPS (p) 174.7p 23.6p 198.3p
FINANCIAL REVIEWcontinued
Intertek Group plc Annual Report and Accounts 201862
Strategic Report | Financial review

2017 RECONCILIATION OF STATUTORY TO ADJUSTED PERFORMANCE MEASURES£m Statutory SDIs Adjusted
Revenue 2,769.1 – 2,769.1Operating profit 422.7 45.0 467.7Operating margin (%) 15.3% 1.6% 16.9%Net financing costs (29.4) 0.5 (28.9)Income tax expense (86.9) (20.6) (107.5)Profit for the year 306.4 24.9 331.3Cash flow from operations 579.2 16.9 596.1Basic EPS (p) 178.6p 15.5p 194.1pDiluted EPS (p) 176.3p 15.3p 191.6p
Further information on Separately Disclosed Items is given in note 3 to the financial statements.
ACQUISITIONS AND INVESTMENTOne of the key corporate goals of the Group’s 5x5 strategy is delivering an accretive, disciplined capital allocation policy. As a result the Group invests both organically, and by acquiring or investing in complementary businesses to strengthen our portfolio in the locations demanded by clients. This approach enables the Group to focus on those existing business lines or countries with good growth and margin prospects where we have market-leading positions or to enter new exciting growth areas offering the latest technologies and quality assurance services.
Acquisitions and investmentsThe Group completed four (2017: two) acquisitions in the year with 2018 cash consideration of £387.9m (2017: £27.4m), net of cash acquired of £5.6m (2017: £2.1m).
In March 2018, the Group acquired Aldo Abela Surveys Limited (“AAS”), a leading provider of quality and quantity cargo inspection services, based in Malta.
In April 2018, the Group acquired Proasem S.A.S. (“Proasem”), a leading provider of laboratory testing, inspection, metrology and training services to the Oil & Gas sector, based in Colombia.
In June 2018, the Group acquired NTA Monitor Limited (“NTA”), a leading network security and assurance services provider, based in the UK and Malaysia.
In August 2018, the Group acquired Alchemy Investment Holdings, Inc. (“Alchemy”), an industry leader in People Assurance solutions for the food industry, based in the USA.
These acquisitions provide valuable additional service lines and new geographic locations for the Group, and will help drive future profitable revenue growth and further accelerate the growth momentum of our high-margin and capital-light assurance business.
In 2018, £0.1m (2017: £7.8m) was spent in relation to consideration for prior-year acquisitions.
Organic investmentThe Group also invested £113.2m (2017: £112.9m) organically in laboratory expansions, new technologies (including software) and equipment and other facilities. This investment represented 4.0% of revenue (2017: 4.1%).
KEY PERFORMANCE INDICATORSThe Group uses a variety of key performance indicators (‘KPIs’) to monitor the financial performance of the Group and operating divisions. The specific metrics and associated definitions are disclosed on pages 52 to 53.
Organic revenue at constant currency is presented to show the Group’s revenue excluding the effects of the change in the scope of the consolidation (acquisitions and disposals made since 1 January 2017) and removing the impact of currency translation from the Group’s growth figures.
Organic revenue at constant currency
2018£m
2017£m
Change%
Reported revenue 2,801.2 2,769.1 1.2%less: Acquisitions / disposals revenue (31.4) (4.9)Organic revenue 2,769.8 2,764.2 0.2% Impact of foreign exchange movements – 92.5Organic revenue at constant currency 2,769.8 2,671.7 3.7%
The rate of return on invested capital (‘ROIC’), defined as adjusted operating profit less adjusted taxes divided by invested capital, measures the efficiency of Group investments. This is a key measure to assess the efficiency of investment decisions and is also an important criterion in the decision-making process when projects are competing for limited funds.
ROIC in 2018 of 20.6% compares to 24.9% in the prior year at constant exchange rates. Excluding the impact of Alchemy which was acquired in August 2018, ROIC in 2018 was 26.9%, 200bps up versus prior year.
Return on Invested Capital at constant currency
2018£m
2017£m
Change%
Adjusted operating profit 481.8 450.8 6.9%less: Adjusted tax* (119.1) (110.5) 7.8%Adjusted profit after tax 362.7 340.3 6.6%Invested capital* 1,764.2 1,366.2 29.1%ROIC % 20.6% 24.9% (430)bps
Return on Invested Capital at constant currency (excluding Alchemy)
2018£m
2017£m
Change%
Adjusted operating profit 483.2 450.8 7.2%less: Adjusted tax* (119.4) (110.5) 8.1%Adjusted profit after tax 363.8 340.3 6.9%Invested capital* 1,354.9 1,366.2 (0.8)%ROIC % 26.9% 24.9% 200bps
* Definitions of the above measures are given on page 52.
Intertek Group plc Annual Report and Accounts 2018 63
Strategic Report

CASH FLOW AND NET DEBTCash flowThe Group relies on a combination of debt and internal cash resources to fund its investment plans. One of the key metrics for measuring the ability of the business to generate cash is cash flow from operations. Due to the cash payments associated with the SDIs, and to provide a complete picture of the underlying performance of the Group, adjusted cash flow from operations is shown below to illustrate the cash generated by the Group:
2018£m
2017£m
Change%
Cash flow from operations 580.9 579.2 0.3%add back: Cash flow relating to SDIs 22.0 16.9 30.2%Adjusted cash flow from operations 602.9 596.1 1.1%add back: Special contributions to pension schemes 2.0 2.8 (28.6)%Cash flow for cash conversion 604.9 598.9 1.0%Cash conversion % 125.6% 128.1% (250)bps
A reconciliation of cash generated from operations to free cash flow is provided below:
Free Cash Flow Reconciliation2018
£m
2017Restated1
£m
Cash Generated from Operations 580.9 579.2less: Net capital expenditure (109.7) (109.7)add back: Interest received 1.8 1.2less: Interest paid (29.3) (28.3)less: Income tax paid (93.1) (100.8)Free cash flow 350.6 341.6add back: SDI Cash outflow 22.0 16.9Adjusted free cash flow 372.6 358.5
1. 2017 adjusted and statutory free cash flows have been restated from £341.6m and £308.7m respectively as disclosed in the 2017 Annual Report and Accounts. The restatement was required to correctly reconcile the Separately Disclosed Items and amortisation of acquired intangibles.
FIVE-YEAR TREND – ADJUSTED CASH FLOW FROM OPERATIONS (£m)
+8.9% CAGR1
394.1
403.7
465.7
565.3
596.1
602.9
2014
2013
2015
2016
2018
2017
1. CAGR represents the compound annual growth rate from 2013 to 2018.
Working capitalDuring 2018, we have continued our working capital intensity and through disciplined performance management working capital has reduced by £28.6m to £109.7m. Working capital has declined to 3.9% of sales reflecting 110bps improvement year-on-year, contributing to continued strong cash conversion.
FIVE-YEAR TREND – WORKING CAPITAL AS % OF REVENUE
(540)bps1
9.3
8.8
7.1
5.0
3.9
2014
2015
2016
2018
2017
1. Reduction in working capital as a percentage of revenue from 2014 to 2018.
FINANCIAL REVIEWcontinued
Intertek Group plc Annual Report and Accounts 201864
Strategic Report | Financial review

Net debtNet debt has increased from £544.1m at 31 December 2017 to £778.2m at 31 December 2018, primarily reflecting the acquisition of Alchemy in August 2018.
In the year, the Group drew on facilities it had in place at 31 December 2017. Total undrawn committed borrowing facilities as at 31 December 2018 were £247.9m (2017: £443.2m).
The Group has a well-balanced loan portfolio to enable the funding of future growth opportunities with a maturity profile as shown below.
BORROWINGS BY MATURITY PROFILE
19%
67%
14%
Less than one year
One to five years
Over five years
Under existing facilities the Group has available debt headroom of £248m at 31 December 2018. The components of net debt at 31 December 2018 are outlined below:
1 January2018
£mCash flow1
£m
Exchangeadjustments
£m
31 December2018
£m
Cash 135.9 55.2 12.1 203.2Borrowings (680.0) (266.3) (35.1) (981.4)Net debt (544.1) (211.1) (23.0) (778.2)
1. Cash flow includes £0.8m of non-cash movements related to amortisation of facility fees (see note 14 of the financial statements).
To ensure the Group is not exposed to income statement volatility in relation to foreign currency translation on its debt, the Group ensures that any foreign currency borrowings are matched to the value of its overseas assets in that currency (an ‘effective’ hedge).
The Group borrows primarily in US dollars and any currency translation exposures on the borrowings are offset by the currency translation on the US dollar and US dollar-related overseas assets of the Group.
The composition of the Group’s gross borrowings in 2018, analysed by currency is as follows:
BORROWINGS BY CURRENCY
1%94%
3%1%
1%
USD
CHF
EUR
AUD
CAD
FOREIGN CURRENCY MOVEMENTSThe Group transacts in over 80 currencies across more than 100 countries, and revenue and profit are impacted by the currency fluctuations. However, the diversification of the Group’s revenue base provides a partial dilution to this exposure.
At constant exchange rates, revenue grew 4.7% (actual exchange rates 1.2%) and adjusted operating profit grew 6.9% (actual exchange rates 3.0%).
The exchange rates used to translate the statement of financial position and the income statement into the Group’s functional currency, sterling, for the five most material currencies used in the Group are shown below:
Statement of financialposition rates
Incomestatement rates
Value of £1 2018 2017 2018 2017
US dollar 1.26 1.34 1.34 1.29Euro 1.11 1.13 1.13 1.14Chinese renminbi 8.69 8.79 8.84 8.72Hong Kong dollar 9.90 10.47 10.47 10.05Australian dollar 1.80 1.72 1.79 1.68
SIGNIFICANT ACCOUNTING POLICIESThe consolidated financial statements are prepared in accordance with IFRS as adopted by the EU. Details of the Group’s significant accounting policies, including the impact of the new accounting standards applicable for the first time in 2018, being IFRS 9 and IFRS 15, are shown in note 1 to the financial statements.
Ross McCluskeyChief Financial Officer
The Strategic Report was approved by the Board on 4 March 2019
By order of the Board.
André LacroixChief Executive Officer
Intertek Group plc Annual Report and Accounts 2018 65
Strategic Report

DEAR SHAREHOLDERAs you will have seen from our Strategic Report, Intertek continued to execute well and deliver on its strategic priorities in 2018 focusing on Total Quality Assurance solutions underpinning our customer centricity. Organic growth of 3.7% at constant rates was the highest in five years, we improved margins for the fourth consecutive year and cash conversion was once again over 125% with net debt of £778m and a good performance on return on invested capital at the year end. This cash flow and a strong financial position provide us with options to create sustainable shareholder value through our disciplined capital allocation policy.
We invested £113m in capital expenditure and in addition made four acquisitions for a total cost of £389m, the most significant being Alchemy, based in the US, a leading software provider in People Assurance solutions for the food industry that will further accelerate the growth momentum of our Assurance Business in the US and also our international network.
In 2018, our progressive dividend policy saw us return £128m to shareholders through cash dividends. We aim to deliver sustainable dividend growth over time, and announced in March 2018 that we would increase the dividend payout ratio to circa 50% from 2018. The Board is recommending a final dividend of 67.2p bringing the total to 99.1p for the full year 2018, an increase of 39% compared with 2017.
Your Board has maintained its commitment to achieving the highest standards of corporate governance. But governance goes well beyond simple compliance with codes and regulations. It is about culture, practices and how our people act. It is about integrity and accountability. It is about ensuring that our values are embedded and upheld throughout the organisation. It is a strong framework and means we have a Board that both supports and challenges the executive team. It is critical underpinning for generating long-term value and benefit for all stakeholders.
The aim of this report is to provide shareholders and other readers with a clear perspective of your Board’s approach to corporate governance, how we have complied with the 2016 UK Corporate Governance Code ('Code’) and the work of the Board and its Committees during 2018.
CORPORATE GOVERNANCE DEVELOPMENTSSince 2017 the focus on corporate governance in the UK has continued to evolve and the Board has paid close attention to
these developments. We noted the publication of the 2018 UK Corporate Governance Code ('new Code') and the issuing of the Companies (Miscellaneous Reporting) Regulation 2018, which updates the Companies Act 2006, both marking the culmination of the Government’s suite of governance reforms aiming to build trust in business.
The Board is strongly supportive of the revisions to the Code and the approach to refresh the existing framework, given the impact on wider society and the greater corporate responsibility large organisations have in an ever-evolving environment. The new Code is effective from 1 January 2019 and steps have been taken to ensure implementation during the year.
The Board is already committed to providing focus and upholding high standards of corporate governance in areas relating to corporate culture; diversity; strengthening the stakeholder voice and adopting appropriate remuneration structures. We hope that this is evidenced through both the Directors’ and Strategic Reports.
BOARD CHANGESOn 22 August 2018, we welcomed Ross McCluskey who was promoted to the Board as Executive Director and Chief Financial Officer, succeeding Edward Leigh. We thank Ed for his significant contribution to our performance over his five years with the Group.
PERFORMANCE EVALUATIONAs Chairman, I am responsible for ensuring the effectiveness of the Board, its Committees and individual Directors. Recognising the many attributes required of an effective Board, focus has been given to our own composition and the diversity this represents.
As announced last year, the evaluation and performance review of the Board was undertaken with the assistance of an independent party, Lorna Parker. I am pleased to report that the evaluation concluded that the Board operates effectively, with each Director making significant contributions to debate and discussion. Further details on the outcome of the evaluation and its process can be found on pages 78 and 79.
Through the annual evaluation process and the work of our Nomination Committee, we have reviewed and challenged where appropriate our succession plans, the skills and knowledge required by the Board now and in the future, and relevant developments including the Hampton-Alexander and Parker Reviews and the revision of the Code.
The Board is committed to long-term sustainable growth through a combination of revenue growth and returns on investment to drive shareholder value underpinned by strong corporate governance.”
Sir David ReidChairman
CHAIRMAN'S INTRODUCTION
Intertek Group plc Annual Report and Accounts 201866
Directors' Report | Chairman's introduction

IN THIS SECTION PEOPLEThe new Code encourages boards to ensure the voices of our employees are heard in the boardroom and we fully endorse the moves to stimulate engagement with our workforce. This engagement is highlighted in the table on page 77 showing the site visits by Non-Executive Directors. I meet employees when I visit our operations – 12 businesses in the past two years – having open conversations, listening to what they have to say and report back to the Board. These meetings have confirmed that we have world-class people at the core of our business. I am constantly impressed by their contribution, drive and commitment to our customers and admire their sense of responsibility and focus on improving performance which is so important to Intertek’s ongoing growth and success.
We are of course very aware of the role of the Board in promoting and supporting diversity in all its forms throughout Intertek, as well as the Board and Executive Management Team. Your Board fully supports the principles and has implemented the recommendations of the Parker Review on ethnic and cultural diversity. We recognise our obligation to society and that the quality and diversity of our people are key to understanding the needs and serving the communities in which we work. We firmly believe that a diverse workforce is a key foundation and can be a competitive advantage of our business to ensure we deliver long-term value to our shareholders.
SUSTAINABILITYSustainability is at the heart of our business 'bringing safety and quality to life' and accordingly we set our five Group Sustainability priorities in 2017 and put in place two integrated networks and reporting structures to keep the Executive Management Team and the Board updated. In 2018, we continued on the journey to improve our sustainability performance by focusing on the environmental footprint of our operations, development of our people, our work with local communities and progress against the UN Sustainable Development Goals. And we have continued to provide services to our customers to improve the sustainability of their businesses through our industry-leading Sustainability value proposition.
SHAREHOLDER ENGAGEMENTWe have maintained a comprehensive engagement programme with shareholders throughout the year. The detail is outlined on pages 108 and 109. This year we are putting to shareholders a new Remuneration Policy and have been actively consulting with shareholders as set out in the Remuneration Report in the letter from the Chair of the Remuneration Committee on page 89 and 90.
The views of our shareholders are essential to the Board and it is important that we understand these when considering strategic options available to the Group.
Finally, I would like to thank our CEO André and all his team, my Board colleagues and all our employees for their hard work during the year and our shareholders for their continued support.
Sir David ReidChairman
This report provides an insight into how, through its actions, the Board and its Committees have fulfilled their governance responsibilities throughout 2018.
LEADERSHIPRead more on page 68
EFFECTIVENESSRead more on page 76
ACCOUNTABILITYRead more on page 83
REMUNERATIONRead more on page 89
SHAREHOLDER ENGAGEMENTRead more on page 108
Intertek Group plc Annual Report and Accounts 2018 67
Directors' Report

COMPLIANCE WITH THE 2016 UK CORPORATE GOVERNANCE CODE ('CODE')This report has been prepared in order to provide stakeholders with a comprehensive understanding of our governance framework and to meet the requirements of the Code, the Listing Rules ('LR') and the Disclosure Guidance and Transparency Rules ('DTR'). A copy of the Code is available at www.frc.org.uk. During 2018, the Company has complied with the provisions of the Code in full. A more detailed explanation of our compliance can also be found on our website at www.intertek.com. The information required to be disclosed in accordance with DTR 7.2.6 can be found in the Other Statutory Information section on pages 110 to 112.
THE BOARD AND ITS RESPONSIBILITIESThe Board has the ultimate responsibility to promote the long-term sustainable success of the Company, generating value for shareholders and contributing to wider society, to the Company’s shareholders and our stakeholders for the proper
conduct and success of the business through entrepreneurial and innovative leadership, and setting the strategic aims of the Company, its values, standards and culture. The Board also decides and reviews all key policies and regulations, its strategy, operating plans, large acquisitions, corporate governance, major investments and disposals, the appointment and removal of Directors, risk management, financial reporting, audit, sustainability, ethics, the environment and people policies. The Board reviews and approves the method and approach to risk management and internal control systems and the Group’s Risk Register. The overall powers of Directors are set out in the Company’s Articles of Association (‘Articles’) and may be amended by special resolution of the shareholders.
The Board is responsible for ensuring that appropriate financial and human resources are in place to achieve its long-term strategy and deliver sustainable performance. Our strategy and progress towards delivering these strategic aims is set out in the Strategic Report on pages 2 to 65.
Intertek Board of DirectorsBiographical details can be found on pages 74 and 75.
Nomination Committee Remuneration CommitteeAudit Committee
Membership as at 31 December 2018
- Gill Rider (Chair)- Graham Allan- Gurnek Bains- Andrew MartinRead more on pages 89 to 107.
Membership as at 31 December 2018
- Sir David Reid (Chair)- Graham Allan- Gurnek Bains- Dame Louise Makin- Lena WilsonRead more on pages 80 to 82.
Membership as at 31 December 2018
- Andrew Martin (Chair)- Dame Louise Makin- Jean-Michel Valette- Lena WilsonRead more on pages 83 to 88.
Group Risk Committee
Ethics & Compliance Committee
Investment Committee
Disclosure Committee
Executive Management Team
Sustainability Operating Committee
Membershipas at 31 December 2018
- André Lacroix - Tony George- Mark Thomas
- André Lacroix - Tony George- Mark Thomas
- André Lacroix - Ross McCluskey
- André Lacroix - Mark Thomas
Biographical details of the team can be found on pages 20 and 21.
- André Lacroix - Nimer Al-Hafi- Darrin Harkness- Ann-Michele
Bowlin- Josh Egan- Matthew Allen
Role Responsible for the management of risk.To develop, oversee and promote the continuous improvement of the Group’s risk management, internal controls and assurance framework and the related procedures and systems; to oversee the development, implementation and adoption of any policies, procedures and systems which are identified as being required to address, or as a consequence of, Group-wide approach to identifying and managing the Group’s emerging and systemic risk environment.
Responsible for the monitoring of ethical, compliance and HSE issues affecting any part of the Intertek Group.
Responsible for reviewing significant contracts, leases and acquisitions, undertaking post investment appraisal reviews, overseeing capital expenditure and investments as described in the Group’s Authorities Grid.
Responsible for overseeing the Group’s compliance with securities dealing as well as continuous and periodic disclosure requirements.
Responsible for Intertek’s global operations, the Team meets regularly to discuss and review business and operational issues.
Responsible for advancing Intertek’s initiatives in both our internal sustainability activities, as well as our external sustainability services for clients.
Products, Trade and Resources Business Lines and Country Management
Support Functions
Intertek Group plc Annual Report and Accounts 201868
Directors' Report | Corporate Governance
LEADERSHIP
ROLES AND RESPONSIBILITIESThere is a clear division of responsibilities between the running of the Board (a key responsibility of the Chairman) and the day-to-day running of the Company’s business (the responsibility of the CEO). These responsibilities have been formalised in writing.
Roles of the Chairman, Chief Executive Officer and Senior Independent Non-Executive Director
ROLE NAME RESPONSIBILITIESChairman Sir David Reid • Leading and governing the Board to ensure its effectiveness in directing the Company.
• Assessing and monitoring the culture within the Company and ensuring that it aligns to the Company’s purpose.
• Ensuring the Directors receive accurate, timely and clear information to enable them to discharge their duties to promote the long-term sustainable success of the Company.
• Ensuring effective two-way communication between the Board and shareholders and stakeholders.
• Communicating to all Directors any of the major shareholders’ issues and concerns.• Facilitating openness and debate and the effective contribution of Non-Executive Directors.
Chief Executive Officer
André Lacroix • Proposing and agreeing the strategy with the Board.• Running the day-to-day operation of the business in line with the agreed strategy
and commercial objectives.• Promoting and conducting the affairs of the Company with the highest standards
of ethics, integrity, sustainability and corporate governance.• Leading the Executive Management Team.
Senior Independent Non-Executive Director
Graham Allan • Providing a sounding board for the Chairman.• Being available as an intermediary between other Directors and the Chairman.• Leading the annual performance review of the Chairman.• Being available to meet with shareholders and other stakeholders should they have
any concerns that have not been resolved through the normal channels.
The Board Approval Matrix formally outlines the matters specifically requiring the consent of the full Board. Each of the Board’s Committees has received delegated authority to carry out the business defined in its respective terms of reference.
The Board has reviewed the terms of reference for each of these Committees and is satisfied that they reflect current best practice and satisfy the terms of the Code.
The Board also delegates specific responsibilities, subject to certain financial limits, to management and this is governed by the Core Mandatory Controls and the Group Authorities Grid, which are regularly reviewed and refreshed. This agreed framework of controls enables strategic aims and financial performance to be delivered whilst also allowing risk to be assessed and managed.
GROUP COMPANY SECRETARYThe Group Company Secretary supports the Chairman in the delivery of the Board and governance procedures, in particular with the planning of agendas for the annual cycle of Board and Committee meetings, the planning of the induction for new Directors and in ensuring that information is made available to the Board members on a timely basis. She arranges for the Non-Executive Directors to meet with investors to discuss aspects of Intertek’s corporate governance arrangements on request, and supervises the arrangements for them to visit Intertek’s operations to enhance their knowledge and understanding of the business. She also provides updates to the Board on regulatory and corporate governance issues, new legislation, and Director’s duties and obligations.
All Directors have access to the advice and services of the Group Company Secretary, including access to independent professional advice at the Group’s expense. She ensures that an accurate record of all the Board and Committee meetings is taken and if a member of the Board has any concerns about the Company or any of the decisions taken, the minutes reflect this. No such concerns were raised during the year.
The Company has granted an indemnity, to the extent permitted by law, to each of the Directors and the Group Company Secretary. Directors’ and Officers’ liability insurance is also in place.
Intertek Group plc Annual Report and Accounts 2018 69
Directors' Report

MEETING, ATTENDANCE & INDEPENDENCEThe table below sets out the Board and Committee attendance during the year to 31 December 2018. Attendance is shown as the number of meetings attended out of the total number of meetings possible for the individual Director to attend during the year.
Whenever a Director is unable to attend a meeting, they will go through the papers, which have been circulated in advance, and give feedback and discuss any issues with the Chairman and CEO.
The Chairman and Non-Executive Directors meet regularly without the Executive Directors or management being present. The Chairman also maintains regular contact with the Senior Independent Non-Executive Director.
The Board reviews the independence of the Non-Executive Directors, other than the Chairman, as part of its annual Board effectiveness review. The Chairman is committed to ensuring the Board comprises a majority of independent Non-Executive Directors, who objectively challenge management, balanced against the need to ensure continuity on the Board.
The Board recognises the recommended term within the Code and as such, any term beyond six years for a Non-Executive Director is subject to a particularly rigorous review to ensure the progressive refreshing of the Board meets the evolving needs of the Company.
Board and Committee meeting attendance
DIRECTOR BOARD AUDIT NOMINATION REMUNERATION
Sir David Reid Chairman 5/5 – 3/3 –André Lacroix Chief Executive Officer 5/5 – – –Edward Leigh1 Chief Financial Officer 3/3 – – –Ross McCluskey2 Chief Financial Officer 2/2 – – –Graham Allan Senior Independent Non-Executive Director 5/5 – 3/3 3/3Gurnek Bains Non-Executive Director 5/5 – 3/3 3/3Dame Louise Makin Non-Executive Director 5/5 4/4 3/3 –Andrew Martin Non-Executive Director 5/5 4/4 – 3/3Gill Rider Non-Executive Director 5/5 – – 3/3Jean-Michel Valette Non-Executive Director 5/5 4/4 – –Lena Wilson Non-Executive Director 5/5 4/4 3/3 –
When required the Board also met at short notice on a quorate basis.
1. Edward Leigh ceased to be a Director on 22 August 2018.2. Ross McCluskey was appointed to the Board with effect from 22 August 2018.
BOARD BALANCE & COMPOSITIONAs at 31 December 2018, the Company’s Board comprised the Chairman, two Executive Directors and seven Non-Executive Directors. Biographical details of individual Directors are set out on pages 74 and 75. The Directors are of the view that the Board and its Committees consist of Directors with the appropriate balance of skills, experience, independence and knowledge of the Group to ensure the business continues to be run effectively and the Board's decision-making is not dominated by any one specific view or individual.
There continues to be a focus on maintaining an effective and complementary Board, whose capability is appropriate for the scale, complexity and strategic positioning of the Group’s business.
The Nomination Committee is responsible for reviewing the composition of the Board and its Committees. More detail on the process for appointments can be found in the report of the Nomination Committee on pages 80 to 82.
The Non-Executive Directors are appointed for specified terms subject to election and re-election by shareholders at the Annual General Meeting ('AGM') each year, if the Board, on the recommendation of the Nomination Committee, deems it appropriate that they remain in office.
The letters of appointment of the Non-Executive Directors, as well as the service agreements of Executive Directors, are available for inspection at the Company’s registered office and at the AGM.
Intertek Group plc Annual Report and Accounts 201870
Directors' Report | Corporate Governance
LEADERSHIPcontinued
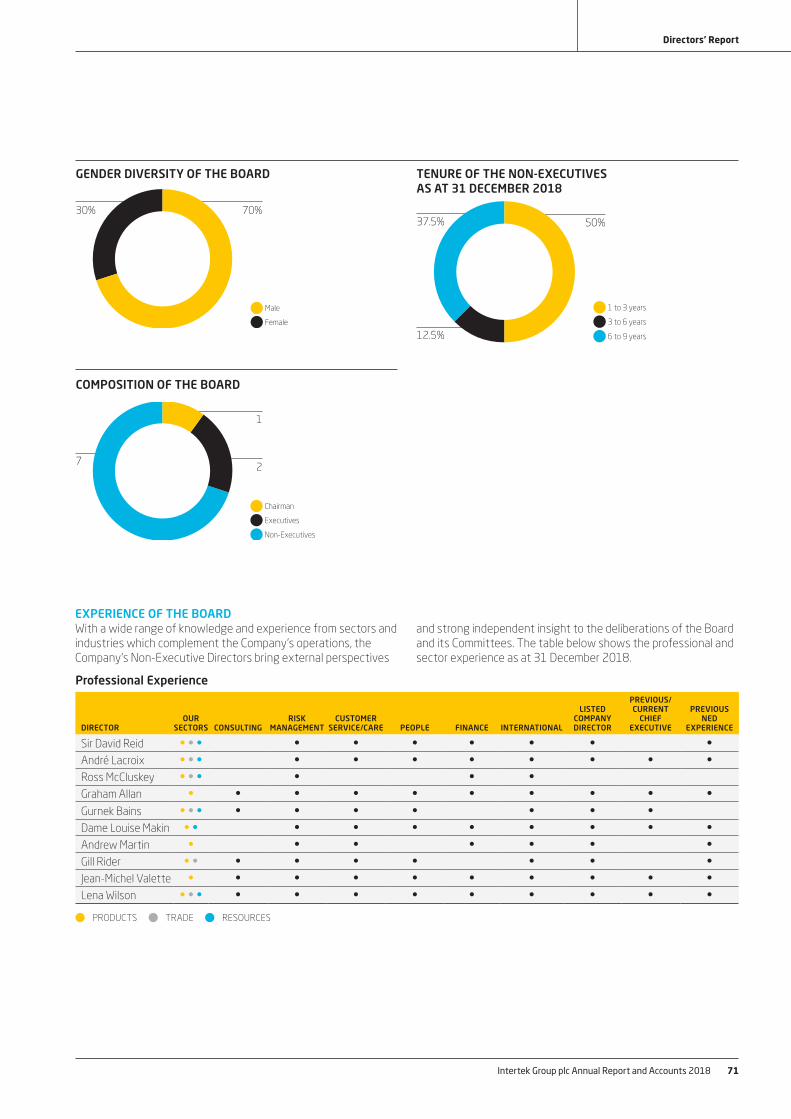
TENURE OF THE NON-EXECUTIVES AS AT 31 DECEMBER 2018
12.5%
37.5% 50%
1 to 3 years
3 to 6 years
6 to 9 years
COMPOSITION OF THE BOARD
7
1
2
Chairman
Executives
Non-Executives
GENDER DIVERSITY OF THE BOARD
30% 70%
Male
Female
EXPERIENCE OF THE BOARDWith a wide range of knowledge and experience from sectors and industries which complement the Company’s operations, the Company’s Non-Executive Directors bring external perspectives
and strong independent insight to the deliberations of the Board and its Committees. The table below shows the professional and sector experience as at 31 December 2018.
Professional Experience
DIRECTOROUR
SECTORS CONSULTINGRISK
MANAGEMENT CUSTOMER
SERVICE/CARE PEOPLE FINANCE INTERNATIONAL
LISTED COMPANY DIRECTOR
PREVIOUS/CURRENT
CHIEF EXECUTIVE
PREVIOUSNED
EXPERIENCE
Sir David Reid • • • • • • • • • •André Lacroix • • • • • • • • • • •Ross McCluskey • • • • • •Graham Allan • • • • • • • • • •Gurnek Bains • • • • • • • • • •Dame Louise Makin • • • • • • • • • •Andrew Martin • • • • • • •Gill Rider • • • • • • • • •Jean-Michel Valette • • • • • • • • • •Lena Wilson • • • • • • • • • • • •
PRODUCTS TRADE RESOURCES
Intertek Group plc Annual Report and Accounts 2018 71
Directors' Report

BOARD ACTIVITY DURING THE YEARThe Chairman, and the respective Committee Chairs, develop and agree a forward agenda for Board and Committee meetings for the year ahead to ensure that proper oversight of key areas of responsibility are scheduled regularly and that adequate time is available during the year for the Board to fully consider strategic matters. Papers, including minutes of Board and Committee meetings held since the previous meeting, are circulated in advance of each meeting. In addition to scheduled Board meetings, there was frequent ad hoc contact between Directors to discuss the Group’s affairs and the development of its business.
THE BOARD
COMMUNITIES
PEOPLE
INVESTORS
SUPPLIERS
STAKEHOLDERS
ENABLERS
LIVI
NG O
UR CUSTOMER-CENTRIC CULTURE DELIVERING SUSTAINABLE GROWTH
DISCI
PLIN
ED P
ERFO
RM
AN
CE M
AN
AG
EMEN
T
ENERGISING OUR PEOPLE
SUP
ERIO
R TECH
NOLOGY
CUSTOMERS
To maintain the highest standards of governance, the Directors receive a reminder of the Directors' duties under section 172 of the Act and Directors received refresher training on their responsibilities under section 172 of the Act during the year. The Board considers its major stakeholder groups as shown in the diagram below when agreeing its strategic priorities and enablers.
Since the year end, the Board approved the Annual Report and Accounts for 2018 and has concluded that, taken as a whole, they are fair, balanced and understandable. The Notice of AGM was also approved, the payment of a final dividend to shareholders was recommended and the Board has received and discussed the report on the external effectiveness of the Board during 2018.
BOARD AND STAKEHOLDERS
Intertek Group plc Annual Report and Accounts 201872
Directors' Report | Corporate Governance
LEADERSHIPcontinued

BOARD AGENDA IN 2018Feb May Aug Oct Dec
Corporate GovernanceReports of the activities of the Audit, Nomination and Remuneration Committees • • • • • • • • • • • •AGM Preparation (Chairman’s script, Questions & Answers, proxy votes and voting reports) •Re-election of Directors at the 2018 AGM • •Directors' Conflicts of Interest •2017 Board, Director and Committee Evaluation Process •2018 External Board Effectiveness Review Process •Purchase of shares by ESOT •Compliance & RiskIntegrated Risk, Control, Compliance and Quality Report • • • • • • • • • • • • • • • • • • • • • • • • •Modern Slavery Statement • • • • •CustomersTQA Customer Value Proposition •ATIC Innovation Strategy •ATIC Update •People ManagementGroup People Strategy •Global Talent Planning •Executive Committee Succession Planning •Performance Management CEO Report • • • • • • • • • • • • • • • • • • • • • • • • •Finance Report • • • • •Financial forecasts • • •Funding Report •Approval of full-year results, Annual Report and Accounts, half-year results, the AGM circular and dividends • •Group Portfolio update • •Shareholder EngagementChairman’s Shareholder Roadshow Feedback •IR Report • • • • •Strategy2018 Board Strategic Agenda •Group M&A Strategy • • • •Group Strategy & Strategic Plan • • • • •Global Macro-trends •Geopolitical Perspective •Group IT Strategy • • •Assurance Strategy •Topics for 2018 Strategy Session • • • • •2019 Annual budget and Five-year plan •SustainabilityGroup Sustainability Strategy • • • • •OtherPresentations by regions, country and business lines • • •Updates on developments, acquisitions and disposals • • • • • • • • • •
CUSTOMERS COMMUNITIES INVESTORS OTHERPEOPLE SUPPLIERS
Intertek Group plc Annual Report and Accounts 2018 73
Directors' Report

1 Sir David Reid Chairman N
Appointed to the Board in December 2011 and became Chairman in January 2012. Sir David Reid retired as Chairman of Tesco PLC in November 2011 after serving in that role since April 2004. Prior to that he was Deputy Chairman of Tesco PLC and had served on the Tesco Board since 1985. David is Chairman of the charity Whizz-Kidz. In February 2012 he was appointed a member of the Global Senior Advisory Board of Jefferies International Limited, a global securities and investment banking group. He was formerly the Senior Independent Non-Executive Director of Reed Elsevier Group PLC (now RELX Group), Chairman of Kwik-Fit Group Ltd, Non-Executive Director at Greenalls Group Plc (now De Vere Group), Legal & General Group Plc and Westbury plc.
2 André Lacroix Chief Executive Officer
Appointed to the Board as Chief Executive Officer in May 2015. André Lacroix is an experienced Chief Executive with a strong track record of delivering long-term growth strategies and shareholder value with global companies across diverse territories. André was previously Group Chief Executive of Inchcape plc from 2005 to 2015 and prior to this he was Chairman and Chief Executive Officer of Euro Disney S.C.A. From 1996 to 2003 he was the President of Burger King International, previously part of Diageo. André was formerly the Senior Independent Director of Reckitt Benckiser Group plc.
3 Ross McCluskey Chief Financial Officer
Appointed to the Board as Chief Financial Officer in August 2018. Ross McCluskey joined Intertek in August 2016 as the Group’s Financial Controller. Prior to that, he spent five years at Inchcape plc, where he held senior operational financial positions, including Finance Director of Inchcape’s Australasian and UK businesses. From 2002 to 2011, Ross worked within the investment banking sector, specialising in mergers and acquisitions, and held roles at J.P. Morgan, Gleacher Shacklock and Greenhill & Co.
4 Graham Allan Senior Independent
Non-Executive Director RN
Appointed to the Board as a Non-Executive Director in October 2017. Graham Allan is a Non-Executive Director of Associated British Foods plc and a member of their Audit and Remuneration Committees. He is also a Board member of IKANO Pte Ltd, an Asian retail and property company. Until August 2017, he was the Group Chief Executive of Dairy Farm International Holdings Limited, a pan-Asian retailer and a subsidiary of Jardine Matheson. Prior to joining Dairy Farm in 2012, he had been President and CEO at Yum! Restaurant International and was responsible for global brands KFC, Pizza Hut and Taco Bell in all markets except the US and China. Since 1989, he has held various senior positions in multinational food and beverage companies with operations across the globe and has lived and worked in Australia, Asia, the US and Europe. He was previously a Non-Executive Director of InterContinental Hotels Group plc, Yonghui Superstores Co. Ltd in China and a Commissioner of Hero Group, an Indonesian retailer.
5 Gurnek Bains Non-Executive Director RN
Appointed to the Board as a Non-Executive Director in July 2017. Gurnek Bains was the co-founder of YSC Ltd, a premier global business psychology consultancy. He led the business as CEO and Chairman for 25 years to a position of global pre-eminence, and a client base comprising over 40% of the FTSE 100. Gurnek has worked extensively with multinational organisations in the areas of culture change, vision and values, executive coaching and assessment, Board development and strategic talent development. Gurnek is also a Trustee of the School of Social Entrepreneurs. He has a doctorate in psychology from Oxford University.
Committees:
Audit A
Nomination N
Remuneration R
BOARD OF DIRECTORS
1 2 3 4 5
Intertek Group plc Annual Report and Accounts 201874
LEADERSHIPcontinued
Directors' Report | Corporate Governance

6 Dame Louise Makin Non-Executive Director NA
Appointed to the Board as a Non-Executive Director in July 2012. Dame Louise Makin is currently Chief Executive Officer of BTG plc, a growing international specialist healthcare company, a position she has held since 2004. Before joining BTG, Louise was at Baxter Healthcare Ltd from 2000, holding the roles of Vice President, Strategy & Business Development Europe, and from 2001, President of their Biopharmaceuticals division, where she was responsible for Europe, Africa and the Middle East. Prior to her time at Baxter, she was a Director of Global Ceramics at English China Clays PLC, and in her earlier career, held a variety of roles at ICI between 1985 and 1998. Louise is a Non-Executive Director of Woodford Patient Capital Trust plc, Chair of the 1851 Trust, a Trustee of the Outward Bound Trust and an Honorary Fellow of St John’s College, Cambridge. She was previously a Non-Executive Director of Premier Foods plc.
7 Andrew Martin Non-Executive Director RA
Appointed to the Board as a Non-Executive Director in May 2016. Andrew Martin is Chairman of Hays plc and Chairman of their Nomination Committee, a Non-Executive Director of easyJet plc where he is a member of the Audit, Nomination and Remuneration Committees, and Chairman of the Finance Committee; and a Non-Executive Director of the John Lewis Partnership Board and Chairman of their Audit and Risk Committee. From 2012 to 2015, Andrew was the Group Chief Operating Officer for Europe and Japan for Compass Group PLC and prior to that served as their Group Finance Director from 2004 to 2012. Before he joined the Compass Group, he was the Group Finance Director at First Choice Holidays plc (now TUI Group). Andrew also previously held senior financial positions with Forte plc and Granada Group plc (now ITV plc) and was a partner at Arthur Andersen LLP.
8 Gill Rider CB Non-Executive Director R
Appointed to the Board as a Non-Executive Director in July 2015. Gill Rider currently holds non-executive directorships with Pennon Group Plc, where she chairs the Sustainability Committee and Charles Taylor Plc where she chairs their Remuneration Committee. She is the Senior Independent Director at both. Gill is Pro-Chancellor of the University of Southampton (previously Chair from 2012 to 2018) and was the President of the Chartered Institute of Personnel & Development for five years until 2015. Formerly Gill was head of the Civil Service Capability Group in the Cabinet Office reporting to the Cabinet Secretary and prior to that held a number of senior positions with Accenture culminating in the post of Chief Leadership Officer for the global firm. She was previously a Non-Executive Director of De La Rue plc.
9 Jean-Michel Valette Non-Executive Director A
Appointed to the Board as a Non-Executive Director in July 2017. Jean-Michel Valette currently serves as an independent advisor in the US to select branded consumer companies and has more than 30 years’ experience in management, US public company corporate governance, strategic planning and finance. He is currently the Chairman of Select Comfort Corporation and the Lead Director, Chair of the Nomination Committee and member of the Audit Committee of The Boston Beer Company, both US listed companies. From 2004 to 2012, Jean-Michel was Chairman of Peet’s Coffee & Tea, Inc. He has an MBA from Harvard Business School.
10 Lena Wilson CBE Non-Executive Director NA
Appointed to the Board as a Non-Executive Director in July 2012. Until October 2017, Lena Wilson was the Chief Executive Officer of Scottish Enterprise, Scotland's national economic development agency, a member of Scotland's Financial Services Advisory Board and Chair of Scotland Oil and Gas Taskforce. Lena was also a Senior Advisor to The World Bank in Washington DC on private sector development for developing countries. She is an Ambassador for the Prince and Princess of Wales Hospice and the Edinburgh Military Tattoo, a visiting professor and advisor to the University of Strathclyde Business School and is a Non-Executive Director of the Royal Bank of Scotland Group plc and ScottishPower Renewable Energy Limited.
6 7 8 9 10
Intertek Group plc Annual Report and Accounts 2018 75
Directors' Report

DIRECTORS’ INDUCTION AND DEVELOPMENTThere is a full, formal and extensive induction programme which is tailored to ensure that Directors joining the Board are provided with the knowledge and materials to add value from an early stage. This is managed by the Chairman and the Group Company Secretary. During the programme, new Directors receive a wealth of background information on the Company and details of Board procedures, Directors’ responsibilities and various governance- related issues. The induction also includes a series of meetings with other members of the Board, senior members of management and external advisors. This process is kept under review, taking into account Directors' feedback.
Ongoing and continual development is crucial to our Directors remaining highly engaged, effective and well informed. All Directors are kept up to date with information about Intertek’s business and there is an ongoing programme of information dissemination throughout the year. It is important that the Directors have an appreciation of the business both in the UK and overseas. During the year there were presentations from
senior management to the Board and meetings have been held on regional strategy to increase the understanding of operations, opportunities and risks together with presentations from external advisors on regional micro and macro-economic trends.
The Chairman and the Group Company Secretary also put together a schedule of external training for the Directors to attend which included Audit Committee technical updates, Remuneration Committee briefings and general Board Directors' updates and discussions.
BOARD VISITS AND WORKFORCE ENGAGEMENTVisit to the US — October 2018Every year, one of the board meetings is held overseas and a detailed itinerary is prepared to allow plenty of time for Directors to visit the local laboratories and meet management and employees. In October 2018, the Board visited the US to give the Board an in-depth view of our business across this region and the itinerary is outlined below:
VISIT TO THE US — OCTOBER 2018
Monday, 15 October Board members arrived in the US and travelled to Syracuse.
Tuesday, 16 October The Board travelled to our laboratory in Cortland. In the morning, there was a Health & Safety briefing and the Board received an introduction to the laboratory in Cortland by Tim Corcoran (Executive Vice President, Electrical & Connected World). The Board was then split into two groups for a three-hour tour of the laboratory visiting the different departments, meeting the staff and seeing the huge variety of testing undertaken in Cortland ranging from light bulbs, washing machines to safety equipment used by fire fighters to mention just a few. In the afternoon, presentations were made to the Board by:Gregg Tiemann – Executive Vice President, AmericasCarlos Velasco – Vice President, Latin AmericaMichael Grigsby – CFO, AmericasGavin Campbell – Senior Vice President, Building & ConstructionIn the evening, there was an informal dinner with the Board and the Americas senior team.
Wednesday, 17 October In the morning, presentations continued to provide a detailed overview of the different US businesses and were made to the Board by:Tony Walker – Global Business Line Leader, Connected WorldNimer Al-Hafi – President, Caleb BrettAndrew Gleason – Vice President, Products, Resources and TransportationMatthew Allen – Vice President, Global OperationsIn the afternoon, the Board meeting convened, and the Directors had two presentations by external speakers on the US economic and political environment.
Thursday, 18 October The Board meeting reconvened and concluded with a discussion on the visit to the US.The Board agreed that the commitment and pride of the team working in Cortland shone through and they really appreciated the time taken by the Cortland staff to demonstrate with passion the services provided. The US management team had also provided very clear and detailed analysis of their businesses in the US and future strategy.
Intertek Group plc Annual Report and Accounts 201876
Directors' Report | Corporate Governance
EFFECTIVENESS

AMERICAS
EUROPE & CENTRAL ASIA
SOUTH & SE ASIA,AUSTRALASIA
CHINA & NORTH
ASIA
Sir David Reid and Graham Allan in India
Gurnek Bains and Gill Rider in Turkey
OUR NON-EXECUTIVE DIRECTORS' SITE VISITS 2017-2018
AMERICAS
Destination NEDs
Mexico 1
Cortland, USA 8
Menlo Park, USA 1
EUROPE & CENTRAL ASIA
Destination NEDs
Sunbury, England 2
Aberdeen, Scotland 2
Milton Keynes, England 4
Turkey 3
Switzerland 1
Germany 2
Dubai 1
SOUTH & SE ASIA, AUSTRALASIA
Destination NEDs
Bangladesh 2
India 2
Australia 1
Indonesia 3
Singapore 8
CHINA & NORTH ASIA
Destination NEDs
China 4
Hong Kong 1
DIRECTORS’ CONFLICTS OF INTERESTThe Board operates a policy to identify, authorise and manage any conflicts of interest to assist Directors in complying with their duty to avoid actual or potential conflicts. The Directors are advised of the process upon appointment and whenever any Director considers that he or she is, or may be, interested in any contract or arrangement to which the Company is, or may be, a party, the Director gives due notice to the Board in accordance with the Companies Act 2006 and the Articles. A formal process is also in place for managing such conflicts to ensure no conflicted Director is involved in any decision related to their conflict.
The Conflicts of Interest Register is maintained by the Group Company Secretary and the Board undertakes an annual review of each Director’s interests, if any, including outside the Company. Any conflicts of interests are reviewed when a new Director is appointed, or if and when a new potential conflict arises. During the year, this process operated effectively.
The Non-Executive Directors have visited a number of Intertek facilities across the world to improve their understanding of the operations of the Group and provide an opportunity to engage
with the wider workforce. The map below shows some of the visits undertaken over the previous two years:
Intertek Group plc Annual Report and Accounts 2018 77
Directors' Report

BOARD, COMMITTEE AND DIRECTORS' PERFORMANCE CYCLE
2020Internal Review
2018Externally facilitated evaluation
conducted by an independent consultant
2019Internal Review
2018 BOARD AND COMMITTEE EVALUATIONThe effectiveness of the Board and its Committees is reviewed annually and an independent externally facilitated review is conducted every three years.
The 2017 internal Board review covered how the Board had continued to deliver sustainable growth and strong returns for our shareholders through the Total Quality Assurance value proposition which forms the core of our 5x5 differentiated strategy for growth. The key findings of last year’s report were very positive, confirming that the Board was performing at a high level demonstrating the right behaviours, culture and tone. The Board refreshment programme had been successfully concluded and the Board strengthened by the addition of three new members bringing new skills, experience and attributes to bear.
For 2018, a full externally facilitated Board evaluation process was led by the Chairman, with the support of the Group Company Secretary and entailed:
• The completion of detailed questionnaires by each Board member;
• One-to-one meetings with each Board member;
• Discussions on the Board evaluation outcomes and recommendations with the Chairman and CEO;
• Discussion of the results of the evaluation with the relevant Committee and the Board as a whole; and
• The Board identifying and agreeing areas for improvement – the strategy and strategic agenda having already been agreed at the Board meeting in December 2018.
A similar process was followed for the evaluation of each Committee with the results of each evaluation discussed by the relevant Committee and future steps agreed.
As planned, and recommended by the Code, the formal evaluation process was facilitated by an independent third party, Lorna Parker, under the direction of the Chairman at the end of 2018. Lorna Parker has no other connection to the Company and was appointed after a review of independent advisors in the field of formal Board evaluations.
The last external review undertaken in 2015 flagged the sense of early progress and improved Board effectiveness once André was in post as CEO, with the general recognition that the Board understood the scale of the challenges and opportunities in realising the value they could deliver for shareholders and were optimistic that it could be done. Over the last two years, the reviews had demonstrated how the Board was actively progressing and implementing the agreed strategy and putting in place the strategic initiatives and capability to deliver sustainable growth and strong returns for our shareholders through the Total Quality Assurance value proposition which forms the core of our 5x5 differentiated strategy for growth.
The key findings of this year’s report are very positive:
• The Board is functioning well and demonstrates strong corporate governance.
• Intertek is part-way through a major strategic, organisational and operational transformation, going from being a good company to a truly great company. The progress that has been made in a relatively short time is hugely impressive, especially given the scale, complexity and geographical spread of the business.
• Three years on, the strategy development and review process are comprehensive, detailed, rigorous and clear, with well-planned and articulated priorities and targets. The strategy is being executed effectively and is delivering great results.
• Over the last three years, the share price has nearly doubled; revenues increased by over 29%, operating margin by 130bps and EPS by over 40%.
• Since the last external review there has been a significant evolution of the Board both in terms of Executive Directors and Non-Executive Directors and, with the changes in the past two years, this feels like a relatively new Board which is settling in well and has made huge progress.
• André has brought clarity to Intertek’s purpose, mission, vision, values and strategy.
• This is a collegiate, supportive, committed and engaged Board with an impressive and diverse mix of complementary skills, experiences and backgrounds.
• The Board continues on a journey from good-to-great, alongside that of the business, and while there are enduring aspects of the role of any Board, emphasis and tone evolve. During the past three years, the focus has been on reshaping the Board and executive team, improving behaviours and tone in the Boardroom, further refining and delivering the growth strategy and moving from a decentralised, entrepreneurial portfolio approach to a more integrated, customer-centric, FTSE 50-calibre company.
Intertek Group plc Annual Report and Accounts 201878
Directors' Report | Corporate Governance
EFFECTIVENESScontinued

• The culture has evolved massively and is one of high performance and high integrity with a sense of purpose: driven by ambitious, transparent, proud scientists who always want to do the right thing and are increasingly customer focused.
• The pace and energy in the business have increased significantly. The sharper focus on customers through TQA has been another key success factor.
• There is also clarity and alignment around strategic priorities from a portfolio perspective in the near term with much focus on the shift from TIC to ATIC.
• People, including talent development, retention, succession and employee engagement figure high on the agenda given the importance of the relatively highly qualified employee base to the ongoing success of Intertek.
• The Board recognises the key challenges and risks facing Intertek. There is confidence in the thoroughness of risk management processes, controls and reporting which have been transformed over the last couple of years.
• As the Company continues on its journey from good-to-great, the Board should continue to evolve its role, style, engagement and 'value add'.
• There is clarity and broad alignment on the role of the Board during this next phase in Intertek’s development which is around supporting, motivating, inspiring and appropriately encouraging management to sustain pace and progress on multiple fronts to create shareholder value.
Lastly, as with all good companies, the Board culture is to aim for best in class and also for continuing improvement which we call 'Ever Better, Ever Stronger'. So, we will be implementing plans to push on in what we call our 'journey areas' such as sustainability, where we believe we can deliver for society at large and also our customers for whom we can provide our expertise and services in the key areas of sustainability. We will also be following up on actions to implement the provisions of the UK Corporate Governance Code. This would include understanding views of our stakeholders, in particular focusing on engagement with our workforce, which is already a priority of our Board. As part of this, inter alia, we will be increasing the number of site visits our Non-Executive Directors will make to the businesses around the world as part of their monitoring of culture at ground level.
Chairman and Director evaluationThe Non-Executive Directors, led by the Senior Independent Non-Executive Director, conducted a performance review of the Chairman. They considered his leadership, performance and overall contribution to be of a high standard and he continues to have their full support.
The Chairman met with each Director to discuss individual contributions and performance, together with training and development needs. Following these reviews, the Board remains satisfied that, in line with the Code, all Directors are able to allocate sufficient time to the Company to enable them to discharge their responsibilities as Directors effectively and that any current external appointments do not detract from the extent or quality of time which the Director is able to devote to the Company.
The Board has reviewed the independence of the Non-Executive Directors, other than the Chairman, and considers that all of them continue to demonstrate independence in both character and judgement.
The Board recommends that shareholders should be supportive of their election or re-election to the Board at the 2019 AGM.
Intertek Group plc Annual Report and Accounts 2018 79
Directors' Report

DEAR SHAREHOLDERAs the Chair of the Nomination Committee (‘Committee’), I am pleased to present to you the Nomination Committee Report for 2018. Over the past 18 months we have spent our time on the Board refreshment programme and were pleased to welcome three new Non-Executive Directors and one Executive Director to the Board. These appointments have strengthened our Board bringing new skills, experiences and attributes. During 2018, the Committee continued discussions on the core skills and attributes required by our Board now, and those of future candidates, to support and drive the long-term sustainable success of our 5x5 differentiated strategy for growth as outlined in pages 2 to 3.
To ensure that members of the Board and senior management have the appropriate balance of skills and experience to support the Group’s strategic objectives, succession planning is a matter that the Board as a whole considers. This ensures that the Company benefits from the views and experience of all Board members in this discussion. During the year, we reviewed the Group People Strategy and the Executive Management Team succession planning and the progress being made to develop the skills and capabilities we need going forward. We aim to ensure both our Directors and members of the Executive Management Team and other senior managers, who are potential successors to the Executive Management Team or Board, are well equipped with the right skills and experience and, where necessary, address any developmental needs.
NOMINATION COMMITTEE
ROLE AND KEY RESPONSIBILITIES OF THE COMMITTEE• Review the structure, size and composition of the Board
and its Committees;
• Identify, review and nominate candidates to fill Board vacancies1;
• Evaluate the balance of skills, independence, knowledge, experience and diversity on the Board and its Committees;
• Review the results of the performance evaluation process that relates to the composition of the Board and its Committees; and
• Review the time commitment required from Non-Executive Directors.
For the Committee’s terms of reference, see www.intertek.com.
1. Neither the Chairman nor the CEO participates in the recruitment of their own successor.
MEMBERSHIP OF THE COMMITTEEThe membership of the Committee at the year end was Sir David Reid (Committee Chair), Graham Allan, Gurnek Bains, Dame Louise Makin and Lena Wilson.
During the year, the Committee held three formal meetings. Attendance of members at formal meetings is shown in the table on page 70. The Group Company Secretary attends all formal meetings of the Committee. The Committee invites the CEO and the EVP, Human Resources to attend meetings when the subject matter deems their presence appropriate.
ACTIVITIES OF THE COMMITTEE DURING THE YEARPerformance EvaluationThe evaluation of the performance of the Committee was conducted during the year and it was shown that the Committee continues to be effective.
Board and Committee CompositionDuring the year, the Committee undertook its annual review of the Board’s effectiveness and composition in relation to long-term succession planning. To ensure that the Board comprises a broad range of skills, experience and attributes, the Committee discusses and reviews extensively the skills and capabilities required of future Directors including qualities of
ACTIVITIES OF THE COMMITTEE 2018
Performance Evaluation • Reviewed the results of the 2017 Committee evaluation.
Board and Committee Composition • Continued to monitor the composition of the Board and its principal Committees, and the independence of its Non-Executive Directors.
• Evaluated the current composition of the Board.
Board Appointments and Reappointments
• Rigorously reviewed the reappointment of Dame Louise Makin and Lena Wilson as Non-Executive Directors for their third three-year term.
• Reviewed the reappointment of Gill Rider as a Non-Executive Director for her second three-year term.
• Recommended to the Board the appointment of Ross McCluskey, to succeed Edward Leigh, in the role of Chief Financial Officer.
Talent Mapping and Succession Planning
• Discussed the skills and attributes desired for the pipeline of future Non-Executive Directors.• Actively evaluated the objective criteria, and enhanced skills, experience and diversity desired
of future Board members.
Sir David ReidChair of the Nomination Committee
Intertek Group plc Annual Report and Accounts 201880
Directors' Report | Corporate Governance
EFFECTIVENESScontinued

the individual required to ensure the right fit with the culture and style of Intertek. The skills matrix is outlined on page 71.
The review concluded that the current composition of the Board and each Committee contained a good balance of skills, industry and geographic experience, as well as diversity.
The Committee unanimously agreed, following the consideration of the independence of each Non-Executive Director, that each Non-Executive Director continued to be independent in accordance with the criteria set out in the Code.
Board Appointments and Reappointments The Board, upon the recommendation of the Committee, approved the internal appointment of Ross McCluskey as Chief Financial Officer. Ross joined the Board as an Executive Director and the Executive Management Team on 22 August 2018. He joined Intertek in August 2016 as the Group’s Financial Controller, which enabled him to gain an extensive understanding of the complexities of the Group. Prior to Ross’ employment with Intertek, he held senior operational finance positions at Inchcape plc for five years, including Finance Director of Inchcape’s Australasian and UK businesses. Between 2002 and 2011, Ross worked within the investment banking sector, specialising in mergers and acquisitions, holding roles at J.P. Morgan, Gleacher Shacklock and Greenhill and Co.
Both Dame Louise Makin and Lena Wilson have been members of our Board for six years. During 2018, a detailed and rigorous review was carried out, following which the Committee agreed to recommend to the Board that they both be reappointed for a third term of three years from 1 July 2018. Having come to the end of her first term, Gill Rider’s appointment was also reviewed. Following this review, the Committee was pleased to recommend the reappointment of Gill for a further three years, from 1 July 2018. Where the reappointment of a member of the Committee is being discussed, they are precluded from any involvement in the discussions. In the instance where the reappointment of the Chairman is being discussed, the Senior Independent Non-Executive Director would chair the Committee meeting.
Biographies for all of the Directors are available on pages 74 and 75 and a resolution for each Director will be proposed at the forthcoming AGM for their election or re-election.
Talent Mapping and Succession Planning The Committee, over the last 18 months, have focused their discussions on the objective criteria they require of future Board members, and in turn highlighting the “must-have” skills, experience, personal characteristics and behaviours they deem necessary to lead Intertek. Such criteria have been used to actively refresh the Board with three new members in 2017, and one new member in 2018, representing a high quality and balanced Board, which functions effectively.
The Committee recognises the increased emphasis on providing oversight of the development of a diverse pipeline for succession. Due to the strategic importance of talent mapping and succession planning to the long-term sustainable success of the Group, the Board, as a whole, discuss and support succession planning on the Executive Management Team, as well as talent
mapping across the Group in respect to Regional, Country and functional roles. This has enabled the Board to gather insights on the key success factors desired for senior roles within the Group.
During 2018, the following appointments were made to the Executive Management Team. On 1 January 2018, Patrick Lee was appointed as Executive Vice President, North East Asia and Australasia. Prior to joining Intertek, Patrick was CEO of Inchcape Greater China and has over 30 years’ management experience with a proven track record of success with blue-chip companies including P&G, Coca-Cola and Agfa Gevaert. Patrick’s appointment has added depth to the Group’s leadership pool and gives Intertek more strength in pursuing the good-to-great journey.
In May 2018, Dr Diane Bitzel was appointed to the Executive Management Team in the role of Chief Information Officer, succeeding Ann-Michele Bowlin who was subsequently promoted as Chief ATIC Innovation Officer, a role in which she leads the development and drives the ATIC innovation strategy and roadmap across the organisation. Diane has over 22 years of global management experience, particularly in the areas of IT strategy, operations and management, HR transformation, and business strategy and process implementation. Diane has previously held roles as CIO for global life science and food companies, including Syngenta AG, Apetito AG and Lonza Group. Diane’s appointment, and Ann-Michele’s promotion, further strengthens the Executive Management Team, and in turn provides additional focus on the areas that will make a difference to the Group’s success.
Full biographical details of the Executive Management Team can be found on pages 20 to 21.
DIVERSITY POLICYThe Board is committed to achieving a Board which will include and make the best use of differences in culture, gender, skills, background, regional and industry experience and other qualities. All of these factors are considered in determining the composition of the Board, and all Board appointments will continue to be made on merit, in the context of the skills, diversity and experience the Board, as a whole, requires for it to be effective. In reviewing Board composition, the Committee aims to maintain an appropriate balance of skills, experience, and background on the Board, by considering all aspects of diversity, including gender. In identifying suitable candidates to recommend for appointment to the Board, the Committee considers candidates on merit, against objective criteria, and with due regard for the benefits of diversity on the Board to achieve the most effective Board possible. We expect to continue to make further progress as our existing Non-Executive Directors rotate in the ordinary course of business.
The Committee and the Board are collectively mindful of the recommendations of both Lord Davies in his report “Women on Boards”, and the Hampton-Alexander Review (the ‘Review’), complementary to Davies’ report, which encourages FTSE 350 companies to achieve at least 33% female representation at Board level by 2020. As at 31 December 2018, there were three female Non-Executive Directors on the Company’s Board,
Intertek Group plc Annual Report and Accounts 2018 81
Directors' Report

representing a 30% female membership; following the Review in November 2018, Intertek was ranked as having the potential to be on target or high performing. However, when recommending new candidates to the Board, the Committee ensures that the correct balance of skills, knowledge and experience is maintained, as this is paramount for Intertek’s long-term sustainable success.
Further detail regarding gender diversity across the Group and in the Executive Management Team, and their direct reports, can be found within the Sustainability Report on page 29.
The Group also supports, and already complies with, the Parker Review ‘Beyond One by 21’ recommendation that FTSE 100 company boards should have at least one ethnically diverse director by 2021. The Committee continues to monitor the overall diversity of Intertek’s leadership at Board and senior management level, to ensure the broadest spectrum of leaders are considered for new appointments.
Sir David ReidChair of the Nomination Committee
Intertek Group plc Annual Report and Accounts 201882
Directors' Report | Corporate Governance
EFFECTIVENESScontinued

The Board has established formal and transparent arrangements to apply the corporate reporting, risk management and internal control principles as set out in the Code.
INTERNAL CONTROL AND RISK MANAGEMENTThe Board is ultimately responsible for monitoring the Group’s system of internal control and risk management and has overall responsibility for ensuring its effectiveness. The Audit Committee is responsible for monitoring and reviewing the effectiveness of the Group’s internal control and risk management controls and reports to the Board on its evaluation of the systems in place. The Board confirms that the Company has fully complied with the FRC's Guidance on Risk Management, Internal Control and Related Financial and Business Reporting.Further information on the framework and its effectiveness can be found on pages 87 to 88.
Risk management and internal controls are embedded in the running of each division, business line, country and support function and oversight is provided by divisional, regional and functional risk committees. Each risk committee in turn reports to the Group Risk Committee ('GRC'). The Group identifies and tracks its risk environment using a risk register process: the risk committees produce a register of risks in their area of responsibility, and these risk registers are then consolidated at Group level. The GRC uses the Group Risk Footprint for the year under review with associated mitigation action plans as its baseline, to then add new risks and/or plans facilitated by the GRC’s quarterly risk review process. The Group General Counsel then presents at each Board meeting an integrated risk, control, compliance and quality report including a review of:
• The Group’s emerging risk environment, the status of the quarterly emerging risk mitigation action plans and the new quarterly emerging risk mitigation plans;
• The specific systemic risks including quarterly hotline and whistleblowing reports, key claims and unlimited liability contracts; and
• The Group’s systemic risk environment, the status of the quarterly systemic risk mitigation action plans and the new quarterly systemic risk mitigation plans.
COMPLIANCE, WHISTLEBLOWING AND FRAUDIntertek is committed to maintaining a culture where issues of integrity and professional ethics can be raised and discussed, which is aligned to our sustainability priority to always do the right thing with precision, pace and passion and also forms part of our 5x5 differentiated strategy for growth. The Group’s key ethics and integrity policies are set out in the Code of Ethics and a detailed description of the topics covered by the Code of Ethics, its operation during the year and the outcomes of these policies are contained in the Sustainability report on pages 30 to 31.
The Group has a whistleblowing process, which includes a global hotline system enabling all employees, contractors and others representing Intertek to confidentially report suspected breaches of the Code of Ethics. This is supported by dedicated Compliance Officers across the Group’s markets who undertake investigations of issues that arise from reports to the hotline system or from other sources, such as routine compliance questions. The Group Compliance function is independent of the Group’s operational business and reports directly to the Group General Counsel.
AUDIT COMMITTEE
DEAR SHAREHOLDEROn behalf of the Board, I am pleased to present the report of the Audit Committee ('Committee') for the year ended 31 December 2018.
We were pleased to welcome Dame Louise Makin as a member of the Committee from 1 January 2018 adding her valuable expertise to our discussions. One of the key responsibilities of the Committee is to monitor the integrity of the financial statements of the Company and measure the performance of the Company against the financial goals of our strategy. This is key for our shareholders and other stakeholders in order for them to understand the financial strength of the business.
During 2018, the Committee’s primary focus centred on the accuracy of the Group’s financial reporting, together with the ongoing improvements in internal control activities and risk and compliance matters. PricewaterhouseCoopers LLP (‘PwC’) completed their second full audit of the Company for the year ended 31 December 2017. During the year, the Committee reviewed and agreed that the audit process continued to be effective with PwC being independent from management, establishing positive relationships and providing a good level of service to the Company whilst seeking continual improvements in the audit of Intertek.
Throughout the year the Committee also ensured that separate meetings with the CFO, Group Audit Director and the external auditor took place without management present in order to provide an open forum for any issues to be raised.
The internal evaluation of the Committee was conducted during the year and it was shown that the Committee is able and effective in discharging its duties in accordance with its terms of reference and the requirements of the Code.
This report aims to outline the activities and the responsibilities of the Committee, on behalf of the Board, in scrutinising the conduct of the business, its management and auditors to protect the interests of our shareholders, the livelihoods of our employees, and the confidence of our customers and suppliers in the long-term financial strength of our business.
Andrew MartinChair of the Audit Committee
Intertek Group plc Annual Report and Accounts 2018 83
Directors' Report
ACCOUNTABILITY

COMMITTEE MEMBERSHIPThe membership of the Committee at the year end was Andrew Martin (Committee Chair), Dame Louise Makin, Jean-Michel Valette and Lena Wilson. With effect from 1 January 2018, Dame Louise Makin was appointed a member of the Committee. Andrew Martin, who is a qualified accountant, has extensive recent and relevant financial experience as required by the Code as he was until 2012 the Group Finance Director of Compass Group plc and through his other current and previous appointments. The Board considers that, as a whole, the Committee has the competence and broad experience relevant to the sectors in which Intertek operates as Dame Louise Makin, Jean-Michel Valette and Lena Wilson all have experience in those sectors. An overview of the background, knowledge and experience of the Committee Chair and each of the Committee members can be found on pages 74 and 75 and in the table on page 71.
On appointment, new Committee members receive an appropriate induction, consisting of the review of the terms of reference, previous Committee meeting papers and minutes, information on the Company’s financial and operational risks and also have access to, and meetings with, senior management and the Group’s internal and external auditors.
The business of the Committee is linked to the Group’s financial calendar of events and the timetable for the annual audit. During the year, the Committee held four formal meetings. Attendance of members at meetings is shown in the table on page 70. The Group Company Secretary attends all the meetings of the Committee. At the invitation of the Committee, the Chairman, CEO, CFO, Deputy Group Financial Controller and the Group Audit Director attended the meetings. The audit partner and his team attended all meetings held during the year. Other senior executives were invited to attend the Committee meetings as necessary.
The internal evaluation of the performance of the Committee was conducted during the year and entailed the completion of a detailed questionnaire by each of the Committee members, the review and discussion of the results of the evaluation and identifying and agreeing areas for improvement. It was shown that the Committee is able and effective in discharging its duties in accordance with its terms of reference and the requirements of the Code.
ROLE AND RESPONSIBILITIES OF THE COMMITTEEOur role and responsibilities, as authorised by the Board, are set out in the terms of reference of the Committee and fall into the categories below:
Financial reporting• Monitor the integrity of the financial statements and their
compliance with UK statutory requirements.
• Review significant financial reporting issues and judgements, accounting policies and compliance with accounting standards, including the implementation of new accounting standards.
Narrative reporting• Where requested by the Board, to review the Annual Report
and Accounts, and advise the Board on whether, taken as a whole, it is fair, balanced and understandable, and provides the information necessary for shareholders to assess the Company’s position and performance, business model and strategy.
Internal control and risk management systems• Keep under review the adequacy and effectiveness of the
internal financial controls and the internal control and risk management and assurance systems.
• Review and approve the statements to be included in the Annual Report and Accounts concerning internal controls and risk management and assurance.
Whistleblowing and fraud• Review the adequacy and security of the Company’s
arrangements for its employees and contractors to raise concerns, in confidence, about possible wrongdoing in financial reporting or other matters ensuring that these arrangements allow proportionate and independent investigation of such matters and appropriate follow up action.
• Review the Company’s systems and procedures for detecting fraud; for the prevention of bribery and receive regular reports on non-compliance and keep under review the effectiveness of the compliance function.
Internal audit• Monitor the effectiveness and resources of the internal
audit function.
• Approve the appointment and removal of the Group Audit Director.
• Agree internal audit plans and review reports of the internal audit work.
• Review and monitor management’s responsiveness to control observations made by the internal auditor.
External audit• Consider and make recommendations to the Board, to be put
to shareholders for approval at the AGM, in relation to the appointment, reappointment and removal of the Company’s external auditor.
• Oversee the relationship with the external auditor.
• Ensure that at least once every 10 years the audit services contract is put out to tender.
• Monitor and review the independence and performance of the external auditor and evaluate their effectiveness.
For the Committee’s terms of reference, see www.intertek.com.
SIGNIFICANT ISSUES CONSIDERED BY THE COMMITTEEIn preparation for each year end, the Committee reviews the significant accounting policies, estimates and judgements to be applied in the financial statements and discusses their application with management. The external auditor also considers the appropriateness of these assessments as part of the external audit.
In accordance with the Code, the external auditor prepares a report for the Committee on both the half-year and full-year results, which summarises the approach to key risks in the external audit and highlights any issues arising out of their work on those risks, or any other work undertaken on the audit.
During the year, the Committee reviewed and considered the following estimates and areas of judgement to be exercised in the application of the accounting policies:
Intertek Group plc Annual Report and Accounts 201884
Directors' Report | Corporate Governance
ACCOUNTABILITYcontinued

ClaimsFrom time to time the Group is involved in various claims and lawsuits incidental to the ordinary course of business. The Committee considered the claims provision which reflects the estimates of amounts payable in connection with identified claims from customers, former employees and others.
The Committee noted that once claims have been notified the finance teams liaise with the business to determine whether a provision is required, based on IAS 37 Provisions, Contingent liabilities and Contingent assets (‘IAS 37’).
The level of provision is subsequently reviewed on a regular basis with the Group General Counsel, taking into account the advice of external legal counsel. The Committee, following assurance from management and review of the report presented by the external auditor, considered and agreed that the claims provision was appropriate given the size and status of claims reported.
TaxationThe determination of profits subject to tax is calculated according to complex laws and regulations, the interpretation and application of which can be uncertain. In addition, deferred tax assets and liabilities require judgement in determining the amounts to be recognised, with consideration given to the timing and level of future taxable income. The main areas of judgement in the Group tax calculation are the expected central tax provisions for the full year and the recognition of the UK deferred tax asset.
Twice a year, the Committee receives a report from management providing an evaluation of existing risks and tax provisions which is reviewed by the Committee. The Committee also considered reports presented by the external auditor before determining that the levels of tax provisioning were appropriate.
RestructuringIn reviewing the provision for restructuring, the Committee reviewed details of the activities pursued as part of the restructuring to ensure that the appropriate level of provision is put in place, that these activities are aligned with the Group's strategy for growth and their classification as a separately disclosed item is appropriate. The Committee also sought confirmation from the external auditor that the restructuring plan met the criteria for recognising a provision under IAS 37 before determining that the provision was appropriate.
Accounting for acquisitionsIn August 2018, the Group made the significant acquisition of Alchemy Investment Holdings, Inc in the US. The provisional recognition of goodwill, intangible assets, other assets and liabilities and estimates of the fair value of consideration transferred for acquisitions made are based on a number of assumptions. In 2018, management concluded its final assessment of these assets and liabilities for acquisitions made in 2017 and presented an update to the Committee. The Committee reviewed management’s final accounting paper on acquisitions made in 2017 and 2018, and took into account the report presented by the external auditor, before determining that the acquisition accounting was appropriate.
ImpairmentThe Group’s strategy includes acquisition-led growth to generate new services and expand into new locations. These acquisitions, being in the service sector, can generate significant goodwill that benefits the Group as a whole and specifically the business to which the acquisition relates. Goodwill, aggregated at the cash generating unit (‘CGU’) level, must be tested annually for impairment under IAS 36 Impairment (‘IAS 36’), or when there are indicators of impairment.
The Committee reviewed the impairment consideration and calculations prepared by management considering the trading assumptions, the discount rates used as well as the sensitivities included by management, details of which are contained in note 9 to the financial statements. The Committee also took into account the work undertaken by the external auditor in respect of impairment and is satisfied that no impairment was required against any CGU.
The significant issues considered by the Committee in relation to the financial statements were consistent, with the exception of restructuring, with those identified by the external auditor in their report on pages 169 to 175.
The Committee reviewed and answered the correspondence received from the Financial Reporting Council (FRC) following their thematic review of Alternative Performance Measures carried out on our 2016 Annual Report and Accounts. The Committee has overseen the incorporation of reporting improvements agreed with the FRC following their review. The FRC’s review only covered the specific disclosures relating to their thematic review and the Committee notes that the FRC does not provide assurance that the Annual Report and Accounts are correct in all material respects as the FRC’s role is to consider compliance with reporting requirements.
FAIR, BALANCED AND UNDERSTANDABLE ASSESSMENT The Code provides that through its financial reporting, the Board should provide a fair, balanced and understandable assessment of the Company’s prospects.
At the Board’s request, the Committee reviewed the Annual Report and Accounts to determine whether it considered that the document, taken as a whole, meets this standard and provides the necessary information for shareholders and other readers of the Annual Report and Accounts to assess the Group’s position and performance for 2018, its business model and strategy.
In justifying this statement, the Committee has considered the robust process that underpins it, which includes:
• Clear guidance and instruction given to all contributors, including at business line level;
• Revisions as a result of regulatory requirements monitored on a regular basis;
• Pre-year end discussions held with the external auditor in advance of the year-end reporting process;
• Pre-year end input provided by senior management and corporate functions;
• A verification process dealing with the factual content of the reports to ensure accuracy and consistency;
Intertek Group plc Annual Report and Accounts 2018 85
Directors' Report

• Comprehensive review by the senior management team to ensure overall consistency and balance;
• Review conducted by external advisors and the external auditor on best practice with regard to the content and structure of the Annual Report and Accounts;
• Review and consideration of the Annual Report and Accounts by the Committee; and
• Final sign-off provided by the Board.
EXTERNAL AUDITORThe Statutory Auditors and Third Country Auditors Regulations 2016, which implement the EU Audit Directive and Audit Regulation, has resulted in changes to the Companies Act 2006 and to the Code. Amongst other things, the Company is now required to tender its audit every 10 years, to give advance notice of any tendering plans and to cap the non-audit fees paid to auditors at 70% of the three-year average audit fees at Group level, with there being a prohibition on the provision of certain non-audit services.
As noted in this report last year, the Group completed a transparent and independent audit tender process in 2015.
ACTIVITIES DURING THE YEARDuring the year the Committee discussed the following items:
AUDIT COMMITTEE AGENDA ITEMS 2018Financial statements and reports Feb May Aug Dec
Full-year results 2017 •Annual Report and Accounts 2017 •Management highlights memorandum • •Going concern assessment • •Fair, balanced and understandable assessment •Review of significant accounting policies • •Half-year results 2018 •Risk Register and Viability Statement process • •External auditPwC 2018 audit plan •Audit fee proposal 2018 •PwC engagement letter •PwC year end report and controls update •PwC half-year report and controls update •Intertek assessment of PwC effectiveness •Letter of representation to the auditors • •Independence confirmation and review of non-audit spend and policy • •PwC pre year-end report to the Committee •Internal Control Environment2019 Internal Audit plan and Charter •Internal Controls process and sign-off •Internal audit reports • • •Assessment of Internal Audit effectiveness •Core Mandatory Controls and Assurance Map update •Other2018 Rolling Committee agenda •2017 Evaluation of the Committee and Committee terms of reference •IFRS accounting standards update •
The results are presented to the Committee to ensure compliance with the Code. The Committee challenges judgemental statements to ensure that they are reasonable within the context of the report. This process enabled the Committee, and then the Board, to confirm that the 2018 Annual Report and Accounts, taken as a whole, is fair, balanced and understandable and provides the information necessary for shareholders to assess the Company’s position, performance, business model and strategy.
Following this process PwC have been the Company’s auditors and Ian Chambers the Audit Partner since May 2016.
In line with current regulation, the Company is required to put its external audit process out to tender again in 2025 – 2026.
The independence of the external auditor is critical for the integrity of the audit. We sought confirmation from the auditor that they are fully independent from the Company’s management, are free from conflicts of interest and have assessed the nature and level of non-audit fees paid to PwC and have determined that PwC are fully independent.
Intertek Group plc Annual Report and Accounts 201886
Directors' Report | Corporate Governance
ACCOUNTABILITYcontinued
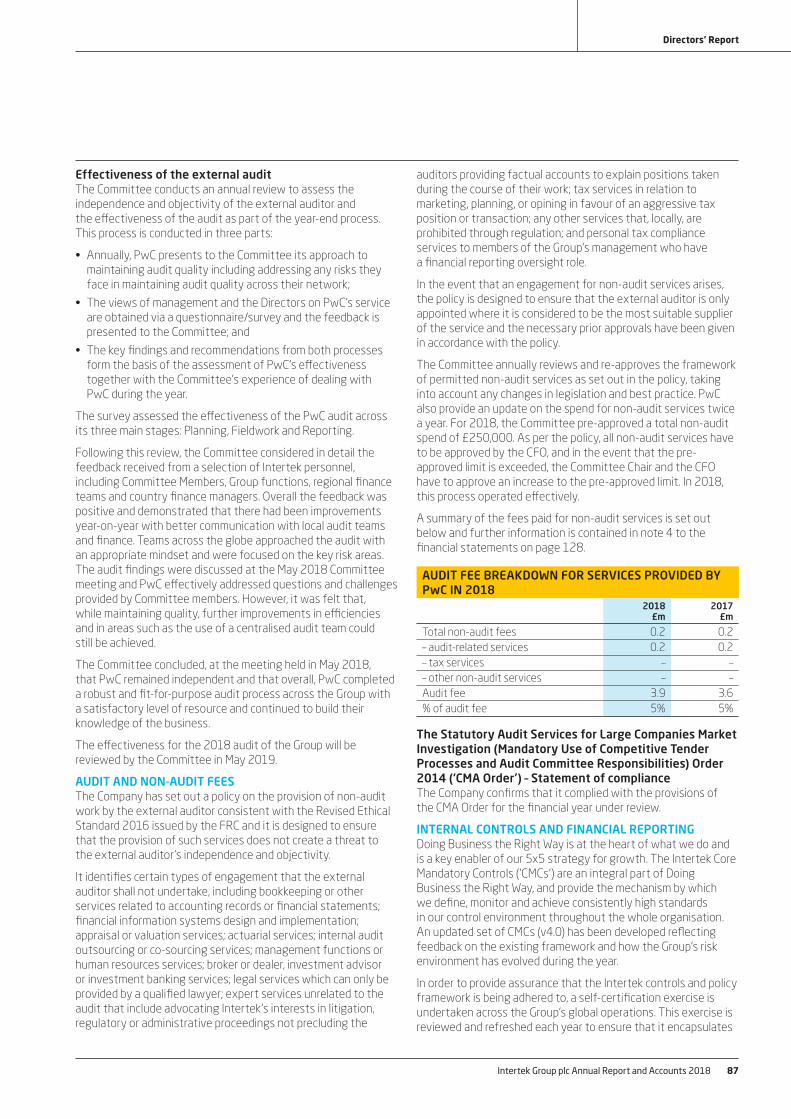
Effectiveness of the external auditThe Committee conducts an annual review to assess the independence and objectivity of the external auditor and the effectiveness of the audit as part of the year-end process. This process is conducted in three parts:
• Annually, PwC presents to the Committee its approach to maintaining audit quality including addressing any risks they face in maintaining audit quality across their network;
• The views of management and the Directors on PwC’s service are obtained via a questionnaire/survey and the feedback is presented to the Committee; and
• The key findings and recommendations from both processes form the basis of the assessment of PwC’s effectiveness together with the Committee’s experience of dealing with PwC during the year.
The survey assessed the effectiveness of the PwC audit across its three main stages: Planning, Fieldwork and Reporting.
Following this review, the Committee considered in detail the feedback received from a selection of Intertek personnel, including Committee Members, Group functions, regional finance teams and country finance managers. Overall the feedback was positive and demonstrated that there had been improvements year-on-year with better communication with local audit teams and finance. Teams across the globe approached the audit with an appropriate mindset and were focused on the key risk areas. The audit findings were discussed at the May 2018 Committee meeting and PwC effectively addressed questions and challenges provided by Committee members. However, it was felt that, while maintaining quality, further improvements in efficiencies and in areas such as the use of a centralised audit team could still be achieved.
The Committee concluded, at the meeting held in May 2018, that PwC remained independent and that overall, PwC completed a robust and fit-for-purpose audit process across the Group with a satisfactory level of resource and continued to build their knowledge of the business.
The effectiveness for the 2018 audit of the Group will be reviewed by the Committee in May 2019.
AUDIT AND NON-AUDIT FEESThe Company has set out a policy on the provision of non-audit work by the external auditor consistent with the Revised Ethical Standard 2016 issued by the FRC and it is designed to ensure that the provision of such services does not create a threat to the external auditor’s independence and objectivity.
It identifies certain types of engagement that the external auditor shall not undertake, including bookkeeping or other services related to accounting records or financial statements; financial information systems design and implementation; appraisal or valuation services; actuarial services; internal audit outsourcing or co-sourcing services; management functions or human resources services; broker or dealer, investment advisor or investment banking services; legal services which can only be provided by a qualified lawyer; expert services unrelated to the audit that include advocating Intertek’s interests in litigation, regulatory or administrative proceedings not precluding the
auditors providing factual accounts to explain positions taken during the course of their work; tax services in relation to marketing, planning, or opining in favour of an aggressive tax position or transaction; any other services that, locally, are prohibited through regulation; and personal tax compliance services to members of the Group’s management who have a financial reporting oversight role.
In the event that an engagement for non-audit services arises, the policy is designed to ensure that the external auditor is only appointed where it is considered to be the most suitable supplier of the service and the necessary prior approvals have been given in accordance with the policy.
The Committee annually reviews and re-approves the framework of permitted non-audit services as set out in the policy, taking into account any changes in legislation and best practice. PwC also provide an update on the spend for non-audit services twice a year. For 2018, the Committee pre-approved a total non-audit spend of £250,000. As per the policy, all non-audit services have to be approved by the CFO, and in the event that the pre-approved limit is exceeded, the Committee Chair and the CFO have to approve an increase to the pre-approved limit. In 2018, this process operated effectively.
A summary of the fees paid for non-audit services is set out below and further information is contained in note 4 to the financial statements on page 128.
AUDIT FEE BREAKDOWN FOR SERVICES PROVIDED BY PwC IN 2018
2018£m
2017£m
Total non-audit fees 0.2 0.2– audit-related services 0.2 0.2– tax services – –– other non-audit services – –Audit fee 3.9 3.6% of audit fee 5% 5%
The Statutory Audit Services for Large Companies Market Investigation (Mandatory Use of Competitive Tender Processes and Audit Committee Responsibilities) Order 2014 (‘CMA Order’) – Statement of complianceThe Company confirms that it complied with the provisions of the CMA Order for the financial year under review.
INTERNAL CONTROLS AND FINANCIAL REPORTINGDoing Business the Right Way is at the heart of what we do and is a key enabler of our 5x5 strategy for growth. The Intertek Core Mandatory Controls (‘CMCs’) are an integral part of Doing Business the Right Way, and provide the mechanism by which we define, monitor and achieve consistently high standards in our control environment throughout the whole organisation. An updated set of CMCs (v4.0) has been developed reflecting feedback on the existing framework and how the Group’s risk environment has evolved during the year.
In order to provide assurance that the Intertek controls and policy framework is being adhered to, a self-certification exercise is undertaken across the Group’s global operations. This exercise is reviewed and refreshed each year to ensure that it encapsulates
Intertek Group plc Annual Report and Accounts 2018 87
Directors' Report

all new areas of risk identified and to support the continued development of the Group’s control environment. An online questionnaire requesting confirmation of adherence to controls, financial and operational, is sent to all Intertek country and finance operations. Where corrective actions are needed, the country is required to provide an outline and a confirmed timeline. These items are monitored closely to ensure timely completion. This process is facilitated by the Legal, Risk and Compliance function.
A consolidated assessment is made at regional level for senior leadership approval. An evaluation is then undertaken with the Executive Management Team following which a Company-wide position is submitted to the CEO and the CFO. A final summary assessment is provided to the Committee. The self-assessment exercise has been reviewed during the year to ensure global coverage and to reflect Intertek’s operational and financial structure, and in order to enhance the alignment of the self- assessment to the assurance process.
A detailed verification programme also provides assurance to the Committee and the Board when checking that all the statements made in the Annual Report and Accounts are accurate. Intertek’s Manual of Accounting Policies and Procedures is issued to all finance staff and gives instructions and guidance on all aspects of accounting and reporting that apply to the Group.
The Committee can confirm that it reviewed the Group’s internal controls and risk management systems and concluded that there was a sound and effective control environment in place across the Group during 2018, and up to the date on which these financial statements were approved. No significant failings or weaknesses had been identified.
INTERNAL AUDITThe Group has an Internal Audit function whose activities are overseen by the Committee, and which provides assurance over compliance with the Group’s framework of financial CMCs. In 2018, the Committee:
• Oversaw the independence of Internal Audit by maintaining a direct independent reporting line between the Group Audit Director and the Committee Chair, and by meeting with the Group Audit Director without the presence of management;
• Approved the Internal Audit Charter, which sets out the basis on which audits are carried out in the Group;
• Oversaw investment in the Internal Audit function, to ensure adequate resourcing that provides value for money assurance;
• Reviewed and approved the audit plan that has ensured all significant businesses have received multiple audits since the launch of the controls framework in 2016;
• Reviewed reports on internal audit activities including overall progress in delivering the plan and summaries of each audit performed, with commentary on compliance with the controls framework, areas of good practice and areas for improvement; the Committee has noted a steady improvement in audit scores over the period since the introduction of the mandatory controls framework;
• Monitored management's progress on addressing audit actions; and
• Reviewed the annual assessment on the effectiveness of the Group Internal Audit function which included feedback from key business stakeholders and an action plan for areas of improvement; an independent review of effectiveness, carried out every three years, will be undertaken in 2019.
PRIORITIES FOR 2019The priorities for the Committee over the next 12 months are as follows:
• Continue to monitor the external auditor;
• Ensure that the audit continues to evolve and align with the changes in the business and strategic objectives;
• Continue to develop and refine the CMCs in line with the evolving risk environment of the Company;
• Continue to monitor the impact of external economic factors on the Group and its financial position; and
• Review the 2018 UK Corporate Governance Code and incorporate any changes as necessary into the Committee's terms of reference.
GOING CONCERNThe Directors have a reasonable expectation that the Group has adequate resources for a period of at least 12 months from the date of signing this Annual Report and Accounts, and have therefore assessed that the going concern basis of accounting is appropriate in preparing the financial statements and that there are no material uncertainties to disclose.
This conclusion is based on a review and an assessment of the levels of facilities expected to be available to the Group, based on levels of cash held, Group Treasury funding projections, and the Group’s financial projections for a period to 31 December 2023. With the exception of US$20m of facilities that matured and were repaid in January 2019, all the current borrowing facilities, as disclosed in note 14 of the financial statements, are expected to be available at 31 December 2019.
In making this assessment, management has considered the covenants attached to the Group’s borrowing facilities and performed downside scenarios on the Group’s financial projections of 10% and 20% reduction in EBITDA forecast. Even in these circumstances, there is significant headroom on the debt covenants.
After making diligent enquiries the Directors have a reasonable expectation based upon current financial projections and bank facilities available, that the Group has adequate resources to continue in operation. Accordingly, they continue to adopt the going concern basis in preparing the Group’s financial statements.
Andrew MartinChair of the Audit Committee
Intertek Group plc Annual Report and Accounts 201888
Directors' Report | Corporate Governance
ACCOUNTABILITYcontinued

DEAR SHAREHOLDERI am delighted to present our Remuneration Report for the year ended 31 December 2018.
Policy reviewThe Remuneration Report includes our proposed Remuneration Policy, which, subject to shareholder approval, will apply for the three years from the 2019 AGM.
During the year, the Remuneration Committee (the 'Committee') completed a thoughtful review of the Remuneration Policy to ensure it continues to support the delivery of Intertek’s differentiated 5x5 strategy for growth as well as recognising the changes in the governance environment since 2016 when the current Remuneration Policy received 96.38% support from our shareholders. The Committee also undertook a detailed consultation with our largest shareholders and the proxy advisory bodies and I would like to thank our shareholders for their engagement.
The proposed Policy is based on doing what is right for Intertek, embracing the spirit of recent changes in corporate governance, and taking into consideration the feedback we have received from our shareholders.
Our Remuneration Policy underpins the delivery of the Group’s strategic objectives of margin-accretive revenue growth, strong cash generation and disciplined allocation of capital to invest in attractive growth and margin sectors. We achieve this by using a balanced set of metrics for our incentives: Revenue, Operating Profit, Return on Invested Capital ('ROIC'), Total Shareholder Return and Earnings per Share. This ensures close alignment between our shareholder interests and management focus.
Our results have demonstrated continuous progress on revenue, margin, EPS, cash and ROIC with impressive CAGR between 2014 and 2018 of:
• +7.6% in Revenue
• +10.4% in Operating Profit
• +10.7% in EPS growth
• +17.4% in Free Cash Flow growth
• +19.2% in Dividend per Share growth
In 2018, we delivered record operating margin of 17.2%, up 170bps since 2014 and our average ROIC over the last four years has been 22.7%. Total Shareholder Return growth has been over five times that of the FTSE 100 over the same period.
Aligning with the wider workforceWith regard to the Committee's oversight of the Core Purpose, Culture and Values and the wider workforce, at Intertek, remuneration for all employees follows the same policy and principles as the senior executives. All of the short-term and long-term incentive schemes, shareholding requirements and other provisions, where applicable, are followed consistently.
The core elements of the Policy will continue to include competitive base salaries, benefits, pensions, annual incentive and long-term incentive. The annual incentive, covering the majority of our 44,720 people around the world, supports sustainable financial performance by focusing on growth in Revenue and Operating Profit, margin accretion and ROIC. The long-term incentive ('LTI') in which about 110 employees take part, focuses on Earnings per Share and Total Shareholder Return, over a three-year cycle
Proposed Policy changes
• To increase the time horizon for the LTI from three and a half to five years from date of grant.
• To introduce a ROIC quality of earnings underpin for the LTI awards.
• To introduce post-cessation shareholding requirements.
• To reduce the pension benefits for new appointments in the UK to be in line with the majority of the UK workforce.
Return on Invested CapitalROIC is very important to us and is already included in our annual incentive. For LTI awards, each year the Committee reviews the level of vesting to ensure it is consistent with the overall business performance and earnings. Following feedback from a few of our shareholders who believe in the importance of Return on Capital when considering our LTI awards, we will additionally introduce an ROIC quality of earnings underpin to vesting. Historically our ROIC performance has been very strong and we have delivered an average ROIC of 22.7% since 2015.
Post-Employment ShareholdingWith regards to the post-employment shareholding requirement, our proposed approach enforces the retention of unvested, outstanding Deferred and LTI awards for leavers through their normal time horizons. In the event that an executive is treated as a good leaver, the pre-tax value of outstanding awards at cessation of employment could be up to 1,300% of base salary. Where an executive is a bad leaver, this could have a pre-tax value of up to 500% of base salary. The Committee believes that in line with the UK Corporate Governance Code this provides significantly improved alignment with shareholder interests post-cessation of employment.
Gill RiderChair of the Remuneration Committee
Intertek Group plc Annual Report and Accounts 2018 89
Directors' Report
REMUNERATION REPORT

DIRECTORS’ REMUNERATION POLICY REPORT The section below sets out the Remuneration Policy for Executive and Non-Executive Directors, which is subject to a binding vote of the shareholders and will, if approved, be effective from the date of the 2019 AGM.
POLICY OVERVIEW We continue to focus on ensuring that our Remuneration Policy is appropriate for the nature, size and complexity of the Group, encourages our employees in the development of their careers and is aligned to the Company’s strategy and is in the best interests of the Company and its stakeholders. It is directed to deliver continued sustainable profitable growth.
Our remuneration strategy is to:
• Align and recognise the individual’s contribution to help us succeed in achieving our 5x5 growth strategy and long-term Ever Better, Ever Stronger business goals;
• Attract, engage, motivate and retain the best available people by positioning total pay and benefits to be competitive in the relevant market and in line with the ability of the business to pay;
• Reward people equitably for the size of their responsibilities and performance; and
• Motivate high performers to increase shareholder value and share in the Group’s success.
Each year the Committee approves the overall reward strategy for the Group and considers the individual remuneration of the Executive Directors and certain senior executives.
The Committee reviews the balance between base salary and performance-related remuneration against the key objectives and targets so as to ensure performance is appropriately rewarded. This also ensures outcomes are a fair reflection of the underlying performance of the Group.
As a global service business, our success is critically dependent on the performance and retention of our key people around the world. Employment costs represent the major element of Group operating costs. As a global Group our pay arrangements take into account both local and international markets and we operate a global Remuneration Policy framework to achieve our reward strategy.
Our peer groups for the majority of our employees consist of international industrial or business service organisations and similar-sized businesses. For our more senior executives we base our remuneration comparisons on a blend of factors, including sector, job complexity, location, responsibilities and performance, whilst recognising the Company is listed in the UK.
We believe that a significant proportion of remuneration for senior executives should be related to performance, with part of that remuneration being deferred in the form of shares and subject to continued employment and longer-term performance.
We also believe that share-based remuneration should form a significant element of senior executives’ compensation, so that there is a strong link to the sustained future success of the Group.
Shareholding requirements during employment remain unchanged. Currently our CEO holds 345,353 shares in the Company valued at over 1,700% of his current base salary.
Pay for performanceAs set out earlier in the Annual Report, Intertek has continued to perform well in 2018, with 1.2% growth in revenue (4.7% at constant currency) and 3.0% growth in adjusted OP (6.9% at constant currency), a record operating margin of 17.2% (up 40bps at constant currency), a proposed full year dividend of 50% and ROIC of over 20%. In light of performance delivered, the Committee approved an annual incentive result of 75.5% of maximum.
Over the longer-term, the three-year performance of the Group has delivered EPS CAGR growth of 9.7% and Total Shareholder Return in the upper quartile of the comparator group, which resulted in a payout of 98.32%.
With regards to salary, the Committee has awarded the CEO a 2% salary increase in line with the wider UK workforce.
Board succession As announced on 22 August 2018, following a review of the Group’s organisation structure, Ross McCluskey was appointed as Group CFO, with Ed Leigh stepping down with immediate effect. Given the change to the organisational structure, Ed was treated as a good leaver for the purpose of outstanding incentive awards (see further details on page 103).
On joining the Board, Ross’ remuneration arrangements were set in line with his predecessor (salary: £475k; annual incentive: 200%; long-term incentive: 200%); in line with the updated UK Corporate Governance Code, his pension arrangements were set in line with wider UK workforce at 5% of salary (previously 20%).
CEO pay ratioIn line with investor expectations, Intertek has also decided to voluntarily report the CEO’s pay ratio, in anticipation of regulations coming into force for accounting periods starting on or after 1 January 2019. This can be found on page 104.
The elements of this Report specifically required to be audited within the bordered sections of pages 98 to 103 have been audited by PwC in compliance with the requirements of the regulations.
The Board is confident that remuneration at Intertek is aligned to our shareholder interests and carefully designed to support the sustainable delivery of Intertek’s clear and powerful differentiated 5x5 growth strategy. I look forward to your support at our forthcoming 2019 AGM.
Yours sincerely,
Gill RiderChair of the Remuneration Committee
Intertek Group plc Annual Report and Accounts 201890
Directors' Report | Corporate Governance
REMUNERATION REPORTcontinued
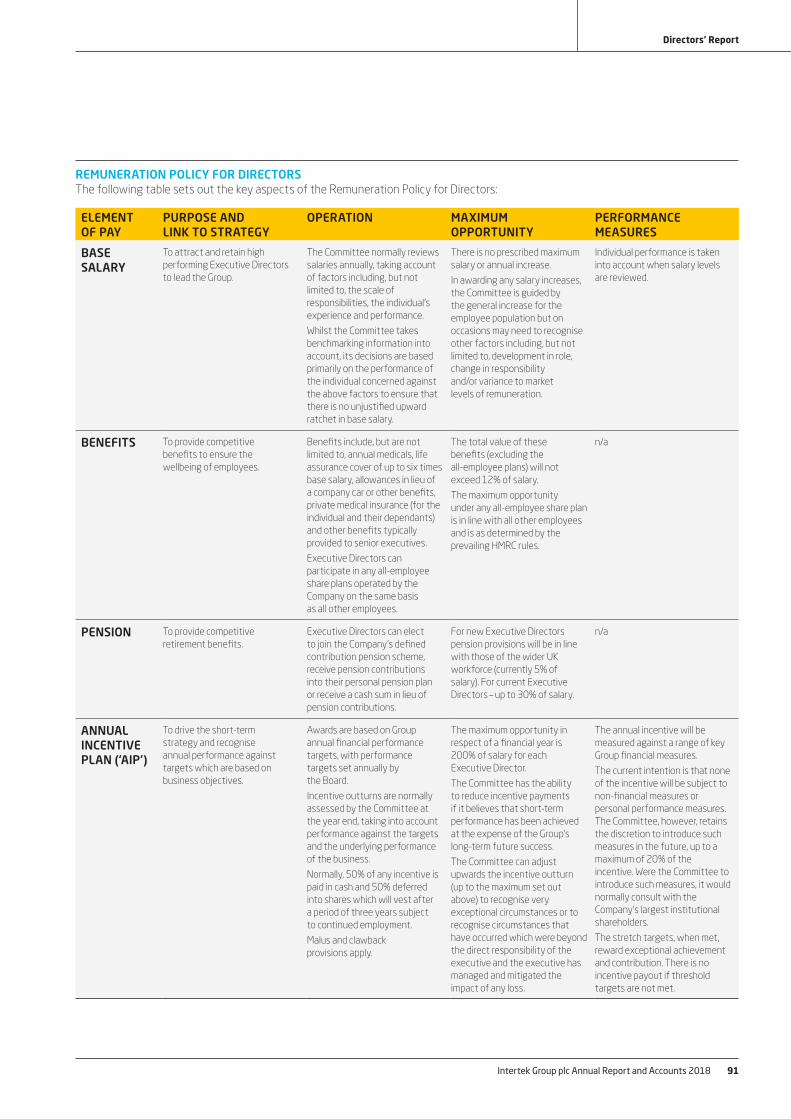
REMUNERATION POLICY FOR DIRECTORSThe following table sets out the key aspects of the Remuneration Policy for Directors:
ELEMENT OF PAY
PURPOSE AND LINK TO STRATEGY
OPERATION MAXIMUM OPPORTUNITY
PERFORMANCE MEASURES
BASE SALARY
To attract and retain high performing Executive Directors to lead the Group.
The Committee normally reviews salaries annually, taking account of factors including, but not limited to, the scale of responsibilities, the individual’s experience and performance.
Whilst the Committee takes benchmarking information into account, its decisions are based primarily on the performance of the individual concerned against the above factors to ensure that there is no unjustified upward ratchet in base salary.
There is no prescribed maximum salary or annual increase.
In awarding any salary increases, the Committee is guided by the general increase for the employee population but on occasions may need to recognise other factors including, but not limited to, development in role, change in responsibility and/or variance to market levels of remuneration.
Individual performance is taken into account when salary levels are reviewed.
BENEFITS To provide competitive benefits to ensure the wellbeing of employees.
Benefits include, but are not limited to, annual medicals, life assurance cover of up to six times base salary, allowances in lieu of a company car or other benefits, private medical insurance (for the individual and their dependants) and other benefits typically provided to senior executives.
Executive Directors can participate in any all-employee share plans operated by the Company on the same basis as all other employees.
The total value of these benefits (excluding the all-employee plans) will not exceed 12% of salary.
The maximum opportunity under any all-employee share plan is in line with all other employees and is as determined by the prevailing HMRC rules.
n/a
PENSION To provide competitive retirement benefits.
Executive Directors can elect to join the Company’s defined contribution pension scheme, receive pension contributions into their personal pension plan or receive a cash sum in lieu of pension contributions.
For new Executive Directors pension provisions will be in line with those of the wider UK workforce (currently 5% of salary). For current Executive Directors – up to 30% of salary.
n/a
ANNUALINCENTIVE PLAN (‘AIP’)
To drive the short-term strategy and recognise annual performance against targets which are based on business objectives.
Awards are based on Group annual financial performance targets, with performance targets set annually by the Board.
Incentive outturns are normally assessed by the Committee at the year end, taking into account performance against the targets and the underlying performance of the business.
Normally, 50% of any incentive is paid in cash and 50% deferred into shares which will vest after a period of three years subject to continued employment.
Malus and clawback provisions apply.
The maximum opportunity in respect of a financial year is 200% of salary for each Executive Director.
The Committee has the ability to reduce incentive payments if it believes that short-term performance has been achieved at the expense of the Group’s long-term future success.
The Committee can adjust upwards the incentive outturn (up to the maximum set out above) to recognise very exceptional circumstances or to recognise circumstances that have occurred which were beyond the direct responsibility of the executive and the executive has managed and mitigated the impact of any loss.
The annual incentive will be measured against a range of key Group financial measures.
The current intention is that none of the incentive will be subject to non-financial measures or personal performance measures. The Committee, however, retains the discretion to introduce such measures in the future, up to a maximum of 20% of the incentive. Were the Committee to introduce such measures, it would normally consult with the Company’s largest institutional shareholders.
The stretch targets, when met, reward exceptional achievement and contribution. There is no incentive payout if threshold targets are not met.
Intertek Group plc Annual Report and Accounts 2018 91
Directors' Report
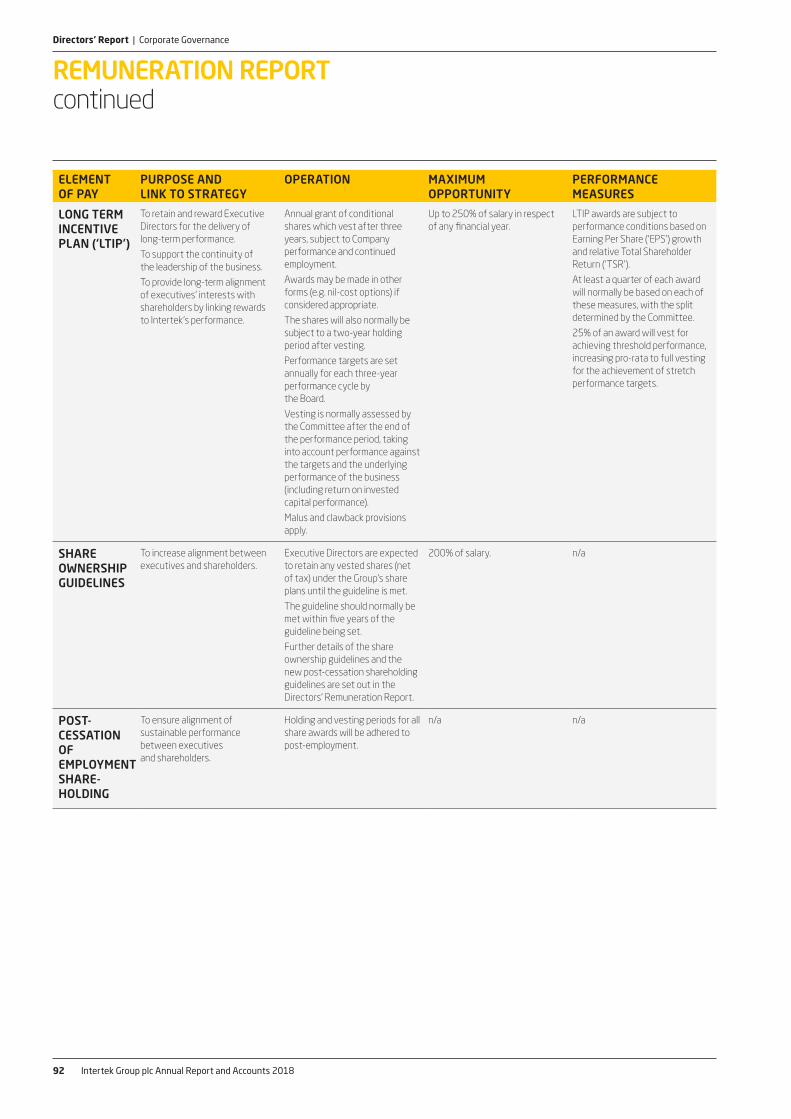
ELEMENT OF PAY
PURPOSE AND LINK TO STRATEGY
OPERATION MAXIMUM OPPORTUNITY
PERFORMANCE MEASURES
LONG TERM INCENTIVE PLAN (‘LTIP’)
To retain and reward Executive Directors for the delivery of long-term performance.
To support the continuity of the leadership of the business.
To provide long-term alignment of executives’ interests with shareholders by linking rewards to Intertek’s performance.
Annual grant of conditional shares which vest after three years, subject to Company performance and continued employment.
Awards may be made in other forms (e.g. nil-cost options) if considered appropriate.
The shares will also normally be subject to a two-year holding period after vesting.
Performance targets are set annually for each three-year performance cycle by the Board.
Vesting is normally assessed by the Committee after the end of the performance period, taking into account performance against the targets and the underlying performance of the business (including return on invested capital performance).
Malus and clawback provisions apply.
Up to 250% of salary in respect of any financial year.
LTIP awards are subject to performance conditions based on Earning Per Share (‘EPS’) growth and relative Total Shareholder Return (‘TSR’).
At least a quarter of each award will normally be based on each of these measures, with the split determined by the Committee.
25% of an award will vest for achieving threshold performance, increasing pro-rata to full vesting for the achievement of stretch performance targets.
SHARE OWNERSHIP GUIDELINES
To increase alignment between executives and shareholders.
Executive Directors are expected to retain any vested shares (net of tax) under the Group’s share plans until the guideline is met.
The guideline should normally be met within five years of the guideline being set.
Further details of the share ownership guidelines and the new post-cessation shareholding guidelines are set out in the Directors' Remuneration Report.
200% of salary. n/a
POST-CESSATIONOFEMPLOYMENTSHARE-HOLDING
To ensure alignment of sustainable performance between executives and shareholders.
Holding and vesting periods for all share awards will be adhered to post-employment.
n/a n/a
Intertek Group plc Annual Report and Accounts 201892
Directors' Report | Corporate Governance
REMUNERATION REPORTcontinued

ELEMENT OF PAY
PURPOSE AND LINK TO STRATEGY
OPERATION MAXIMUM OPPORTUNITY
PERFORMANCE MEASURES
NON-EXECUTIVE DIRECTORS’ FEES
To attract and retain high-calibre Non-Executive Directors through the provision of market-competitive fees.
A proportion of the fees (at least 50%) are paid in cash, with the remainder used to purchase shares.
Fees are primarily determined based on the responsibility and time committed to the Group’s affairs and appropriate market comparisons.
The Chairman receives an all-inclusive fee. Non-Executive Directors receive a base fee and further fees for additional Board responsibilities. Additional fees may be paid in the exceptional event that Non-Executive Directors are required to commit substantial additional time above that normally expected for the role.
With the exception of benefits-in-kind arising from the performance of duties (and any tax due on those benefits which is reimbursed by the Company), no other benefits are provided, other than to the Chairman, who receives a car allowance of £25,000 per annum.
As for the Executive Directors, there is no prescribed maximum annual increase. The Committee is guided by the general increase for the employee population but on occasions may need to recognise other factors including, but not limited to, change in responsibility and/or variance to market levels of remuneration.
n/a
CHANGES TO THE POLICY TABLEAs set out in the statement from the Committee Chairman, there are no major changes to the remuneration structure proposed as part of the new policy. The key changes that have been made are:
(a) increasing the holding period for LTIP Awards to two years from the date of vesting;
(b) introduction of a ROIC quality of earnings underpin for the LTI awards;
(c) in line with the 2018 Corporate Governance Code, reducing the pension provision for new Executive Directors to be aligned with the wider workforce;
(d) introduction of post-cessation of employment shareholding guideline; and
(e) a few minor changes to clarify the policy and to reflect developments in market practice since the last policy was approved at the Company's 2016 Annual General Meeting.
SELECTION OF PERFORMANCE METRICSThe annual incentive plan is based on performance against a mix of financial measures. The mix of financial measures is aligned to the Group’s Key Performance Indicators ('KPIs') and is reviewed each year by the Remuneration Committee to ensure that they remain appropriate to reflect the priorities for the business in the year ahead. The targets are set for each KPI to encourage continuous improvement and challenge the delivery of stretch performance.
The LTIP is based on EPS growth and TSR performance. EPS is a measure of the Group’s overall financial success and TSR provides an external assessment of the Company’s performance against the market. It also aligns the rewards received by executives with the returns received by shareholders. A sliding scale of challenging performance targets is set for each measure. The Committee reviews the choice of performance measures and the appropriateness of the performance targets prior to each LTIP grant. The Committee reserves the discretion to set different targets for future awards, without consulting with shareholders. Overall, the Committee consider that the complementary nature of the performance measures used for the annual incentive plan and the LTIP provide executives with the right balance between revenue growth, margin progress, cash generation, disciplined capital allocation and return on investment to deliver sustainable returns for our shareholders.
When setting the targets for the annual incentive and the LTIP, the Committee takes into account a range of factors, including the business plan, prior-year performance, market conditions and consensus forecasts.
Intertek Group plc Annual Report and Accounts 2018 93
Directors' Report

TERMS OF INCENTIVE AWARDSDeferred awards and LTIP awards may include the right to receive (in cash or shares) the value of the dividends that would have been paid on the shares that vest up to the time of vesting (or for LTIP awards, up to the end of the relevant holding period). The Committee’s intention is that such dividends would normally be settled in shares.
The Committee will operate the annual incentive plan and LTIP according to the respective rules of the plans. The Committee will retain flexibility in a number of areas regarding the operation and administration of these plans, including (but not limited to) the following:
• How to deal with a change of control or restructuring of the Group, or a demerger or similar event (including how to assess performance conditions and whether to time pro-rate awards);
• How and whether any award may be adjusted in certain circumstances (including in the event of a variation of share capital, demerger, special dividend, or similar event).
The Committee also retains the discretion within the Policy to adjust targets and/or set different measures and weightings if it considers it is required so that the targets or conditions achieve their original purpose. Revised targets/measures will be, in the opinion of the Committee, no less difficult to satisfy than the original conditions.
The Committee may accelerate the vesting and/or the release of awards if an Executive Director moves jurisdictions following grant and there would be greater tax or regulatory burdens on the award in the new jurisdiction.
REMUNERATION SCENARIOS FOR EXECUTIVE DIRECTORSThe chart below illustrates how the Executive Directors’ remuneration packages vary at different levels of performance under the revised Policy, which will apply in 2019 for both the Chief Executive Officer (‘CEO’) and Chief Financial Officer (‘CFO’).
APPROACH TO RECRUITMENT AND PROMOTIONSThe remuneration package for a new Executive Director – base salary, benefits, pension, annual incentive and long-term incentive awards – would be set in accordance with the terms of the Company’s prevailing approved Remuneration Policy at the time of appointment. The Committee may set the base salary at a value to reflect the calibre, experience and earnings potential of a candidate, subject to the Committee’s judgement that the level of remuneration is in the Company’s best interest. The maximum level of variable pay (annual incentive and long-term incentive awards, or any combination thereof) which may be awarded to a new Executive Director at or shortly following recruitment shall be limited to 450% of salary. These limits exclude buyout awards and are in line with the ‘Remuneration Policy for Directors’ set out previously.
The Committee may offer additional cash and/or share-based elements to take account of remuneration relinquished when leaving the former employer when it considers these buyouts to be in the best interests of the Company (and therefore shareholders) (‘buyouts’). Any such awards would reflect the nature, time horizons and performance requirements attaching to the remuneration it is intended to replace. Where appropriate, the Committee retains the flexibility to utilise Listing Rule 9.4.2
VALUE OF REMUNERATION PACKAGES AT DIFFERENT LEVELS OF PERFORMANCE
£’000
7,000
6,500
6,000
5,500
4,500
5,000
Minimum On-targetA Lacroix, Chief Executive O�cer R McCluskey, Chief Financial O�cer
Maximum 2Maximum Minimum
LTIP award
Annual incentive
Basic salary, benefits and pension
On-target Maximum 2Maximum
4,000
34%
27%28%
32%
32%
49%
33%
52%
100% 39% 20%
34%
42%
24%100% 36% 18%
39%
39%
22%
3,500
3,000
2,500
2,000
1,500
1,000
500
£1,379
£3,559
£5,739
£6,950
£520
£1,470
£2,420
£2,895
Points relating to the above table:1. Salary levels are based on those applying on 1 April 2019.2. The value of taxable benefits is based on the cost of supplying those benefits (as disclosed) for the year ended 31 December 2018.3. The value of pension receivable by the CEO and CFO in 2019 is taken to be 30% of salary and 5% of salary respectively.4. The on-target level of annual incentive is taken to be 50% of the maximum opportunity.5. The on-target level of the LTIP is taken to be 50% of the face value of the award at grant.6. Share price movement and dividend accrual have not been incorporated into the first three scenarios. Share price growth of 50% has been assumed
on the LTIP in the final scenario.
Intertek Group plc Annual Report and Accounts 201894
Directors' Report | Corporate Governance
REMUNERATION REPORTcontinued

for the purpose of making an award to ‘buyout’ remuneration relinquished when leaving the former employer.
For external and internal appointments, the Committee may agree that the Company will meet certain relocation expenses and continuing allowances as appropriate. Additionally, in the case of any Executive Director being recruited from overseas, or being recruited by the Company to relocate overseas to perform their duties, the Committee may offer expatriate benefits on an ongoing basis subject to their aggregate value to the individual not exceeding 50% of salary per annum.
For an internal Executive Director appointment, any variable pay element awarded in respect of the prior role may be allowed to pay out according to its terms, adjusted as relevant to take into account the appointment. In addition, any other ongoing remuneration obligations existing prior to appointment may continue.
If a new Chairman or Non-Executive Director is appointed, remuneration arrangements will be in line with those detailed in the Remuneration Policy for Non-Executive Directors set out in the ‘Remuneration Policy for Directors’ above.
SERVICE CONTRACTS FOR EXECUTIVE DIRECTORSThe service agreements of the Executive Directors are not fixed term and are terminable by either the Company or the Director on 12 months’ notice and make provision, at the Board’s discretion, for early termination by way of payment of salary and pension contributions in lieu of 12 months’ notice. In calculating the amount payable to a Director on termination of employment, the Board would take into account the commercial interests of the Company and apply usual common law and contractual principles. Any payments in lieu of notice may be paid in a lump sum or may be paid in instalments and reduce if the Director finds alternative employment. The service contracts are available for inspection at the Company’s registered office. The Committee reviews the contractual terms for new Executive Directors to ensure these reflect best practice.
In summary, the contractual provisions are:
PROVISION DETAILED TERMS
Notice period 12 months
Common law and contractual principles
Common law and contractual principles apply
Remuneration entitlements An incentive may be payable (pro-rata where relevant) and outstanding Share Awards may vest (see below).
Change of control No Executive Director’s contract contains provisions or additional payments in respect of change of control. The treatment of annual incentive awards and outstanding Share Awards will be treated in line with the relevant plan rules.
There is no automatic entitlement to an annual incentive award in the year of cessation of employment. The Committee may determine however, that for certain leavers an annual incentive award may be payable with respect to the period of the financial year served. Any share-based entitlements granted to an Executive Director under the Company's share plans will be determined based on the relevant plan rules. The default treatment for deferred share awards is that any outstanding awards lapse on cessation of employment. However, in certain 'good leaver' circumstances (as described under the 2011 LTIP below), awards will vest in full on the original vesting date unless (as permitted under the plan rules) the Committee determines that awards should vest at an earlier date.
The default treatment under the 2011 LTIP is that any outstanding awards lapse on cessation of employment. However, in certain prescribed circumstances, such as death, ill-health, injury, disability, retirement or other circumstances at the discretion of the Committee, ‘good leaver’ status may be applied.
For good leavers, awards will normally vest on the original vesting date (and will normally, where appropriate, be subject to any holding period), subject to the satisfaction of the relevant performance conditions at that time and reduced pro-rata to reflect the proportion of the performance period actually served. However, the Committee has discretion to determine that awards vest at an earlier date and/or to disapply time pro-rating, although it is envisaged that this would only be applied in exceptional circumstances. Any such incidents, where discretion is applied by the Committee in relation to Executive Directors, will be disclosed in the following Annual Report on Remuneration.
In determining whether an Executive should be treated as a good leaver or not, the Committee will take into account the reasons for their departure.
The Committee reserves the right to make any other payments (including appropriate legal fees) in connection with an Executive Director's cessation of office or employment where the payments are made in good faith on discharge of an existing legal obligation (or by way of damages for breach of their obligation) or by way of settlement of any claim arising in contravention with the cessation of an Executive Director's office or employment.
LETTERS OF APPOINTMENT FOR NON-EXECUTIVE DIRECTORSThe letter of appointment for each Non-Executive Director states that they are appointed for an initial period of three years and all appointments are terminable by one month’s notice on either side. At the end of the initial period and after rigorous review the appointment may be renewed for a further period, usually three years, if the Company and the Director agree and subject to annual re-election at the AGM. Each letter of appointment states that if the Company were to terminate the appointment, the Director would not be entitled to any compensation for loss of office.
Intertek Group plc Annual Report and Accounts 2018 95
Directors' Report

The table below sets out the terms for all the current Non-Executive Directors of the Board.
DATE OF APPOINTMENT
NOTICE PERIOD/ UNEXPIRED TERM AS AT 31 DECEMBER 2018
Sir David Reid 1 December 2011 Reappointed: 1 December 2017
One month/23 months
Graham Allan 1 October 2017 One month/21 months
Gurnek Bains 1 July 2017 One month/18 months
Dame Louise Makin
1 July 2012 Reappointed: 1 July 2018
One month/30 months
Andrew Martin 26 May 2016 One month/6 months
Gill Rider 1 July 2015 Reappointed: 1 July 2018
One month/30 months
Jean-Michel Valette
1 July 2017 One month/18 months
Lena Wilson 1 July 2012 Reappointed: 1 July 2018
One month/30 months
CONSIDERATION OF EMPLOYMENT CONDITIONS ELSEWHERE IN THE COMPANYWhen setting the Remuneration Policy for Executive Directors, the Remuneration Committee takes into account the pay and employment conditions elsewhere within the Group. When considering the remuneration arrangements for the Executive Directors for the year ahead, the Committee is informed of salary increases across the wider group. The Committee also approves the overall reward strategy in operation across the Group.
The remuneration strategy set out at the beginning of the Directors’ Remuneration Policy report reflects the strategy in place across all employees across the Group. Although this remuneration strategy applies across the Group, given the size of the Group and the geographical spread of its operations, the way in which the Remuneration Policy is implemented varies across the Group. For example, annual incentive deferral applies at the more senior levels within the Group and participation in the LTIP is at the Remuneration Committee’s discretion and is typically limited to senior executives employed within the Group.
Given the geographical spread of the Group’s operations, the Remuneration Committee does not consider it appropriate to consult employees on the Remuneration Policy in operation for Executive Directors.
CONSIDERATION OF SHAREHOLDER VIEWSThe Committee takes the views of the Group’s shareholders very seriously. Prior to the 2019 AGM, the Committee consulted with shareholders on the proposed policy and the changes that were being made. The proposed policy reflects the extensive discussions with shareholders during the consultation process.
LEGACY ARRANGEMENTSThrough this approved Directors’ Remuneration Policy Report, authority is given to the Company to honour any commitments entered into with current or former Directors such as the vesting of outstanding share awards (including exercising any discretions available to it in connection with such commitments) that were agreed:
(i) Before the policy set out above, or any previous policy, came into effect;
(ii) At a time when a previous policy approved by shareholders was in place provided that the payment is in line with the terms of that policy; and
(iii) At a time when the relevant individual was not a Director of the Company and the payment was not in consideration for the individual becoming a Director of the Company.
ANNUAL REPORT ON REMUNERATION
COMMITTEE MEMBERSHIP AND MEETING ATTENDANCEThe membership of the Committee at the year end was Gill Rider (Committee Chair), Graham Allan, Gurnek Bains and Andrew Martin. With effect from 1 January 2018, Dame Louise Makin stepped down and Gurnek Bains was appointed a member of the Committee. Meeting attendance is shown on page 70.
Throughout the year, the composition of the Committee was compliant with the Code. All members are independent Non-Executive Directors. Prior to joining Intertek and becoming Chair of the Remuneration Committee Gill had previously acted as Chair of the Remuneration Committee at Charles Taylor Plc.
On appointment, new Committee members receive an appropriate induction consisting of the review of the terms of reference, previous Committee meeting papers, meetings with senior personnel and advisors and, as appropriate, meetings with shareholders and other relevant stakeholders.
The Committee invites the Chairman, CEO and the EVP, Human Resources to attend meetings when it deems appropriate, except when their own remuneration is discussed. No Director is involved in determining his or her own remuneration. None of the Committee members has had any personal financial interest, except as shareholders, in the decisions made by the Committee. The Group Company Secretary acts as Secretary to the Committee.
Intertek Group plc Annual Report and Accounts 201896
Directors' Report | Corporate Governance
REMUNERATION REPORTcontinued

THE ROLE OF THE COMMITTEEOn behalf of the Board, the Committee:
• Determines the Company’s policy on the remuneration of the Chairman, the Executive Directors and senior executive management;
• Determines the remuneration packages of the above, including any compensation on termination of office;
• Reviews the remuneration arrangements for the wider employee population and considers issues relating to remuneration that may have a significant impact on the Group;
• Provides advice to, and consults with, the CEO on major policy issues affecting the remuneration of other executives; and
• Keeps the Remuneration Policy under review in light of regulatory and best practice developments and shareholder expectations. Due regard is given to the interests of shareholders and the requirements of the Listing Rules and associated guidance.
For the Committee’s terms of reference, see www.intertek.com.
THE ACTIVITY OF THE COMMITTEEDuring the year the Committee discussed the following items:
FEB AUGUST DEC
Executive Directors’ remuneration •Salary for senior management and the determination of the annual incentive payments for 2017
•
The TSR and EPS performance results for the 2015 to 2017 share plan award cycles
•
The 2018 annual incentive targets and performance measures
•
Share plan awards for 2018 to 2020 and TSR and EPS performance criteria
•
The review of the Directors’ Remuneration report to ensure compliance with Remuneration Reporting Regulations
•
The annual Committee evaluation •Amendments to Share plan rules to comply with EU General Data Protection regulation
•
Timetable for review of Directors Remuneration Policy
•
2018 AGM update and Corporate Governance bodies' voting recommendations
•
Review of market trends in remuneration •Remuneration proposals or departure terms for senior employees
• •
Updates on Corporate Governance developments •Timetable for review of Directors' Remuneration Report •Outcomes from shareholder consultation •The annual Committee agenda schedule •
ADVISORSTo ensure that the Group’s remuneration practices drive and support achievement of strategies and are market competitive, the Committee obtains advice from various independent sources.
In 2018, the Committee received advice from Deloitte LLP (‘Deloitte’), who they appointed in 2015 for their particular expertise both at a local and global level, due to the worldwide operations of the Group and, following review, the Committee remains satisfied that their advice is objective and independent. Deloitte provided no other services to the Company during the year under review.
Deloitte are members of the Remuneration Consultants Group and adhere to the Voluntary Code of Conduct in relation to executive remuneration consulting in the UK.
The fees paid to Deloitte in the year were £66,597. The charges for services are calculated on the basis of time spent and the seniority of the personnel performing the work at their respective rates.
EXTERNAL APPOINTMENTSThe Company recognises that, during their employment with the Company, Executive Directors may be invited to become Non-Executive Directors of other companies and that such duties can broaden their experience and knowledge. Executive Directors may, with the written consent of the Company, accept such appointments outside the Company, and the policy is that any fees may be retained by the Director.
André LacroixAndré was the Senior Independent Non-Executive Director at Reckitt Benckiser Group plc for which his earnings from 1 January to 31 December 2018 were £142,000 which he retained. André retired as a Non-Executive Director of Reckitt Benckiser Group plc on 31 December 2018.
STATEMENT OF SHAREHOLDER VOTINGAt the 2018 AGM, a resolution was proposed to shareholders to approve the Directors’ Remuneration Report for the year ended 31 December 2017. This resolution received the following votes from shareholders:
VOTES %
In favour 112,789,998 85.38Against 19,312,605 14.62Total 132,102,603 81.851
Withheld 415,015
1. Percentage of total issued share capital voted.
At the 2016 AGM, a resolution was proposed to shareholders to approve the Remuneration Policy. This resolution received the following votes from shareholders:
Remuneration Policy:
VOTES %
In favour 116,806,831 96.38Against 4,383,570 3.62Total 121,190,401 75.091.
Withheld 1,386,204
1. Percentage of total issued share capital voted.
Intertek Group plc Annual Report and Accounts 2018 97
Directors' Report

The following sections on pages 98 to 103 have been audited.
DIRECTORS’ REMUNERATION EARNED IN 2018The table below summarises Directors’ remuneration received for 2018 and the prior year for comparison.
Executive Directors
Basesalary
or fees£’000
Benefits1
£’000
BIK arisingfrom
performanceof duties
£'000Pension
£’000
Annualincentive2
£'000
Long-termincentives
£’000Total
£'000Other £'000
Total including
otherawards
£’000
André Lacroix 2018 945 117 8 284 1,434 3,4383 6,226 – 6,226 2017 927 104 – 278 1,862 4,1704 7,341 4,0765 11,417Edward Leigh 20186 302 21 7 61 456 9903 1,837 – 1,837 2017 414 27 – 83 832 1,4494 2,805 – 2,805Ross McCluskey 20187 172 10 1 9 260 493 501 – 501
1. Benefits include allowances in lieu of company car, annual medicals, life assurance and private medical insurance, and the use of a car and driver for the CEO (£55,279).2. This relates to the payment of the annual incentive and Deferred Share Award for the financial year end. Further details of this payment are set out on the
following pages.3. This relates to the vesting of the 2016 LTIP award. The value shown is based on the share price of £46.42 which was the average mid-market share price in the fourth
quarter of 2018. Further details on performance are set out on page 100.4. This figure has been updated to show the actual value of the vested LTIP share awards based on the share price of £48.50 the share price at vesting as the 2017 Report
included figures based on the share price for the final quarter of 2017 (£52.01).5. This relates to the vesting of the second and final tranche of the awards granted on joining to buy out André’s share awards with his previous employer. This tranche
vested in May 2017 at a vesting price of £42.95 which represented an increase in our Company share price over the two years of over 53%. These awards were one-off awards and are not part of his ongoing remuneration.
6. This relates to the period from 1 January 2018 to 22 August 2018 when Edward Leigh ceased to be a Director.7. This relates to the period from 22 August 2018 when Ross McCluskey was appointed as a Director.
Non-Executive Directors
Basesalary
or fees£’000
Benefits1
£’000
BIK arisingfrom
performanceof duties
£'000 2Total
£'000
Sir David Reid 2018 320 25 7 352 2017 320 25 6 351Graham Allan 2018 87 – – 87
20173 17 – – 17Gurnek Bains 2018 75 – – 75
20174 25 – – 25Dame Louise Makin 2018 75 – – 75
2017 68 – – 68Andrew Martin 2018 90 – – 90
2017 78 – – 78Gill Rider 2018 76 – 1 77
2017 73 – – 73Jean-Michel Valette 2018 71 – 4 75
20174 29 – 2 31Lena Wilson 2018 75 – 11 86
2017 68 – 3 71
1. With respect to the Non-Executive Directors, other than Sir David Reid who receives a car allowance of £25,000 per annum, no other benefits are provided.2. Certain expenses relating to the performance of a Director’s duties (not included in the Benefits column above) such as travel to and from Company meetings and related
accommodation have been classified as taxable. In such cases, the Company will ensure that the Director is not out of pocket by settling the related tax via the PSA. In line with current regulations, these taxable benefits have been disclosed and are shown in the BIK arising from performance of duties column. The figures shown are the cost of the taxable benefit.
3. The 2017 fees for Graham Allan, relate to the period from 1 October 2017, the date he was appointed to the Board.4. The 2017 fees for Gurnek Bains and Jean-Michel Valette relate to the period from 1 July 2017, the date they were appointed to the Board.
Intertek Group plc Annual Report and Accounts 201898
Directors' Report | Corporate Governance
REMUNERATION REPORTcontinued
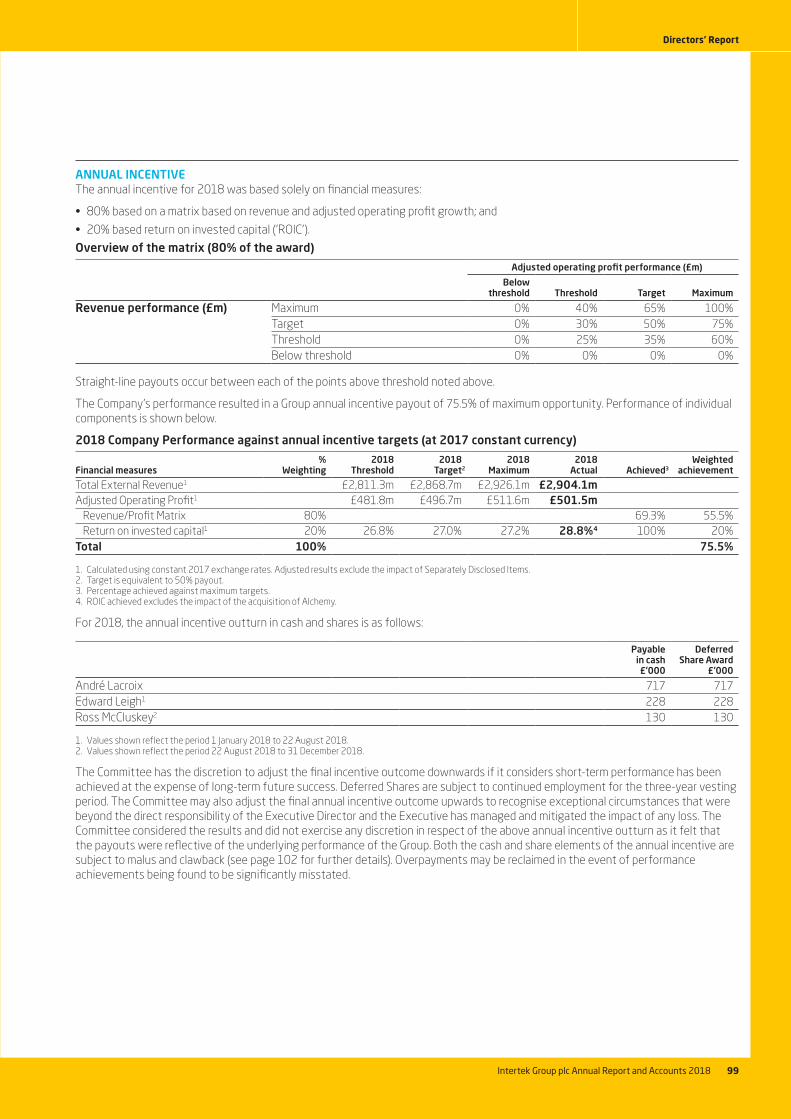
ANNUAL INCENTIVEThe annual incentive for 2018 was based solely on financial measures:
• 80% based on a matrix based on revenue and adjusted operating profit growth; and
• 20% based return on invested capital ('ROIC').
Overview of the matrix (80% of the award)
Adjusted operating profit performance (£m)
Belowthreshold Threshold Target Maximum
Revenue performance (£m) Maximum 0% 40% 65% 100%Target 0% 30% 50% 75%Threshold 0% 25% 35% 60%Below threshold 0% 0% 0% 0%
Straight-line payouts occur between each of the points above threshold noted above.
The Company’s performance resulted in a Group annual incentive payout of 75.5% of maximum opportunity. Performance of individual components is shown below.
2018 Company Performance against annual incentive targets (at 2017 constant currency)
Financial measures%
Weighting2018
Threshold2018
Target22018
Maximum2018
Actual Achieved3Weighted
achievement
Total External Revenue1 £2,811.3m £2,868.7m £2,926.1m £2,904.1mAdjusted Operating Profit1 £481.8m £496.7m £511.6m £501.5m
Revenue/Profit Matrix 80% 69.3% 55.5%Return on invested capital1 20% 26.8% 27.0% 27.2% 28.8%4 100% 20%
Total 100% 75.5%
1. Calculated using constant 2017 exchange rates. Adjusted results exclude the impact of Separately Disclosed Items.2. Target is equivalent to 50% payout.3. Percentage achieved against maximum targets.4. ROIC achieved excludes the impact of the acquisition of Alchemy.
For 2018, the annual incentive outturn in cash and shares is as follows:
Payablein cash£’000
DeferredShare Award
£’000
André Lacroix 717 717Edward Leigh1 228 228Ross McCluskey2 130 130
1. Values shown reflect the period 1 January 2018 to 22 August 2018.2. Values shown reflect the period 22 August 2018 to 31 December 2018.
The Committee has the discretion to adjust the final incentive outcome downwards if it considers short-term performance has been achieved at the expense of long-term future success. Deferred Shares are subject to continued employment for the three-year vesting period. The Committee may also adjust the final annual incentive outcome upwards to recognise exceptional circumstances that were beyond the direct responsibility of the Executive Director and the Executive has managed and mitigated the impact of any loss. The Committee considered the results and did not exercise any discretion in respect of the above annual incentive outturn as it felt that the payouts were reflective of the underlying performance of the Group. Both the cash and share elements of the annual incentive are subject to malus and clawback (see page 102 for further details). Overpayments may be reclaimed in the event of performance achievements being found to be significantly misstated.
Intertek Group plc Annual Report and Accounts 2018 99
Directors' Report

VESTING OF LTIP SHARE AWARDSThe LTIP Share Awards granted in 2016 are subject to performance for the three-year period ended 31 December 2018. The performance conditions attached to this award and actual performance against these conditions are as follows:
Metric Performance conditionThreshold
targetStretchtarget
Actualperformance
Vestinglevel
Earnings Per Share Annualised fully diluted, adjusted EPS growth, calculated on the basis of foreign exchange rates adopted at the start of the performance targets
4% 10% 9.73% 96.63%
Total Shareholder Return Relative TSR performance against the FTSE 31 to 130 (excluding banks and investment trusts)
Median Upperquartile
At or above upper
quartile1
100.00%
Total vesting 98.32%
1. TSR performance calculation was calculated by Deloitte; Intertek was ranked 12th of the 90 members of the comparator group of companies.
The LTIP Share Awards granted in 2016 to the Executive Directors were as follows:
Executive Director
Number ofshares at
grant
Number ofshares based
on accrueddividends
Total numberof shares1
Number ofshares
to lapse
Number ofsharesto vest
Value ofvestedshares£’0001
André Lacroix 71,9822 3,341 75,323 (1,266) 74,057 3,438Edward Leigh 25,7362 1,157 26,893 (5,567)3 21,326 990Ross McCluskey 3,1174 108 3,225 (55) 3,170 147Total vesting 100,835 4,606 105,441 (6,888) 98,553 4,575
1. The value shown is based on the share price of £46.42 which is based on the average mid-market share price in the fourth quarter of 2018.2. Due to vest in March 2019.3. This figure includes the 5,005 share awards and the 197 dividend share awards which lapsed as a result of pro-ration to 22 August 2018, the date of Edward Leigh's
departure.4. Due to vest in September 2019.
The Committee considered the LTIP outturns in the context of the underlying financial performance of the Group and determined it was appropriate not to exercise its discretion, as the business performance merited the award.
LTIP SHARE AWARDS GRANTED DURING THE YEARThe following LTIP Share Awards were granted to the Executive Directors on 21 March 2018:
Executive DirectorType of
award
Basis ofaward
granted
Share priceat date
of grant£
Number ofshares over
which awardwas granted
Face valueof award
£’000
% of facevalue that
would vest atthreshold
performance
Vestingdetermined
byperformance
over
André Lacroix LTIP ShareAward
250% ofsalary
49.49 47,037 2,328 25% Threeyears to
31 December2020
Edward Leigh LTIP Share Award
200% ofsalary
49.49 19,195 950 25%
Ross McCluskey LTIP ShareAward
50% ofsalary
49.49 2,244 111 25%
The LTIP Share Awards granted in 2018 are conditional share awards subject to performance for the three-year period ending 31 December 2020. This note relates to performance shares only; details of Deferred Shares granted in 2018 are set out in the table opposite (Share Plan Awards).
The performance conditions attached to this award and the targets are as follows:
Metric Performance conditionThreshold
targetStretchtarget
Earnings Per Share (50%) Annualised fully diluted, adjusted EPS growth, calculated on the basis of foreign exchange rates adopted at the start of the performance targets
4% 10%
Total Shareholder Return (50%) Relative TSR performance against the FTSE 31 to 130 (excluding banks and investment trusts)
Median UpperQuartile
Intertek Group plc Annual Report and Accounts 2018100
Directors' Report | Corporate Governance
REMUNERATION REPORTcontinued

SHARE PLAN AWARDSThe table below shows the Directors’ interests in the Intertek Share Plans, all of which are restricted stock units (‘RSUs’):
Type of Award
31 December2017
Numberof shares
Grantedin 2018
Number ofshares
Awardprice1
£
Dividendaccruedin 20182
Vestedin 2018Number
of shares
Lapsedin 2018Number
of shares
31 December2018
Numberof shares
Date ofvesting
André Lacroix2015 LTIP Share4,5 90,440 – 24.74 – (82,182) (8,258) – Sep 2018
Dividend 3,411 – – 761 (3,791) (381) –2016 LTIP Share4,6 71,982 31.084 – – – 71,982 Mar 2019
Dividend 2,226 – – 1,115 – – 3,341Deferred Share6
17,376 – 31.084 – – – 17,376 Mar 2019
Dividend 536 – – 268 – – 8042017 LTIP Share4,8 58,636 – 38.922 – – – 58,636 Mar 2020
Dividend 846 – – 907 – – 1,753Deferred Share8
16,474 – 38.922 – – – 16,474 Mar 2020
Dividend 237 – – 254 – – 4912018 LTIP Share4,9 47,037 49.49 47,037 Mar 2021
Dividend 728 728Deferred Share9
18,815 49.49 18,815 Mar 2021
Dividend 291 291Total 262,164 65,852 4,324 (85,973) (8,639) 237,728
Type of Award
31 December2017
Numberof shares
Grantedin 2018
Number ofshares
Awardprice1
£
Dividendaccruedin 20182
Vestedin 2018Number
of shares
Lapsedin 2018Number
of shares
31 December2018
Numberof shares
Date ofvesting
Edward Leigh 2015 LTIP Share4,5 32,336 – 24.74 – (28,566) (3,770) – Sep 2018
Dividend 1,217 – – 272 (1,315) (174) –Deferred Share3
5,405 – 25.572 – (5,405) – – Mar 2018
Dividend 272 – – – (272) – –2016 LTIP Share4,6 25,736 – 31.084 – – (5,005) 20,731 Mar 2019
Dividend 795 – – 362 – (197) 960Deferred Share6
12,425 – 31.084 – – – 12,425 Mar 2019
Dividend 383 – – 191 – – 5742017 LTIP Share4,8 20,965 – 38.922 – – (11,065) 9,900 Mar 2020
Dividend 302 – – 246 – (253) 295Deferred Share8
7,362 – 38.922 – – – 7,362 Mar 2020
Dividend 106 – – 113 – – 2192018 LTIP Share4,9 – 19,195 49.49 – – (16,530) 2,665 Mar 2021
Dividend – – – 179 – (139) 40Deferred9 Share
– 8,408 49.49 – – – 8,408 Mar 2021
Dividend – – – 129 – – 129Total 107,304 27,603 1,492 (35,558) (37,133) 63,708
Intertek Group plc Annual Report and Accounts 2018 101
Directors' Report

SHARE PLAN AWARDS (CONTINUED)
Type of Award
31 December2017
Numberof shares
Grantedin 2018
Number ofshares
Awardprice1
£
Dividendaccruedin 20182
Vestedin 2018Number
of shares
Lapsedin 2018Number
of shares
31 December2018
Numberof shares
Date ofvesting
Ross McCluskey 2016 LTIP Share4 3,117 – 35.288 – – – 3,117 Sep 2019
Dividend 60 – – 48 – – 108DSP-Deferred Shares7
3,000 – 35.288 – (3,000) – – Sep 2018
Dividend 58 – – 25 (83) – –2017 LTIP Share4,8 2,826 – 38.922 – – – 2,826 Mar 2020
Dividend 40 – – 42 – – 82Deferred Share8
715 – 38.922 – – – 715 Mar 2020
Dividend 10 – – 11 – – 212018 LTIP Share4,9 – 2,244 49.49 – – – 2,244 Mar 2021
Dividend – – – 33 – – 33Deferred Share9
– 2,244 49.49 – – – 2,244 Mar 2021
Dividend – – – 33 – – 33Total 9,826 4,488 192 (3,083) – 11,423
1. Awards made are based on a share price obtained by averaging the closing share prices for the five dealing days before the date of grant.2. The dividend shares are accrued on the date the dividend is paid and determined using the closing market price of the shares on that date. The dividend accruals relate
to Share Awards made in lieu of not receiving cash dividends during the vesting period.3. Awards vested on 9 March 2018 on which date the market price of shares was £50.01 having been granted on 9 March 2015 on which date the closing market price
was £25.70.4. 50% of the LTIP Share Awards are subject to EPS and 50% are subject to relative TSR. The EPS threshold level was set at 4% per annum and the upper target at
10% per annum. Under the TSR condition, the Company’s TSR ranking is measured relative to the FTSE index members 31 to 130 (excluding banks and investment trusts).5. LTIP awards vested on 24 September 2018, subject to performance and continued employment, having been granted on 22 September 2015 on which date the closing
market price was £23.94 and 90.87% of the awards vested.6. Awards will vest on 21 March 2019, subject to continued employment or good leaver status, having been granted on 21 March 2016 on which date the closing market
price was £31.13. Awards were made at a share price of £31.084 being the share price obtained by averaging the closing share prices for the five dealing days before the date of grant.
7. Award vested on 5 September 2018 on which date the market price of shares was £50.56 having been granted on 5 September 2016 on which date the closing market price was £35.53.
8. Awards will vest on 20 March 2020, subject to continued employment or good leaver status, having been granted on 20 March 2017 on which date the closing market price was £39.17. Awards were made on a share price of £38.922 being the share price obtained by averaging the closing share prices for the five dealing days before the date of grant.
9. Awards will vest on 21 March 2021, subject to continued employment or good leaver status, having been granted on 21 March 2018 on which date the closing market price was £49.55. Awards were made on a share price of £49.49 being the share price obtained by averaging the closing share prices for the five dealing days before the date of grant.
MALUS AND CLAWBACKMalus and clawback will operate, in respect of the 2011 Long Term Incentive Plan, in circumstances where there is reasonable evidence of misbehaviour or material error, conduct considered gross misconduct, breach of any restrictive covenants by participants, conduct which resulted in (a) significant loss(es) to the Company, failure to meet appropriate standards of fitness and propriety; a material failure of management in the Company, a discovery of a material misstatement in the audited consolidated accounts or the behaviour of a Director has a significant detrimental impact on the reputation of the Group. Clawback can be applied at any time during the clawback period which is six years from the date of the award unless extended by the Remuneration Committee prior to the expiry of the initial clawback period.
The Committee has the discretion to reduce annual incentive payments if it believes that short-term performance has been achieved at the expense of the Group’s long-term future or vice versa. The Committee also retains the discretion to reduce or reclaim payments if the performance achievements are subsequently found to have been significantly misstated.
Intertek Group plc Annual Report and Accounts 2018102
Directors' Report | Corporate Governance
REMUNERATION REPORTcontinued

DIRECTORS’ INTERESTS IN ORDINARY SHARESThe interests of the Directors in the shares of the Company as at the year end, or date of ceasing to be a Director, are set out below. Save as stated in this report, during the course of the year, no Director or any member of his or her immediate family have any other interest in the ordinary share capital of the Company or any of its subsidiaries. None of the Non-Executive Directors has share options or share awards.
Beneficiallyowned at
31 December2017 or on
appointment
Beneficiallyowned at
31 December2018 or onceasing to
be a Director1
OutstandingLTIP Share
Awards2
OutstandingDeferred
Shares3
Shareholdingas a % of
salary4
ShareholdingGuideline
met
André Lacroix5 299,788 345,353 183,477 54,251 1,745.34 Yes
Edward Leigh6 4,271 7,279 34,591 29,117 73.56 NoRoss McCluskey7 185 1,813 8,410 3,013 38.40 NoSir David Reid 5,919 6,244 – – n/a n/aGraham Allan – 110 – – n/a n/aGurnek Bains – 112 – – n/a n/aDame Louise Makin 852 956 – – n/a n/aAndrew Martin 137 251 – – n/a n/aGill Rider 395 509 – – n/a n/aJean-Michel Valette 10,000 10,112 – – n/a n/aLena Wilson 836 940 – – n/a n/a
1. No changes in the above Directors’ interests have taken place between 31 December 2018 and the date of this report.2. Subject to performance conditions.3. Subject to continued employment or good leaver status.4. Based on a share price of £48.00 as at 31 December 2018 being the last trading day and applied to the annual salary for 2018.5. Appointed 16 May 2015 with the guideline to hold 200% of base salary in shares by 16 May 2020, which has been exceeded.6. Guideline to hold 200% of base salary in shares by May 2021. Edward Leigh ceased to be a Director on 22 August 2018.7. Joined Intertek in August 2016 with the guideline to hold 35% of base salary in shares by August 2021. This guideline was increased on his appointment
to Chief Financial Officer on 22 August 2018 to 200% to be achieved by August 2023.
PAYMENTS TO PAST DIRECTORSNo payments were made to past directors during the year ended 31 December 2018.
PAYMENTS FOR LOSS OF OFFICENo payments were made in respect of loss of office during the year ended 31 December 2018, however a payment of £3,810 will be paid to Edward Leigh for loss of office when his employment terminates.
ARRANGEMENTS FOR EDWARD LEIGHAs set out on stepping down from the Board, Edward Leigh ceased to be a director of the Company with effect from 22 August 2018. Edward was paid in respect of accrued salary and contractual benefits up to and including the 22 August 2018. He remains an employee of the Company potentially until 21 August 2019 and during the period of continued employment, he will be paid his salary and contractual benefits (other than car allowance) in accordance with his Service Agreement. If Edward serves notice on the Company terminating his employment before 21 August 2019 he will be paid, within 30 days of the Termination Date, an amount equal to his basic salary and a sum in lieu of pension contributions for the period from the termination of his employment up to 21 August 2019.
The annual incentive payable to Edward for 2018 has been pro-rated for the period to 22 August 2018 to reflect Edward’s time as a Director during the financial year. This incentive has been determined based on performance achieved, in line with our Executive Directors, as set out on page 99. 50% of the incentive will be paid in cash in March 2019, and 50% will be deferred into shares (which will vest after a period of three years). Edward is being treated as a good leaver in respect of his existing deferred share awards, which will, accordingly, vest on their original vesting dates. All deferred share awards are subject to malus and clawback provisions.
As set out in the Chair's letter, Edward is being treated as a good leaver in respect of his unvested LTIP share awards under the Long Term Incentive Plan. The awards will vest on their original vesting dates, subject to the satisfaction of the original performance conditions and will be pro-rated up to 22 August 2018. All LTIP awards will continue to be subject to malus and clawback provisions. 32,336 LTIP share awards were due to vest to Edward on 22 September 2018 but following the application of pro-ration and performance criteria 29,881 shares vested at a share price of £48.50 giving a total value of £1,449,228. With regards to other outstanding LTIP awards, Edward has the following outstanding awards (which have been pro-rated for time): 2017 = 9,900; 2018 = 2,665. These awards will vest at the normal time subject to performance.
The Company made a payment to Edward Leigh’s legal advisers of £1,000 plus VAT to cover legal fees.
Intertek Group plc Annual Report and Accounts 2018 103
Directors' Report

PERCENTAGE CHANGE IN REMUNERATION LEVELSThe table below shows the average movement in salary and annual incentive for UK employees between the 2017 and 2018 financial year ends.
Salary Incentive Benefits
CEO (A Lacroix1) 2.0% 45.2% 25.3%Average pay based on Intertek’s UK employees2 5.5% 50.9% 7.0%
1. The percentage change for incentive and benefits for André Lacroix are based on actual amounts earned in 2017 and 2018. 2. The Intertek UK employee group has been selected as the most appropriate comparator group, due to the diverse nature of the Group’s global employee population.
CEO PAY RATIOFor accounting periods starting on or after 1 January 2019, UK companies have to report on pay ratio information in relation to the total remuneration of the Director undertaking the role of Chief Executive Officer. To meet the spirit of the legislation, Intertek has decided to voluntarily report one year early the required data, comparing the CEO’s total remuneration against that of all of its UK employees. The table below shows the required information.
Year Method
25thpercentile
pay ratioMedian
pay ratio
75th percentile
pay ratio
2018 Option B 262:1 189:1 123:1
In terms of reporting options, the Company chose option B, using the most recent gender pay gap information to determine the relevant employees at the 25th, 50th and 75th percentile to compare to CEO pay, as that data was already available and is used for other reporting purposes. It refers to gender pay data as of 1 April 2018.
With regards to representativeness of the ratios, Intertek is a very diverse employer and has employees in many UK locations. Our employees have many different qualifications and are working in and serving almost all major industries. As a consequence, it is unlikely that there is any one single individual whose pay and benefits is representative of Intertek UK as a whole. Intertek have therefore also looked at the total pay of the individuals immediately above and below the 25th, 50th and 75th percentile. Looking at the spread of resulting ratios, it was decided that the “best equivalent” would be the arithmetic mean of the total pay of three individuals around each reporting point:
• For the three employees around the 25th percentile: Ratios ranged from 239:1 to 280:1, with an arithmetic mean of 262:1.
• For the three employees around the 50th percentile: Ratios ranged from 165:1 to 210:1, with an arithmetic mean of 189:1.
• For the three employees around the 75th percentile: Ratios ranged from 110:1 to 143:1, with an arithmetic mean of 123:1.
When calculating total pay and rewards, no pay components were omitted. The Company used the calculation methodology as set out in the relevant regulations (The Companies (Miscellaneous Reporting) Regulations 2018). For part-time employees their relevant pay and benefit components have been adjusted to the equivalent full-time figure for the relevant business. Full-time equivalent hours can vary across locations and legal entities.
RELATIVE IMPORTANCE OF THE SPEND ON PAYThe table below shows the movement in spend on staff costs between the 2017 and 2018 financial years, compared to dividends.
2018£m
2017£m % change
Staff costs1 1,239.0 1,220.8 1.5%Dividends 128.3 107.0 19.9%
1. Staff costs are shown at actual rates. At constant currency, staff costs increased by 4.9%, reflecting a 3.4% foreign exchange impact.
Intertek Group plc Annual Report and Accounts 2018104
Directors' Report | Corporate Governance
REMUNERATION REPORTcontinued

PERFORMANCE GRAPHConsistent with prior years, the graph below shows the TSR in respect of the Company over the last 10 financial years, compared with the TSR for the full FTSE 100 Index. The FTSE 100 is selected as the comparator group as it is a good representation of peer group companies and Intertek is a constituent of the FTSE 100. TSR, reflecting the change in the value of a share and dividends paid, can be represented by the value of a notional £100 invested at the beginning of a period and its change over that period.
TSR PERFORMANCE
Intertek Group
FTSE 100
600
800
700
500
400
300
200
100
0
2008 2009 2010 2012 2014 2015 2018201720162011 2013
£
CEO TOTAL REMUNERATIONThe total remuneration figures for the CEO during each of the past 10 financial years are shown in the table below. Consistent with the calculation methodology for the single figure for total remuneration, the total remuneration figure includes the total annual incentive and Deferred Share Award based on that year’s performance and LTIP Share Awards based on the three-year performance period ending in the relevant year. The annual incentive payout and LTIP award vesting level as a percentage of the maximum opportunity are also shown for each of these years.
Year ended 31 December
2009 2010 2011 2012 2013 2014W Hauser
2015A Lacroix
2015 2016 2017 2018
Total remuneration £’000 2,451 3,164 4,554 5,298 3,195 2,011 876 1,824 5,4521 11,4171 6,223Annual incentive (%) 100.0 96.6 92.3 83.1 34.6 38.4 90.6 96.6 70.24 100.0 75.5LTIP award vesting (%) 100.0 100.0 100.0 100.0 81.8 25.2 – – – 90.87 98.32
1. As reported in previous years, at the time of joining, the Company had bought out André’s existing share awards with his previous employer in two tranches of 91,575 and 91,574 shares vesting in 2016 and 2017 each at an award price of £28. The tranche that vested in 2017 vested at a share price of £42.95 which represents an increase in our Company share price over the two years of over 53%. These awards were one-off awards and are not part of his ongoing remuneration.
Intertek Group plc Annual Report and Accounts 2018 105
Directors' Report

CEO TOTAL REMUNERATIONThe graph below shows the total remuneration of the Intertek CEO over the 10 year period from 2009 to 2018.
CEO TOTAL REMUNERATION FIGURE
20112009 2010 2012 2013 2014 2015 (WH)1 2015 (AL)2 20172016 2018
0
2,000
4,000
6,000
8,000
10,000
12,000
£’000
Annual incentiveLTIP (share price increase)4
LTIP (award share price)3 Benefits
Mirror awards5
Pension
Salary
1. Shows W Hauser remuneration based on period to 15 May 2015.2. Shows A Lacroix remuneration for the period from appointment as CEO on 16 May 2015.3. LTIP (award share price) shows the proportion of the LTIP value received which resulted from the share price on the award date.4. LTIP (share price increase) shows the proportion of the LTIP value received which resulted from increase in the share price over the vesting period.5. Mirror Awards – as reported in previous years, at the time of joining, the Company had bought out André’s existing share awards with his previous employer in two
tranches of 91,575 and 91,574 shares vesting in 2016 and 2017 each at an award price of £28. The tranche that vested in 2017 vested at a share price of £42.95 which represents an increase in our Company share price over the two years of over 53%. These awards were one-off awards and are not part of his ongoing remuneration.
REMUNERATION DECISIONS TAKEN IN RESPECT OF THE FINANCIAL YEAR ENDING 31 DECEMBER 2019Base salaryFollowing a review of base salaries, the Remuneration Committee approved a salary increase of 2.0% for the CEO. This is in line with the increase provided to UK employees in the Group. No change is proposed to the CFO's salary, given his appointment in August 2018.
The Executive Directors’ salaries are:
Base salaryfrom
1 April 2018 £’000
Base salaryfrom
1 April 2019 £’000 % increase
André Lacroix 950 969 2.0%Ross McCluskey 4751 475 0.0%
1. Salary on appointment.
Annual incentive and LTIP awards to be granted in 2019For 2019, the annual incentive opportunity expressed as a percentage of base salary will be 200% for the CEO and CFO. The Committee has determined that for 2019 the basis for calculating the annual incentive will be unchanged from the previous year – 80% will be based on a matrix based on revenue and adjusted operating profit growth, and 20% will be based on ROIC.
Annual incentive will continue to be subject to a quality of earnings review at the end of the year to ensure that payouts are appropriate based on the underlying performance of the Group and to ensure that any awards are commensurate with the Group’s culture and values.
The Committee has chosen not to disclose, in advance, the performance targets for the forthcoming year as these include items which the Committee considers commercially sensitive. In accordance with good governance, the Committee is however committed to providing insightful and transparent disclosure to our shareholders. In this regard, the Committee will disclose the performance targets for the annual incentive in the following year.
Intertek Group plc Annual Report and Accounts 2018106
Directors' Report | Corporate Governance
REMUNERATION REPORTcontinued

For 2019, the LTIP opportunity for the CEO and CFO will be 250% and 200% of salary respectively with targets based on the Group Remuneration Policy and decisions taken by the Committee as below:
Metric Performance conditionThreshold
targetStretchtarget
Earnings Per Share (50%) Annualised fully diluted, adjusted EPS growth calculated on the basis of foreign exchange rates adopted at the start of the performance cycle
4% 10%
Total Shareholder Return (50%) Relative TSR performance against the FTSE index members 31 to 130 (excluding banks and investment trusts)
Median Upperquartile
NON-EXECUTIVE DIRECTORS’ FEES As detailed in the Remuneration Policy, fees for the Non-Executive Directors are determined by the Board, based on the responsibility and time committed to the Group’s affairs and appropriate market comparisons. Individual Non-Executive Directors do not take part in discussions regarding their own fees. Following a review of Non-Executive Directors fees in 2017, minor changes were implemented as set out in the table below:
To 31 March2018
£’000
From 1 April2018
£’00020191
£'000
Board membership Chairman 320 320 320Non-Executive Director 58 62 62Senior Independent Non-Executive Director 12 12 12Committee membershipChair Audit Committee 20 20 20Chair Remuneration Committee 15 15 15Chair Nomination Committee – – –Member Audit Committee 10 10 10Member Remuneration Committee 7.5 10 10
Member Nomination Committee 2.5 5 5
1. Increase took effect from 1 April 2019.
Pursuant to the policy of aligning Directors’ interests with those of shareholders, £10,000 of the fees paid to the Non-Executive Directors and £30,000 of the fees paid to the Chairman are used each year to purchase shares in the Company.
APPROVAL OF THE DIRECTORS’ REMUNERATION REPORTThe Directors’ Remuneration Report, including the Remuneration Policy Annual Report on Remuneration, was approved by the Board on 4 March 2019.
Gill RiderChair of the Remuneration Committee
Intertek Group plc Annual Report and Accounts 2018 107
Directors' Report

AUGUST
• Half Year Results 2018
• London, Edinburgh, New York, Montreal, Boston, Chicago - Interim Results Roadshows
• Stockholm Roadshow
• Helsinki Roadshow
OCTOBER
• Berenberg London Testing, Inspection & Certification (TIC) Conference
• Dublin Roadshow
• Zurich Roadshow
• Geneva Roadshow
• Frankfurt Roadshow
• Munich Roadshow
• Milan Roadshow
DECEMBER
• Credit Suisse San Francisco 8th Annual European Business Services Conference
• Denver Roadshow
• Chicago roadshow
JANUARY
• Oddo BHF Lyon stock-picker Conference
• Denmark and Finland Roadshow
MAY
• Trading Statement
SEPTEMBER
• Bernstein London Strategic Decisions Conference
• UBS London Business Services, Leisure and Transport Conference
• Kepler Cheuvreux Paris Autumn Conference
NOVEMBER
• Trading Statement
• Paris Roadshow
MARCH
• Full Year Results 2017
• London, Edinburgh, Toronto, New York – Annual Results Roadshow
JUNE
• Goldman Sachs London European Business Services, Transport & Leisure Conference
The Board recognises its responsibility to take account of the interests of stakeholders as outlined in section 172 of the Companies Act 2006.
Our Sustainability report on pages 22 to 43 sets out our sustainability priorities, our commitment and engagement with our people, the environment and wider communities.
Details of our significant shareholders are disclosed on page 111.
APPROACH TO INVESTOR RELATIONSThe Board is committed to maintaining an active and open dialogue with shareholders and sees this as an important part of the governance process. The Board retains overall responsibility for shareholder engagement. This is discharged through the Chairman, supported by the Executive Directors and the Group Company Secretary, who is responsible for ensuring Intertek has regular and effective communication with its investors. Throughout the year, the Chairman, Non-Executive Directors and Executive Directors are available to meet with institutional shareholders.
Intertek has a comprehensive annual Investor Relations programme, aimed at helping existing and potential investors understand the Group’s business model, strategy, financial performance and outlook.
This function is managed by the Investor Relations team in London and includes a wide-ranging programme of events and roadshows throughout the year to update investors and sell-side analysts on the developments of the Group.
INVESTOR RELATIONS PROGRAMMEInvestor Materials The primary form of communication with institutional investors is through our Annual Report, full-year and half-year results updates and Trading Statements. These materials are available on the investor webpages, which include a wealth of information that may be of interest to shareholders and investors and is supplemented by videos, webcasts and presentations.
Investor Conferences Throughout the year, the Executive Directors and the Investor Relations team attended industry conferences which provide an opportunity to meet a large number of investors. Some of the conferences attended this year include the Berenberg TIC Conference in London, the Kepler Cheuvreux Autumn Conference in Paris and the Credit Suisse Business Services Conference in San Francisco. A full list of conferences attended is outlined in the calendar below.
Investor RoadshowsFollowing the full-year and half-year results announcements in March and August respectively, the Executive Directors and Investor Relations team carried out meetings with principal shareholders across London, Edinburgh, New York, Boston, Chicago, Montreal and Toronto.
In addition, further roadshows were held and a full list of roadshows held, and attended, is included in the calendar below.
Intertek Group plc Annual Report and Accounts 2018108
Directors' Report | Corporate Governance
SHAREHOLDER ENGAGEMENT
Corporate Governance Roadshow Intertek’s largest shareholders are invited annually to meet with the Chairman to share their views and discuss any corporate governance matters. In 2018, shareholders holding more than 55.10% of the share register collectively were invited to these meetings.
FEEDBACK ON INVESTOR RELATIONS ACTIVITIESThe Executive Directors and Investor Relations team receive regular feedback from sell-side analysts and investors during the year both directly and through the Group’s Corporate Advisers. The Group Company Secretary also receives feedback on governance matters directly from investors and shareholder bodies.
ANNUAL GENERAL MEETING (‘AGM’)The Board welcomes the opportunity to meet with both private and institutional investors at the AGM. The 2018 AGM provided all shareholders with the opportunity to question the Board and Chair of each Board Committee on matters put to the meeting. The results of voting at the AGM are published on the Company’s website.
The 2019 AGM will be held on 23 May 2019 at 9.00 a.m. in the Marlborough Theatre, No. 11 Cavendish Square, London, W1G 0AN. The AGM provides the opportunity for all shareholders to develop their understanding of the Company’s strategy and operations, to ask questions of the full Board on the matters put to the meeting, including the Annual Report and Accounts. All Board members attend the AGM and, in particular, the Chairs of the Audit, Nomination and Remuneration Committees are available to answer questions. The Company proposes a resolution on each separate issue and does not combine resolutions inappropriately. The Notice of the AGM is sent to shareholders by e-communications or by post and is also available at www.intertek.com.
DIVIDEND PAYMENTSDividend payments to shareholders were made twice during 2018. The 2017 final dividend payment was made on 6 June 2018 to all shareholders present on the register as at 18 May 2018. The 2018 interim dividend payment was made on 19 October 2018 to all shareholders on the register as at 5 October 2018.
Intertek Group plc Annual Report and Accounts 2018 109
Directors' ReportShareholder Engagement

In accordance with the requirements of the Companies Act 2006 (‘Act’) and the Disclosure Guidance and Transparency Rules (‘DTR’) of the Financial Conduct Authority (‘FCA’), the following section describes the matters that are required for inclusion in the Directors’ report and were approved by the Board. Further details of matters required to be included in the Directors’ report that are incorporated by reference into this report are set out below.
DIRECTORSThe names of the members of the Board, as at the date of this report, and their biographical details are set out on pages 74 to 75.
ARTICLES OF ASSOCIATIONThe Company’s Articles of Association contain provisions relating to the retirement, election and re-election of Directors but, in accordance with best practice, all Directors who wish to continue to serve will stand for election or re-election at the Annual General Meeting (‘AGM’).
The Articles of Association set out the internal regulation of the Company and cover such matters as the rights of shareholders, the appointment or removal of Directors and the conduct of the Board and general meetings. Copies are available upon request from the Group Company Secretary and are available at the Company’s AGM. Further powers are granted by members in general meeting and those currently in place are set out in detail in the appropriate section of this report.
DIRECTORS’ INDEMNITIESThe Board believes that it is in the best interests of the Group to attract and retain the services of the most able and experienced Directors by offering competitive terms of engagement, including the granting of indemnities on terms consistent with the applicable statutory provisions. In accordance with the Articles of Association, the Company has executed deed polls of indemnity for the benefit of Directors of the Company.
These provisions which are deemed to be qualifying third-party indemnity provisions (as defined by section 234 of the Act), were in force during the financial year ended 31 December 2018, for the benefit of the Directors and, at the date of this report, remain in force in relation to certain losses and liabilities which they may incur (or have incurred) in connection with their duties, powers or office.
DIRECTORS’ INTERESTSOther than the Directors’ service agreements or letters of appointment, none of the Directors of the Company had a personal interest in any business transactions of the Company or its subsidiaries. The terms of the Directors’ service agreements or letters of appointment and the Directors’ interests in shares and share awards of the Company, in respect of which transactions are notifiable to the Company and the FCA under Article 19 of the Market Abuse Regulation, are disclosed in the Remuneration Report on pages 89 to 107.
DIRECTORS’ POWERSThe Directors are responsible for the strategic management of the Company and their powers to do so are determined by the provisions of the Act and the Company’s Articles of Association.
DIVIDENDThe Directors are recommending a final dividend of 67.2p per ordinary share (2017: 47.8p) making a full-year dividend of 99.1p per ordinary share (2017: 71.3p) which will, if approved at the AGM, be paid on 4 June 2019 to shareholders on the register at the close of business on 17 May 2019.
GENERAL MEETINGDuring the year to December 2018, the Directors became aware that the payment of the interim dividend paid on 19 October 2018 (the ‘Relevant Distribution’) totalling £51.4m had been made otherwise than in accordance with the Companies Act 2006 (‘the Act’) because interim accounts had not been filed at Companies House prior to payment. At a General Meeting of the Company’s shareholders held on 16 January 2019, a resolution was passed, the effect of which was to return all potentially affected parties so far as possible in the position in which they were always intended to be had the Relevant Distribution been made in accordance with the procedural requirements of the Act. This constituted a related-party transaction under IAS 24. The Company had at all times sufficient distributable reserves to justify the payment of dividends.
SHARE CAPITALThe issued share capital of the Company and the details of the movements in the Company’s share capital during the year are shown in note 15 to the financial statements.
The holders of ordinary shares are entitled to receive dividends when declared, to receive the Company’s Annual Report and Accounts, to attend and speak at general meetings of the Company, to appoint proxies and exercise voting rights. A waiver of dividend exists in respect of 455,463 shares held by the Intertek Group Employee Share Ownership Trust (‘Trust’) as at 31 December 2018. Details of the shares purchased by the Trust during the year are outlined within note 15 to the financial statements. There are no restrictions on the transfer of ordinary shares in the Company.
The rights attached to shares in the Company are provided by the Articles of Association, which may be amended or replaced by means of a special resolution of the Company in a general meeting. The Directors’ powers are conferred on them by UK legislation and by the Company’s Articles of Association.
No ordinary shares carry any special rights with regard to control of the Company and there are no restrictions on voting rights except that a shareholder has no right to vote in respect of a share unless all sums due in respect of that share are fully paid. There are no arrangements known to the Company by which financial rights carried by any shares in the Company are held by a person other than the holder of the shares, nor are there any arrangements between holders of securities that may result in restrictions on the transfer of securities or on voting rights known to the Company. All issued shares are fully paid.
Shares are admitted to trading on the London Stock Exchange and may be traded through the CREST system.
ALLOTMENT OF SHARESAt the AGM held in 2018, the shareholders generally and unconditionally authorised the Directors to allot relevant
Intertek Group plc Annual Report and Accounts 2018110
Directors' Report | Corporate Governance
OTHER STATUTORY INFORMATION

securities up to approximately two-thirds of the nominal amount of issued share capital.
It is the Directors’ intention to seek renewal of this authority in line with guidance issued by the Investment Association. The resolution will be set out in the Notice of AGM.
At the AGM in 2018 the Directors were also empowered by the shareholders to allot equity securities, up to 5% of the Company’s issued share capital, for cash under section 570 of the Act. It is intended that this authority be renewed, at the forthcoming AGM.
It is the Board’s intention, in line with guidance issued by the Pre-Emption Group, to also propose the renewal of the additional special resolution to allow the Company to allot equity securities up to a further 5% of the Company’s issued share capital. This is applicable when the Board determines a transaction to be an acquisition or other capital investment, as defined by the Pre-Emption Group’s Statement of Principles and is announced contemporaneously with the allotment, or has taken place in the preceding six-month period and is disclosed in the announcement of the allotment.
PURCHASE OF OWN SHARESShareholders also approved the authority for the Company to buy back up to 10% of its own ordinary shares by market purchase until the conclusion of the AGM to be held this year. The Directors will seek to renew this authority for up to 10% of the Company’s issued share capital at the forthcoming AGM. This power will only be exercised if the Directors are satisfied that any purchase will increase the earnings per share of the ordinary share capital in issue after the purchase and accordingly, that the purchase is in the interests of shareholders. The Directors will also give careful consideration to gearing levels of the Company and its general financial position. Any shares purchased in this way may be held in treasury which, the Directors believe, will provide the Company with flexibility in the management of its share capital. Where treasury shares are used to satisfy Share Awards, they will be classed as new issue shares for the purpose of the 10% limit on the number of shares that may be issued over a 10-year period under the relevant share plan rules. The Company currently holds no shares in treasury.
SIGNIFICANT AGREEMENTS – CHANGE OF CONTROL The Company is not a party to significant agreements which take effect, alter or terminate upon a change of control following a takeover bid apart from a number of credit facilities with banks together with certain senior notes issued by the Company. The total amount owing under such credit facilities and senior note agreements as at 31 December 2018 is shown in note 14 to the financial statements. These agreements contain clauses such that, in the event of a change of control, the Company can offer to or must repay all such borrowings together with accrued interest, fees and other sums owing as required by the individual agreements.
The rules of the Company’s incentive plans contain clauses relating to a change of control resulting from a takeover and in such an event awards would vest subject to the satisfaction of any associated performance criteria.
MATERIAL INTERESTS IN SHARESUp to 4 March 2019, being the latest practicable date before the publication of this report, the following disclosures of major holdings of voting rights have been made (and have not been amended or withdrawn) to the Company pursuant to the requirements of Rule 5 of the DTR of the FCA. There have been no changes since the year end.
AT THE DATE OF NOTIFICATION
ShareholderNumber of
voting rights% of voting
rights
BlackRock Inc. 10,473,019 6.49MFS Investment Management 9,547,182 5.92Mawer Investment Management Ltd 8,110,417 5.03Marathon Asset Management LLP 8,037,714 4.98Fiera Capital Corporation 8,485,236 5.26Fundsmith LLP 8,215,293 5.10
EMPLOYMENTInformation about the Group’s employees, employment of disabled persons and employment practices is contained within the Sustainability report on pages 28 to 31. Information on employee share schemes is in note 17 to the financial statements.
GREENHOUSE GAS EMISSIONS (‘GHG’)Information about the Group’s Greenhouse Gas emissions is given in the Sustainability report on pages 34 to 36.
POLITICAL DONATIONSAt the AGM in 2018, shareholders passed a resolution, on a precautionary basis, to authorise the Company to make donations to EU political organisations and to incur EU political expenditure (as such items are defined in the Act) not exceeding £90,000. During the year the Group did not make such political donations (2017: £nil). It is the Company’s policy not, directly or through any subsidiary, to make what are commonly regarded as donations to any political party.
At the forthcoming AGM of the Company, shareholders’ approval will again be sought to authorise the Group to make political donations and/or incur political expenditure (as such terms are defined in section 362 to 379 of the Act). Further information is contained in the Notice of AGM.
BRANCHESThe Company, through various subsidiaries has established branches in a number of different countries in which the business operates. The list of related undertakings is available on pages 158 to 163.
AUDITORThe auditor, PricewaterhouseCoopers LLP, have expressed their willingness to continue in office. Upon the recommendation of the Audit Committee, resolutions to re-appoint them as auditor and to determine their remuneration will be proposed at the forthcoming AGM.
FINANCIAL INSTRUMENTSDetails about the Group’s use of financial instruments are outlined in note 14 to the financial statements.
Intertek Group plc Annual Report and Accounts 2018 111
Directors' ReportOther Statutory Information

ANNUAL GENERAL MEETINGThe Notice of AGM, which is to be held on 23 May 2019, is available for download from the Company’s website at www.intertek.com/investors. The Notice details the business to be conducted at the meeting and includes information concerning the deadlines for submitting proxy forms and in relation to voting rights.
STATEMENT OF DISCLOSURE OF INFORMATION TO AUDITORSThe Directors who held office at the date of approval of this Directors’ report confirm that, so far as they are aware, there is no relevant audit information of which the Company’s auditor is unaware and each Director has taken all the steps that he or she ought to have taken as a Director of the Company to make themselves aware of any relevant audit information and to establish that the Company’s auditor is aware of that information.
ANNUAL REPORT AND ACCOUNTS AND COMPLIANCE WITH LISTING RULE (‘LR’) 9.8.4 RThe Board has prepared a Strategic Report (pages 2 to 65) which provides an overview of the development and performance of the Company’s business during the year ended 31 December 2018 and its position at the end of that year, and which covers likely future developments in the business of the Company and Group.
For the purposes of compliance with DTR 4.1.5 R(2) and DTR 4.1.8 R, the required content of the Management Report can be found in the Strategic Report and this Directors’ Report, including the sections of the Annual Report and Accounts incorporated by reference.
For the purposes of LR 9.8.4C R, the information required to be disclosed by LR 9.8.4 R can be found in the following locations:
TOPIC LOCATION1. Amount of interest capitalised Not applicable2. Any information required
by LR 9.2.18 R (Publication of unaudited financial information)
Not applicable
3. Details of long-term incentive schemes
Directors’ Remuneration Report (pages 89 to 107)
4. Waiver of emoluments by a Director
Not applicable
5. Waiver of future emoluments by a Director
Not applicable
6. Non pre-emptive issues of equity for cash
Not applicable
7. Information required by (6) above for any unlisted major subsidiary undertaking of the Company
Not applicable
8. Company participation in a placing by a listed subsidiary
Not applicable
9. Any contracts of significance Other statutory information (page 111)
10. Any contracts for the provision of services by a controlling shareholder
Not applicable
11. Shareholder waivers of dividends
Other statutory information (page 110)
12. Shareholder waivers of future dividends
Other statutory information (page 110)
13. Agreements with controlling shareholders
Not applicable
Intertek Group plc Annual Report and Accounts 2018112
Directors' Report | Corporate Governance
OTHER STATUTORY INFORMATIONcontinued

STATEMENT OF DIRECTORS’ RESPONSIBILITIES
STATEMENT OF DIRECTORS’ RESPONSIBILITIES IN RESPECT OF THE ANNUAL REPORT AND THE FINANCIAL STATEMENTSThe Directors are responsible for preparing the Annual Report and the financial statements in accordance with applicable law and regulation.
Company law requires the Directors to prepare financial statements for each financial year. Under that law the Directors have prepared the Group financial statements in accordance with International Financial Reporting Standards (IFRSs) as adopted by the European Union and company financial statements in accordance with United Kingdom Generally Accepted Accounting Practice (United Kingdom Accounting Standards, comprising FRS 101 'Reduced Disclosure Framework', and applicable law). Under company law the Directors must not approve the financial statements unless they are satisfied that they give a true and fair view of the state of affairs of the Group and Company and of the profit or loss of the Group and Company for that period. In preparing the financial statements, the Directors are required to:
• select suitable accounting policies and then apply them consistently;
• state whether applicable IFRSs as adopted by the European Union have been followed for the group financial statements and United Kingdom Accounting Standards, comprising FRS 101, have been followed for the company financial statements, subject to any material departures disclosed and explained in the financial statements;
• make judgements and accounting estimates that are reasonable and prudent; and
• prepare the financial statements on the going concern basis unless it is inappropriate to presume that the Group and Company will continue in business.
The Directors are also responsible for safeguarding the assets of the group and company and hence for taking reasonable steps for the prevention and detection of fraud and other irregularities.
The Directors are responsible for keeping adequate accounting records that are sufficient to show and explain the Group and Company's transactions and disclose with reasonable accuracy at any time the financial position of the Group and Company and enable them to ensure that the financial statements and the Directors’ Remuneration Report comply with the Companies Act 2006 and, as regards the Group financial statements, Article 4 of the IAS Regulation.
The Directors are responsible for the maintenance and integrity of the Company’s website. Legislation in the United Kingdom governing the preparation and dissemination of financial statements may differ from legislation in other jurisdictions.
RESPONSIBILITY STATEMENT OF THE DIRECTORS IN RESPECT OF THE ANNUAL FINANCIAL REPORTThe Directors consider that the Annual Report and Accounts, taken as a whole, is fair, balanced and understandable and provides the information necessary for shareholders to assess the Group and Company’s position and performance, business model and strategy.
Each of the Directors, whose names and functions are listed in the Directors' Report confirm that, to the best of their knowledge:
• the Company financial statements, which have been prepared in accordance with United Kingdom Generally Accepted Accounting Practice (United Kingdom Accounting Standards, comprising FRS 101 'Reduced Disclosure Framework', and applicable law), give a true and fair view of the assets, liabilities, financial position and profit of the Company;
• the Group financial statements, which have been prepared in accordance with IFRSs as adopted by the European Union, give a true and fair view of the assets, liabilities, financial position and profit of the Group; and
• the Directors' Report includes a fair review of the development and performance of the business and the position of the Group and Company, together with a description of the principal risks and uncertainties that it faces.
André LacroixChief Executive Officer4 March 2019
Registered Office 33 Cavendish Square London W1G 0PS
Registered Number: 04267576
Intertek Group plc Annual Report and Accounts 2018 113
Directors' Report

IN THIS SECTION
CONTENTSConsolidated income statement 115Consolidated statement of comprehensive income 116C onsolidated statement of financial position 117Consolidated statement of changes in equity 118Consolidated statement of cash flows 119Notes to the financial statements 120Intertek Group plc – Company balance sheet 164Intertek Group plc – Company statement of changes in equity 165Notes to the Company financial statements 166
NOTES TO THE FINANCIAL STATEMENTSNote1 Significant accounting policies 1202 Operating segments and presentation of results 1243 Separately Disclosed Items 1274 Expenses and auditor’s remuneration 1285 Employees 1286 Taxation 1297 Earnings per ordinary share 1328 Property, plant and equipment 1339 Goodwill and other intangible assets 13510 Acquisitions 13911 Trade and other receivables 14112 Trade and other payables 14213 Provisions 14214 Borrowings and financial instruments 14315 Capital and reserves 15016 Employee benefits 15117 Share schemes 15518 Subsequent events 15619 Capital management 15620 Non-controlling interest 15721 Related parties 15722 Contingent liabilities 15723 Principal Group Companies 158
FINANCIAL STATEMENTS
Intertek Group plc Annual Report and Accounts 2018114
Contents

For the year ended 31 December 2018 Notes
Adjusted results
£m
Separately Disclosed
Items* £m
Total2018
£m
Adjusted results
£m
Separately Disclosed
Items* £m
Total2017
£m
Revenue 2 2,801.2 – 2,801.2 2,769.1 – 2,769.1Operating costs (2,319.4) (45.6) (2,365.0) (2,301.4) (45.0) (2,346.4)Group operating profit/(loss) 2 481.8 (45.6) 436.2 467.7 (45.0) 422.7
Finance income 14 1.8 – 1.8 1.2 – 1.2Finance expense 14 (27.1) (6.4) (33.5) (30.1) (0.5) (30.6)Net financing costs (25.3) (6.4) (31.7) (28.9) (0.5) (29.4)
Profit/(loss) before income tax 456.5 (52.0) 404.5 438.8 (45.5) 393.3Income tax expense 6 (112.8) 13.5 (99.3) (107.5) 20.6 (86.9)Profit/(loss) for the year 2 343.7 (38.5) 305.2 331.3 (24.9) 306.4
Attributable to: Equity holders of the Company 322.9 (38.5) 284.4 312.3 (24.9) 287.4 Non-controlling interest 20 20.8 – 20.8 19.0 – 19.0Profit/(loss) for the year 343.7 (38.5) 305.2 331.3 (24.9) 306.4
Earnings per share**Basic 7 176.8p 178.6pDiluted 7 174.7p 176.3p
* See note 3.** Earnings per share on the adjusted results is disclosed in note 7.
CONSOLIDATED INCOME STATEMENT
Intertek Group plc Annual Report and Accounts 2018 115
Financial StatementsFinancial Statements | Consolidated primary statements

For the year ended 31 December 2018 Notes2018
£m2017
£m
Profit for the year 2 305.2 306.4Other comprehensive incomeRemeasurements on defined benefit pension schemes 16 (0.8) 12.6Tax on items that will never be reclassified to profit or loss 6 (0.5) (1.7)Items that will never be reclassified to profit or loss (1.3) 10.9Foreign exchange translation differences of foreign operations 45.3 (107.3)Net exchange (loss)/gain on hedges of net investments in foreign operations 14 (32.6) 77.3Gain/(loss) on fair value of cash flow hedges 1.1 (16.4)Items that are or may be reclassified subsequently to profit or loss 13.8 (46.4)Total other comprehensive income/(expense) for the year 12.5 (35.5)Total comprehensive income for the year 317.7 270.9
Total comprehensive income for the year attributable to: Equity holders of the Company 299.7 252.2
Non-controlling interest 20 18.0 18.7Total comprehensive income for the year 317.7 270.9
CONSOLIDATED STATEMENT OF COMPREHENSIVE INCOME
Intertek Group plc Annual Report and Accounts 2018116
Financial Statements | Consolidated primary statements

As at 31 December 2018 Notes2018
£m2017
£m
AssetsProperty, plant and equipment 8 441.2 420.6Goodwill 9 874.9 579.6Other intangible assets 9 329.5 178.2Investments in associates 0.3 0.3Deferred tax assets 6 58.4 59.4Total non-current assets 1,704.3 1,238.1Inventories* 18.3 18.3Trade and other receivables* 11 684.4 641.7Cash and cash equivalents 14 206.9 137.0Current tax receivable 19.7 17.3Total current assets 929.3 814.3
Total assets 2,633.6 2,052.4
LiabilitiesInterest-bearing loans and borrowings 14 (138.3) (77.1)Current taxes payable (62.5) (46.8)Trade and other payables* 12 (515.1) (452.2)Provisions* 13 (26.8) (32.2)Total current liabilities (742.7) (608.3)Interest-bearing loans and borrowings 14 (846.8) (604.0)Deferred tax liabilities 6 (80.8) (47.4)Net pension liabilities 16 (12.5) (17.8)Other payables* 12 (26.5) (21.6)Provisions* 13 (16.0) (9.1)Total non-current liabilities (982.6) (699.9)
Total liabilities (1,725.3) (1,308.2)
Net assets 908.3 744.2
EquityShare capital 15 1.6 1.6Share premium 257.8 257.8Other reserves 7.1 (9.5)Retained earnings 607.5 459.8Total equity attributable to equity holders of the Company 874.0 709.7Non-controlling interest 20 34.3 34.5
Total equity 908.3 744.2
Working capital of £109.7m (2017: £138.3m) comprises the asterisked items in the above Statement of Financial Position less refundable deposits aged over 12 months of £8.6m (2017: £6.6m).
The financial statements on pages 115 to 163 were approved by the Board on 4 March 2019 and were signed on its behalf by:
André Lacroix Ross McCluskeyChief Executive Officer Chief Financial Officer
CONSOLIDATED STATEMENT OF FINANCIAL POSITION
Intertek Group plc Annual Report and Accounts 2018 117
Financial Statements

For the year ended 31 December 2018
Attributable to equity holders of the Company
Notes
Share capital
£m
Share premium
£m
Other reserves
Retained earnings
£m
Total before
non-controlling
interest £m
Translation reserve
£mOther
£m
Non-controlling
interest£m
Total equity
£m
At 1 January 2017 1.6 257.8 14.6 20.7 273.0 567.7 34.7 602.4Total comprehensive income for the yearProfit – – – – 287.4 287.4 19.0 306.4Other comprehensive (expense)/income – – (28.4) (16.4) 9.6 (35.2) (0.3) (35.5)Total comprehensive income for the year – – (28.4) (16.4) 297.0 252.2 18.7 270.9Transactions with owners of the
Company recognised directly in equityContributions by and distributions to the
owners of the CompanyDividends paid 15 – – – – (107.0) (107.0) (18.7) (125.7)Adjustment arising from changes in
non-controlling interest 20 – – – – – – (0.2) (0.2)Issue of share capital 15 – – – – – – – –Purchase of own shares 15 – – – – (15.6) (15.6) – (15.6)Tax paid on Share Awards vested* 17 – – – – (6.8) (6.8) – (6.8)Equity-settled transactions 17 – – – – 17.5 17.5 – 17.5Income tax on equity-settled transactions 6 – – – – 1.7 1.7 – 1.7Total contributions by and distributions
to the owners of the Company – – – – (110.2) (110.2) (18.9) (129.1)At 31 December 2017 1.6 257.8 (13.8) 4.3 459.8 709.7 34.5 744.2
At 1 January 2018 1.6 257.8 (13.8) 4.3 459.8 709.7 34.5 744.2Total comprehensive income for the yearProfit – – – – 284.4 284.4 20.8 305.2
Other comprehensive (expense)/income – – 15.5 1.1 (1.3) 15.3 (2.8) 12.5Total comprehensive income for the year – – 15.5 1.1 283.1 299.7 18.0 317.7Transactions with owners of the
Company recognised directly in equityContributions by and distributions to the
owners of the CompanyDividends paid 15 – – – – (128.3) (128.3) (18.2) (146.5)Adjustment arising from changes in
non-controlling interest 20 – – – – – – – –Issue of share capital 15 – – – – – – – –Purchase of own shares 15 – – – – (16.7) (16.7) – (16.7)Tax paid on Share Awards vested* 17 – – – – (9.9) (9.9) – (9.9)Equity-settled transactions 17 – – – – 20.9 20.9 – 20.9Income tax on equity-settled transactions 6 – – – – (1.4) (1.4) – (1.4)Total contributions by and distributions
to the owners of the Company – – – – (135.4) (135.4) (18.2) (153.6)At 31 December 2018 1.6 257.8 1.7 5.4 607.5 874.0 34.3 908.3
* The tax paid on share awards vested is related to settlement of the tax obligation on behalf of employees by the Group via the sale of a portion of the equity-settled shares.
CONSOLIDATED STATEMENT OF CHANGES IN EQUITY
Intertek Group plc Annual Report and Accounts 2018118
Financial Statements | Consolidated primary statements

For the year ended 31 December 2018 Notes2018
£m2017
£m
Cash flows from operating activitiesProfit for the year 2 305.2 306.4Adjustments for:Depreciation charge 8 76.2 81.2Amortisation of software 9 12.5 12.2Amortisation of acquisition intangibles 9 24.6 16.0Impairment of goodwill and other assets 8,9 – 18.2Equity-settled transactions 17 20.9 17.5Net financing costs 14 31.7 29.4Income tax expense 6 99.3 86.9(Profit)/loss on disposal of subsidiary (1.1) –Loss/(profit) on disposal of property, plant, equipment and software 0.4 (0.8)Operating cash flows before changes in working capital and operating provisions 569.7 567.0Change in inventories 1.0 (0.5)Change in trade and other receivables (16.0) (22.7)Change in trade and other payables 35.2 46.0Change in provisions (7.0) (7.8)Special contributions into pension schemes 16 (2.0) (2.8)Cash generated from operations 580.9 579.2Interest and other finance expense paid (29.3) (28.3)Income taxes paid (93.1) (100.8)Net cash flows generated from operating activities* 458.5 450.1
Cash flows from investing activitiesProceeds from sale of property, plant, equipment and software* 3.5 3.2Interest received* 14 1.8 1.2Acquisition of subsidiaries, net of cash acquired 10 (387.9) (27.4)Consideration paid in respect of prior year acquisitions 0.1 (7.8)Acquisition of property, plant, equipment and software* 8,9 (113.2) (112.9)Net cash flows used in investing activities (495.7) (143.7)
Cash flows from financing activitiesPurchase of own shares 15 (16.7) (15.6)Tax paid on share awards vested (9.9) (6.8)Drawdown of borrowings 341.4 –Repayment of borrowings (75.9) (151.3)Dividends paid to non–controlling interest 20 (18.2) (18.7)Equity dividends paid 15 (128.3) (107.0)Net cash flow used in financing activities 92.4 (299.4)
Net increase in cash and cash equivalents 14 55.2 7.0Cash and cash equivalents at 1 January 14 135.9 158.8Exchange adjustments 14 12.1 (29.9)Cash and cash equivalents at 31 December 14 203.2 135.9
The notes on pages 120 to 163 are an integral part of these consolidated financial statements.
Cash outflow relating to Separately Disclosed Items was £22.0m for year ended 31 December 2018 (2017: £16.9m).
Free cash flow of £350.6m (2017: £341.6m) comprises the asterisked items in the above consolidated Statement of Cash Flows.
CONSOLIDATED STATEMENT OF CASH FLOWS
Intertek Group plc Annual Report and Accounts 2018 119
Financial Statements
NOTES TO THE FINANCIAL STATEMENTS
1 Significant accounting policiesBASIS OF PREPARATIONAccounting policies applicable to more than one section of the financial statements are shown below. Where accounting policies relate to a specific note in the financial statements, they are set out within that note, to provide readers of the financial statements with a more useful layout to the financial information presented.
Statement of complianceIntertek Group plc is a company incorporated and domiciled in the UK.
The Group financial statements as at and for the year ended 31 December 2018 consolidate those of the Company and its subsidiaries (together referred to as the 'Group') and include the Group’s interest in associates. The Group financial statements have been prepared and approved by the Directors in accordance with International Financial Reporting Standards as adopted by the EU (IFRSs). The Company financial statements present information about the Company as a separate entity and not about its Group. The Company has elected to prepare its Company financial statements in accordance with UK GAAP, comprising FRS 101 and applicable law; these are presented on pages 164 to 168.
Significant new accounting policiesIFRS 9 Financial Instruments came into effect on 1 January 2018. Management has performed its reviews of the standard, and identified the following areas of note, although there is no material impact in the year ending 31 December 2018 as a result of implementing the new standard. The Group has applied the limited exemption in IFRS 9 and has elected not to restate comparative information in the year of adoption. As a result, the comparative information provided has been accounted for in accordance with Group's previous accounting policy.
• Classification and measurement of financial assets – the Group's financial assets comprise trade receivables, contract assets and cash and cash equivalents. The disclosures relating to both trade receivables, contract assets and cash and cash equivalents continue to be applicable and have not been affected by the adoption of IFRS 9. There are no changes to the measurement of financial assets.
• Impairment of financial assets, by introducing a forward-looking expected loss impairment model – the Group's primary types of financial assets subject to IFRS 9's new expected credit loss model are trade receivables and contract assets. For trade receivables and contract assets, the Group has applied the simplified approach permitted by IFRS 9, which requires the use of the lifetime expected loss provision for all receivables, whereas IAS 39 operated under an incurred loss model and would only recognise impairments when there was objective evidence. There has been no material change to the impairment provision of receivables.
• Hedge accounting – the Group has continued to apply IAS 39 accounting and has provided additional IFRS 7 disclosures required for taking that option.
IFRS 15 Revenue from contracts with customers came into effect on 1 January 2018. During the year ended 31 December 2017 the Group carried out a detailed review of the recognition criteria for revenue applying the requirements of IFRS 15 and to ensure that the same principles were being applied consistently across the Group. Management assessed the potential impact of IFRS 15 by i) discussing the changes in accounting for revenue under the new standard with major countries and business lines; ii) reviewing a cross-section of different revenue contracts across the Group; and iii) considering the impact of IFRS 15 on both short-term and long-term contracts. Specifically, the Group's revenue streams are two-fold:
• Revenue from services rendered on short-term projects is generally recognised in the income statement when the relevant service is completed, usually when the report of findings or test/inspection certificate is issued. The adoption of IFRS 15 has no material impact on the recognition of such revenue.
• On long-term projects the Group records transactions as revenue on the basis of value of work done, with the corresponding amount being included in trade receivables if the customer has been invoiced, or in contract assets if billing has yet to be completed. Long-term projects consist of two main types:
– time incurred is billed at agreed rates on a periodic basis, such as monthly. The current recognition approach is based on timesheets evidencing work done, this is consistent with the "over time" recognition criteria under IFRS 15 using those timesheets as the input basis; or
– staged payment invoicing occurs, requiring an assessment of percentage completion, based on services provided and revenue accrued accordingly. Assessment of percentage completion has continued in the same way, this is in line with the "over time" recognition under IFRS 15.
Whilst IAS 18 is based on deliverables and risks and rewards of transfer, IFRS 15 identifies performance obligations. There may be more than one performance obligation per contract, for example Alchemy Training Solutions contracts have multiple elements which are split between recognising revenue at a point in time for services such as software licences and over time for other services delivered under the same contract. The application to the Group's long- and short-term contracts remains the same. IFRS 15 provides guidance on variable consideration that was not included under IAS 18, however no material variable consideration exists within the Group.
Intertek Group plc Annual Report and Accounts 2018120
Financial Statements | Notes to the financial statements

1 Significant accounting policies (continued)IFRS 15 has been implemented retrospectively, but the comparative figures have not been restated because the new standard does not have a material impact on the timing of revenue recognition based on the Group’s current revenue streams. The economic factors affecting revenue for both short-term and long-term contracts are consistent within each. The operating segment revenue disclosures (note 2) provided under IFRS 8 are consistent with the disaggregated revenue disclosure and recognition and measurement requirements of IFRS 15.
IFRSs announced but not yet effectiveIFRS 16 Leases (effective 1 January 2019) requires that, to the extent that a right-of-control exists over an asset subject to a lease, with a lease term exceeding one year and subject to exceptions for leases of low-value assets, a right-of-use asset, representing the Group's right to use the underlying leased asset and a lease liability representing the Group's obligation to make lease payments, are recognised in the consolidated statement of financial position at the commencement of the lease.
The Group will be applying the modified retrospective approach, where the cumulative effect of applying IFRS 16 is recognised in retained earnings with no restatement to prior years.
On transition, the majority of leases will be recognised using modified retrospective B, whereby the right-of-use asset is equal to the lease liability at 1 January 2019, being the present value of the remaining future minimum lease payments at the date of initial application, including any early termination or extension options if they are deemed reasonably certain to be adopted. For certain leases the modified retrospective A approach will be applied, whereby the right-of-use asset recognised at 1 January 2019 is equal to the right-of-use asset had IFRS 16 been applied since the beginning of the lease.
The Group has applied the practical expedient within the standard whereby IFRS 16 has been applied to contracts that were previously identified as leases when applying IAS 17 Leases and IFRIC 4 Determining whether an Arrangement Contains a Lease.
Management has completed the data collection exercise to determine the estimated quantitative impact of IFRS 16 on the Group’s net assets and income statement as a result of IFRS 16 coming into effect from 1 January 2019:
• The Group’s assets would increase by between £230m and £250m and liabilities would increase by between £250m and £270m. The overall impact on the Group’s statement of financial position as at 31 December 2018 is expected to be a reduction in the Group’s net assets of £20m.
• Operating lease rental charges for those leases accounted for under IFRS 16 are replaced by depreciation and finance costs. The impact on the Group’s 2018 income statement is not material.
IFRS 16 will primarily affect the accounting for the Group’s operating leases, to which the Group had commitments of £303.6m at 31 December 2018 as reported in note 8. This is the gross value and does not reflect a discounting of the commitments to their present value, as required by IFRS 16. IFRS 16 will not have any impact on the underlying commercial performance of the Group, nor the cash flows generated in the year.
There are no other standards that are not yet effective and that would be expected to have a material impact on the Group in the current or future reporting periods and on future transactions.
Changes in accounting policiesThe accounting policies set out in these financial statements have been applied consistently to all years presented except for the policy on the useful economic lives of intangible assets that has been updated to reflect the longer useful economic lives of the intangibles assets recognised following the acquisition of Alchemy. A number of new standards, amendments to standards and interpretations are effective for annual periods beginning on or after 1 January 2018, but do not have a material effect on the consolidated financial statements of the Group. Details of these standards can be found on page 120.
Measurement conventionThe financial statements are prepared on the historical cost basis except as discussed in the relevant accounting policies.
Functional and presentation currencyThese consolidated financial statements are presented in sterling, which is the Company’s functional currency. All information presented in sterling has been rounded to the nearest £0.1m.
Going concernThe Board has reviewed forecasts, including forecasts adjusted for significantly worse economic conditions. The Board has also reviewed the Group’s funding requirements and the available debt facilities. As a result of these reviews the Board remains satisfied with the Group’s funding and liquidity position and believes that the Group is well placed to manage its business risks successfully.
In addition, on the basis of its forecasts, both base case and stressed, and available facilities, which are described in note 14, the Board has concluded that the going concern basis of preparation continues to be appropriate.
Intertek Group plc Annual Report and Accounts 2018 121
Financial Statements

NOTES TO THE FINANCIAL STATEMENTScontinued
1 Significant accounting policies (continued)BASIS OF CONSOLIDATIONSubsidiariesSubsidiaries are those entities controlled by the Group. Control exists when the Group has power to direct the relevant activities, exposure to variable returns from the investee and the ability to use its power over the investee to affect the amount of investor returns. The financial statements of subsidiaries are included in the consolidated financial statements from the date that control commences until the date that control ceases.
For purchases of non-controlling interest in subsidiaries, the difference between the cost of the additional interest in the subsidiary and the non-controlling interest’s share of the assets and liabilities reflected in the consolidated statement of financial position at the date of acquisition, is reflected directly in shareholders’ equity.
Transactions eliminated on consolidationIntra-group balances and transactions, and any unrealised gains and losses or income and expenses arising from intra-group transactions, are eliminated in preparing the consolidated financial statements. Unrealised losses are eliminated in the same way as unrealised gains, but only to the extent that there is no evidence of impairment.
FOREIGN CURRENCYForeign currency transactionsTransactions in foreign currencies are translated to the respective functional currencies of Group entities at the foreign exchange rate ruling at the date of the transaction. Monetary assets and liabilities (for example cash, trade receivables, trade payables) denominated in foreign currencies at the reporting date are translated at the foreign exchange rate ruling at that date. Foreign exchange differences arising on translation are generally recognised in the income statement. Non-monetary assets and liabilities that are measured in terms of historical cost in a foreign currency are translated using the exchange rate at the date of the transaction. For the policy on hedging of foreign currency transactions see note 14.
Foreign operationsThe assets and liabilities of foreign operations, including goodwill and fair value adjustments arising on acquisition, are translated to sterling at foreign exchange rates ruling at the reporting date.
The income and expenses of foreign operations are translated into sterling at cumulative average rates of exchange during the year. Exchange differences arising from the translation of foreign operations are taken directly to equity in the translation reserve. They are released to the income statement upon disposal. For the policy on net investment hedging see note 14.
The most significant currencies for the Group were translated at the following exchange rates:
Value of £1
Assets and liabilitiesActual rates
Income and expensesCumulative average rates
31 Dec 2018 31 Dec 2017 2018 2017
US dollar 1.26 1.34 1.34 1.29Euro 1.11 1.13 1.13 1.14Chinese renminbi 8.69 8.79 8.84 8.72Hong Kong dollar 9.90 10.47 10.47 10.05Australian dollar 1.80 1.72 1.79 1.68
USE OF JUDGEMENTS AND ESTIMATESThe preparation of financial statements in conformity with IFRSs requires management to make judgements and estimates that affect the application of accounting policies and the reported amounts of assets, liabilities, income and expenses. Actual results may differ from these estimates. Estimates and underlying assumptions are reviewed on an ongoing basis. Revisions to accounting estimates are recognised in the year in which the estimates are revised and in any future years affected.
During the year, management reassessed its critical estimates and judgements and resolved that the following disclosure was no longer considered critical, as management does not expect there to be a significant risk of material change to the carrying value of those liabilities within the next year.
Put option over non-controlling interestThe calculation of the fair value of put options over the non-controlling interest in the Group’s businesses in the relevant countries required the use of judgement in the application of key assumptions around the future performance of those businesses; the risk- adjusted discount rate taking into account the risk-free rate and the gross domestic product growth in those countries.
Intertek Group plc Annual Report and Accounts 2018122
Financial Statements | Notes to the financial statements

1 Significant accounting policies (continued)JUDGEMENTSIn applying the Group’s accounting policies, management has applied judgement in the following areas that have a significant impact on the amounts recognised in the financial statements.
Income and deferred taxThe tax on profits is determined according to complex tax laws and regulations. Where the effect of these laws and regulations is unclear, judgements are used in determining the liability for the tax to be paid.
Deferred tax assets and liabilities require management judgement in determining the amounts to be recognised, with consideration given to the timing and level of future taxable income. The main areas of judgement in the Group tax calculation are reassessment of the uncertain tax provisions for the full year and reassessment of the recognition and recoverability of the UK deferred tax asset – see note 6.
Basis of consolidationJudgement is applied when determining if the Group ‘controls’ a subsidiary. In assessing control, the Group considers whether it has the power to direct the relevant activities, whether it has exposure to variable returns from the investee and whether it has power over the investee to affect the amount of investor returns. Our original assessments are subsequently revisited on a rolling basis – see ‘Basis of Consolidation’ policy. In 2018 the Group made a number of acquisitions, as disclosed in note 10, and it was determined that the Group has control over all subsidiaries acquired in the year.
Intangible assetsWhen the Group makes an acquisition, e.g. Aldo Abela Surveys Limited, Proasem S.A.S., NTA Monitor Limited and Alchemy Investment Holdings, Inc. in 2018, management determines initially whether any intangible assets (e.g. customer relationships, trade names and technology) should be recognised separately from goodwill, and the provisional amounts at which to recognise those assets. Certain assumptions are used in determining the provisional values for such intangible assets, including, but not limited to, future growth rates and customer attrition rates. During the first 12 months of ownership, intangible assets are reviewed to determine whether any additional information exists that supports amendments to that original assessment, including new intangible assets. Management has performed this subsequent review for the 2017 acquisitions of KJ Tech Services GmbH and Acumen Security LLC during the current year – see note 10.
RestructuringIn making a provision and classifying costs as restructuring as part of our ‘5x5’ differentiated strategy for growth, management has used its judgement to assess the specific circumstances of each local and regional restructuring proposal as to whether it meets the Group definition of this SDI, including an estimate of future costs and the timing of completion – see note 3.
ClaimsIn making provision for claims, management has used its judgement to assess the circumstances relating to each specific event, internal and external legal advice, knowledge of the industries and markets, prevailing commercial terms and legal precedents – see note 13.
ESTIMATESDiscussed below are key assumptions concerning the future, and other key sources of estimation at the reporting date, that could have a risk of causing a significant material adjustment to the carrying amount of assets and liabilities within the next financial year.
Impairment of goodwillFollowing recognition of goodwill as a result of acquisitions, the Group determines, as a minimum on an annual basis and including current year acquisitions (e.g. Alchemy), whether goodwill is impaired, which requires an estimation of the future cash flows of the cash generating units to which the goodwill is allocated, as well as assumptions on growth rates and discount rates – see note 9. No risk has been identified of a goodwill impairment in the next twelve months, as detailed in the sensitivity analysis in note 9.
Contingent considerationWhen the Group acquires businesses, the total consideration may consist of an amount paid on completion plus further amounts payable on agreed post completion dates. These further amounts are contingent on the acquired business meeting agreed performance targets. At the date of acquisition and at subsequent reporting periods, the Group reviews the profit and cash forecasts for the acquired business and estimates the amount of contingent consideration that is likely to be due. Further details and sensitivity analysis are included in note 10.
Employee post-retirement benefit obligationsFor material defined benefit plans, the actuarial valuation includes assumptions such as discount rates, return on assets, salary progression and mortality rates. Further details and sensitivity analysis are included in note 16.
Recoverability of trade receivablesTrade receivables are reflected, net of an estimated provision for impairment losses. This provision considers the past payment history and the length of time that the debts have remained unpaid and forward-looking judgmental factors, such as specific customer knowledge and country-specific risk factors. Further details are included in note 11.
Intertek Group plc Annual Report and Accounts 2018 123
Financial Statements
NOTES TO THE FINANCIAL STATEMENTScontinued
1 Significant accounting policies (continued)Accounting policies relating to a specific note in the financial statements are set out within that note as follows:
NoteRevenue 2Separately Disclosed Items 3Taxation 6Property, plant and equipment 8Goodwill and other intangible assets 9Trade and other receivables 11Trade and other payables 12Provisions 13Borrowings and financial instruments 14Capital and reserves 15Employee benefits 16Share schemes 17Non-controlling interest 20
2 Operating segments and presentation of resultsACCOUNTING POLICYRevenueRevenue represents the total amount receivable for services rendered when there is transfer of control to the customer, excluding sales related taxes and intra-group transactions.
Revenue from services rendered on short-term projects is generally recognised in the income statement when the relevant service is completed, usually when the report of findings or test/inspection certificate is issued. Short-term projects are considered to be those of less than two months' duration.
On long-term projects revenue is recognised using the five steps for revenue recognition. The majority of contracts are for less than one year. The Group records transactions as sales on the basis of value of work done, with the corresponding amount being included in trade receivables if the customer has been invoiced, or in contract assets, if billing has yet to be completed. Performance obligations vary across business lines and regions, and on a contract-by-contract basis. There may be more than one performance obligation per contract, for example Alchemy Training Solutions contracts have multiple elements which are split between recognising revenue at a point in time for services such as software licences and over time for other services delivered under the same contract.
Long-term projects consist of two main types:
• time incurred is billed at agreed rates on a periodic basis, such as monthly; or
• staged payment invoicing occurs, requiring an assessment of percentage completion, based on services provided and revenue accrued accordingly.
Expenses are recharged to clients where permitted by the contract. Payments received in advance from customers are recognised in contract liabilities where services have not yet been rendered.
The Group does not expect to have any contracts where the period between the transfer of promised goods or services to the customer and payment by the customer exceeds one year. As a consequence, the Group does not adjust any of the transaction prices for the time value of money.
The Group has applied practical expedients in i) recognising assets from the costs incurred to obtain or fulfil a contract; and ii) in disclosing unsatisfied performance obligations in contracts as contracts have an expected duration of less than a year.
OPERATING SEGMENTSThe Group is organised into business lines, which are the Group’s operating segments and are reported to the CEO, the chief operating decision maker.
These operating segments are aggregated into three divisions, which are the Group’s reportable segments, based on similar nature of products and services and mid- to long-term structural growth drivers. When aggregating operating segments into the three divisions we have applied judgement over the similarities of the services provided, the customer-base and the mid- to long-term structural growth drivers. The costs of the corporate head office and other costs which are not controlled by the three divisions are allocated appropriately.
Inter-segment pricing is determined on an arm’s length basis. There is no significant seasonality in the Group’s operations. Segment results include items directly attributable to a segment as well as those that can be allocated on a reasonable basis.
Intertek Group plc Annual Report and Accounts 2018124
Financial Statements | Notes to the financial statements

2 Operating segments and presentation of results (continued) The performance of the segments is assessed based on adjusted operating profit which is stated before Separately Disclosed Items.
A reconciliation to operating profit by division and Group profit for the year is included overleaf.
The principal activities of the divisions, and the customers they serve, are as follows:
Products – Our Products division consists of business lines that are focused on ensuring the quality and safety of physical components and products, as well as minimising risk through assessing the operating process and quality management systems of our customers.
As a trusted partner to the world’s leading retailers, manufacturers and distributors, our Products business lines support a wide range of industries including textiles, footwear, toys, hardlines, home appliances, consumer electronics, information and communication technology, automotive, aerospace, lighting, building products, industrial and renewable energy products, food and hospitality, healthcare and beauty, and pharmaceuticals.
Across these industries we provide a wide range of ATIC services including laboratory safety, quality and performance testing, second-party supplier auditing, sustainability analysis, products assurance, vendor compliance, process performance analysis, facility plant and equipment verification and third party certification.
Trade – Our Trade division consists of three global business lines with similar global and regional trade-flow structural growth drivers with demand driven by population and GDP growth, the development of regional trade, increased traceability and growth in port and transport infrastructure.
The division provides differing services which reflect the breadth of our ATIC offering, but the services provided are similar in nature and include analytical assessment, inspection and technical services that are delivered to the customers through issuing certificates or reports. The three business lines all assist our Trade-related customers in protecting the value and quality of their products during their custody-transfer, storage and transportation, globally. Our Trade-related customers are all dependent on, and intrinsically linked to, global shipping and trade flows.
Our Caleb Brett business provides cargo inspection, analytical assessment, calibration and related research and technical services to the world’s petroleum and biofuels industries.
Our Government & Trade Services ('GTS') business provides inspection services to governments and regulatory bodies to support trade activities that help the flow of goods across borders, predominantly in the Middle East, Africa and South America.
Our AgriWorld business provides analytical and testing services to global agricultural trading companies and growers.
Resources – Our Resources division consists of two business lines demonstrating similar mid- to long-term structural growth drivers closely linked to our end-customer capital investment. Demand is driven by long-term energy demand, supply chain risk management, sustainability of energy supply, infrastructure investments, growth in alternative energy and focus on health and safety.
The division offers similar services across our range of Total Quality Assurance solutions to the oil, gas, nuclear, power and minerals industries. Our Resources customers typically extract natural resources from the ground and our services enable our customers to optimise the use of their assets and to minimise risk in their supply chains. Delivery of our services is through issuing certificates or reports.
Our Industry Services business uses in-depth knowledge of the oil, gas, nuclear and power industries to provide a diverse range of Total Quality Assurance solutions to optimise the use of customers' assets and minimise the risk in their supply chains. Some of our key services include technical inspection, asset integrity management, analytical testing and ongoing training services.
Our Minerals business provides a broad range of ATIC service solutions to the mining and minerals exploration industries, covering the resource supply chain from exploration and resource development, through to production, shipping and commercial settlement.
Intertek Group plc Annual Report and Accounts 2018 125
Financial Statements

NOTES TO THE FINANCIAL STATEMENTScontinued
2 Operating segments and presentation of results (continued) The results of these divisions for the year ended 31 December 2018 are shown below:
Year ended 31 December 2018
Revenuefrom
contracts with customers
£m
Depreciation and
softwareamortisation
£m
Adjusted operating
profit£m
Separately Disclosed
Items £m
Operating profit
£m
Products 1,680.2 (58.6) 371.0 (26.5) 344.5Trade 642.1 (19.2) 83.4 (5.1) 78.3Resources 478.9 (10.9) 27.4 (14.0) 13.4Total 2,801.2 (88.7) 481.8 (45.6) 436.2Group operating profit 481.8 (45.6) 436.2Net financing costs (25.3) (6.4) (31.7)Profit before income tax 456.5 (52.0) 404.5Income tax expense (112.8) 13.5 (99.3)Profit for the year 343.7 (38.5) 305.2
Year ended 31 December 2017
Revenuefrom
contracts withcustomers
£m
Depreciation and
softwareamortisation
£m
Adjusted operating
profit£m
Separately Disclosed
Items £m
Operating profit
£m
Products 1,625.5 (60.3) 350.5 (15.0) 335.5Trade 647.8 (19.9) 88.7 (5.9) 82.8Resources 495.8 (13.2) 28.5 (24.1) 4.4Total 2,769.1 (93.4) 467.7 (45.0) 422.7Group operating profit 467.7 (45.0) 422.7Net financing costs (28.9) (0.5) (29.4)Profit before income tax 438.8 (45.5) 393.3Income tax expense (107.5) 20.6 (86.9)Profit for the year 331.3 (24.9) 306.4
GEOGRAPHIC SEGMENTSAlthough the Group is managed through a divisional structure, which operates on a global basis, under the requirements of IFRS 8 the Group must disclose any specific countries that are important to the Group’s performance. The Group considers the following to be the material countries in which it operates: the United States, China (including Hong Kong) and the United Kingdom.
In presenting information on the basis of geographic segments, segment revenue is based on the location of the entity generating that revenue. Segment assets are based on the geographical location of the assets.
Revenue from external customers Non-current assets
2018£m
2017£m
2018£m
2017£m
United States 872.8 863.3 1,034.7 583.4China (including Hong Kong) 530.3 528.4 56.9 55.0United Kingdom 186.4 183.0 116.2 106.5Other countries and unallocated 1,211.7 1,194.4 438.1 433.8Total 2,801.2 2,769.1 1,645.9 1,178.7
MAJOR CUSTOMERSNo revenue from any individual customer exceeded 10% of total Group revenue in 2017 or 2018.
Intertek Group plc Annual Report and Accounts 2018126
Financial Statements | Notes to the financial statements

3 Separately Disclosed ItemsACCOUNTING POLICYAdjusted resultsIn order to present the performance of the Group in a clear, consistent and comparable format, certain items are disclosed separately on the face of the income statement. Separately Disclosed Items are items which by their nature or size, in the opinion of the Directors, should be excluded from the adjusted result to provide readers with a clear and consistent view of the business performance of the Group and its operating divisions.
When applicable, these items include amortisation of acquisition intangibles; impairment of goodwill and other assets; the profit or loss on disposals of businesses or other significant non-current assets; costs of acquiring and integrating acquisitions; the cost of any fundamental restructuring; material claims and settlements; significant recycling of amounts from equity to the income statement; and unrealised market or fair value gains or losses on financial assets or liabilities, including contingent consideration.
Adjusted operating profit, which is a non-GAAP measure, excludes the amortisation of acquired intangible assets, primarily customer relationships, as we do not believe that the amortisation charge in the Income Statement provides useful information about the cash costs of running our business as these assets will be supported and maintained by the ongoing marketing and promotional expenditure, which is already reflected in operating costs. Amortisation of software, however, is included in adjusted operating profit as it is similar in nature to other capital expenditure. The costs of any restructuring as part of our 5x5 differentiated strategy for growth are excluded from adjusted operating profit where they represent fundamental changes in individual operations around the Group and where they reflect the refinement of our operational structure identified as part of the Group's strategy that are not expected to recur in those operations. The impairment of goodwill and other assets that by their nature or size are not expected to recur; the profit and loss on disposals of businesses or other significant assets; and the costs associated with successful, active or aborted acquisitions are excluded from adjusted operating profit to provide useful information regarding the underlying performance of the Group’s operations.
SEPARATELY DISCLOSED ITEMSThe Separately Disclosed Items are described in the table below:
2018£m
2017£m
Operating costs:Amortisation of acquisition intangibles (a) (24.6) (16.0)Acquisition costs (b) (8.5) (3.2)Restructuring costs (c) (13.6) (12.4)Gain on disposal of business (d) 1.1 –Impairment of goodwill and other assets (e) – (16.8)Material claims and settlements (f) – 3.4Total operating costs (45.6) (45.0)Net financing costs (g) (6.4) (0.5)Total before income tax (52.0) (45.5)Income tax credit on Separately Disclosed Items 13.5 20.6Total (38.5) (24.9)
(a) Of the amortisation of acquisition intangibles in the current year, £3.6m (2017: £nil) relates to the customer relationships, trade names, technology and non-compete covenants acquired with the purchase of Alchemy Investment Holdings, Inc ("Alchemy") in 2018.
(b) Acquisition costs comprise £8.5m (2017: £3.6m) for transaction costs in respect of successful, active and aborted acquisitions in the current year, and £nil in respect of prior-years’ acquisitions (2017: £0.4m income).
(c) During the year, the Group has implemented various fundamental restructuring activities, consistent with the Group's 5x5 strategy. These activities included site consolidations, closure of non-core business units, re-engineering of underperforming businesses and the delayering of management structures.
(d) £1.1m of small non-core businesses were disposed of in 2018 (2017: £nil).
(e) No impairment charges have been recorded in 2018. Consistent with the corporate 5x5 strategy objective of "Superior Technology" announced in 2016, the Group recorded an impairment of other assets of £8.0m in 2017 following a comprehensive strategic review of the Global IT organisation structure and system finalised in April 2017. In addition, in 2017 £8.8m of plant and equipment was impaired in full, related to a specific service line in the Resources division that is no longer an area of focus for the Group.
(f) Material claims and settlements relate to a commercial claim that is separately disclosable due to its size.
(g) Net financing costs of £6.4m (2017: £0.5m) relate to the change in fair value of contingent consideration and the unwinding of discount on put options related to acquisitions.
Intertek Group plc Annual Report and Accounts 2018 127
Financial Statements

NOTES TO THE FINANCIAL STATEMENTScontinued
4 Expenses and auditor’s remunerationAn analysis of operating costs by nature is outlined below:
2018£m
2017£m
Employee costs 1,239.0 1,220.8Depreciation and software amortisation 88.7 93.4Impairment of goodwill and other assets – 18.2Other expenses 1,037.3 1,014.0Total 2,365.0 2,346.4
Certain expenses are outlined below, including fees paid to the auditors of the Group:
2018£m
2017£m
Included in profit for the year are the following expenses:Property rentals 77.6 81.4Lease and hire charges – fixtures, fittings and equipment 25.7 24.5Loss/(profit) on disposal of property, fixtures, fittings, equipment and software 0.4 (0.8)
2018£m
2017£m
Auditor’s remuneration: Audit of these financial statements 0.5 0.5Amounts receivable by the auditors and their associates in respect of: Audit of financial statements of subsidiaries pursuant to legislation 3.4 3.1 Total audit fees payable pursuant to legislation 3.9 3.6 Audit-related services 0.2 0.2 Taxation compliance services – – Taxation advisory services – – Other – –Total 4.1 3.8
5 EmployeesTotal employee costs are shown below:
Employee costs 2018
£m2017
£m
Wages and salaries 1,052.0 1,037.7Equity-settled transactions 21.0 17.4Social security costs 120.0 115.6Pension costs (note 16) 46.0 50.1Total employee costs 1,239.0 1,220.8
Details of pension arrangements and equity-settled transactions are set out in notes 16 and 17 respectively.
Average number of employees by division 2018 2017
Products 23,961 23,164Trade 10,550 10,171Resources 8,025 7,970Central 1,926 2,001Total average number for the year ended 31 December 44,462 43,306Total actual number at 31 December 44,720 43,906
The total remuneration of the Directors is shown below:
Directors’ emoluments 2018
£m2017
£m
Directors’ remuneration 5.0 9.4Amounts charged under the long-term incentive scheme 4.5 6.0Company contributions to the defined contribution schemes – –Total Directors’ emoluments 9.5 15.4
Intertek Group plc Annual Report and Accounts 2018128
Financial Statements | Notes to the financial statements
6 TaxationACCOUNTING POLICYIncome tax for the year comprises current and deferred tax. Income tax is recognised in the same primary statement as the accounting transaction to which it relates.
Current taxCurrent tax is the expected tax payable on the taxable income for the year, using tax rates enacted or substantively enacted at the reporting date, and any adjustment to tax payable in respect of previous years.
The Group recognises liabilities for anticipated tax issues based on estimates of the additional taxes that are likely to become due. Amounts are accrued based on management’s interpretation of specific tax law and the likelihood of settlement. Where the outcome of discussions with tax authorities is different from the amount initially recorded, this difference will impact the tax provisions in the period the determination is made.
Deferred taxDeferred tax is provided using the balance sheet liability method, providing for temporary differences between the carrying amount of assets and liabilities for financial reporting purposes and the amounts used for taxation purposes, except for:
• recognition of consolidated goodwill;
• the initial recognition of assets or liabilities in a transaction that is not a business combination and that affects neither accounting nor taxable profit; and
• differences relating to investments in subsidiaries, branches, associates and interest in joint ventures, the reversal of which is under the control of the Group and where it is probable that the difference will not reverse in the foreseeable future.
The amount of deferred tax provided is based on the expected manner of realisation or settlement of the carrying amount of assets and liabilities, using tax rates that have been enacted or substantively enacted at the balance sheet date, for the periods when the asset is realised or the liability is settled. Deferred tax assets and liabilities are offset if there is a legally enforceable right to offset current tax liabilities and assets and they relate to income taxes levied by the same tax authority on the same taxable entity, or on different taxable entities which intend to settle current tax liabilities and assets on a net basis or their tax assets and liabilities will be realised simultaneously.
A deferred tax asset is recognised only to the extent that it is probable that future taxable profits will be available against which the temporary difference can be utilised. The carrying amount of deferred tax assets is reviewed at each balance sheet date and reduced to the extent that it is no longer probable that sufficient taxable profits will be available to allow all or part of the deferred tax asset to be utilised.
Any additional income taxes that arise from the distribution of dividends are recognised at the same time as the liability to pay the related dividend.
TAX EXPENSEThe Group operates across many different tax jurisdictions. Income and profits are earned and taxed in the individual countries in which they occur.
The income tax expense for the profit before tax for the 12 months ended 31 December 2018 is £99.3m (2017: £86.9m). The Group’s consolidated effective tax rate for the 12 months ended 31 December 2018 is 24.5% (2017: 22.1%).
The income tax expense for the adjusted profit before tax for the 12 months ended 31 December 2018 is £112.8m (2017: £107.5m). The Group’s adjusted consolidated effective tax rate for the 12 months ended 31 December 2018 is 24.7% (2017: 24.5%).
Differences between the consolidated effective tax rate of 24.5% and notional statutory UK rate of 19.0% include, but are not limited to: the mix of profits; the effect of tax rates in foreign jurisdictions; non-deductible expenses; the effect of utilised tax losses; and under/over provisions in previous periods.
The Group receives tax incentives in certain jurisdictions, resulting in a lower tax charge to the income statement. Without these incentives the adjusted effective tax rate would be 27.1% (2017: 27.0%). The Group’s tax rate is affected by its financing arrangements that are in place to fund business operations in overseas territories. There is no guarantee that these reduced rates will continue to be applicable in future years (see note 22).
Intertek Group plc Annual Report and Accounts 2018 129
Financial Statements

NOTES TO THE FINANCIAL STATEMENTScontinued
6 Taxation (continued)Tax chargeThe total income tax charge, comprising the current tax charge and the movement in deferred tax, recognised in the income statement is analysed as follows:
2018£m
2017£m
Current tax charge for the period 106.1 94.3Adjustments relating to prior year liabilities 0.7 (0.2)Current tax 106.8 94.1Deferred tax movement related to current year (4.8) (9.2)Deferred tax movement related to prior year (2.7) 2.0Deferred tax movement (7.5) (7.2)Total tax in income statement 99.3 86.9
Tax on adjusted result 112.8 107.5Tax on Separately Disclosed Items (13.5) (20.6)Total tax in income statement 99.3 86.9
Reconciliation of effective tax rateThe following table provides a reconciliation of the UK statutory corporation tax rate to the effective tax rate of the Group on profit before taxation.
2018£m
2017£m
Profit before taxation 404.5 393.3Notional tax charge at UK standard rate 19.00% (2017: 19.25%) 76.9 75.7Differences in overseas tax rates 15.0 17.6Withholding tax on intercompany dividends 6.5 12.1Non-deductible expenses 24.3 4.4Tax exempt income (14.1) (4.5)US change in tax rate impact1 – (12.5)Movement in unrecognised deferred tax (9.2) (6.5)Adjustments in respect of prior years (2.0) 1.8Other2 1.9 (1.2)Total tax in income statement 99.3 86.9
1. Of the £12.5m in 2017 relating to the impact of the US tax rate change, £7.5m has been recorded in SDIs, which is where the underlying cost/income driving the associated deferred tax has also been recorded.
2. The Other category contains R&D tax credits of £1.3m (2017: £1.2m).
During 2015, the UK Government announced a phased reduction in the main rate of corporation tax from 20% to 18% over a period of three years from 1 April 2017. In 2016, the UK Government announced a further reduction in the UK corporation tax rate to 17% from 1 April 2020 which was substantively enacted in September 2016.
Income tax recognised in other comprehensive income (‘OCI’)As noted in the accounting policy, tax is recognised in the same place as the relevant accounting charge. The income tax recognised on items recorded in other comprehensive income is shown below:
Before tax2018
£m
Tax charge2018
£m
Net of tax2018
£m
Before tax2017
£m
Tax charge2017
£m
Net of tax2017
£m
Foreign exchange translation differences of foreign operations 45.3 – 45.3 (107.3) – (107.3)
Net exchange gain/(loss) on hedges of net investments in foreign operations (32.6) – (32.6) 77.3 – 77.3
(Loss)/gain on fair value of cash flow hedges 1.1 – 1.1 (16.4) – (16.4)Remeasurements on defined benefit pension schemes (0.8) (0.5) (1.3) 12.6 (1.7) 10.9Total other comprehensive (expense)/income
for the year 13.0 (0.5) 12.5 (33.8) (1.7) (35.5)
Intertek Group plc Annual Report and Accounts 2018130
Financial Statements | Notes to the financial statements

6 Taxation (continued)Income tax recognised directly in equityAs noted in the accounting policy, tax is recognised in the same place as the relevant accounting charge. The income tax on items recognised in equity is shown below:
Before tax2018
£m
Tax charge2018
£m
Net of tax2018
£m
Before tax2017
£m
Tax credit2017
£m
Net of tax2017
£m
Equity-settled transactions 20.9 (1.4) 19.5 17.5 1.7 19.2
DEFERRED TAXRecognised deferred tax assets and liabilitiesDeferred tax assets and liabilities are attributable to the following:
Assets2018
£m
Assets2017
£m
Liabilities 2018
£m
Liabilities 2017
£m
Net2018
£m
Net2017
£m
Intangible assets 0.5 0.8 (91.1) (52.7) (90.6) (51.9)Property, fixtures, fittings and equipment 12.1 11.6 (7.8) (8.7) 4.3 2.9Pensions 2.6 3.2 – – 2.6 3.2Equity-settled transactions 8.2 8.2 – – 8.2 8.2Provisions and other temporary differences 41.9 42.5 0.3 (4.5) 42.2 38.0Tax value of losses 10.9 11.6 – – 10.9 11.6Total 76.2 77.9 (98.6) (65.9) (22.4) 12.0As shown on balance sheet:Deferred tax assets* 58.4 59.4Deferred tax liabilities* (80.8) (47.4)Total (22.4) 12.0
* The deferred tax by category shown above is not netted off within companies or jurisdictions. The balance sheet shows the net position within companies or jurisdictions. The difference between the two asset and liability totals is £17.8m, but the net liability of £22.4m is the same in both cases.
Movements in deferred tax temporary differences during the yearThe movement in the year in deferred tax assets and liabilities is shown below:
1 January 2018
£m
Exchange adjustments
£mAcquisitions
£m
Recognised in income
statement£m
Recognised in equity
and OCI£m
31 December 2018
£m
Intangible assets (51.9) (2.2) (41.9) 5.4 – (90.6)Property, fixtures, fittings and equipment 2.9 (0.9) – 2.3 – 4.3Pensions 3.2 – – 0.2 (0.8) 2.6Equity-settled transactions 8.2 (0.1) – 1.5 (1.4) 8.2Provisions and other temporary differences 38.0 0.7 – 2.8 0.7 42.2Tax value of losses 11.6 (0.9) 5.3 (4.7) (0.4) 10.9Total 12.0 (3.4) (36.6) 7.5 (1.9) (22.4)
1 January 2017
£m
Exchange adjustments
£mAcquisitions
£m
Recognised in income
statement£m
Recognised in equity
and OCI£m
31 December 2017
£m
Intangible assets (71.2) 4.8 (3.4) 17.9 – (51.9)Property, fixtures, fittings and equipment (5.4) 0.6 – 7.7 – 2.9Pensions 1.4 – – 0.8 1.0 3.2Equity-settled transactions 6.0 – – 0.4 1.8 8.2Provisions and other temporary differences 43.9 1.6 – (6.5) (1.0) 38.0Tax value of losses 24.9 (0.6) – (13.1) 0.4 11.6Total (0.4) 6.4 (3.4) 7.2 2.2 12.0
Intertek Group plc Annual Report and Accounts 2018 131
Financial Statements
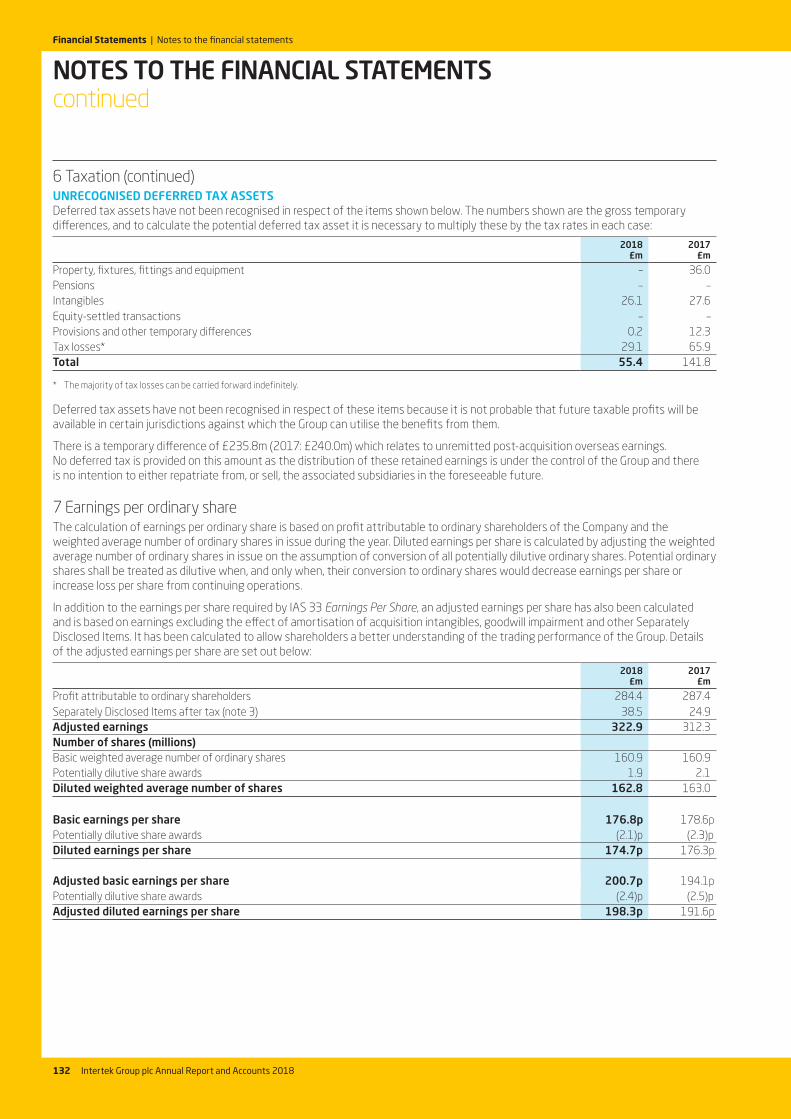
NOTES TO THE FINANCIAL STATEMENTScontinued
6 Taxation (continued)UNRECOGNISED DEFERRED TAX ASSETSDeferred tax assets have not been recognised in respect of the items shown below. The numbers shown are the gross temporary differences, and to calculate the potential deferred tax asset it is necessary to multiply these by the tax rates in each case:
2018£m
2017£m
Property, fixtures, fittings and equipment – 36.0Pensions – –Intangibles 26.1 27.6Equity-settled transactions – –Provisions and other temporary differences 0.2 12.3Tax losses* 29.1 65.9Total 55.4 141.8
* The majority of tax losses can be carried forward indefinitely.
Deferred tax assets have not been recognised in respect of these items because it is not probable that future taxable profits will be available in certain jurisdictions against which the Group can utilise the benefits from them.
There is a temporary difference of £235.8m (2017: £240.0m) which relates to unremitted post-acquisition overseas earnings. No deferred tax is provided on this amount as the distribution of these retained earnings is under the control of the Group and there is no intention to either repatriate from, or sell, the associated subsidiaries in the foreseeable future.
7 Earnings per ordinary shareThe calculation of earnings per ordinary share is based on profit attributable to ordinary shareholders of the Company and the weighted average number of ordinary shares in issue during the year. Diluted earnings per share is calculated by adjusting the weighted average number of ordinary shares in issue on the assumption of conversion of all potentially dilutive ordinary shares. Potential ordinary shares shall be treated as dilutive when, and only when, their conversion to ordinary shares would decrease earnings per share or increase loss per share from continuing operations.
In addition to the earnings per share required by IAS 33 Earnings Per Share, an adjusted earnings per share has also been calculated and is based on earnings excluding the effect of amortisation of acquisition intangibles, goodwill impairment and other Separately Disclosed Items. It has been calculated to allow shareholders a better understanding of the trading performance of the Group. Details of the adjusted earnings per share are set out below:
2018£m
2017£m
Profit attributable to ordinary shareholders 284.4 287.4Separately Disclosed Items after tax (note 3) 38.5 24.9Adjusted earnings 322.9 312.3Number of shares (millions)Basic weighted average number of ordinary shares 160.9 160.9Potentially dilutive share awards 1.9 2.1Diluted weighted average number of shares 162.8 163.0
Basic earnings per share 176.8p 178.6pPotentially dilutive share awards (2.1)p (2.3)pDiluted earnings per share 174.7p 176.3p
Adjusted basic earnings per share 200.7p 194.1pPotentially dilutive share awards (2.4)p (2.5)pAdjusted diluted earnings per share 198.3p 191.6p
Intertek Group plc Annual Report and Accounts 2018132
Financial Statements | Notes to the financial statements

8 Property, plant and equipmentACCOUNTING POLICYProperty, plant and equipmentOwned assetsItems of property, plant and equipment are measured at cost less accumulated depreciation and accumulated impairment losses. Cost includes expenditure that is directly attributable to the acquisition of the asset.
Leased assetsLeases in which the Group assumes substantially all the risks and rewards of ownership are classified as finance leases. Where land and buildings are held under finance leases, the accounting treatment of the land is considered separately from that of the buildings. Leased assets acquired by way of finance leases are stated at an amount equal to the lower of their fair value and the present value of the minimum lease payments at inception of the lease, less accumulated depreciation and impairment losses.
Other leases are operating leasesThese leased assets are not recognised in the Group’s statement of financial position.
DepreciationDepreciation is charged to the income statement on a straight-line basis over the estimated useful lives of items of property, plant and equipment. Leased assets are depreciated over the shorter of the expected lease term and their useful lives. Land is not depreciated.
The estimated useful lives are as follows:
Freehold buildings and long leasehold buildings 50 yearsShort leasehold buildings Term of lease Fixtures, fittings, plant and equipment 3 to 10 years
Depreciation methods, residual values and the useful lives of assets are reassessed at each reporting date.
ImpairmentNon-financial assetsThe carrying amounts of the Group’s non-financial assets, other than inventories and deferred tax assets, are reviewed at each reporting date to determine whether there is any indication of impairment. If any such indication exists, then the asset’s recoverable amount is estimated to determine the level of any impairment.
Intertek Group plc Annual Report and Accounts 2018 133
Financial Statements

NOTES TO THE FINANCIAL STATEMENTScontinued
8 Property, plant and equipment (continued)PROPERTY, PLANT AND EQUIPMENTThe property, plant and equipment employed by the business is analysed below:
Land andbuildings
£m
Fixtures,fittings,
plant andequipment
£mTotal
£m
CostAt 1 January 2017 98.3 1,079.6 1,177.9Exchange adjustments (3.8) (62.7) (66.5)Additions 0.1 91.6 91.7Disposals (0.2) (21.5) (21.7)Businesses acquired (note 10) – 0.6 0.6At 31 December 2017 94.4 1,087.6 1,182.0DepreciationAt 1 January 2017 29.5 705.1 734.6Exchange adjustments (2.2) (43.1) (45.3)Charge for the year 3.4 77.8 81.2Impairments – 10.2 10.2Disposals 0.2 (19.5) (19.3)At 31 December 2017 30.9 730.5 761.4Net book value at 31 December 2017 63.5 357.1 420.6
CostAt 1 January 2018 94.4 1,087.6 1,182.0Exchange adjustments 6.0 27.7 33.7Additions 3.3 85.5 88.8Disposals (0.2) (27.2) (27.4)Businesses acquired (note 10) 0.5 4.3 4.8At 31 December 2018 104.0 1,177.9 1,281.9DepreciationAt 1 January 2018 30.9 730.5 761.4Exchange adjustments 2.7 25.9 28.6Charge for the year 3.3 72.9 76.2Impairments – – –Disposals – (25.5) (25.5)At 31 December 2018 36.9 803.8 840.7Net book value at 31 December 2018 67.1 374.1 441.2
In 2017, consistent with the corporate 5x5 strategy objectives announced in 2016, the Group recorded an impairment of £8.8m of plant and equipment related to a specific service line in the Resources division that was impaired in full and £1.4m related to computer hardware.
Fixtures, fittings, plant and equipment include assets in the course of construction of £33.0m at 31 December 2018 (2017: £30.3m), mainly comprising laboratories under construction. These assets will not be depreciated until they are available for use.
The net book value of land and buildings comprised:
2018£m
2017£m
Freehold 62.6 58.4Long leasehold 1.6 1.8Short leasehold 2.9 3.3Total 67.1 63.5
Intertek Group plc Annual Report and Accounts 2018134
Financial Statements | Notes to the financial statements

8 Property, plant and equipment (continued)CommitmentsOperating lease paymentsPayments made under operating leases are recognised in the income statement on a straight-line basis over the expected term of the lease. Lease incentives received are recognised in the income statement as an integral part of the total lease expense over the term of the lease.
At 31 December, the Group had future unprovided commitments under non-cancellable operating leases due as follows:
Land and buildings
2018£m
Other2018
£m
Total2018
£m
Land and buildings
2017£m
Other2017
£m
Total2017
£m
Within one year 64.3 17.4 81.7 73.5 8.0 81.5In the second to fifth years inclusive 139.8 19.0 158.8 129.0 9.2 138.2Over five years 63.0 0.1 63.1 80.2 0.8 81.0Total 267.1 36.5 303.6 282.7 18.0 300.7
The Group leases various laboratories, testing and inspection sites, administrative offices and equipment under lease agreements which have varying terms, escalation clauses and renewal rights.
Contracts for capital expenditure which are not provided in the financial statements amounted to £5.2m (2017: £8.0m).
9 Goodwill and other intangible assetsACCOUNTING POLICYGoodwillGoodwill arises on the acquisition of businesses. Goodwill represents the difference between the cost of acquisition and the Group’s interest in the fair value of the identifiable assets and liabilities acquired.
Goodwill is stated at cost less any accumulated impairment losses. Goodwill is allocated to cash generating units (‘CGUs’) and is not amortised but is tested annually for impairment.
Acquisitions on or after 1 January 2010From 1 January 2010, the Group has prospectively applied IFRS 3 Business Combinations (revised 2008). Business combinations are accounted for using the acquisition method at the acquisition date, which is the date on which control is obtained.
The Group measures goodwill as the fair value of the consideration transferred less the net recognised amount (generally fair value) of the identifiable assets acquired and liabilities assumed, all measured as of the acquisition date.
Costs related to the acquisition, other than those associated with the issue of debt or equity securities, are expensed as incurred. Costs relating to acquisitions are shown in Separately Disclosed Items.
Any contingent consideration payable is recognised at fair value at the acquisition date with subsequent changes recognised in profit or loss.
If at the reporting date the fair values of the acquiree’s identifiable assets, liabilities and contingent liabilities can only be established provisionally, then these values are used. Adjustments to the fair values can be made within 12 months of the acquisition date and are taken as adjustments to goodwill.
Acquisitions between 1 January 2004 and 31 December 2009For acquisitions between 1 January 2004 and 31 December 2009, goodwill represents the excess of the cost of the acquisition over the Group’s interest in the recognised amount (generally fair value) of the identifiable assets, liabilities and contingent liabilities of the acquiree.
Transaction costs, other than those associated with the issue of debt or equity securities, that the Group incurred in connection with business combinations were capitalised as part of the cost of the acquisition.
The Group has taken advantage of the exemption permitted by IFRS 1 and has not restated goodwill on acquisitions prior to 1 January 2004, the date of transition to IFRS. In respect of acquisitions prior to 1 January 2004, goodwill represents the amount recognised under the Group’s previous accounting framework.
Intertek Group plc Annual Report and Accounts 2018 135
Financial Statements

NOTES TO THE FINANCIAL STATEMENTScontinued
9 Goodwill and other intangible assets (continued)Other intangible assetsWhen the Group makes an acquisition, management review the business and assets acquired to determine whether any intangible assets should be recognised separately from goodwill. If, based on management’s judgement, such an asset is identified, then it is valued by discounting the probable future cash flows expected to be generated by the asset, over the estimated life of the asset. Where there is uncertainty over the amount of economic benefit and the useful life, this is factored into the calculation.
Intangible assets arising on acquisitions and computer software are stated at cost less accumulated amortisation and accumulated impairment losses. Identifiable intangibles are those which can be sold separately or which arise from legal rights regardless of whether those rights are separable, and which have finite useful lives.
Amortisation is charged to the income statement on a straight-line basis over the estimated useful lives. The estimated useful lives are as follows:
Computer software Up to 7 yearsCustomer relationships Up to 20 years Technology and know-how Trade names
Up to 15 yearsUp to 18 years
Licences Contractual life Covenants not to compete Contractual life
ImpairmentGoodwill is not subject to amortisation and is tested annually for impairment and when circumstances indicate that the carrying value may be impaired.
Other intangible assets are subject to amortisation and are reviewed for impairment whenever events or changes in circumstances indicate that the amount carried in the statement of financial position may be less than its recoverable amount.
Any impairment is recognised in the income statement. Impairment is determined for goodwill by assessing the recoverable amount of each asset or group of assets, i.e. cash generating unit, to which the goodwill relates. A CGU represents an asset grouping at the lowest level for which there are separately identifiable cash flows.
The recoverable amount of an asset or a CGU is the greater of its fair value less costs to sell and value in use. In assessing value in use, the estimated future cash flows are discounted to their present value using a pre-tax discount rate that reflects current market assessments of the time value of money and the risks specific to the asset. The estimation process is complex due to the inherent risks and uncertainties and if different estimates were used this could materially change the projected value of the cash flows. An impairment loss in respect of goodwill is not reversed.
Intertek Group plc Annual Report and Accounts 2018136
Financial Statements | Notes to the financial statements

9 Goodwill and other intangible assets (continued)INTANGIBLESThe intangibles employed by the business are analysed below:
Other intangible assets
Goodwill£m
Customerrelationships
£mLicences
£m
Other acquisition intangibles
£m
Computer software
£m
Total otherintangible
assets£m
CostAt 1 January 2017 1,138.6 351.1 9.4 18.9 167.5 546.9Exchange adjustments (60.5) (30.0) (0.4) 12.4 (12.9) (30.9)Additions – 4.9 – – 21.2 26.1Disposal – (0.1) – – (1.4) (1.5)Businesses acquired (note 10) 28.1 5.2 – 0.7 0.1 6.0At 31 December 2017 1,106.2 331.1 9.0 32.0 174.5 546.6Amortisation and impairment lossesAt 1 January 2017 552.5 238.3 9.4 18.4 82.0 348.1Exchange adjustments (25.9) (9.0) (0.4) 0.2 (5.4) (14.6)Charge for the year – 14.5 – 1.5 12.2 28.2Disposal – – – – (1.3) (1.3)Impairment – – – – 8.0 8.0At 31 December 2017 526.6 243.8 9.0 20.1 95.5 368.4Net book value at 31 December 2017 579.6 87.3 – 11.9 79.0 178.2
CostAt 1 January 2018 1,106.2 331.1 9.0 32.0 174.5 546.6Exchange adjustments 41.8 11.9 0.3 1.3 9.3 22.8Additions – – 2.2 – 22.2 24.4Transfers (8.3) 10.4 – 1.3 – 11.7Reclassifications – 7.4 – (7.4) – –Disposal – – – – (0.6) (0.6)Businesses acquired (note 10) 278.3 91.8 – 52.1 0.2 144.1At 31 December 2018 1,418.0 452.6 11.5 79.3 205.6 749.0AmortisationAt 1 January 2018 526.6 243.8 9.0 20.1 95.5 368.4Exchange adjustments 16.5 8.4 0.2 0.8 4.7 14.1Transfers – 0.3 – 0.2 – 0.5Charge for the year – 19.4 0.4 4.8 12.5 37.1Disposal – – – – (0.6) (0.6)At 31 December 2018 543.1 271.9 9.6 25.9 112.1 419.5Net book value at 31 December 2018 874.9 180.7 1.9 53.4 93.5 329.5
Other intangible assets Computer software additions of £22.2m (2017: £21.2m) relates to separately acquired computer software of £6.8m and internally developed intangible assets of £15.4m. Licence additions of £2.2m (2017: £nil) relates to separately acquired intangible assets.
The other acquisition intangibles of £53.4m (2017: £11.9m) consist of guaranteed income, order backlog, covenants not to compete and know-how. The average remaining amortisation period for customer relationships is eight years (2017: six years).
Computer software net book value of £93.5m at 31 December 2018 (2017: £79.0m) includes software in construction of £48.5m (2017: £38.5m). Research and development expenditure of £31.6m (2017: £26.9m) was recognised as an expense in the year.
GoodwillGoodwill arising from acquisitions in the current and prior year has been allocated to reportable segments as follows:
2018£m
2017£m
Products 275.0 29.0Trade 3.3 (0.9)Resources – –At 31 December 278.3 28.1
Intertek Group plc Annual Report and Accounts 2018 137
Financial Statements

NOTES TO THE FINANCIAL STATEMENTScontinued
9 Goodwill and other intangible assets (continued)Goodwill (continued)The total carrying amount of goodwill by CGU is as follows, which is also used for the assessment of the Group’s impairment review.
2018£m
2017£m
Industry Services 15.2 14.7Business Assurance 286.5 12.4Food & AgriWorld 17.4 17.3Caleb Brett 57.3 52.6Government & Trade Services 0.8 0.8Minerals 38.5 39.7Softlines 6.3 6.3Hardlines 9.4 9.4Electrical & Wireless 90.0 88.6Transportation Technologies 45.2 43.1Building & Construction 226.4 215.3Chemicals & Pharma/Health, Environmental & Regulatory 81.9 79.4Net book value at 31 December* 874.9 579.6
* All goodwill is recorded in local currency. Additions during the year are converted at the exchange rate on the date of the transaction and the goodwill at the end of the year is stated at closing exchange rates.
Impairment reviewIn order to determine whether impairments are required, the Group estimates the recoverable amount of each CGU. The calculation is based on projecting future cash flows over a five-year period and using a terminal value to incorporate expectations of growth thereafter. A discount factor is applied to obtain a value in use which is the recoverable amount. Goodwill arising in year from acquisitions is assessed for impairment separately from the above CGUs and on an acquisition-by-acquisition basis. No impairments were required on goodwill arising in 2018.
Key assumptionsThe key assumptions include the rate of revenue and profit growth within each of the territories and business lines in which the Group operates. These are based on the Group’s approved budget and five-year Strategic Plan. The long-term growth rate is also key since it is used in the perpetuity calculations. Finally, the discount rate used to bring the cash flow back to a present value varies depending on the location of the operation and the nature of the operations. The estimated future cash flows are discounted to their present value using a discount rate that reflects current market assessments of the time value of money and the risks specific to the asset.
The calculation of the value in use is sensitive to long-term growth rates and discount rates. Long-term growth rates predict growth beyond the Group’s planning cycle, and range from 1.8% to 2.5% (2017: 1.7% to 2.5%). The discount rate for each CGU reflects the Group’s weighted average cost of capital adjusted for the risks specific to the CGU. Pre-tax discount rates ranged from 9.1% to 10.3% (2017: 9.6% to 11.9%).
Sensitivity analysisNone of the reasonable downside sensitivity scenarios on key assumptions would cause the carrying amount of each CGU to exceed its recoverable amount. The sensitivities modelled by management include:
(i) Assuming revenues decline each year by 1% in 2020 to 2023 from the 2019 budgeted revenues, with margins increasing with base assumptions.
(ii) Assuming zero growth in operating profit margins in 2019 to 2023 with revenues increasing per base assumptions.
(iii) Assuming an increase in the discount rates used by 1%.
Management considers that the likelihood of any or all of the above scenarios occurring is low.
Intertek Group plc Annual Report and Accounts 2018138
Financial Statements | Notes to the financial statements

10 AcquisitionsACQUISITIONS IN 2018On 20 August 2018, the Group acquired Alchemy Investment Holdings, Inc. ('Alchemy'), an industry leader in People Assurance solutions for the food industry, for an estimated purchase price of £378.5m, (£375.3m net of cash acquired), generating goodwill of £270.6m.
On 6 March 2018, the Group acquired Aldo Abela Surveys Limited ('AAS'), a leading provider of quality and quantity cargo inspection services, based in Malta. On 30 April 2018, the Group acquired Proasem S.A.S. ('Proasem'), a leading provider of laboratory testing, inspection, metrology and training services, based in Colombia. On 5 June 2018, the Group acquired NTA Monitor Limited ('NTA'), a leading network security and assurance services provider, based in the UK and Malaysia. The estimated purchase price for these three acquisitions was £15.7m (£13.3m net of cash acquired, of which £0.7m has been paid in January 2019), generating goodwill of £7.7m.
Provisional details of the net assets acquired and fair value adjustments are set out in the following tables. These analyses are provisional and amendments may be made to these figures in the 12 months following the date of acquisition.
2018
Alchemy Investment Holdings, Inc.
Total
Book value prior to
acquisition£m
Provisional fair value
adjustments£m
Fair value to Group on acquisition
£m
Property, plant and equipment 1.8 – 1.8Goodwill 20.9 249.7 270.6Other intangible assets 14.9 123.0 137.9Inventories 2.1 (1.7) 0.4Trade and other receivables 10.3 (0.6) 9.7Trade and other payables (23.7) 10.1 (13.6)Deferred tax liabilities 0.5 (32.0) (31.5)Net assets acquired 26.8 348.5 375.3
2018
Others
Total
Book value prior to
acquisition£m
Provisional fair value
adjustments£m
Fair value to Group on acquisition
£m
Property, plant and equipment 3.2 (0.2) 3.0Goodwill – 7.7 7.7Other intangible assets – 6.2 6.2Trade and other receivables 2.9 (0.4) 2.5Trade and other payables (4.2) (0.3) (4.5)Deferred tax liabilities – (1.6) (1.6)Net assets acquired 1.9 11.4 13.3
Goodwill and intangible assetsThe total goodwill arising on acquisitions made during 2018 was £278.3m, none of which is expected to be deductible for tax purposes. The goodwill arising represents the value of the assembled workforce and the benefits the Company expects to gain from increasing its presence in the relevant sectors in which the acquired businesses operate. The goodwill recognised following the acquisition of Alchemy represents the significant synergies and scalability the Alchemy platforms can provide to existing and new customers and markets across the world. The intangible assets of £144.1m primarily represent the value placed on customer relationships, trade names and technology. The deferred tax thereon was £33.1m.
Consideration paidThe total cash consideration paid for the acquisitions in the year was £393.5m (2017: £29.5m), with further contingent consideration payable of £0.7m (2017: £9.0m) which is recognised in note 13. Cash consideration includes cash and debt acquired of £5.6m. The estimated purchase price net of cash and debt acquired was £388.6m, of which £0.7m has been paid in January 2019.
Contribution of acquisitions to revenue and profitsIn total, acquisitions made during 2018 contributed revenues of £18.5m and a statutory net loss after tax of £4.3m from their respective dates of acquisition to 31 December 2018. The Group revenue and statutory profit after tax for the year ended 31 December 2018 would have been £2,829.6m and £298.7m respectively if all the acquisitions were assumed to have been made on 1 January 2018.
Intertek Group plc Annual Report and Accounts 2018 139
Financial Statements

NOTES TO THE FINANCIAL STATEMENTScontinued
10 Acquisitions (continued)ACQUISITIONS IN 2017On 31 March 2017, the Group acquired KJ Tech Services GmbH ('KJ Tech'), a leading provider of vehicle, component and fuel testing services based in Germany, for a purchase price of £12.8m (£12.5m net of cash acquired), generating goodwill of £7.6m.
On 8 December 2017, the Group acquired Acumen Security LLC ('Acumen'), a leading provider of Security Certification solutions for products, headquartered in Maryland, USA, for a purchase price of £25.6m (£23.8m net of cash acquired), generating goodwill of £16.9m.
The fair value adjustments 12 months from the date of acquisition were:
2018 2017
Acumen Security LLC
Total
Book value prior to
acquisition£m
Fair value adjustments
£m
Fair value to Group on acquisition
£m
Book value prior to
acquisition£m
Provisional fair value
adjustments£m
Provisional fair value to Group on acquisition
£m
Property, plant and equipment – – – – – –Goodwill – 16.9 16.9 – 23.4 23.4Other intangible assets – 9.5 9.5 – – –Trade and other receivables 0.8 0.6 1.4 0.8 – 0.8Trade and other payables (0.3) (1.1) (1.4) (0.3) – (0.3)Deferred tax liabilities – (2.6) (2.6) – – –Net assets acquired 0.5 23.3 23.8 0.5 23.4 23.9
2018 2017
KJ Tech Services GmbH
Total
Book value prior to
acquisition£m
Fair value adjustments
£m
Fair value to Group on acquisition
£m
Book value prior to
acquisition£m
Provisional fair value
adjustments£m
Provisional fair value to Group on acquisition
£m
Property, plant and equipment 0.6 – 0.6 0.6 – 0.6Goodwill – 7.6 7.6 – 7.6 7.6Other intangible assets 0.1 5.9 6.0 0.1 5.9 6.0Trade and other receivables 0.6 – 0.6 0.6 – 0.6Trade and other payables (0.3) – (0.3) (0.3) – (0.3)Deferred tax liabilities – (2.0) (2.0) – (2.0) (2.0)Net assets acquired 1.0 11.5 12.5 1.0 11.5 12.5
Goodwill in respect of 2017 acquisitions decreased by £6.5m.
Key assumptionsThe key assumptions in deriving the contingent consideration to be recognised include the weighted probability of making a payout and the discount rate used to bring the cash flow back to present values. The discount rates used for the calculation are aligned with the discount rates used for impairment purposes as set out in Note 9.
Sensitivity analysisIt is estimated that an increase of 1% in the discount rate used to calculate the contingent consideration would have decreased the financial liability by £0.4m, and a 1% decrease in the discount rate would have increased the financial liability by £0.4m. It has also been estimated that an increase of 10% in the probability used to calculate the contingent consideration would have increased the financial liability by £0.2m, whilst a decrease of 10% in the probability used would have decreased the financial liability by £1.5m.
Intertek Group plc Annual Report and Accounts 2018140
Financial Statements | Notes to the financial statements

11 Trade and other receivablesACCOUNTING POLICYTrade receivables are recognised initially at the value of the invoice sent to the customer and subsequently at the amounts considered recoverable (amortised cost). Estimates are used in determining the level of receivables that will not, in the opinion of the Directors, be collected. The Group applies the simplified approach permitted by IFRS 9, which requires the use of the lifetime expected loss provision for all receivables, including contract assets. The provision calculations are based on historic credit losses and specific country-risk classifications with higher default rates applied to older balances. This approach is followed for all receivables unless there are specific circumstances, such as the bankruptcy of a customer or emerging market risks, which would render the receivable irrecoverable and therefore require a specific provision. A provision is made against trade receivables and contract assets until such time as the Group believes the amount to be irrecoverable, after which the trade receivable or contract assets balance is written off.
In 2017, under IAS 39, impairment losses only related to trade receivables and were calculated based on historical default rates. No impairment allowance was made for trade receivables less than six months outstanding and the Group provided for trade receivables over 12 months old that were considered irrecoverable, 25% of balances 6 to 12 months old and specific provisions for known doubtful debts regardless of age.
TRADE AND OTHER RECEIVABLESTrade and other receivables are analysed below:
2018£m
2017£m
Trade receivables 485.2 469.6Contract assets 99.7 90.4Other receivables 62.7 51.3Prepayments 36.8 30.4Total trade and other receivables 684.4 641.7
Trade receivables and contract assets are shown net of allowance for impairment losses of £16.3m (2017: £24.0m) and £9.6m (2017: £nil) respectively and are all expected to be recovered within 12 months. Impairment on trade receivables and contract assets charged as part of operating costs was £1.3m (2017: £8.8m) and £3.5m (2017: £nil) respectively.
There is no material difference between the above amounts for trade and other receivables and their fair value, due to their short-term duration. There is no concentration of credit risk with respect to trade receivables as the Group has a large number of customers who are internationally dispersed.
The ageing of trade receivables and contract assets at the reporting date was as follows:
2018£m
2017£m
Under 3 months 489.1 473.3Between 3 and 6 months 54.2 52.9Between 6 and 12 months 30.0 24.7Over 12 months 37.5 33.1Gross trade receivables and contract assets 610.8 584.0Allowance for impairment (25.9) (24.0)Trade receivables and contract assets, net of allowance 584.9 560.0
Included in trade receivables under three months of £404.9m (2017: £397.0m) are trade receivables of £351.9m (2017: £340.6m) that are not yet due for payment.
The movement in the allowance for impairment in respect of trade receivables and contract assets during the year was as follows:
Impairment allowance for doubtful trade receivables and contract assets2018
£m2017
£m
At 1 January 24.0 23.9Exchange differences 0.3 (2.0)Acquisitions 0.6 –Impairment loss recognised 4.8 8.8Receivables written off (3.8) (6.7)At 31 December 25.9 24.0
Sensitivity analysisTrade receivables and contract assets are assessed for impairment using a calculated credit loss assumption. A 0.25% variance in the assumed credit risk factor would impact impairment by £1.9m. There were no material individual impairments of trade receivables or contract assets.
Intertek Group plc Annual Report and Accounts 2018 141
Financial Statements

NOTES TO THE FINANCIAL STATEMENTScontinued
12 Trade and other payablesACCOUNTING POLICYTrade payablesTrade payables are recognised at the value of the invoice received from a supplier. The carrying value of trade payables is considered approximate to fair value.
Put option over non-controlling interestPut options held by non-controlling interests that arise on acquisition are recognised initially at the present value of the redemption amount. They are subsequently measured at amortised cost using the effective interest method. The discount is unwound through SDIs as a finance charge.
TRADE AND OTHER PAYABLESTrade and other payables are analysed below:
Current2018
£m
Current2017
£m
Non-current2018
£m
Non-current2017
£m
Trade payables 154.0 126.7 – –Other payables 57.3 45.5 18.6 17.5Accruals 240.0 227.1 2.3 3.6Contract liabilities 63.8 52.9 5.6 0.5Total trade and other payables 515.1 452.2 26.5 21.6
The Group’s exposure to liquidity risk related to trade payables is disclosed in note 14. £40.8m of contract liabilities at the end of 2017 was recognised in revenue in 2018. The key assumptions in arriving at the value of the put options over shares held by non-controlling interests are the performance of those businesses; the risk-adjusted discount rate taking into account the risk-free rate and the gross domestic product growth in the countries of those underlying businesses.
13 ProvisionsACCOUNTING POLICYA provision is recognised in the balance sheet when the Group has a present legal or constructive obligation that can be estimated reliably as a result of a past event, and it is probable that an outflow of economic benefits will be required to settle the obligation.
PROVISIONSContingent
consideration£m
Claims£m
Other£m
Total£m
At 1 January 2018 14.7 14.0 12.6 41.3Exchange adjustments 0.9 – 0.8 1.7Provided in the year: – 1.8 13.8 15.6 in respect of current year acquisitions 0.7 – – 0.7 in respect of prior year acquisitions 8.2 – – 8.2Released during the year (2.2) (2.9) – (5.1)Utilised during the year (5.6) (2.5) (11.5) (19.6)At 31 December 2018 16.7 10.4 15.7 42.8Included in:Current liabilities 0.7 10.4 15.7 26.8Non-current liabilities 16.0 – – 16.0At 31 December 2018 16.7 10.4 15.7 42.8
The maximum contingent consideration, on a discounted basis, that could be paid in relation to acquisitions is £19.2m.
The Group is involved in various claims and lawsuits incidental to the ordinary course of its business. The outcome of such litigation and the timing of any potential liability cannot be readily foreseen, as it is often subject to legal proceedings. Based on information currently available, the Directors consider that the cost to the Group of an unfavourable outcome arising from such litigation is unlikely to have a materially adverse effect on the financial position of the Group in the foreseeable future.
The provision for claims of £10.4m (2017: £14.0m) represents an estimate of the amounts payable in connection with identified claims from customers, former employees and other plaintiffs and associated legal costs. The timing of the cash outflow relating to the provisions is uncertain, but is likely to be within one year. Details of contingent liabilities in respect of claims are set out in note 22.
The other provision of £15.7m (2017: £12.6m) includes restructuring provisions. The timing of the cash outflow is uncertain, but is likely to be within one year.
Intertek Group plc Annual Report and Accounts 2018142
Financial Statements | Notes to the financial statements

14 Borrowings and financial instrumentsACCOUNTING POLICYNet financing costsNet financing costs comprise interest expense on borrowings; facility fees; interest receivable on funds invested; net foreign exchange gains or losses; interest income and expense relating to pension assets and liabilities; unrealised market or fair value gains or losses on financial assets or liabilities, including contingent consideration; and gains and losses on hedging instruments that are recognised in the income statement. Interest income and interest expense are recognised as they accrue using the effective interest rate method.
Loans and receivablesLoans and receivables comprise trade and other receivables. Loans and receivables are recognised initially at fair value and subsequently at amortised cost less impairment losses (including bad debt provision).
Cash and cash equivalentsCash and cash equivalents comprise cash balances and call deposits. Bank overdrafts that are repayable on demand and form an integral part of the Group’s cash management are included as a component of cash and cash equivalents for the purpose of the statement of cash flows. Net debt comprises borrowings less cash and cash equivalents.
Non-derivative financial liabilitiesTrade and other payables are recognised initially at fair value and subsequently at their amortised cost.
Interest-bearing borrowings are initially recognised at fair value less transaction costs. Subsequent to initial recognition, interest-bearing borrowings are stated at amortised cost with any difference between cost and redemption value being recognised in the income statement over the period of the borrowings on an effective interest basis.
The fair value of put option liabilities over non-controlling interests is calculated using a present value calculation, incorporating observable and non-observable inputs. This valuation technique has been adopted as it most closely mirrors the contractual arrangement.
Derivative financial instrumentsThe Group uses derivative financial instruments, including cross currency interest rate swaps and foreign currency forwards, to hedge economically its exposure to foreign exchange and interest rate risks arising from operational, financing and investment activities. In accordance with its treasury policy, the Group does not hold or issue derivative financial instruments for speculative purposes.
Derivative financial instruments are recognised initially and subsequently at fair value; attributable transaction costs are recognised in profit or loss when incurred. The gain or loss on remeasurement to fair value at each period end is recognised immediately in the income statement except where derivatives qualify for hedge accounting.
The fair value of cross currency interest rate swaps is estimated using the present value of the estimated future cash flows based on observable yield curves.
The fair value of foreign currency forwards is estimated using present value of future cash flows based on the forward exchange rates at the balance sheet date.
HedgingHedge of monetary assets and liabilitiesWhere a derivative financial instrument is used economically to hedge the foreign exchange exposure of a recognised monetary asset or liability, no hedge accounting is applied and any gain or loss on the hedging instrument is recognised in the income statement in the same caption as the foreign exchange on the related item.
Hedge of net investment in foreign operationsThe Group is exposed to foreign exchange risk exposure arising from its net investment in foreign currency operations and net assets. The Group uses a combination of debt and cross currency interest rate swaps to hedge foreign exchange risks.
The portion of the gain or loss on an instrument designated as a hedge of a net investment in a foreign operation that is determined to be an effective hedge is recognised directly in equity in the translation reserve. The value in relation to the hedge instrument that is held within the cumulative foreign currency translation reserve is recycled through the income statement. If the instrument is no longer deemed effective, then future movements in fair value are posted to the income statement.
Cash flow hedges Cash flow hedges comprise derivative financial instruments designated in a hedging relationship to manage interest rate risk and foreign exchange risk to which the cash flows of certain assets and liabilities are exposed. The Group is exposed to the variability in cash flows arising from the foreign exchange risk exposure in a USD private placement bond. In accordance with the Group’s hedging strategy, the Group has cross currency interest rates swaps designated as cash flow hedges.
The effective portion of changes in the fair value of the derivative that is designated and qualifies for hedge accounting is recognised in other comprehensive income. The value in relation to the hedge instrument that is held within the cumulative cash flow hedge reserve (disclosed within other reserves) is recycled through the income statement. If the instrument is no longer deemed effective, then future movements in fair value are posted to the income statement.
Intertek Group plc Annual Report and Accounts 2018 143
Financial Statements

NOTES TO THE FINANCIAL STATEMENTScontinued
14 Borrowings and financial instruments (continued)ImpairmentA financial asset is assessed for impairment at each reporting date by application of an expected loss model in line with IFRS 9 requirements. In previous periods an assessment was made to determine whether there was any objective evidence that a balance was impaired. In line with IAS 39, a financial asset was considered to be impaired if objective evidence indicated that one or more events had a negative effect on the estimated future cash flows of that asset.
Net financing costsNet financing costs are shown below:
Recognised in income statement2018
£m2017
£m
Finance incomeInterest on bank balances 1.8 1.2Total finance income 1.8 1.2Finance expenseInterest on borrowings (26.2) (24.8)Net pension interest cost (note 16) (0.4) (0.7)Foreign exchange differences on revaluation of net monetary assets and liabilities 1.5 (2.0)Facility fees and other* (8.4) (3.1)Total finance expense* (33.5) (30.6)Net financing costs* (31.7) (29.4)* Includes £6.4m (2017: £0.5m) relating to SDIs.
Analysis of net debt2018
£m2017
£m
Cash and cash equivalents per the Statement of Financial Position 206.9 137.0Overdrafts (3.7) (1.1)Cash per the Statement of Cash Flows 203.2 135.9
The components of net debt are outlined below:
1 January 2018
£mCash flow
£m
Non-cash movements
£m
Exchange adjustments
£m
31 December 2018
£m
Cash 135.9 55.2 – 12.1 203.2Borrowings:Revolving credit facility US$800m 2021 (153.9) (223.8) – (7.1) (384.8)Bilateral term loan facilities US$100m 2018 (74.6) 74.6 – – –Senior notes US$20m 2019 (15.0) – – (0.8) (15.8)Senior notes US$150m 2020 (112.0) – – (6.6) (118.6)Senior notes US$15m 2021 (11.1) – – (0.7) (11.8)Senior notes US$140m 2022 (104.5) – – (6.2) (110.7)Senior notes US$40m 2023 (29.8) – – (1.8) (31.6)Senior notes US$125m 2024 (93.4) – – (5.5) (98.9)Senior notes US$40m 2025 (29.9) – – (1.8) (31.7)Senior notes US$75m 2026 (55.9) – – (3.4) (59.3)Other* 0.1 (116.3) (0.8) (1.2) (118.2)Total borrowings (680.0) (265.5) (0.8) (35.1) (981.4)Total net debt (544.1) (210.3) (0.8) (23.0) (778.2)
* Includes other uncommitted borrowings of £118.6m and facility fees of £0.9m (2017: £2.1m).
Intertek Group plc Annual Report and Accounts 2018144
Financial Statements | Notes to the financial statements

14 Borrowings and financial instruments (continued)
1 January 2017
£mCash flow
£m
Non-cash movements
£m
Exchange adjustments
£m
31 December 2017
£m
Cash 158.8 7.0 – (29.9) 135.9Borrowings:Revolving credit facility US$800m 2021 (242.2) 73.8 – 14.5 (153.9)Bilateral term loan facilities US$100m 2018 (81.8) – – 7.2 (74.6)Senior notes US$100m 2017 (81.8) 75.1 – 6.7 –Senior notes US$20m 2019 (16.4) – – 1.4 (15.0)Senior notes US$150m 2020 (122.7) – – 10.7 (112.0)Senior notes US$15m 2021 (12.2) – – 1.1 (11.1)Senior notes US$140m 2022 (114.5) – – 10.0 (104.5)Senior notes US$40m 2023 (32.7) – – 2.9 (29.8)Senior notes US$125m 2024 (102.3) – – 8.9 (93.4)Senior notes US$40m 2025 (32.7) – – 2.8 (29.9)Senior notes US$75m 2026 (61.3) – – 5.4 (55.9)Other* (1.9) 2.4 (0.7) 0.3 0.1Total borrowings (902.5) 151.3 (0.7) 71.9 (680.0)Total net debt (743.7) 158.3 (0.7) 42.0 (544.1)
*Includes facility fees of £2.1m.
BORROWINGSBorrowings are split into current and non-current as outlined below:
Current2018
£m
Current2017
£m
Non-current2018
£m
Non-current2017
£m
Senior term loans and notes 15.0 73.9 846.8 604.0Other borrowings 119.6 2.1 – –Total borrowings 134.6 76.0 846.8 604.0
Analysis of debt2018
£m2017
£m
Debt falling due:In one year or less 134.6 76.0Between one and two years 118.2 14.2Between two and five years 538.9 380.9Over five years 189.7 208.9Total borrowings 981.4 680.0
Description of borrowingsTotal undrawn committed borrowing facilities as at 31 December 2018 were £247.9m (2017: £443.2m).
US$800m revolving credit facilityThe Group’s principal bank facility comprises a US$800m multi-currency revolving credit facility. In July 2016, US$672m of the facility was extended to July 2021. Advances under the facility bear interest at a rate equal to LIBOR, or their local currency equivalent, plus a margin, depending on the Group’s leverage. Drawings under this facility at 31 December 2018 were £384.8m (2017: £153.9m).
Bilateral term loan facility 1On 21 December 2012 the Group signed a US$20m bilateral term loan which was increased on 4 April 2014 to US$40m. This facility was further increased in November 2015 to US$100m. This facility was fully repaid in June 2018 and was no longer available at 31 December 2018. Drawings under this facility at 31 December 2018 were £nil (2017: £74.6m).
Intertek Group plc Annual Report and Accounts 2018 145
Financial Statements

NOTES TO THE FINANCIAL STATEMENTScontinued
14 Borrowings and financial instruments (continued)BORROWINGS (CONTINUED)Private placement bondsIn December 2010 the Group issued US$250m of senior notes. These notes were issued in two tranches with US$100m repaid on 15 December 2017 at a fixed annual interest rate of 3.2% and US$150m repayable on 15 December 2020 at a fixed annual interest rate of 3.91%.
In October 2011 the Group issued US$265m of senior notes. These notes were issued in three tranches with US$20m repayable on 18 January 2019 at a fixed annual interest rate of 3.0%, US$140m repayable on 18 January 2022 at a fixed annual interest rate of 3.75% and US$105m repayable on 18 January 2024 at a fixed annual interest rate of 3.85%.
In February 2013 the Group issued US$80m of senior notes. These notes were issued in two tranches with US$40m repayable on 14 February 2023 at a fixed annual interest rate of 3.10% and US$40m repayable on 14 February 2025 at a fixed annual interest rate of 3.25%.
In July 2014 the Group issued US$110m of senior notes. These notes were issued in four tranches with US$15m repayable on 31 July 2021 at a fixed annual interest rate of 3.37%, US$20m repayable on 31 July 2024 at a fixed annual interest rate of 3.86%, US$60m repayable on 31 October 2026 at a fixed annual interest rate of 4.05% and US$15m repayable on 31 December 2026 at a fixed annual interest rate of 4.10%.
FINANCIAL RISKSDetails of the Group’s treasury controls, exposures and the policies and processes for managing capital and credit, liquidity, interest rate and currency risk are set out below, and in the Strategic Report – Financial Review that starts on page 60.
Credit risk Exposure to credit riskCredit risks arise mainly from the possibility that customers may not be able to settle their obligations as agreed. The Group monitors the creditworthiness of customers on an ongoing basis. The Group’s credit risk is diversified due to the large number of entities, industries and regions that make up the Group’s customer base.
The carrying amount of financial assets represents the maximum credit exposure. At the reporting date this was as follows:
2018£m
2017£m
Trade receivables, net of allowance (note 11) 485.2 469.6Cash and cash equivalents 203.2 135.9Total 688.4 605.5
The maximum exposure to credit risk for trade receivables at the reporting date by geographic region was as follows:
2018£m
2017£m
Asia Pacific 134.1 127.1Americas 191.8 180.6Europe, Middle East and Africa 159.3 161.9Total 485.2 469.6
Counterparty riskCash and cash equivalents and available borrowing facilities are at risk in the event that the counterparty is not able to meet its obligations in regards to the cash held or facilities available to the Group. The Group also enters into transactions with counterparties in relation to derivative financial instruments. If the counterparty was not able to meet its obligations, the Group may be exposed to additional foreign currency or interest rate risk. Counterparty credit risk inherent in all hedge relationships is monitored throughout the period of the hedge but this risk is not expected to be significant.
The Group, wherever possible, enters into arrangements with counterparties who have robust credit standing, which the Group defines as a financial institution with a credit rating of at least investment grade. The Group has existing banking relationships with a number of ‘relationship banks’ that meet this criterion, and seeks to use their services wherever possible while avoiding excessive concentration of credit risk. Given the diverse geographic nature of the Group’s activities, it is not always possible to use a relationship bank. Therefore the Group has set limits on the level of deposits to be held at non-relationship banks to minimise the risk to the Group. It is also Group policy to remit any excess funds from local entities back to Intertek Group Treasury in the UK. Given the controls in place, and based on a current assessment of our banking relationships, management does not expect any counterparty to fail to meet its obligations.
Intertek Group plc Annual Report and Accounts 2018146
Financial Statements | Notes to the financial statements

14 Borrowings and financial instruments (continued)Liquidity riskLiquidity risk is the risk that the Group will not be able to meet its obligations as and when they fall due. The Group’s policy is to:
• ensure sufficient liquidity is available to Group companies in the amounts, currencies and locations required to support the Group’s operations;
• ensure the Group has adequate available sources of funding to protect against unforeseen internal and external events; and• avoid excess liquidity which restricts growth and impacts the cost of financing.
To ensure this policy is met, the Group monitors cash balances on a daily basis, projects cash requirements on a rolling basis and funds itself using debt instruments with a range of maturities.
The following are the contractual cash flows of financial liabilities/(assets) including interest (for floating rate instruments, interest payments are based on the interest rate at 31 December 2018). The table has been updated to include cross currency interest swaps for 2018 and 2017:
2018
Carrying amount
£m
Contractual cash flows
£m
Six months or less
£m
6-12 months
£m1-2 years
£m2-5 years
£m
More than five years
£m
Non-derivative financial liabilitiesSenior term loans and notes 861.9 863.3 15.8 – 515.3 241.2 91.0Other loans 119.5 119.5 118.6 0.9 – – –Trade payables (note 12) 154.0 154.0 141.2 11.1 1.4 0.2 0.1Put option liability over non-controlling
interest 9.6 9.9 – – – 9.9 –1,145.0 1,146.7 275.6 12.0 516.7 251.3 91.1
Derivative financial liabilities/(assets)
Foreign currency forwards Outflow 0.3 360.2 360.2 – – – – Inflow – (359.9) (359.9) – – – –Cross currency interest rate swaps Outflow 7.7 88.4 0.9 0.9 86.6 – – Inflow – (85.3) (1.5) (1.5) (82.3) – –
8.0 3.4 (0.3) (0.6) 4.3 – –Total 1,153.0 1,150.1 275.3 11.4 521.0 251.3 91.1
2017
Carrying amount
£m
Contractual cash flows
£m
Six months or less
£m
6-12 months
£m1-2 years
£m2-5 years
£m
More than five years
£m
Non-derivative financial liabilitiesSenior term loans and notes 677.9 777.4 10.5 85.1 164.8 327.5 189.5Other loans 2.1 2.1 – 2.1 – – –Trade payables (note 12) 126.7 126.7 122.1 2.9 1.3 0.3 0.1Put option liability over non-controlling
interest 8.7 9.2 – – – 9.2 –
815.4 915.4 132.6 90.1 166.1 337.0 189.6
Derivative financial liabilities/(assets)
Foreign currency forwards Outflow – 440.9 440.9 – – – – Inflow (1.0) (441.9) (441.9) – – – –Cross currency interest rate swaps* Outflow 11.9 88.2 0.9 0.9 1.7 84.8 – Inflow – (83.4) (1.5) (1.5) (2.9) (77.5) –
10.9 3.8 (1.6) (0.6) (1.2) 7.3 –Total 826.3 919.2 131.0 89.5 164.9 334.3 189.6
* 2017 comparatives have been restated to include disclosure of the cross currency interest rate swaps in accordance with IFRS 7.
Intertek Group plc Annual Report and Accounts 2018 147
Financial Statements

NOTES TO THE FINANCIAL STATEMENTScontinued
14 Borrowings and financial instruments (continued)Interest rate riskThe Group’s objective is to manage the risk to the business from movements in interest rates, and to provide stability and predictability of the near term (12 month horizon) interest expense. Under the Group’s Treasury policy, management may fix the interest rates on up to 80% of the Group’s debt portfolio for the period of the current financial year. The Group’s debt portfolio beyond this period is to be managed within the range of a 20%-60% fixed-to-floating rate ratio. To achieve this, the Group uses bank debt facilities, US private placements and cross currency interest rate swaps.
SensitivityAt 31 December 2018, it is estimated that the impact on variable rate net debt of a general increase of 3% in interest rates would be a decrease in the Group’s profit before tax of approximately £9.6m (2017: £5.4m). This analysis assumes all other variables remain constant.
Foreign currency riskThe Group’s objective in managing foreign currency risk is to safeguard the Group’s financial assets from economic loss due to fluctuations in foreign currencies, and to protect margins on cross currency contracts and operations. To achieve this, the Group’s policy is to hedge its foreign currency exposures where appropriate.
The net assets of foreign subsidiaries represent a significant portion of the Group’s shareholders’ funds and a substantial percentage of the Group’s revenue and operating costs are incurred in currencies other than sterling. Because of the high proportion of international activity, the Group’s profit is exposed to exchange rate fluctuations. Two types of risk arise as a result: (i) translation risk, that is, the risk of adverse currency fluctuations in the translation of foreign currency operations and foreign assets and liabilities into sterling; and (ii) transaction risk, that is, the risk that currency fluctuations will have a negative effect on the value of the Group’s commercial cash flows in various currencies.
The foreign currency profiles of cash, trade receivables and payables subject to translation risk and transaction risk, at the reporting date were as follows:
2018
Carrying amount
£mSterling
£mUS dollar
£m
Chinese renminbi
£m
Hong Kong dollar
£m
Other currencies
£m
Cash 203.2 26.3 26.4 49.7 1.5 99.3Trade receivables (note 11) 485.2 42.6 162.6 48.0 15.6 216.4Trade payables (note 12) 154.0 14.0 63.0 16.4 3.4 57.2
2017
Cash 135.9 13.7 10.3 24.3 3.4 84.2Trade receivables (note 11) 469.6 43.6 156.7 44.6 14.5 210.2Trade payables (note 12) 126.7 13.6 39.8 17.1 3.5 52.7
RECOGNISED ASSETS AND LIABILITIESChanges in the fair value of foreign currency forwards that economically hedge monetary assets and liabilities in foreign currencies, and for which no hedge accounting is applied, are recognised in the income statement.
CASH FLOW HEDGEThe Group holds a US$150m fixed interest rate USD private placement bond maturing in December 2020.
A proportion of the bond is hedged using 100m USD/GBP fixed-to-fixed cross currency swaps maturing in December 2020 to eliminate the changes in the cash flows of the repayment of coupon and principal related to changes in foreign exchange rates.
The timings of both hedge and bond cash flows are expected to match since the maturity profile and coupon profile for bond and hedge matches. In 2018, £4.4m of the cash flow hedge reserve was recycled through to the income statement to offset the impact of the hedged US$100m bond. The remaining balance of the cash flow hedge reserve is expected to be recycled through to the income statement up to the expiry of the bond in December 2020.
HEDGE OF NET INVESTMENT IN FOREIGN OPERATIONSThe Group’s foreign currency denominated loans are designated as a hedge to protect the same amount of net investment in the Group's foreign currency operations and net assets, against adverse changes in exchange rates. The carrying amount of these loans at 31 December 2018 was £902.8m (2017: £580.4m).
93.8m EUR/GBP fixed-to-fixed cross currency swaps maturing in December 2020, including all coupons, are designated as a hedge to protect the same amount of net investment in the Group's Euro operations and net assets, against adverse changes in exchange rates.
A foreign exchange loss of £32.6m (2017: gain £77.3m) was recognised in the translation reserve in equity on translation of these loans to sterling and the impact of changes in fair value of the cross currency interest rate swaps.
Intertek Group plc Annual Report and Accounts 2018148
Financial Statements | Notes to the financial statements
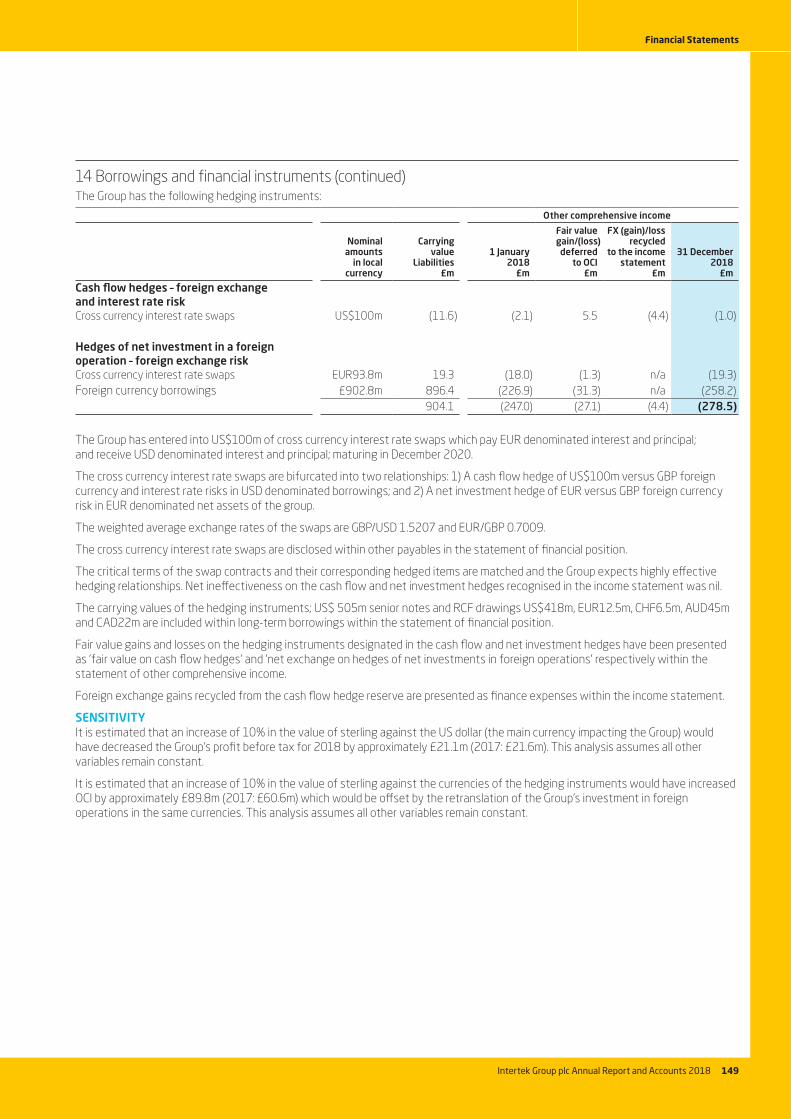
14 Borrowings and financial instruments (continued)The Group has the following hedging instruments:
Other comprehensive income
Nominalamounts
in local currency
Carryingvalue
Liabilities£m
1 January2018
£m
Fair value gain/(loss)
deferredto OCI
£m
FX (gain)/lossrecycled
to the incomestatement
£m
31 December2018
£m
Cash flow hedges – foreign exchangeand interest rate riskCross currency interest rate swaps US$100m (11.6) (2.1) 5.5 (4.4) (1.0)
Hedges of net investment in a foreign operation – foreign exchange riskCross currency interest rate swaps EUR93.8m 19.3 (18.0) (1.3) n/a (19.3)Foreign currency borrowings £902.8m 896.4 (226.9) (31.3) n/a (258.2)
904.1 (247.0) (27.1) (4.4) (278.5)
The Group has entered into US$100m of cross currency interest rate swaps which pay EUR denominated interest and principal; and receive USD denominated interest and principal; maturing in December 2020.
The cross currency interest rate swaps are bifurcated into two relationships: 1) A cash flow hedge of US$100m versus GBP foreign currency and interest rate risks in USD denominated borrowings; and 2) A net investment hedge of EUR versus GBP foreign currency risk in EUR denominated net assets of the group.
The weighted average exchange rates of the swaps are GBP/USD 1.5207 and EUR/GBP 0.7009.
The cross currency interest rate swaps are disclosed within other payables in the statement of financial position.
The critical terms of the swap contracts and their corresponding hedged items are matched and the Group expects highly effective hedging relationships. Net ineffectiveness on the cash flow and net investment hedges recognised in the income statement was nil.
The carrying values of the hedging instruments; US$ 505m senior notes and RCF drawings US$418m, EUR12.5m, CHF6.5m, AUD45m and CAD22m are included within long-term borrowings within the statement of financial position.
Fair value gains and losses on the hedging instruments designated in the cash flow and net investment hedges have been presented as 'fair value on cash flow hedges' and 'net exchange on hedges of net investments in foreign operations' respectively within the statement of other comprehensive income.
Foreign exchange gains recycled from the cash flow hedge reserve are presented as finance expenses within the income statement.
SENSITIVITYIt is estimated that an increase of 10% in the value of sterling against the US dollar (the main currency impacting the Group) would have decreased the Group’s profit before tax for 2018 by approximately £21.1m (2017: £21.6m). This analysis assumes all other variables remain constant.
It is estimated that an increase of 10% in the value of sterling against the currencies of the hedging instruments would have increased OCI by approximately £89.8m (2017: £60.6m) which would be offset by the retranslation of the Group's investment in foreign operations in the same currencies. This analysis assumes all other variables remain constant.
Intertek Group plc Annual Report and Accounts 2018 149
Financial Statements

NOTES TO THE FINANCIAL STATEMENTScontinued
14 Borrowings and financial instruments (continued)FAIR VALUESThe table below provides a comparison of book values and corresponding fair values of all the Group’s financial instruments by class.
Book value2018
£m
Fair value2018
£m
Book value2017
£m
Fair value2017
£m
Financial assetsCash and cash equivalents 203.2 203.2 135.9 135.9Trade receivables (note 11) 485.2 485.2 469.6 469.6Foreign currency forwards* – – 1.0 1.0Total financial assets 688.4 688.4 606.5 606.5Financial liabilitiesInterest-bearing loans and borrowings* 981.4 974.5 680.0 679.1Trade payables (note 12) 154.0 154.0 126.7 126.7Foreign currency forwards* 0.3 0.3 – –Put option liability over non-controlling interest 9.6 9.6 8.7 8.7Cross currency interest rate swaps*1 7.7 7.7 11.9 11.9Total financial liabilities 1,153.0 1,146.1 827.3 826.4
* Interest-bearing loans and borrowing, cross currency interest rate swaps and derivative assets/liabilities are categorised as Level 2 under which the fair value is measured using inputs other than quoted prices observable for the liability, either directly or indirectly.
1 2017 comparatives have been restated to include disclosure of the cross currency interest rate swaps in accordance with IFRS 7.
15 Capital and reservesACCOUNTING POLICYDividendsInterim dividends are recognised as a movement in equity when they are paid. Final dividends are reported as a movement in equity in the year in which they are approved by the shareholders.
Own shares held by the Employee Share Ownership Trust (‘ESOT’)Transactions of the Group-sponsored ESOT are included in the Group financial statements. In particular, the Trust’s purchases of shares in the Company are debited directly in equity to retained earnings.
Share capital
Group and Company2018
Number2018
£m2017
£m
Allotted, called up and fully paid:Ordinary shares of 1p each at start of year 161,390,540 1.6 1.6Share Awards 2,587 – –Ordinary shares of 1p each at end of year 161,393,127 1.6 1.6Shares classified in shareholders’ funds 1.6 1.6
The holders of ordinary shares are entitled to receive dividends and are entitled to vote at general meetings of the Company.
During the year, the Company issued 2,587 (2017: 3,765) ordinary shares in respect of all share plans.
Purchase of own shares for trustDuring the year ended 31 December 2018, the Company financed the purchase of 340,000 (2017: 350,000) of its own shares with an aggregate nominal value of £3,400 (2017: £3,500) for £16.7m (2017: £15.6m) which was charged to retained earnings in equity and was held by the ESOT. This trust is managed and controlled by an independent offshore trustee. During the year, 421,823 shares were utilised to satisfy the vesting of share awards (note 17). At 31 December 2018, the ESOT held 455,463 shares (2017: 541,211 shares) with an aggregate nominal value of £4,555 (2017: £5,412). The associated cash outflow of £16.7m (2017: £15.6m) has been presented as a financing cash flow.
Dividends2018
£m
2018Pence per
share2017
£m
2017Pence per
share
Amounts recognised as distributions to equity holders:Final dividend for the year ended 31 December 2016 – – 69.2 43.0Interim dividend for the year ended 31 December 2017 – – 37.8 23.5Final dividend for the year ended 31 December 2017 76.9 47.8 – –Interim dividend for the year ended 31 December 2018 51.4 31.9 – –Dividends paid 128.3 79.7 107.0 66.5
Intertek Group plc Annual Report and Accounts 2018150
Financial Statements | Notes to the financial statements

15 Capital and reserves (continued)After the reporting date, the Directors proposed a final dividend of 67.2p per share in respect of the year ended 31 December 2018, which is expected to amount to £108.5m. This dividend is subject to approval by shareholders at the Annual General Meeting and therefore, in accordance with IAS 10 Events after the reporting date, it has not been included as a liability in these financial statements. If approved, the final dividend will be paid to shareholders on 4 June 2019.
RESERVESTranslation reserveThe translation reserve comprises foreign currency differences arising from the translation of the financial statements of foreign operations as well as the translation of liabilities that hedge the Group’s net investment in foreign operations.
OtherThis reserve includes a merger difference that arose in 2002 on the conversion of share warrants into share capital, as well as the cash flow hedge reserve.
16 Employee benefitsACCOUNTING POLICYPension schemesDefined contribution plansA defined contribution plan is a post-employment benefit plan under which an entity pays fixed contributions into a separate entity and will have no legal or constructive obligation to pay further amounts. Obligations for contributions to defined contribution pension plans are recognised as an employee benefit expense in the income statement as incurred.
Defined benefit plansA defined benefit plan is a post-employment benefit plan other than a defined contribution plan.
The Group’s net obligation in respect of material defined benefit pension plans is calculated separately for each plan by estimating the amount of future benefit that employees have earned in return for their service in the current and prior years; that benefit is discounted to determine its present value. The fair value of any plan assets are deducted.
In calculating the defined benefit deficit, the discount rate is the yield at the reporting date on AA credit-rated bonds that have maturity dates approximating the terms of the Group’s obligations and that are denominated in the same currency in which the benefits are expected to be paid. The calculation is performed annually by a qualified actuary using the Projected Unit credit method.
The increase in the present value of the liabilities expected to arise from the employees’ services in the accounting period is charged to the operating profit in the income statement. The expected return on the schemes’ assets and the interest on the present value of the schemes’ liabilities, during the accounting period, are shown as finance income and finance expense respectively.
The Group operates a number of pension schemes throughout the world. In most locations, these are defined contribution arrangements. However, there are significant defined benefit schemes in the United Kingdom, Hong Kong and Switzerland. The United Kingdom Scheme and Hong Kong Scheme are funded, with assets held in separate trustee-administered funds and the Switzerland Scheme is an insured scheme. The schemes in the United Kingdom and Hong Kong were closed to new entrants in 2002 and 2000, respectively. Other funded defined benefit schemes are not considered to be material and are therefore accounted for as if they were defined contribution schemes.
The Group recognises all actuarial remeasurements in each year in equity through the consolidated statement of comprehensive income.
In June 2011, the International Accounting Standards Board issued revisions to IAS 19 Employee Benefits (‘IAS 19’) that provide changes in the recognition, presentation and disclosure of post-employment benefits. The Group has adopted the revised accounting standard from 1 January 2013.
TOTAL PENSION COSTThe total pension cost included in operating profit for the Group was:
2018£m
2017£m
Defined contribution schemes (43.1) (46.9)Defined benefit schemes – current service cost and administration expenses (2.9) (3.2)Pension cost included in operating profit (note 5) (46.0) (50.1)
The pension cost for the defined benefit schemes was assessed in accordance with the advice of qualified actuaries. The last full triennial actuarial valuation of The Intertek Pension Scheme in the United Kingdom (‘United Kingdom Scheme’) was carried out as at 1 April 2016, and for IAS 19 accounting purposes has been updated to 31 December 2018. The last full actuarial valuation of the Hong Kong Scheme was carried out as at 31 December 2016, for local accounting purposes and has been updated to 31 December 2018 for IAS 19 purposes. The Switzerland Scheme was valued for IAS 19 purposes as at 31 December 2018. The average duration of the schemes are 20 years, 10 years and 15 years for the United Kingdom, Hong Kong and Switzerland schemes respectively.
Intertek Group plc Annual Report and Accounts 2018 151
Financial Statements

NOTES TO THE FINANCIAL STATEMENTScontinued
16 Employee benefits (continued)DEFINED BENEFIT SCHEMESThe cost of defined benefit schemesThe amounts recognised in the income statement were as follows:
2018£m
2017£m
Current service cost (2.7) (2.9)Curtailment gain on United Kingdom Scheme 5.4 –Scheme administration expenses (0.2) (0.3)Net pension interest cost (note 14) (0.4) (0.7)Total charge 2.1 (3.9)
The current service cost and scheme administration expenses are included in operating costs in the income statement and pension interest cost and interest income are included in net financing costs.
Included in Other Comprehensive Income:
2018£m
2017£m
Remeasurements arising from: Demographic assumptions 0.8 1.4 Financial assumptions 7.4 0.2 Experience adjustment 1.3 (0.7) Asset valuation (10.1) 11.6Other (0.2) 0.1Total (0.8) 12.6
Company contributionsThe Company assessed the triennial actuarial valuation for the United Kingdom Scheme and its impact on the scheme funding plan in 2018 and future years. In 2019 the Group expects to make normal contributions of £1.0m (2018: £0.8m) and has made a special contribution of £2.0m (2018: £2.0m). The next triennial valuation is due to take place as at 1 April 2019 and will include a review of the Company's future contribution requirements.
The Hong Kong Scheme has an annual actuarial valuation, identifying the funding requirements for 2019.
Pension liability for defined benefit schemesThe amounts recognised in the statement of financial position for defined benefit schemes were as follows:
United Kingdom Scheme
£m
Hong Kong Scheme
£m
SwitzerlandScheme
£mTotal
£m
Fair value of scheme assets 108.1 21.4 15.1 144.6Present value of funded defined benefit obligations (114.5) (24.8) (17.8) (157.1)Deficit in schemes (6.4) (3.4) (2.7) (12.5)
The fair value changes in the scheme assets are shown below:
2018£m
2017£m
Fair value of scheme assets at 1 January 152.3 143.5Interest income 3.3 3.3Normal contributions by the employer 1.6 1.7Special contributions by the employer 2.0 2.8Contributions by scheme participants 0.6 0.5Benefits paid (6.9) (7.9)Effect of exchange rate changes on overseas schemes 2.0 (3.1)Remeasurements (10.1) 11.6Scheme administration expenses (0.4) (0.3)Contribution to fund scheme administration expenses 0.2 0.2Fair value of scheme assets at 31 December 144.6 152.3
Intertek Group plc Annual Report and Accounts 2018152
Financial Statements | Notes to the financial statements
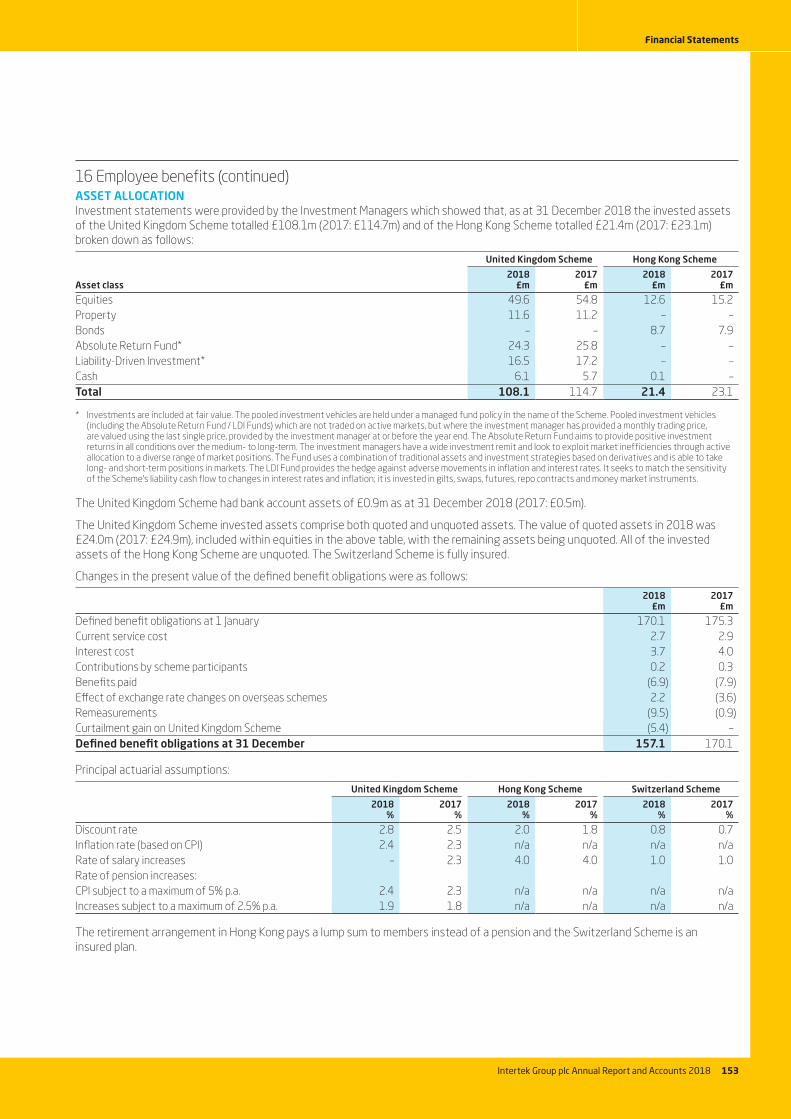
16 Employee benefits (continued)ASSET ALLOCATIONInvestment statements were provided by the Investment Managers which showed that, as at 31 December 2018 the invested assets of the United Kingdom Scheme totalled £108.1m (2017: £114.7m) and of the Hong Kong Scheme totalled £21.4m (2017: £23.1m) broken down as follows:
United Kingdom Scheme Hong Kong Scheme
Asset class2018
£m2017
£m2018
£m2017
£m
Equities 49.6 54.8 12.6 15.2Property 11.6 11.2 – –Bonds – – 8.7 7.9Absolute Return Fund* 24.3 25.8 – –Liability-Driven Investment* 16.5 17.2 – –Cash 6.1 5.7 0.1 –Total 108.1 114.7 21.4 23.1
* Investments are included at fair value. The pooled investment vehicles are held under a managed fund policy in the name of the Scheme. Pooled investment vehicles (including the Absolute Return Fund / LDI Funds) which are not traded on active markets, but where the investment manager has provided a monthly trading price, are valued using the last single price, provided by the investment manager at or before the year end. The Absolute Return Fund aims to provide positive investment returns in all conditions over the medium- to long-term. The investment managers have a wide investment remit and look to exploit market inefficiencies through active allocation to a diverse range of market positions. The Fund uses a combination of traditional assets and investment strategies based on derivatives and is able to take long- and short-term positions in markets. The LDI Fund provides the hedge against adverse movements in inflation and interest rates. It seeks to match the sensitivity of the Scheme’s liability cash flow to changes in interest rates and inflation; it is invested in gilts, swaps, futures, repo contracts and money market instruments.
The United Kingdom Scheme had bank account assets of £0.9m as at 31 December 2018 (2017: £0.5m).
The United Kingdom Scheme invested assets comprise both quoted and unquoted assets. The value of quoted assets in 2018 was £24.0m (2017: £24.9m), included within equities in the above table, with the remaining assets being unquoted. All of the invested assets of the Hong Kong Scheme are unquoted. The Switzerland Scheme is fully insured.
Changes in the present value of the defined benefit obligations were as follows:
2018£m
2017£m
Defined benefit obligations at 1 January 170.1 175.3Current service cost 2.7 2.9Interest cost 3.7 4.0Contributions by scheme participants 0.2 0.3Benefits paid (6.9) (7.9)Effect of exchange rate changes on overseas schemes 2.2 (3.6)Remeasurements (9.5) (0.9)Curtailment gain on United Kingdom Scheme (5.4) –Defined benefit obligations at 31 December 157.1 170.1
Principal actuarial assumptions:
United Kingdom Scheme Hong Kong Scheme Switzerland Scheme
2018%
2017%
2018%
2017%
2018%
2017%
Discount rate 2.8 2.5 2.0 1.8 0.8 0.7Inflation rate (based on CPI) 2.4 2.3 n/a n/a n/a n/aRate of salary increases – 2.3 4.0 4.0 1.0 1.0Rate of pension increases:CPI subject to a maximum of 5% p.a. 2.4 2.3 n/a n/a n/a n/aIncreases subject to a maximum of 2.5% p.a. 1.9 1.8 n/a n/a n/a n/a
The retirement arrangement in Hong Kong pays a lump sum to members instead of a pension and the Switzerland Scheme is an insured plan.
Intertek Group plc Annual Report and Accounts 2018 153
Financial Statements

NOTES TO THE FINANCIAL STATEMENTScontinued
16 Employee benefits (continued)Life expectancy assumptions at year end for:
United Kingdom Scheme Hong Kong Scheme* Switzerland Scheme
2018 2017 2018 2017 2018 2017
Male aged 40 48.8 49.0 n/a n/a 42.8 42.8Male aged 65 22.0 22.1 n/a n/a 19.7 19.8Female aged 40 50.9 50.9 n/a n/a 45.4 45.4Female aged 65 23.9 24.0 n/a n/a 21.9 21.9
* The retirement arrangement in Hong Kong pays a lump sum to members instead of a pension at the point of retirement. Since the amount of the lump sum is not related to the life expectancy of the member, the post-retirement mortality is not a relevant assumption for the Hong Kong Scheme.
The table above shows, for the United Kingdom Scheme, the number of years a male or female is expected to live, assuming they were aged either 40 or 65 at 31 December. The mortality tables adopted in 2018 for the United Kingdom Scheme are the S2PA projected by year of birth, based on the CMI 2016 mortality projection model with a 1.25% long-term annual rate for future improvement. In 2017 the S2PA tables were used, based on the CMI 2016 mortality projection model. For the Switzerland Scheme, the mortality table adopted in both 2018 and 2017 is the BVG2015, an industry standard in Switzerland which is based on statistical evidence of major Switzerland pension funds.
SENSITIVITY ANALYSISThe table below sets out the sensitivity on the United Kingdom and Hong Kong pension assets and liabilities as at 31 December 2018 of the two main assumptions:
UK Scheme Hong Kong Scheme
Change in assumptionsLiabilities
£m
Increase/ (decrease) in deficit
£mLiabilities
£m
Increase/ (decrease) in deficit
£m
No change 114.5 – 24.8 –0.25% rise in discount rate 109.5 (5.0) 24.3 (0.5)0.25% fall in discount rate 119.8 5.3 25.4 0.60.25% rise in inflation 118.2 3.7 n/a n/a0.25% fall in inflation 111.0 (3.5) n/a n/a
The United Kingdom Scheme is also subject to the mortality assumption. If the mortality tables used are rated up/down one year, the value placed on the liabilities increases by £5.1m and decreases by £5.2m respectively.
FUNDING ARRANGEMENTS United Kingdom SchemeThe Trustees use the Projected Unit credit method with a three-year control period. Currently the scheme members pay contributions at the rate of 8.5% of salary. The employer pays contributions of 16.4% of salary, plus £0.2m per year to fund scheme expenses, and has made an additional contribution of £2.0m in 2019 to reduce the deficit disclosed by the 2016 valuation.
Hong Kong SchemeThe Trustees use the Attained Age funding method. The last actuarial valuation was as at 31 December 2016. Scheme members do not contribute to the scheme. The employer pays contributions of 11.5% of salaries including 0.6% in respect of scheme expenses.
Funding RisksThe main risks for the schemes are:
Investment return risk: If the assets underperform the returns assumed in setting the funding targets then additional contributions may be required at subsequent valuations.
Investment matching risk: The schemes invest significantly in equities, whereas the funding targets are closely related to the returns on bonds. If equities fall in value relative to the matching asset of bonds, additional contributions may be required.
Longevity risk: If future improvements in longevity exceed the assumptions made for scheme funding then additional contributions may be required.
Role of Third PartiesThe United Kingdom Scheme is managed by Trustees on behalf of its members. The Trustees take advice from appropriate third parties including investment advisors, actuaries and lawyers as necessary.
Guaranteed Minimum Pension LiabilityOn 26 October 2018, the High Court of Justice of England and Wales issued a judgement in a claim between Lloyds Banking Group Pension Trustees Limited (the claimant) and Lloyds Bank plc (defendant) that UK pension schemes should equalise pension benefits for men and women for the calculation of their guaranteed minimum pension liability. This court ruling impacts with the majority of companies with a UK defined benefit plan, including the Intertek Pension Scheme. Formal calculation of the impact will be undertaken during 2019 as part of the scheme’s three-yearly valuation process, however, the scheme actuary estimates the impact will not be meaningful to both the Scheme and the Group, based on the scheme’s demographics.
Intertek Group plc Annual Report and Accounts 2018154
Financial Statements | Notes to the financial statements

17 Share schemesACCOUNTING POLICYShare-based payment transactionsThe share-based compensation plans operated by the Group allow employees to acquire shares of the Company. The fair value of the employee services, received in exchange for the grant of shares, is measured at the grant date and is recognised as an expense with a corresponding increase in equity. The charge is calculated using the Monte Carlo method and expensed to the income statement over the vesting period of the relevant award. The charge for the Deferred Share Awards is adjusted to reflect expected and actual levels of vesting for service conditions. The expense of the LTIP Share Awards is calculated using the Black-Scholes method and is adjusted for the probability of EPS performance conditions being achieved.
The Group has taken advantage of the provisions of IFRS 1 First-time Adoption of International Financial Reporting Standards, and has recognised an expense only in respect of share awards granted since 7 November 2002.
SHARE PLANS2011 Long Term Incentive PlanThe Deferred Bonus Plan 2005 was replaced in 2011 with the Intertek 2011 Long Term Incentive Plan (the 'LTIP'). Deferred Share Awards (previously Share Awards) and LTIP Share Awards (previously Performance Awards) have been granted under this plan. The first awards were granted on 7 April 2006. The awards under these plans vest three years after grant date, subject to fulfilment of the performance conditions.
Outstanding Awards
2018 2017
DeferredShare
Awards
LTIPShare
AwardsTotal
awards
Deferred Share
Awards
LTIPShare
AwardsTotal
awards
At beginning of year 869,796 1,080,222 1,950,018 817,586 1,043,719 1,861,305Granted* 308,885 338,386 647,271 317,302 369,342 686,644Vested** (239,087) (351,415) (590,502) (193,628) (93,463) (287,091)Forfeited (44,012) (104,536) (148,548) (71,464) (239,376) (310,840)At end of year 895,582 962,657 1,858,239 869,796 1,080,222 1,950,018
* Includes 11,933 Deferred Share Awards (2017: 11,173) and 17,725 LTIP Share awards (2017: 15,691) granted in respect of dividend accruals.** Of the 590,502 awards vested in 2018, 2,587 were satisfied by the issue of shares and 402,266 by the transfer of shares from the ESOT (see note 15). The balance
of 185,649 awards represented a tax liability of £9.3m which was settled in cash on behalf of employees by the Group, of which £8.5m was settled by the Company.
Deferred Share PlanAwards may be granted under the Deferred Share Plan ('DSP')' to employees of the Group (other than the Executive Directors of the Company) selected by the Remuneration Committee over existing, issued ordinary shares of the Company only. The DSP was adopted primarily to allow for the deferral of a proportion of selected employees annual bonus into shares in the Company, but may also be used for the grant of other awards (such as incentive awards and buy-out awards for key employees) in circumstances that the Remuneration Committee deems appropriate. Awards will normally have a three-year vesting period. Awards may be made subject to performance conditions and are subject to normal good and bad leaver provisions and malus and clawback.
Outstanding Awards
2018 2018 2017 2017
Deferred Share
AwardsTotal
Awards
Deferred Share
AwardsTotal
awards
At beginning of year 66,154 66,154 117,537 117,537Granted* 103,086 103,086 44,915 44,915Vested** (32,098) (32,098) (94,313) (94,313)Forfeited (17,128) (17,128) (1,985) (1,985)At end of year 120,014 120,014 66,154 66,154
* Includes 697 Deferred Share Awards (2017: 945) granted in respect of dividend accruals.** Of the 32,098 awards vested in 2018, 19,557 were satisfied by the transfer of shares from the ESOT (see note 15). The balance of 12,541 awards represented a tax
liability of £0.6m which was settled in cash on behalf of employees by the Group, of which £0.5m was settled by the Company.
Intertek Group plc Annual Report and Accounts 2018 155
Financial Statements

NOTES TO THE FINANCIAL STATEMENTScontinued
17 Share schemes (continued)Equity-settled transactionsDuring the year ended 31 December 2018, the Group recognised an expense of £20.9m (2017: £17.5m). The fair values and the assumptions used in their calculations are set out below:
2018 Awards
DeferredShare
Awards (DSP)Share
Awards
LTIP ShareAwards EPS
element
LTIP ShareAwards TSR
element
Fair value at measurement date (pence) 4,516 4,751 4,651 2,608Share price (pence) 4,516 4,751 4,651 4,651Expected volatility – – – 21.9%Risk–free interest rate – – – 1.0%Time to maturity (years) 1-3 3 3 3
2017 Awards
DeferredShare
Awards (DSP)Share
Awards
LTIP ShareAwards EPS
element
LTIP ShareAwards TSR
element
Fair value at measurement date (pence) 4,679 3,868 3,860 2,385Share price (pence) 4,679 3,868 3,860 3,860Expected volatility – – – 23.9%Risk-free interest rate – – – 0.15%Time to maturity (years) 1-3 3 3 3
The expected volatility is based on the historical volatility, adjusted for any expected changes to future volatility due to publicly available information.
All Share Awards are granted under a service condition. Such condition is not taken into account in the fair value measurement at grant date. The LTIP Share Awards (TSR element) are granted under a performance-related market condition and as a result this condition is taken into account in the fair value measurement at grant date.
18 Subsequent eventsNo post balance sheet events were identified between 31 December 2018 and the date of signing this report.
19 Capital managementThe Directors determine the appropriate capital structure of Intertek; specifically how much capital is raised from shareholders (equity) and how much is borrowed from financial institutions (debt) in order to finance the Group’s activities. These activities include ongoing operations as well as acquisitions as described in note 10.
The Group’s policy is to maintain a robust capital base (including cash and debt) to ensure the market and key stakeholders retain confidence in the capital profile. Debt capital is monitored by Group Treasury assessing the liquidity buffer on a short- and longer-term basis as discussed in note 14. The Group uses key performance indicators, including return on invested capital and adjusted diluted earnings per share to monitor the capital position of the Group to ensure it is being utilised effectively. The dividend policy also forms part of the Board’s capital management policy, and the Board ensures there is appropriate earnings cover for the dividend proposed at both the interim and year end.
Intertek Group plc Annual Report and Accounts 2018156
Financial Statements | Notes to the financial statements

20 Non-controlling interestACCOUNTING POLICYAcquisitions of non-controlling interests are accounted for as transactions with owners in their capacity as owners and therefore no goodwill is recognised as a result of such transactions.
NON-CONTROLLING INTERESTAn analysis of the movement in non-controlling interest is shown below:
2018£m
2017£m
At 1 January 34.5 34.7Exchange adjustments (2.8) (0.3)Share of profit for the year 20.8 19.0Adjustment arising from changes in non-controlling interest – –Dividends paid to non-controlling interest (18.2) (18.7)Non-controlling interest from businesses acquired – (0.2)At 31 December 34.3 34.5
21 Related partiesIDENTITY OF RELATED PARTIESThe Group has a related party relationship with its key management. Transactions between the Company and its subsidiaries and between subsidiaries have been eliminated on consolidation and are not discussed in this note.
TRANSACTIONS WITH KEY MANAGEMENT PERSONNELKey management personnel compensation, including the Group’s Directors, is shown in the table below:
2018£m
2017£m
Short-term benefits 10.6 9.3Post-employment benefits 0.8 0.8Equity-settled transactions 8.5 7.2Total 19.8 17.3
More detailed information concerning Directors’ remuneration, shareholdings, pension entitlements and other long-term incentive plans is shown in the audited part of the Remuneration report. Apart from the above, no member of key management had a personal interest in any business transactions of the Group.
At a General Meeting of the Company’s shareholders held on 16 January 2019, a resolution was passed which constituted a related party transaction under IAS 24. For further details please see page 110.
22 Contingent liabilities2018
£m2017
£m
Guarantees, letters of credit and performance bonds 27.5 26.5
LITIGATIONThe Group is involved in various claims and lawsuits incidental to the ordinary course of its business, including claims for damages, negligence and commercial disputes regarding inspection and testing, and disputes with employees and former employees. The Group is not currently party to any legal proceedings other than ordinary litigation incidental to the conduct of business. The Group maintains appropriate insurance cover to provide protection from the small number of significant claims it is subject to from time to time.
TAXThe Group operates in more than 100 countries and with complex tax laws and regulations. At any point in time it is normal for there to be a number of open years which may be subject to enquiry by local authorities. In some jurisdictions the Group receives tax incentives (see note 6) which are subject to renewal and review and reduce the amount of tax payable. Where the effect of the laws and regulations is unclear, estimates are used in determining the liability for the tax to be paid. The Group considers the estimates, assumptions and judgements to be reasonable but this can involve complex issues which may take a number of years to resolve. The Group is also monitoring developments in relation to EU State Aid investigations following the EU Commission opening a State Aid investigation into the Group Financing Exemption in the UK’s Controlled Foreign Company regime in October 2017. In line with current UK tax law, the Group applies this regime. Based on its current assessment, the Group does not consider any provision is required in relation to this issue.
Intertek Group plc Annual Report and Accounts 2018 157
Financial Statements

NOTES TO THE FINANCIAL STATEMENTScontinued
FULLY OWNED SUBSIDIARIES 0949491 B.C. Limited1620-400 Burrard Street, Vancouver, BC V6C 3A6, Canada4th Strand, LLC (i)
3000 Northwoods Parkway, Suite 330, Norcross, GA 30071, United StatesAcucert Labs, LLP82/2, Shreyas, 25th Road, Sion West, Mumbai, 400022, IndiaAcumen Security, LLC2400 Research Blvd, Suite 395, Rockville, MD 20850, United StatesAdelaide Inspection Services Pty LimitedLevel 3, 235 St Georges Terrace, Perth, WA 6000, AustraliaAgeus Solutions Inc.505 March Road, Suite 100, Kanata, ON K2K 2V6, CanadaAlchemy Investment Holdings, Inc.1209 Orange Street, Wilmington, New Castle, DE, 19801, United StatesAlchemy Systems L.P.8015 Shoal Creek Blvd, Suite 100, Austin, TX, 78757, United StatesAlchemy Systems Training, Inc.8015 Shoal Creek Blvd, Suite 100, Austin, TX, 78757, United StatesAlchemy Systems Training LimitedArcadia House, Maritime Walk, Ocean Village, Southampton, SO14 3TL, United KingdomAlchemy Training Technologies, Inc.1 Germain Street, Suite 1500, Saint John, NB E2L 4V1, CanadaAldo Abela Surveys Limited98 Triq Patri Magri, Marsa, MRS 2200, MaltaAlex Stewart Assayers Private Limited (ii)
Unit No. D1, Udyog Sadan No.3, M.I.D.C. Central Road, Andheri (East), Mumbai, 400093, India
Alta Analytical Laboratory, Inc. (i)
200 Westlake Park Blvd., Westlake Building 4, Suite 400, Houston, TX 77079, United StatesAmtac Certification Services LimitedAngus Management, LLC1209 Orange Street, Wilmington, New Castle, DE 19801, United StatesArchitectural Testing Holdings, Inc.2711 Centerville Road, Suite 400, Wilmington, DE 19808, United StatesArchitectural Testing, Inc.130, Derry Court, York, PA 17406, United StatesBigart Ecosystems, LLC1021 Hunters Way, Bozeman, MT 59718, United StatesCaleb Brett Abu Dhabi LLCCB UAE (Private) Ltd, c/o Al Nahiya Group, PO Box 3728, Abu Dhabi, United Arab EmiratesCaleb Brett Ecuador S.A.Centro Commercial Mall del Sol, Av. Joaquín Orrantia González y Juan Tanca Marengo, Torre B, Piso 5, Oficina 505, Guayaquil, EcuadorCantox U.S. Inc.100 Davidson Avenue, Suite #102, Somerset, NJ 08873, United StatesCapcis LimitedCatalyst Awareness, Inc.43 Carolinian Lane, Cambridge, ON N1S 5B5, CanadaCenter for the Evaluation of Clean Energy Technology, Inc.3933 US Route 11, Cortland, NY 13045, United StatesCharon Insurance LimitedThomas Miller (Bermuda) Ltd, Canon’s Court, 22 Victoria Street, Hamilton, HM12, Bermuda
23 Principal Group companiesThe principal subsidiaries whose results or financial position, in the opinion of the Directors, principally affect the figures of the Group have been shown below. All the subsidiaries shown were consolidated with Intertek Group plc as at 31 December 2018. Unless otherwise stated, these entities are wholly owned subsidiaries and the address of the registered office is Academy Place, 1-9 Brook Street, Brentwood, Essex, CM14 5NQ, United Kingdom for all related undertakings included in this note.
Company nameCountry of Incorporation and principal place of operation Activity
Intertek Finance plc England FinanceIntertek Holdings Limited (i) England HoldingIntertek Technical Services, Inc. (ii) USA TradingIntertek Testing Services Holdings Limited (i) England HoldingIntertek Testing Services Hong Kong Limited (iii) Hong Kong TradingIntertek Testing Services Limited Shanghai (iv) China TradingIntertek Testing Services NA, Inc. (v) USA TradingIntertek Testing Services Shenzhen Limited (vi) China TradingIntertek USA, Inc. (vii) USA TradingIntertek USD Finance Limited England FinanceLabtest Hong Kong Limited (viii) Hong Kong TradingRCG-Moody International Limited England HoldingTesting Holdings USA, Inc. (ix) USA Holding(i) Directly owned by Intertek Group plc.(ii) Ownership held in Ordinary and Preference shares; Registered office address is: 25025 I-45 North, Suite #111, The Woodlands, TX 77380, United States.(iii) Registered office address is: 2/F Garment Centre, 576 Castle Peak Road, Kowloon, Hong Kong.(iv) Equity shareholding 85%, company controlled by the Group based on management’s assessment; Registered office address is: 2nd Floor (West Zone), No 707
ZhangYang Road, Pilot Free Trade Zone, Shanghai, China.(v) Registered office address is: 3933 US Route 11, Cortland, NY 13045, United States.(vi) Registered office address is: West side of 1/F and 3,4,5/F of Bldg. 1, 1-5/F of Bldg. 3, Yuanzheng Science and Technology Industrial Park, No. 4012, Bantian Street,
Longgang District, Shenzhen, Guangdong, China.(vii) Registered office address is: CT Corporation System, 5615 Corporate Blvd., Suite 400B, Baton Rouge, LA 70808, United States.(viii) Registered office address is: 11/F, Unit IJK, Garment Centre, 576 Castle Peak Road, Kowloon, Hong Kong.(ix) Registered office address is: Corporation Trust Center, 1209 Orange Street, Wilmington, DE 19801, United States.
GROUP COMPANIESIn accordance with section 409 of the Companies Act 2006 a full list of related undertakings is set out below. Related undertakings comprise subsidiaries, partnerships, associates, joint ventures and joint arrangements. The above principal subsidiaries have not been duplicated in the list below. Unless otherwise stated, the share capital disclosed comprises ordinary shares which are indirectly held by Intertek Group plc as at 31 December 2018. No subsidiary undertakings have been excluded from the consolidation.
Intertek Group plc Annual Report and Accounts 2018158
Financial Statements | Notes to the financial statements

23 Principal Group companies (continued)FULLY OWNED SUBSIDIARIES (CONTINUED) Electrical Mechanical Instrument Services (UK) LimitedUnit 19 & 20 Wellheads Industrial Centre, Dyce, Aberdeen, AB21 7GA, United KingdomElectronic Warfare Associates-Canada, Ltd1223 Michael Street North, Suite 200, Ottawa, ON K1J 7T2, CanadaEntela-Taiwan, Inc4700 Broadmoor Avenue SE, Suite 200, Kentwood, MI 49512, United StatesEsperanza Guernsey Holdings LimitedPO Box 472, St Julian’s Court, St Julian's Avenue, St Peter Port, GY1 6AX, GuernseyEsperanza International Services (Southern Africa) (Pty.) LimitedCharter House, 13 Brand Road, Glenwood, Durban, South AfricaFour Front Research (India) Pvt Limited (ii)
Plot# 847, 5th Floor, Near Electricity Substation, Ayyappa Society Road, Madhapur, Hyderabad, Telangana, 500081, IndiaFrameworks Inc.1595 Sixteenth Avenue, Suite 301, Richmond Hill, ON L4B 3N9, CanadaGellatly Hankey Marine Services (M) Sdn. Bhd.Unit 30-01 Level 30, Tower A, Vertical Business Suite, Avenue 3, Bangsar South, No. 8, Jalan Kerinchi, 59200 Kuala Lumpur, MalaysiaGenalysis Laboratory Services Pty Limited (vi)
Level 3, 235 St Georges Terrace, Perth, WA 6000, AustraliaGeotechnical Services Pty LimitedLevel 3, 235 St Georges Terrace, Perth, WA 6000, AustraliaGlobal X-Ray & Testing CorporationP.O. Box 1536, Morgan City, LA 70380, United StatesGlobal X-Ray Holdings, Inc. (v)
112 East Service Road, Morgan City, LA 70381, United StatesH.P. White Laboratory Inc.3114 Scarboro Road, Street, MD 21154, United StatesHawks Acquisition Holding, Inc.Corporation Service Company, 2711 Centerville Road, Suite 400, Wilmington, New Castle, DE 19808, United StatesHi-Tech Holdings, Inc.CT Corporation System, 1200 S.Pine Island Road, Plantation, FL 33324, United StatesHi-Tech Testing Service, Inc.CT Corporation System, 1999 Bryan Street Suite 900, Dallas, TX 75201, United StatesInspection Services (US), LLCCorporation Trust Center, 1209 Orange Street, Wilmington, DE 19801, United StatesInternational Cargo Services, Inc. (i)
c/o CT Corp, 8550 United Plaza Blvd, Baton Rouge, LA 70809, United StatesInternational Inspection Services Limited33/37 Athol Street, Douglas, IM1 1LB, Isle of ManIntertek (Mauritius) Limited2 Palmerston Road, Phoenix, MauritiusIntertek (Schweiz) AGTechCenter, Kaegenstrasse 18, 4153 Reinach, SwitzerlandIntertek Academy A/SBuen 12, 3, 6000 Kolding, DenmarkIntertek Argentina Certificaciones S.A.Cerrito 1136 3rd floor CF, Ciudad Autónoma de Buenos Aires, C1010AAX, ArgentinaIntertek Aruba N.V.Lago Heights Straat 28A, San Nicolas, ArubaIntertek Asset Integrity Management, Inc.1710 Sens Road, La Porte, TX 77571, United StatesIntertek ATI SRL266-268 Calea Rahovei Street, Building 61, 1st Floor, Sector 5, Bucharest, RomaniaIntertek Australia Holdings Pty LimitedLevel 3, 235 St Georges Terrace, Perth, WA 6000, AustraliaIntertek Azeri Limited2236 Mirza Davud Str., Xatai District, Baku, AZ 1026, AzerbaijanIntertek BA EOOD24A Akad. Metodi Popov Str., Floor 5, Sofia, 1113, BulgariaIntertek Bangladesh LimitedPhoenix Tower, Plot–407 (3rd Floor), Tejgaon I/A, Dhaka, BangladeshIntertek Belgium NVKruisschansweg 11, 2040 Antwerp, Belgium
Intertek Burkina Faso Ltd Sarl (i)
Ouagadougou, Secteur 13, Parcelle 21, Lot 11 Section EO Arrondissement de Nongr'Masson, Ouagadougou, 11 GP 1429, Burkina FasoIntertek C&T Australia Holdings PTY Ltd (i)
Level 3, 235 St Georges Terrace, Perth WA 6000, AustraliaIntertek C&T Australia Pty Ltd (i)
Level 3, 235 St Georges Terrace, Perth WA 6000, AustraliaIntertek Caleb Brett (Uruguay) S.A.Cerrito 507, 4th Floor, Of. 46 and 47, Montevideo, 11000, UruguayIntertek Caleb Brett Chile S.A.Avenida Las Condes N° 11287 Torre A, oficina 301 A Las Condes, Santiago, ChileIntertek Caleb Brett El Salvador S.A. de C.V.Recinto Industrial de RASA zona industrial de Acajutla, Sonsonate, El SalvadorIntertek Caleb Brett Germany GmbHWitternstrasse 14, 21107, Hamburg, GermanyIntertek Caleb Brett Panama, Inc.Zona Procesadora para la Exportacion de Albrook, Building 6, Ancon Panama, PanamaIntertek Caleb Brett Venezuela C.A.2a AV El Mirador Edif. Saragon Palace Piso, PH-602/603 La Campina, Caracas, 1050, VenezuelaIntertek Canada Newco Limited1829 32nd Avenue, Lachine, QC H8T 3JI, CanadaIntertek Capacitacion Chile SpaAvenida Las Condes N° 11287 Torre A, oficina 301 A Las Condes, Santiago, ChileIntertek Capital Resources LimitedIntertek Certification ABTorshamnsgatan 43, Box 1103, Kista, S-164 22, SwedenIntertek Certification ASLeif Weldings vei 8, 3208 Sandefjord, NorwayIntertek Certification France SAS67 Boulevard Bessières, 75017, Paris, FranceIntertek Certification GmbHMarie-Bernays-Ring 19a, 41199 Monchengladbach, GermanyIntertek Certification International Sdn. Bhd.6-L12-01, Level 12, Tower 2, Menara PGRM, No. 6 & 8 Jalan Pudu Ulu, Cheras, 56100 Kuala Lumpur, MalaysiaIntertek Certification Japan LimitedNihonbashi N Bldg, 1-4-2, Nihonbashi – Horidomecho, Chuo-ku, Tokyo, 103-0012, JapanIntertek Certification LimitedIntertek Colombia S.A.Calle 127A No. 53A-45, Oficina 1103, Bogotá, ColombiaIntertek Commodities Botswana (Proprietary) Limited (i)
First Floor, Time Square, Plot 134 Independence Avenue, Gaborone, BotswanaIntertek Commodities Mozambique LdaRua 1233, NR 72 R/C, Distrito Urbano 1, Maputo, MozambiqueIntertek Consulting & Training (UK) LimitedNorthpoint Aberdeen Science & Energy Park, Exploration Drive, Bridge of Don, Aberdeen, AB23 8HZ, United KingdomIntertek Consulting & Training (USA), Inc.201 Energy Parkway, Suite 240, Lafayette, LA 70508, United StatesIntertek Consulting & Training Colombia LimitadaCalle 127A No. 53A-45, Oficina 1103, Bogotá, ColombiaIntertek Consulting & Training Egypt(ii)
46 B Street #7, Maadi, Cairo, EgyptIntertek Consulting ABTorshamnsgatan 43, Box 1103, Kista, S-164 22, SwedenIntertek Consumer Goods GmbHWürzburger Strasse 152, 90766 Fürth, GermanyIntertek Curacao N.V.Barendslaan #3, Rio Canario Willemstad, Curacao, Netherlands AntillesIntertek de Guatemala SA46 Calle 21-53 Zona 12, Expobodega 46, Edificio 10, Guatemala Ciudad, GuatemalaIntertek de Nicaragua S.A.Zona Franca Astro KM 47, Carretera Tipitapa Masaya, Nave 20, Managua, NicaraguaIntertek Denmark A/SDokhavnsvej 3, 4400 Kalundborg, DenmarkIntertek Deutschland GmbHStangenstrasse 1, 70771 Leinfelden-Echterdingen, GermanyIntertek DIC A/SBuen 12, 3, 6000 Kolding, Denmark
Intertek Group plc Annual Report and Accounts 2018 159
Financial Statements

NOTES TO THE FINANCIAL STATEMENTScontinued
23 Principal Group companies (continued)FULLY OWNED SUBSIDIARIES (CONTINUED)Intertek do Brasil Inspecoes LtdaAv Eng. Augusto Barata s/n, Alamoa, Santos, SP, CEP11095-650, BrazilIntertek Egypt for Testing Services2nd Floor, Block 13001, Piece 15, Street 13, First Industrial Zone, (Beside Abou Ghali Motors), Elobour City, Cairo, EgyptIntertek Engineering Service Shanghai LimitedRoom 308A, 3rd Floor, No. 1 Building, No.1287, Shangcheng Road, Pilot Free Trade Zone, Shanghai, ChinaIntertek Engineering Services (Wuhu) LtdNo. 65 Chang Ye Street, YinHu District, Wuhu, ChinaIntertek Evaluate ABTorshamnsgatan 43, Box 1103, Kista, S-164 22, SwedenIntertek Finance No. 2 LtdIntertek Finland OYTeknoublevardi 3-5, FI-01530 Vantaa, FinlandIntertek Fisheries Certification LimitedIntertek Food Services GmbHOlof-Palme-Strasse 8, 28719 Bremen, GermanyIntertek France SASZAC Ecopark 2, 27400, Heudebouville, FranceIntertek Fujairah FZCP.O. Box 1307, Fujairah, United Arab EmiratesIntertek Genalysis (Zambia) LimitedPlot No 25/26 Nkwazi House, Nkwazi and Cha Cha Cha Roads, PO Box 31014, Lusaka, ZambiaIntertek Genalysis Madagascar SASaint Denis Terrain II, Parcel 2 Ambatofotsy, Ampandrianomby, MadagascarIntertek Genalysis South Africa Pty LtdLevel 3, 235 St Georges Terrace, Perth, WA 6000, AustraliaIntertek Ghana Limited1st Floor Gian, Towers Office, Number 2 Community, Gian Towers Tema, Accra, Accra Metropolitan, P.O. BOX GP 199, GhanaIntertek Global (Iraq) LimitedIntertek Global International LLCBuilding 242, Office No.3, C-Ring Road, PO Box 47146, Doha, QatarIntertek Global Limited1st Floor, Liberation House, Castle Street, St Helier, JE1 1GL, JerseyIntertek Health Sciences Inc. (vi)
2233 Argentia Road, Suite # 201, Mississauga, ON L5N 2X7, CanadaIntertek Holding Deutschland GmbHStangenstrasse 1, 70771 Leinfelden-Echterdingen, GermanyIntertek Holdings France SASZAC Ecopark 2, 27400 Heudebouville, FranceIntertek Holdings Italia SRLVia Guido Miglioli 2/A, Cernusco sul Naviglio, 20063, Milano, ItalyIntertek Holdings Nederland B.V.Leerlooierstraat 135, 3194AB Hoogvliet, Rotterdam, The NetherlandsIntertek Holdings Norge ASOljevegen 2, 4056 Tananger, NorwayIntertek Ibérica Spain, S.L.Alda. Recalde, 27-5., 48009, Bilbao, Vizcaya, SpainIntertek India Private LimitedE-20, Block B1, Mohan Co-operative Industrial Area, Mathura Road, New Delhi, 110044, IndiaIntertek Industrial Services GmbHMarie-Bernays-Ring 19a, 41199 Monchengladbach, GermanyIntertek Industry and Certification Services (Thailand) Limited539/2 Gypsum Metropolitan Tower, 11C Fl., Sri-Ayudhaya Road, Tanon – Phayathai Subdistrict, Khet Ratchathewi, Bangkok, 10400, ThailandIntertek Industry Holdings (Pty) Ltd53 Phillip Engelbrecht Drive, Woodhill Office Park Building 2, 1st Floor Unit 8B Meyersdal, Gauteng, 1448, South AfricaIntertek Industry Services (PTY) LTD3 EL Wak Street, Vereeniging, 1930, Gauteng, South AfricaIntertek Industry Services (S) Pte Ltd2 International Business Park, #10-09/10, The Strategy, 609930, SingaporeIntertek Industry Services Brasil LtdaAlameda Mamore 503, Alphaville, Barueri-SP, 06454-040-SP, Brazil
Intertek Industry Services Colombia LimitedCalle 127A No. 53A-45, Oficina 1103, Bogotá, ColombiaIntertek Industry Services Japan LimitedNihonbashi N Bldg, 1-4-2, Nihonbashi – Horidomecho, Chuo-ku, Tokyo, 103-0012, JapanIntertek Industry Services Romania Srl266-268 Calea Rahovei Street, Building 61, 1st Floor, Sector 5, Bucharest, RomaniaIntertek Industry WLLOffice # 24, Building 400, Road 3207, Mahooz, Block 332, Manama, Kingdom of BahrainIntertek Inspection Services Ltd2561 Avenue Georges V, Montreal-Est, QC H1L 6S4, CanadaIntertek Inspection Services Scandinavia ASLeif Weldings vei 8, 3208 Sandefjord, NorwayIntertek Inspection Services UK LimitedIntertek International France SAS67 Boulevard Bessières, 75017, Paris, FranceIntertek International Gabon SARLQuartier Montagne Sainte – Immeuble Dumez, 2éme étage, Libreville, B.P: 13312, GabonIntertek International Guinee S.A.R.L. (i)
Conakry Republique de Guinee, Compte Bancaire: 52481.369.10 0 (SGBG), Conakry GuineaIntertek International Inc.24900 Pitkin Road, Suite 200, The Woodlands, TX 77386, United StatesIntertek International Kazakhstan, LLCBuilding 2A, Abay street, Atyrau City, 060002, KazakhstanIntertek International LimitedIntertek International Ltd Egypt69, Road 161, Intersection with Road 104, Ground Floor, Maadi, Cairo, EgyptIntertek International Nederland BVLeerlooierstraat 135, 3194AB Hoogvliet, Rotterdam, The NetherlandsIntertek International Niger SARLBP 2769, 2nd Floor Lot 792 Block Q, Independance Boulevard, Rue GM-20, NigerIntertek International Suriname N.V.Prins Hendrikstraat 49, Paramaribo, SurinameIntertek International Tanzania LimitedMinazini Street, Kilwa Road 5, Dar es Salaam, United Republic of TanzaniaIntertek Italia SpAVia Guido Miglioli 2/A, Cernusco sul Naviglio, 20063, Milano, ItalyIntertek Japan K.K.Pier City Shibaura Building, 4F, 3-18-1, Kaigan, Minato-ku, Tokyo, 108-0022, JapanIntertek Kalite Servisleri Limited SirketiIcerenkoy mahallesi Eski Uskudar Yolu cadessi, VIP Center No: 10, Kat 12, Daire 13, Atasehir, Istanbul, TurkeyIntertek Korea Industry Service LtdYeouido Dept Bldg #916, 36-2, Yeouido-Dong, Youngdeungpo-Gu, Seoul, 150-749, Republic of KoreaIntertek Labtest S.A.R.LRoute 110, (par Chefchaouni), Lot Saadi no. 20, Q.I. Aïn Sebaâ 20 250, 4eme Etage, Casablanca, MoroccoIntertek LtdBorco Administration Bldg, West Sunrise Highway, Freeport, Grand Bahama, The BahamasIntertek Management Services (Australia) Pty LtdLevel 3, 235 St Georges Terrace, Perth, WA 6000, AustraliaIntertek Med SARL AUZone Franche Logistique Tanger Med, Plateau Bureaux 4, Lot 130, Tanger, MoroccoIntertek Medical Notified Body ABTorshamnsgatan 43, Box 1103, Kista, S-164 22, SwedenIntertek Minerales Services SARL (i)
Rue KM 10, Route de Kouroussa S/P Karifamoriah, Commune Urbaine de Kankan, GuineaIntertek Minerals LimitedOsu Badu Street, Airport Residential Area, Accra, Greater Accra, CP8196, GhanaIntertek Myanmar Limited (i)
Classic Strand Cono, No.693/701, Room (4-A), (4th Floor), Merchant Road, Pabedan Township, Yangon, MyanmarIntertek Nederland B.V.Leerlooierstraat 135, 3194 AB Hoogvliet, Rotterdam, The NetherlandsIntertek Nominees LimitedIntertek OCA France SARLRoute Industrielle – Centre Routier, 76600, Gonfreville L'Orcher, France
Intertek Group plc Annual Report and Accounts 2018160
Financial Statements | Notes to the financial statements

23 Principal Group companies (continued)FULLY OWNED SUBSIDIARIES (CONTINUED)Intertek Overseas Holdings LimitedIntertek Overseas Holdings, Eritrea Limited (i)
3rd Floor, Warsay Avenue, P.O. Box 4588, Asmara, EritreaIntertek Pakistan (Private) LimitedIntertek House, Plot No.1-5/11-A, Sector-5, Korangi Industrial Area, Karachi, PakistanIntertek Poland sp.z.o.o.Cyprysowa 23 B, 02-265, Warsaw, PolandIntertek Polychemlab B.V.Koolwaterstofstraat 1, 6161 RA, Geleen, The NetherlandsIntertek Portugal, Unipessoal LdaRua Antero de Quental, 221-Sala 102, 4455-586, Perafita-Matosinhos, PortugalIntertek Quality Services Ltd (i)
Intertek Resource Solutions (Trinidad) Limited (i)
#91-92 Union Road, Marabella, Trinidad, Trinidad and TobagoIntertek Resource Solutions, Inc.24900 Pitkin Road, Suite 200, The Woodlands, TX 77386, United StatesIntertek Rus JSC8, 2nd Brestskaya Str., 125047, Moscow, Russian FederationIntertek S.R.OSokolovská 131/86, Karlín, Praha 8, 186 00, Czech RepublicIntertek Saudi Arabia LimitedSouthern Olaya Center, Office No. 213, Makkah Al-Mukaramah Street, P.O. Box 2526, Al-Khobar, 31952, Saudi ArabiaIntertek ScanBi Diagnostics ABBox 166, Alnarp, SE-230 53, SwedenIntertek Secretaries Limited (i)
Intertek Semko ABTorshamnsgatan 43, Box 1103, Kista, S-164 22, SwedenIntertek Services (Pty) Ltd151 Monument Road, Aston Manor, 1619, South AfricaIntertek Servicios C.A. (i)
Res. San Ignacio, Calle San Ignacio de Loyola con Avenue Francisco de Miranda, Local 3, Chacao, Caracas, VenezuelaIntertek Settlements Limited (i)
Intertek Statius N.V.Man 'O' War #B3, Oranjestad, St. Eustatius, Netherlands AntillesIntertek Surveying Services (USA), LLC3033 Chimney Rock Road, Suite 625, Houston TX 77056, United StatesIntertek Surveying Services UK LimitedRedshank House, Alness Point Business Park, Alness, Highland, IV17 OUP, United KingdomIntertek Technical Inspections Canada Inc. (iv)
1829 32nd Avenue, Montreal H8T 3J1, CanadaIntertek Technical Services PTY LimitedLevel 3, 235 St Georges Terrace, Perth WA 6000, AustraliaIntertek Technical Testing and Analysis PLC (i)
Bole Sub City Woreda 04, House Number 064/A/, Abune Yosef, Addis Ababa, 4260, EthiopiaIntertek Testing & Certification LimitedIntertek Testing and Inspection Services UK LimitedIntertek Testing Management LimitedIntertek Testing Services (Australia) Pty LimitedLevel 3, 235 St Georges Terrace, Perth WA 6000, AustraliaIntertek Testing Services (Cambodia) Company Limited13AC, Street 337, Sangkat Boeung Kak I, Khan Tuol Kork, Phnom Penh, CambodiaIntertek Testing Services (East Africa) Pty LimitedDjibouti Free Zone, Room 19, Rue De Venice, P.O. Box 6419, Djibouti, South AfricaIntertek Testing Services (Fiji) Limitedc/o BDO, Level 10, FNPF Place, 343 Victoria Parade, Suva, FijiIntertek Testing Services (Guangzhou) Ltd3F Hengyun Building, 235 Kaifa Ave, Guangzhou Economic & Technological Development District, Guangzhou, 510730, ChinaIntertek Testing Services (ITS) Canada Ltd.105-9000 Bill Fox Way, Burnaby BC V5J 5J3, CanadaIntertek Testing Services (Japan) K. K.Nihonbashi N Bldg, 1-4-2, Nihonbashi – Horidomecho, Chuo-ku, Tokyo, 103-0012, Japan
Intertek Testing Services (NZ) Limited3 Kepa Road, Ruakaka, Northland, 0171, New ZealandIntertek Testing Services (Shanghai FTZ) Co., LtdBuild T52-8, No. 1201, Gui Qiao Road, Jinqiao Development Area, Pudong District, Shanghai, 201206, ChinaIntertek Testing Services (Singapore) Pte Ltd.3 Irving Road #05-01 to 05, Tai Seng Centre, 369522, SingaporeIntertek Testing Services (Thailand) Limited1285/5 Prachachuen Road, Wong-Sawang Sub-District, Bangsue District, Bangkok, 10800, ThailandIntertek Testing Services Argentina S.A.Cerrito 1136, piso 3ro, Frente. Ciudad Autonoma de Buenos Aires, (C1010AAX), ArgentinaIntertek Testing Services Bolivia S.A.Calle Chichapi # 2125, Santa Cruz, de la Sierra, BoliviaIntertek Testing Services Caleb Brett Egypt LimitedIntertek Testing Services Center LLCOffice 165-N, Letter A, 21 Rozenshteina Street, 198095, Saint Petersburg, Russian FederationIntertek Testing Services Chongqing Co., Limited1-2/F, Building #3, 5 Gangcheng East Ring Road, Jiangbei District, Chongqing, ChinaIntertek Testing Services de Honduras, S.A.Edificio la Pradera, locales 5 y 6. 1-2 Ave, 1 calle, Puerto Cortes, Barrio el Centro, HondurasIntertek Testing Services De Mexico, S.A. De C.V.Poniente 134, No 660 Industrial Vallejo, Mexico DF CP, 02300, MexicoIntertek Testing Services Environmental Laboratories Inc. (i)
Lexis Document Services, 15 East North Street, Dover, DE 19901, United StatesIntertek Testing Services NA Limited1829 32nd Avenue, Lachine QC H8T 3JI, CanadaIntertek Testing Services NA Sweden AB (i)
c/o Intertek Semko AB, Box 1103, Kista, 16422, SwedenIntertek Testing Services Namibia (Proprietary) Limited15th Floor, Frans Indongo Gardens, Dr Frans Indongo Street, Windhoek, NamibiaIntertek Testing Services Pacific Limited11/F, Unit IJK, Garment Centre, 576 Castle Peak Road, Kowloon, Hong KongIntertek Testing Services Peru S.A.Jr. Mariscal Jose de la Mar No. 200 Urb., Res. El Pino, San Luis, Lima, PeruIntertek Testing Services Philippines, Inc.Intertek Building, 2307 Chino Roces Avenue Extension, Metro Manila, Makati City, 1231, PhilippinesIntertek Testing Services Taiwan Limited8F No. 423 Ruiguang Rd, Neihu District, Taipei, 11492, TaiwanIntertek Testing Services Tianjin Limited2-F, No. 7 GuiYuan Road, Yi Shang Hu Tong Building, Hua Yuan High-tech Industry Park, Tianjin, ChinaIntertek Timor, S.A.Hotel Timor, Colmera, Vera Cruz, Dili, Timor-LesteIntertek Training Malaysia Sdn. Bhd.6-L12-01, Level 12, Tower 2, Menara PGRM, No. 6 & 8 Jalan Pudu Ulu, Cheras, 56100 Kuala Lumpur, MalaysiaIntertek Trinidad Limited#91-92 Union Road, Marabella, Trinidad and TobagoIntertek UK Holdings LimitedIntertek UkraineChernomorskogo Kazachestva, 115, Office 507, Odessa, 65003, UkraineIntertek USA Finance LLCc/o CSC Services of Nevada, Inc., 2215-B Renaissance Dr, Las Vegas NV 89919, United StatesIntertek Vietnam Limited3rd & 4th floor, Au Viet Building, No. 01 Le Duc Tho Str., Mai Dich Ward, Cau Giay District, Hanoi City, VietnamIntertek West Africa SARLRue du Canal de Vridi Face Appontement, SIAP, Abidjan, 15 BP 882, Cote d'IvoireIntertek West Lab ASOljevegen 2, 4056 Tananger, NorwayIntertekGenalysis SI Limitedc/o Baoro & Associates, Top Floor, Y. Sato Building, Point Cruz, Honiara, Solomon IslandsITS (PNG) LimitedSection 27 Allotment 27, Voco Point, Lae, Morobe Province, Papua New GuineaITS Hong Kong NA, Limited (i)
2/F Garment Centre, 576 Castle Peak Road, Kowloon, Hong Kong
Intertek Group plc Annual Report and Accounts 2018 161
Financial Statements

NOTES TO THE FINANCIAL STATEMENTScontinued
23 Principal Group companies (continued)FULLY OWNED SUBSIDIARIES (CONTINUED)ITS Labtest Bangladesh LimitedPhoenix Tower, Plot – 407 (3rd Floor), Tejgaon I/A, Dhaka, BangladeshITS Testing Holdings Canada Limited3771 North Fraser Way, Suite 17, Burnaby BC V5J 5G5, CanadaITS Testing Services (UK) LimitedKJ Tech Services GmbH (ix)
Kirschberg 20, 64347, Griesheim, GermanyLaboratory Services International Rotterdam B.V.Pittsburghstraat 9, 3047 BL, Rotterdam, The NetherlandsLabtest International Inc.2107 Swift Drive, No 200, Oak Brook, Illinois, 60523, United StatesLintec Testing Services LimitedLouisiana Grain Services, Inc. (i)
c/o CT Corp, 8550 United Plaza Blvd, Baton Rouge LA 70809, United StatesMace Land Company, Inc.3114 Scarboro Road, Street MD 21154, United StatesManagement & Industrial Consultancy (i)
59 Road No.104, Second Floor, Maadi, Cairo, EgyptManagement Systems International Limited (i)
Materials Testing & Inspection Services LimitedMaterials Testing Lab, Inc.145 Sherwood Avenue, Farmingdale NY 11735, United StatesMcPhar Geoservices (Philippines) Inc. (i)
Building 7 & 8 Philcrest 1 Compound, Km23 West Service Road, Bo. Cupang, Muntinlupa City, PhilippinesMelbourn Scientific LimitedMelbourn Scientific, Saxon Way, Melbourn, Hertfordshire, Royston, SG8 6DN, United KingdomMetoc LimitedMidwest Engineering Services, Inc.CT Corporation System, 8020 Excelsior Dr., Suite 200, Madison WI 53717, United StatesMoody (Shanghai) Consulting Co., Ltd1F, No. 5 Building, 912 Bibo Road, Zhangjiang Hi-Tech Park, Shanghai, 201203, ChinaMoody Algerie SARLCité SERBAT, Bat. B2/C2, N°03, Garidi 1, 16051, Kouba, Wilaya d'Alger, AlgeriaMoody Energy Technical Service Co LtdRoom A201, B-2 East 3rd, Ring Road North Road, Chaoyang District, Beijing, 100027, ChinaMoody International (Holdings) LimitedMoody International (India) Private LimitedE-20, Block B1, Mohan Co-operative Industrial Area, Mathura Road, New Delhi, 110044, IndiaMoody International (Malaysia) Sdn. Bhd.6-L12-01, Level 12, Tower 2, Menara PGRM, No. 6 & 8 Jalan Pudu Ulu, Cheras, 56100 Kuala Lumpur, MalaysiaMoody International (Russia) LimitedMoody International Angola Ltda (i)
Rua de Macau, Edifico ex Edil Apto 1, Res de Chao Esq. C.P 215, Cabinda, AngolaMoody International Certification India LimitedE-20, Block B1, Mohan Co-operative Industrial Area, Mathura Road, New Delhi, 110044, IndiaMoody International de Argentina SACerrito 1136, 2nd floor CF, Ciudad Autonoma de Buenos Aires, C1010AAX, ArgentinaMoody International Holdings LLC24900 Pitkin Road, Ste. 200, The Woodlands TX 77386, United StatesMoody International LLC (ii)
18A Kikvidze str., 01133, Kiev, UkraineMoody International Philippines, Inc. (i)
Intertek Building, 2310 Chino Roces Avenue Extension, Metro Manila, Makati City, 1231, PhilippinesMoody United Certification Limited (i)
2F, No. 5 Building, 912 Bibo Road, Pudong, Shanghai, 201203, ChinaMT Group LLC145 Sherwood Avenue, Farmingdale NY 11735, United StatesMT Operating of New Jersey, LLC145 Sherwood Avenue, Farmingdale NY 11735, United States
MT Operating of New York, LLC145 Sherwood Avenue, Farmingdale NY 11735, United StatesN T A Monitor Limited NDT Services LimitedNorthern Territory Environmental Laboratories Pty Ltd (i)Level 3, 235 St Georges Terrace, Perth WA 6000, AustraliaNTA Academy LimitedNTA Monitor (M) Sdn BhdNo. 18-B, Jalan Kancil off Jalan Pudu, 55100 Kuala Lumpur, Wilayah Persekutuan, MalaysiaPaulsen & Bayes-Davy Ltd11/F, Unit IJK, Garment Centre, 576 Castle Peak Road, Kowloon, Hong KongPetroleum Services of Union Lab Sdn. Bhd.Suite C-7-10 (B), Level 9, Block C, UE3 Corporate Offices, Menara Uncang Emas, No 85 Jalan Loke Yew, Taman Miharja, 55200 Kuala Lumpur, MalaysiaPittsburgh Testing Laboratory Inc.PSI, 850 Poplar Street, Pittsburgh PA 15220, United StatesProfesionales Contables en Asesoría Empresarial y de Ingenieria S.A.S.Calle 120, No. 45A – 32, Bogota, ColombiaProfessional Service Industries (Canada) Inc. (i)
200 Bay Street, Suite 3800, Royal Bank Plaza, South Tower, Toronto ON M5J 2J7, CanadaProfessional Service Industries Holding, Inc.Corporation Trust Center, 1209 Orange Street, Wilmington, DE 19801, United StatesProfessional Service Industries Engineering, PLLCCT Corporation System, 111 8th Avenue, NY 10011, United StatesProfessional Service Industries, Inc.Corporation Trust Center, 1209 Orange Street, Wilmington, DE 19801, United StatesPSI Acquisitions, Inc.Corporation Service Company, 2711 Centerville Road, Suite 400, Wilmington, DE 19808, United StatesPT. Moody Technical ServicesGraha STR 3rd floor, Suite#302, Jl. Ampera Raya No. 11, Jakarta, 12550, IndonesiaPT. RCG Moody (i)
Graha STR 3rd floor, Suite#302, Jl. Ampera Raya No. 11, Jakarta, 12550, IndonesiaRCG Moody International Uruguay S.A.Cerrito 507, 4th Floor, Off. 46, 47, Montevideo 11000, UruguaySchindler & Associates (L.C.) (i)
24900 Pitkin Road, Suite 200, The Woodlands TX 77386, United StatesShanghai Orient Intertek Testing Services Company LimitedRoom 301,401, No 1,4,5, Lane 2028, Changzhong Road, Jin’an district, Shanghai, China Shanghai Tianxiao Investment Consultancy Company LimitedRoom 520, No. 5-6, Lane 1218, WanRong Road, ZhaBei District, Shanghai, ChinaTechnical Company for Testing and Conformity Services & Systems LLCGates No. 1/2/6, Building 73/ Area 903, Karadah, Al Rusafa, Baghdad, IraqTesting Holdings Sweden ABTorshamnsgatan 43, Box 1103, Kista, S-164 22, SwedenTradegood Singapore Pte. Ltd. (i)
3 Irving Road #05-01 to 05, Tai Seng Centre, 369522, SingaporeTradegood.com International Limited11/F, Unit IJK, Garment Centre, 576 Castle Peak Road, Kowloon, Hong KongVan Sluys & Bayet NVKruisschansweg 11, 2040 Antwerp, BelgiumWhite Land Company, Inc.3114 Scarboro Road, Street MD 21154, United StatesWilson Inspection X-Ray Services, Inc.Michael E Wilson, 6010 Edgewater Dr., Corpus Christi TX 78412, United StatesWisco SE Asia PTE Limited (i)
3 Irving Road #05-01 to 05, Tai Seng Centre, 369522, SingaporeYoungever Holdings Ltd.Ritter House, Wickhams Cay II, Road Town, Tortola, VG 1110, British Virgin Islands
Intertek Group plc Annual Report and Accounts 2018162
Financial Statements | Notes to the financial statements

23 Principal Group companies (continued)RELATED UNDERTAKINGS WHERE THE EFFECTIVE INTEREST IS LESS THAN 100%Admon Labs Servicios Corporativos y Administrativos, S.A. de C.V. (9.99%)Boulevard Adolfo Lopez Mateos #2259, Atlamaya, Alvaro Obregon, Ciudad de Mexico, C.P. 01760, MexicoEuro Mechanical Instrument Services LLC (49%)PO Box 46153, Abu Dhabi, United Arab EmiratesGamatek, S.A. de C.V. (9.99%)Alanis Valdez #2308, Industrial, Monterrey, Nuevo Leon, MexicoGCA Calidad y Analisis de Mexico, S.A. de C.V. (9.99%)Jacarandas #19, San Clemente, Alvaro Obregon, Ciudad de Mexico, C.P. 01740, MexicoInternational Inspection Services LLC (70%)PO Box 193, Al Hamriyah, Muscat, PC 131, OmanIntertek (Qeshm Island) Limited (51%)Unit 107, Goldis Building, Valiasr Boulevard, Qeshm Island, Islamic Republic of IranIntertek Angola LDA (99%)282 Rua Amilcar Cabral no.147 2nd floor, Apartment Z, Luanda, AngolaIntertek ETL SEMKO KOREA Limited (90%)5F, Intertek building, Gongdan-ro, 160beon-gil 3, Gunpo-si, Gyeonggi-do, 15845, Republic of KoreaIntertek Geronimo JV Limited (i) (70%)1, North Industrial Area, Klan Street, Accra, GhanaIntertek GM Testing Service Zhuhai Co., Ltd (70%)55 Guangdong-Macau TCM Park Commercial Service Center, 2522 Huan Dao Bei Road, Hengqin New Area, Zhuhai, Guangdong, ChinaIntertek Kimsco Co. Ltd. (50%)Intertek Building, 3, Gongdan-ro, 160beon-gil, Gunpo-si, Gyeonggi-do, 15845, Republic of KoreaIntertek Lanka (Private) Limited (70%)Intertek House, No: 282, Kaduwela Road, Battaramulla, Sri LankaIntertek Libya Technical Services and Consultations Company Spa (65%)P.O Box 3788, Hay Alandalus, Gargaresh, Tripoli, LibyaIntertek Life Bridge (Shanghai) Testing Services Co., Ltd. (80%)Room 401, Building #5-6, Lane 1218, WanRong Road, JinAn District, Shanghai, Shandong, ChinaIntertek Robotic Laboratories Pty Limited (50%)15 Davison Street, Maddington, WA 6109, AustraliaIntertek South Africa Holdings (Pty) Ltd (75%)5th Floor, Charter House, 13 Brand Road, Glenwood, Kwazulu-Natal, South AfricaIntertek Test Hizmetleri Anonim Sirketi (85%)Merkez Mahallesi, Sanayi Cad. No.23, Altindag Plaza, Yenibosna-34197, Istanbul, TurkeyIntertek Testing Services (Hangzhou) Limited (70%)No. 16, First Street South, Hangzhou Economic Development Zone, Hangzhou, Zhejiang Province, 310018, ChinaIntertek Testing Services (South Africa) (Proprietary) Limited (49.5%)5th Floor, Charter House, 13 Brand Road, Glenwood, Durban, South AfricaIntertek Testing Services Korea Limited (50%)1st Fl., Aju Digital Tower, 284-56, Seongsu-dong 2-ga, Seongdong-gu, Seoul 133-120, Republic of KoreaIntertek Testing Services Nigeria Limited (60%)No. 2 Bombay Crescent, Apapa, Lagos, NigeriaIntertek Testing Services Sichuan Co., Ltd (90%)No 1, Jiuxiang Blvd, Pharmacy Industry Park, Luzhou National High Technology District, Sichuan, ChinaIntertek Testing Services Wuxi Ltd (70%)No. 8 Fubei Road, Xishan Economic Development Zone, Wuxi, Jiangsu, 214101, ChinaITS (Subic Bay), Inc. (99%)Area 8 – 10, Lots 11/12 Boton Wharf, Argonaut Highway, Subic Bay, Freeport Zone, Olongapo City, PhilippinesITS Caleb Brett Deniz Survey A S(viii) (50%)Ulus Mah. Oz Topuz cad. no.32, Besiktas, Istanbul, 34340, TurkeyITS Testing Services (M) Sdn Bhd (74%)Unit 30-01, Level 30, Tower A, Vertical Business Suite, Avenue 3, Bangsar South, No.8, Jalan Kerinchi, 59200 Kuala Lumpur, MalaysiaITS Testing Services Holdings (M) Sdn Bhd (49%)Unit 30-01 Level 30, Tower A, Vertical Business Suite, Avenue 3, Bangsar South, No. 8, Jalan Kerinchi, 59200 Kuala Lumpur, MalaysiaLaboratorio Fermi S.A. de C.V. (10%)Jacarandes #15, San Clemente, Alvaro Obregon, Ciudad de Mexico, C.P. 01740, Mexico
Laboratorios ABC Química, Investigación y Análisis, S.A. de C.V.(vii) (10%)Jacarandas #19, San Clemente, Alvaro Obregón, Ciudad de Mexico, C.P. 01740, MexicoMoody International Bangladesh Limited (99.9%)House 6, Road 17/A, Block E, Ground Floor, Banani, Dhaka, 1213, BangladeshMoody International Holdings Chile Ltda (99%)Avenida Las Condes N° 11287 Torre A, oficina 301 A Las Condes, Santiago, ChileMoody International Lanka (Private) Ltd. (99.9%)no.5, St Albans Place, Colombo-4, Sri LankaPT Citrabuana Indoloka (viii) (50%)Jl. Raya Bogor KM 28, RT/RW. 04/07, Kel. Pekayon, Kec. Pasar Rebo, Jakarta Timur, 13710, IndonesiaPT. Intertek Utama Services (viii) (50%)Jl. Raya Bogor KM. 28, RT/RW. 04/07, Kel. Pekayon, Kec. Pasar Rebo, Jakarta Timur, 13710, IndonesiaQatar Calibration Services LLC (49%)Petrotec, PO Box 16069, 8th Floor, Toyota Tower, Doha, QatarRCG Moody International de Venezuela S.A. (i) (99%)Res Morgana, p_4, #04, Av.Andres Bello, Fco de Miranda, Los Polos Grandes, Caracas, VenezuelaShanghai Moody Management & Technical Services Co. Ltd (i) (90%)Room 225, No. 14 at Lane No. 1700 Luo Shan Road, Shanghai, ChinaSociete Tunisienne d’Inspection Caleb Brett SARL (51%)67 rue Ech-Chem, Tunis, 1002, TunisiaUzIntertek Testing Services LLC (51%)Abdulla Kodiriy Str., C-4, House 24,100017, Tashkent, Uzbekistan
ASSOCIATESDecernis LLC (20%)1250 Connecticut Avenue, NW, Suite 200, Washington WA DC 20036, United StatesLynx Diagnostics Inc.(viii) (50%)#220, 8 Perron Street, St Albert AB T8N 1E4, CanadaMoody International Certification Limited (40%)Brivibas iela 85, Riga, LV-1001, LatviaMoody International Certification Ltd (40%)53, Nautic, Triq l-Ortolan, San Gwann, SGN 1943, MaltaMoody International Morocco (30%)28, Rue de Provins, 2 eme etage, Casablanca, MoroccoMoody International SA (35%)4 Rue Des Brasseurs, Zone 3 Abidjan, Cote d'Ivoire
(i) Dormant.(ii) In Liquidation/Strike off requested.(iii) Ownership held in class of A shares and B shares.(iv) Ownership held in class of A shares and E shares.(v) Ownership held in ordinary and preference shares.(vi) Shares held in Class A, B, C, D, E and F.(vii) Ownership held in class I Series B shares and class II Series B shares.(viii) Intertek shares joint control over the company under a shareholders’
agreement, and its rights to the profit, assets and liabilities of the company are dependent on the performance of the Group’s brands rather than the effective equity ownership of the company.
(ix) Ownership held in No.1 shares and No.2 shares.
Intertek Group plc Annual Report and Accounts 2018 163
Financial Statements

As at 31 December 2018 Notes2018
£m2017
£m
Fixed assetsInvestments in subsidiary undertakings (D) 334.4 324.9
Current assetsDebtors due within one year (E) 634.5 187.6Cash at bank and in hand 0.3 0.3
634.8 187.9Creditors due within one yearOther creditors (F) (284.5) (164.1)
(284.5) (164.1)Net current assets 350.3 23.8Total assets less current liabilities 684.7 348.7
Net assets 684.7 348.7
Capital and reservesCalled up share capital (G) 1.6 1.6Share premium (G) 257.8 257.8Profit and loss account (G) 425.3 89.3Shareholders’ funds 684.7 348.7
The profit for the financial year was £469.1m (2017: £1.6m loss).
The financial statements on pages 164 to 168 were approved by the Board on 4 March 2019 and were signed on its behalf by:
André Lacroix Ross McCluskeyChief Executive Officer Chief Financial Officer
INTERTEK GROUP PLC – COMPANY BALANCE SHEET
Intertek Group plc Annual Report and Accounts 2018164
Financial Statements | Intertek Group plc – Company primary statements and notes

Notes
Sharecapital
£m
Sharepremium
£m
Retainedearnings
£m
Totalequity
£m
At 1 January 2017 1.6 257.8 202.0 461.4Total comprehensive income for the yearLoss (B) – – (1.6) (1.6)Total comprehensive income for the year – – (1.6) (1.6)Transactions with owners of the company recognised
directly in equityContributions by and distributions to the owners
of the companyDividends paid (C) – – (107.0) (107.0)Purchase of own shares – – (15.6) (15.6)Tax paid on Share Awards vested – – (6.3) (6.3)Equity-settled transactions (D) – – 17.8 17.8Total contributions by and distributions to the owners
of the company – – (111.1) (111.1)At 31 December 2017 1.6 257.8 89.3 348.7
At 1 January 2018 1.6 257.8 89.3 348.7Total comprehensive income for the yearProfit (B) – – 469.1 469.1Total comprehensive income for the year – – 469.1 469.1Transactions with owners of the company recognised
directly in equityContributions by and distributions to the owners of
the companyDividends paid (C) – – (128.3) (128.3)Purchase of own shares – – (16.7) (16.7)Tax paid on Share Awards vested – – (9.0) (9.0)Equity-settled transactions (D) – – 20.9 20.9Total contributions by and distributions to the owners
of the company – – (133.1) (133.1)At 31 December 2018 1.6 257.8 425.3 684.7
INTERTEK GROUP PLC – COMPANY STATEMENT OF CHANGES IN EQUITY
Intertek Group plc Annual Report and Accounts 2018 165
Financial Statements

NOTES TO THE COMPANY FINANCIAL STATEMENTS
(A) ACCOUNTING POLICIES – COMPANYThe following accounting policies have been applied consistently in dealing with items which are considered material in relation to the Company’s financial statements.
Basis of preparationThese financial statements were prepared in accordance with Financial Reporting Standard 101 Reduced Disclosure Framework (‘FRS 101’).
In preparing these financial statements, the Company applies the recognition, measurement and disclosure requirements of International Financial Reporting Standards as adopted by the EU (‘Adopted IFRSs’), but makes amendments where necessary in order to comply with Companies Act 2006 and has set out below where advantage of the FRS 101 disclosure exemptions has been taken.
In these financial statements, the Company has applied the exemptions available under FRS 101 in respect of the following disclosures:
• a Cash Flow Statement and related notes;• comparative period reconciliations for share capital;• disclosures in respect of transactions with wholly owned subsidiaries;• disclosures in respect of capital management; • the effects of new, but not yet effective, IFRSs; • an additional balance sheet for the beginning of the earliest comparative period following the retrospective change
in accounting policy; • disclosures in respect of the compensation of Key Management Personnel; and• certain disclosures required by IFRS 13 Fair Value Measurement and the disclosures required by IFRS 7 Financial Instrument
Disclosures on the basis that the consolidated financial statements include the equivalent disclosures.
As the consolidated financial statements include the equivalent disclosures, the Company has also taken the exemptions under FRS 101 available in respect of IFRS 2 Share Based Payments in respect of Group-settled share-based payments.
The Company proposes to continue to adopt the reduced disclosure framework of FRS 101 in its next financial statements.
Under Section 408 of the Companies Act 2006 the Company is exempt from the requirement to present its own profit and loss account.
The accounting policies set out below have, unless otherwise stated, been applied consistently to all periods presented in these financial statements.
Foreign currenciesTransactions in foreign currencies are recorded to the Company’s functional currency, Sterling, using the rate of exchange ruling at the date of the transaction. Monetary assets and liabilities in foreign currencies are translated into sterling at the rates of exchange prevailing at the balance sheet date. All foreign exchange differences are taken to the profit and loss account.
TaxationTax on the profit or loss for the year comprises current and deferred tax. Tax is recognised in the profit and loss account except to the extent that it relates to items recognised directly in equity or other comprehensive income, in which case it is recognised directly in equity or other comprehensive income.
Current tax is the expected tax payable or receivable on the taxable income or loss for the year, using tax rates enacted or substantively enacted at the balance sheet date, and any adjustment to tax payable in respect of previous years.
Deferred tax is provided on temporary differences between the carrying amounts of assets and liabilities for financial reporting purposes and the amounts used for taxation purposes. The following temporary differences are not provided for: the initial recognition of goodwill; the initial recognition of assets or liabilities that affect neither accounting nor taxable profit other than in a business combination; and differences relating to investments in subsidiaries to the extent that they will probably not reverse in the foreseeable future. The amount of deferred tax provided is based on the expected manner of realisation or settlement of the carrying amount of assets and liabilities, using tax rates enacted or substantively enacted at the balance sheet date.
A deferred tax asset is recognised only to the extent that it is probable that future taxable profits will be available against which the temporary difference can be utilised.
Intertek Group plc Annual Report and Accounts 2018166
Financial Statements | Notes to the Company financial statements

Dividends on shares presented within shareholders’ fundsDividend income is recognised in profit or loss on the date that the Company’s right to receive payment is established. Dividends unpaid at the balance sheet date are only recognised as a liability at that date to the extent that they are appropriately authorised and are no longer at the discretion of the Company. Unpaid dividends that do not meet these criteria are disclosed in the notes to the financial statements.
Investments in subsidiariesInvestments in subsidiaries are stated at cost less any provisions for impairment.
Intercompany financial guaranteesWhen the Company enters into financial guarantee contracts to guarantee the indebtedness of other companies in the Group, the Company considers these to be insurance arrangements and accounts for them as such. In this respect the Company treats the guarantee contract as a contingent liability, until such time as it becomes probable that the Company will be required to make a payment under the guarantee.
Share-based paymentsIntertek Group plc runs a share ownership programme that allows Group employees to acquire shares in the Company. Details of the share schemes are given in note 17 of the Group financial statements.
Significant new accounting policies• IFRS 9 Financial Instruments and IFRS 15 Revenue from contracts with customers came into effect on 1 January 2018.
Management has performed its review of IFRS 9 and having assessed the history of credit losses no provisions have been made in the Company financial statements. As a result of implementing the new standard there has been no material impact in the year ending 31 December 2018. IFRS 15 is not relevant to the Company as there is no revenue from contracts with customers. Further details of the work performed around these standards are given in note 1 of the Group financial statements.
(B) PROFIT AND LOSS ACCOUNTAmounts paid to the Company’s auditor and their associates in respect of services to the Company, other than the audit of the Company’s financial statements, have not been disclosed as the information is required instead to be disclosed on a consolidated basis. The Company does not have any employees.
Details of the remuneration of the Directors are set out in the Remuneration report.
(C) DIVIDENDSThe aggregate amount of dividends comprises:
2018£m
2017£m
Final dividend paid in respect of prior year but not recognised as a liability in that year 76.9 69.2Interim dividends paid in respect of the current year 51.4 37.8Aggregate amount of dividends paid in the financial year 128.3 107.0
The aggregate amount of dividends proposed and recognised as liabilities as at 31 December 2018 is £nil (2017: £nil). The aggregate amount of dividends proposed and not recognised as liabilities as at 31 December 2018 is £108.5m (2017: £77.1m).
(D) INVESTMENT IN SUBSIDIARY UNDERTAKINGS
2018£m
2017£m
Cost and net book valueAt 1 January 324.5 318.1Additions due to share-based payments 20.9 17.4Recharges of share-based payments to subsidiaries (11.0) (11.0)At 31 December 334.4 324.5
The Company has made Share Awards to the employees of its directly and indirectly owned subsidiaries, and as such, the Company recognises an increase in the cost of investment in subsidiaries of £20.9m (2017: £17.4m). Details of the principal operating subsidiaries are set out in note 23 to the Group financial statements.
The Company had two direct subsidiary undertakings at 31 December 2018: Intertek Testing Services Holdings Limited and Intertek Holdings Limited, both of which are holding companies, are incorporated in the United Kingdom and registered in England and Wales. All interests are in the ordinary share capital and all are wholly owned. In the opinion of the Directors, the value of the investments in subsidiary undertakings is not less than the amount at which the investments are stated in the balance sheet.
There is no impairment to the carrying value of these investments.
Intertek Group plc Annual Report and Accounts 2018 167
Financial Statements

NOTES TO THE COMPANY FINANCIAL STATEMENTScontinued
(E) DEBTORS DUE WITHIN ONE YEAR
2018£m
2017£m
Amounts owed by Group undertakings 634.5 187.6
The amounts owed by Group undertakings represent loans that carry interest based on the denomination of the borrowing currency.
(F) CREDITORS DUE WITHIN ONE YEAR
2018£m
2017£m
Amounts owed to Group undertakings 284.5 164.1
The amounts owed to Group undertakings represent loans that carry interest based on the denomination of the borrowing currency.
(G) STATEMENT OF CHANGES IN EQUITYDetails of share capital are set out in note 15 and details of share-based payments are set out in note 17 to the Group financial statements.
A profit and loss account for Intertek Group plc has not been presented as permitted by Section 408 of the Companies Act 2006. The profit for the financial year, before dividends paid to shareholders of £128.3m (2017: £107.0m), was £469.1m (2017: £1.6m loss) which was mainly in respect of dividend income in relation to 2018.
The Company has sufficient distributable reserves to pay the 2018 final dividend and the anticipated 2019 interim dividend. When required the Company can receive additional dividends from its subsidiaries to further increase distributable reserves.
The Group settled in cash the tax element of the Share Awards vested in 2018 amounting to £9.9m of which the Company settled £9.0m (2017: £6.3 m).
During the year ended 31 December 2018, the Company purchased, through its Employee Benefit Trust, 340,000 (2017: 350,000) of its own shares with an aggregate nominal value of £3,400 (2017: £3,500) for £16.7m (2017: £15.6m) which was charged to profit and loss in equity.
(H) RELATED PARTY TRANSACTIONSDetails of related party transactions are set out in note 21 of the Group financial statements.
(I) CONTINGENT LIABILITIESThe Company is a member of a group of UK companies that are part of a composite banking cross-guarantee arrangement. This is a joint and several guarantee given by all members of the Intertek UK cash pool, guaranteeing the total gross liability position of the pool which was £3.4m at 31 December 2018 (2017: £1.5m).
From time to time, in the normal course of business, the Company may give guarantees in respect of certain liabilities of subsidiary undertakings.
(J) POST-BALANCE SHEET EVENTSDetails of post-balance sheet events relevant to the Company and the Group are given in note 18 of the Group financial statements.
Intertek Group plc Annual Report and Accounts 2018168
Financial Statements | Notes to the Company financial statements
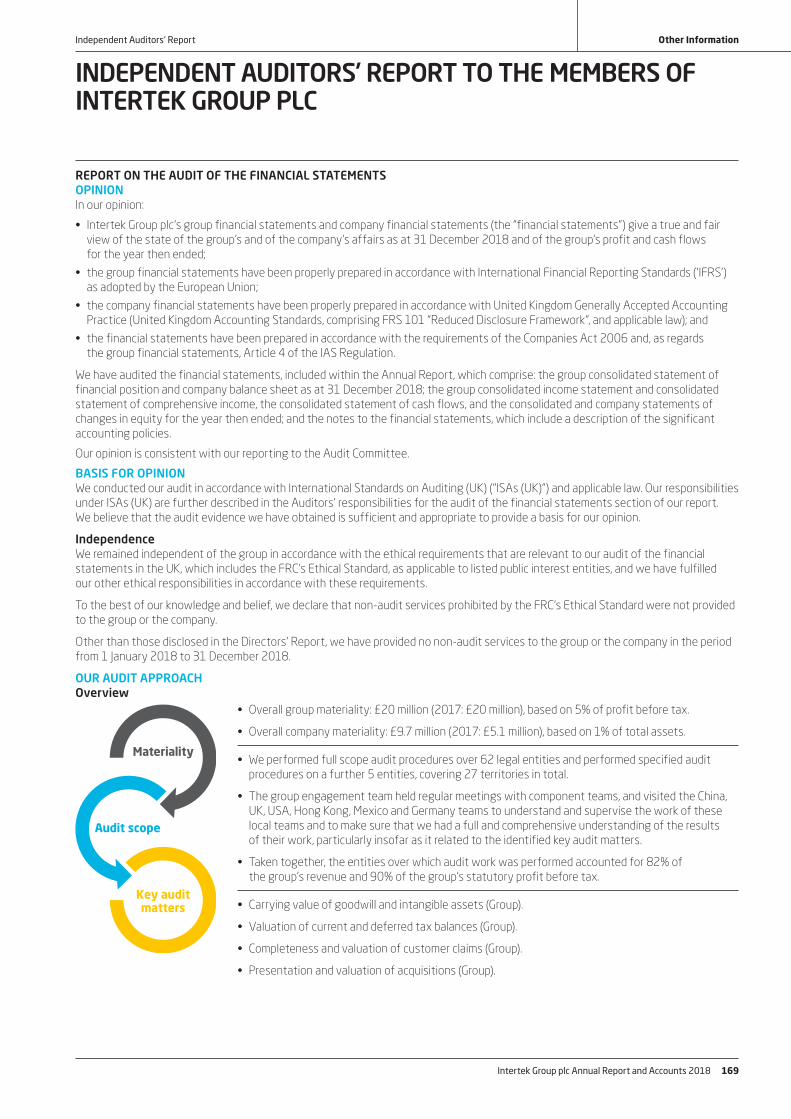
REPORT ON THE AUDIT OF THE FINANCIAL STATEMENTSOPINIONIn our opinion:
• Intertek Group plc’s group financial statements and company financial statements (the “financial statements”) give a true and fair view of the state of the group’s and of the company’s affairs as at 31 December 2018 and of the group’s profit and cash flows for the year then ended;
• the group financial statements have been properly prepared in accordance with International Financial Reporting Standards ('IFRS') as adopted by the European Union;
• the company financial statements have been properly prepared in accordance with United Kingdom Generally Accepted Accounting Practice (United Kingdom Accounting Standards, comprising FRS 101 “Reduced Disclosure Framework”, and applicable law); and
• the financial statements have been prepared in accordance with the requirements of the Companies Act 2006 and, as regards the group financial statements, Article 4 of the IAS Regulation.
We have audited the financial statements, included within the Annual Report, which comprise: the group consolidated statement of financial position and company balance sheet as at 31 December 2018; the group consolidated income statement and consolidated statement of comprehensive income, the consolidated statement of cash flows, and the consolidated and company statements of changes in equity for the year then ended; and the notes to the financial statements, which include a description of the significant accounting policies.
Our opinion is consistent with our reporting to the Audit Committee.
BASIS FOR OPINIONWe conducted our audit in accordance with International Standards on Auditing (UK) (“ISAs (UK)”) and applicable law. Our responsibilities under ISAs (UK) are further described in the Auditors’ responsibilities for the audit of the financial statements section of our report. We believe that the audit evidence we have obtained is sufficient and appropriate to provide a basis for our opinion.
IndependenceWe remained independent of the group in accordance with the ethical requirements that are relevant to our audit of the financial statements in the UK, which includes the FRC’s Ethical Standard, as applicable to listed public interest entities, and we have fulfilled our other ethical responsibilities in accordance with these requirements.
To the best of our knowledge and belief, we declare that non-audit services prohibited by the FRC’s Ethical Standard were not provided to the group or the company.
Other than those disclosed in the Directors’ Report, we have provided no non-audit services to the group or the company in the period from 1 January 2018 to 31 December 2018.
OUR AUDIT APPROACHOverview
Materiality
Audit scope
Key auditmatters
• Overall group materiality: £20 million (2017: £20 million), based on 5% of profit before tax.
• Overall company materiality: £9.7 million (2017: £5.1 million), based on 1% of total assets.
• We performed full scope audit procedures over 62 legal entities and performed specified audit procedures on a further 5 entities, covering 27 territories in total.
• The group engagement team held regular meetings with component teams, and visited the China, UK, USA, Hong Kong, Mexico and Germany teams to understand and supervise the work of these local teams and to make sure that we had a full and comprehensive understanding of the results of their work, particularly insofar as it related to the identified key audit matters.
• Taken together, the entities over which audit work was performed accounted for 82% of the group’s revenue and 90% of the group’s statutory profit before tax.
• Carrying value of goodwill and intangible assets (Group).
• Valuation of current and deferred tax balances (Group).
• Completeness and valuation of customer claims (Group).
• Presentation and valuation of acquisitions (Group).
INDEPENDENT AUDITORS' REPORT TO THE MEMBERS OF INTERTEK GROUP PLC
Intertek Group plc Annual Report and Accounts 2018 169
Other InformationIndependent Auditors' Report

INDEPENDENT AUDITORS' REPORT TO THE MEMBERS OF INTERTEK GROUP PLC continued
The scope of our auditAs part of designing our audit, we determined materiality and assessed the risks of material misstatement in the financial statements.
Capability of the audit in detecting irregularities, including fraudBased on our understanding of the group and industry, we identified that the principal risks of non-compliance with laws and regulations related to indirect and direct tax laws and anti-bribery laws, and we considered the extent to which non-compliance might have a material effect on the financial statements. We also considered those laws and regulations that have a direct impact on the preparation of the financial statements such as the Companies Act 2006. We evaluated management’s incentives and opportunities for fraudulent manipulation of the financial statements (including the risk of override of controls), and determined that the principal risks were related to posting inappropriate journal entries to increase revenue or reduce expenditure, and management bias in accounting estimates. The group engagement team shared this risk assessment with the component auditors so that they could include appropriate audit procedures in response to such risks in their work. Audit procedures performed by the group engagement team and/or component auditors included: understanding management’s approach to ensuring compliance with laws and regulations; enquiries with local, regional and group management; meeting with group and local legal counsel to discuss legal matters; meeting with internal audit; obtaining legal confirmations; testing manual journals and focusing testing on balances and transactions, in addition to those listed as key audit matters below, that are subject to estimation, such as contract assets.
There are inherent limitations in the audit procedures described above and the further removed non-compliance with laws and regulations is from the events and transactions reflected in the financial statements, the less likely we would become aware of it. Also, the risk of not detecting a material misstatement due to fraud is higher than the risk of not detecting one resulting from error, as fraud may involve deliberate concealment by, for example, forgery or intentional misrepresentations, or through collusion.
Key audit mattersKey audit matters are those matters that, in the auditors’ professional judgement, were of most significance in the audit of the financial statements of the current period and include the most significant assessed risks of material misstatement (whether or not due to fraud) identified by the auditors, including those which had the greatest effect on: the overall audit strategy; the allocation of resources in the audit; and directing the efforts of the engagement team. These matters, and any comments we make on the results of our procedures thereon, were addressed in the context of our audit of the financial statements as a whole, and in forming our opinion thereon, and we do not provide a separate opinion on these matters. This is not a complete list of all risks identified by our audit.
KEY AUDIT MATTER HOW OUR AUDIT ADDRESSED THE KEY AUDIT MATTER
Carrying value of goodwill and intangible assets (Group).Refer to the Audit Committee report on page 85 and to note 9 in the financial statements.
The group had £874.9m of goodwill and a further £329.5m of other intangible assets recognised on the balance sheet at 31 December 2018. The carrying values of goodwill and intangible assets are dependent on future cash flows of the underlying Cash Generating Units ('CGUs') and there is a risk that, if these cash flows do not meet the directors’ expectations, the assets may be impaired.
Accounting standards require management to perform an annual assessment of the carrying value of goodwill, and other intangible assets are assessed where there are indications that they are impaired. As this assessment is based on the future value in use, and a significant amount of value is based on the value to perpetuity of the CGUs, future cash flows must be estimated, which can be highly judgemental and could significantly impact the carrying value of the assets.
We evaluated future cash flow forecasts, and the process by which they were drawn up, including comparing them to the latest Board-approved budgets, and testing the underlying calculations and assumptions. We identified no issues in this testing.
We used our in-house valuation specialists to evaluate the methodology used to calculate the value in use of the CGUs and key assumptions including:
• the discount rate by comparing the cost of capital for the group with comparable organisations; and
• the long-term growth rates by comparing these to publicly available market data on projected growth rates in key territories such as the UK, USA and China.
We concluded that they were within the range of reasonable assumptions based on this information.
We performed sensitivity analysis around these assumptions. Having ascertained the extent of change in those assumptions that either individually or collectively would be required for an impairment to arise, we considered the likelihood of such a movement occurring.
Our testing did not identify any indicators of impairment, and that it would require significant downside changes before any impairment would be triggered.
In addition we assessed the appropriateness of the CGUs used in the impairment assessment, the useful economic lives of the intangible assets and the related disclosures, and concluded that these were appropriate.
Intertek Group plc Annual Report and Accounts 2018170
Other Information | Independent Auditors' Report
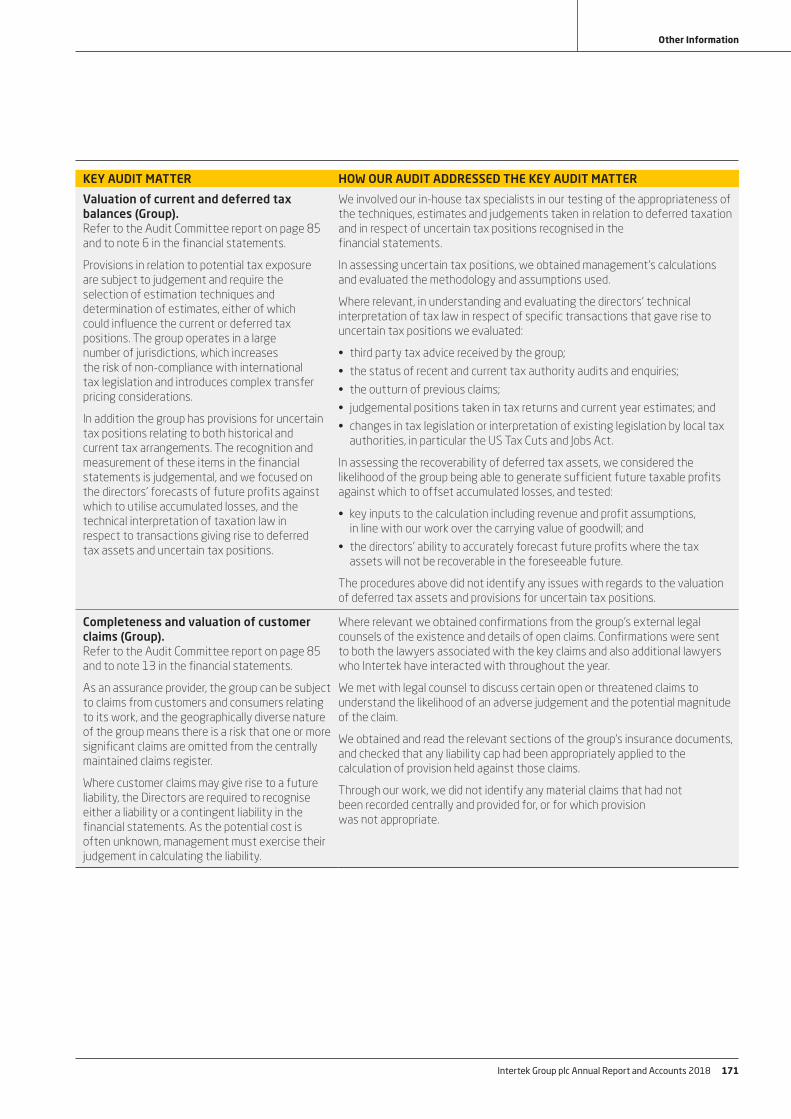
KEY AUDIT MATTER HOW OUR AUDIT ADDRESSED THE KEY AUDIT MATTER
Valuation of current and deferred tax balances (Group).Refer to the Audit Committee report on page 85 and to note 6 in the financial statements.
Provisions in relation to potential tax exposure are subject to judgement and require the selection of estimation techniques and determination of estimates, either of which could influence the current or deferred tax positions. The group operates in a large number of jurisdictions, which increases the risk of non-compliance with international tax legislation and introduces complex transfer pricing considerations.
In addition the group has provisions for uncertain tax positions relating to both historical and current tax arrangements. The recognition and measurement of these items in the financial statements is judgemental, and we focused on the directors’ forecasts of future profits against which to utilise accumulated losses, and the technical interpretation of taxation law in respect to transactions giving rise to deferred tax assets and uncertain tax positions.
We involved our in-house tax specialists in our testing of the appropriateness of the techniques, estimates and judgements taken in relation to deferred taxation and in respect of uncertain tax positions recognised in the financial statements.
In assessing uncertain tax positions, we obtained management’s calculations and evaluated the methodology and assumptions used.
Where relevant, in understanding and evaluating the directors’ technical interpretation of tax law in respect of specific transactions that gave rise to uncertain tax positions we evaluated:
• third party tax advice received by the group;
• the status of recent and current tax authority audits and enquiries;
• the outturn of previous claims;
• judgemental positions taken in tax returns and current year estimates; and
• changes in tax legislation or interpretation of existing legislation by local tax authorities, in particular the US Tax Cuts and Jobs Act.
In assessing the recoverability of deferred tax assets, we considered the likelihood of the group being able to generate sufficient future taxable profits against which to offset accumulated losses, and tested:
• key inputs to the calculation including revenue and profit assumptions, in line with our work over the carrying value of goodwill; and
• the directors’ ability to accurately forecast future profits where the tax assets will not be recoverable in the foreseeable future.
The procedures above did not identify any issues with regards to the valuation of deferred tax assets and provisions for uncertain tax positions.
Completeness and valuation of customer claims (Group).Refer to the Audit Committee report on page 85 and to note 13 in the financial statements.
As an assurance provider, the group can be subject to claims from customers and consumers relating to its work, and the geographically diverse nature of the group means there is a risk that one or more significant claims are omitted from the centrally maintained claims register.
Where customer claims may give rise to a future liability, the Directors are required to recognise either a liability or a contingent liability in the financial statements. As the potential cost is often unknown, management must exercise their judgement in calculating the liability.
Where relevant we obtained confirmations from the group’s external legal counsels of the existence and details of open claims. Confirmations were sent to both the lawyers associated with the key claims and also additional lawyers who Intertek have interacted with throughout the year.
We met with legal counsel to discuss certain open or threatened claims to understand the likelihood of an adverse judgement and the potential magnitude of the claim.
We obtained and read the relevant sections of the group’s insurance documents, and checked that any liability cap had been appropriately applied to the calculation of provision held against those claims.
Through our work, we did not identify any material claims that had not been recorded centrally and provided for, or for which provision was not appropriate.
Intertek Group plc Annual Report and Accounts 2018 171
Other Information

INDEPENDENT AUDITORS' REPORT TO THE MEMBERS OF INTERTEK GROUP PLC continued
KEY AUDIT MATTER HOW OUR AUDIT ADDRESSED THE KEY AUDIT MATTER
Presentation and valuation of acquisitions (Group).Refer to the Audit Committee report on page 85 and to note 10 in the financial statements.
The group’s strategy is to use acquisitions to augment organic revenue growth, and during the year made four acquisitions: Aldo Abela Surveys Limited, Proasem S.A.S., NTA Monitor Limited and Alchemy Investment Holdings, Inc.. In addition, the 12-month hindsight period for reassessing the provisional purchase price allocation in respect of the KJ Tech Services GmbH and Acumen Security LLC acquisitions closed during the year.
Judgement is required in determining the amount of consideration paid and the valuation of assets and liabilities acquired. In addition, the disclosure requirements in respect of acquisitions are extensive.
For these transactions we obtained and read the sale and purchase agreements ('SPAs') in order to gain an understanding of the key terms of each transaction.
In testing acquisitions during the year we:
• tested that the consideration paid by the group was consistent with the terms of the SPAs;
• assessed the appropriateness of the directors’ identification of intangible assets acquired by reference to the SPAs, due diligence reports and other supporting documentation, to identify any assets listed;
• obtained the directors’ calculation of the fair value of intangible assets acquired, and where material corroborated the inputs and assumptions to supporting evidence;
• verified that the accounting treatment for each transaction, and any resulting liabilities, is consistent with the accounting standard requirements;
• assessed the reasonableness of the inputs and assumptions used in calculating contingent consideration; and
• assessed the accounting policies applied by the new subsidiaries against the accounting standard requirements, particularly in relation to deferred revenue.
We noted no material exceptions through performing these procedures.
For the acquisitions made in 2017, in order to test the directors’ final assessment of the purchase price allocation, we:
• obtained evidence from internal and external advisors in relation to the fair value of liabilities recognised on acquisition, to evaluate whether the valuation remained appropriate, or that any adjustments were supported; and
• evaluated whether all fair value adjustments, and any resulting impact, had been appropriately recognised and accounted for.
Based on the evidence obtained, we did not identify any indications that the fair value adjustments identified by management were inappropriate. We are also satisfied that the disclosures included in note 10 are appropriate.
We determined that there were no key audit matters specifically applicable to the company to communicate in our report.
How we tailored the audit scopeWe tailored the scope of our audit to ensure that we performed enough work to be able to give an opinion on the financial statements as a whole, taking into account the structure of the group and the company, the accounting processes and controls, and the industry in which they operate.
The group is split into three reporting segments: Products, Trade and Resources and the operations are spread across over 100 countries and approximately 500 legal entities. The results are not consolidated at a country or regional level, so we determined that the most appropriate level at which to scope our audit was the legal entity level.
When determining our scope, the key financial measure used was profit before tax. Due to the disaggregation of the group’s results across the various entities, we identified only two individually financially significant legal entities, both within China. As a result we instructed our component team to perform audits of the complete financial information of these entities.
We then considered the 50 countries in which PwC are appointed statutory auditor. Of these, 25 accounted for the majority of external profit, and we therefore focused our considerations on these territories. Within these countries, we then excluded any legal entities with no external balances, such as intermediate holding companies, and those entities with highly immaterial revenue, leaving 55 legal entities for which we instructed our local teams to perform audits of the complete financial information for the purpose of the group audit.
In certain territories, notably the USA, Canada and Brazil, there is no statutory audit requirement and so we considered whether procedures needed to be performed to supplement our coverage. We selected seven of the largest entities in the US and Canada for full scope audits, representing those with the largest contribution to Group profit, and a further one entity in the USA and two entities in Brazil, over which we performed specified procedures over the complete financial information.
We also identified a further two entities in Japan over which we instructed specific audit procedures to be performed over revenue and receivables to supplement coverage over these key financial line items.
Intertek Group plc Annual Report and Accounts 2018172
Other Information | Independent Auditors' Report

In total we performed procedures over 67 legal entities in 27 countries, which together accounted for 82% of the group’s revenue and 90% of the group’s profit before tax.
During the year, members of the group engagement team visited the China, UK, USA, Hong Kong, Mexico and Germany component teams, and we held planning workshops with seven of the largest in scope component teams, in order to understand and supervise the audit approach in those locations and to inform them of our audit approach and strategy.
This, together with additional procedures performed at the group level (including audit procedures over material head office entities, tax, legal claims, impairment assessments and consolidation adjustments), gave us the evidence we needed for our opinion on the financial statements as a whole.
MaterialityThe scope of our audit was influenced by our application of materiality. We set certain quantitative thresholds for materiality. These, together with qualitative considerations, helped us to determine the scope of our audit and the nature, timing and extent of our audit procedures on the individual financial statement line items and disclosures and in evaluating the effect of misstatements, both individually and in aggregate on the financial statements as a whole.
Based on our professional judgement, we determined materiality for the financial statements as a whole as follows:
GROUP FINANCIAL STATEMENTS COMPANY FINANCIAL STATEMENTS
Overall materiality £20 million (2017: £20 million). £9.7 million (2017: £5.1 million).
How we determined it 5% of profit before tax. 1% of total assets.
Rationale for benchmark applied
We believe that profit before tax is the primary measure used by the members in assessing the performance of the group.
These are a single set of company financial statements for an entity which has no external revenue and takes advantage of the exemption offered under S408 of Companies Act 2006 not to present its income statement in its financial statements - which are presented alongside the group financial statements within the Annual Report. As a result, the determination of materiality was based on the total assets of this non-trading holding company within the group.
For each component in the scope of our group audit, we allocated a materiality that is less than our overall group materiality. The range of materiality allocated across components was between £1.3million and £9.7million. Certain components were audited to a local statutory audit materiality that was also less than our overall group materiality.
We agreed with the Audit Committee that we would report to them misstatements identified during our audit above £1 million (group audit) (2017: £ 900,000) and £1 million (company audit) (2017: £ 900,000) as well as misstatements below those amounts that, in our view, warranted reporting for qualitative reasons.
Going concernIn accordance with ISAs (UK) we report as follows:
REPORTING OBLIGATION OUTCOME
We are required to report if we have anything material to add or draw attention to in respect of the directors’ statement in the financial statements about whether the directors considered it appropriate to adopt the going concern basis of accounting in preparing the financial statements and the directors’ identification of any material uncertainties to the group’s and the company’s ability to continue as a going concern over a period of at least twelve months from the date of approval of the financial statements.
We have nothing material to add or to draw attention to.
However, because not all future events or conditions can be predicted, this statement is not a guarantee as to the group’s and company’s ability to continue as a going concern. For example, the terms on which the United Kingdom may withdraw from the European Union, which is currently due to occur on 29 March 2019, are not clear, and it is difficult to evaluate all of the potential implications on the group’s and company’s trade, customers, suppliers and the wider economy.
We are required to report if the directors’ statement relating to Going Concern in accordance with Listing Rule 9.8.6R(3) is materially inconsistent with our knowledge obtained in the audit.
We have nothing to report.
Intertek Group plc Annual Report and Accounts 2018 173
Other Information
INDEPENDENT AUDITORS' REPORT TO THE MEMBERS OF INTERTEK GROUP PLC continued
REPORTING ON OTHER INFORMATIONThe other information comprises all of the information in the Annual Report other than the financial statements and our auditors’ report thereon. The directors are responsible for the other information. Our opinion on the financial statements does not cover the other information and, accordingly, we do not express an audit opinion or, except to the extent otherwise explicitly stated in this report, any form of assurance thereon.
In connection with our audit of the financial statements, our responsibility is to read the other information and, in doing so, consider whether the other information is materially inconsistent with the financial statements or our knowledge obtained in the audit, or otherwise appears to be materially misstated. If we identify an apparent material inconsistency or material misstatement, we are required to perform procedures to conclude whether there is a material misstatement of the financial statements or a material misstatement of the other information. If, based on the work we have performed, we conclude that there is a material misstatement of this other information, we are required to report that fact. We have nothing to report based on these responsibilities.
With respect to the Strategic Report and Directors’ Report, we also considered whether the disclosures required by the UK Companies Act 2006 have been included.
Based on the responsibilities described above and our work undertaken in the course of the audit, the Companies Act 2006 ('CA06'), ISAs (UK) and the Listing Rules of the Financial Conduct Authority ('FCA') require us also to report certain opinions and matters as described below (required by ISAs (UK) unless otherwise stated).
Strategic Report and Directors’ ReportIn our opinion, based on the work undertaken in the course of the audit, the information given in the Strategic Report and Directors’ Report for the year ended 31 December 2018 is consistent with the financial statements and has been prepared in accordance with applicable legal requirements. (CA06)
In light of the knowledge and understanding of the group and company and their environment obtained in the course of the audit, we did not identify any material misstatements in the Strategic Report and Directors’ Report. (CA06)
The directors’ assessment of the prospects of the group and of the principal risks that would threaten the solvency or liquidity of the groupWe have nothing material to add or draw attention to regarding:
• The directors’ confirmation on page 55 of the Annual Report that they have carried out a robust assessment of the principal risks facing the group, including those that would threaten its business model, future performance, solvency or liquidity.
• The disclosures in the Annual Report that describe those risks and explain how they are being managed or mitigated.
• The directors’ explanation on page 54 of the Annual Report as to how they have assessed the prospects of the group, over what period they have done so and why they consider that period to be appropriate, and their statement as to whether they have a reasonable expectation that the group will be able to continue in operation and meet its liabilities as they fall due over the period of their assessment, including any related disclosures drawing attention to any necessary qualifications or assumptions.
We have nothing to report having performed a review of the directors’ statement that they have carried out a robust assessment of the principal risks facing the group and statement in relation to the longer-term viability of the group. Our review was substantially less in scope than an audit and only consisted of making inquiries and considering the directors’ process supporting their statements; checking that the statements are in alignment with the relevant provisions of the UK Corporate Governance Code (the “Code”); and considering whether the statements are consistent with the knowledge and understanding of the group and company and their environment obtained in the course of the audit. (Listing Rules)
Other Code ProvisionsWe have nothing to report in respect of our responsibility to report when:
• The statement given by the directors, on page 85, that they consider the Annual Report taken as a whole to be fair, balanced and understandable, and provides the information necessary for the members to assess the group’s and company’s position and performance, business model and strategy is materially inconsistent with our knowledge of the group and company obtained in the course of performing our audit.
• The section of the Annual Report on pages 83 to 88 describing the work of the Audit Committee does not appropriately address matters communicated by us to the Audit Committee.
• The directors’ statement relating to the company’s compliance with the Code does not properly disclose a departure from a relevant provision of the Code specified, under the Listing Rules, for review by the auditors.
Directors’ RemunerationIn our opinion, the part of the Directors’ Remuneration Report to be audited has been properly prepared in accordance with the Companies Act 2006. (CA06)
Intertek Group plc Annual Report and Accounts 2018174
Other Information | Independent Auditors' Report

RESPONSIBILITIES FOR THE FINANCIAL STATEMENTS AND THE AUDITResponsibilities of the directors for the financial statementsAs explained more fully in the Statement of Directors’ Responsibilities set out on page 113, the directors are responsible for the preparation of the financial statements in accordance with the applicable framework and for being satisfied that they give a true and fair view. The directors are also responsible for such internal control as they determine is necessary to enable the preparation of financial statements that are free from material misstatement, whether due to fraud or error.
In preparing the financial statements, the directors are responsible for assessing the group’s and the company’s ability to continue as a going concern, disclosing, as applicable, matters related to going concern and using the going concern basis of accounting unless the directors either intend to liquidate the group or the company or to cease operations, or have no realistic alternative but to do so.
Auditors’ responsibilities for the audit of the financial statementsOur objectives are to obtain reasonable assurance about whether the financial statements as a whole are free from material misstatement, whether due to fraud or error, and to issue an auditors’ report that includes our opinion. Reasonable assurance is a high level of assurance, but is not a guarantee that an audit conducted in accordance with ISAs (UK) will always detect a material misstatement when it exists. Misstatements can arise from fraud or error and are considered material if, individually or in the aggregate, they could reasonably be expected to influence the economic decisions of users taken on the basis of these financial statements.
A further description of our responsibilities for the audit of the financial statements is located on the FRC’s website at: www.frc.org.uk/auditorsresponsibilities. This description forms part of our auditors’ report.
Use of this reportThis report, including the opinions, has been prepared for and only for the company’s members as a body in accordance with Chapter 3 of Part 16 of the Companies Act 2006 and for no other purpose. We do not, in giving these opinions, accept or assume responsibility for any other purpose or to any other person to whom this report is shown or into whose hands it may come save where expressly agreed by our prior consent in writing.
OTHER REQUIRED REPORTINGCOMPANIES ACT 2006 EXCEPTION REPORTINGUnder the Companies Act 2006 we are required to report to you if, in our opinion:
• we have not received all the information and explanations we require for our audit; or
• adequate accounting records have not been kept by the company, or returns adequate for our audit have not been received from branches not visited by us; or
• certain disclosures of directors’ remuneration specified by law are not made; or
• the company financial statements and the part of the Directors’ Remuneration Report to be audited are not in agreement with the accounting records and returns.
We have no exceptions to report arising from this responsibility.
APPOINTMENTFollowing the recommendation of the Audit Committee, we were appointed by the members on 25 May 2016 to audit the financial statements for the year ended 31 December 2016 and subsequent financial periods. The period of total uninterrupted engagement is 3 years, covering the years ended 31 December 2016 to 31 December 2018.
Ian Chambers (Senior Statutory Auditor)for and on behalf of PricewaterhouseCoopers LLP Chartered Accountants and Statutory Auditors
London 4 March 2019
The maintenance and integrity of the Intertek Group plc website is the responsibility of the directors; the work carried out by the auditors does not involve consideration of these matters and, accordingly, the auditors accept no responsibility for any changes that may have occurred to the financial statements since they were initially presented on the website.
Legislation in the United Kingdom governing the preparation and dissemination of financial statements may differ from legislation in other jurisdictions.
Intertek Group plc Annual Report and Accounts 2018 175
Other Information

SHAREHOLDERS’ ENQUIRIESAny shareholder with enquiries relating to their shareholding should, in the first instance, contact our Registrar, Equiniti, using the telephone number or the address on this page.
ELECTRONIC SHAREHOLDER COMMUNICATIONSShareholders can elect to receive communications by email each time the Company distributes documents, instead of receiving paper copies. This can be done by registering via Shareview at no extra cost, at www.shareview.co.uk. In the event that you change your mind or require a paper version of any document in the future, please contact the Registrar.
Access to Shareview allows shareholders to view details about their holdings, submit a proxy vote for shareholder meetings and notify a change of address. In addition to this, shareholders have the opportunity to complete dividend mandates online which facilitates the payment of dividends directly into a nominated account.
SHAREGIFTIf you have a small shareholding which is uneconomical to sell, you may want to consider donating it to ShareGift. The Orr Mackintosh Foundation operates this charity share donation scheme. Details of the scheme are available from:
ShareGift at www.sharegift.org T: +44 (0) 20 7930 3737
SHARE PRICE INFORMATIONInformation on the Company’s share price is available from the Company’s website at www.intertek.com.
FINANCIAL CALENDARFinancial year end 31 December 2018Results announced 5 March 2019Ex-dividend date for final dividend 16 May 2019Record date for final dividend 17 May 2019Annual General Meeting 23 May 2019Final dividend payable 4 June 2019Interim results announced 1 August 2019Ex-dividend date for interim dividend 26 September 2019Record date for interim dividend 27 September 2019Interim dividend payable 11 October 2019
INVESTOR RELATIONSE: [email protected] T: +44 (0) 20 7396 3400
REGISTRAREquinitiAspect House Spencer Road Lancing West Sussex BN99 6DA T: 0371 384 2030 (UK)* T: +44 (0) 12 1415 7047 (outside UK)
* Lines are open 8.30 a.m. to 5.30 p.m. Monday to Friday, excluding bank holidays.
AUDITORSPricewaterhouseCoopers LLP1 Embankment Place London WC2N 6RH T: +44 (0) 20 7583 5000
BROKERSJ.P.Morgan Cazenove25 Bank Street Canary Wharf London E14 5JP T: +44 (0) 20 7742 4000
Goldman Sachs InternationalPeterborough Court 133 Fleet Street London EC4A 2BB T: +44 (0) 20 7774 1000
REGISTERED OFFICEIntertek Group plc33 Cavendish Square London W1G 0PS T: +44 (0) 20 7396 3400 www.intertek.com
Registered number: 04267576
ISIN: GB0031638363
LEI: 2138003GAT25WW1RN369
London Stock Exchange Support Services FTSE 100 Symbol: ITRK
Intertek Group plc Annual Report and Accounts 2018176
Other Information | Shareholder and corporate information
SHAREHOLDER AND CORPORATE INFORMATION

Printed in the UK by Pureprint Group, a CarbonNeutral® company, certificated to Environmental Management System ISO14001 and holders of FSC® chain of custody certification.
The report is printed on UPM Fine SC. This paper is made from virgin wood fibre from well-managed forest independently certified according to the rules of the Forest Stewardship Council® (FSC®) and other controlled sources. It is manufactured at a mill that is certified to ISO14001 and EMAS environmental standards. The mill uses pulps that are totally chlorine free (TCF), and some pulp is bleached using an elemental chlorine free (ECF) process. The inks in printing this report are all vegetable-based.
Designed and produced by

INTERTEK GROUP PLC33 Cavendish Square, London, W1G 0PS United Kingdom
Tel +44 20 7396 3400 [email protected] intertek.com