Market Conditions Analysis and Recommendations for ...
112
Market Conditions Analysis and Recommendations for Downtown Mound, Minnesota Prepared for: City of Mound Mound, Minnesota June 2013 1221 Nicollet Avenue S. Suite 218 Minneapolis, MN 55403 (612) 338‐0012 www.maxfieldresearch.com
-
Upload
khangminh22 -
Category
Documents
-
view
3 -
download
0
Transcript of Market Conditions Analysis and Recommendations for ...

Market Conditions Analysis and Recommendations for
Downtown Mound, Minnesota
Prepared for:
City of Mound Mound, Minnesota
June 2013
1221 Nicollet Avenue S. Suite 218 Minneapolis, MN 55403 (612) 338‐0012 www.maxfieldresearch.com
(612) 338‐0012 fax (612) 904‐7979 1221 Nicollet Avenue South, Suite 218, Minneapolis, MN 55403
www.maxfieldresearch.com
June 9, 2013 Ms. Kandis Hanson City Administrator City of Mound 5341 Maywood Road Mound, Minnesota 55364 Dear Ms. Hanson: Attached is the study Market Conditions Analysis and Recommendations for Downtown Mound, Minnesota. The study updates market conditions for retail, office, multifamily residential and lodging uses for the Downtown including the Mound Harbor District. Based on the analysis, demand is identified for market rate multifamily uses, in addition to a modest amount of demand for retail and office space. We recommend that Mound defer the development of a hotel and continue to monitor market conditions to determine if develop‐ment has reached a level where a lodging facility could be supported. Detailed recommenda‐tions can be found in the report. We have enjoyed performing this study for you and are available should you have any ques‐tions or need additional information. Sincerely, MAXFIELD RESEARCH INC.
Mary C. Bujold President Attachment

TABLE OF CONTENTS Page EXECUTIVE SUMMARY ........................................................................................................ 1 Purpose and Scope of Study ........................................................................................... 1 Downtown Overview ...................................................................................................... 1 Demand Summary ........................................................................................................... 2 Recommended Development Strategies ........................................................................ 7 PURPOSE AND SCOPE OF STUDY ........................................................................................ 10 Purpose and Scope of Study ........................................................................................... 10 DOWNTOWN REDEVELOPMENT – PRINCIPLES AND GOALS ............................................. 11 Sustainable Development ............................................................................................... 11 Objectives of a Downtown Plan ...................................................................................... 11 DOWNTOWN DISTRICT CHARACTERISTICS ........................................................................ 14 Downtown Overview ...................................................................................................... 14 Downtown Mound District.............................................................................................. 14 Mound Harbor Renaissance District ............................................................................... 16 Access and Visibility ........................................................................................................ 17 Traffic Volumes ............................................................................................................... 18 Key Characteristics to Attract New Business Development to Mound .......................... 22 HOUSING MARKET ANALYSIS ............................................................................................. 23 Introduction .................................................................................................................... 23 Housing Market Area Definition ..................................................................................... 23 Demographic Overview ................................................................................................... 24 Impact of Demographic Trends on Housing ................................................................... 38 Rental Market Analysis ................................................................................................... 38 For‐Sale Housing Market Situation ................................................................................. 45 Independent Senior Housing Analysis ............................................................................ 52 Multifamily Housing Demand ......................................................................................... 57 Downtown Housing Conclusions and Recommendations .............................................. 61 RETAIL MARKET ANALYSIS .................................................................................................. 65 Introduction .................................................................................................................... 65 Market Area Definition ................................................................................................... 65 Population and Household Growth Trends and Projections .......................................... 67 Population Age Distribution ............................................................................................ 68 Daytime Population ........................................................................................................ 69 Categories of Goods ........................................................................................................ 70 Consumer Expenditure Patterns ..................................................................................... 72
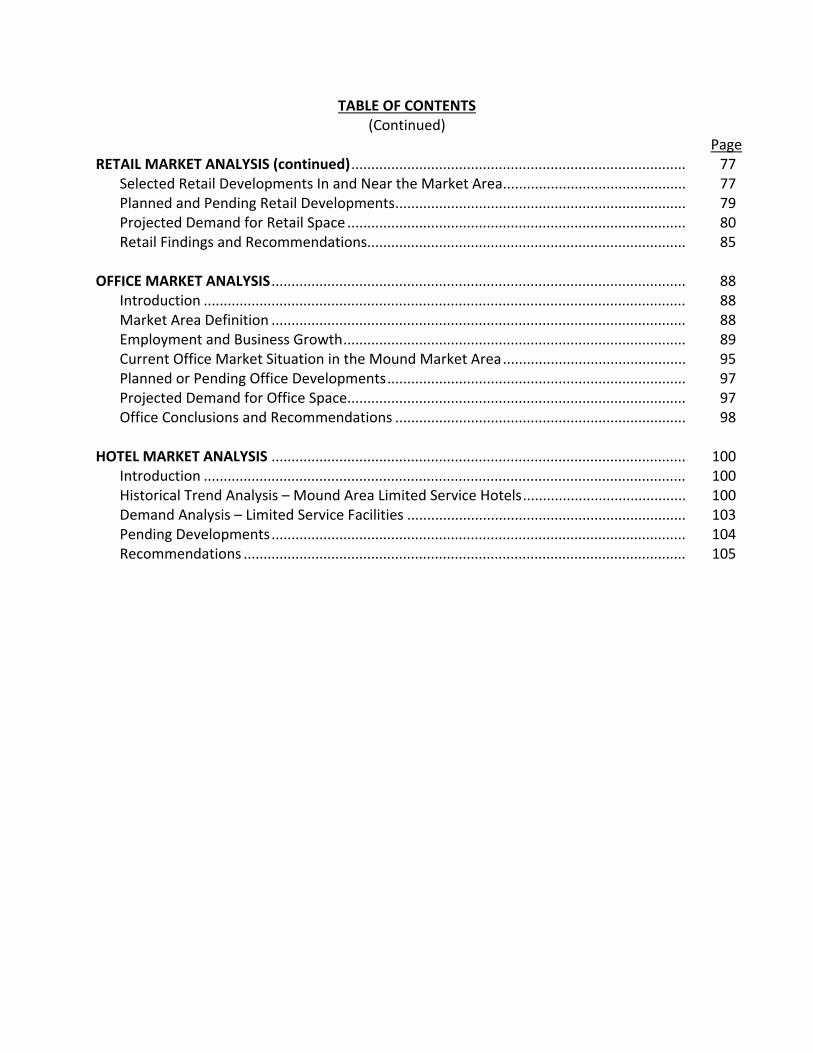
TABLE OF CONTENTS (Continued)
Page RETAIL MARKET ANALYSIS (continued) .................................................................................... 77 Selected Retail Developments In and Near the Market Area .............................................. 77 Planned and Pending Retail Developments ......................................................................... 79 Projected Demand for Retail Space ..................................................................................... 80 Retail Findings and Recommendations................................................................................ 85 OFFICE MARKET ANALYSIS ........................................................................................................ 88 Introduction ......................................................................................................................... 88 Market Area Definition ........................................................................................................ 88 Employment and Business Growth ...................................................................................... 89 Current Office Market Situation in the Mound Market Area .............................................. 95 Planned or Pending Office Developments ........................................................................... 97 Projected Demand for Office Space ..................................................................................... 97 Office Conclusions and Recommendations ......................................................................... 98 HOTEL MARKET ANALYSIS ........................................................................................................ 100 Introduction ......................................................................................................................... 100 Historical Trend Analysis – Mound Area Limited Service Hotels ......................................... 100 Demand Analysis – Limited Service Facilities ...................................................................... 103 Pending Developments ........................................................................................................ 104 Recommendations ............................................................................................................... 105
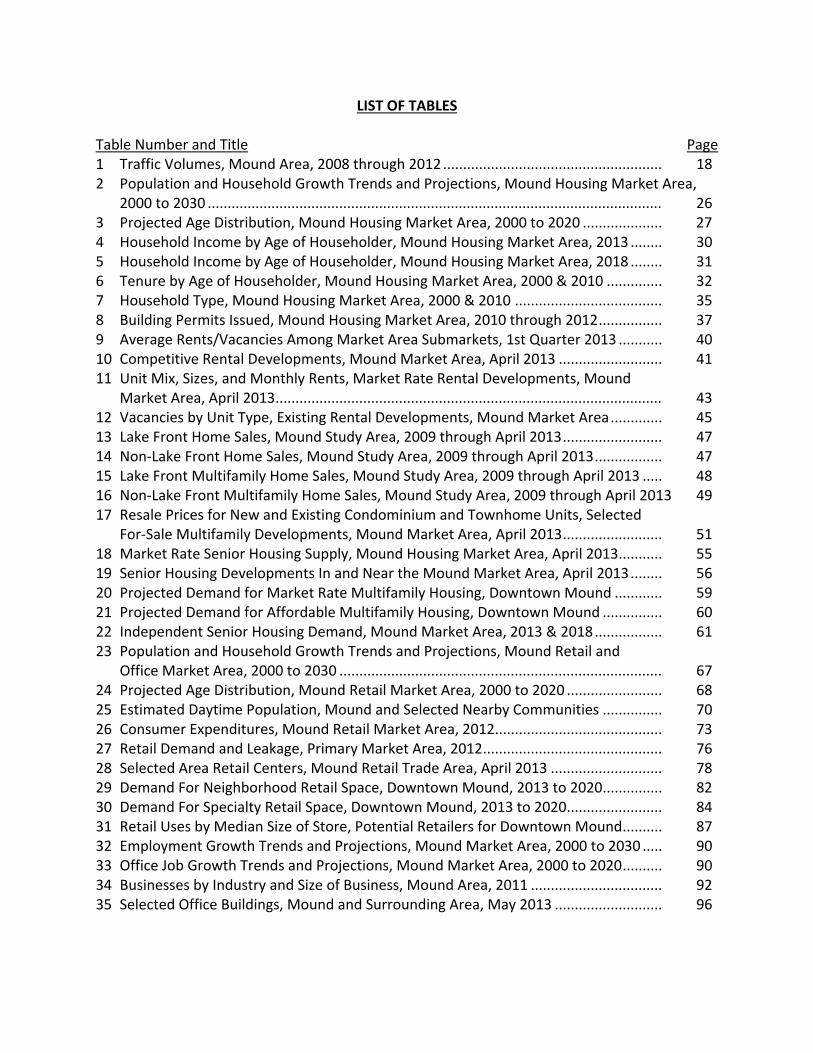
LIST OF TABLES Table Number and Title Page 1 Traffic Volumes, Mound Area, 2008 through 2012 ....................................................... 18 2 Population and Household Growth Trends and Projections, Mound Housing Market Area,
2000 to 2030 .................................................................................................................. 26 3 Projected Age Distribution, Mound Housing Market Area, 2000 to 2020 .................... 27 4 Household Income by Age of Householder, Mound Housing Market Area, 2013 ........ 30 5 Household Income by Age of Householder, Mound Housing Market Area, 2018 ........ 31 6 Tenure by Age of Householder, Mound Housing Market Area, 2000 & 2010 .............. 32 7 Household Type, Mound Housing Market Area, 2000 & 2010 ..................................... 35 8 Building Permits Issued, Mound Housing Market Area, 2010 through 2012 ................ 37 9 Average Rents/Vacancies Among Market Area Submarkets, 1st Quarter 2013 ........... 40 10 Competitive Rental Developments, Mound Market Area, April 2013 .......................... 41 11 Unit Mix, Sizes, and Monthly Rents, Market Rate Rental Developments, Mound Market Area, April 2013 ................................................................................................. 43 12 Vacancies by Unit Type, Existing Rental Developments, Mound Market Area ............. 45 13 Lake Front Home Sales, Mound Study Area, 2009 through April 2013 ......................... 47 14 Non‐Lake Front Home Sales, Mound Study Area, 2009 through April 2013 ................. 47 15 Lake Front Multifamily Home Sales, Mound Study Area, 2009 through April 2013 ..... 48 16 Non‐Lake Front Multifamily Home Sales, Mound Study Area, 2009 through April 2013 49 17 Resale Prices for New and Existing Condominium and Townhome Units, Selected For‐Sale Multifamily Developments, Mound Market Area, April 2013 ......................... 51 18 Market Rate Senior Housing Supply, Mound Housing Market Area, April 2013 ........... 55 19 Senior Housing Developments In and Near the Mound Market Area, April 2013 ........ 56 20 Projected Demand for Market Rate Multifamily Housing, Downtown Mound ............ 59 21 Projected Demand for Affordable Multifamily Housing, Downtown Mound ............... 60 22 Independent Senior Housing Demand, Mound Market Area, 2013 & 2018 ................. 61 23 Population and Household Growth Trends and Projections, Mound Retail and Office Market Area, 2000 to 2030 ................................................................................. 67 24 Projected Age Distribution, Mound Retail Market Area, 2000 to 2020 ........................ 68 25 Estimated Daytime Population, Mound and Selected Nearby Communities ............... 70 26 Consumer Expenditures, Mound Retail Market Area, 2012.......................................... 73 27 Retail Demand and Leakage, Primary Market Area, 2012 ............................................. 76 28 Selected Area Retail Centers, Mound Retail Trade Area, April 2013 ............................ 78 29 Demand For Neighborhood Retail Space, Downtown Mound, 2013 to 2020............... 82 30 Demand For Specialty Retail Space, Downtown Mound, 2013 to 2020........................ 84 31 Retail Uses by Median Size of Store, Potential Retailers for Downtown Mound .......... 87 32 Employment Growth Trends and Projections, Mound Market Area, 2000 to 2030 ..... 90 33 Office Job Growth Trends and Projections, Mound Market Area, 2000 to 2020 .......... 90 34 Businesses by Industry and Size of Business, Mound Area, 2011 ................................. 92 35 Selected Office Buildings, Mound and Surrounding Area, May 2013 ........................... 96

LIST OF TABLES (Continued)
Table Number and Title Page 36 Projected Demand for Office Space, Mound Market Area, 2010 to 2020 .............. 98 37 Properties Surveyed in Hotel Trend Report, Mound Market Area, May 2013 ....... 100 38 Limited Service Facilities, Occupancy, Room Rate, Revenue, Mound Market Area, 2007
through 2013 (April) ................................................................................................ 101 39 Historical Room Supply and Demand Trends, Mound Area Hotels – Limited Service and
Extended Stay, 2007 through 2013 (April) .............................................................. 102 40 Projected Limited Service Room Demand, Mound Area, 2013 through 2020 ........ 104

EXECUTIVE SUMMARY
MAXFIELD RESEARCH INC. 1
Purpose and Scope of Study Maxfield Research Inc. was engaged by the City of Mound to complete an update of current market conditions for various real estate sectors and to reassess the development potential for these uses in Mound with a focus on the Downtown area including the Lost Lake property and the Downtown Business District. The Downtown Business District is centered at the intersec‐tion of Commerce Boulevard and Highway 15. The research includes an analysis of the existing supply of and market conditions for retail, office, lodging and multifamily housing in the area. Growth trends and demographic characteristics and the potential impact of these trends on Downtown’s development potential are presented. Based on growth trends and current market conditions, demand potential is summarized for additional retail, office, multifamily housing (owned and rented) and hotel rooms from 2010 to 2020 in the Mound Trade Area. In addition, recommendations are presented to strengthen Mound’s ability to attract new business and residents to its community now and in the future. These recommendations are intended to support Mound’s business and economic develop‐ment initiatives as the community continues to grow.
Downtown Overview
Mound is a community of about 9,210 people (2012 estimate from the Metropolitan Council) located on the western edge of the Twin Cities Metro Area. The 2010 Census showed a population for Mound of 9,052. The most recent estimate reflects an increase of 158 people or 1.7% over the past two years. In terms of its size, Mound’s total popu‐lation exceeds the combined populations of Wayzata, Spring Park, Tonka Bay and Excel‐sior (9,188 combined vs. 9,210). As of 2013, we estimate Mound’s population at ap‐proximately 9,230 people.
Historically, Mound and several cities that border Lake Minnetonka were originally free‐standing communities. As the Twin Cities Metro Area has expanded, development has occurred in all of the areas further west of Mound including Laketown Township, Min‐netrista, St. Bonifacius, Independence, Maple Plain and Watertown. Mound was one of the first communities to implement municipal sewer and water back in the 1940s. Mound has more lakeshore on Lake Minnetonka than any of the 15 cities that touch the Lake.
Mound is essentially a fully‐developed community. While some parcels have been made available for new development, most of Mound has been developed for a number of years. Growth in households (occupied housing units) in Mound can essentially only be generated through redevelopment of existing property, in‐fill on vacant lots and in‐creased density (more units per acre).

EXECUTIVE SUMMARY
MAXFIELD RESEARCH INC. 2
Downtown Mound is centered at the intersection of Highways 15 and 110. Access to the Downtown is primarily from these highways. An extension of Interstate 394 to Ma‐ple Plain has resulted in reduced travel times between Mound and Downtown Minne‐apolis via Interstate 394. From Downtown Mound and traveling along County Road 110 and County Road 6, commuters can access the new interstate connection in about five minutes.
Highway 15 connects communities on the north end of Lake Minnetonka to Interstate 394. However, improvements to Highways 7 and 12, both accessed from County Road 110 means that travelers can access Mound more quickly than traveling along Highway 15. However, Highway 15 continues to provide a scenic route to Mound around Lake Minnetonka. If time is not an issue, traveling along Highway 15 is picturesque. Mound boasts significant lakeshore but much of the lakeshore is hidden from public view by de‐velopment around the Lake. The Lost Lake property in the Downtown District offers a direct public view of Lake Minnetonka and public boat docks. Boats may enter the area through the Lost Lake Channel to reach Downtown Mound. The Lost Lake property re‐mains available for additional development that will take advantage of views of the Channel.
Commute data demonstrate what most local people already know, that a majority of Mound residents commute to jobs outside of the City. There are however, a number of people that work out of their homes even if they maintain an office outside of the City.
Interviews with stakeholders in Mound revealed the following strengths of the commu‐nity:
o 1) close proximity to Lake Minnetonka; o 2) small town environment with neighborhood retail goods available in town; o 3) most affordable housing around the Lake; o 4) highly rated public school system; and o 5) new development in the Downtown that presents an attractive image of the
community.
While the Downtown has its strengths, it also has some weaknesses. Its primary weak‐ness is its location approximately five miles away from a major highway (i.e. Highway 12 and Highway 7), which causes people traveling along those highways to often bypass Mound.
Although specialty retail located in other communities draws some customers away from Mound, local businesses in Mound are generally stable or thriving and attracting customers from Mound, Minnetrista, Watertown, Independence, Maple Plain, St. Boni‐facius and Laketown Township. While Mound’s image has historically languished in the
EXECUTIVE SUMMARY
MAXFIELD RESEARCH INC. 3
shadow of Wayzata and Excelsior, this is changing in the housing market and from in‐creased access to the community along the Dakota Trail.
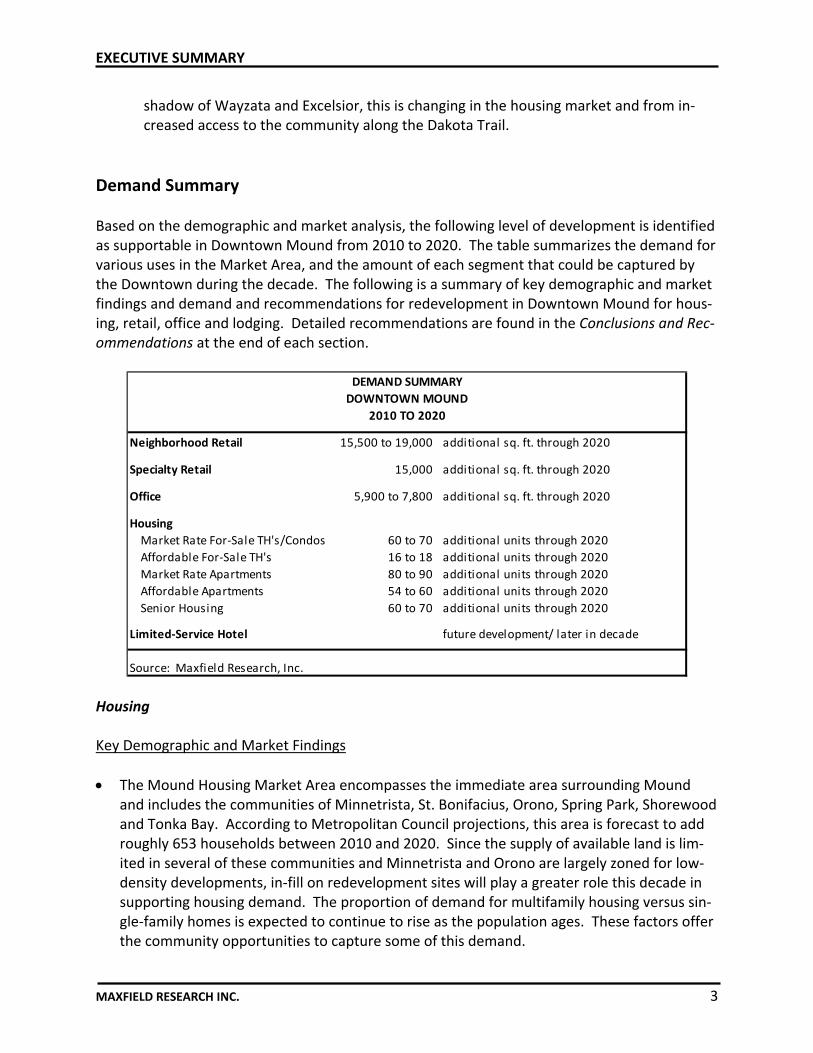
Demand Summary Based on the demographic and market analysis, the following level of development is identified as supportable in Downtown Mound from 2010 to 2020. The table summarizes the demand for various uses in the Market Area, and the amount of each segment that could be captured by the Downtown during the decade. The following is a summary of key demographic and market findings and demand and recommendations for redevelopment in Downtown Mound for hous‐ing, retail, office and lodging. Detailed recommendations are found in the Conclusions and Rec‐ommendations at the end of each section.
Neighborhood Retail 15,500 to 19,000 additional sq. ft. through 2020
Specialty Retail 15,000 additional sq. ft. through 2020
Office 5,900 to 7,800 additional sq. ft. through 2020
Housing
Market Rate For‐Sale TH's/Condos 60 to 70 additional units through 2020
Affordable For‐Sale TH's 16 to 18 additional units through 2020
Market Rate Apartments 80 to 90 additional units through 2020
Affordable Apartments 54 to 60 additional units through 2020
Senior Housing 60 to 70 additional units through 2020
Limited‐Service Hotel future development/ later in decade
Source: Maxfield Research, Inc.
DEMAND SUMMARY
DOWNTOWN MOUND
2010 TO 2020
Housing Key Demographic and Market Findings
The Mound Housing Market Area encompasses the immediate area surrounding Mound and includes the communities of Minnetrista, St. Bonifacius, Orono, Spring Park, Shorewood and Tonka Bay. According to Metropolitan Council projections, this area is forecast to add roughly 653 households between 2010 and 2020. Since the supply of available land is lim‐ited in several of these communities and Minnetrista and Orono are largely zoned for low‐density developments, in‐fill on redevelopment sites will play a greater role this decade in supporting housing demand. The proportion of demand for multifamily housing versus sin‐gle‐family homes is expected to continue to rise as the population ages. These factors offer the community opportunities to capture some of this demand.
EXECUTIVE SUMMARY
MAXFIELD RESEARCH INC. 4
Currently, the rental market is exhibiting the strongest demand with vacancy rates that are the lowest seen in several years. For‐sale market activity however, is increasing as buyers come to the market to capture greater affordability. Senior housing demand also remains strong in the Metro Area and in the Mound Market Area.
Demand Summary
The following primary market segments have not changed significantly and these groups remain the primary targets for medium to high‐density housing in the Downtown based on a review of demographic growth trends and current housing conditions. They are:
1) Empty nesters and independent seniors currently living in the area or who wish
to live in the area and are seeking multifamily housing (single‐level living) as an alternative to single‐family homes or a second home;
2) Young to middle‐aged singles and couples without children who work or will
work in the west Metro Area and are seeking ownership opportunities in a downtown environment;
3) Singles and couples without children who are or will become employed in the
west Metro Area and are seeking rental housing. Recommendations
Demand is increasing for single‐family homes in Mound and areas that can support single‐family development would be very attractive. Areas more appropriate for medium density and high density housing, such as the Downtown, could support for‐sale townhomes, con‐dominiums, rental housing and independent senior housing.
1) Townhomes/Condominiums – We recommend the development of 60 to 70
units of townhome or condominium style housing through 2020. At this time, buyers continue to exhibit a preference for townhome units and for single‐level living. Primary buyer segments are generally empty‐nesters and young seniors that prefer a lower maintenance alternative to their single‐family home. These units could take advantage of scenic locations overlooking either Lost Lake or Langdon Lake. Although a higher proportion of buyers are usually older, these units can also be marketed to younger households.
2) Market Rate Apartments – We recommend the development of 80 to 90 units of
market rate rental housing through 2020 in a three‐ to four‐story freestanding building. We recommend that a site in or near the Downtown be considered for this building where residents would have convenient access to all the downtown amenities including shopping, trail, parks etc. Market rate apartments could act as an anchor component to a larger redevelopment project. Currently, the
EXECUTIVE SUMMARY
MAXFIELD RESEARCH INC. 5
apartment market is strong and is expected to remain so for several years pri‐marily due to current housing market factors and demographic trends.
3) Independent Senior Housing – We recommend 60 to 70 units of market rate in‐
dependent senior housing with few or no services. Similar to market rate apartments, these units would however, be restricted to people age 55 or older. The target market for these types of properties is usually people age 70 or older that are healthy and living independently. These properties are often combined with a limited amount of retail or have been combined with the development of new and/or entirely renovated county libraries.
4) Workforce Affordable Apartments – We recommend 54 to 60 units of workforce
rental housing that would target households with incomes between 50% and 60% of the Area Median Household Income. These units would be affordable for moderate‐income households generally earning between $32,000 and $40,000 per year depending on household size. These units should be located in close proximity to goods and services and public transit.
5) Workforce Affordable Townhomes – We recommend 16 to 18 units of workforce
rental townhomes that would again target households with incomes of between 50% and 60% of the Area Median Household Income with households generally earning between $36,000 and $49,000 annually depending on household size. Household sizes are usually slightly larger than those for apartments and typical‐ly target family households that desire additional privacy.
Adding new housing should remain a high priority of the City as it proceeds with redevel‐opment. Our research finds that strong housing demand in the area will create the poten‐tial to develop the housing products described above. Also, the addition of housing in Downtown Mound will continue to support the commercial business base.
Retail Key Demographic and Market Findings
The Retail Market Area includes Mound, Minnetrista, Spring Park, St. Bonifacius, Independ‐ence, Maple Plain, Watertown and Watertown Township. The Market Area is expected to add 5,186 people from 2010 to 2020 (for a population of 42,692 in 2020). As growth occurs, the potential for additional retail will increase and Downtown Mound will have an oppor‐tunity to capture a portion of retail expenditures from new residents. It is expected that Downtown Mound will be able to also support new retail by drawing customers from Min‐netrista, St. Bonifacius Maple Plain and Independence.
EXECUTIVE SUMMARY
MAXFIELD RESEARCH INC. 6
The current retail mix in Downtown Mound consists mostly of neighborhood stores (stores that offer goods and services purchased often – daily or weekly) that draw the majority of their customers from Mound. Mound Marketplace, at the intersection of Highways 15 and 110, has increased the draw of Mound’s retail to residents in St. Bonifacius, Minnetrista and other communities to the west. Most of the demand for retail in the Downtown is for daily goods and services (restaurants, drugstore, and groceries) that serve the local population base. Increased retail demand in the Market Area this decade will primarily be for addition‐al neighborhood stores and some demand for specialty retail (goods and services for which there are few alternatives and customers make the greatest effort to purchase).
Mound residents most likely purchase most of their shopping goods (goods that are pur‐chased less often‐ such as furniture, appliances and electronics) at larger retail centers in Minnetonka and Eden Prairie. There is a trend for shopping goods to be located in larger retail centers that require a larger support population than is provided in Mound. Thus, res‐idents in Mound are likely to continue to make these types of purchases at shopping cen‐ters or online.
Demand Summary
Retail types that have the greatest potential in Downtown Mound are those occupying about 3,000 square feet or less. Examples of neighborhood store types that currently exist‐ing in the Downtown are sandwich shop, hair salon, nail salon, barber, among others. It is likely that new businesses to Mound will come from local independent retailers that are al‐ready operating one or more outlets in the Twin Cities region. These operators are familiar with the shopping patterns of local residents and are likely to better understand their draw than a national chain that has specific criteria to meet for a site.
Recommendations
We recommend developing a list of target retailers that the community would like to attract and send specific proposals to these retailers to consider Mound. Conversations with these groups will also identify in greater detail their costs to operate, their general location crite‐ria and whether Mound would be a good “fit” for them.
Office Key Demographic and Market Findings
From 2010 to 2020, the Market Area is forecast to add 1,274 jobs. Based on employment growth rates for the FIRE (Finance, Insurance and Real Estate) Sector and the portion of the Service Sector that typically occupies office space, the Market Area is projected to add 218 jobs that will require office space between 2010 and 2020. Utilizing the industry standard of 180 square feet of office space per employee, an estimated 39,240 square feet of office space will be needed in the Market Area during this decade.
EXECUTIVE SUMMARY
MAXFIELD RESEARCH INC. 7
Of the total office demand in the Market Area, Mound could capture approximately 15% to 20% or 5,900 to 7,800 square feet by 2020. New tenants are likely to be limited to busi‐nesses serving the local population and/or small businesses requiring about 1,500 square feet or less.
Demand Summary
The majority of office demand will be from businesses serving the local household and busi‐ness base. These are users such as insurance agents, attorneys, architects, graphic design‐ers, real estate agents, accountants, financial planners, banks, dentists, chiropractors and medical offices. In addition, there is potential for Downtown Mound to attract small pro‐fessional businesses with a regional or national customer base.
The majority of businesses seeking office space in Downtown Mound will have five or fewer employees and will need about 1,500 square feet or less. We recommend traditional office space for this type of development as this has been the most successful overall.
Recommendations
We recommend that office space be combined with other types of uses including retail or residential uses. With the limited amount of demand identified, combining the office space with other uses will provide more efficient utilization of land and could provide some syner‐gies with these other uses.
Lease rates for retail will vary considerably by class of space. Current office rents in and near Mound range from $10.00 to $14.00 net for older buildings and between $10.00 and $20.00 net for newer buildings. Smaller office users are likely to prefer to pay between $14.00 and $16.00 net per square foot for new space.
Lodging Key Demographic and Market Findings
Travel dipped again from 2008 to 2010 as the recession took hold. From 2011 to 2012, oc‐cupancy and room revenue started increasing again as companies and travelers gained more confidence in the economy.
Interest in hotel development is again popular but most of this interest is occurring in heavy travel markets on the coast and major employment centers such as Chicago, Houston and in the North Dakota oil fields. Two boutique hotels are proposed in the Lake Minnetonka ar‐ea, one in Excelsior and one in Wayzata. We are concerned about the potential impact of these two facilities on any lodging development that would occur in Mound and Mound’s ability to support the necessary level of weekday occupancies in its local market.
EXECUTIVE SUMMARY
MAXFIELD RESEARCH INC. 8
Demand Summary
Occupancy trends have fluctuated over the past several years as the Twin Cities and the US continue to pull out of the recession. Although the Metro Area is experiencing a more rapid recovery than other parts of the Nation, growth has been slow. Hotels surveyed in the area are performing at a 62% overall occupancy rate, below the rate of 70% to 75% which is con‐sidered healthy for limited service hotels. Despite a return to modest growth, Mound would likely struggle to supply sufficient weeknight occupancy to support even a small hotel (40 to 45 rooms).
Recommendations
We recommend that Mound defer consideration of a hotel in the Downtown for at least another five years to further allow the recovery to take hold and implementation of addi‐tional development that could increase room night generation. Also, Mound should moni‐tor the development of the two proposed hotels and their overall impact on the market should those facilities proceed.
Recommended Development Strategies We recommend the following development strategies for the Downtown in the next phase of redevelopment: Development of the remaining parcels for Lost Lake Villas is expected to be underway this summer. It is our understanding that units will be constructed as there are buyers, at least ini‐tially. A total of 16 units is to be developed in that area. Rental housing is currently strong in the area as well as in the Twin Cities. We recommend the development of a mixed income rental building with 20% affordable units. This property could be developed in the Lost Lake area or another location. Commerce Place shopping center is struggling with a high vacancy rate and has been unable to backfill the vacant space from the exiting of two anchor tenants. This is the final corner of the Highway 15 and Highway 110 intersection to be redeveloped, which is the key intersection in the Downtown. We understand that there have been previous proposals for this site that have been rejected. However, we urge the City to work closely with the developer to restructure this center to optimize its operations and to further enhance redevelopment of the Downtown. Attracting a full‐service, sit‐down restaurant to Downtown Mound has been very challenging. We believe that a restaurant will have to be a component of a larger development with either additional commercial uses or additional commercial and residential uses to achieve this objec‐tive if the restaurant is to be located on the Channel. We recommend scouting for a regional

EXECUTIVE SUMMARY
MAXFIELD RESEARCH INC. 9
restaurant that already has one or two other outlets and serves a range of relatively traditional menu items appealing to the broadest customer base. As new development ensues, we recommend consistent publicity in the local and regional me‐dia to support increased awareness of Downtown Mound’s efforts. Mound is, to a degree, a well‐kept secret, that should no longer be a secret.

PURPOSE AND SCOPE OF STUDY
MAXFIELD RESEARCH INC. 10
Maxfield Research Inc. was engaged by the City of Mound to conduct an update of current real estate market conditions for commercial and residential development with a focus on the Downtown Central Business District and the Lost Lake property. The analysis includes infor‐mation on the existing supply of and market conditions for retail, office, hospitality and multi‐family housing in the area. Growth trends and demographic characteristics were also analyzed and the impact of these trends on the potential to develop various types of real estate products in Mound. Based on growth trends and market conditions in the area, demand was quantified for addi‐tional retail, office, hotel rooms, and multifamily housing units through 2020 in the Mound Market Area. Additionally, the amount of development that can be captured by Mound for each component is also provided. Demand calculations and recommendations are intended to serve as a guide in attracting specific development projects to Mound. The report includes both primary and secondary research. Primary research includes interviews of City staff, community businessowners, commercial brokers, developers and real estate agents. Secondary data is credited to the source when used and is usually data from the U. S. Census Bureau or ESRI, Inc., a nationally recognized demographics firm, or is locally collected data such as building permit information, interviews with property managers, leasing agents, commercial brokers and stakeholders.
DOWNTOWN REDEVELOPMENT‐ PRINCIPLES AND GOALS
MAXFIELD RESEARCH INC. 11
Sustainable Development
“Then I say the earth belongs to each . . . generation during its course, fully and in its own right, no generation can contract debts greater than may be paid
during the course of its own existence.” Thomas Jefferson, September 6, 1789
Sustainable development is economic development that is designed to meet a broad range of economic, social, and environmental goals. The concept of “sustainability” in the practice of economic development means attending to all costs and benefits in evaluating development options. Sustainable economic development increases the number of jobs and improves busi‐ness sales by emphasizing local assets and resource conservation. Sustainable development is defined in Minnesota Statute 4A.07(1) in the following manner:
. . .development that maintains or enhances economic opportunity and community well‐being while protecting and restoring the
natural environment upon which people and economies depend. Sustainable development meets the needs of the present without compromising the ability of future generations to meet their own
needs.”
Objectives of a Downtown Plan
o Create or enhance a “central place” as the physical and social heart of the community. o Restructure and enhance retail, restaurant, and entertainment facilities. Such business‐
es often serve as public spaces, emphasizing downtown’s role as a “central place.” o Integrate transportation networks, including pedestrian links to housing, traffic patterns
and parking, and transit systems. Emphasize a “multi‐modal” approach to link the major components of the community.
o Improve use and access to natural features in and near downtown, including rivers, bluffs, view sheds, and open space.
o Restructure and enhance public buildings and cultural facilities in the downtown. Librar‐ies, city hall, post offices, and social organizations accent downtown’s role as a “central place.”
o Create an urban form where buildings relate well to one another and to the street. Ex‐emplify good architecture and urban design practices.
o Identify historic buildings and historic architecture styles. Emphasize the importance of historic places as a community resource.
o Increase opportunities for housing in and around the core of the community. o Use the downtown to unify nearby parks and cultural facilities. o Identify economic assets of the downtown and expand and enhance these assets.

DOWNTOWN REDEVELOPMENT‐ PRINCIPLES AND GOALS
MAXFIELD RESEARCH INC. 12
o Identify opportunities for competitive economic investment, emphasizing entrepreneuri‐al and sustainable business opportunities and transportation planning to other commu‐nity assets;
Historic places, environmental amenities, and public places are key assets in the community’s downtown. Downtown Mound, through its previous revitalization efforts, currently demonstrates many of the attributes of an effective downtown plan. The goal is to continue to further economic de‐velopment in Mound while retaining a strong downtown environment and incorporating up‐dated or new uses in the Downtown that will improve the community visually, economically and socially. The National Historic Trust and its Main Street Program have identified eight guiding principles that distinguish it from other redevelopment strategies. These eight principles are: Comprehensive Downtown revitalization is complicated and cannot be accomplished through any single pro‐ject. For successful long‐term revitalization, a comprehensive approach must be applied and utilized over time. Incremental Small projects and simple activities lead to a more sophisticated understanding of the revitaliza‐tion process and help to develop local skills to undertake increasing complex projects and en‐suring that each local program builds its capacity to address these projects. Self‐help Nobody else will save the Downtown. There are no white knights. Local leaders must be willing to make their commercial area successful. Programs are available locally and nationally that provide technical assistance and training, but sustained, long‐term success depends upon the involvement and commitment of the local community. Public‐private partnership The public and private sectors have a vital interest in the economic health and physical viability of the downtown. Each sector has a role to play and must understand the other’s strengths and limitations to forge effective partnerships. Compromise and flexibility are crucial to both sides in the partnership.
DOWNTOWN REDEVELOPMENT‐ PRINCIPLES AND GOALS
MAXFIELD RESEARCH INC. 13
Identifying existing assets Commercial districts need to capitalize on those assets that make them unique and different. Every district has unique attributes, such as distinctive architecture or a pedestrian feel. This enables a sense of belonging. These local assets serve to differentiate each district and each community. Quality Quality must be emphasized in every aspect of the revitalization program. This applies equally to each element of the program, from storefront design to promotional campaigns to educa‐tional programs to organizational performance. Change Downtown revitalization can make skeptics become believers. Changes in attitudes and the ways that things are done are necessary to improve the district’s economic conditions. Public support for change builds as the program is successful in its work. Implementation Actions create confidence in the program and increase local involvement. Frequent and visible changes even though they may be small, remind the community and downtown’s stakeholders that revitalization is under way, beginning with small steps and building on those successes.
DOWNTOWN DISTRICT CHARACTERISTICS
MAXFIELD RESEARCH INC. 14
Downtown Overview Mound is a community of just over 9,200 people (2012) located on the western fringe of the Twin Cities Metro Area. Mound is situated on the western end of Lake Minnetonka, a prime amenity in the Metro Area with over 20 square miles of surface water and close to 100 miles of shoreline. While Mound was once a free‐standing community, the Twin Cities Metro Area has pushed outward and Mound is now surrounded by low‐density residential neighborhoods in addition to rural land. Currently, the Lake area east of Mound is fully developed with residen‐tial neighborhoods and the land west of Mound consists primarily of rural land and newly‐developing low‐density neighborhoods. The realignment of Highway 15 provided the community with an opportunity to consider changes to its Downtown. The Mound Harbor Renaissance District was created south of the re‐aligned Highway 15 with a plan to bring a mix of retail, office, and multifamily housing that would be situated on the Lost Lake Channel. In total, plans were proposed for the addition of about 120,000 square feet of retail and office space, 75 hotel rooms, and 207 housing units. The economic recession in 2006 left the plan largely incomplete. Some components were put in place including eight townhome units, the infrastructure along Auditor’s Road, the connec‐tion of the Lost Lake Channel to Mound Harbor and the city docks, a new Park and Ride garage, the relocation and expansion of several local businesses, a new Post Office and a small amount of new retail space facing Highway 15. Despite the downturn, a significant amount of devel‐opment was accomplished in a short period of time.
Mound Downtown District The Downtown District is essentially bounded on the north by Alder Road/Church Road on the east by Middenvale Lane, on the west by Langdon Lake and on the south by Maywood Road. This area contains the most significant concentration of commercial office and retail uses and is located in the area that is outlined on the aerial below.

DOWNTOWN DISTRICT CHARACTERISTICS
MAXFIELD RESEARCH INC. 15
Mound Downtown District
Downtown District
Key Intersection

DOWNTOWN DISTRICT CHARACTERISTICS
MAXFIELD RESEARCH INC. 16
Mound Harbor Renaissance District The Mound Harbor Renaissance property contains approximately 30 acres located south of Highway 15 (Shoreline Boulevard) on either side of Highway 110 (Commerce Boulevard). The Site abuts Langdon Lake to the west and the Lost Lake channel of Lake Minnetonka to the south. The new Dakota Trail, which extends from Wayzata to St. Bonifacius, comprises a por‐tion of the District’s northern border.
Mound Harbor Renaissance District
The original plan for the Mound Harbor Renaissance District identified uses for five separate ar‐eas within the redevelopment area (shown on the map on the following page). Proposed uses in each of the areas were as follows: Auditor’s Road District
75,500 square feet of commercial space (including one‐ and two‐story buildings)
75‐room hotel The Lost Lake District – West
40 for‐sale townhomes The Lost Lake District – East
12,000 square foot, two‐story commercial building
Lost Lake West
Auditor’s Road Langdon
Lost Lake East
South 110
DOWNTOWN DISTRICT CHARACTERISTICS
MAXFIELD RESEARCH INC. 17
The Langdon District
19,000 square foot commercial building
54 senior housing units
75 general‐occupancy apartment units
five for‐sale townhomes
five loft housing units The South 110 District
12,000 square foot two‐story commercial building
10 for‐sale townhomes
18 loft condominiums
Several of these proposed uses remain viable for the District, but in smaller size projects in the short‐term than were originally conceived. This analysis addresses the potential demand for multifamily housing, retail, office and hotel in Mound and the ability of the Downtown and Harbor District to support these uses and over what timeframe.
Access and Visibility Properties located on Highway 15 and/or Highway 110 have the highest levels of visibility and access to the primary travel routes through the Downtown District. Highway 110 extends north‐south and connects Mound with St. Bonifacius to the southwest and Maple Plain to the north. Highway 15 connects Downtown Mound with Watertown to the west and Wayzata and the Twin Cities Metro Area to the east. While Highways 110 and 15 provide strong access and visibility from the immediate area, these highways primarily carry traffic from Mound and the nearby surrounding areas that draw peo‐ple to Mound for shopping and business and/or through the community to other locations. This is primarily because many people living west or north and south of Highway 15 typically use Highway 7 (south of Mound) or Highway 12 (north of Mound) to drive into the western suburbs or into Downtown Minneapolis. These two highways both provide faster access to the greater Twin Cities Metropolitan Area than Highway 15. Highway 15 east of Mound has much lower posted speeds and is intended to be a slower moving local route through developed are‐as along the shores of Lake Minnetonka. It is not the preferred choice for commuters traveling to larger employment centers. Commuters are often more likely to make shopping trips out‐side of the immediate community on their way to and from work.
DOWNTOWN DISTRICT CHARACTERISTICS
MAXFIELD RESEARCH INC. 18
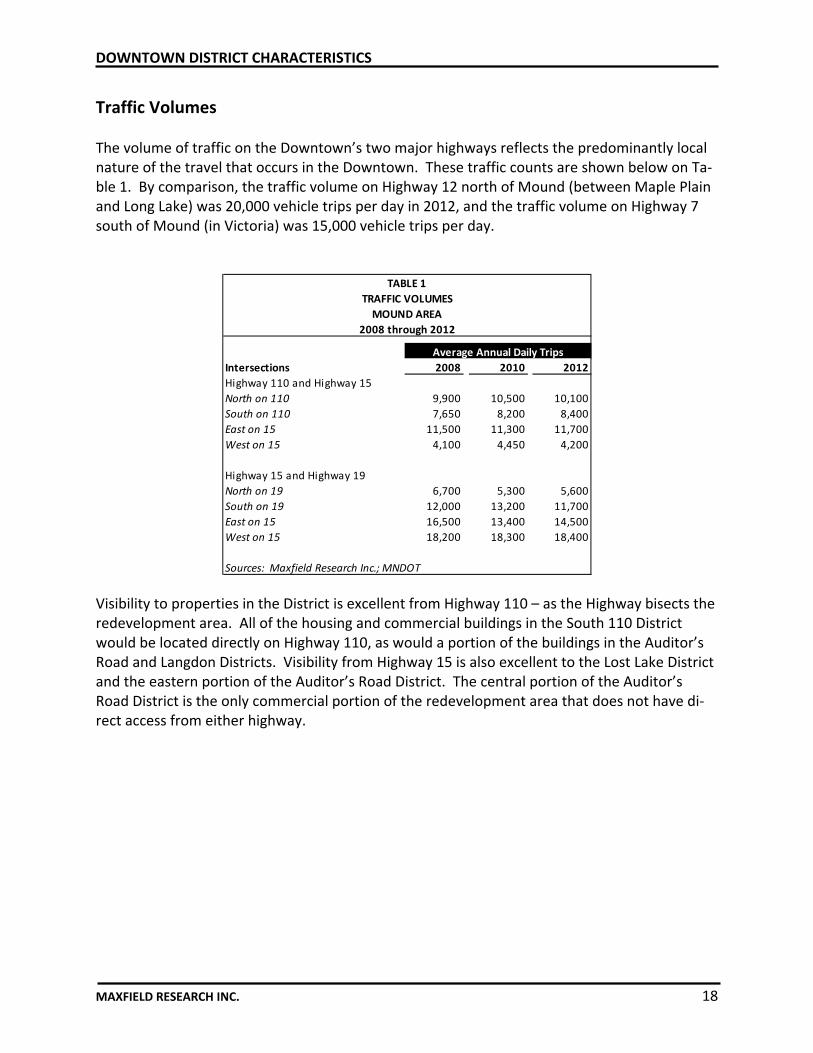
Traffic Volumes The volume of traffic on the Downtown’s two major highways reflects the predominantly local nature of the travel that occurs in the Downtown. These traffic counts are shown below on Ta‐ble 1. By comparison, the traffic volume on Highway 12 north of Mound (between Maple Plain and Long Lake) was 20,000 vehicle trips per day in 2012, and the traffic volume on Highway 7 south of Mound (in Victoria) was 15,000 vehicle trips per day.
Intersections 2008 2010 2012
Highway 110 and Highway 15
North on 110 9,900 10,500 10,100
South on 110 7,650 8,200 8,400
East on 15 11,500 11,300 11,700
West on 15 4,100 4,450 4,200
Highway 15 and Highway 19
North on 19 6,700 5,300 5,600
South on 19 12,000 13,200 11,700
East on 15 16,500 13,400 14,500
West on 15 18,200 18,300 18,400
Sources: Maxfield Research Inc.; MNDOT
TABLE 1
TRAFFIC VOLUMES
2008 through 2012
Average Annual Daily Trips
MOUND AREA
Visibility to properties in the District is excellent from Highway 110 – as the Highway bisects the redevelopment area. All of the housing and commercial buildings in the South 110 District would be located directly on Highway 110, as would a portion of the buildings in the Auditor’s Road and Langdon Districts. Visibility from Highway 15 is also excellent to the Lost Lake District and the eastern portion of the Auditor’s Road District. The central portion of the Auditor’s Road District is the only commercial portion of the redevelopment area that does not have di‐rect access from either highway.

DOWNTOWN DISTRICT CHARACTERISTICS
MAXFIELD RESEARCH INC. 19
Downtown Mound Overview The existing Downtown encompasses about 40 acres and contains about 50 businesses, with approximately 110,000 total square feet of office and retail space. Although Highway 15 has been realigned, the 100% corner of the Downtown Central Business District is now the intersec‐tion of Highway 15 and Highway 110. Three of the four corners of this intersection have been redeveloped in the 2000s and now include a new building for Park True Value Hardware, Walgreens and Mound Marketplace, a 74,000 square foot retail center anchored by Jubilee Foods. At the intersection of Highway 15 and Highway 110, Carbone’s Pizza and Grill is featured prominently on the second level of Mound Marketplace with an outside seating area. There is one vacant bay in Mound Marketplace and vacant retail space in Commerce Place (both end caps) and at Shoreline Plaza. New and existing businesses are considering some of the vacant space that is located in Mound, but in most cases, this would create vacant space elsewhere that would need to be filled. New retail space is currently full, but that has essentially been a result of existing businesses re‐locating to new spaces and expanding. Older space vacated by these businesses has not been backfilled, indicating that there has been a flight to higher quality space. Existing businesses are essentially stable, but not growing significantly. The effects of the downturn in the econo‐my were felt among businesses in Mound similar to other communities in the region. In gen‐eral, Mound provides “basic” retail and commercial services to residents of Mound and the sur‐rounding area, but does not generally attract customers as a “destination” location. Visitors come to Mound primarily because of a local connection to a resident, via the Dakota Trail or other special event. Mound does not generally attract people who are just passing through. Summertime attracts more people to Mound because of outdoor activities including walking, biking and boating. Strengths/Weaknesses Based on interviews with existing business owners and stakeholders in Mound and our visual analysis of the physical layout of the Downtown, and its community orientation, the following bullet points identify the key strengths and weaknesses of the Downtown regarding its poten‐tial to support additional commercial space (retail and office), housing, and a hotel in the Downtown area. They are as follows:
DOWNTOWN DISTRICT CHARACTERISTICS
MAXFIELD RESEARCH INC. 20
Downtown Strengths
1. Existing Downtown infrastructure Several years ago Mound completed a significant redevelopment that included dredging of the Lost Lake Channel to provide boat access and public docks to the southern shore of the Downtown. Additional property was created in the Mound Renaissance Harbor District south of Highway 15 along Auditor’s Road. The down‐turn in the economy stifled new development, but platted parcels are in place to ac‐commodate new development. Additional phases of the Lost Lake Villas are sched‐uled to begin construction this summer.
2. Access to Langdon Lake and the Lost Lake Channel Langdon Lake and access to Lake Minnetonka through the Lost Lake Channel are amenities that have the potential to increase drawing power. Although this is an amenity to the Downtown, the general boating public has not taken advantage of what Mound has to offer via this access from Lake Minnetonka.
3. Dakota Trail
The 13.5‐mile Dakota Trail operated by Three Rivers Park District now extends from Wayzata to Mayer with additional phases planned to be added. The trail is paved and is used primarily for biking, walking and rollerblading. Trail usage (2011) was es‐timated at 336,000 total visits with the majority of these visits 224,000 occurring during the spring/fall and approximately 170,000 occurring during the summer. The vistas along the trail of Lake Minnetonka and the surrounding area are considered to be spectacular.
4. Adjacent residential base Most retail and service businesses are supported by the surrounding population base. Currently, Mound has a sizable population that has potential to support a greater amount of retail than currently exists in the community, but significant dol‐lars continue to be spent outside of Mound, especially for specialty items.
5. Intersection of Commerce Boulevard and Highway 15 ‐ 100% Corner The redevelopment that has occurred at this intersection has created a new focal point for the Downtown. Three of the four corners have been redeveloped and have new commercial retail space. The fourth corner, Commerce Shopping Center, is the final segment to be redeveloped. These new spaces are drawing customers regularly to this location.
6. Community‐Based Events
Mound participates in and sponsors a number of events in the community and in the Downtown area. The City’s Farmer’s Market is held seasonally from mid‐May through mid‐October and is located on the Dakota Trail and adjacent to the Mound Transit Center. Within direct view of Mound Harbor, the Farmer’s Market, Spirit of

DOWNTOWN DISTRICT CHARACTERISTICS
MAXFIELD RESEARCH INC. 21
the Lakes Festival and other events provide residents and visitors with activities that bring people into the Downtown.
Downtown Weaknesses
1. Distance from large major thoroughfares Mound is centrally located between Highway 7 and Highway 12 and is approximately five miles equidistant from either roadway. Commuters using these two major thoroughfares are likely to bypass Mound on their way to and from work which re‐duces the potential traffic that could be captured from drive‐by traffic. Those that come to Mound do so usually because they are making a specific trip to the Down‐town. They are not “stopping by.” The distance from either of these highways limits Mound’s ability to attract a larger amount of drive‐by traffic. Drive‐by traffic typical‐ly fuels demand for convenience retail uses and hospitality uses.
2. Limited larger “supporting retail” Smaller retail stores often feed off traffic generated by larger stores, like grocery stores and hardware stores. Smaller retailers are likely to prefer locations that will be in close proximity to large retail generators. Retail that is primarily “destination” will be sought out by customers that have special needs and are willing to spend ex‐tra time to travel to a specific retail outlet.
3. Competition from nearby retail developments For many shopping and specialty goods, particularly for larger items, residents of Mound and the surrounding area will continue to conduct most of their shopping in Minnetonka, Wayzata, Excelsior or other retail concentrations east of Mound. Downtown Mound should try to enhance its current retail mix by identifying specific gaps in its retail offerings. Filling gaps in the current retail base will support custom‐er service needs in the retail draw area. Additional demand may be generated through attracting customers that will come to Mound because of specific uses that are located in the community.
4. Commuting to employment outside of the City
While Mound is one of the only communities in the area that has some light manu‐facturing employment, its employment base, similar to other nearby communities, has a sizeable concentration of retail jobs. Retail employment in Mound accounted for 16% of total place of work employment as of 4th Quarter 2012. This does not in‐clude self‐employed workers that would add another 10% to the total employment base.

DOWNTOWN DISTRICT CHARACTERISTICS
MAXFIELD RESEARCH INC. 22
Key Characteristics to Attract New Business Development to Downtown Based on traffic volumes on major thoroughfares, new redevelopment, geographic orientation and projected growth of trade area households, Mound can continue to attract new develop‐ment, but growth is most likely to occur through the redevelopment of older space and new businesses that will understand and support the local dynamics of the community. For many daily services, nearby residents find Mound convenient. Existing specialty retail and services are also positioned to serve the immediate surrounding population and household base, but do not generally attract customers from far outside of those areas. There is an exist‐ing and growing population in close proximity to Mound that finds shopping in the Downtown to be very convenient and people in the area support Mound businesses. Although Downtown Mound lacks large traffic volumes, Langdon Lake, Lake Minnetonka and the Dakota Trail en‐hance the Downtown’s ambiance. Mound has much to offer, but was hampered by the eco‐nomic downturn which caused some planned projects to stagnate. Activity in development and interest in Mound is increasing, but Mound must strategically target the investments that it makes moving forward to optimize the benefits of new development. Additional synergies can be derived from completing the Lost Lake Villas project, redeveloping Commerce Center and considering uses that will enhance the existing commercial base rather than just shift business‐es from one location to the next. While the recent shifts were necessary to obtain an improved image for the Downtown, new businesses are now needed to support further expansion. We see the following strategies as critical to Downtown’s further growth and development:
Redevelopment of Commerce Place Shopping Center to complete the 100% Corner;
Additional residential development in the Mound Harbor Renaissance District;
Targeted destination uses along Auditor’s Road, maintaining view sheds as much as pos‐sible;
Consider combining public, private uses together to support a key signature redevelop‐ment project;
Increase awareness of Mound development opportunities through the City website;
Assist the Economic Development Committee in targeting local and regional businesses for expansion into Mound; identify best “fit” with Mound needs;
Avoid duplicating existing uses with more of the same; new businesses should provide or target needs not currently being served by existing businesses.
We believe that based on the Downtown’s strengths, and accounting for its weaknesses, Down‐town Mound will be able to capture a portion of existing and future demand for retail, office and housing in the surrounding area. It will not be able to capture all of the demand, as no one location can capture 100% of the demand in a given area.
HOUSING MARKET ANALYSIS
MAXFIELD RESEARCH INC. 23
Introduction This section of the report presents an analysis of the demand for housing in Mound with special focus on the need for multifamily housing in the Downtown, based on an examination of de‐mographic characteristics, growth trends, and the housing market situation in the Market Area. The Market Area is defined as the area from which housing is most likely to attract buy‐ers/renters. Demographic data analyzed include population, household and employment growth trends, population age distribution, household incomes, household types and house‐hold tenure. The existing supply of owned and rental housing in the Market Area is assessed. Presented are overall vacancy and rental rates at properties located in Mound and surrounding communities including Spring Park, Excelsior and Wayzata, resales of single‐family and multifamily homes and pricing at newer developments. Planned new housing developments are also identified in the Market Area. Based on the analysis, we quantify the potential demand for a variety of housing products in the community and focus on recommendations for housing products that have the highest po‐tential demand through 2020.
Housing Market Area Definition Maxfield Research Inc. determined the primary draw area for housing in Mound based on geo‐graphic and man‐made boundaries, commuting patterns, and our knowledge of the Mound ar‐ea. The draw area (Market Area) includes the Cities of Mound, Excelsior, Long Lake, Minneton‐ka Beach, Minnetrista, Orono, St. Bonifacius, Shorewood, Spring Park, Tonka Bay and Wayzata. Additional demand will come from outside of this area because people that want to live on the Lake are finding that Mound has some significant benefits:
Housing that is priced at a level that is more affordable than other Lake Minnetonka communities;
Lakefront property that is more affordable than other Lake Minnetonka communities;
A variety of housing in multiple price categories;
A very highly‐rated school district (Westonka Public Schools); Mound Westonka High School was named one of the top high schools in the country by US News and World Report.
Small town community environment but easy driving distance to Downtown Minneap‐olis (30 minutes).
Seventeen miles of shoreline that offer more opportunities to own lakefront property;
HOUSING MARKET ANALYSIS
MAXFIELD RESEARCH INC. 24
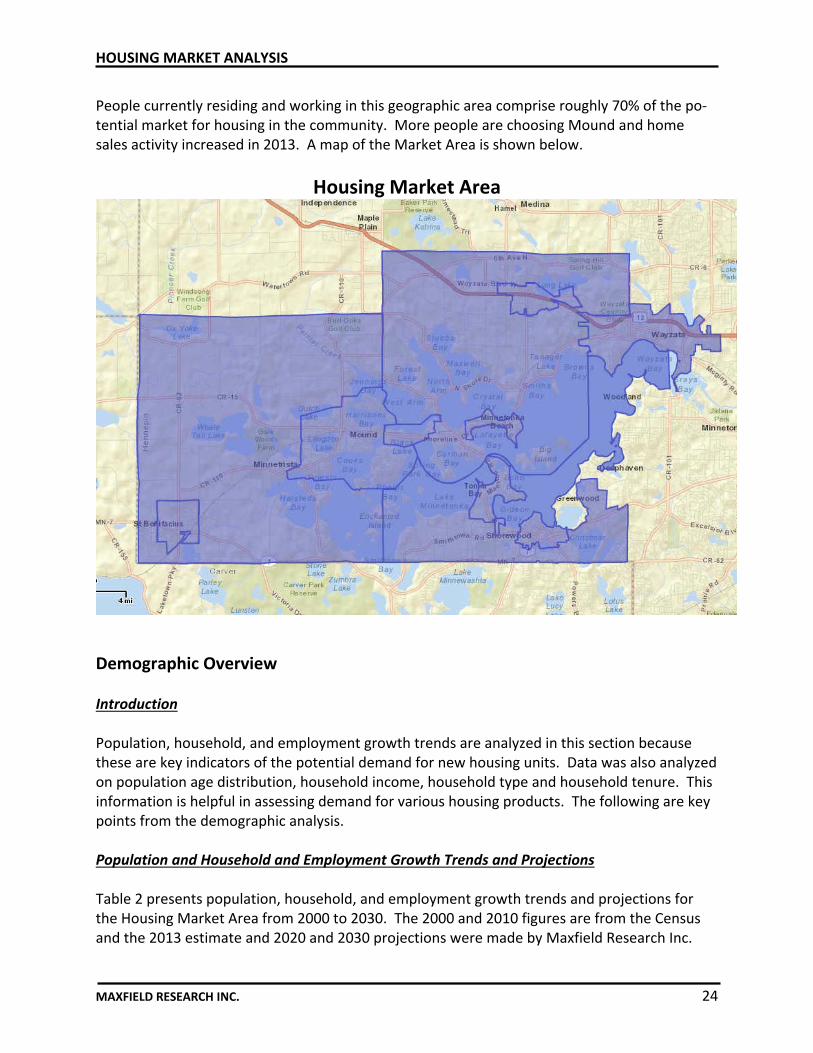
People currently residing and working in this geographic area comprise roughly 70% of the po‐tential market for housing in the community. More people are choosing Mound and home sales activity increased in 2013. A map of the Market Area is shown below.
Housing Market Area
Demographic Overview Introduction Population, household, and employment growth trends are analyzed in this section because these are key indicators of the potential demand for new housing units. Data was also analyzed on population age distribution, household income, household type and household tenure. This information is helpful in assessing demand for various housing products. The following are key points from the demographic analysis.
Population and Household and Employment Growth Trends and Projections Table 2 presents population, household, and employment growth trends and projections for the Housing Market Area from 2000 to 2030. The 2000 and 2010 figures are from the Census and the 2013 estimate and 2020 and 2030 projections were made by Maxfield Research Inc.

HOUSING MARKET ANALYSIS
MAXFIELD RESEARCH INC. 25
based on data obtained from the Metropolitan Council and ESRI Inc., a national demographics forecasting company.
Mound had 9,435 people and 3,982 households in 2000, or 28% of the Market Area’s popu‐lation (33,868 people) and 31% of the household base (13,007 households). By 2010, Mound’s population had decreased to 9,052 people and 3,974 households. The decrease in population and households primarily reflects an aging household base with fewer people in each household. This trend is affecting many other communities in the Twin Cities region, particularly those that have limited land available for new housing development.
The Housing Market Area’s population increased by 5.1% during the 2000s and households increased by 7.5% (from 13,007 households to 13,980 households). In comparison, the Metro Area’s population and household base grew by 7.9% and 9.4%, respectively, during the same period. The Metro Area experienced a faster growth rate because it includes are‐as with a significant amount of land available for new residential development and urban areas that have increased in density.
The Market Area is growing, but growth has been low, limited in large part to a lack of available land. Although Mound’s population decreased by 383 people, households de‐creased by only eight. New land was made available in the Mound Harbor Renaissance Dis‐trict and other sites could be made available as well for new housing through redevelop‐ment. Although growth in Mound during the past decade was affected in part, by the hous‐ing market downturn, demand has increased as the housing market continues to recover. Mound is currently experiencing strong demand for owner occupied housing, primarily sin‐gle‐family homes.
Declining average household size caused Mound’s population to decrease. The average household size decreased from 2.60 in 2000 to 2.54 in 2010 and is projected to decrease to 2.52 by 2020. Some of the decrease in household size will be mitigated by younger house‐holds with children moving into existing homes and older households transitioning to other housing products.
Household growth trends are a better indicator of housing demand than population growth because households represent occupied dwelling units. Between 2000 and 2010, Mound lost eight households (3,974 households).
Mound is projected to add 261 households this decade, provided that new housing devel‐opment is accommodated in the community in both low‐density, medium density and high density developments.
New development is planned for Wayzata (senior and general market housing), Minnetrista (single‐family and multifamily) and additional single‐family development is likely in some of the other outlying areas such as Watertown, Independence and Maple Plain. Residential

HOUSING MARKET ANALYSIS
MAXFIELD RESEARCH INC. 26
development in these communities will increase the potential customer base in Mound as most businesses regularly draw clientele from these communities. Restrictions on medium and high‐density development in communities west of Mound provide an opportunity to capture demand for multifamily development from households looking for greater conven‐ience.
Estimate
2000 2010 2013 2020 2030 No. Pct. No. Pct. No. Pct.
Population
Mound 9,435 9,052 9,230 9,400 9,480 ‐383 ‐4.1 348 3.8 80 0.9
Rem. Of Market Area 25,271 28,454 29,274 29,204 31,550 3,183 12.6 750 2.6 2,346 8.0
Total 34,706 37,506 38,504 38,786 41,030 2,800 8.1 1,280 3.4 2,244 5.8
Hennepin County 1,116,206 1,152,425 1,177,220 1,265,250 1,397,610 36,219 3.2 112,825 9.8 132,360 10.5
Twin Cities Metro Area 2,642,062 2,849,567 2,868,250 3,144,000 3,447,000 207,505 7.9 294,433 10.3 303,000 9.6
Households
Mound 3,982 3,974 4,052 4,235 4,350 ‐8 ‐0.2 261 6.6 115 2.7
Rem. Of Market Area 9,296 10,758 11,092 11,150 12,180 1,462 15.7 392 3.6 1,030 9.2
Total 13,278 14,732 15,144 15,385 16,530 1,454 11.0 653 4.4 1,145 7.4
Hennepin County 456,129 475,913 488,470 525,000 594,615 19,784 4.3 49,087 10.3 69,615 13.3
Twin Cities Metro Area 1,021,456 1,117,749 1,147,300 1,293,000 1,464,000 96,293 9.4 175,251 15.7 171,000 13.2
Sources: Census Bureau (2000 & 2010); Metropolitan Council; Maxfield Research Inc.
2020 to 2030
Change
TABLE 2
POPULATION AND HOUSEHOLD GROWTH TRENDS AND PROJECTIONS
MOUND HOUSING MARKET AREA
2000 to 2030
2000 to 2010 2010 to 2020Census Projection
Age Distribution The age distribution of the population relates to the type of housing needed in a given commu‐nity. Younger and older people tend to be attracted to higher density housing located near ser‐vices and entertainment; mid‐age people (particularly those with children) tend to prefer low‐er‐density single‐family homes. Table 3 presents the age distribution of the Housing Market Area population in 2000 and 2010 from the Census with an estimate for 2013 and a projection to 2020. The table shows the number of people and the percent of the population in eight age categories.
The significant investment made in the Downtown and its mixed use setting lends itself to multifamily housing products. Although multifamily housing now attracts people of most ages, it remains dominated by younger and older households. Property located in the Mound Harbor District and other sites in the Downtown are most likely to appeal to young to mid‐age singles and couples without children (25 to 45) and empty nesters and young seniors (ages 55+). During this decade, the 25 to 44 age cohort is projected to grow by 2,700 people, the 55 to 64 cohort by 7,800 and seniors (65+) by 6,800 people.
HOUSING MARKET ANALYSIS
MAXFIELD RESEARCH INC. 27
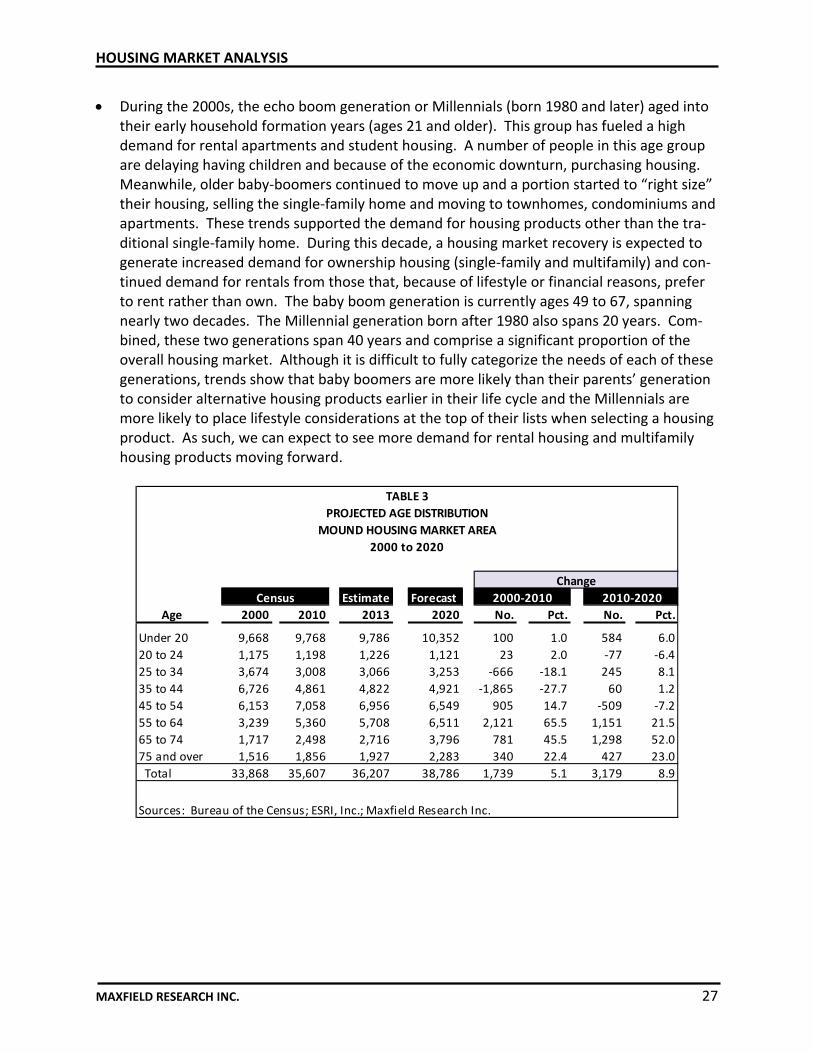
During the 2000s, the echo boom generation or Millennials (born 1980 and later) aged into their early household formation years (ages 21 and older). This group has fueled a high demand for rental apartments and student housing. A number of people in this age group are delaying having children and because of the economic downturn, purchasing housing. Meanwhile, older baby‐boomers continued to move up and a portion started to “right size” their housing, selling the single‐family home and moving to townhomes, condominiums and apartments. These trends supported the demand for housing products other than the tra‐ditional single‐family home. During this decade, a housing market recovery is expected to generate increased demand for ownership housing (single‐family and multifamily) and con‐tinued demand for rentals from those that, because of lifestyle or financial reasons, prefer to rent rather than own. The baby boom generation is currently ages 49 to 67, spanning nearly two decades. The Millennial generation born after 1980 also spans 20 years. Com‐bined, these two generations span 40 years and comprise a significant proportion of the overall housing market. Although it is difficult to fully categorize the needs of each of these generations, trends show that baby boomers are more likely than their parents’ generation to consider alternative housing products earlier in their life cycle and the Millennials are more likely to place lifestyle considerations at the top of their lists when selecting a housing product. As such, we can expect to see more demand for rental housing and multifamily housing products moving forward.
Estimate Forecast 2000‐2010 2010‐2020
Age 2000 2010 2013 2020 No. Pct. No. Pct.
Under 20 9,668 9,768 9,786 10,352 100 1.0 584 6.0
20 to 24 1,175 1,198 1,226 1,121 23 2.0 ‐77 ‐6.4
25 to 34 3,674 3,008 3,066 3,253 ‐666 ‐18.1 245 8.1
35 to 44 6,726 4,861 4,822 4,921 ‐1,865 ‐27.7 60 1.2
45 to 54 6,153 7,058 6,956 6,549 905 14.7 ‐509 ‐7.2
55 to 64 3,239 5,360 5,708 6,511 2,121 65.5 1,151 21.5
65 to 74 1,717 2,498 2,716 3,796 781 45.5 1,298 52.0
75 and over 1,516 1,856 1,927 2,283 340 22.4 427 23.0
Total 33,868 35,607 36,207 38,786 1,739 5.1 3,179 8.9
Sources: Bureau of the Census; ESRI, Inc.; Maxfield Research Inc.
Change
TABLE 3
PROJECTED AGE DISTRIBUTION
MOUND HOUSING MARKET AREA
2000 to 2020
Census
HOUSING MARKET ANALYSIS
MAXFIELD RESEARCH INC. 28
0
2,000
4,000
6,000
8,000
10,000
12,000
Under 20 20 to 24 25 to 34 35 to 44 45 to 54 55 to 64 65 to 74 75 and over
No.
of
Per
sons
Age Group
Projected Age DistributionMound Market Area
2013 ‐ 2020
2013
2020
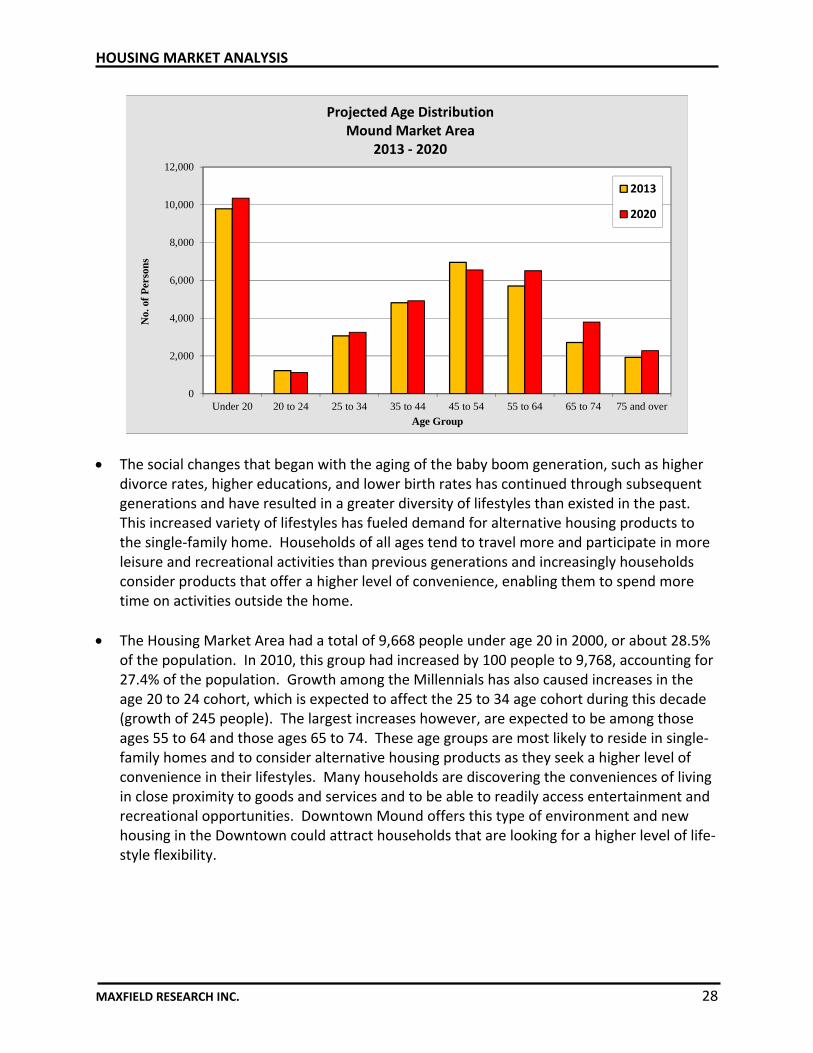
The social changes that began with the aging of the baby boom generation, such as higher divorce rates, higher educations, and lower birth rates has continued through subsequent generations and have resulted in a greater diversity of lifestyles than existed in the past. This increased variety of lifestyles has fueled demand for alternative housing products to the single‐family home. Households of all ages tend to travel more and participate in more leisure and recreational activities than previous generations and increasingly households consider products that offer a higher level of convenience, enabling them to spend more time on activities outside the home.
The Housing Market Area had a total of 9,668 people under age 20 in 2000, or about 28.5% of the population. In 2010, this group had increased by 100 people to 9,768, accounting for 27.4% of the population. Growth among the Millennials has also caused increases in the age 20 to 24 cohort, which is expected to affect the 25 to 34 age cohort during this decade (growth of 245 people). The largest increases however, are expected to be among those ages 55 to 64 and those ages 65 to 74. These age groups are most likely to reside in single‐family homes and to consider alternative housing products as they seek a higher level of convenience in their lifestyles. Many households are discovering the conveniences of living in close proximity to goods and services and to be able to readily access entertainment and recreational opportunities. Downtown Mound offers this type of environment and new housing in the Downtown could attract households that are looking for a higher level of life‐style flexibility.
HOUSING MARKET ANALYSIS
MAXFIELD RESEARCH INC. 29
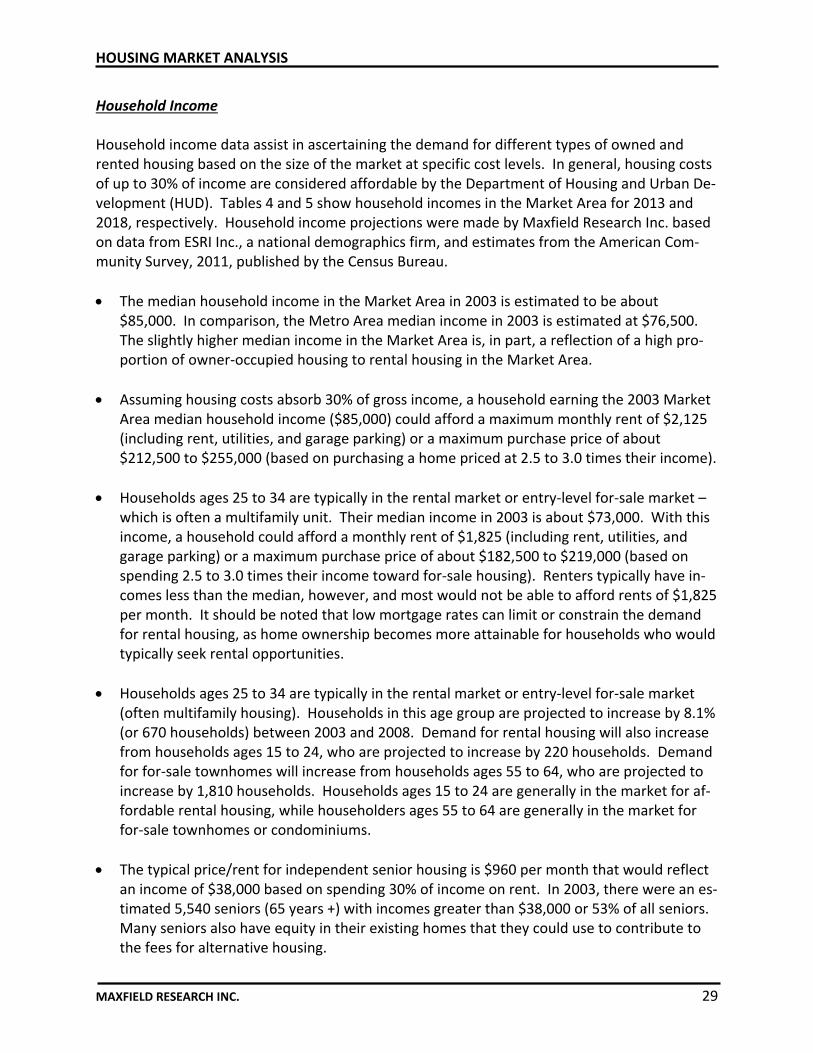
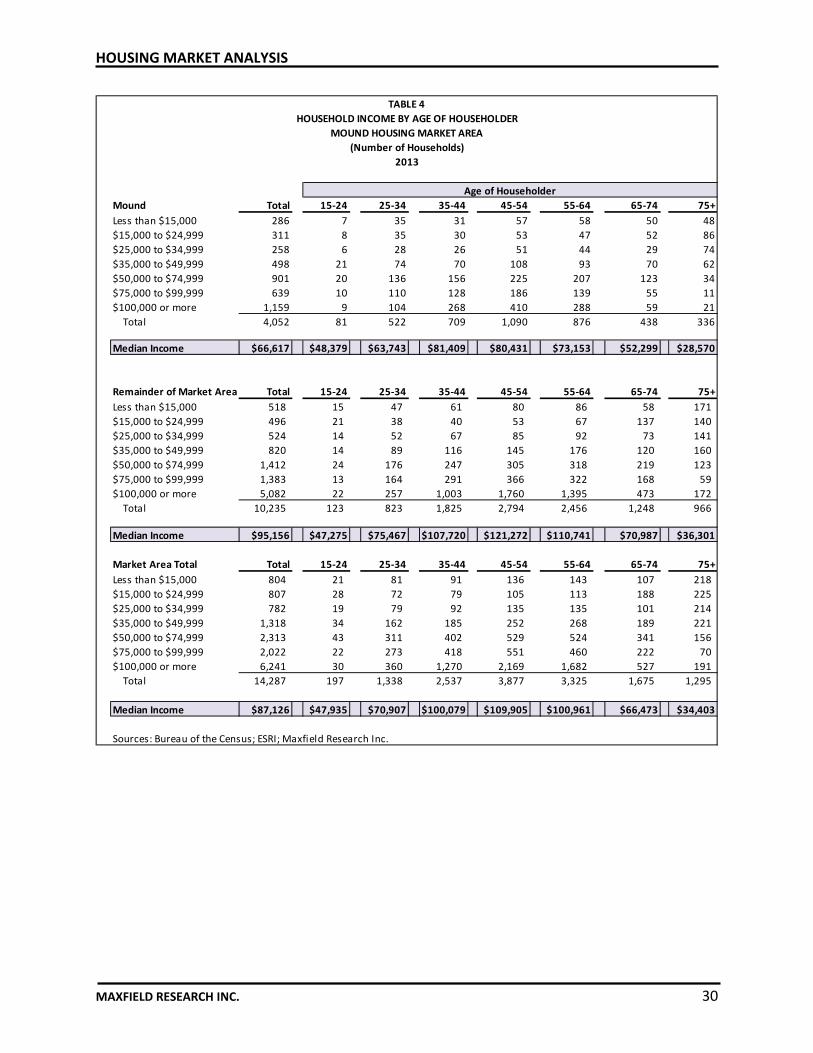
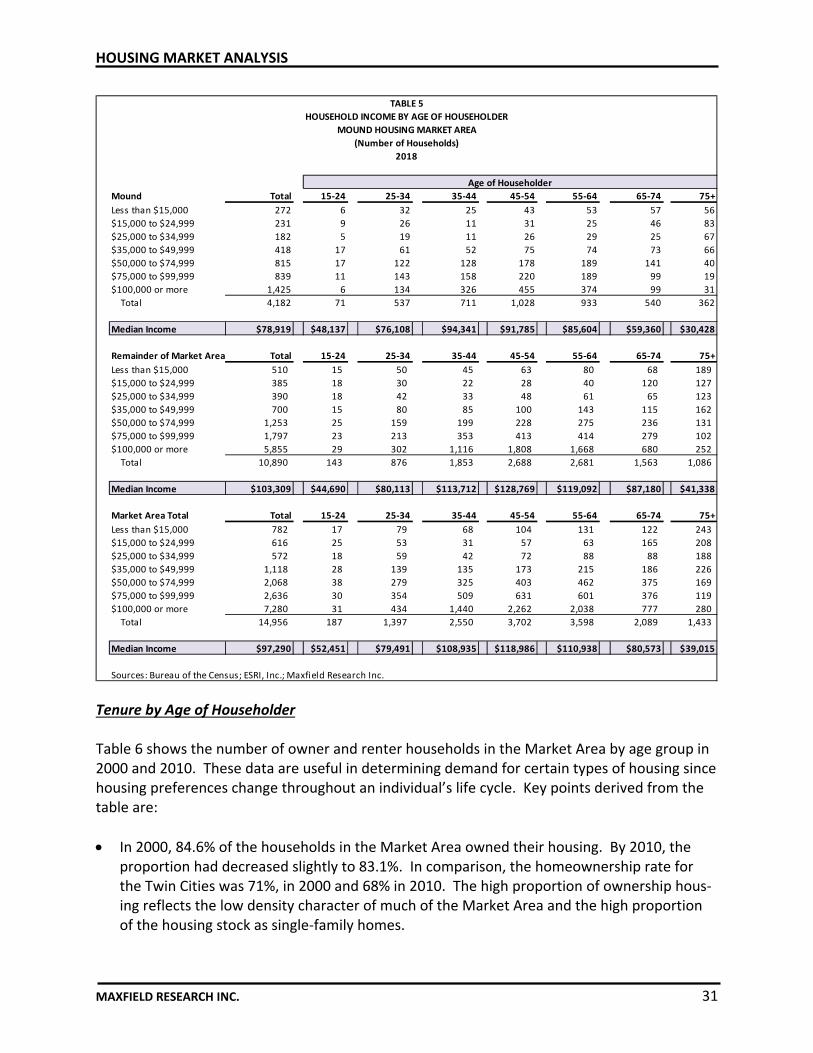
Household Income Household income data assist in ascertaining the demand for different types of owned and rented housing based on the size of the market at specific cost levels. In general, housing costs of up to 30% of income are considered affordable by the Department of Housing and Urban De‐velopment (HUD). Tables 4 and 5 show household incomes in the Market Area for 2013 and 2018, respectively. Household income projections were made by Maxfield Research Inc. based on data from ESRI Inc., a national demographics firm, and estimates from the American Com‐munity Survey, 2011, published by the Census Bureau.
The median household income in the Market Area in 2003 is estimated to be about $85,000. In comparison, the Metro Area median income in 2003 is estimated at $76,500. The slightly higher median income in the Market Area is, in part, a reflection of a high pro‐portion of owner‐occupied housing to rental housing in the Market Area.
Assuming housing costs absorb 30% of gross income, a household earning the 2003 Market Area median household income ($85,000) could afford a maximum monthly rent of $2,125 (including rent, utilities, and garage parking) or a maximum purchase price of about $212,500 to $255,000 (based on purchasing a home priced at 2.5 to 3.0 times their income).
Households ages 25 to 34 are typically in the rental market or entry‐level for‐sale market – which is often a multifamily unit. Their median income in 2003 is about $73,000. With this income, a household could afford a monthly rent of $1,825 (including rent, utilities, and garage parking) or a maximum purchase price of about $182,500 to $219,000 (based on spending 2.5 to 3.0 times their income toward for‐sale housing). Renters typically have in‐comes less than the median, however, and most would not be able to afford rents of $1,825 per month. It should be noted that low mortgage rates can limit or constrain the demand for rental housing, as home ownership becomes more attainable for households who would typically seek rental opportunities.
Households ages 25 to 34 are typically in the rental market or entry‐level for‐sale market (often multifamily housing). Households in this age group are projected to increase by 8.1% (or 670 households) between 2003 and 2008. Demand for rental housing will also increase from households ages 15 to 24, who are projected to increase by 220 households. Demand for for‐sale townhomes will increase from households ages 55 to 64, who are projected to increase by 1,810 households. Households ages 15 to 24 are generally in the market for af‐fordable rental housing, while householders ages 55 to 64 are generally in the market for for‐sale townhomes or condominiums.
The typical price/rent for independent senior housing is $960 per month that would reflect an income of $38,000 based on spending 30% of income on rent. In 2003, there were an es‐timated 5,540 seniors (65 years +) with incomes greater than $38,000 or 53% of all seniors. Many seniors also have equity in their existing homes that they could use to contribute to the fees for alternative housing.
HOUSING MARKET ANALYSIS
MAXFIELD RESEARCH INC. 30
Mound Total 15‐24 25‐34 35‐44 45‐54 55‐64 65‐74 75+
Less than $15,000 286 7 35 31 57 58 50 48
$15,000 to $24,999 311 8 35 30 53 47 52 86
$25,000 to $34,999 258 6 28 26 51 44 29 74
$35,000 to $49,999 498 21 74 70 108 93 70 62
$50,000 to $74,999 901 20 136 156 225 207 123 34
$75,000 to $99,999 639 10 110 128 186 139 55 11
$100,000 or more 1,159 9 104 268 410 288 59 21
Total 4,052 81 522 709 1,090 876 438 336
Median Income $66,617 $48,379 $63,743 $81,409 $80,431 $73,153 $52,299 $28,570
Remainder of Market Area Total 15‐24 25‐34 35‐44 45‐54 55‐64 65‐74 75+
Less than $15,000 518 15 47 61 80 86 58 171
$15,000 to $24,999 496 21 38 40 53 67 137 140
$25,000 to $34,999 524 14 52 67 85 92 73 141
$35,000 to $49,999 820 14 89 116 145 176 120 160
$50,000 to $74,999 1,412 24 176 247 305 318 219 123
$75,000 to $99,999 1,383 13 164 291 366 322 168 59
$100,000 or more 5,082 22 257 1,003 1,760 1,395 473 172
Total 10,235 123 823 1,825 2,794 2,456 1,248 966
Median Income $95,156 $47,275 $75,467 $107,720 $121,272 $110,741 $70,987 $36,301
Market Area Total Total 15‐24 25‐34 35‐44 45‐54 55‐64 65‐74 75+
Less than $15,000 804 21 81 91 136 143 107 218
$15,000 to $24,999 807 28 72 79 105 113 188 225
$25,000 to $34,999 782 19 79 92 135 135 101 214
$35,000 to $49,999 1,318 34 162 185 252 268 189 221
$50,000 to $74,999 2,313 43 311 402 529 524 341 156
$75,000 to $99,999 2,022 22 273 418 551 460 222 70
$100,000 or more 6,241 30 360 1,270 2,169 1,682 527 191
Total 14,287 197 1,338 2,537 3,877 3,325 1,675 1,295
Median Income $87,126 $47,935 $70,907 $100,079 $109,905 $100,961 $66,473 $34,403
Sources: Bureau of the Census; ESRI; Maxfield Research Inc.
Age of Householder
TABLE 4
HOUSEHOLD INCOME BY AGE OF HOUSEHOLDER
MOUND HOUSING MARKET AREA
(Number of Households)
2013
HOUSING MARKET ANALYSIS
MAXFIELD RESEARCH INC. 31
Mound Total 15‐24 25‐34 35‐44 45‐54 55‐64 65‐74 75+
Less than $15,000 272 6 32 25 43 53 57 56
$15,000 to $24,999 231 9 26 11 31 25 46 83
$25,000 to $34,999 182 5 19 11 26 29 25 67
$35,000 to $49,999 418 17 61 52 75 74 73 66
$50,000 to $74,999 815 17 122 128 178 189 141 40
$75,000 to $99,999 839 11 143 158 220 189 99 19
$100,000 or more 1,425 6 134 326 455 374 99 31
Total 4,182 71 537 711 1,028 933 540 362
Median Income $78,919 $48,137 $76,108 $94,341 $91,785 $85,604 $59,360 $30,428
Remainder of Market Area Total 15‐24 25‐34 35‐44 45‐54 55‐64 65‐74 75+
Less than $15,000 510 15 50 45 63 80 68 189
$15,000 to $24,999 385 18 30 22 28 40 120 127
$25,000 to $34,999 390 18 42 33 48 61 65 123
$35,000 to $49,999 700 15 80 85 100 143 115 162
$50,000 to $74,999 1,253 25 159 199 228 275 236 131
$75,000 to $99,999 1,797 23 213 353 413 414 279 102
$100,000 or more 5,855 29 302 1,116 1,808 1,668 680 252
Total 10,890 143 876 1,853 2,688 2,681 1,563 1,086
Median Income $103,309 $44,690 $80,113 $113,712 $128,769 $119,092 $87,180 $41,338
Market Area Total Total 15‐24 25‐34 35‐44 45‐54 55‐64 65‐74 75+
Less than $15,000 782 17 79 68 104 131 122 243
$15,000 to $24,999 616 25 53 31 57 63 165 208
$25,000 to $34,999 572 18 59 42 72 88 88 188
$35,000 to $49,999 1,118 28 139 135 173 215 186 226
$50,000 to $74,999 2,068 38 279 325 403 462 375 169
$75,000 to $99,999 2,636 30 354 509 631 601 376 119
$100,000 or more 7,280 31 434 1,440 2,262 2,038 777 280
Total 14,956 187 1,397 2,550 3,702 3,598 2,089 1,433
Median Income $97,290 $52,451 $79,491 $108,935 $118,986 $110,938 $80,573 $39,015
Sources: Bureau of the Census; ESRI, Inc.; Maxfield Research Inc.
2018
Age of Householder
TABLE 5
HOUSEHOLD INCOME BY AGE OF HOUSEHOLDER
MOUND HOUSING MARKET AREA
(Number of Households)
Tenure by Age of Householder Table 6 shows the number of owner and renter households in the Market Area by age group in 2000 and 2010. These data are useful in determining demand for certain types of housing since housing preferences change throughout an individual’s life cycle. Key points derived from the table are:
In 2000, 84.6% of the households in the Market Area owned their housing. By 2010, the proportion had decreased slightly to 83.1%. In comparison, the homeownership rate for the Twin Cities was 71%, in 2000 and 68% in 2010. The high proportion of ownership hous‐ing reflects the low density character of much of the Market Area and the high proportion of the housing stock as single‐family homes.
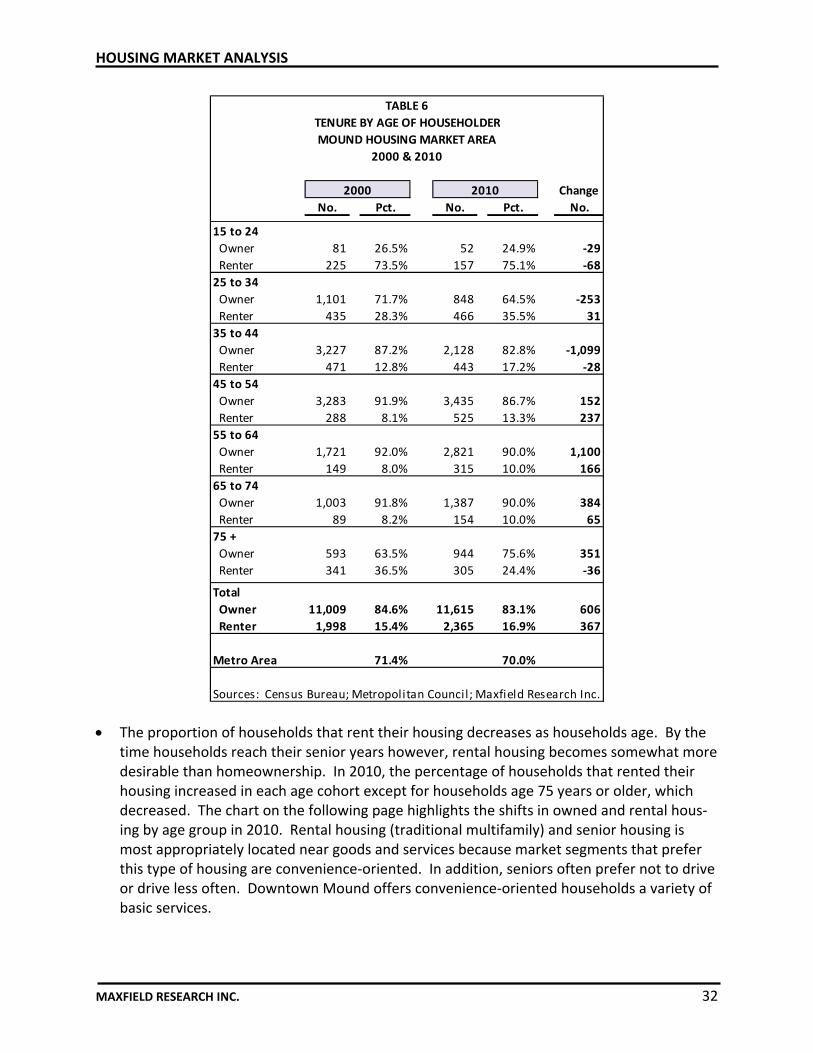
HOUSING MARKET ANALYSIS
MAXFIELD RESEARCH INC. 32
Change
No. Pct. No. Pct. No.
15 to 24
Owner 81 26.5% 52 24.9% ‐29
Renter 225 73.5% 157 75.1% ‐68
25 to 34
Owner 1,101 71.7% 848 64.5% ‐253
Renter 435 28.3% 466 35.5% 31
35 to 44
Owner 3,227 87.2% 2,128 82.8% ‐1,099
Renter 471 12.8% 443 17.2% ‐28
45 to 54
Owner 3,283 91.9% 3,435 86.7% 152
Renter 288 8.1% 525 13.3% 237
55 to 64
Owner 1,721 92.0% 2,821 90.0% 1,100
Renter 149 8.0% 315 10.0% 166
65 to 74
Owner 1,003 91.8% 1,387 90.0% 384
Renter 89 8.2% 154 10.0% 65
75 +
Owner 593 63.5% 944 75.6% 351
Renter 341 36.5% 305 24.4% ‐36
Total
Owner 11,009 84.6% 11,615 83.1% 606
Renter 1,998 15.4% 2,365 16.9% 367
Metro Area 71.4% 70.0%
Sources: Census Bureau; Metropolitan Council; Maxfield Research Inc.
2000 2010
TABLE 6
TENURE BY AGE OF HOUSEHOLDER
MOUND HOUSING MARKET AREA
2000 & 2010
The proportion of households that rent their housing decreases as households age. By the time households reach their senior years however, rental housing becomes somewhat more desirable than homeownership. In 2010, the percentage of households that rented their housing increased in each age cohort except for households age 75 years or older, which decreased. The chart on the following page highlights the shifts in owned and rental hous‐ing by age group in 2010. Rental housing (traditional multifamily) and senior housing is most appropriately located near goods and services because market segments that prefer this type of housing are convenience‐oriented. In addition, seniors often prefer not to drive or drive less often. Downtown Mound offers convenience‐oriented households a variety of basic services.
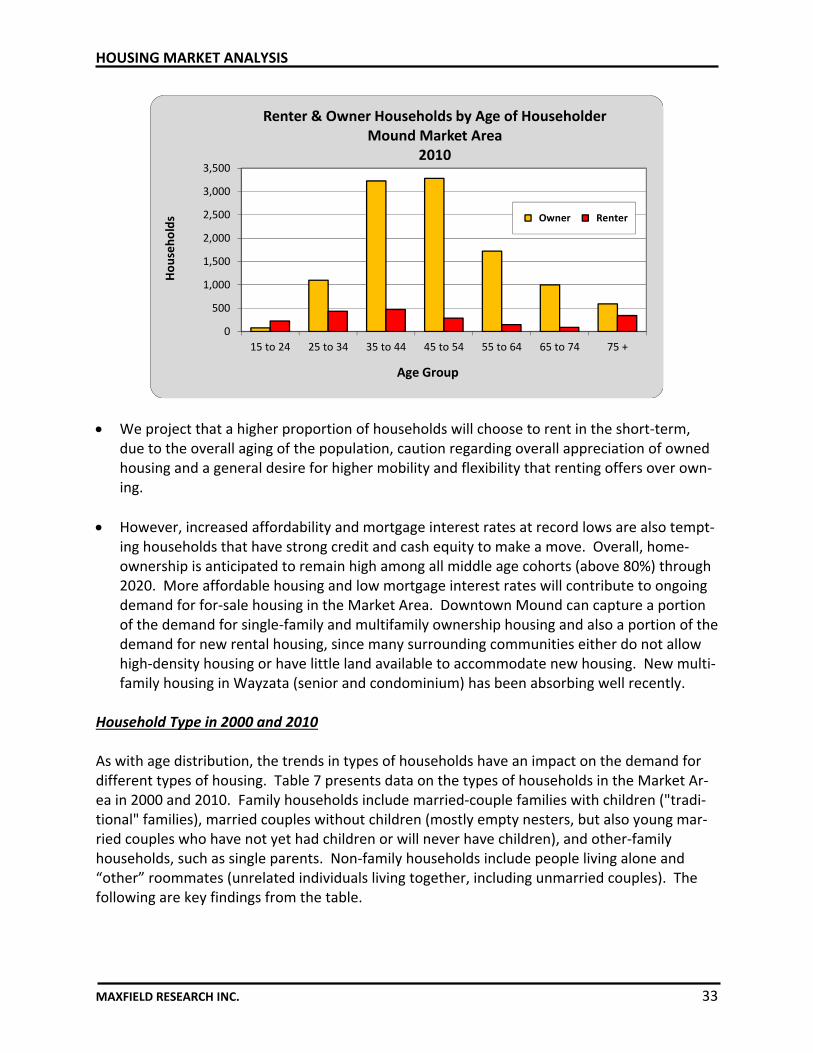
HOUSING MARKET ANALYSIS
MAXFIELD RESEARCH INC. 33
0
500
1,000
1,500
2,000
2,500
3,000
3,500
15 to 24 25 to 34 35 to 44 45 to 54 55 to 64 65 to 74 75 +
Households
Age Group
Renter & Owner Households by Age of HouseholderMound Market Area
2010
Owner Renter
We project that a higher proportion of households will choose to rent in the short‐term, due to the overall aging of the population, caution regarding overall appreciation of owned housing and a general desire for higher mobility and flexibility that renting offers over own‐ing.
However, increased affordability and mortgage interest rates at record lows are also tempt‐ing households that have strong credit and cash equity to make a move. Overall, home‐ownership is anticipated to remain high among all middle age cohorts (above 80%) through 2020. More affordable housing and low mortgage interest rates will contribute to ongoing demand for for‐sale housing in the Market Area. Downtown Mound can capture a portion of the demand for single‐family and multifamily ownership housing and also a portion of the demand for new rental housing, since many surrounding communities either do not allow high‐density housing or have little land available to accommodate new housing. New multi‐family housing in Wayzata (senior and condominium) has been absorbing well recently.
Household Type in 2000 and 2010 As with age distribution, the trends in types of households have an impact on the demand for different types of housing. Table 7 presents data on the types of households in the Market Ar‐ea in 2000 and 2010. Family households include married‐couple families with children ("tradi‐tional" families), married couples without children (mostly empty nesters, but also young mar‐ried couples who have not yet had children or will never have children), and other‐family households, such as single parents. Non‐family households include people living alone and “other” roommates (unrelated individuals living together, including unmarried couples). The following are key findings from the table.
HOUSING MARKET ANALYSIS
MAXFIELD RESEARCH INC. 34
In 2000, married couples accounted for nearly 64% of all households in the Market Area. Married couples without children were 52% of the total, while Married Couples with chil‐dren were 48% of the total. The second largest group was people living alone which ac‐counted for 22% of the total; Other Family households (primarily single‐parent households) accounted for nearly 9%. By 2010, all household type categories increased except for Mar‐ried Couples with Children, which decreased. The household type that experienced the most rapid growth during the 2000s was nearly evenly split between people living alone and Married Couples without children. Married couples without children remains the largest household type in the Market Area.
Married couples without children includes empty nesters, which are increasingly a market for for‐sale multifamily housing, and younger couples without children, who are also a pri‐mary market for rental housing and for‐sale multifamily housing. Empty nesters and younger childless couples represent the primary market segments for housing in the Down‐town except that people living alone of any age are also a strong market for multifamily housing whether for‐sale or for rent. Married couples with children still largely prefer sin‐gle‐family homes, although an increasing number will choose a townhome.
There were 3,573 non‐family households in the Mound Housing Market Area in 2000. This figure increased to 4,026 households by 2010, an increase of 453 households or 11.3%. People living alone, who are a strong market for Downtown housing, exhibited a significant increase during this period. Seniors often comprise a significant portion of this category, and are a primary market for Downtown housing, because living within walking distance, and thereby reducing the need to drive, is important to seniors.
The number of other families (primarily single‐parents), increased by 264 households be‐tween 2000 and 2010. This growth is the result of overall lifestyle changes, which also re‐sulted in growth of non‐family roommate households during the decade. Non‐family and other‐family households in the Market Area increased by 717 households during the 2000s, while married couple families increased by only 256 households. These trends should con‐tinue, as the baby boom generation ages into their young senior years and the number of younger householders increases. The result is an increased demand for rental housing, in‐cluding affordable housing and multifamily owned housing. Many households are open and interested in an option that offers them convenient access to goods and services, enter‐tainment and recreation opportunities such as those available in Downtown Mound.
Roommate households consist of unrelated people living with each other to share housing costs and also unmarried couples without children, among others. In the past, most of these people tended to be younger and most still are. However, there is a growing group of cohabitating couples that have never married or prefer not to marry again. A number of these households may want to live in locations that are closer to entertainment, activities and other nightlife and would be a target market for housing in Downtown Mound. Room‐mate households increased by 57 households or 7.7% in the 2000s.

HOUSING MARKET ANALYSIS
MAXFIELD RESEARCH INC. 35
2000 2010 2000 2010 2000 2010 2000 2010 2000 2010 2000 2010
Number of Households
Mound 3,982 3,974 945 759 1,184 1,152 430 533 1,128 1,220 295 310
Rem.of Market Area 9,025 10,006 3,050 3,099 3,121 3,546 704 865 1,705 2,009 445 487
Market Area Total 13,007 13,980 3,995 3,858 4,305 4,698 1,134 1,398 2,833 3,229 740 797
Hennepin County 456,129 475,913 95,469 89,084 111,018 116,099 60,816 67,702 145,086 155,807 43,740 47,221
Percent of Total
Mound 100.0 100.0 23.7 19.1 29.7 29.0 10.8 13.4 28.3 30.7 7.4 7.8
Rem.of Market Area 100.0 100.0 33.8 31.0 34.6 35.4 7.8 8.6 18.9 20.1 4.9 4.9
Market Area Total 100.0 100.0 30.7 27.6 33.1 33.6 8.7 10.0 21.8 23.1 5.7 5.7
Hennepin County 100.0 100.0 20.9 18.7 24.3 24.4 13.3 14.2 31.8 32.7 9.6 9.9
No. Pct. No. Pct. No. Pct. No. Pct. No. Pct. No. Pct.
Mound ‐8 ‐0.2% ‐186 ‐19.7% ‐32 ‐2.7% 103 24.0% 92 8.2% 15 5.1%
Rem.of Market Area 981 10.9% 49 1.6% 425 13.6% 161 22.9% 304 17.8% 42 9.4%
Market Area Total 973 7.5% ‐137 ‐3.4% 393 9.1% 264 23.3% 396 14.0% 57 7.7%
Hennepin County 19,784 4.3% ‐6,385 ‐6.7% 5,081 4.6% 6,886 11.3% 10,721 7.4% 3,481 8.0%
* Single‐parents and unmarried couples with children
** Includes unmarried couples without children
Source: US Census Bureau
Change
Family Households Non‐Family Households
Total HH's Married w/ Child Married w/o Child Other * Living Alone Roommates**
TABLE 7
HOUSEHOLD TYPE
MOUND HOUSING MARKET AREA
2000 & 2010

HOUSING MARKET ANALYSIS
MAXFIELD RESEARCH INC. 36
The increased diversity of household types in the Market Area, caused by overall lifestyle changes, is creating a need for a wider range of housing options. For example, non‐family householders tend to rent their housing more so than the other household types. This cate‐gory includes elderly widows as well as young people. A proportion of young people do not have sufficient incomes to purchase housing, while single seniors are more likely to move to multifamily housing to shed the burden of home maintenance and to have more opportuni‐ties for socialization.
Residential Construction Trends Table 8 presents information on the number of residential units added to the housing stock from building permits issued by the Market Area jurisdictions. The following are key points from the table. Over the past three years, 2010 through 2012, 481 new housing units were added in the
Market Area. Of the new units added, 42% were single‐family homes (204 units). Minnetrista led the Market Area by adding 83 new single‐family units, followed by Orono
(50 units). Shorewood and Wayzata tied with 34 units each. Two multifamily properties were developed during the period, 52 units in Spring Park and 225 units in Wayzata.
The supply of vacant land in the Housing Market Area continues to dwindle. This situation,
couple with the fact that most of the Market Area communities are zoned primarily for sin‐gle‐family homes, offers Mound an opportunity to capture a larger share of the Market Ar‐ea’s multifamily housing development this decade.
Multifamily development among the Housing Market Area communities accounted for 58% of the total units, but all of these units (277) were concentrated in two developments in two communities. We anticipate that increased demand for townhomes will be fueled by the growing number of baby boomers that are becoming empty‐nesters and also by a growing preference for townhomes and condominiums by younger and middle age householders who value affordability and limited‐maintenance offered by these type of housing products.

HOUSING MARKET ANALYSIS
MAXFIELD RESEARCH INC. 37
Mound Spring Park Tonka Bay Minnetrista Excelsior Orono Shorewood St. Boni Wayzata Total
2010 6 2 1 33 0 10 8 1 8 61
2011 7 1 1 29 1 15 8 0 13 62
2012 6 0 5 21 6 25 18 0 13 81
Total 19 3 7 83 7 50 34 1 34 204
2010 0 52 0 0 0 0 0 0 0 52
2011 0 0 0 0 0 0 0 0 0 0
2012 0 0 0 0 0 0 0 0 225 225
Total 0 52 0 0 0 0 0 0 225 277
Source: US Census
Single‐Family
Multifamily
TABLE 8
RESIDENTIAL UNITS ADDED FROM BUILDING PERMITS ISSUED
MOUND HOUSING MARKET AREA
2010 through 2012
HOUSING MARKET ANALYSIS
MAXFIELD RESEARCH INC. 38
Impact of Demographic Trends on Housing
The most significant demographic trends affecting demand for housing in Mound are the aging of the baby boom generation (empty‐nesters) that is looking for housing options that provide greater flexibility and relief from exterior home maintenance and young to mid‐age households looking for maximum flexibility that a rental option can provide. Although growth is not projected to be significant this decade, the lack of new housing and pent‐up demand from the recession is causing an increase in residential activity across all product types.
A higher proportion of households than in the past are looking for greater convenience and rental housing can offer that flexibility. The current rental market situation in the Twin Cit‐ies Metro Area and in the Mound Housing Area demonstrates increased market activity (home resales), low rental vacancy rates (pent‐up demand), increased interest in purchasing a home with mortgage interest rates at all‐time lows, greater confidence in the employment outlook and greater affordability as home prices have decreased. There is increasing de‐mand for maintenance‐free alternatives to single‐family homes. This trend is expected to support the potential demand for medium to high density housing in a Downtown environ‐ment.
Young seniors (those ages 65 to 74) are projected to increase by 6,775 people or 47%, be‐tween 2010 and 2020. The growing senior population and an increasing acceptance of sen‐ior housing options are creating strong demand for senior housing. Seniors are a primary market for Downtown housing because of their desire to be close to goods and services.
More people now are living alone than ever before and married couples without children and single person households are the two largest household types in the Market Area. De‐velopment of housing products that fit the needs of active adults in a Downtown environ‐ment can bring more people to the Downtown that would consider the Downtown their “neighborhood.”
Changing demographics and housing preferences are creating demand for additional multi‐family housing however, most communities in the Market Area discourage high‐density housing, particularly rental housing. The proportion of renter households in the area in‐creased in each age cohort during the 2000s except for those ages 65 or older.

HOUSING MARKET ANALYSIS
MAXFIELD RESEARCH INC. 39
Rental Market Analysis Introduction This section provides an overview of the rental market situation in the Market Area. Overall, vacancy and average monthly rents for selected communities in and near the Market Area were examined, using data from the Marquette Advisors Metro Trends Report. This data provides insight regarding the demand for new rental product in the area. Maxfield Research Inc. also analyzed the performance of existing older and newer apartment product in Mound and sur‐rounding communities, looking at buildings’ ages, unit mixes, sizes, monthly rents and vacancy rates as of 1st Quarter 2013. Monthly Rent and Vacancy Trends A summary of average monthly rents and vacancy rate data was obtained from Marquette Ad‐visors: Apartment Trends and was available for the following submarkets: Wayzata/Mound and Excelsior/Spring Park. Table 9 presents overall vacancy and monthly rents for 1st Quarter 2013 and an average rent increase for the previous 12 months. The following are key points from the table.
The equilibrium vacancy rate for rental housing is considered to be 5.0%. This allows for normal turnover and an adequate supply of alternatives for prospective renters. During the 1st Quarter of 2013, the apartment vacancy rate in the selected Market Area communities was 2.5% in Wayzata/Mound and 2.5% in Excelsior/Spring Park. The vacancy rate in the Twin Cities was 2.8%. In effect, the supply of rental housing is currently inadequate to meet demand. The vacancy rate in the Wayzata/Mound submarket has decreased from 4.3% two years ago to its current 2.5% primarily because of higher housing foreclosures and a higher proportion of households choosing rental housing because of a concern about housing val‐ues and home appreciation.
There remains some shortage of units affordable to moderate income households. The va‐cancy rates for units in the Twin Cities Metro Area with monthly rents below $900 range from a low of 1.7% to 2.5%, while vacancy rates among units with rents above $900 range from 2.7% to 4.7%. Also there is demand for new product types, where none have been built for many years.
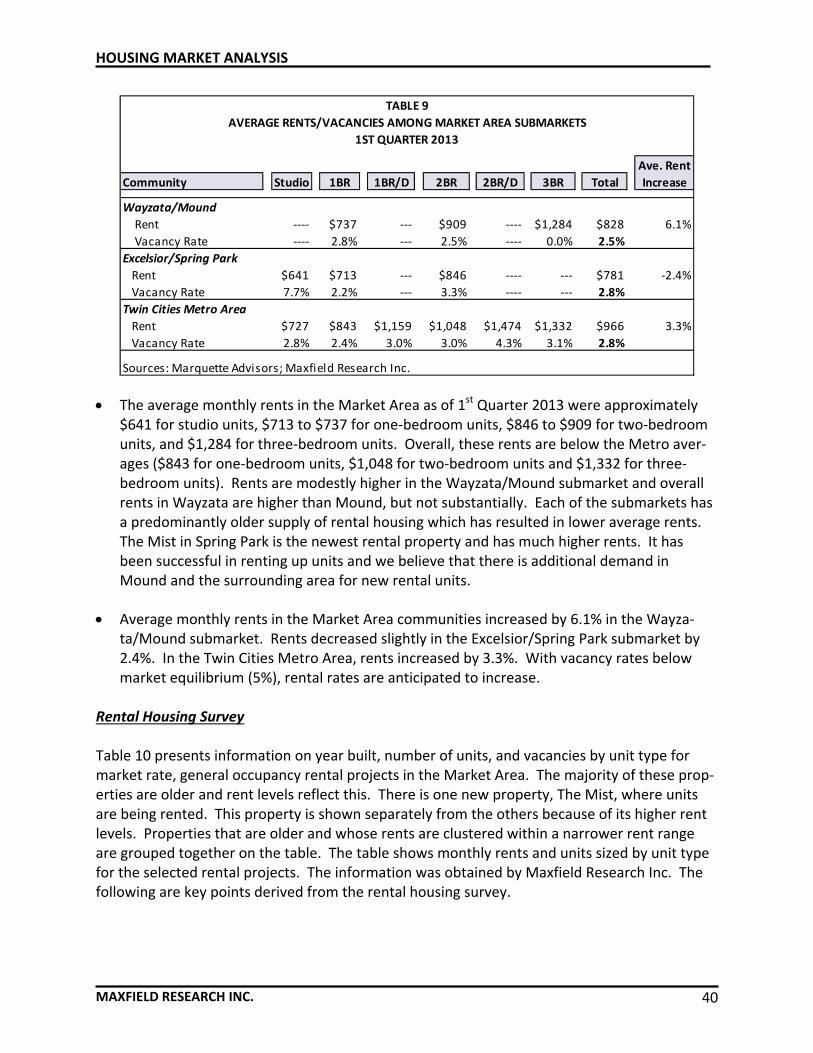
HOUSING MARKET ANALYSIS
MAXFIELD RESEARCH INC. 40
Ave. Rent
Community Studio 1BR 1BR/D 2BR 2BR/D 3BR Total Increase
Wayzata/Mound
Rent ‐‐‐‐ $737 ‐‐‐ $909 ‐‐‐‐ $1,284 $828 6.1%
Vacancy Rate ‐‐‐‐ 2.8% ‐‐‐ 2.5% ‐‐‐‐ 0.0% 2.5%
Excelsior/Spring Park
Rent $641 $713 ‐‐‐ $846 ‐‐‐‐ ‐‐‐ $781 ‐2.4%
Vacancy Rate 7.7% 2.2% ‐‐‐ 3.3% ‐‐‐‐ ‐‐‐ 2.8%
Twin Cities Metro Area
Rent $727 $843 $1,159 $1,048 $1,474 $1,332 $966 3.3%
Vacancy Rate 2.8% 2.4% 3.0% 3.0% 4.3% 3.1% 2.8%
Sources: Marquette Advisors; Maxfield Research Inc.
TABLE 9
AVERAGE RENTS/VACANCIES AMONG MARKET AREA SUBMARKETS
1ST QUARTER 2013
The average monthly rents in the Market Area as of 1st Quarter 2013 were approximately $641 for studio units, $713 to $737 for one‐bedroom units, $846 to $909 for two‐bedroom units, and $1,284 for three‐bedroom units. Overall, these rents are below the Metro aver‐ages ($843 for one‐bedroom units, $1,048 for two‐bedroom units and $1,332 for three‐bedroom units). Rents are modestly higher in the Wayzata/Mound submarket and overall rents in Wayzata are higher than Mound, but not substantially. Each of the submarkets has a predominantly older supply of rental housing which has resulted in lower average rents. The Mist in Spring Park is the newest rental property and has much higher rents. It has been successful in renting up units and we believe that there is additional demand in Mound and the surrounding area for new rental units.
Average monthly rents in the Market Area communities increased by 6.1% in the Wayza‐
ta/Mound submarket. Rents decreased slightly in the Excelsior/Spring Park submarket by 2.4%. In the Twin Cities Metro Area, rents increased by 3.3%. With vacancy rates below market equilibrium (5%), rental rates are anticipated to increase.
Rental Housing Survey Table 10 presents information on year built, number of units, and vacancies by unit type for market rate, general occupancy rental projects in the Market Area. The majority of these prop‐erties are older and rent levels reflect this. There is one new property, The Mist, where units are being rented. This property is shown separately from the others because of its higher rent levels. Properties that are older and whose rents are clustered within a narrower rent range are grouped together on the table. The table shows monthly rents and units sized by unit type for the selected rental projects. The information was obtained by Maxfield Research Inc. The following are key points derived from the rental housing survey.
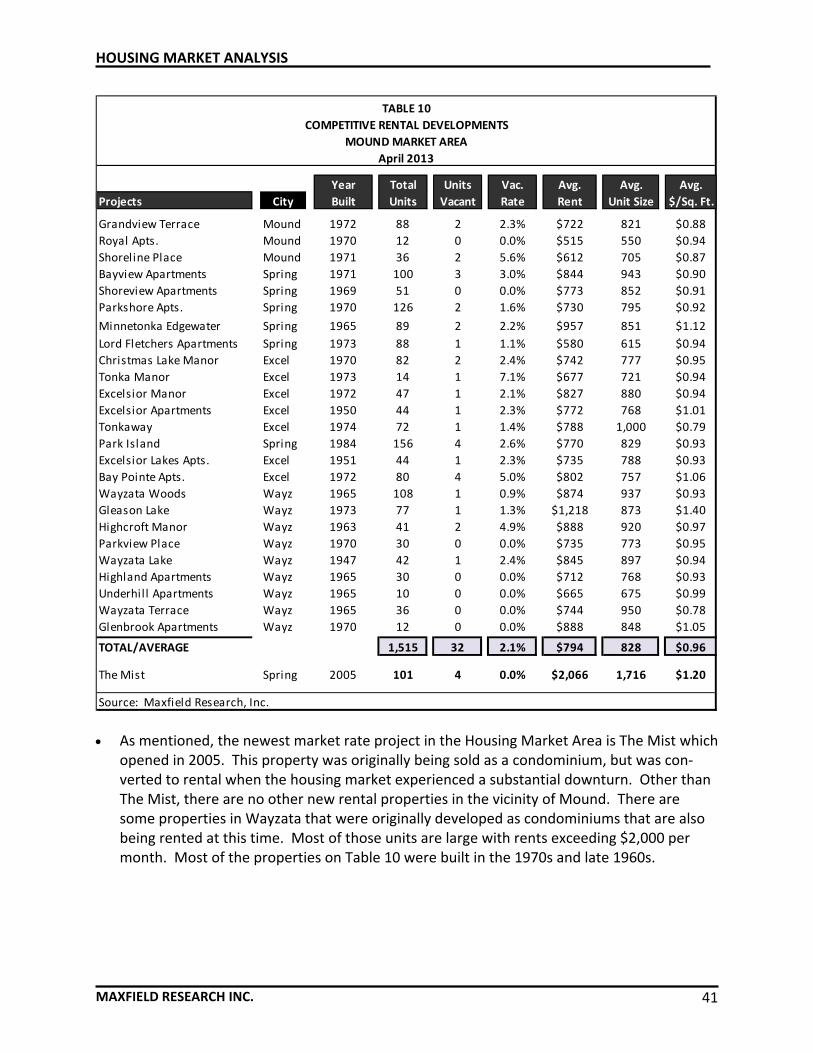
HOUSING MARKET ANALYSIS
MAXFIELD RESEARCH INC. 41
Year Total Units Vac. Avg. Avg. Avg.
Projects City Built Units Vacant Rate Rent Unit Size $/Sq. Ft.
Grandview Terrace Mound 1972 88 2 2.3% $722 821 $0.88
Royal Apts. Mound 1970 12 0 0.0% $515 550 $0.94
Shoreline Place Mound 1971 36 2 5.6% $612 705 $0.87
Bayview Apartments Spring 1971 100 3 3.0% $844 943 $0.90
Shoreview Apartments Spring 1969 51 0 0.0% $773 852 $0.91
Parkshore Apts. Spring 1970 126 2 1.6% $730 795 $0.92
Minnetonka Edgewater Spring 1965 89 2 2.2% $957 851 $1.12
Lord Fletchers Apartments Spring 1973 88 1 1.1% $580 615 $0.94
Christmas Lake Manor Excel 1970 82 2 2.4% $742 777 $0.95
Tonka Manor Excel 1973 14 1 7.1% $677 721 $0.94
Excelsior Manor Excel 1972 47 1 2.1% $827 880 $0.94
Excelsior Apartments Excel 1950 44 1 2.3% $772 768 $1.01
Tonkaway Excel 1974 72 1 1.4% $788 1,000 $0.79
Park Island Spring 1984 156 4 2.6% $770 829 $0.93
Excelsior Lakes Apts. Excel 1951 44 1 2.3% $735 788 $0.93
Bay Pointe Apts. Excel 1972 80 4 5.0% $802 757 $1.06
Wayzata Woods Wayz 1965 108 1 0.9% $874 937 $0.93
Gleason Lake Wayz 1973 77 1 1.3% $1,218 873 $1.40
Highcroft Manor Wayz 1963 41 2 4.9% $888 920 $0.97
Parkview Place Wayz 1970 30 0 0.0% $735 773 $0.95
Wayzata Lake Wayz 1947 42 1 2.4% $845 897 $0.94
Highland Apartments Wayz 1965 30 0 0.0% $712 768 $0.93
Underhil l Apartments Wayz 1965 10 0 0.0% $665 675 $0.99
Wayzata Terrace Wayz 1965 36 0 0.0% $744 950 $0.78
Glenbrook Apartments Wayz 1970 12 0 0.0% $888 848 $1.05
TOTAL/AVERAGE 1,515 32 2.1% $794 828 $0.96
The Mist Spring 2005 101 4 0.0% $2,066 1,716 $1.20
Source: Maxfield Research, Inc.
TABLE 10
COMPETITIVE RENTAL DEVELOPMENTS
MOUND MARKET AREA
April 2013
As mentioned, the newest market rate project in the Housing Market Area is The Mist which
opened in 2005. This property was originally being sold as a condominium, but was con‐verted to rental when the housing market experienced a substantial downturn. Other than The Mist, there are no other new rental properties in the vicinity of Mound. There are some properties in Wayzata that were originally developed as condominiums that are also being rented at this time. Most of those units are large with rents exceeding $2,000 per month. Most of the properties on Table 10 were built in the 1970s and late 1960s.
HOUSING MARKET ANALYSIS
MAXFIELD RESEARCH INC. 42
In total, the rental survey includes 1,616 units and among 26 projects surveyed, 36 units were vacant, for a vacancy rate of 2.2%. This is slightly lower than the Market Area’s overall 2.6% vacancy rate (calculated from Table 9), but the difference is not significant. As men‐tioned earlier, the industry standard equilibrium vacancy rate for rental housing is 5.0%. This allows for normal turnover and an adequate supply of alternatives for prospective renters. To achieve a market equilibrium vacancy rate of 5.0%, an additional 55 units would need to become vacant in Market Area projects.
The average monthly rent at the properties surveyed was $794 for 828 square feet or $0.96
per square foot. Table 11 shows average monthly rents by unit type at:
Studio $450 1BR $736 1B+Den $860 2BR $893 3BR $1,276
Rents at The Mist are substantially higher than the average rents at most properties in the Mar‐ket Area. Rent levels at The Mist range from $1,400 for a one‐bedroom unit to $3,350 for a two‐bedroom plus den unit or an average of $1.20 per square foot overall. Unit sizes are gen‐erally larger at The Mist because of its development as a condominium. A new rental property would require per square foot rents to be somewhat higher than what is currently being charged in the Market Area, about $1.40 to $1.50 per square foot. This is usually achieved through somewhat smaller unit sizes but the addition of a significant amenity package to sup‐port the higher rent levels.
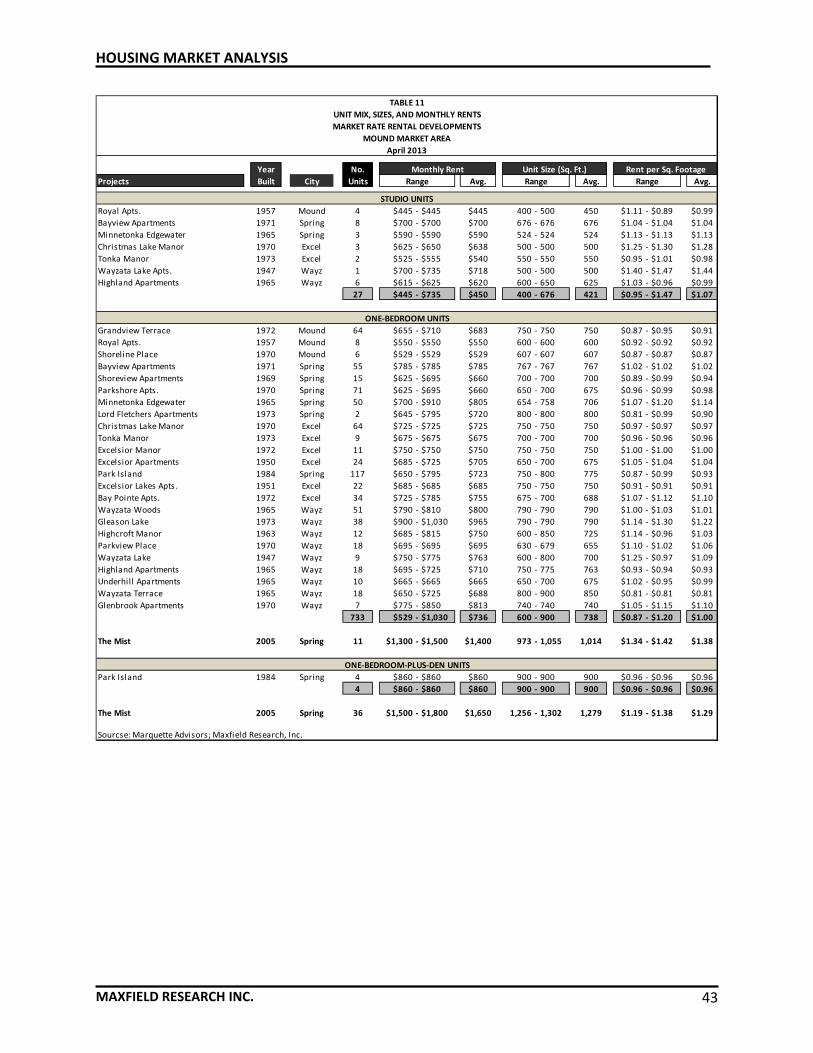
HOUSING MARKET ANALYSIS
MAXFIELD RESEARCH INC. 43
Year No.
Projects Built City Units Avg. Avg. Avg.
Royal Apts. 1957 Mound 4 $445 ‐ $445 $445 400 ‐ 500 450 $1.11 ‐ $0.89 $0.99
Bayview Apartments 1971 Spring 8 $700 ‐ $700 $700 676 ‐ 676 676 $1.04 ‐ $1.04 $1.04
Minnetonka Edgewater 1965 Spring 3 $590 ‐ $590 $590 524 ‐ 524 524 $1.13 ‐ $1.13 $1.13
Christmas Lake Manor 1970 Excel 3 $625 ‐ $650 $638 500 ‐ 500 500 $1.25 ‐ $1.30 $1.28
Tonka Manor 1973 Excel 2 $525 ‐ $555 $540 550 ‐ 550 550 $0.95 ‐ $1.01 $0.98
Wayzata Lake Apts. 1947 Wayz 1 $700 ‐ $735 $718 500 ‐ 500 500 $1.40 ‐ $1.47 $1.44
Highland Apartments 1965 Wayz 6 $615 ‐ $625 $620 600 ‐ 650 625 $1.03 ‐ $0.96 $0.99
27 $445 ‐ $735 $450 400 ‐ 676 421 $0.95 ‐ $1.47 $1.07
Grandview Terrace 1972 Mound 64 $655 ‐ $710 $683 750 ‐ 750 750 $0.87 ‐ $0.95 $0.91
Royal Apts. 1957 Mound 8 $550 ‐ $550 $550 600 ‐ 600 600 $0.92 ‐ $0.92 $0.92
Shoreline Place 1970 Mound 6 $529 ‐ $529 $529 607 ‐ 607 607 $0.87 ‐ $0.87 $0.87
Bayview Apartments 1971 Spring 55 $785 ‐ $785 $785 767 ‐ 767 767 $1.02 ‐ $1.02 $1.02
Shoreview Apartments 1969 Spring 15 $625 ‐ $695 $660 700 ‐ 700 700 $0.89 ‐ $0.99 $0.94
Parkshore Apts. 1970 Spring 71 $625 ‐ $695 $660 650 ‐ 700 675 $0.96 ‐ $0.99 $0.98
Minnetonka Edgewater 1965 Spring 50 $700 ‐ $910 $805 654 ‐ 758 706 $1.07 ‐ $1.20 $1.14
Lord Fletchers Apartments 1973 Spring 2 $645 ‐ $795 $720 800 ‐ 800 800 $0.81 ‐ $0.99 $0.90
Christmas Lake Manor 1970 Excel 64 $725 ‐ $725 $725 750 ‐ 750 750 $0.97 ‐ $0.97 $0.97
Tonka Manor 1973 Excel 9 $675 ‐ $675 $675 700 ‐ 700 700 $0.96 ‐ $0.96 $0.96
Excelsior Manor 1972 Excel 11 $750 ‐ $750 $750 750 ‐ 750 750 $1.00 ‐ $1.00 $1.00
Excelsior Apartments 1950 Excel 24 $685 ‐ $725 $705 650 ‐ 700 675 $1.05 ‐ $1.04 $1.04
Park Island 1984 Spring 117 $650 ‐ $795 $723 750 ‐ 800 775 $0.87 ‐ $0.99 $0.93
Excelsior Lakes Apts. 1951 Excel 22 $685 ‐ $685 $685 750 ‐ 750 750 $0.91 ‐ $0.91 $0.91
Bay Pointe Apts. 1972 Excel 34 $725 ‐ $785 $755 675 ‐ 700 688 $1.07 ‐ $1.12 $1.10
Wayzata Woods 1965 Wayz 51 $790 ‐ $810 $800 790 ‐ 790 790 $1.00 ‐ $1.03 $1.01
Gleason Lake 1973 Wayz 38 $900 ‐ $1,030 $965 790 ‐ 790 790 $1.14 ‐ $1.30 $1.22
Highcroft Manor 1963 Wayz 12 $685 ‐ $815 $750 600 ‐ 850 725 $1.14 ‐ $0.96 $1.03
Parkview Place 1970 Wayz 18 $695 ‐ $695 $695 630 ‐ 679 655 $1.10 ‐ $1.02 $1.06
Wayzata Lake 1947 Wayz 9 $750 ‐ $775 $763 600 ‐ 800 700 $1.25 ‐ $0.97 $1.09
Highland Apartments 1965 Wayz 18 $695 ‐ $725 $710 750 ‐ 775 763 $0.93 ‐ $0.94 $0.93
Underhill Apartments 1965 Wayz 10 $665 ‐ $665 $665 650 ‐ 700 675 $1.02 ‐ $0.95 $0.99
Wayzata Terrace 1965 Wayz 18 $650 ‐ $725 $688 800 ‐ 900 850 $0.81 ‐ $0.81 $0.81
Glenbrook Apartments 1970 Wayz 7 $775 ‐ $850 $813 740 ‐ 740 740 $1.05 ‐ $1.15 $1.10
733 $529 ‐ $1,030 $736 600 ‐ 900 738 $0.87 ‐ $1.20 $1.00
The Mist 2005 Spring 11 $1,300 ‐ $1,500 $1,400 973 ‐ 1,055 1,014 $1.34 ‐ $1.42 $1.38
Park Island 1984 Spring 4 $860 ‐ $860 $860 900 ‐ 900 900 $0.96 ‐ $0.96 $0.96
4 $860 ‐ $860 $860 900 ‐ 900 900 $0.96 ‐ $0.96 $0.96
The Mist 2005 Spring 36 $1,500 ‐ $1,800 $1,650 1,256 ‐ 1,302 1,279 $1.19 ‐ $1.38 $1.29
Sourcse: Marquette Advisors; Maxfield Research, Inc.
Rent per Sq. Footage
STUDIO UNITS
ONE‐BEDROOM UNITS
TABLE 11
MARKET RATE RENTAL DEVELOPMENTS
MOUND MARKET AREA
April 2013
UNIT MIX, SIZES, AND MONTHLY RENTS
Range
Monthly Rent
Range
Unit Size (Sq. Ft.)
Range
ONE‐BEDROOM‐PLUS‐DEN UNITS

HOUSING MARKET ANALYSIS
MAXFIELD RESEARCH INC. 44
Year No.
Projects Built City Units Avg. Avg. Avg.
Grandview Terrace 1972 Mound 24 $820 ‐ $835 $828 1,010 ‐ 1,010 1,010 $0.81 ‐ $0.83 $0.82
Shoreline Place 1970 Mound 30 $629 ‐ $629 $629 725 ‐ 725 725 $0.87 ‐ $0.87 $0.87
Bayview Apartments 1971 Spring 26 $905 ‐ $905 $905 1,100 ‐ 1,180 1,140 $0.82 ‐ $0.77 $0.79
Shoreview Apartments 1969 Spring 36 $745 ‐ $895 $820 915 ‐ 915 915 $0.81 ‐ $0.98 $0.90
Parkshore Apts. 1970 Spring 55 $745 ‐ $895 $820 900 ‐ 1,000 950 $0.83 ‐ $0.90 $0.86
Minnetonka Edgewater 1965 Spring 36 $1,050 ‐ $1,345 $1,198 990 ‐ 1,169 1,080 $1.06 ‐ $1.15 $1.11
Lord Fletcher's Apartments 1973 Spring 50 $835 ‐ $1,150 $993 1,000 ‐ 1,100 1,050 $0.84 ‐ $1.05 $0.95
Christmas Lake Manor 1970 Excel 15 $825 ‐ $850 $838 950 ‐ 950 950 $0.87 ‐ $0.89 $0.88
Tonka Manor 1973 Excel 3 $750 ‐ $800 $775 900 ‐ 900 900 $0.83 ‐ $0.89 $0.86
Excelsior Manor 1972 Excel 36 $825 ‐ $875 $850 920 ‐ 920 920 $0.90 ‐ $0.95 $0.92
Excelsior Apartments 1950 Excel 22 $775 ‐ $775 $775 750 ‐ 850 800 $1.03 ‐ $0.91 $0.97
Tonkaway Apts. 1974 Excel 72 $750 ‐ $825 $788 1,000 ‐ 1,000 1,000 $0.75 ‐ $0.83 $0.79
Park Island 1984 Spring 35 $890 ‐ $950 $920 1,000 ‐ 1,000 1,000 $0.89 ‐ $0.95 $0.92
Excelsior Lakes Apts. 1951 Excel 22 $785 ‐ $785 $785 825 ‐ 825 825 $0.95 ‐ $0.95 $0.95
Bay Pointe Apts. 1972 Excel 46 $800 ‐ $875 $838 795 ‐ 820 808 $1.01 ‐ $1.07 $1.04
Wayzata Woods 1965 Wayz 51 $890 ‐ $910 $900 1,035 ‐ 1,035 1,035 $0.86 ‐ $0.88 $0.87
Gleason Lake 1973 Wayz 34 $1,430 ‐ $1,440 $1,435 895 ‐ 895 895 $1.60 ‐ $1.61 $1.60
Highcroft Manor 1963 Wayz 29 $895 ‐ $995 $945 1,000 ‐ 1,000 1,000 $0.90 ‐ $1.00 $0.95
Parkview Place 1970 Wayz 12 $795 ‐ $795 $795 950 ‐ 950 950 $0.84 ‐ $0.84 $0.84
Wayzata Lake 1947 Wayz 32 $850 ‐ $895 $873 800 ‐ 1,130 965 $1.06 ‐ $0.79 $0.90
Highland Apartments 1965 Wayz 6 $795 ‐ $825 $810 900 ‐ 950 925 $0.88 ‐ $0.87 $0.88
Wayzata Terrace 1965 Wayz 18 $750 ‐ $850 $800 1,000 ‐ 1,100 1,050 $0.75 ‐ $0.77 $0.76
Glenbrook Apartments 1970 Wayz 5 $975 ‐ $1,010 $993 1,000 ‐ 1,000 1,000 $0.98 ‐ $1.01 $0.99
695 $629 ‐ $1,440 $893 725 ‐ 1,180 958 $0.81 ‐ $1.15 $0.93
The Mist 2005 Spring 42 $1,800 ‐ $3,500 $2,650 1,637 ‐ 1,999 1,818 $1.10 ‐ $1.75 $1.46
Bayview 1971 Spring 11 $1,100 ‐ $1,100 $1,100 1,550 ‐ 1,550 1,550 $0.71 ‐ $0.71 $0.71
Wayzata Woods 1965 Wayz 6 $1,250 ‐ $1,300 $1,275 1,350 ‐ 1,350 1,350 $0.93 ‐ $0.96 $0.94
Gleason Lake 1973 Wayz 5 $1,635 ‐ $1,690 $1,663 1,350 ‐ 1,350 1,350 $1.21 ‐ $1.25 $1.23
22 $1,250 ‐ $1,690 $1,276 1,350 ‐ 1,350 1,450 $0.93 ‐ $1.25 $0.88
The Mist 2005 Spring 12 $2,300 ‐ $4,000 $3,150 1,750 ‐ 2,978 2,364 $1.31 ‐ $1.34 $1.33
Sources: Marquette Advisors; Maxfield Research, Inc.
TABLE 11 (cont.)
UNIT MIX, SIZES, AND MONTHLY RENTS
April 2013
Monthly Rent Unit Size (Sq. Ft.) Rent per Sq. Footage
MOUND MARKET AREA
TWO‐BEDROOM UNITS
TWO‐BEDROOM‐PLUS‐DEN AND THREE‐BEDROOM UNITS
MARKET RATE RENTAL DEVELOPMENTS
Range Range Range
Vacancy Rates Table 12 shows vacancies for the market rate rental properties surveyed in the Housing Market Area. The table identifies a total of 36 units as vacant among the properties for an overall va‐cancy rate of 2.2%, significantly below the 5% level considered to be market equilibrium. The market equilibrium rate of 5% is a level that allows for balanced market conditions where there is sufficient consumer choice and adequate turnover. Levels below 5% indicate that pent‐up demand exists for additional rental units in the market.
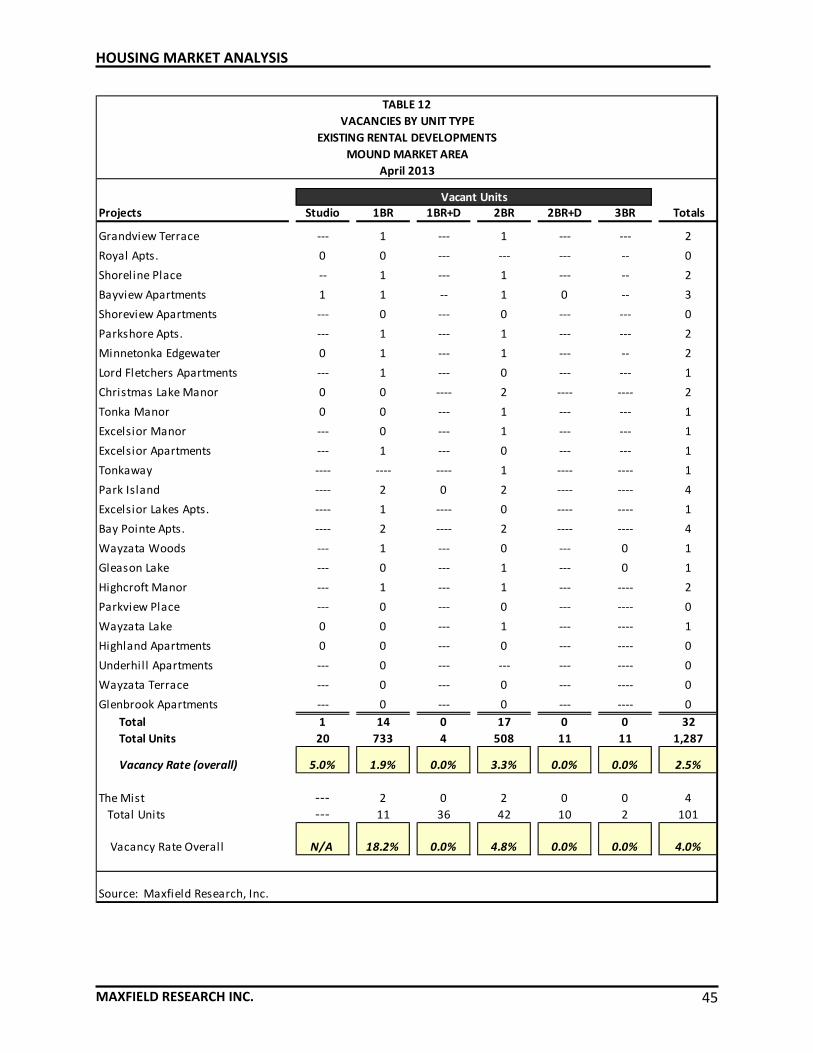
HOUSING MARKET ANALYSIS
MAXFIELD RESEARCH INC. 45
Projects Studio 1BR 1BR+D 2BR 2BR+D 3BR Totals
Grandview Terrace ‐‐‐ 1 ‐‐‐ 1 ‐‐‐ ‐‐‐ 2
Royal Apts. 0 0 ‐‐‐ ‐‐‐ ‐‐‐ ‐‐ 0
Shoreline Place ‐‐ 1 ‐‐‐ 1 ‐‐‐ ‐‐ 2
Bayview Apartments 1 1 ‐‐ 1 0 ‐‐ 3
Shoreview Apartments ‐‐‐ 0 ‐‐‐ 0 ‐‐‐ ‐‐‐ 0
Parkshore Apts. ‐‐‐ 1 ‐‐‐ 1 ‐‐‐ ‐‐‐ 2
Minnetonka Edgewater 0 1 ‐‐‐ 1 ‐‐‐ ‐‐ 2
Lord Fletchers Apartments ‐‐‐ 1 ‐‐‐ 0 ‐‐‐ ‐‐‐ 1
Christmas Lake Manor 0 0 ‐‐‐‐ 2 ‐‐‐‐ ‐‐‐‐ 2
Tonka Manor 0 0 ‐‐‐ 1 ‐‐‐ ‐‐‐ 1
Excelsior Manor ‐‐‐ 0 ‐‐‐ 1 ‐‐‐ ‐‐‐ 1
Excelsior Apartments ‐‐‐ 1 ‐‐‐ 0 ‐‐‐ ‐‐‐ 1
Tonkaway ‐‐‐‐ ‐‐‐‐ ‐‐‐‐ 1 ‐‐‐‐ ‐‐‐‐ 1
Park Island ‐‐‐‐ 2 0 2 ‐‐‐‐ ‐‐‐‐ 4
Excelsior Lakes Apts. ‐‐‐‐ 1 ‐‐‐‐ 0 ‐‐‐‐ ‐‐‐‐ 1
Bay Pointe Apts. ‐‐‐‐ 2 ‐‐‐‐ 2 ‐‐‐‐ ‐‐‐‐ 4
Wayzata Woods ‐‐‐ 1 ‐‐‐ 0 ‐‐‐ 0 1
Gleason Lake ‐‐‐ 0 ‐‐‐ 1 ‐‐‐ 0 1
Highcroft Manor ‐‐‐ 1 ‐‐‐ 1 ‐‐‐ ‐‐‐‐ 2
Parkview Place ‐‐‐ 0 ‐‐‐ 0 ‐‐‐ ‐‐‐‐ 0
Wayzata Lake 0 0 ‐‐‐ 1 ‐‐‐ ‐‐‐‐ 1
Highland Apartments 0 0 ‐‐‐ 0 ‐‐‐ ‐‐‐‐ 0
Underhill Apartments ‐‐‐ 0 ‐‐‐ ‐‐‐ ‐‐‐ ‐‐‐‐ 0
Wayzata Terrace ‐‐‐ 0 ‐‐‐ 0 ‐‐‐ ‐‐‐‐ 0
Glenbrook Apartments ‐‐‐ 0 ‐‐‐ 0 ‐‐‐ ‐‐‐‐ 0
Total 1 14 0 17 0 0 32
Total Units 20 733 4 508 11 11 1,287
Vacancy Rate (overall) 5.0% 1.9% 0.0% 3.3% 0.0% 0.0% 2.5%
The Mist ‐‐‐ 2 0 2 0 0 4
Total Units ‐‐‐ 11 36 42 10 2 101
Vacancy Rate Overall N/A 18.2% 0.0% 4.8% 0.0% 0.0% 4.0%
Source: Maxfield Research, Inc.
TABLE 12
VACANCIES BY UNIT TYPE
April 2013
EXISTING RENTAL DEVELOPMENTS
MOUND MARKET AREA
Vacant Units

HOUSING MARKET ANALYSIS
MAXFIELD RESEARCH INC. 46
Pending Rental Developments The following is a list of general‐occupancy rental projects in the planning process or under construction in the Market Area. This information was gathered through interviews with City officials in each of the Market Area communities and with project developers.
Currently, a local real estate developer is considering the development of market rate rental units on a site located in Downtown Wayzata. The project is in the conceptual planning stages and no formal proposal has been made to the City. The property would feature a high level of amenities with views of Lake Minnetonka from some of the units. Total project size is expected to range from about 80 to 150 units.
For‐Sale Housing Market Situation Introduction This section provides an overview of the for‐sale housing market situation in the Housing Mar‐ket Area. Included are an evaluation of single‐family and multifamily home resales and an overview of active developments and an inventory of pending developments. Maxfield Re‐search analyzed housing resale data for the Market Area communities from the Regional Multi‐ple Listing Service (MLS) for the years 2009 through May 2013. Single‐Family Home Resales Tables 13 and 14 show home resale activity for non‐lakefront and lakefront homes in the Hous‐ing Market Area from 2009 through May 2013. Despite a little less than a half year for 2013, sales have increased proportionally in 2013. Mound, especially, has experienced considerable market activity in single‐family home sales during this period. Although Mound continues to perform well within the overall Housing Market Area, the lower price of homes, on average, in Mound is definitely attracting buyers to the community.
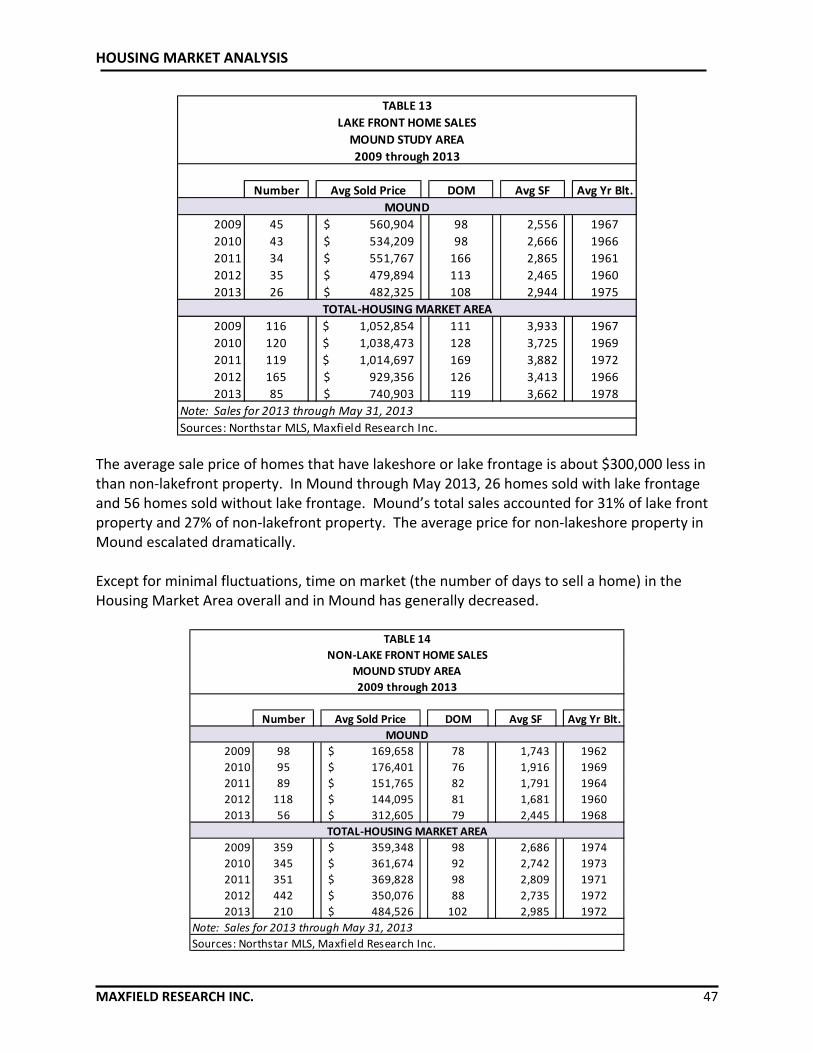
HOUSING MARKET ANALYSIS
MAXFIELD RESEARCH INC. 47
Number Avg Sold Price DOM Avg SF Avg Yr Blt.
2009 45 560,904$ 98 2,556 1967
2010 43 534,209$ 98 2,666 1966
2011 34 551,767$ 166 2,865 1961
2012 35 479,894$ 113 2,465 1960
2013 26 482,325$ 108 2,944 1975
2009 116 1,052,854$ 111 3,933 1967
2010 120 1,038,473$ 128 3,725 1969
2011 119 1,014,697$ 169 3,882 1972
2012 165 929,356$ 126 3,413 1966
2013 85 740,903$ 119 3,662 1978
Note: Sales for 2013 through May 31, 2013
Sources: Northstar MLS, Maxfield Research Inc.
TABLE 13
LAKE FRONT HOME SALES
MOUND STUDY AREA
2009 through 2013
MOUND
TOTAL‐HOUSING MARKET AREA
The average sale price of homes that have lakeshore or lake frontage is about $300,000 less in than non‐lakefront property. In Mound through May 2013, 26 homes sold with lake frontage and 56 homes sold without lake frontage. Mound’s total sales accounted for 31% of lake front property and 27% of non‐lakefront property. The average price for non‐lakeshore property in Mound escalated dramatically. Except for minimal fluctuations, time on market (the number of days to sell a home) in the Housing Market Area overall and in Mound has generally decreased.
Number Avg Sold Price DOM Avg SF Avg Yr Blt.
2009 98 169,658$ 78 1,743 1962
2010 95 176,401$ 76 1,916 1969
2011 89 151,765$ 82 1,791 1964
2012 118 144,095$ 81 1,681 1960
2013 56 312,605$ 79 2,445 1968
2009 359 359,348$ 98 2,686 1974
2010 345 361,674$ 92 2,742 1973
2011 351 369,828$ 98 2,809 1971
2012 442 350,076$ 88 2,735 1972
2013 210 484,526$ 102 2,985 1972
Note: Sales for 2013 through May 31, 2013
Sources: Northstar MLS, Maxfield Research Inc.
TABLE 14
NON‐LAKE FRONT HOME SALES
MOUND STUDY AREA
2009 through 2013
MOUND
TOTAL‐HOUSING MARKET AREA

HOUSING MARKET ANALYSIS
MAXFIELD RESEARCH INC. 48
Multifamily Resales Tables 15 and 16 present summary data for multifamily housing units in the Housing Market Area from 2009 through May 2013. The tables are separated between developments that have lake frontage and those that do not. The tables show the number of units sold each year, the median sale price, and average number of days on the market according to the Regional Multi‐ple Listing Service (MLS).
Resale data is shown for Mound, Orono, Excelsior, Shorewood, Tonka Bay, Spring Park, and St. Bonifacius.
The table shows lakefront sales and non‐lakefront multifamily home sales. Overall, the av‐erage median sale price of for‐sale multifamily units in the Housing Market Area over the period 2009 through May 2013 was $343,605. The average time on market was 100 days and the average year built was 1986. As shown on the table, the average price of lakefront units sold in Mound during the period was $219,622, lower than all other communities listed on the table. However, the average size of units was also the smallest.
The average square feet of multifamily units sold in the Housing Market Area is nearly the same average as that for single‐family homes. This suggests that households that are “rightsizing” in this area tend to prefer a unit size that is only modestly less than their exist‐ing single‐family home.
Number Avg Sold Price DOM Avg SF Avg Yr Blt.
Excelsior 12 418,041$ 108 1,506 1977
Mound 57 219,622$ 138 1,566 1979
Orono 3 380,167$ 66 2,485 1989
Shorewood 16 369,222$ 72 3,041 1985
Spring Park 39 310,576$ 158 1,755 1998
Tonka Bay 5 364,000$ 58 2,330 1986
Total 132 343,605$ 100 2,114 1986
Note: Sales for 2013 through May 31, 2013
Sources: Northstar MLS, Maxfield Research Inc.
TABLE 15
LAKEFRONT MULTIFAMILY HOME SALES
MOUND STUDY AREA
2009 through 2013
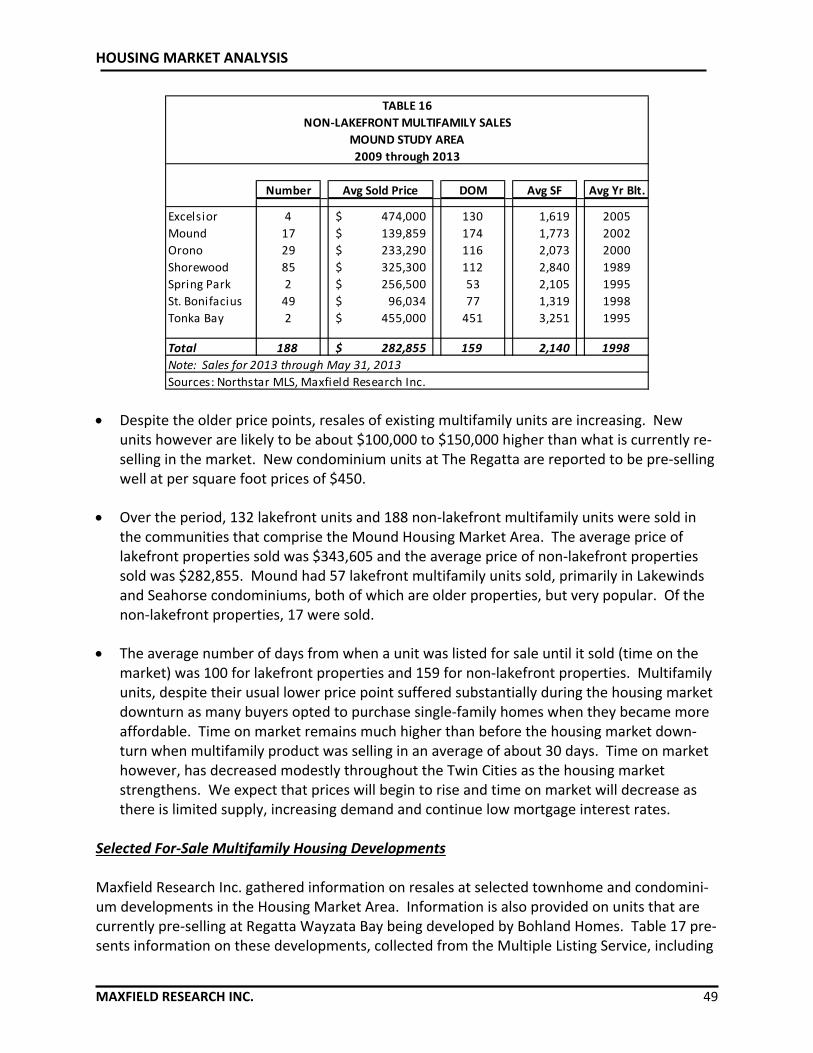
HOUSING MARKET ANALYSIS
MAXFIELD RESEARCH INC. 49
Number Avg Sold Price DOM Avg SF Avg Yr Blt.
Excelsior 4 474,000$ 130 1,619 2005
Mound 17 139,859$ 174 1,773 2002
Orono 29 233,290$ 116 2,073 2000
Shorewood 85 325,300$ 112 2,840 1989
Spring Park 2 256,500$ 53 2,105 1995
St. Bonifacius 49 96,034$ 77 1,319 1998
Tonka Bay 2 455,000$ 451 3,251 1995
Total 188 282,855$ 159 2,140 1998
Note: Sales for 2013 through May 31, 2013
Sources: Northstar MLS, Maxfield Research Inc.
TABLE 16
NON‐LAKEFRONT MULTIFAMILY SALES
MOUND STUDY AREA
2009 through 2013
Despite the older price points, resales of existing multifamily units are increasing. New units however are likely to be about $100,000 to $150,000 higher than what is currently re‐selling in the market. New condominium units at The Regatta are reported to be pre‐selling well at per square foot prices of $450.
Over the period, 132 lakefront units and 188 non‐lakefront multifamily units were sold in
the communities that comprise the Mound Housing Market Area. The average price of lakefront properties sold was $343,605 and the average price of non‐lakefront properties sold was $282,855. Mound had 57 lakefront multifamily units sold, primarily in Lakewinds and Seahorse condominiums, both of which are older properties, but very popular. Of the non‐lakefront properties, 17 were sold.
The average number of days from when a unit was listed for sale until it sold (time on the
market) was 100 for lakefront properties and 159 for non‐lakefront properties. Multifamily units, despite their usual lower price point suffered substantially during the housing market downturn as many buyers opted to purchase single‐family homes when they became more affordable. Time on market remains much higher than before the housing market down‐turn when multifamily product was selling in an average of about 30 days. Time on market however, has decreased modestly throughout the Twin Cities as the housing market strengthens. We expect that prices will begin to rise and time on market will decrease as there is limited supply, increasing demand and continue low mortgage interest rates.
Selected For‐Sale Multifamily Housing Developments Maxfield Research Inc. gathered information on resales at selected townhome and condomini‐um developments in the Housing Market Area. Information is also provided on units that are currently pre‐selling at Regatta Wayzata Bay being developed by Bohland Homes. Table 17 pre‐sents information on these developments, collected from the Multiple Listing Service, including
HOUSING MARKET ANALYSIS
MAXFIELD RESEARCH INC. 50
the date the development opened, the number of units available, average unit size, average sales price, and average market time.
Of the six projects inventoried, three are upper‐end product (St. Albans Bay Villa, Willough‐by and Windpoint Villas) and three are entry‐level to move‐up product. Prices for the up‐per‐end product range from the low $400,000s for two‐bedroom units up to over $1 mil‐lion. The entry‐level to move‐up products have prices that range from $150,000 for one‐bedroom units to $290,000 for two‐bedroom units.
Overall, properties that have water views or are close to the water and are newer have prices that range from about $250,000 to $500,000. If units are to be located in the Mound Harbor Renaissance District, most units should be priced generally within these guidelines with units that have the best views priced at a premium. Units that face the water should be move‐up or units that would be purchased primarily by those seeking an alternative to a single‐family home. Entry‐level units would need to have a higher density to support a low‐er price point and could be situated off the lake.
Per square foot price points for entry level units (not on the lake) would range from about $120 to $150 per square foot. Per square foot price points for move‐up units would range from about $200 to $250 per square foot.
The number of multifamily units sold has generally been less than the number of single‐family sales. During the housing market downturn, a portion of the market that was inter‐ested in multifamily housing because of its greater affordability turned back to single‐family homes because of greater pricing stability and greater affordability after the home price de‐flation. Home mortgage interest rates have decreased further making single‐family homes more affordable and more accessible to homebuyers. We continue however to see that multifamily units generally offer buyers greater lifestyle flexibility.
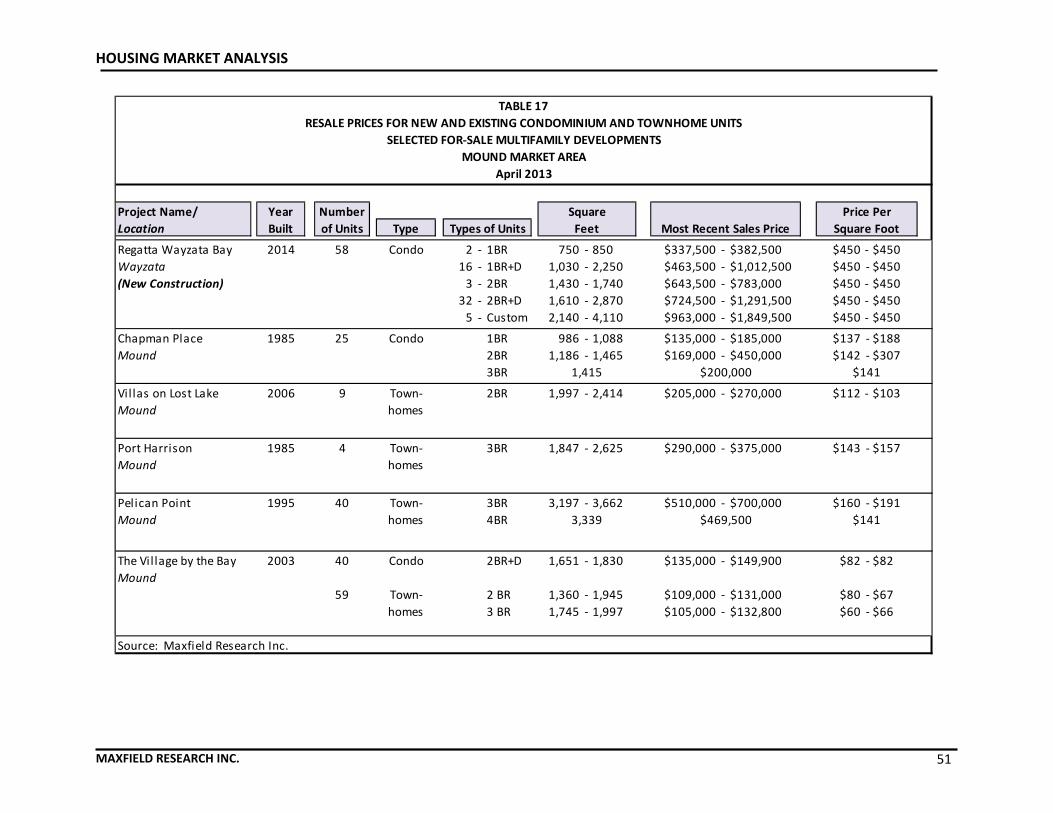
HOUSING MARKET ANALYSIS
MAXFIELD RESEARCH INC. 51
Project Name/ Year Number
Location Built of Units Type
Regatta Wayzata Bay 2014 58 Condo 2 ‐ 1BR 750 ‐ 850 $337,500 ‐ $382,500 $450 ‐ $450
Wayzata 16 ‐ 1BR+D 1,030 ‐ 2,250 $463,500 ‐ $1,012,500 $450 ‐ $450
(New Construction) 3 ‐ 2BR 1,430 ‐ 1,740 $643,500 ‐ $783,000 $450 ‐ $450
32 ‐ 2BR+D 1,610 ‐ 2,870 $724,500 ‐ $1,291,500 $450 ‐ $450
5 ‐ Custom 2,140 ‐ 4,110 $963,000 ‐ $1,849,500 $450 ‐ $450
Chapman Place 1985 25 Condo 1BR 986 ‐ 1,088 $135,000 ‐ $185,000 $137 ‐ $188
Mound 2BR 1,186 ‐ 1,465 $169,000 ‐ $450,000 $142 ‐ $307
3BR
Villas on Lost Lake 2006 9 Town‐ 2BR 1,997 ‐ 2,414 $205,000 ‐ $270,000 $112 ‐ $103
Mound homes
Port Harrison 1985 4 Town‐ 3BR 1,847 ‐ 2,625 $290,000 ‐ $375,000 $143 ‐ $157
Mound homes
Pelican Point 1995 40 Town‐ 3BR 3,197 ‐ 3,662 $510,000 ‐ $700,000 $160 ‐ $191
Mound homes 4BR
The Village by the Bay 2003 40 Condo 2BR+D 1,651 ‐ 1,830 $135,000 ‐ $149,900 $82 ‐ $82
Mound
59 Town‐ 2 BR 1,360 ‐ 1,945 $109,000 ‐ $131,000 $80 ‐ $67
homes 3 BR 1,745 ‐ 1,997 $105,000 ‐ $132,800 $60 ‐ $66
Source: Maxfield Research Inc.
1,415 $200,000 $141
Types of Units Feet Most Recent Sales Price Square Foot
3,339 $469,500 $141
April 2013
Square Price Per
TABLE 17
RESALE PRICES FOR NEW AND EXISTING CONDOMINIUM AND TOWNHOME UNITS
SELECTED FOR‐SALE MULTIFAMILY DEVELOPMENTS
MOUND MARKET AREA
HOUSING MARKET ANALYSIS
MAXFIELD RESEARCH INC. 52
Most empty nesters have a strong preference for one‐level units or units with elevator ac‐cess. Many are moving from single‐family homes and want to eliminate stairs. Some younger buyers are interested in one‐level units, but most prefer two‐level floor plans. One‐level townhomes marketed toward empty‐nesters typically command a much higher price than two‐story townhomes marketed towards younger households or condominium projects.
Older buyers are especially attracted to association‐maintained townhomes when they are no longer able to or desire to maintain a yard and the exterior of their single‐family homes. Many young to middle age buyers are also opting for townhomes for the same reason. Many buyers simply do not have time to maintain a single‐family home due to their career or other reasons.
Pending For‐Sale Developments
Regatta Wayzata Bay is proposed to have 58 units and will be located above retail shops in the new Wayzata Bay development in Downtown Wayzata. Unit types available in‐clude one‐bedroom, one‐bedroom plus den, two‐bedroom, two‐bedroom plus den and a few custom units. Unit sizes range from 750 square feet for a one‐bedroom unit to 4,110 square feet for a custom penthouse. Pricing averages $450 per square foot. The builder is Bohland Homes. Presales are currently underway.
Mark Saliterman is planning to develop 16 townhomes in Mound Harbor Renaissance District, finishing out the Lost Lake Villas development. Units will face the Lost Lake Channel and will be similar to the existing townhomes that are built and occupied. The townhomes are expected to sell for between $350,000 to $450,000 each and the devel‐oper has already had interest from potential buyers for some of the units. Each unit will be provided with a private dock. A summer construction start is planned for the initial units.

HOUSING MARKET ANALYSIS
MAXFIELD RESEARCH INC. 53
Independent Senior Housing Analysis Types of Senior Housing For analytical proposes, Maxfield Research Inc. classifies senior projects into four categories based on the level and type of services offered: Adult/Few‐Services projects are similar to a general occupancy apartment or condominium building, in that they offer virtually no services but have age‐restrictions (typically 55+ or older). Organized activities and transportation are usually all that are available at these projects. Be‐cause of the lack of services, adult/few‐services projects typically do not command the rent premiums typical of more service‐intensive senior housing.
Congregate projects (or independent living with services available) offer seniors support ser‐vices such as meals and/or housekeeping, either optional or included in the monthly fee. These projects typically dedicate a larger share of the overall building area to common areas to ac‐commodate for the smaller units and to encourage socialization. Congregate projects attract a slightly older target market than adult housing, typically seniors age 75+. Rents are above those of the adult/few‐services buildings, even at the exclusion of services, because of the availability of services. Sponsorship by a nursing home, hospital, or other health care organiza‐tion is common. Assisted Living facilities come in a variety of forms, but the target market for most is very frail seniors, generally age 80 or older who are in need of extensive support services. Absent an as‐sisted living option, these seniors may otherwise need to move to a nursing facility. At a mini‐mum, assisted living projects include two meals per day and weekly housekeeping in the monthly fee, with the availability of a third meal and personal care (either included in the monthly fee or available for additional cost in tiered service packages or a‐la‐carte). Assisted living facilities also have either staff on duty 24 hours per day or 24‐hour emergency response.
Some assisted living facilities offer self‐contained dwelling units similar to a regular senior apartment with full kitchens and spacious rooms. Projects offering kitchens in the units may in‐clude only two meals per day while those without kitchens in the units generally provide three. Other projects do not have kitchens and are merely updated versions of board‐and‐care facili‐ties with sleeping units and communal living spaces. Monthly fees vary depending on the number and type of services included and the size of the units, but most facilities have fees starting at roughly $2,800 per month. Because of the high cost of care, many facilities accept financial assistance through Elderly Waivers or other finan‐cial assistance programs. Memory Care facilities are designed specifically for seniors suffering from Alzheimer’s or other dementias. Projects will consist mostly of suite‐style or studio apartment units and allocate large communal areas for activities and programming.

HOUSING MARKET ANALYSIS
MAXFIELD RESEARCH INC. 54
In addition, staff personnel typically undergo specialized training in the care of this population. Because of the greater amount of individualized care required, staffing ratios are much higher than traditional assisted living. The costs of care are also higher. Monthly fees for memory care units typically start at about $4,500 per month. Unlike conventional assisted living, however, which deals almost exclusively with widows or widowers, a higher proportion of people afflicted with Alzheimer’s are in two‐person house‐holds. Therefore, the decision to move a spouse into a memory care facility involves the care‐giver’s concern of incurring the costs of health care at a special facility while continuing to maintain their home.
Townhome or
Apartment
FIGURE 1
Single‐Family
Home
CONTINUUM OF HOUSING AND SERVICES FOR SENIORS
Age‐Restricted Independent Single‐
Family or Townhomes or Apartments or
Condominiums or Cooperatives
Congregate Apartments w/
Optional Services
Congregate Apartments w/
Intensive Services
Assisted Living
Memory Care
(Alzheimer's Units)
Nursing Facilities
Fully or Highly
Dependent on Care
Senior Housing Product Type
Fully
Independent
Lifestyle
Source: Maxfield Research Inc.
Today’s senior housing products form a continuum of care from a purely residential level to in‐tensive medical care. Often the services offered at these projects overlap with one another and make these definitions somewhat ambiguous. In general, however, distinctions in cliental are made within each type of facility. Adult/few‐services projects tend to attract younger, independent, and active seniors; congre‐gate projects serve independent seniors who desire support services (i.e., meals, housekeeping, transportation, etc.); and assisted living projects tend to attract older, more frail seniors who need assistance with daily activities but do not need the intensive medical care provided by a skilled care facility. The senior housing products offered today form a continuum of care (see above), from a low level of care to fairly intensive care; often, the service offerings of one type overlap with those of another. In general, however Adult/Few Services projects tend to attract younger, more in‐dependent seniors, while assisted living and memory care projects tend to attract older, frailer seniors.
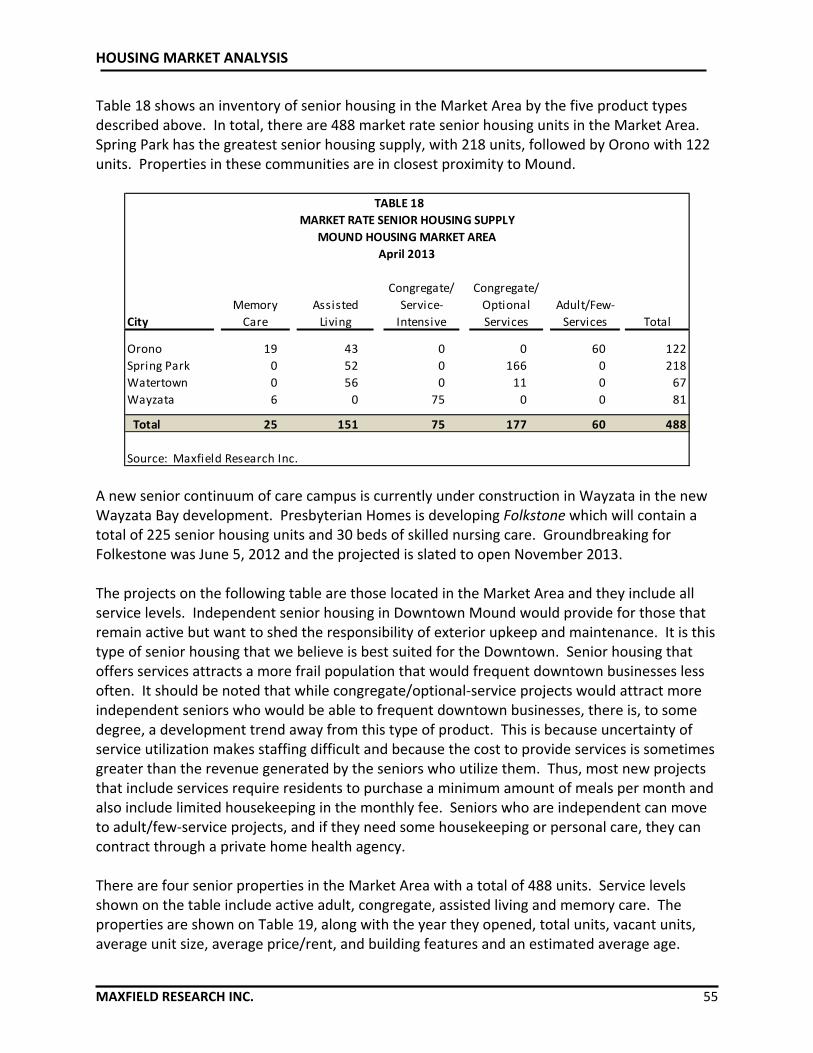
HOUSING MARKET ANALYSIS
MAXFIELD RESEARCH INC. 55
Table 18 shows an inventory of senior housing in the Market Area by the five product types described above. In total, there are 488 market rate senior housing units in the Market Area. Spring Park has the greatest senior housing supply, with 218 units, followed by Orono with 122 units. Properties in these communities are in closest proximity to Mound.
City Total
Orono 19 43 0 0 60 122
Spring Park 0 52 0 166 0 218
Watertown 0 56 0 11 0 67
Wayzata 6 0 75 0 0 81
Total 25 151 75 177 60 488
Source: Maxfield Research Inc.
TABLE 18
MARKET RATE SENIOR HOUSING SUPPLY
MOUND HOUSING MARKET AREA
April 2013
Congregate/ Congregate/
Memory Assisted Service‐ Optional Adult/Few‐
Care Living Intensive Services Services
A new senior continuum of care campus is currently under construction in Wayzata in the new Wayzata Bay development. Presbyterian Homes is developing Folkstone which will contain a total of 225 senior housing units and 30 beds of skilled nursing care. Groundbreaking for Folkestone was June 5, 2012 and the projected is slated to open November 2013. The projects on the following table are those located in the Market Area and they include all service levels. Independent senior housing in Downtown Mound would provide for those that remain active but want to shed the responsibility of exterior upkeep and maintenance. It is this type of senior housing that we believe is best suited for the Downtown. Senior housing that offers services attracts a more frail population that would frequent downtown businesses less often. It should be noted that while congregate/optional‐service projects would attract more independent seniors who would be able to frequent downtown businesses, there is, to some degree, a development trend away from this type of product. This is because uncertainty of service utilization makes staffing difficult and because the cost to provide services is sometimes greater than the revenue generated by the seniors who utilize them. Thus, most new projects that include services require residents to purchase a minimum amount of meals per month and also include limited housekeeping in the monthly fee. Seniors who are independent can move to adult/few‐service projects, and if they need some housekeeping or personal care, they can contract through a private home health agency. There are four senior properties in the Market Area with a total of 488 units. Service levels shown on the table include active adult, congregate, assisted living and memory care. The properties are shown on Table 19, along with the year they opened, total units, vacant units, average unit size, average price/rent, and building features and an estimated average age.

HOUSING MARKET ANALYSIS
MAXFIELD RESEARCH INC. 56
Year Total Avg. Avg. Building features/
Project/Location Opened Units Vacant Size Price/Rent Resident Avg. Age
Orono Woods 10/2002 60 25 15 ‐ 1BR 725 $990
Orono 22 ‐ 1BR/D 925 $1,150
15 ‐ 2BR 1,013 $1,318
10 ‐ 2BR/D 1,200 $1,578
Elim Meadows 6/1989 11 0 5 ‐ 1BR 685 $840
Watertown 6 ‐ 2BR 810 $955
The Court 11/1988 92 0 8 ‐ 0 BR 445 $750
Spring Park 54 ‐ 1BR 541 $103
30 ‐ 2 BR 793 $1,805
Avg. age = 82
The Villa 10/1996 65 0 6 ‐ 0 BR 480 $650
Spring Park 46 ‐ 1 BR 664 $950
13 ‐ 2BR 944 $1,350
Avg. age = 85
The Chateau 5/2012 52 0 ‐ 0 BR 470 $3,050
Spring Park ‐ 1 BR 595 $3,250
‐ 2 BR 900 $3,850
Orono Trails 10/2011 43 2 13 ‐ 0 BR 356 $3,025
Orono 30 ‐ 1 BR 631 $3,450
The Arbor 5/2012 20 1 12 ‐ 0 BR 470 $4,800
Spring Park 8 ‐ 1 BR 570 $5,500
Orono Trails 10/2011 19 0 19 ‐ 0BR 356 $5,300
Orono
Source: Maxfield Research Inc.
0.0%
Library, dining, theater, salon,
lounge, outdoor patio, firepit, club
room; avg. age=82
Library, dining, theater, salon,
lounge, outdoor patio, firepit, club
room; avg. age=82
0.0%
New Town Center with dining,
chapel, salon, community room,
l ibrary, bill iards, resident garden,
computer lab, Wings Wellness Ctr.
Avg. age 85
New Town Center with dining,
chapel, salon, community room,
l ibrary, bill iards, resident garden,
computer lab, Wings Wellness Ctr.
Avg. age 82
4.7%
5.0%
TABLE 19
SENIOR HOUSING DEVELOPMENTS
IN & NEAR THE MOUND MARKET AREA
April 2013
Unit‐Mix
Community room, card room,
l ibrary, underground parking for
$50/mo.; avg. age ‐ 75
Community room, craft/hobby
room, dining, salon.; average
age=85
41.7%
0.0%
CONGREGATE
New Town Center with dining,
chapel, salon, community room,
l ibrary, bill iards, resident garden,
computer lab, Wings Wellness Ctr.
0.0%
ACTIVE ADULT
ASSISTED LIVING
MEMORY CARE
New Town Center with dining,
chapel, salon, community room,
l ibrary, bill iards, resident garden,
computer lab, Wings Wellness Ctr.
0.0%
HOUSING MARKET ANALYSIS
MAXFIELD RESEARCH INC. 57
The following are key points about the projects in Table 19.
There are limited vacancies among the properties listed on the table, signaling strong de‐mand for senior housing in the area. Orono Trails opened only just a couple of years ago to serve frail seniors and offers assisted living and memory care. Presbyterian Homes and Ser‐vices recently completed a large scale renovation of the Lake Minnetonka Shores campus in Spring Park and last year opened a memory care wing.
Despite being marketed to active adults, most elevator‐style buildings targeted to seniors attract seniors age 70 years or older. It is not unusual to see independent seniors residing in a building with an average age of 82. A number of seniors prefer to rent so they are free to travel to the Sunbelt or up north to a lake home or cabin.
Orono Woods in Orono is the only adult few services development in the Market Area. The others range from a limited service component to extensive services that are provided in memory care facilities. The property includes a community room, card room, and library, it does not offer meals or other services and residents must be independent.
Pending Senior Developments
Within the Housing Market Area As mentioned in the section, Presbyterian Homes is currently developing Folkestone, a full con‐tinuum of care senior living community in Downtown Wayzata at the Promenade of Wayzata. Folkestone – Phase I will feature 148 units of independent living, 58 units of assisted living, and 18 units of memory care. There will also be the addition of an amenities center that will incor‐porate dining areas, a conservatory, a theater, library, chapel and wellness center with swim‐ming pool, spa and other amenities and services. Folkestone is expected to open November 2013. Outside of the Housing Market Area Church of St. Therese in Deephaven is also planning to develop senior housing on property that is adjacent to the Church. A total of 78 units is planned and will include independent living, as‐sisted living and memory care. Financing is being arranged at this time and a fall construction start is contemplated.
HOUSING MARKET ANALYSIS
MAXFIELD RESEARCH INC. 58
Multifamily Housing Demand Table 20 presents housing demand calculations for the Market Area between 2010 and 2020 and the estimated number of units supportable in Downtown Mound during this period. The following bullet points summarize our demand calculations.
According to projections, the Market Area is expected to grow by an estimated 653 house‐holds between 2010 and 2020. Based on homeownership trends, an estimated 70% of the demand this decade will be for for‐sale housing, resulting in demand for 457 for‐sale units and 196 rental units. Since much of the Market Area is zoned only for single‐family devel‐opment, an estimated 40% of for‐sale demand will be for multifamily units – resulting in overall demand for 183 for‐sale multifamily units. It is estimated that all of the demand for rental housing will be multifamily units, or 196 rental units. We further adjust these figures to account for the portion of demand that would be market rate (80% for for‐sale and 60% for rental).
The demand figures in Table 20 are for the entire Market Area, and no one community would be able to capture all of the demand. We estimate that Downtown Mound could capture 35% to 40% of the for‐sale multifamily demand (51 to 59 units) and 45% to 50% of the rental demand (53 to 59 units). In addition to demand from the Market Area, there would be some demand from outside of the Market Area. This would come from people who would move to Mound for a specific project or because of a lack of other options out‐side the Market Area. We project that 35% of the demand would come from outside of the Market Area, increasing total demand in Downtown Mound to 79 to 90 for‐sale units and 81 to 90 market rate rental units.
Overall we project that Downtown Mound could capture 80% of the for‐sale demand and 100% of the rental demand in Mound this decade. Overall, we project that Downtown Mound could support 63 to 72 for‐sale multifamily units and 81 to 90 rental units.
As with some of the for‐sale housing, new rental housing in the Downtown should be multi‐story buildings. The greater number of units attainable in a multi‐story building would max‐imize the impact on Downtown retail.
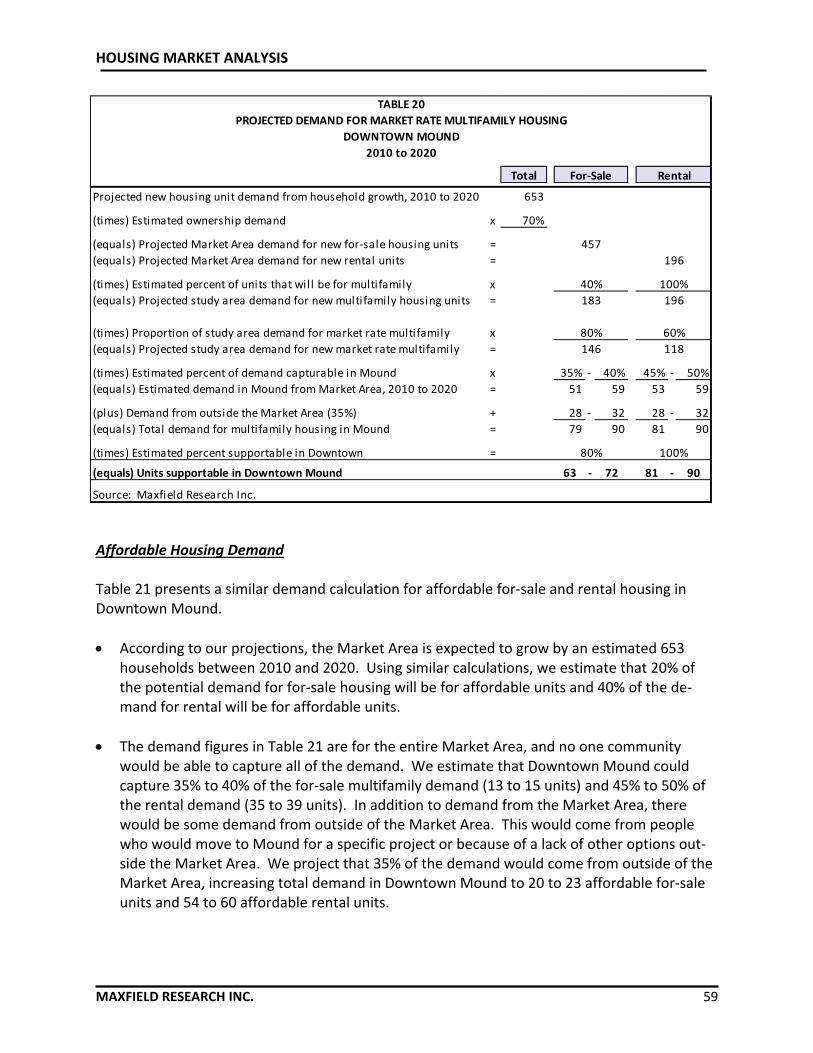
HOUSING MARKET ANALYSIS
MAXFIELD RESEARCH INC. 59
Total
Projected new housing unit demand from household growth, 2010 to 2020 653
(times) Estimated ownership demand x 70%
(equals) Projected Market Area demand for new for‐sale housing units =
(equals) Projected Market Area demand for new rental units =
(times) Estimated percent of units that will be for multifamily x
(equals) Projected study area demand for new multifamily housing units =
(times) Proportion of study area demand for market rate multifamily x
(equals) Projected study area demand for new market rate multifamily =
(times) Estimated percent of demand capturable in Mound x 35% ‐ 40% 45% ‐ 50%
(equals) Estimated demand in Mound from Market Area, 2010 to 2020 = 51 59 53 59
(plus) Demand from outside the Market Area (35%) + 28 ‐ 32 28 ‐ 32
(equals) Total demand for multifamily housing in Mound = 79 90 81 90
(times) Estimated percent supportable in Downtown =
(equals) Units supportable in Downtown Mound 63 ‐ 72 81 ‐ 90
Source: Maxfield Research Inc.
80% 100%
80% 60%
146 118
457
196
40% 100%
183 196
TABLE 20
PROJECTED DEMAND FOR MARKET RATE MULTIFAMILY HOUSING
DOWNTOWN MOUND
2010 to 2020
For‐Sale Rental
Affordable Housing Demand Table 21 presents a similar demand calculation for affordable for‐sale and rental housing in Downtown Mound.
According to our projections, the Market Area is expected to grow by an estimated 653 households between 2010 and 2020. Using similar calculations, we estimate that 20% of the potential demand for for‐sale housing will be for affordable units and 40% of the de‐mand for rental will be for affordable units.
The demand figures in Table 21 are for the entire Market Area, and no one community would be able to capture all of the demand. We estimate that Downtown Mound could capture 35% to 40% of the for‐sale multifamily demand (13 to 15 units) and 45% to 50% of the rental demand (35 to 39 units). In addition to demand from the Market Area, there would be some demand from outside of the Market Area. This would come from people who would move to Mound for a specific project or because of a lack of other options out‐side the Market Area. We project that 35% of the demand would come from outside of the Market Area, increasing total demand in Downtown Mound to 20 to 23 affordable for‐sale units and 54 to 60 affordable rental units.

HOUSING MARKET ANALYSIS
MAXFIELD RESEARCH INC. 60
Total
Projected new housing unit demand from household growth, 2010 to 2020 653
(times) Estimated ownership demand x 70%
(equals) Projected Market Area demand for new for‐sale housing units =
(equals) Projected Market Area demand for new rental units =
(times) Estimated percent of units that will be for multifamily x
(equals) Projected study area demand for new multifamily housing units =
(times) Proportion of study area demand for affordable multifamily x
(equals) Projected study area demand for new affordable multifamily =
(times) Estimated percent of demand capturable in Mound x 35% ‐ 40% 45% ‐ 50%
(equals) Estimated demand in Mound from Market Area, 2010 to 2020 = 13 15 35 39
(plus) Demand from outside the Market Area (35%) + 7 ‐ 8 19 ‐ 21
(equals) Total demand for multifamily housing in Mound = 20 23 54 60
(times) Estimated percent supportable in Downtown =
(equals) Units supportable in Downtown Mound 16 ‐ 18 54 ‐ 60
Source: Maxfield Research Inc.
20% 40%
37 78
80% 100%
457
196
40% 100%
183 196
TABLE 21
PROJECTED DEMAND FOR MARKET RATE MULTIFAMILY HOUSING
DOWNTOWN MOUND
2010 to 2020
For‐Sale Rental
Overall we project that Downtown Mound could capture 80% of the for‐sale demand and 100% of the rental demand in Mound this decade. Overall, we project that Downtown Mound could support 16 to 18 for‐sale multifamily units and 54 to 60 rental units.
As with some of the for‐sale housing, new rental housing in the Downtown should be multi‐story buildings. The greater number of units attainable in a multi‐story building would max‐imize the impact on Downtown retail.
Senior Housing Demand Table 22 presents demand estimates for independent senior housing in the Market Area, in‐cluding housing with and without services. We believe that senior housing without services or optional services would attract seniors who are more active and would find the convenience of being located near goods and services in a Downtown setting more appealing. Therefore, they are the target market for senior housing in Downtown. The demand figure in Table 22 is calculated based on senior households with incomes above $35,000, including those households whose incomes would rise to this level based on proceeds gained from the sale of their single‐family homes. An income of $35,000 and an allocation of 40% of that income on housing would translate to an affordable monthly cost of about $1,200 per month to start.
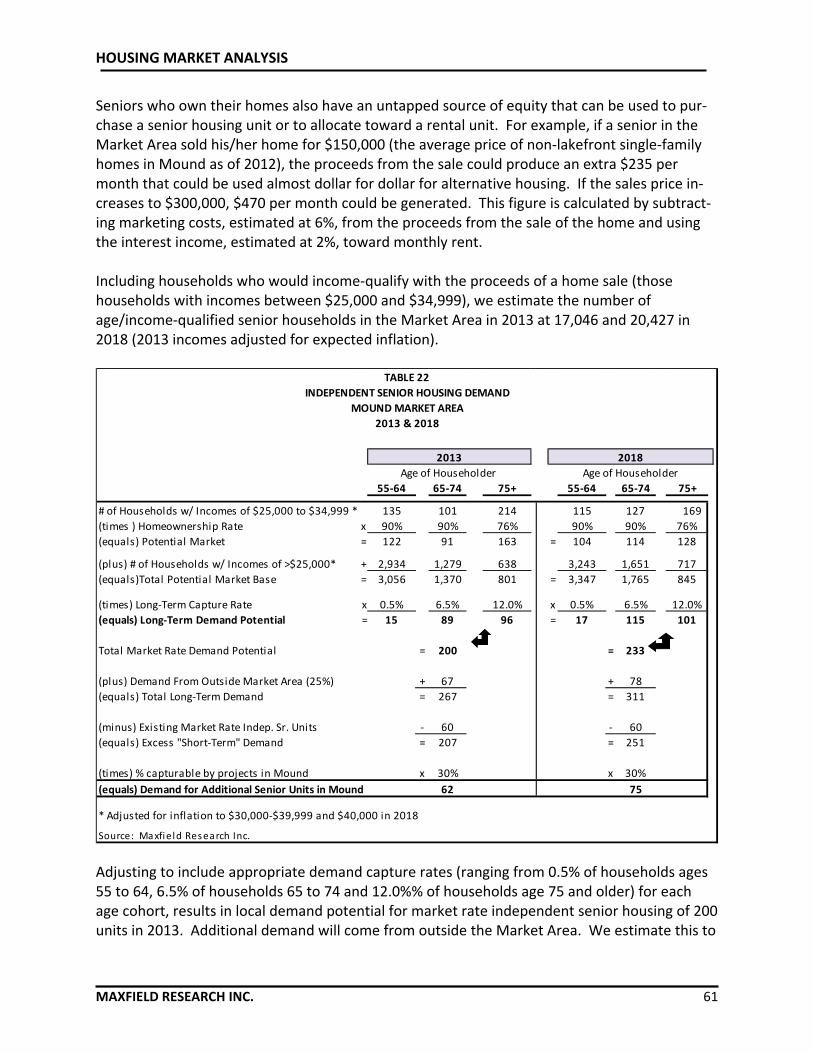
HOUSING MARKET ANALYSIS
MAXFIELD RESEARCH INC. 61
Seniors who own their homes also have an untapped source of equity that can be used to pur‐chase a senior housing unit or to allocate toward a rental unit. For example, if a senior in the Market Area sold his/her home for $150,000 (the average price of non‐lakefront single‐family homes in Mound as of 2012), the proceeds from the sale could produce an extra $235 per month that could be used almost dollar for dollar for alternative housing. If the sales price in‐creases to $300,000, $470 per month could be generated. This figure is calculated by subtract‐ing marketing costs, estimated at 6%, from the proceeds from the sale of the home and using the interest income, estimated at 2%, toward monthly rent. Including households who would income‐qualify with the proceeds of a home sale (those households with incomes between $25,000 and $34,999), we estimate the number of age/income‐qualified senior households in the Market Area in 2013 at 17,046 and 20,427 in 2018 (2013 incomes adjusted for expected inflation).
55‐64 65‐74 75+ 55‐64 65‐74 75+
# of Households w/ Incomes of $25,000 to $34,999 * 135 101 214 115 127 169
(times ) Homeownership Rate x 90% 90% 76% 90% 90% 76%
(equals) Potential Market = 122 91 163 = 104 114 128
(plus) # of Households w/ Incomes of >$25,000* + 2,934 1,279 638 3,243 1,651 717
(equals)Total Potential Market Base = 3,056 1,370 801 = 3,347 1,765 845
(times) Long‐Term Capture Rate x 0.5% 6.5% 12.0% x 0.5% 6.5% 12.0%
(equals) Long‐Term Demand Potential = 15 89 96 = 17 115 101
Total Market Rate Demand Potential = 200 = 233
(plus) Demand From Outside Market Area (25%) + 67 + 78
(equals) Total Long‐Term Demand = 267 = 311
(minus) Existing Market Rate Indep. Sr. Units ‐ 60 ‐ 60
(equals) Excess "Short‐Term" Demand = 207 = 251
(times) % capturable by projects in Mound x 30% x 30%
(equals) Demand for Additional Senior Units in Mound 62 75
* Adjusted for inflation to $30,000‐$39,999 and $40,000 in 2018
Source: Maxfield Research Inc.
2013 2018
Age of Householder Age of Householder
TABLE 22
INDEPENDENT SENIOR HOUSING DEMAND
MOUND MARKET AREA
2013 & 2018
Adjusting to include appropriate demand capture rates (ranging from 0.5% of households ages 55 to 64, 6.5% of households 65 to 74 and 12.0%% of households age 75 and older) for each age cohort, results in local demand potential for market rate independent senior housing of 200 units in 2013. Additional demand will come from outside the Market Area. We estimate this to

HOUSING MARKET ANALYSIS
MAXFIELD RESEARCH INC. 62
represent 25% of the total demand generated by Market Area seniors, or an additional 67 units in 2013. Together, the demand from Market Area seniors who would relocate to the Market Area totals 267 units in 2013. From this total, the 60 existing market rate units available in the Market Area are subtracted to calculate the excess local demand for 207 units in 2013. Applying the same demand methodol‐ogy to the projected 2018 senior household base, there is demand for 251 units of market‐rate independent senior housing in the Market Area by 2018. A project in any one location would not be able to capture 100% of the projected demand. We estimate that Downtown Mound could capture 15% of the demand in 2013, or about 62 units, increasing to about 75 units in 2018. We believe that this demand could be satisfied by either a rental or owned product (such as a senior cooperative).
Downtown Housing Conclusions and Recommendations The housing market analysis identified the following current market conditions in Mound and the surrounding areas:
Limited new multifamily product available – either rental or owned;
Low rental vacancy rates indicating pent‐up demand for new rental housing;
Increased sales activity among single‐family and multifamily units, but multifamily pric‐ing is significantly lower from the early 2000s, when many of these properties were first marketed.
Buyers are finding strong value in the existing housing market due to price deflation and continued low mortgage interest rates.
Home inventory has decreased and there is very limited inventory in some price ranges.
An increasing number of empty‐nesters are considering alternatives to their single‐family homes and many are considering townhomes or condominiums in order to re‐duce the burden of maintenance.
HOUSING MARKET ANALYSIS
MAXFIELD RESEARCH INC. 63
Downtown Mound offers many basic services within walking distance and residents located in the Downtown are more likely to do the majority of their shopping purchases at stores that they would be able to access nearby. Housing can continue to add to the potential customer base of the Downtown to the extent that it would attract households that would be most likely to spend their dollars close to home. Simply stated, strong household growth creates opportunities to increase the local population which, in turn, creates opportunities to enhance and expand the local Downtown business base. Target Markets We have identified three primary target markets for housing in Downtown Mound based on the review of demographic growth trends and current housing conditions and trends. They are:
1) Empty‐nesters and independent seniors currently living in the area or who wish to live in the area and are seeking multifamily housing as an alternative to their single‐family homes (for reasons such as rightsizing their living space, shedding home maintenance responsibili‐ties because they have second homes elsewhere or to increase time for traveling or other activities, and for seniors living alone, to increase socialization);
2) Young to mid‐age singles and couples without children who work or will work in the west Metro Area and are seeking an affordable owned housing option in the Lake Minnetonka area and/or a lifestyle choice for multifamily owned housing in a downtown environment that offers retail, restaurants, and other entertainment within walking distance from their home;
3) Singles and couples without children (including lower‐ to moderate‐income households) who are or will become employed in the west Metro Area and are seeking rental housing and also young singles who are drawn to Lake Minnetonka for lifestyle choices.
Recommended Housing Types The housing types that we believe would satisfy housing demand from the target markets and that are most appropriate in the Downtown are listed below.
For‐Sale Townhomes – For‐sale townhomes also experienced a substantial price defla‐tion during the economic recession as homebuyers largely turned to single‐family homes. Those that have held their value best are units with features and amenities at the upper end of the market, typically priced at $350,000 or higher. These units tend to be attractive to empty‐nesters and mid‐age professional singles and couples. The de‐mand calculations identified potential demand for between 63 and 72 units for the dec‐ade. The original plans for the Mound Harbor Renaissance District included a total of 55 units. Because one‐level units would appeal to empty‐nesters, who are a prime market

HOUSING MARKET ANALYSIS
MAXFIELD RESEARCH INC. 64
for for‐sale townhomes, the development should incorporate a mix of one‐level and two‐level units. For two‐level units, we recommend base prices (2013 dollars) of approximately $200 per square foot, on average. One‐level units should be priced higher than two‐level units – with base prices at roughly $250 per square foot or slightly higher. Also units that are on the Lake or that have good views and access to boat slips on Lake Minneton‐ka may have additional price premiums.
Condominium – The condominium market experienced a substantial downturn during the economic recession and many units that were on the market were converted to rentals. Regatta, the proposed condominium development that is part of The Prome‐nade at Wayzata is currently preselling units and there is strong interest. Another de‐velopment in Minnetonka that was never completed is planning to move forward with the remaining two buildings and has experienced exceptional interest in initial market‐ing. Although we do not recommend the development of a condominium building over the next two years, we recommend that you continue to monitor interest in this product for the Downtown and especially for units that would overlook the Lost Lake Channel. These units would appeal to mid‐age as well as empty‐nesters and seniors that wish to avoid stairs. We would recommend base prices in 2013 dollars of approximately $300 per square foot, on average. Units with excellent views should be able to attain a price premium.
Market Rate Rental Apartment – Approximately 80 to 90 market rate rental units could be supported in the Downtown over the next decade. A stand‐alone building would likely be needed to accommodate this many units. Rent levels should range on average from $1.40 to $1.45 per square foot. A small portion of these units could be affordable for moderate‐income households.
Independent Senior Housing – We find that demand from independent seniors is suffi‐cient to support the development of 60 units as of 2013. We recommend that the build‐ing be freestanding or there could be a public use on the main level such as a new public library. This has been done in several communities in the Twin Cities Metro with signifi‐cant success and is currently being considered in Columbia Heights along with a new City Hall. A stand‐alone senior building on Langdon Lake would provide seniors with a location that is somewhat quiet, but within walking distance to goods and services in the Downtown. We estimate per square foot rents on average at about $1.35 to $1.45 per square foot for this type of building. This project could be a for‐sale development as well, for example, an age‐restricted cooperative or condominium.
RETAIL MARKET ANALYSIS
MAXFIELD RESEARCH INC. 65
Introduction The following points outline the process and methodology for assessing retail market condi‐tions for Downtown Mound.
A Retail Trade Area was identified for Downtown Mound based on customer traffic patterns and interviews with local business owners. This is the area from which businesses located in the Downtown are most likely to attract the majority of their customers. Demographic characteristics assessed for this Trade Area include population and household growth trends and daytime population.
Consumer expenditure data is presented for people residing in the Market Area. We as‐sume that people that work in Mound, but do not reside in Mound are similar in demo‐graphic composition to those that reside in the community.
The supply of retail space in the Market Area was analyzed through fieldwork and from in‐formation obtained from the Minnesota Commercial Association of Realtors’ (MNCAR) online database.
Based on an analysis of existing customer spending potential, leakage of retail spending outside of the community and the existing supply and condition of retail spaces in Mound, demand is quantified for additional retail in the Mound Trade area and the ability of Down‐town Mound to support additional retail space.
Market Area Definition The majority of people who shop at retail establishments in the Downtown come from Mound and adjacent nearby communities. Based on conversations with business owners in Mound, the customer draw area is quite consistent. Therefore, the Mound Retail Market Area is de‐fined as the communities of Mound, Spring Park, Navarre (Orono), Minnetrista, St. Bonifacius, Independence, Maple Plain, Watertown and Watertown Township. Due to travel patterns on existing highways and competitive shopping areas, people in communities to the south (Victo‐ria, Chanhassen and Chaska), and east (Minnetonka, Wayzata) would not constitute a large market for retail in the Downtown. Downtown Mound may however, draw some people from these areas for specialty retail.
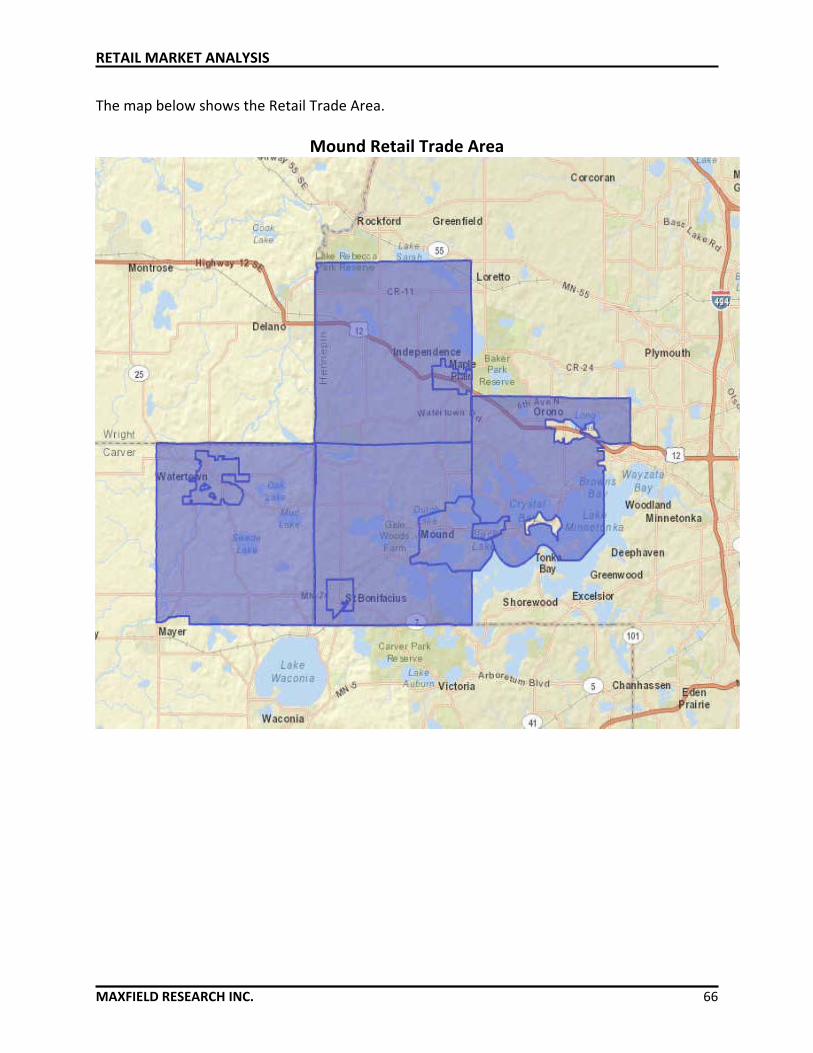
RETAIL MARKET ANALYSIS
MAXFIELD RESEARCH INC. 66
The map below shows the Retail Trade Area.
Mound Retail Trade Area
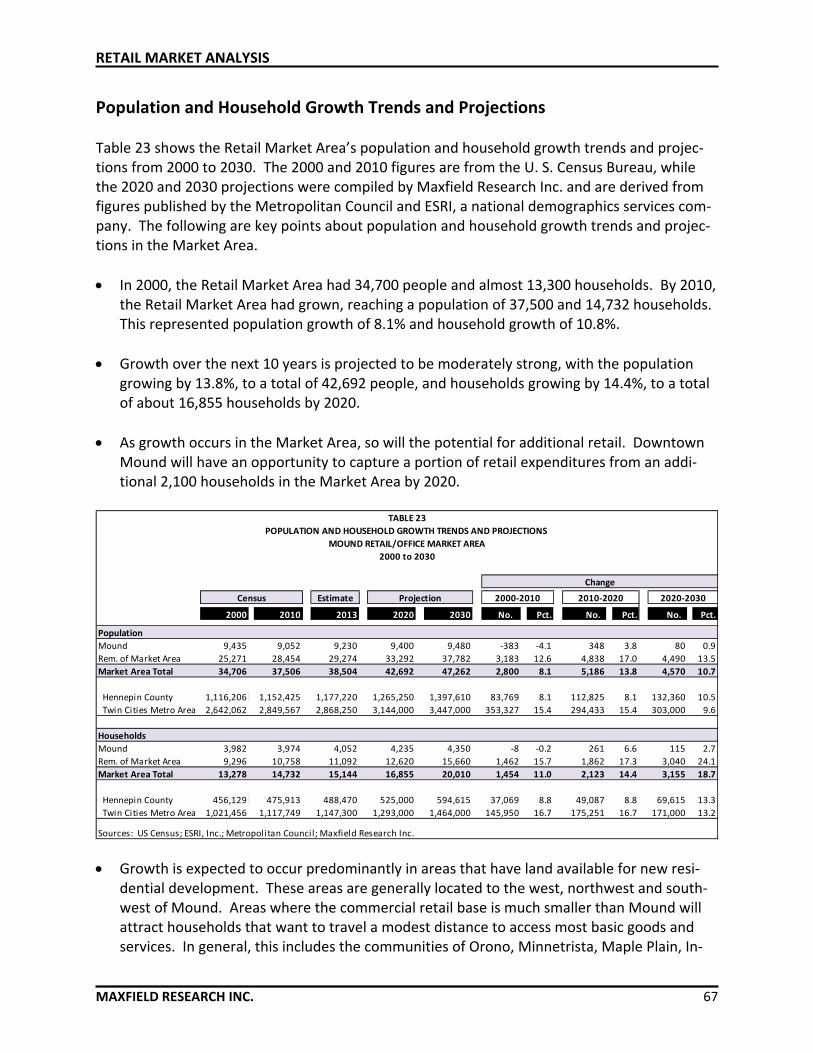
RETAIL MARKET ANALYSIS
MAXFIELD RESEARCH INC. 67
Population and Household Growth Trends and Projections Table 23 shows the Retail Market Area’s population and household growth trends and projec‐tions from 2000 to 2030. The 2000 and 2010 figures are from the U. S. Census Bureau, while the 2020 and 2030 projections were compiled by Maxfield Research Inc. and are derived from figures published by the Metropolitan Council and ESRI, a national demographics services com‐pany. The following are key points about population and household growth trends and projec‐tions in the Market Area.
In 2000, the Retail Market Area had 34,700 people and almost 13,300 households. By 2010, the Retail Market Area had grown, reaching a population of 37,500 and 14,732 households. This represented population growth of 8.1% and household growth of 10.8%.
Growth over the next 10 years is projected to be moderately strong, with the population growing by 13.8%, to a total of 42,692 people, and households growing by 14.4%, to a total of about 16,855 households by 2020.
As growth occurs in the Market Area, so will the potential for additional retail. Downtown Mound will have an opportunity to capture a portion of retail expenditures from an addi‐tional 2,100 households in the Market Area by 2020.
POPULATION AND HOUSEHOLD GROWTH TRENDS AND PROJECTIONS
MOUND RETAIL/OFFICE MARKET AREA
2000 to 2030
Change
Estimate
2000 2010 2013 2020 2030 No. Pct. No. Pct. No. Pct.
Population
Mound 9,435 9,052 9,230 9,400 9,480 ‐383 ‐4.1 348 3.8 80 0.9
Rem. of Market Area 25,271 28,454 29,274 33,292 37,782 3,183 12.6 4,838 17.0 4,490 13.5
Market Area Total 34,706 37,506 38,504 42,692 47,262 2,800 8.1 5,186 13.8 4,570 10.7
Hennepin County 1,116,206 1,152,425 1,177,220 1,265,250 1,397,610 83,769 8.1 112,825 8.1 132,360 10.5
Twin Cities Metro Area 2,642,062 2,849,567 2,868,250 3,144,000 3,447,000 353,327 15.4 294,433 15.4 303,000 9.6
Households
Mound 3,982 3,974 4,052 4,235 4,350 ‐8 ‐0.2 261 6.6 115 2.7
Rem. of Market Area 9,296 10,758 11,092 12,620 15,660 1,462 15.7 1,862 17.3 3,040 24.1
Market Area Total 13,278 14,732 15,144 16,855 20,010 1,454 11.0 2,123 14.4 3,155 18.7
Hennepin County 456,129 475,913 488,470 525,000 594,615 37,069 8.8 49,087 8.8 69,615 13.3
Twin Cities Metro Area 1,021,456 1,117,749 1,147,300 1,293,000 1,464,000 145,950 16.7 175,251 16.7 171,000 13.2
Sources: US Census; ESRI, Inc.; Metropolitan Council; Maxfield Research Inc.
2000‐2010 2020‐2030Projection
TABLE 23
Census 2010‐2020
Growth is expected to occur predominantly in areas that have land available for new resi‐
dential development. These areas are generally located to the west, northwest and south‐west of Mound. Areas where the commercial retail base is much smaller than Mound will attract households that want to travel a modest distance to access most basic goods and services. In general, this includes the communities of Orono, Minnetrista, Maple Plain, In‐
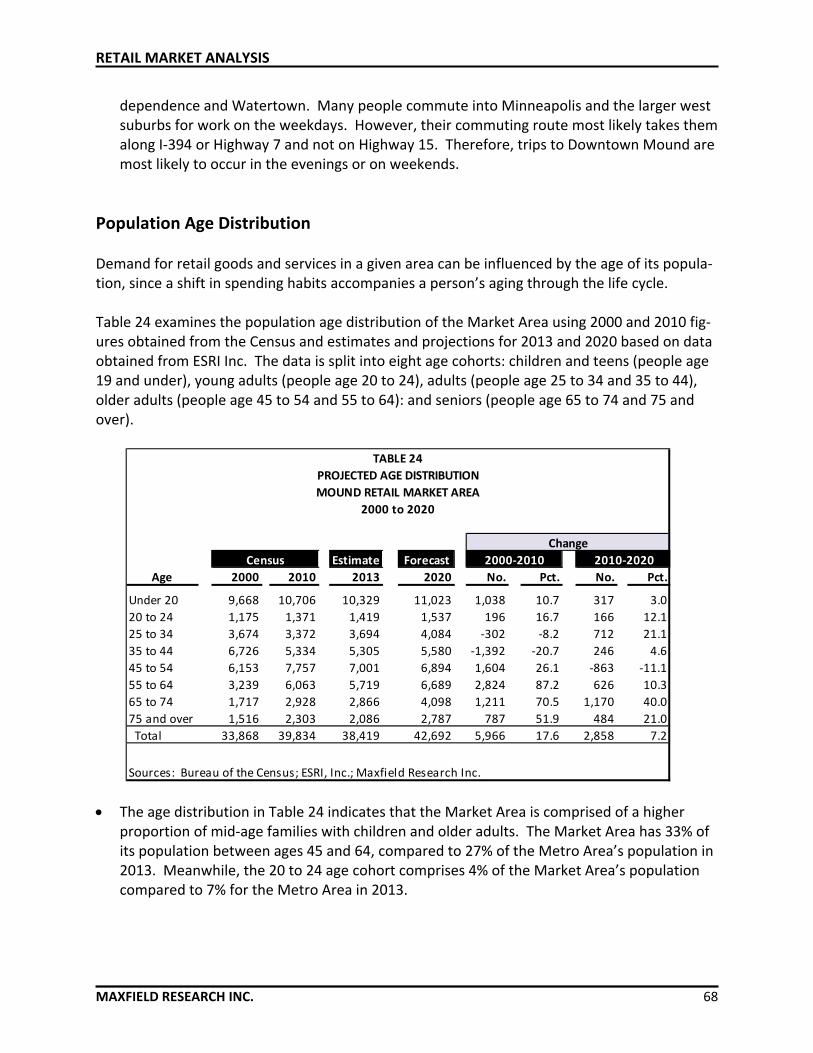
RETAIL MARKET ANALYSIS
MAXFIELD RESEARCH INC. 68
dependence and Watertown. Many people commute into Minneapolis and the larger west suburbs for work on the weekdays. However, their commuting route most likely takes them along I‐394 or Highway 7 and not on Highway 15. Therefore, trips to Downtown Mound are most likely to occur in the evenings or on weekends.
Population Age Distribution Demand for retail goods and services in a given area can be influenced by the age of its popula‐tion, since a shift in spending habits accompanies a person’s aging through the life cycle. Table 24 examines the population age distribution of the Market Area using 2000 and 2010 fig‐ures obtained from the Census and estimates and projections for 2013 and 2020 based on data obtained from ESRI Inc. The data is split into eight age cohorts: children and teens (people age 19 and under), young adults (people age 20 to 24), adults (people age 25 to 34 and 35 to 44), older adults (people age 45 to 54 and 55 to 64): and seniors (people age 65 to 74 and 75 and over).
Estimate Forecast 2000‐2010 2010‐2020
Age 2000 2010 2013 2020 No. Pct. No. Pct.
Under 20 9,668 10,706 10,329 11,023 1,038 10.7 317 3.0
20 to 24 1,175 1,371 1,419 1,537 196 16.7 166 12.1
25 to 34 3,674 3,372 3,694 4,084 ‐302 ‐8.2 712 21.1
35 to 44 6,726 5,334 5,305 5,580 ‐1,392 ‐20.7 246 4.6
45 to 54 6,153 7,757 7,001 6,894 1,604 26.1 ‐863 ‐11.1
55 to 64 3,239 6,063 5,719 6,689 2,824 87.2 626 10.3
65 to 74 1,717 2,928 2,866 4,098 1,211 70.5 1,170 40.0
75 and over 1,516 2,303 2,086 2,787 787 51.9 484 21.0
Total 33,868 39,834 38,419 42,692 5,966 17.6 2,858 7.2
Sources: Bureau of the Census; ESRI, Inc.; Maxfield Research Inc.
Change
TABLE 24
PROJECTED AGE DISTRIBUTION
MOUND RETAIL MARKET AREA
2000 to 2020
Census
The age distribution in Table 24 indicates that the Market Area is comprised of a higher proportion of mid‐age families with children and older adults. The Market Area has 33% of its population between ages 45 and 64, compared to 27% of the Metro Area’s population in 2013. Meanwhile, the 20 to 24 age cohort comprises 4% of the Market Area’s population compared to 7% for the Metro Area in 2013.

RETAIL MARKET ANALYSIS
MAXFIELD RESEARCH INC. 69
0
2,000
4,000
6,000
8,000
10,000
12,000
Under 20 20 to 24 25 to 34 35 to 44 45 to 54 55 to 64 65 to 74 75 and over
No. of Persons
Age Group
Projected Age DistributionMound Retail Market Area
2013‐2020
2013
2020
The age distribution shown in Table 24 suggests that children of families in the Market Area
seek housing elsewhere when they reach their 20s. This is likely due to many young people in this age group leaving the community for higher education institutions or work opportu‐nities elsewhere. The Mound School District is very highly rated and a significant proportion of its graduates attend institutions of higher learning beyond high school graduation. A por‐tion of those individuals may return to the area after college graduation if they find a posi‐tion in the Twin Cities. However, the population/customer base in the Market Area is skewed more toward mid‐age and older adults who usually have more disposable income.
The growth trend shows the 45 to 64 age cohort with the greatest growth this decade, gain‐ing 4,375 people or increasing by 58.9%.
Daytime Population Table 25 shows the daytime population and resident workforce population in Mound and four other nearby communities. This information was compiled by the US Census using estimates (five‐year average) from the American Community Survey from 2006 to 2010. The information identifies the number of people that work in the community along with the number of people that work and work outside of the community. A ratio of live there/work there for the popula‐tion is identified which indicates the number of people that would be available to the retail market base during the daytime hours, when most retail establishments are open. Communi‐ties that have a high ratio of live there/work there for the population can often support a
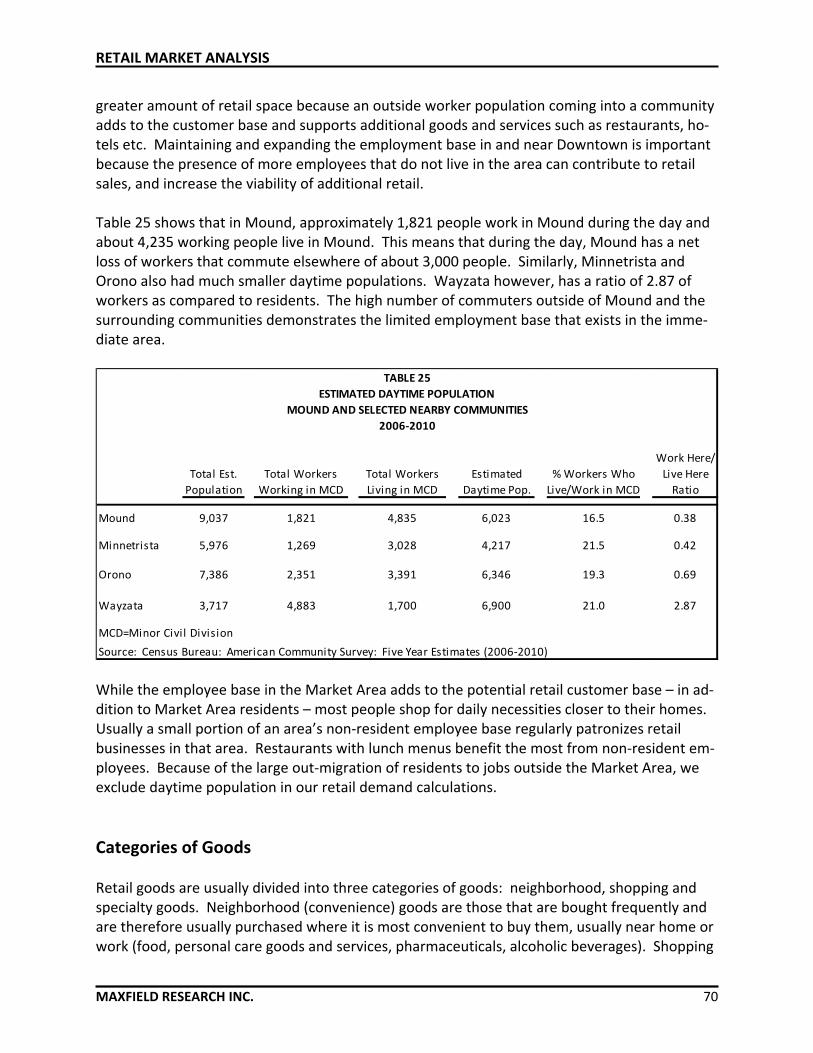
RETAIL MARKET ANALYSIS
MAXFIELD RESEARCH INC. 70
greater amount of retail space because an outside worker population coming into a community adds to the customer base and supports additional goods and services such as restaurants, ho‐tels etc. Maintaining and expanding the employment base in and near Downtown is important because the presence of more employees that do not live in the area can contribute to retail sales, and increase the viability of additional retail. Table 25 shows that in Mound, approximately 1,821 people work in Mound during the day and about 4,235 working people live in Mound. This means that during the day, Mound has a net loss of workers that commute elsewhere of about 3,000 people. Similarly, Minnetrista and Orono also had much smaller daytime populations. Wayzata however, has a ratio of 2.87 of workers as compared to residents. The high number of commuters outside of Mound and the surrounding communities demonstrates the limited employment base that exists in the imme‐diate area.
Work Here/
Total Est. Total Workers Total Workers Estimated % Workers Who Live Here
Population Working in MCD Living in MCD Daytime Pop. Live/Work in MCD Ratio
Mound 9,037 1,821 4,835 6,023 16.5 0.38
Minnetrista 5,976 1,269 3,028 4,217 21.5 0.42
Orono 7,386 2,351 3,391 6,346 19.3 0.69
Wayzata 3,717 4,883 1,700 6,900 21.0 2.87
MCD=Minor Civil Division
Source: Census Bureau: American Community Survey: Five Year Estimates (2006‐2010)
TABLE 25
ESTIMATED DAYTIME POPULATION
MOUND AND SELECTED NEARBY COMMUNITIES
2006‐2010
While the employee base in the Market Area adds to the potential retail customer base – in ad‐dition to Market Area residents – most people shop for daily necessities closer to their homes. Usually a small portion of an area’s non‐resident employee base regularly patronizes retail businesses in that area. Restaurants with lunch menus benefit the most from non‐resident em‐ployees. Because of the large out‐migration of residents to jobs outside the Market Area, we exclude daytime population in our retail demand calculations.
Categories of Goods Retail goods are usually divided into three categories of goods: neighborhood, shopping and specialty goods. Neighborhood (convenience) goods are those that are bought frequently and are therefore usually purchased where it is most convenient to buy them, usually near home or work (food, personal care goods and services, pharmaceuticals, alcoholic beverages). Shopping
RETAIL MARKET ANALYSIS
MAXFIELD RESEARCH INC. 71
goods are those that shoppers will take more care and make a greater effort to purchase and for which they prefer to have a comparative selection so that quality, types, and price can be compared. Specialty goods are those for which shoppers expend the greatest effort and for which there is little competition (unique goods or items for which there are few substitutes or alternatives). The draw area for shopping, and therefore, its size, is affected by the availability of such goods. The draw area for most neighborhood goods in a suburban area is less than two miles. People typically purchase shopping and specialty goods less often than neighborhood goods, and are willing to travel farther to purchase these items. Thus, the draw area for shopping goods is larger, typically about five miles in a suburban setting. However, since the area to the west of Mound is primarily rural with few retail stores, the draw areas for both neighborhood and shopping goods extends about 10 miles to the west and about five miles to the northwest along Highway 110. The draw area to the south and east is smaller because residents of these areas typically travel Highway 12 or Highway 7 into the Twin Cities and bypass Mound, although Spring Park residents and some Navarre and Tonka Bay residents come to Mound for various items. Historically, most retail stores were independently owned and located in individually owned buildings in a Downtown. Today, most retail stores are national retailers that are located in shopping centers along major Highways. Shopping centers are classified into three categories: Neighborhood, Community, and Regional shopping centers.
Neighborhood Centers range from about 30,000 to 180,000 square feet and are typ‐ically anchored by a grocery store and/or drug store. These centers serve the day‐to‐day shopping needs of surrounding neighborhoods within a one‐ to two‐mile ra‐dius (serving 10,000 to 40,000 people). The newly constructed Mound Marketplace is a neighborhood center with about 74,000 square feet and Jubilee Foods as its an‐chor. Across the street from Mound Marketplace is a newly expanded Walgreens drugstore. Mound’s municipal liquor store is also located in this center.
Community Centers typically have between 180,000 and 465,000 square feet, alt‐hough some newer “power centers” are larger, with up to 800,000 square feet. Community centers are usually anchored by a discount and/or department store and include a variety of small tenants. Community centers draw from a larger geograph‐ic area – about five miles, and serve a population of up to 150,000.
RETAIL MARKET ANALYSIS
MAXFIELD RESEARCH INC. 72
Regional Centers range from about 300,000 to 1.2 million square feet of GLA and must include at least one (usually two or more) major department store, along with a variety of additional shops. Most regional centers are enclosed malls. However, some of today’s new power centers have draw areas similar to a traditional enclosed mall. These shopping centers have the largest draw areas among the three shopping center classifications and typically serve a population of about 250,000 or more.
Sine the 1950s, new retail development in the Twin Cities and nationwide has occurred primari‐ly in shopping centers. Meanwhile, the amount of retail located in downtowns has been in de‐cline. Today, most retail expenditures occur at stores that are located in a traditional shopping center format with on‐line internet sales increasing in volume against traditional soft goods outlets. Mound’s newest retail is found in and surrounding a traditional neighborhood shopping center. Additional centers are located in Mound (Commerce Center and Shoreline Place), both of which have experienced increased vacancies as tenants have relocated either to new space in Mound or to space outside of Mound. Conversations with business owners and stakeholders and visual inspection of operations in the Downtown indicate that traffic at new retail outlets is active. Businesses that remain in older centers are also doing well, but vacant spaces give an appear‐ance of an area or center that is struggling despite strong performance by individual tenants. Instead of attracting new businesses to Mound, most businesses have either relocated and/or expanded in Mound or have left for a location outside of Mound, but may remain within the Mound Trade Area. These businesses remain convenient for customers, but do not add to the tax base or retail sales base of the City.
Consumer Expenditure Patterns Table 26 shows consumer expenditures for retail goods and services for the Market Area in 2013, according to data obtained from ESRI Inc. This data is used later in the report to calculate the potential demand for retail space, based on projected population growth in the area and the resulting growth in consumer expenditures. The following are key points from the consum‐er expenditure data.
Market Area consumers spend approximately $566 million per year on the retail goods and services shown in Table 26 (excluding housing, insurance, health care, lodging, and educa‐tion). Average annual expenditures are estimated to be $17,316 per capita and $44,559 per household.
Of the 29 categories of retail items in Table 26, 11 are considered items typically found at neighborhood and convenience centers, five categories are considered to be specialty‐oriented goods or services, while the remaining categories are typically found at community
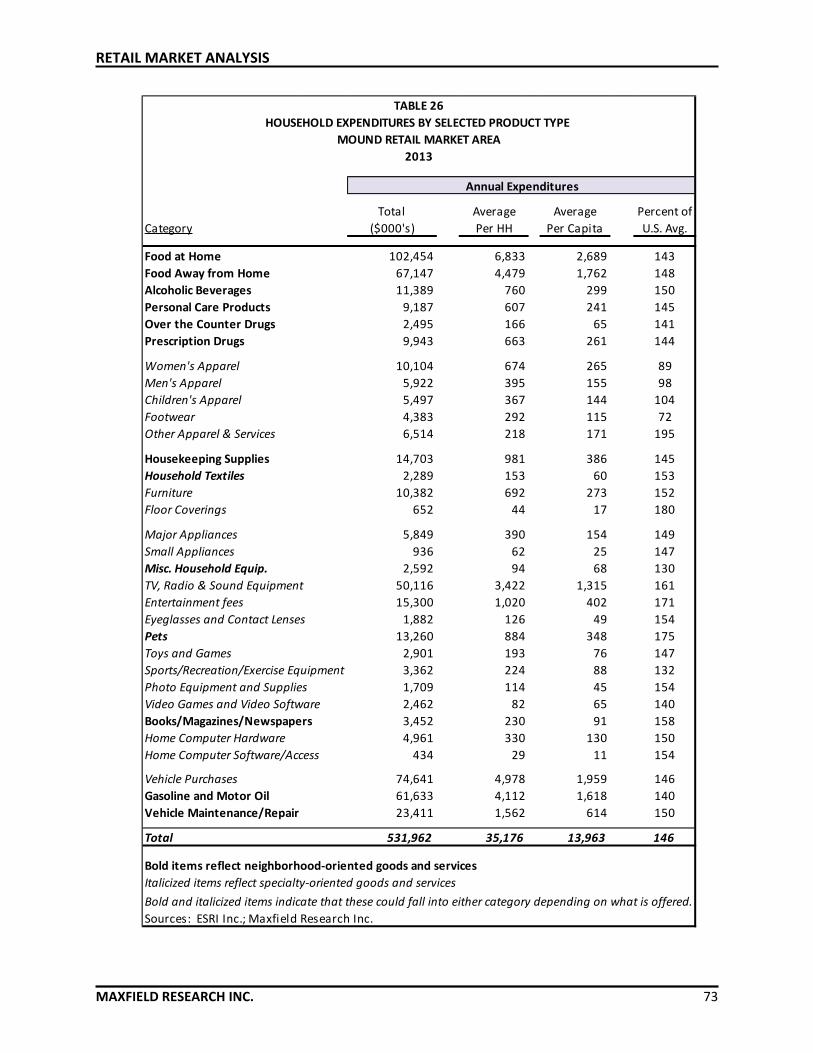
RETAIL MARKET ANALYSIS
MAXFIELD RESEARCH INC. 73
Total Average Average Percent of
Category ($000's) Per HH Per Capita U.S. Avg.
Food at Home 102,454 6,833 2,689 143
Food Away from Home 67,147 4,479 1,762 148
Alcoholic Beverages 11,389 760 299 150
Personal Care Products 9,187 607 241 145
Over the Counter Drugs 2,495 166 65 141
Prescription Drugs 9,943 663 261 144
Women's Apparel 10,104 674 265 89
Men's Apparel 5,922 395 155 98
Children's Apparel 5,497 367 144 104
Footwear 4,383 292 115 72
Other Apparel & Services 6,514 218 171 195
Housekeeping Supplies 14,703 981 386 145
Household Textiles 2,289 153 60 153
Furniture 10,382 692 273 152
Floor Coverings 652 44 17 180
Major Appliances 5,849 390 154 149
Small Appliances 936 62 25 147
Misc. Household Equip. 2,592 94 68 130
TV, Radio & Sound Equipment 50,116 3,422 1,315 161
Entertainment fees 15,300 1,020 402 171
Eyeglasses and Contact Lenses 1,882 126 49 154
Pets 13,260 884 348 175
Toys and Games 2,901 193 76 147
Sports/Recreation/Exercise Equipment 3,362 224 88 132
Photo Equipment and Supplies 1,709 114 45 154
Video Games and Video Software 2,462 82 65 140
Books/Magazines/Newspapers 3,452 230 91 158
Home Computer Hardware 4,961 330 130 150
Home Computer Software/Access 434 29 11 154
Vehicle Purchases 74,641 4,978 1,959 146
Gasoline and Motor Oil 61,633 4,112 1,618 140
Vehicle Maintenance/Repair 23,411 1,562 614 150
Total 531,962 35,176 13,963 146
Bold items reflect neighborhood‐oriented goods and services
Italicized items reflect specialty‐oriented goods and services
Bold and italicized items indicate that these could fall into either category depending on what is offered.
Sources: ESRI Inc.; Maxfield Research Inc.
Annual Expenditures
TABLE 26
HOUSEHOLD EXPENDITURES BY SELECTED PRODUCT TYPE
MOUND RETAIL MARKET AREA
2013

RETAIL MARKET ANALYSIS
MAXFIELD RESEARCH INC. 74
centers or regional malls (larger shopping centers with retailers that require a larger cus‐tomer base than neighborhood retailers). The “neighborhood” categories are bolded and the “specialty” categories are italicized in the table. Combined, the average annual expend‐itures for these items in the Market Area was $8,136 per capita and $20,938 per household.
The two categories accounting for the greatest percentage of consumer expenditures are Food at Home (groceries) and Food Away from Home (restaurants). Food at Home or gro‐cery accounts for 10% of household expenditures while Food Away from Home accounts for 12% of household expenditures. The significant growth in Food Away from Home docu‐ments that households are spending more of their food dollars at restaurants and at gro‐cery outlets that also offer prepared foods.
According to ESRI’s “Market Index,” the average household expenditure for most items by Market Area residents was greater than the U.S. average, as indicated by an overall market index of 1.54 (residents spent 54% more on consumer goods than the national average). The fact that Market Area households spend significantly above the national average on most retail goods and services is an indicator of a relatively high household incomes in the area as compared to the nation.
In addition to supporting retailers of neighborhood goods that serve the local population, the Downtown currently supports retailers of specialty and some shopping goods that draw customers from a larger area. Many retailers of shopping and specialty goods are national chains that have specific location requirements – which typically place them in an area with a high population density and better highway access than Downtown Mound. The stores that Downtown Mound would attract will most likely be small, independently‐owned spe‐cialty stores, versus larger stores of shopping goods.
The fact that households spend more than the national average on retail goods and services is a strength that can increase the area’s attractiveness to retailers who are searching for expansion markets.

RETAIL MARKET ANALYSIS
MAXFIELD RESEARCH INC. 75
Retail Gaps Analysis Table 27 presents a summary of the potential demand and supply of retail goods and services for the communities that comprise the Retail Trade Area. The table shows the level of potential demand from the existing resident household base in the area as matched against retail sales estimates for each category of retail outlet. A number of Mound retailers draw customers from a larger area including Minnetrista, Orono, Independence, Maple Plain, St. Bonifacius as well as a few from other areas nearby such as Tonka Bay, Navarre, Shorewood, Wayzata and Waconia. The gaps analysis lists potential demand by retail industry group along with the estimated retail sales for that group among the existing retail outlets. A negative number indicates that there is sufficient supply or oversupply of that type of retail use in the Market Area. A positive number indicates there is a retail gap or additional demand that could potentially be captured by other retail outlets. The leakage or surplus factor identifies the proportion of sales that is being cap‐tured by outlets that are outside of Mound and Spring Park. As shown on the table, there is only on category that is currently identified as having an over‐supply in the Retail Trade Area: Lawn & Garden Equipment and Supply Stores All other uses have some level of leakage, meaning that customers are spending their retail dol‐lars outside of Mound for many of the industry categories shown on the table. We caution here however that a strict face value interpretation of this data does not account for the retail criteria of national versus local outlets and that national chains in a number of these categories are not likely to consider Mound as a location for a retail outlet. Smaller stores that have the capacity to draw from the surrounding area and that are not in direct com‐petition with other outlets nearby may be able to capture a portion of the retail sales are are currently leaving the community. Because existing Mound retailers are competing with other retailers in the Retail Trade Area as well as against other outlets that are located in larger retail concentrations outside of Mound, the level of gap that exists for specific categories may not be able to capture a sufficient amount of the leakage to support a second or third retail outlet in Mound. The information on Table 27 should be used as a guide to consider some gaps in retail that could be offered in the community to enhance the existing retail base without cannibalizing sales from other businesses. This is critical to the ongoing success of the Downtown. If too many of one type of outlet locates in the same Trade Area, it could create a situation for the es‐tablished retailer and the new retailer that neither could capture sufficient revenues to support the two operations and both would close, increasing the loss to the community and to custom‐ers.
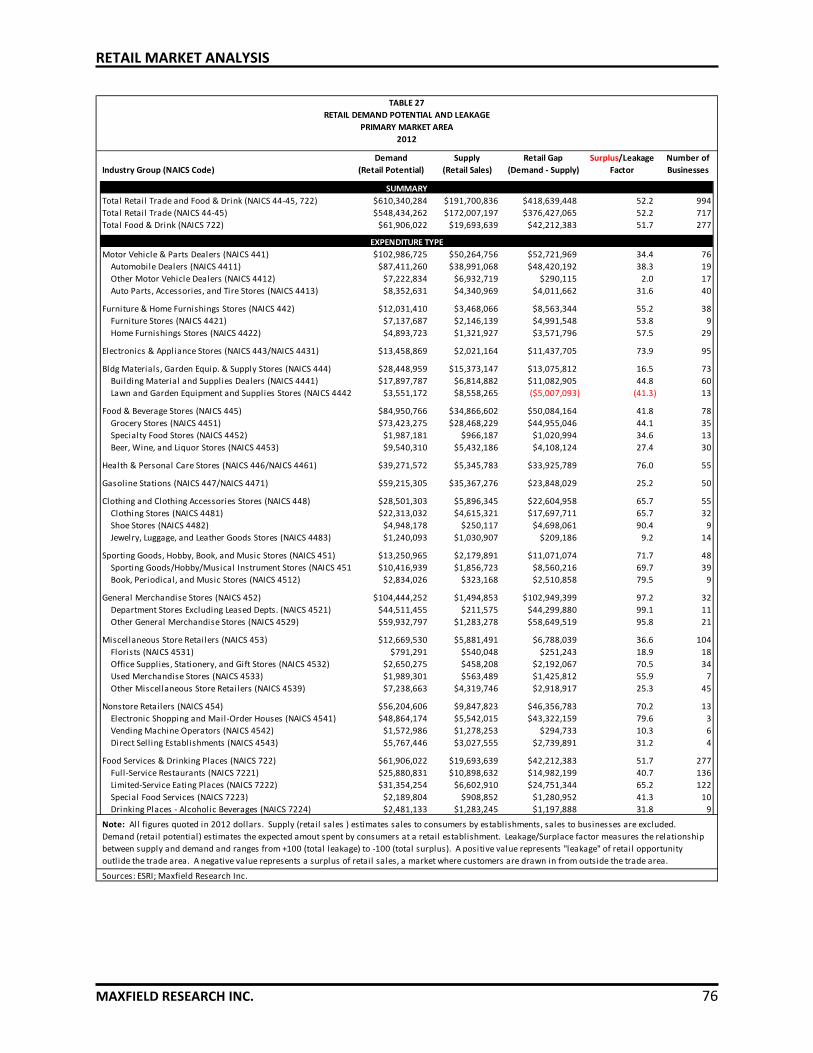
RETAIL MARKET ANALYSIS
MAXFIELD RESEARCH INC. 76
Demand Supply Retail Gap Surplus/Leakage Number of
Industry Group (NAICS Code) (Retail Potential) (Retail Sales) (Demand ‐ Supply) Factor Businesses
Total Retail Trade and Food & Drink (NAICS 44‐45, 722) $610,340,284 $191,700,836 $418,639,448 52.2 994
Total Retail Trade (NAICS 44‐45) $548,434,262 $172,007,197 $376,427,065 52.2 717
Total Food & Drink (NAICS 722) $61,906,022 $19,693,639 $42,212,383 51.7 277
Motor Vehicle & Parts Dealers (NAICS 441) $102,986,725 $50,264,756 $52,721,969 34.4 76
Automobile Dealers (NAICS 4411) $87,411,260 $38,991,068 $48,420,192 38.3 19
Other Motor Vehicle Dealers (NAICS 4412) $7,222,834 $6,932,719 $290,115 2.0 17
Auto Parts, Accessories, and Tire Stores (NAICS 4413) $8,352,631 $4,340,969 $4,011,662 31.6 40
Furniture & Home Furnishings Stores (NAICS 442) $12,031,410 $3,468,066 $8,563,344 55.2 38
Furniture Stores (NAICS 4421) $7,137,687 $2,146,139 $4,991,548 53.8 9
Home Furnishings Stores (NAICS 4422) $4,893,723 $1,321,927 $3,571,796 57.5 29
Electronics & Appliance Stores (NAICS 443/NAICS 4431) $13,458,869 $2,021,164 $11,437,705 73.9 95
Bldg Materials, Garden Equip. & Supply Stores (NAICS 444) $28,448,959 $15,373,147 $13,075,812 16.5 73
Building Material and Supplies Dealers (NAICS 4441) $17,897,787 $6,814,882 $11,082,905 44.8 60
Lawn and Garden Equipment and Supplies Stores (NAICS 4442 $3,551,172 $8,558,265 ($5,007,093) (41.3) 13
Food & Beverage Stores (NAICS 445) $84,950,766 $34,866,602 $50,084,164 41.8 78
Grocery Stores (NAICS 4451) $73,423,275 $28,468,229 $44,955,046 44.1 35
Specialty Food Stores (NAICS 4452) $1,987,181 $966,187 $1,020,994 34.6 13
Beer, Wine, and Liquor Stores (NAICS 4453) $9,540,310 $5,432,186 $4,108,124 27.4 30
Health & Personal Care Stores (NAICS 446/NAICS 4461) $39,271,572 $5,345,783 $33,925,789 76.0 55
Gasoline Stations (NAICS 447/NAICS 4471) $59,215,305 $35,367,276 $23,848,029 25.2 50
Clothing and Clothing Accessories Stores (NAICS 448) $28,501,303 $5,896,345 $22,604,958 65.7 55
Clothing Stores (NAICS 4481) $22,313,032 $4,615,321 $17,697,711 65.7 32
Shoe Stores (NAICS 4482) $4,948,178 $250,117 $4,698,061 90.4 9
Jewelry, Luggage, and Leather Goods Stores (NAICS 4483) $1,240,093 $1,030,907 $209,186 9.2 14
Sporting Goods, Hobby, Book, and Music Stores (NAICS 451) $13,250,965 $2,179,891 $11,071,074 71.7 48
Sporting Goods/Hobby/Musical Instrument Stores (NAICS 451 $10,416,939 $1,856,723 $8,560,216 69.7 39
Book, Periodical, and Music Stores (NAICS 4512) $2,834,026 $323,168 $2,510,858 79.5 9
General Merchandise Stores (NAICS 452) $104,444,252 $1,494,853 $102,949,399 97.2 32
Department Stores Excluding Leased Depts. (NAICS 4521) $44,511,455 $211,575 $44,299,880 99.1 11
Other General Merchandise Stores (NAICS 4529) $59,932,797 $1,283,278 $58,649,519 95.8 21
Miscellaneous Store Retailers (NAICS 453) $12,669,530 $5,881,491 $6,788,039 36.6 104
Florists (NAICS 4531) $791,291 $540,048 $251,243 18.9 18
Office Supplies, Stationery, and Gift Stores (NAICS 4532) $2,650,275 $458,208 $2,192,067 70.5 34
Used Merchandise Stores (NAICS 4533) $1,989,301 $563,489 $1,425,812 55.9 7
Other Miscellaneous Store Retailers (NAICS 4539) $7,238,663 $4,319,746 $2,918,917 25.3 45
Nonstore Retailers (NAICS 454) $56,204,606 $9,847,823 $46,356,783 70.2 13
Electronic Shopping and Mail‐Order Houses (NAICS 4541) $48,864,174 $5,542,015 $43,322,159 79.6 3
Vending Machine Operators (NAICS 4542) $1,572,986 $1,278,253 $294,733 10.3 6
Direct Sell ing Establishments (NAICS 4543) $5,767,446 $3,027,555 $2,739,891 31.2 4
Food Services & Drinking Places (NAICS 722) $61,906,022 $19,693,639 $42,212,383 51.7 277
Full‐Service Restaurants (NAICS 7221) $25,880,831 $10,898,632 $14,982,199 40.7 136
Limited‐Service Eating Places (NAICS 7222) $31,354,254 $6,602,910 $24,751,344 65.2 122
Special Food Services (NAICS 7223) $2,189,804 $908,852 $1,280,952 41.3 10
Drinking Places ‐ Alcoholic Beverages (NAICS 7224) $2,481,133 $1,283,245 $1,197,888 31.8 9
Sources: ESRI; Maxfield Research Inc.
RETAIL DEMAND POTENTIAL AND LEAKAGE
PRIMARY MARKET AREA
2012
TABLE 27
EXPENDITURE TYPE
Note: All figures quoted in 2012 dollars. Supply (retail sales ) estimates sales to consumers by establishments, sales to businesses are excluded.
Demand (retail potential) estimates the expected amout spent by consumers at a retail establishment. Leakage/Surplace factor measures the relationship
between supply and demand and ranges from +100 (total leakage) to ‐100 (total surplus). A positive value represents "leakage" of retail opportunity
outlide the trade area. A negative value represents a surplus of retail sales, a market where customers are drawn in from outside the trade area.
SUMMARY
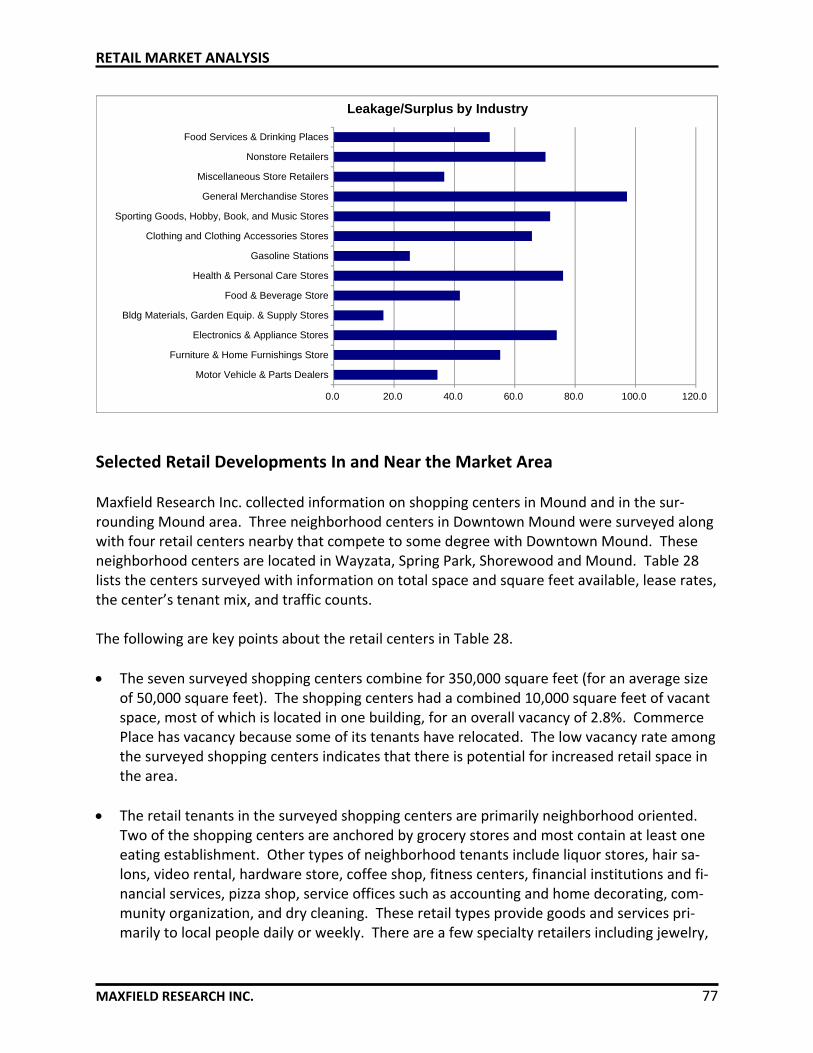
RETAIL MARKET ANALYSIS
MAXFIELD RESEARCH INC. 77
0.0 20.0 40.0 60.0 80.0 100.0 120.0
Motor Vehicle & Parts Dealers
Furniture & Home Furnishings Store
Electronics & Appliance Stores
Bldg Materials, Garden Equip. & Supply Stores
Food & Beverage Store
Health & Personal Care Stores
Gasoline Stations
Clothing and Clothing Accessories Stores
Sporting Goods, Hobby, Book, and Music Stores
General Merchandise Stores
Miscellaneous Store Retailers
Nonstore Retailers
Food Services & Drinking Places
Leakage/Surplus by Industry
Selected Retail Developments In and Near the Market Area Maxfield Research Inc. collected information on shopping centers in Mound and in the sur‐rounding Mound area. Three neighborhood centers in Downtown Mound were surveyed along with four retail centers nearby that compete to some degree with Downtown Mound. These neighborhood centers are located in Wayzata, Spring Park, Shorewood and Mound. Table 28 lists the centers surveyed with information on total space and square feet available, lease rates, the center’s tenant mix, and traffic counts. The following are key points about the retail centers in Table 28.
The seven surveyed shopping centers combine for 350,000 square feet (for an average size of 50,000 square feet). The shopping centers had a combined 10,000 square feet of vacant space, most of which is located in one building, for an overall vacancy of 2.8%. Commerce Place has vacancy because some of its tenants have relocated. The low vacancy rate among the surveyed shopping centers indicates that there is potential for increased retail space in the area.
The retail tenants in the surveyed shopping centers are primarily neighborhood oriented. Two of the shopping centers are anchored by grocery stores and most contain at least one eating establishment. Other types of neighborhood tenants include liquor stores, hair sa‐lons, video rental, hardware store, coffee shop, fitness centers, financial institutions and fi‐nancial services, pizza shop, service offices such as accounting and home decorating, com‐munity organization, and dry cleaning. These retail types provide goods and services pri‐marily to local people daily or weekly. There are a few specialty retailers including jewelry,
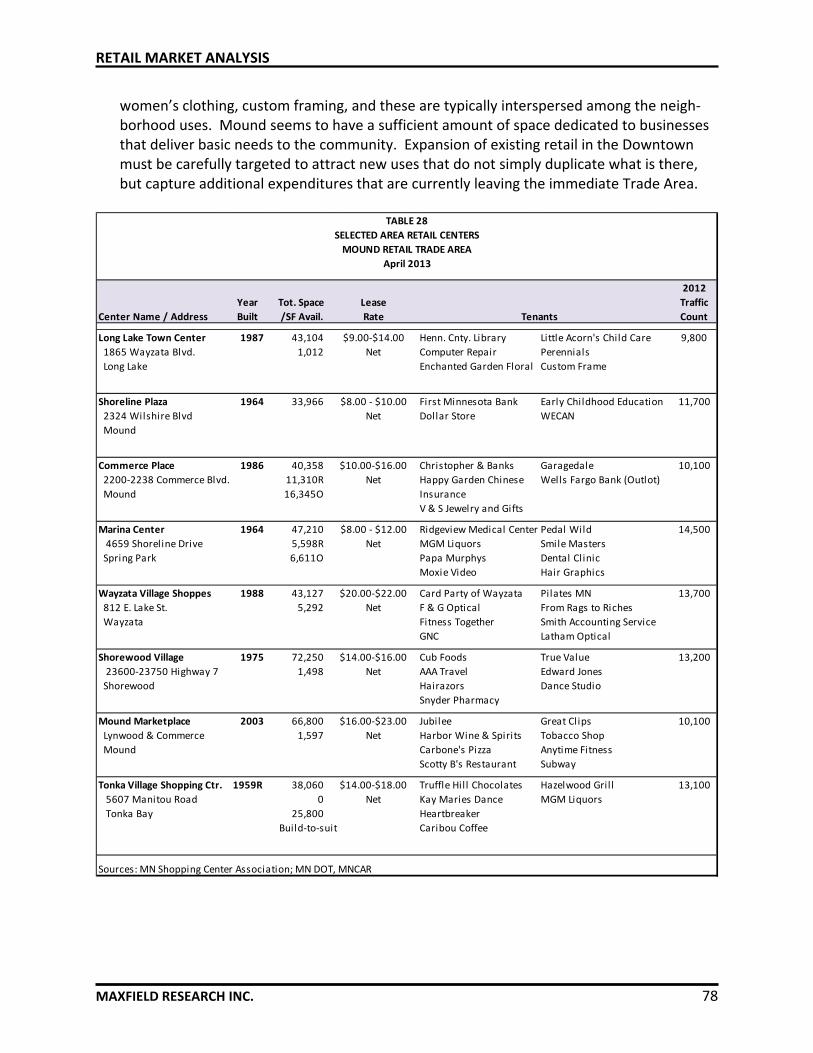
RETAIL MARKET ANALYSIS
MAXFIELD RESEARCH INC. 78
women’s clothing, custom framing, and these are typically interspersed among the neigh‐borhood uses. Mound seems to have a sufficient amount of space dedicated to businesses that deliver basic needs to the community. Expansion of existing retail in the Downtown must be carefully targeted to attract new uses that do not simply duplicate what is there, but capture additional expenditures that are currently leaving the immediate Trade Area.
2012
Year Tot. Space Lease Traffic
Center Name / Address Built /SF Avail. Rate Count
Long Lake Town Center 1987 43,104 $9.00‐$14.00 Henn. Cnty. Library Little Acorn's Child Care 9,800
1865 Wayzata Blvd. 1,012 Net Computer Repair Perennials
Long Lake Enchanted Garden Floral Custom Frame
Shoreline Plaza 1964 33,966 $8.00 ‐ $10.00 First Minnesota Bank Early Childhood Education 11,700
2324 Wilshire Blvd Net Dollar Store WECAN
Mound
Commerce Place 1986 40,358 $10.00‐$16.00 Christopher & Banks Garagedale 10,100
2200‐2238 Commerce Blvd. 11,310R Net Happy Garden Chinese Wells Fargo Bank (Outlot)
Mound 16,345O Insurance
V & S Jewelry and Gifts
Marina Center 1964 47,210 $8.00 ‐ $12.00 Ridgeview Medical Center Pedal Wild 14,500
4659 Shoreline Drive 5,598R Net MGM Liquors Smile Masters
Spring Park 6,611O Papa Murphys Dental Clinic
Moxie Video Hair Graphics
Wayzata Village Shoppes 1988 43,127 $20.00‐$22.00 Card Party of Wayzata Pilates MN 13,700
812 E. Lake St. 5,292 Net F & G Optical From Rags to Riches
Wayzata Fitness Together Smith Accounting Service
GNC Latham Optical
Shorewood Village 1975 72,250 $14.00‐$16.00 Cub Foods True Value 13,200
23600‐23750 Highway 7 1,498 Net AAA Travel Edward Jones
Shorewood Hairazors Dance Studio
Snyder Pharmacy
Mound Marketplace 2003 66,800 $16.00‐$23.00 Jubilee Great Clips 10,100
Lynwood & Commerce 1,597 Net Harbor Wine & Spirits Tobacco Shop
Mound Carbone's Pizza Anytime Fitness
Scotty B's Restaurant Subway
Tonka Village Shopping Ctr. 1959R 38,060 $14.00‐$18.00 Truffle Hill Chocolates Hazelwood Grill 13,100
5607 Manitou Road 0 Net Kay Maries Dance MGM Liquors
Tonka Bay 25,800 Heartbreaker
Build‐to‐suit Caribou Coffee
Sources: MN Shopping Center Association; MN DOT, MNCAR
Tenants
TABLE 28
SELECTED AREA RETAIL CENTERS
MOUND RETAIL TRADE AREA
April 2013
RETAIL MARKET ANALYSIS
MAXFIELD RESEARCH INC. 79
Lease rates at existing shopping centers range from a low of about $8.00 per square foot to a high of approximately $22.00 to $23.00 per square foot. Lease rates are net (meaning that, in addition to the rent, tenants also pay for taxes and common area maintenance). On average, net rents at the surveyed projects range from about $9.00 to $10.00 per square foot for older centers to about $18.00 per square foot for new buildings.
Except for Mound Marketplace, the shopping centers in Mound are generally older. In look‐ing at the existing centers, there is more vacant space in the centers that are older than in the newer center. Although lease rates may be less in an older center, retailers trying to at‐tract customers are conscious of their outlet’s appearance and the appearance of the cen‐ter. Drive‐by and pedestrian traffic can add to a destination retailer’s level of business. As such, retailers prefer a location that is active and vibrant all other things being equal. A re‐tailer however, will weigh their existing space with the cost of upgrading or expanding against the potential additional revenue that can be gained from making these improve‐ments.
The decision to expand or relocate and upgrade space is costly and retailers do not enter in‐to these decisions lightly. In addition, because of the high cost of opening a store or starting a restaurant, start‐up businesses usually face limited financial resources and because of that, the greatest risk. Many small businesses would like to locate in smaller communities, but paying for new space that will support the growth of their business is often financially infeasible. As a result, new businesses may often move to the least expensive space they can find which does not address the tastes and preferences of the customers they are trying to attract.
National chain restaurants and national chains in general have deep pockets, but they also have strict criteria on how they evaluate a potential market. They have less flexibility be‐cause they are heavily brand‐oriented and must maintain the image of that brand in the marketplace.
Planned and Pending Retail Developments Mound recently announced the groundbreaking for a new bistro restaurant concept that will open on a parcel adjacent to the new Dakota Trail and Walgreens. The bistro will serve beer and wine and locally grow organic foods. The space will be small, seating only 44 people. At this time, the owner intends to serve breakfast, lunch and dinner. There has been other interest in finding space in Downtown Mound from other types of spe‐cialty and retail businesses. According to those interviewed, many of the businesses are small, start‐up enterprises that cannot afford to pay the rent for new space. For others, the type of space required may not fit with the spaces that are currently available (size, configuration, lease rate).

RETAIL MARKET ANALYSIS
MAXFIELD RESEARCH INC. 80
The Promenade at Wayzata is currently under construction with the first phase of retail space that will face Superior Street and East Lake Street. A total of approximately 48,000 to 50,000 square feet is available for lease and is anticipated to accommodate some restaurants as well as clothing and other types of soft goods retailers. Above the retail component will be the 58‐unit Regatta condominiums. Although a small footprint Lund’s grocery store is scheduled to open November 2013, most of the remaining retail space is expected to be occupied in 2014. There are no other retail developments currently planned of which we are aware. Projected Demand for Retail Space Earlier sections studied shopping patterns and factors that influence the demand for retail space in the Market Area, such as population growth and consumer expenditure trends, and reviewed the current supply of retail space. Tables 29 and 30 combine the “demand” and “supply” data to calculate the amount of retail space (gross leasable area in square feet) sup‐portable within the Market Area. Table 29 calculates demand for neighborhood goods and ser‐vices, while Table 30 calculates demand for selected shopping and specialty retail goods and services. The figures utilized for the calculations reflect the amount of dollars spent on consumer goods and services (from consumer expenditure reports from ESRI, Inc.), the estimated median per square foot sales for neighborhood retail centers (from Dollars and Cents of Shopping Centers, Urban Land Institute), and the estimated current supply of retail space in the Market Area (from MNCAR database, the Hennepin County Assessor and field work by Maxfield Research Inc.). Also shown in the Tables is a calculation for “net leakage.” Net leakage is the amount of con‐sumer spending for convenience goods and services that is likely to be spent outside of the Market Area. (Retail space in the Market Area is estimated to be capturing roughly 50% of the total retail expenditures for neighborhood goods by Market Area residents, and only about 35% of shopping and specialty goods). This calculation is based on the proportion of consumer ex‐penditures by Market Area residents being captured by retail space in the area from the retail gaps analysis. The net leakage figures in the demand tables are based on the estimated leakage after new space would be added in the Market Area, estimated at 35% for neighborhood retail and 65% for specialty retail. While leakage would be less once additional space is added in the Market Area, it would still be significant, especially for shopping and specialty goods, as many Market Area residents will continue to consistently purchase items at centers located outside of the Market Area.

RETAIL MARKET ANALYSIS
MAXFIELD RESEARCH INC. 81
The following bullet points summarize our demand calculations presented in Tables 29 and 30. Neighborhood Retail
Table 29 calculates demand for neighborhood retail space in Downtown Mound and shows a total population in the Retail Market Area of 38,419 people in 2013. Based on our analysis of consumer expenditure data, we estimate that consumer expenditures for the types of neighborhood goods and services that could be purchased in Downtown Mound are $3,581 per person (26% of per capita total expenditures for retail goods). Per capita expenditures used in Table 29 are obtained from the Consumer Expenditures table. The categories for neighborhood retail are food away from home, alcoholic beverages, personal care products, over the counter drugs, prescription drugs, housekeeping supplies, small appliances, miscel‐laneous household equipment, and books/magazines/newspapers. Multiplying $3,581 by 38,419 people results in total retail sales of $137.6 million. However, factoring in leakage of retail dollars spent by Market Area residents to centers outside of the Market at 50%, the total demand in the Market Area is reduced to $68.8 million.
Next, the $62.5 million being generated by existing neighborhood retail space for these types of neighborhood goods is subtracted from total demand. This results in excess de‐mand for $6.3 million in expenditures for neighborhood goods and services. Dividing the potential to capture an additional $6.3 million in expenditures by the average sales per square foot of retail space ($250), we calculate demand in the Market Area for about 25,160 square feet in 2013.
In 2020, we project the Market Area to grow to 42,692 people (or an increase of 4,273 peo‐ple from 2013). With the increase in population, we project retail demand to increase to 77,789 square feet in the Market Area in 2020.
Downtown Mound will compete with other areas in the Market Area for new retail stores over the decade including Orono, Shorewood, Maple Plain and Excelsior. Besides competi‐tion from these other communities, no one location will be able to capture 100% of the re‐tail demand. We estimate that Downtown Mound can capture 5% to 10% of the neighbor‐hood retail demand, or 5,000 to 6,300 square feet in 2013.
We estimate that the capture rate for neighborhood retail Downtown will remain the same through 2020, because the projected population growth will be primarily outside of Mound. We project neighborhood retail demand to increase to 16,000 to 19,000 square feet in 2020.
The figures above exclude uses for vehicle repair and maintenance, gasoline purchases and gro‐cery stores.
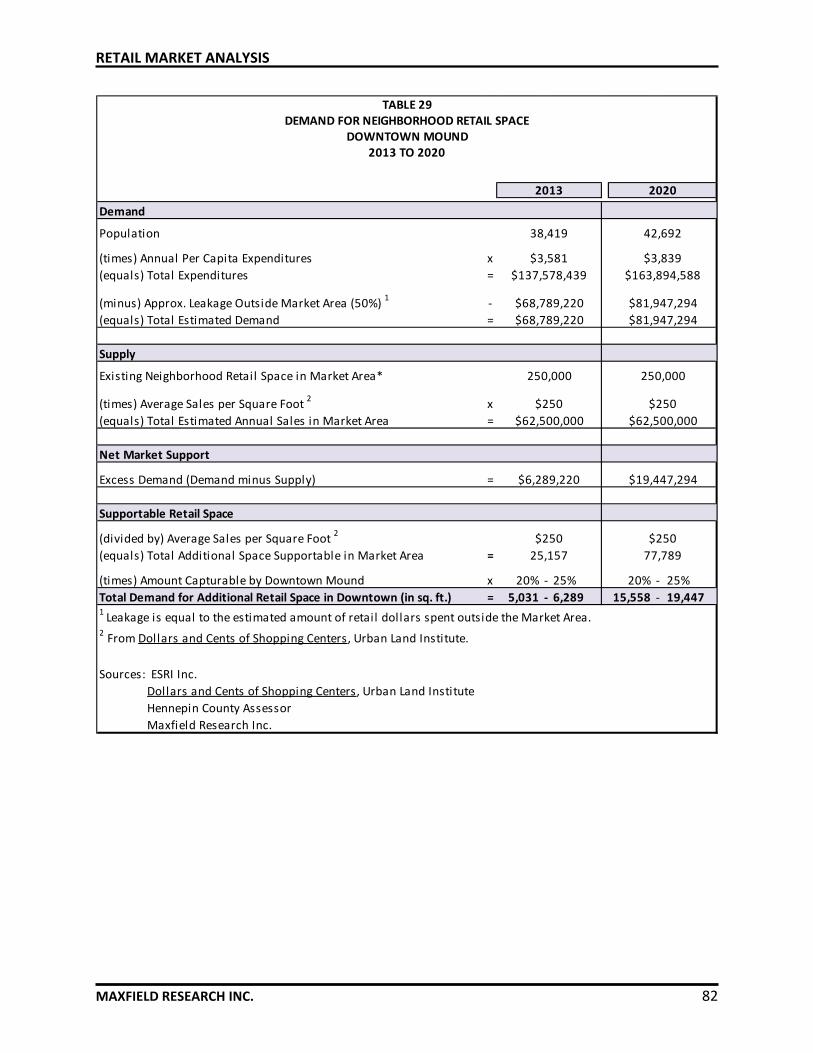
RETAIL MARKET ANALYSIS
MAXFIELD RESEARCH INC. 82
Demand
Population
(times) Annual Per Capita Expenditures x
(equals) Total Expenditures =
(minus) Approx. Leakage Outside Market Area (50%) 1
‐
(equals) Total Estimated Demand =
Supply
Existing Neighborhood Retail Space in Market Area*
(times) Average Sales per Square Foot 2
x
(equals) Total Estimated Annual Sales in Market Area =
Net Market Support
Excess Demand (Demand minus Supply) =
Supportable Retail Space
(divided by) Average Sales per Square Foot 2
(equals) Total Additional Space Supportable in Market Area =
(times) Amount Capturable by Downtown Mound x 20% ‐ 25% 20% ‐ 25%
Total Demand for Additional Retail Space in Downtown (in sq. ft.) = 5,031 ‐ 6,289 15,558 ‐ 19,4471 Leakage is equal to the estimated amount of retail dollars spent outside the Market Area.
2 From Dollars and Cents of Shopping Centers, Urban Land Institute.
Sources: ESRI Inc.
Dollars and Cents of Shopping Centers, Urban Land Institute
Hennepin County Assessor
Maxfield Research Inc.
TABLE 29DEMAND FOR NEIGHBORHOOD RETAIL SPACE
DOWNTOWN MOUND2013 TO 2020
2020
$250
25,157
2013
$68,789,220
250,000
$250
$62,500,000
38,419
$3,581
$137,578,439
250,000
42,692
$3,839
$163,894,588
$6,289,220
$68,789,220
$250
77,789
$250
$62,500,000
$19,447,294
$81,947,294
$81,947,294

RETAIL MARKET ANALYSIS
MAXFIELD RESEARCH INC. 83
Shopping and Specialty Retail
We identified several categories of shopping and specialty goods (italicized in Table 26) from which Downtown Mound could capture a portion of sales from the Market Area. Some shopping and specialty goods are sold in large stores that physically would not fit well in the Downtown, such as furniture, major appliances and cars. Apparel is generally sold in regional shopping centers or community centers where there is a greater selection of stores for consumers to comparison shop. We did not however, exclude apparel expenditures for these categories of goods from the calculations. Multiplying the average per capita expend‐itures for the selected retail categories ($2,044) by the Market Area’s population (38,419) results in total estimated sales in 2013 of $78 million in the Market Area.
The number of shopping and specialty retail stores is limited in the Market Area, and the majority of purchases for these types of goods by Market Area residents are made outside of the Market Area. Even with new space added, we estimate net leakage for shopping and specialty goods in Table 30 at 70% in the Market Area. Factoring in net leakage, total de‐mand for the shopping and specialty goods is estimated at $23.5 million in the Market Area.
We estimate that 20,000 square feet of space is occupied by the selected shopping and spe‐cialty goods retailers in the Market Area. Based on average sales per square foot of $250, this space generates the capacity for $5.0 million in sales in the Market Area. Subtracting this supply from demand results in excess demand for $18.5 million. Dividing the average sales per square foot of retail space, we calculate demand for about 80,000 square feet in the Market Area.
With a projected increase of 4,270 people in the Market Area to 2020, we project excess re‐tail demand to increase to 100,000 square feet in the Market Area in 2020.
Downtown Mound will compete with other areas in the Market Area for new shopping and specialty retail stores over the next five years and no one location will be able to capture 100% of the retail demand. Because some shopping and specialty goods retailers will seek unique space versus that offered by typical shopping centers, we believe that Downtown Mound can capture a greater percentage of Market Area demand than for neighborhood retail. We estimate that Downtown Mound can capture 15% of the shopping/specialty re‐tail demand from the Market Area or 12,000 square feet in 2013. Because of the projected increase in population by 2020, we estimate 15,000 square feet of shopping/specialty retail demand in Downtown Mound in 2018.
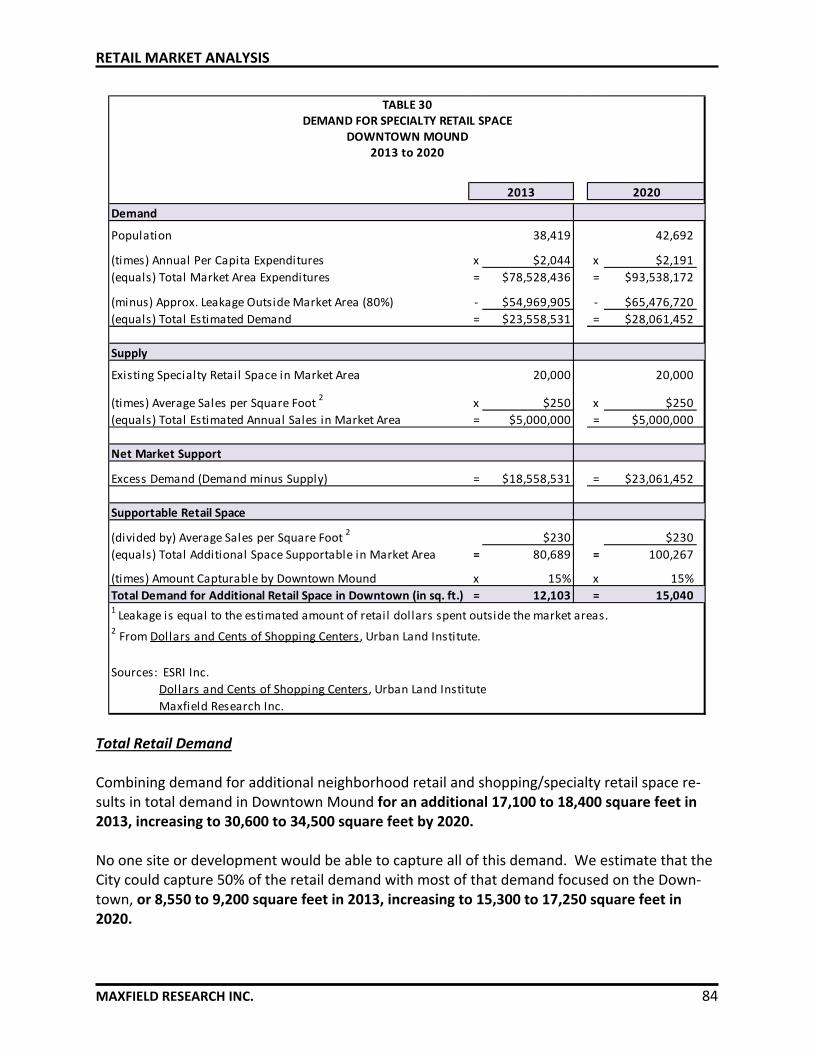
RETAIL MARKET ANALYSIS
MAXFIELD RESEARCH INC. 84
Demand
Population 38,419 42,692
(times) Annual Per Capita Expenditures x $2,044 x $2,191
(equals) Total Market Area Expenditures = $78,528,436 = $93,538,172
(minus) Approx. Leakage Outside Market Area (80%) ‐ $54,969,905 ‐ $65,476,720
(equals) Total Estimated Demand = $23,558,531 = $28,061,452
Supply
Existing Specialty Retail Space in Market Area 20,000 20,000
(times) Average Sales per Square Foot 2
x $250 x $250
(equals) Total Estimated Annual Sales in Market Area = $5,000,000 = $5,000,000
Net Market Support
Excess Demand (Demand minus Supply) = $18,558,531 = $23,061,452
Supportable Retail Space
(divided by) Average Sales per Square Foot 2
$230 $230
(equals) Total Additional Space Supportable in Market Area = 80,689 = 100,267
(times) Amount Capturable by Downtown Mound x 15% x 15%
Total Demand for Additional Retail Space in Downtown (in sq. ft.) = 12,103 = 15,0401 Leakage is equal to the estimated amount of retail dollars spent outside the market areas.
2 From Dollars and Cents of Shopping Centers, Urban Land Institute.
Sources: ESRI Inc.
Dollars and Cents of Shopping Centers, Urban Land Institute
Maxfield Research Inc.
20202013
TABLE 30DEMAND FOR SPECIALTY RETAIL SPACE
DOWNTOWN MOUND2013 to 2020
Total Retail Demand Combining demand for additional neighborhood retail and shopping/specialty retail space re‐sults in total demand in Downtown Mound for an additional 17,100 to 18,400 square feet in 2013, increasing to 30,600 to 34,500 square feet by 2020. No one site or development would be able to capture all of this demand. We estimate that the City could capture 50% of the retail demand with most of that demand focused on the Down‐town, or 8,550 to 9,200 square feet in 2013, increasing to 15,300 to 17,250 square feet in 2020.
RETAIL MARKET ANALYSIS
MAXFIELD RESEARCH INC. 85
Retail Findings and Recommendations Key findings of the research for retail development in the Downtown are:
Since 2003, existing businesses in Mound have expanded and built new space including the grocery store, hardware store, Walgreens and some others. Other service businesses have relocated to new space or have left the area. Although there has been a net increase the amount of retail space dedicated to these businesses, interviews with local businesses own‐ers indicated that the customer base has increased only modestly.
Mound has primarily neighborhood businesses that provide for most of the daily needs of the local household base. If it is not found in Mound, then most households will travel fur‐ther to a location where there is a higher concentration of retail, primarily to the Ridgedale area or beyond.
New retail space in Mound is attractive and occupied. Older retail space is partially occu‐pied and some of the older retail space has converted over to primarily service businesses that may or may not be retail‐oriented. At this time, there is an excess supply of retail space in Mound.
While older retail space often provides lower lease rates attractive for new start‐up busi‐nesses, below market lease rates also may lead to properties that are struggling financially and/or have fewer reserves for upgrades.
Strong retail businesses are less likely to locate in centers that are vacant or experiencing deferred maintenance because of the potential signal that may give to customers. Although new retail can be supported in the community, vacant space that is undesirable often re‐mains vacant for longer periods of time.
New businesses to the community should enhance the existing mix of businesses not dupli‐cate it. Although competition is generally good, too much of the same type of business that is not sufficiently differentiated will often divide the customer base among them and could cause all of the businesses to struggle financially.
High average household incomes and projected growth to the west will continue to provide additional customers for Downtown Mound.
The Lost Lake Channel that connects the Downtown with Lake Minnetonka is an amenity that creates the potential to attract some specialty retailers who seek unique locations. To date however, the Channel has not optimized its potential to attract visitors to the Down‐town. This could be because there is not a destination that people want to come to. A des‐tination use in the Downtown along with increased promotion of Downtown’s attributes is needed to encourage visitors to make the extra effort up the Channel.

RETAIL MARKET ANALYSIS
MAXFIELD RESEARCH INC. 86
The Dakota Trail offers, we believe, a stronger opportunity to attract regular visitors to Mound than perhaps the Channel.
The research indicates that most potential retailers will be smaller in size (under about 3,000 square feet) and they will primarily be oriented to serve the local population base.
Appropriate Types of Retail in Downtown Mound The greatest retail demand in Downtown Mound is for stores serving the local population with goods and services they purchase more frequently (“neighborhood retail”) and this segment is essentially being served in Mound today by existing businesses. Mound continues to be underserved with eating establishments. The new café/bistro that has just broken ground will add to the food service mix. Residents continue to want more restau‐rant variety and a full‐service sit down restaurant that would serve at least beer and wine with a meal. Other comments received through interviews include a moderately priced gift store, a shoe store, health and wellness products, sporting goods equipment and teen/young adult clothing i.e. (Main Street Outfitters, Heartbreaker or similar). Examples of the types of retail that have potential in the Downtown District are listed in Table 31, along with the median size (square feet) for each type of store. The table identifies some types of retail outlets that we believe would enhance the mix in the Downtown and not canni‐balize store sales of existing businesses to a significant degree. While competition can be good, allowing the retail market to balance itself often does not work and can wreak significant havoc on a small Downtown’s fragile economy.

RETAIL MARKET ANALYSIS
MAXFIELD RESEARCH INC. 87
Median Median
Retail Uses: Sq. Ft. Retail Uses: Sq. Ft.
Cards & Gifts 2,000 Women's Clothing 4,000
Restaurant with Liquor 3,500 Arts & Crafts 2,200
Cosmetics/Beauty Supplies 1,250 Teen Clothing 4,000
Specialty food 1,950 Day Spa 2,000
Frozen Yogurt 1,500 Decorative accessories 1,650
Sporting Goods 5,000 Eyeglasses‐optician 1,400
Tailor 900 Shoes 2,500
Tanning Salon 1,250 Hobby 2,800
Weight Loss Center 1,300 Home accessories 2,000
Photographer 1,200
Picture Framing 1,250
Dance Studio 2,500
Sources: Urban Land Institute: Dollars and Cents of Shopping Centers
Maxfield Research Inc.
Neighborhood‐Oriented Specialty Retail
TABLE 31
RETAIL USES BY MEDIAN SIZE OF STORE
POTENTIAL RETAILERS FOR DOWNTOWN MOUND
June 2013
In addition to retail stores, some professional service businesses will seek out retail space. These include businesses such as a bank, travel agent, financial planner, insurance agent, etc. Retail Lease Rates To be attractive to potential neighborhood‐oriented tenants, new retail space in the Downtown is likely to require net lease rates of between $18.00 and $22.00 per square foot. Format and location are factors in determining the lease rate to be paid. Locations for New Retail Demand was calculated for a total of about 30,600 to 34,500 square feet of retail space in the Mound Trade Area by 2020. Because of limited land and the fact that no one location or pro‐ject can capture 100% of demand, we estimate that Downtown Mound could capture approxi‐mately 9,200 square feet as of 2013, increasing to 17,250 square feet by 2020. The Mound Harbor District will not be able to capture all of demand for retail in Downtown Mound over the next five years. There are other parcels with excellent access and good visibil‐ity in the Downtown that will also be appealing to retailers.

OFFICE MARKET ANALYSIS
MAXFIELD RESEARCH INC. 88
Introduction This section of the report calculates the potential demand for new office development in Down‐town Mound by examining employment and business growth trends, office market conditions in the surrounding area and the existing supply of office space in the Mound Market Area.
Market Area Definition The majority of demand for office space in Downtown Mound will be from businesses serving the growing local household and business base. These users include insurance agents, attor‐neys, architects, graphic designers, real estate agents, accountants, financial planners, banks, dentists, chiropractors and medical offices. Most are small businesses with fewer than 10 em‐ployees, requiring spaces of less than 2,000 square feet. In addition, there is potential for Downtown Mound to attract small professional businesses, including those that are likely to have a local franchise and may want to operate a local affiliate office in the area. Mound and the surrounding communities tend to have a higher proportion of executives and owners of white collar businesses. As shown previously however, many of these individuals currently commute outside of Mound for their work and/or have a home office from which they operate their business. Businesses that may seek to locate an office in the Downtown would be those that tend to have high customer volumes where customers seek them out and usually visit them at their place of business. This includes real estate agents, accountants, health care pro‐fessionals, attorneys and financial advisors. Mound’s potential to attract larger office users (i.e., corporate headquarters) is limited because of the lack of available land and limited high profile sites and distance from a major freeway. The map on the following page represents the Market Area from which new office develop‐ment in Downtown Mound would draw the majority of its tenants. The Office draw area is the same as Mound’s Retail draw area.

OFFICE MARKET ANALYSIS
MAXFIELD RESEARCH INC. 89
Mound Office Draw Area
Employment and Business Growth Overall Employment Growth Table 32 presents total employment growth trends and projections in the Market Area from 2000 to 2030. Table 33 shows the estimated percent of total employment that would likely oc‐cupy office space. The figures were compiled by Maxfield Research Inc. using data from the Metropolitan Council, Minnesota Department of Employment and Economic Development and the US Bureau of Labor Statistics.
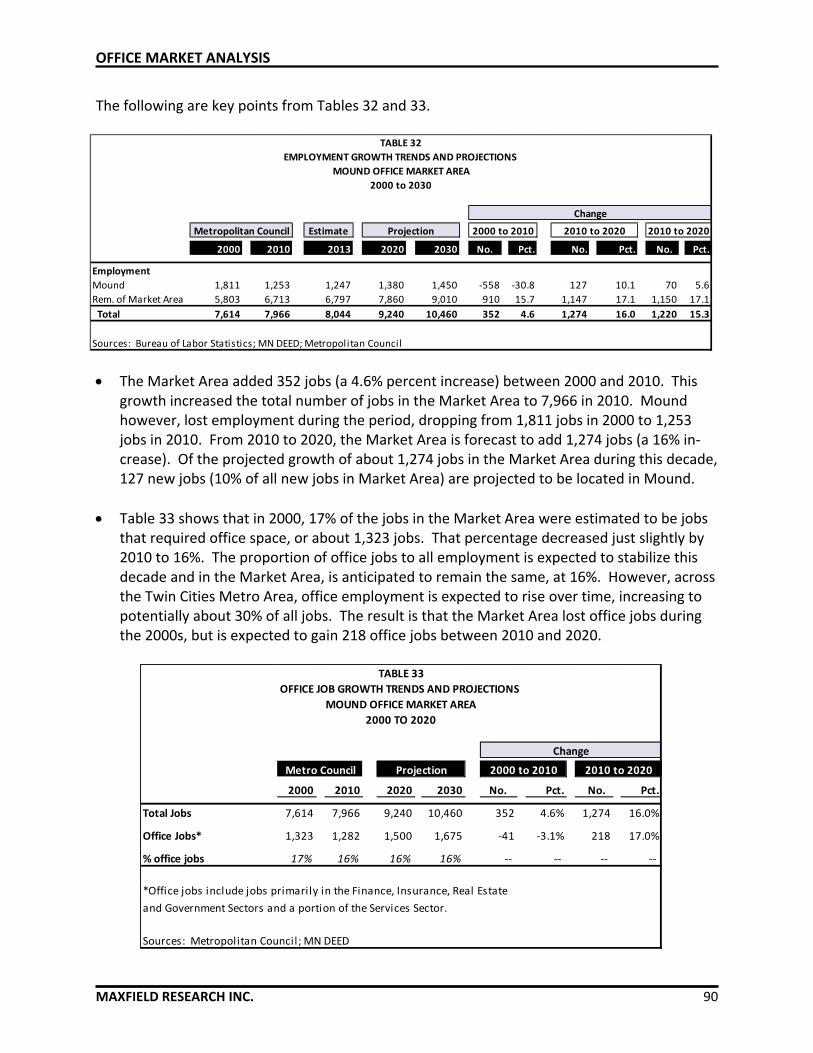
OFFICE MARKET ANALYSIS
MAXFIELD RESEARCH INC. 90
The following are key points from Tables 32 and 33.
EMPLOYMENT GROWTH TRENDS AND PROJECTIONS
MOUND OFFICE MARKET AREA
2000 to 2030
Change
Estimate
2000 2010 2013 2020 2030 No. Pct. No. Pct. No. Pct.
Employment
Mound 1,811 1,253 1,247 1,380 1,450 ‐558 ‐30.8 127 10.1 70 5.6
Rem. of Market Area 5,803 6,713 6,797 7,860 9,010 910 15.7 1,147 17.1 1,150 17.1
Total 7,614 7,966 8,044 9,240 10,460 352 4.6 1,274 16.0 1,220 15.3
Sources: Bureau of Labor Statistics; MN DEED; Metropolitan Council
TABLE 32
Metropolitan Council Projection 2000 to 2010 2010 to 20202010 to 2020
The Market Area added 352 jobs (a 4.6% percent increase) between 2000 and 2010. This growth increased the total number of jobs in the Market Area to 7,966 in 2010. Mound however, lost employment during the period, dropping from 1,811 jobs in 2000 to 1,253 jobs in 2010. From 2010 to 2020, the Market Area is forecast to add 1,274 jobs (a 16% in‐crease). Of the projected growth of about 1,274 jobs in the Market Area during this decade, 127 new jobs (10% of all new jobs in Market Area) are projected to be located in Mound.
Table 33 shows that in 2000, 17% of the jobs in the Market Area were estimated to be jobs that required office space, or about 1,323 jobs. That percentage decreased just slightly by 2010 to 16%. The proportion of office jobs to all employment is expected to stabilize this decade and in the Market Area, is anticipated to remain the same, at 16%. However, across the Twin Cities Metro Area, office employment is expected to rise over time, increasing to potentially about 30% of all jobs. The result is that the Market Area lost office jobs during the 2000s, but is expected to gain 218 office jobs between 2010 and 2020.
OFFICE JOB GROWTH TRENDS AND PROJECTIONS
MOUND OFFICE MARKET AREA
2000 TO 2020
Change
2000 2010 2020 2030 No. Pct. No. Pct.
Total Jobs 7,614 7,966 9,240 10,460 352 4.6% 1,274 16.0%
Office Jobs* 1,323 1,282 1,500 1,675 ‐41 ‐3.1% 218 17.0%
% office jobs 17% 16% 16% 16% ‐‐ ‐‐ ‐‐ ‐‐
*Office jobs include jobs primarily in the Finance, Insurance, Real Estate
and Government Sectors and a portion of the Services Sector.
Sources: Metropolitan Council; MN DEED
Projection 2000 to 2010 2010 to 2020
TABLE 33
Metro Council

OFFICE MARKET ANALYSIS
MAXFIELD RESEARCH INC. 91
Office space sizes are starting to decrease, at least among major companies. Previously, the industry standard was approximately 200 square feet of office space per employee. We have reduced this figure to 180 square feet of office space to reflect what we project will be a decrease in the amount of office space per employee as companies become more efficient in terms of their space planning. Therefore, projected growth of 218 office jobs between 2010 and 2020 would result in an estimated 39,240 square feet of office space needed to accommodate these new employees. The actual amount of office space needed, however, would likely be less, because a portion of the office jobs would be from people working from home offices and some typical office users will choose to locate in retail space.
Growth of Businesses that Primarily Occupy Office Space Table 34 shows the number of businesses by size of business (number of employees) in the in‐dustry sectors (NAICS) that are typical office users. These include Information; Finance & Insur‐ance; Real Estate, Rental & Leasing; Professional, Scientific, & Technical Services; Management of Companies & Enterprises; and Health Care & Social Assistance. The data are for Zip Code 55364 (which includes Mound and Minnetrista) and three other Zip Codes that encompass an area roughly the same as the Market Area. The data in Table 34 is for 2011, the most current year available, and is from the U.S. Depart‐ment of Commerce; County Business Patterns. Business growth in these sectors is an important indicator of total demand for office space and the size of businesses provides an indication of the type and sizes of office spaces required. In addition to businesses in these sectors, a small amount of office demand will be generated from other sectors, including government agencies. The follow are key points from Table 34.
The six business categories in the table contain a total of 217 businesses, with most (89, or 41%) being in the Professional, Scientific & Technical Services category – which includes law, accounting, and finance. This figure represents a growth of 42% since 2003. As shown, 89% of Professional, Scientific, and Technical businesses had fewer than five employees with the largest firm having between 20 and 49 employees.
Of the 217 businesses in the table, 80% had fewer than five employees, 17% had between five and 49 employees, and 3% had 50 or more employees. Based on this information, it appears that the majority of office users in the area would require smaller spaces and it is likely that many of the smallest businesses are single workers working out of their homes. They may have a larger company to which they are affiliated in some manner. Assuming that office employees occupy an average of 180 square feet of office space (including com‐mon areas), most companies in the area would need less than 1,000 square feet, and only a few would need more than 2,000 square feet.
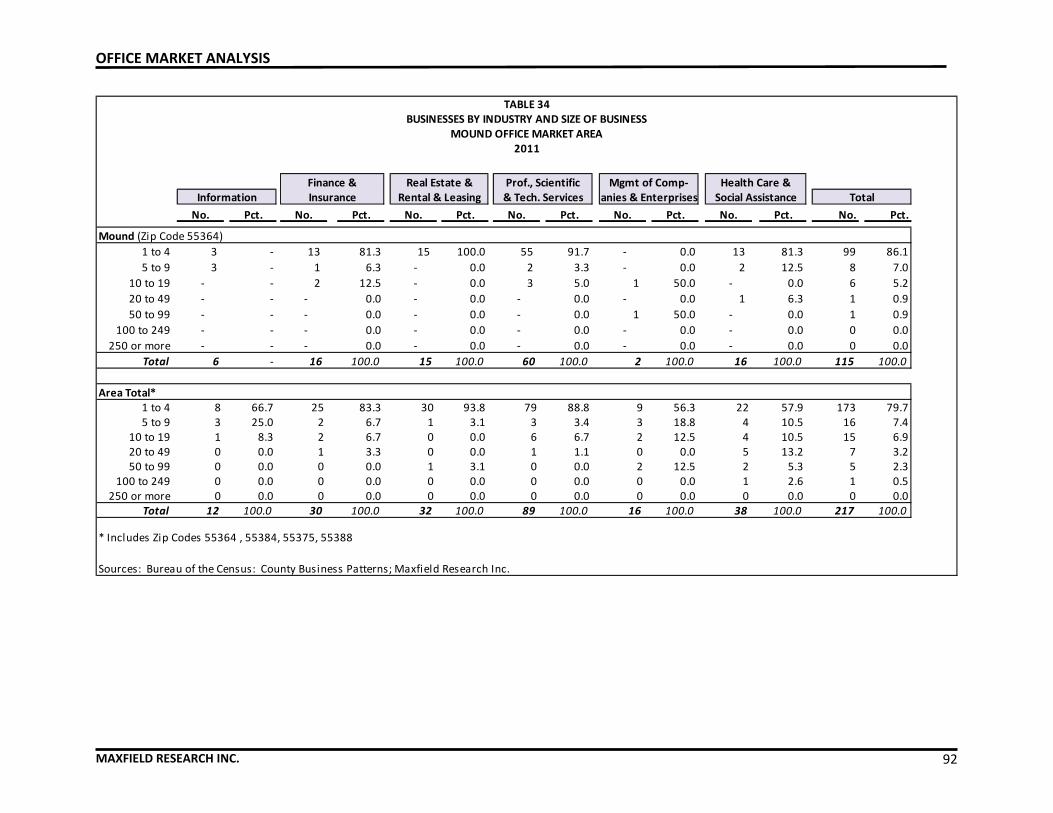
OFFICE MARKET ANALYSIS
MAXFIELD RESEARCH INC. 92
No. Pct. No. Pct. No. Pct. No. Pct. No. Pct. No. Pct. No. Pct.
Mound (Zip Code 55364)
1 to 4 3 ‐ 13 81.3 15 100.0 55 91.7 ‐ 0.0 13 81.3 99 86.1
5 to 9 3 ‐ 1 6.3 ‐ 0.0 2 3.3 ‐ 0.0 2 12.5 8 7.0
10 to 19 ‐ ‐ 2 12.5 ‐ 0.0 3 5.0 1 50.0 ‐ 0.0 6 5.2
20 to 49 ‐ ‐ ‐ 0.0 ‐ 0.0 ‐ 0.0 ‐ 0.0 1 6.3 1 0.9
50 to 99 ‐ ‐ ‐ 0.0 ‐ 0.0 ‐ 0.0 1 50.0 ‐ 0.0 1 0.9
100 to 249 ‐ ‐ ‐ 0.0 ‐ 0.0 ‐ 0.0 ‐ 0.0 ‐ 0.0 0 0.0
250 or more ‐ ‐ ‐ 0.0 ‐ 0.0 ‐ 0.0 ‐ 0.0 ‐ 0.0 0 0.0
Total 6 ‐ 16 100.0 15 100.0 60 100.0 2 100.0 16 100.0 115 100.0
Area Total*1 to 4 8 66.7 25 83.3 30 93.8 79 88.8 9 56.3 22 57.9 173 79.75 to 9 3 25.0 2 6.7 1 3.1 3 3.4 3 18.8 4 10.5 16 7.4
10 to 19 1 8.3 2 6.7 0 0.0 6 6.7 2 12.5 4 10.5 15 6.920 to 49 0 0.0 1 3.3 0 0.0 1 1.1 0 0.0 5 13.2 7 3.2
50 to 99 0 0.0 0 0.0 1 3.1 0 0.0 2 12.5 2 5.3 5 2.3 100 to 249 0 0.0 0 0.0 0 0.0 0 0.0 0 0.0 1 2.6 1 0.5 250 or more 0 0.0 0 0.0 0 0.0 0 0.0 0 0.0 0 0.0 0 0.0
Total 12 100.0 30 100.0 32 100.0 89 100.0 16 100.0 38 100.0 217 100.0
* Includes Zip Codes 55364 , 55384, 55375, 55388
Sources: Bureau of the Census: County Business Patterns; Maxfield Research Inc.
TotalMgmt of Comp‐ Health Care &
Information Insurance Rental & Leasing & Tech. Services anies & Enterprises Social AssistanceFinance & Real Estate & Prof., Scientific
TABLE 34BUSINESSES BY INDUSTRY AND SIZE OF BUSINESS
MOUND OFFICE MARKET AREA2011
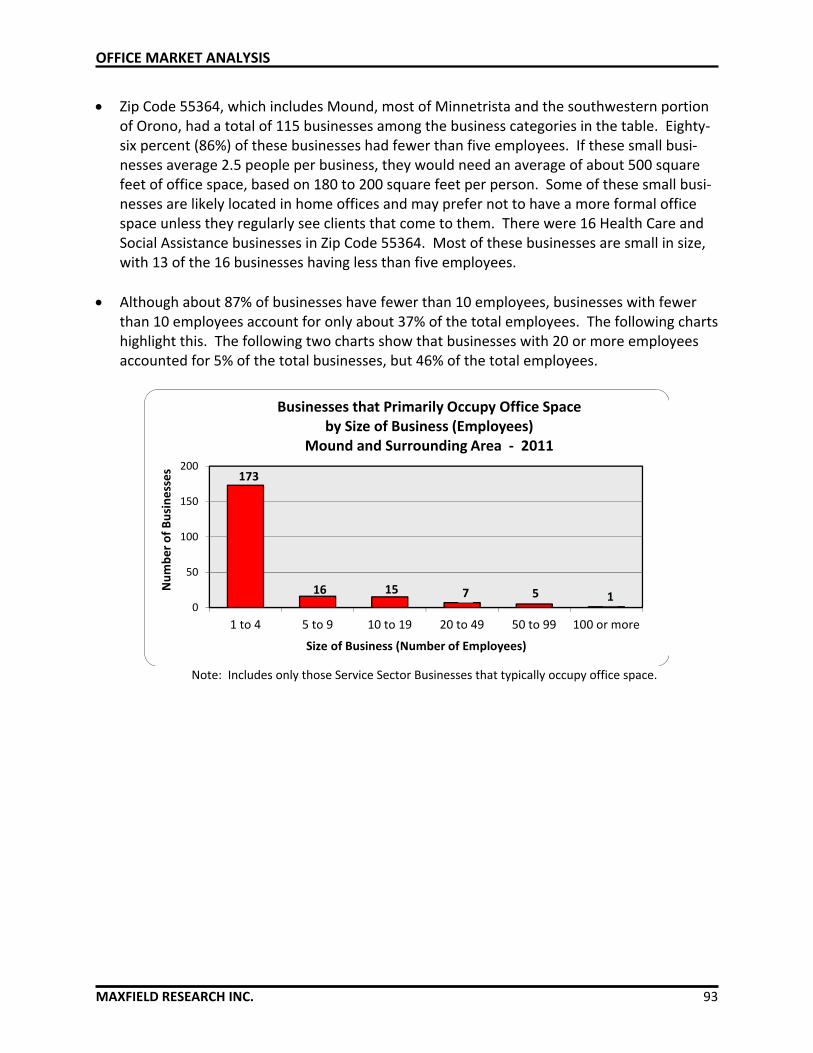
OFFICE MARKET ANALYSIS
MAXFIELD RESEARCH INC. 93
Zip Code 55364, which includes Mound, most of Minnetrista and the southwestern portion of Orono, had a total of 115 businesses among the business categories in the table. Eighty‐six percent (86%) of these businesses had fewer than five employees. If these small busi‐nesses average 2.5 people per business, they would need an average of about 500 square feet of office space, based on 180 to 200 square feet per person. Some of these small busi‐nesses are likely located in home offices and may prefer not to have a more formal office space unless they regularly see clients that come to them. There were 16 Health Care and Social Assistance businesses in Zip Code 55364. Most of these businesses are small in size, with 13 of the 16 businesses having less than five employees.
Although about 87% of businesses have fewer than 10 employees, businesses with fewer than 10 employees account for only about 37% of the total employees. The following charts highlight this. The following two charts show that businesses with 20 or more employees accounted for 5% of the total businesses, but 46% of the total employees.
173
16 15 7 5 10
50
100
150
200
1 to 4 5 to 9 10 to 19 20 to 49 50 to 99 100 or more
Number of Businesses
Size of Business (Number of Employees)
Businesses that Primarily Occupy Office Spaceby Size of Business (Employees)
Mound and Surrounding Area ‐ 2011
Note: Includes only those Service Sector Businesses that typically occupy office space.

OFFICE MARKET ANALYSIS
MAXFIELD RESEARCH INC. 94
389
100
195 210
325
125
0
200
400
1 to 4 5 to 9 10 to 19 20 to 49 50 to 99 100 or more
Employees
Size of Business (Employees)
Employees Occupying Office Space by Size of BusinessMound and Surrounding Area ‐ 2011
Note: Includes only those Service Sector Businesses that typically occupy office space.
The chart below shows an estimate of the total amount of office space needed to accom‐modate the businesses listed in Table 34 by size of business. The figures assume that em‐ployees occupy an average of 200 square feet of office space. The chart shows that about 191,000 square feet is needed to accommodate all of the businesses. However, many of the businesses with between one and four employees are likely operated from private homes, thereby reducing total office needs to closer to 134,000 square feet.
77,850
20,000
39,000 42,000
65,000
25,000
0
30,000
60,000
90,000
1 to 4 5 to 9 10 to 19 20 to 49 50 to 99 100 ormore
Square Feet
Size of Business (Employees)
Office Space by Size of BusinessMound and Surrounding Area ‐ 2011
Based on 180 to 200 square feet of office space per employee, businesses with between
five and nine employees would require about 1,000 to 1,700 square feet of office space, businesses with between 10 and 19 employees would require 1,800 to about 3,800 square feet, and businesses with 20 to 49 employees would require between 3,600 and 9,800 square feet. We believe that office‐related businesses with fewer than 20 employees will constitute the greatest demand for office space in Downtown Mound.

OFFICE MARKET ANALYSIS
MAXFIELD RESEARCH INC. 95
Current Office Market Situation in the Mound Market Area Table 35 displays information on seven selected office buildings in or near Mound, including two in Wayzata and two in Spring Park. Information on these buildings was collected by Maxfield Research Inc. through the MNCAR database in May 2013. The table displays the build‐ing address, age, total space, square feet available, lease rate and tenant mix. The following are key points from the table.
The table displays information on eight multitenant office buildings in Mound, Wayzata and Shorewood. The types of buildings shown are generally smaller in size (less than 20,000 square feet) and have tenants that are representative of the types of businesses that are likely to use office space in Mound. Two of the buildings have been recently renovated and updated. Businesses such as insurance agents, financial advisors, attorneys, real estate agents, accountants, small professional service businesses, small medical offices and other small health practitioners are most likely to be a market for office space in Mound. Tenant information was not available for some of the buildings on the table. The majority tend to serve a local customer base.
Except for the two buildings in Mound, the remaining buildings shown are all located east of Mound. Downtown Wayzata currently has a substantial number of smaller size buildings that have office space available. As the Metro Area continues to grow to the west, Mound may be able to capture a portion of office space demand as the household and business ba‐ses increase. We note however, that demand for office space in the short‐term is expected to be modest. Existing spaces may be upgraded, but demand for new multitenant office space in Mound at rents in excess of $15.00 per square foot will be limited.
The sizes of the office buildings shown on the table range from 4,000 square feet to 33,330 square feet. Commerce Place currently has about 16,000 square feet of space available as office but is only marketing 7,000 square feet. Other spaces available range in size from 860 to 10,000 square feet. The vacant space available could accommodate businesses with sizes ranging from about three employees to 50 employees A space size of 4,000 square feet could accommodate approximately 20 employees. Though the majority of businesses will have five employees or less, we project that this is about the size of some businesses that would be attracted to new office space in Downtown Mound. Larger businesses with 50 or more employees are likely to seek traditional office space with good highway access and vis‐ibility that has adjacent surface parking for their employees.
Commerce Place, located in Mound, is the largest office building in Mound, but this space can also be easily converted to retail space. The retail portion of the center has 7,000 va‐cant square feet and owners are seeking a lease rate of $15.00 net per square foot.

OFFICE MARKET ANALYSIS
MAXFIELD RESEARCH INC. 96
Year Total Space/ Net Lease
Building/Address Built SF Available Rate
407 Lake Street E. 1960 4,000 $20.00 Minnetonka Travel
407 Lake street 1,333 Net
Wayzata
Commerce Place 1986 40,358 $10.00 Christopher and Banks
2200‐2238 Commerce Blvd. 7,000 Net Happy Garden
Mound V & S Jewelry and Gifts
Garagedale
Beacon Bank Building 1996 19,800 $22.00/ Beacon Bank
19765 Highway 7 860 $23.00 Architecture Firm
Shorewood Net
Laurent Building 2001 4,000 $18.00‐
155 East Lake Street 4,000 $26.00
Wayzata Net
201 Building 1997 33,330 $19.00‐ Burnet Title Sawhorse Designers/Builders
201 E. Lake Street 10,000 $20.00 Coldwell Banker Burnet Vanderlinde Group
Wayzata Net Heislett Associates Wayzata Appliances Inc.
Ps Real Estate Services Robin Carlson Real Estate
Steiner Office Building 1986 10,278 $15.00 August Financial Consulting
3610 Co. Rd. 101 S. 5,307 Net Counselor Realty
Wayzata Solyst
Gass
Commerce Building 1957 6,300 $6.00‐$10.00 Law Offices
2321 Commerce Blvd. 6,300 Net Tonka Carpet Care
Mound
Linden Park 1915R 5,565 $14.00 Watertown Pharmacy West Chiropractic
6140 Lake Linden Dr. 1,693 Net Catalyst Medical Clinic Curves for Women
Shorewood Pro Rehab Sully's Deli & Coffee
Carver Eye Care Mound Psychological Services
R=Renovated
Source: Maxfield Research Inc.
Tenants
TABLE 35
SELECTED OFFICE BUILDINGS
MOUND AND SURROUNDING AREA
May 2013

OFFICE MARKET ANALYSIS
MAXFIELD RESEARCH INC. 97
Net rents in the office buildings range from $10.00 per square foot to a high of $26.00 per square foot. Because of construction and land costs, most new space would require rents at a minimum of about $18.00 per square foot net to be financially feasible.
In Mound, office rents are low as office space has been difficult to lease and Commerce Place lost its medical tenant when they relocated to another center. For good quality space, we estimate that tenants would be likely to pay about $14.00 to $18.00 per square foot but likely not much higher. It may be beneficial to consider renovating existing space with some upgrades and pushing the rents modestly versus constructing new office space at this time.
It is our opinion that new office space would have to be a build‐to‐suit situation where the user would essentially build and self‐occupy the space or with some modest assistance from the City through a TIF District.
Planned and Pending Office Developments At this time, we are not aware of any pending office developments in the Market Area. The Promenade of Wayzata is planning on incorporating a small amount of office space into the de‐velopment, but no specifics have been publicized at this time.
Projected Demand for Office Space Earlier sections of the Office Market Analysis focused on factors that influence the demand for office space, including business and employment growth and current market conditions. The amount (in square feet) of additional office space supportable in the Downtown is based on projected office employment growth in the Market Area which is expected to remain some‐what weak in the short‐term. In addition, most of the new business growth has occurred as a result of the downturn in the employment market with many people going out on their own af‐ter losing their jobs. A substantial portion of these individuals work out of their homes. The demand calculations are presented in Table 36 and are summarized in the following bullet points.
The Market Area is projected to add 218 jobs that will require office space between 2010 and 2020. Our growth projection is based on the assumption that new office space will be constructed in the Market Area to support business and employment growth.
Using an industry standard of 180 square feet of office space per employee, on average, we project demand for 39,240 square feet of office space in the Market Area between 2010 and 2020 to accommodate office employment growth. This figure assumes that a variety of office spaces in a variety of locations will be available to meet the needs of prospective ten‐ants.
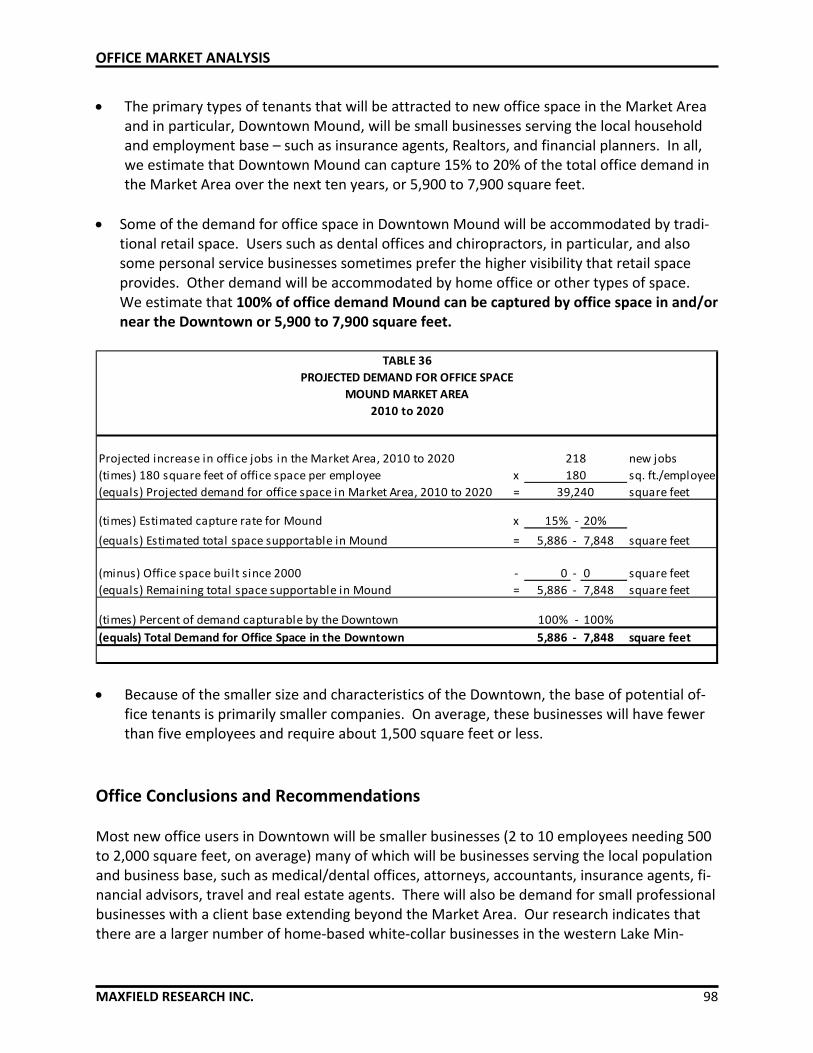
OFFICE MARKET ANALYSIS
MAXFIELD RESEARCH INC. 98
The primary types of tenants that will be attracted to new office space in the Market Area and in particular, Downtown Mound, will be small businesses serving the local household and employment base – such as insurance agents, Realtors, and financial planners. In all, we estimate that Downtown Mound can capture 15% to 20% of the total office demand in the Market Area over the next ten years, or 5,900 to 7,900 square feet.
Some of the demand for office space in Downtown Mound will be accommodated by tradi‐tional retail space. Users such as dental offices and chiropractors, in particular, and also some personal service businesses sometimes prefer the higher visibility that retail space provides. Other demand will be accommodated by home office or other types of space. We estimate that 100% of office demand Mound can be captured by office space in and/or near the Downtown or 5,900 to 7,900 square feet.
Projected increase in office jobs in the Market Area, 2010 to 2020 new jobs
(times) 180 square feet of office space per employee x sq. ft./employee
(equals) Projected demand for office space in Market Area, 2010 to 2020 = square feet
(times) Estimated capture rate for Mound x 15% ‐ 20%
(equals) Estimated total space supportable in Mound = 5,886 ‐ 7,848 square feet
(minus) Office space built since 2000 ‐ 0 ‐ 0 square feet
(equals) Remaining total space supportable in Mound = 5,886 ‐ 7,848 square feet
(times) Percent of demand capturable by the Downtown 100% ‐ 100%
(equals) Total Demand for Office Space in the Downtown 5,886 ‐ 7,848 square feet
218
180
39,240
TABLE 36
PROJECTED DEMAND FOR OFFICE SPACE
MOUND MARKET AREA
2010 to 2020
Because of the smaller size and characteristics of the Downtown, the base of potential of‐fice tenants is primarily smaller companies. On average, these businesses will have fewer than five employees and require about 1,500 square feet or less.
Office Conclusions and Recommendations Most new office users in Downtown will be smaller businesses (2 to 10 employees needing 500 to 2,000 square feet, on average) many of which will be businesses serving the local population and business base, such as medical/dental offices, attorneys, accountants, insurance agents, fi‐nancial advisors, travel and real estate agents. There will also be demand for small professional businesses with a client base extending beyond the Market Area. Our research indicates that there are a larger number of home‐based white‐collar businesses in the western Lake Min‐
OFFICE MARKET ANALYSIS
MAXFIELD RESEARCH INC. 99
netonka Area and a portion of these businesses may be interested in new office space – par‐ticularly office suites (which are geared toward businesses with only one to three employees). Type of Space Although there are a variety of office space types that may be appealing to these small busi‐nesses, the experience has been that most prefer to be located in traditional office space or in office suites, rather than office condominiums which have not been as successful in the Twin Cities market. Depending on the type of business, some prefer first floor retail space if they have a large walk‐in clientele. Because of the limited amount of office demand identified for the Downtown, we recommend that office development focus on providing traditional office space as a component of a larger development that may include retail and/or residential space. Leased office space: The majority of potential office users will be attracted to leased office space (excluding office suites) in either a stand‐alone building or as a component of a mixed‐use building. Nearly all of the medical offices will seek this type of space, as will many of the service businesses, such as attorneys, accountants, financial planners, etc. Retail Space: Some businesses that are traditionally considered users of office space will seek first‐floor retail space. These include personal service businesses that sometimes prefer the higher visibility that retail space provides. While not all of these potential types of businesses in Mound Harbor Renaissance will seek retail space, some will prefer to be in higher visibility loca‐tions where walk‐in traffic is important. Lease Rates To be competitive, new office space will need net lease rates of between $16.00 and $18.00 per square foot. This is about the minimum rent needed for new construction to be financially fea‐sible. Absorption We estimate that the amount of office space proposed could be developed within a period of five years. We recommend that the office space be located in a small freestanding building or in a mixed‐use building as the first floor of the property.
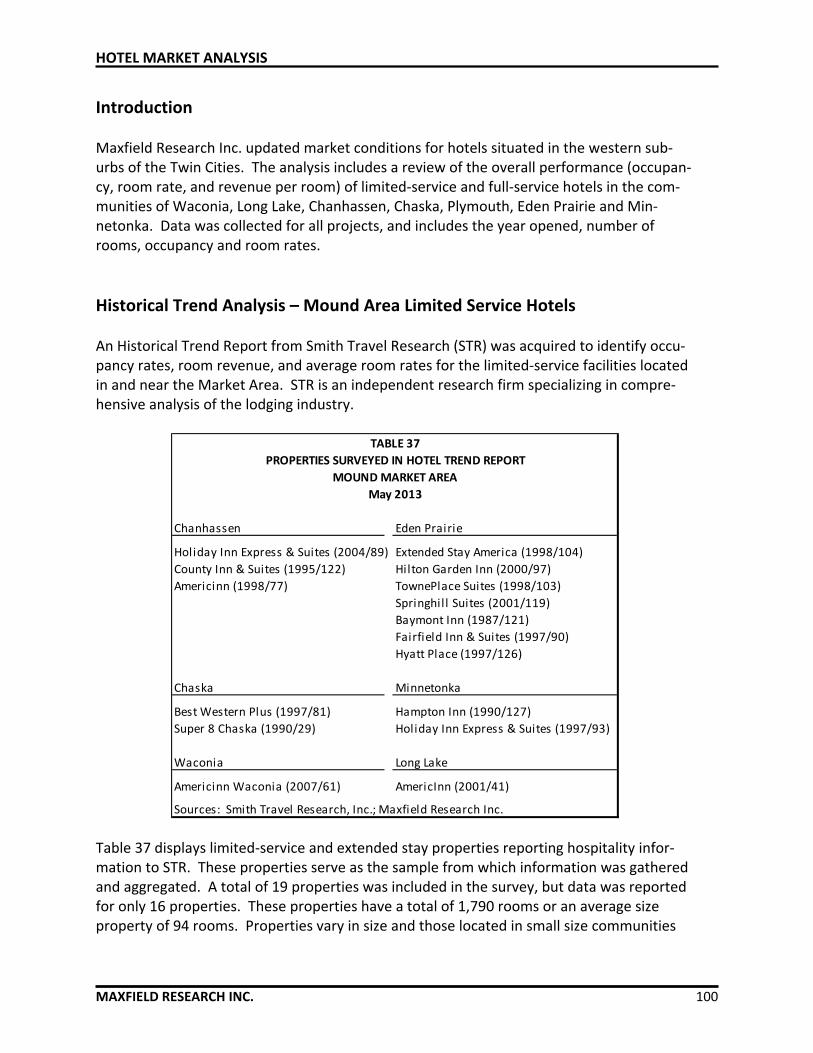
HOTEL MARKET ANALYSIS
MAXFIELD RESEARCH INC. 100
Introduction Maxfield Research Inc. updated market conditions for hotels situated in the western sub‐urbs of the Twin Cities. The analysis includes a review of the overall performance (occupan‐cy, room rate, and revenue per room) of limited‐service and full‐service hotels in the com‐munities of Waconia, Long Lake, Chanhassen, Chaska, Plymouth, Eden Prairie and Min‐netonka. Data was collected for all projects, and includes the year opened, number of rooms, occupancy and room rates.
Historical Trend Analysis – Mound Area Limited Service Hotels An Historical Trend Report from Smith Travel Research (STR) was acquired to identify occu‐pancy rates, room revenue, and average room rates for the limited‐service facilities located in and near the Market Area. STR is an independent research firm specializing in compre‐hensive analysis of the lodging industry.
Chanhassen Eden Prairie
Holiday Inn Express & Suites (2004/89) Extended Stay America (1998/104)
County Inn & Suites (1995/122) Hilton Garden Inn (2000/97)
Americinn (1998/77) TownePlace Suites (1998/103)
Springhill Suites (2001/119)
Baymont Inn (1987/121)
Fairfield Inn & Suites (1997/90)
Hyatt Place (1997/126)
Chaska Minnetonka
Best Western Plus (1997/81) Hampton Inn (1990/127)
Super 8 Chaska (1990/29) Holiday Inn Express & Suites (1997/93)
Waconia Long Lake
Americinn Waconia (2007/61) AmericInn (2001/41)
Sources: Smith Travel Research, Inc.; Maxfield Research Inc.
TABLE 37
PROPERTIES SURVEYED IN HOTEL TREND REPORT
MOUND MARKET AREA
May 2013
Table 37 displays limited‐service and extended stay properties reporting hospitality infor‐mation to STR. These properties serve as the sample from which information was gathered and aggregated. A total of 19 properties was included in the survey, but data was reported for only 16 properties. These properties have a total of 1,790 rooms or an average size property of 94 rooms. Properties vary in size and those located in small size communities
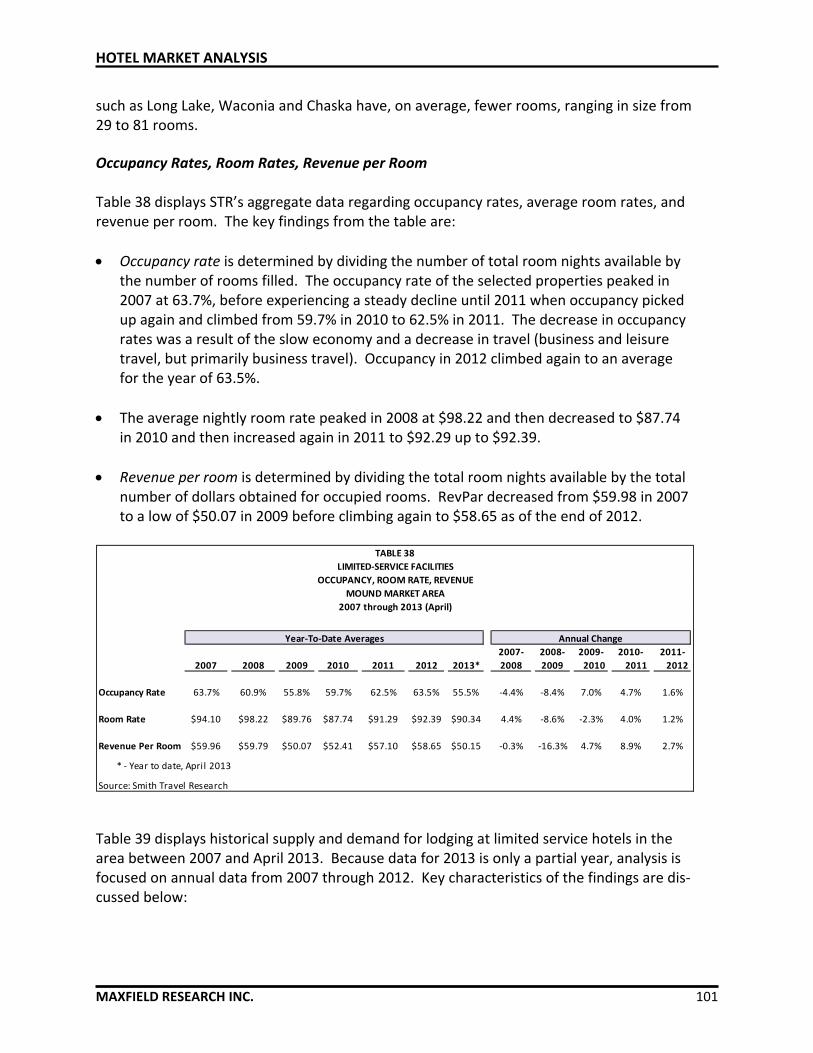
HOTEL MARKET ANALYSIS
MAXFIELD RESEARCH INC. 101
such as Long Lake, Waconia and Chaska have, on average, fewer rooms, ranging in size from 29 to 81 rooms. Occupancy Rates, Room Rates, Revenue per Room Table 38 displays STR’s aggregate data regarding occupancy rates, average room rates, and revenue per room. The key findings from the table are:
Occupancy rate is determined by dividing the number of total room nights available by the number of rooms filled. The occupancy rate of the selected properties peaked in 2007 at 63.7%, before experiencing a steady decline until 2011 when occupancy picked up again and climbed from 59.7% in 2010 to 62.5% in 2011. The decrease in occupancy rates was a result of the slow economy and a decrease in travel (business and leisure travel, but primarily business travel). Occupancy in 2012 climbed again to an average for the year of 63.5%.
The average nightly room rate peaked in 2008 at $98.22 and then decreased to $87.74 in 2010 and then increased again in 2011 to $92.29 up to $92.39.
Revenue per room is determined by dividing the total room nights available by the total number of dollars obtained for occupied rooms. RevPar decreased from $59.98 in 2007 to a low of $50.07 in 2009 before climbing again to $58.65 as of the end of 2012.
2007‐ 2008‐ 2009‐ 2010‐ 2011‐
2007 2008 2009 2010 2011 2012 2013* 2008 2009 2010 2011 2012
Occupancy Rate 63.7% 60.9% 55.8% 59.7% 62.5% 63.5% 55.5% ‐4.4% ‐8.4% 7.0% 4.7% 1.6%
Room Rate $94.10 $98.22 $89.76 $87.74 $91.29 $92.39 $90.34 4.4% ‐8.6% ‐2.3% 4.0% 1.2%
Revenue Per Room $59.96 $59.79 $50.07 $52.41 $57.10 $58.65 $50.15 ‐0.3% ‐16.3% 4.7% 8.9% 2.7%
* ‐ Year to date, April 2013
Source: Smith Travel Research
2007 through 2013 (April)
Year‐To‐Date Averages Annual Change
TABLE 38
LIMITED‐SERVICE FACILITIES
OCCUPANCY, ROOM RATE, REVENUE
MOUND MARKET AREA
Table 39 displays historical supply and demand for lodging at limited service hotels in the area between 2007 and April 2013. Because data for 2013 is only a partial year, analysis is focused on annual data from 2007 through 2012. Key characteristics of the findings are dis‐cussed below:
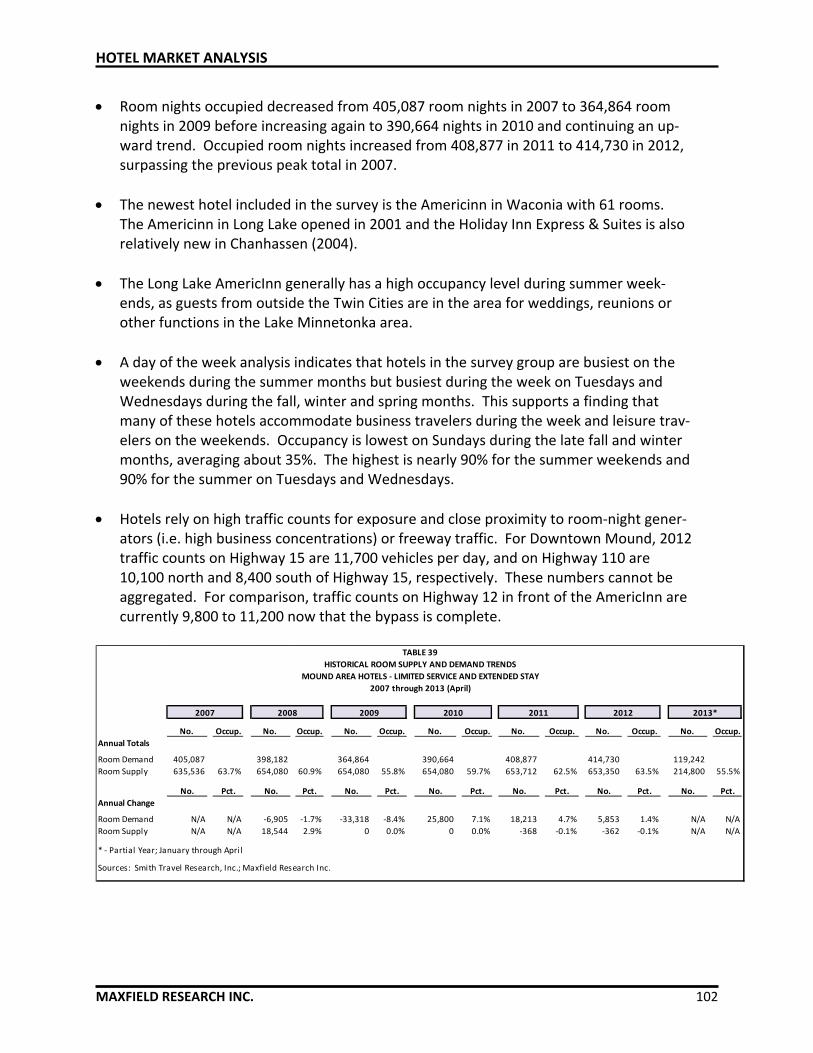
HOTEL MARKET ANALYSIS
MAXFIELD RESEARCH INC. 102
Room nights occupied decreased from 405,087 room nights in 2007 to 364,864 room nights in 2009 before increasing again to 390,664 nights in 2010 and continuing an up‐ward trend. Occupied room nights increased from 408,877 in 2011 to 414,730 in 2012, surpassing the previous peak total in 2007.
The newest hotel included in the survey is the Americinn in Waconia with 61 rooms. The Americinn in Long Lake opened in 2001 and the Holiday Inn Express & Suites is also relatively new in Chanhassen (2004).
The Long Lake AmericInn generally has a high occupancy level during summer week‐ends, as guests from outside the Twin Cities are in the area for weddings, reunions or other functions in the Lake Minnetonka area.
A day of the week analysis indicates that hotels in the survey group are busiest on the weekends during the summer months but busiest during the week on Tuesdays and Wednesdays during the fall, winter and spring months. This supports a finding that many of these hotels accommodate business travelers during the week and leisure trav‐elers on the weekends. Occupancy is lowest on Sundays during the late fall and winter months, averaging about 35%. The highest is nearly 90% for the summer weekends and 90% for the summer on Tuesdays and Wednesdays.
Hotels rely on high traffic counts for exposure and close proximity to room‐night gener‐ators (i.e. high business concentrations) or freeway traffic. For Downtown Mound, 2012 traffic counts on Highway 15 are 11,700 vehicles per day, and on Highway 110 are 10,100 north and 8,400 south of Highway 15, respectively. These numbers cannot be aggregated. For comparison, traffic counts on Highway 12 in front of the AmericInn are currently 9,800 to 11,200 now that the bypass is complete.
No. Occup. No. Occup. No. Occup. No. Occup. No. Occup. No. Occup. No. Occup.
Annual Totals
Room Demand 405,087 398,182 364,864 390,664 408,877 414,730 119,242
Room Supply 635,536 63.7% 654,080 60.9% 654,080 55.8% 654,080 59.7% 653,712 62.5% 653,350 63.5% 214,800 55.5%
No. Pct. No. Pct. No. Pct. No. Pct. No. Pct. No. Pct. No. Pct.
Annual Change
Room Demand N/A N/A ‐6,905 ‐1.7% ‐33,318 ‐8.4% 25,800 7.1% 18,213 4.7% 5,853 1.4% N/A N/A
Room Supply N/A N/A 18,544 2.9% 0 0.0% 0 0.0% ‐368 ‐0.1% ‐362 ‐0.1% N/A N/A
* ‐ Partial Year; January through April
Sources: Smith Travel Research, Inc.; Maxfield Research Inc.
2007 2010 20112008 2013*
TABLE 39
HISTORICAL ROOM SUPPLY AND DEMAND TRENDS
MOUND AREA HOTELS ‐ LIMITED SERVICE AND EXTENDED STAY
2007 through 2013 (April)
20122009
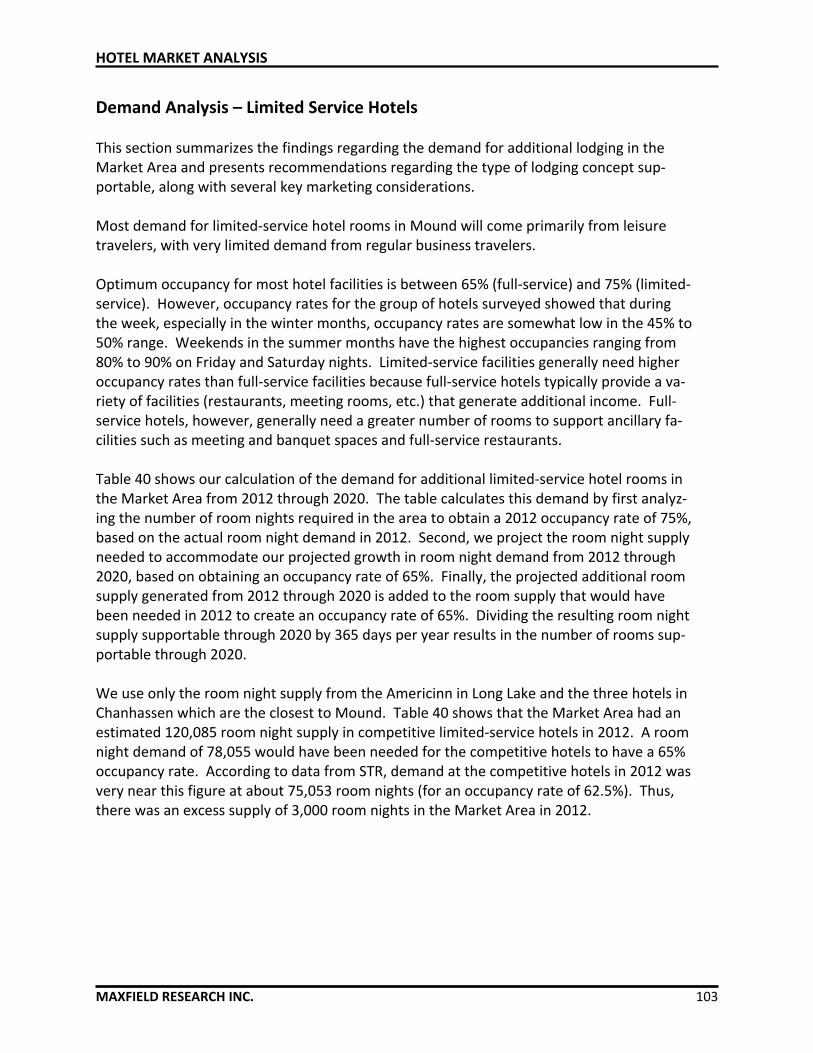
HOTEL MARKET ANALYSIS
MAXFIELD RESEARCH INC. 103
Demand Analysis – Limited Service Hotels This section summarizes the findings regarding the demand for additional lodging in the Market Area and presents recommendations regarding the type of lodging concept sup‐portable, along with several key marketing considerations. Most demand for limited‐service hotel rooms in Mound will come primarily from leisure travelers, with very limited demand from regular business travelers. Optimum occupancy for most hotel facilities is between 65% (full‐service) and 75% (limited‐service). However, occupancy rates for the group of hotels surveyed showed that during the week, especially in the winter months, occupancy rates are somewhat low in the 45% to 50% range. Weekends in the summer months have the highest occupancies ranging from 80% to 90% on Friday and Saturday nights. Limited‐service facilities generally need higher occupancy rates than full‐service facilities because full‐service hotels typically provide a va‐riety of facilities (restaurants, meeting rooms, etc.) that generate additional income. Full‐service hotels, however, generally need a greater number of rooms to support ancillary fa‐cilities such as meeting and banquet spaces and full‐service restaurants. Table 40 shows our calculation of the demand for additional limited‐service hotel rooms in the Market Area from 2012 through 2020. The table calculates this demand by first analyz‐ing the number of room nights required in the area to obtain a 2012 occupancy rate of 75%, based on the actual room night demand in 2012. Second, we project the room night supply needed to accommodate our projected growth in room night demand from 2012 through 2020, based on obtaining an occupancy rate of 65%. Finally, the projected additional room supply generated from 2012 through 2020 is added to the room supply that would have been needed in 2012 to create an occupancy rate of 65%. Dividing the resulting room night supply supportable through 2020 by 365 days per year results in the number of rooms sup‐portable through 2020. We use only the room night supply from the Americinn in Long Lake and the three hotels in Chanhassen which are the closest to Mound. Table 40 shows that the Market Area had an estimated 120,085 room night supply in competitive limited‐service hotels in 2012. A room night demand of 78,055 would have been needed for the competitive hotels to have a 65% occupancy rate. According to data from STR, demand at the competitive hotels in 2012 was very near this figure at about 75,053 room nights (for an occupancy rate of 62.5%). Thus, there was an excess supply of 3,000 room nights in the Market Area in 2012.
HOTEL MARKET ANALYSIS
MAXFIELD RESEARCH INC. 104
Existing Room Supply
Room supply in 2012 among competitive facil ities 120,085(times) Equil ibrium occupancy rate x 65%(equals) Equil ibrium room demand = 78,055
(minus) Room demand in 2012 ‐ 75,053(equals) Excess room supply in 2012 = 3,002
Additional Room Demand from 2003 through 2007
Projected increase in room night demand from 2013 through 2020 750 to 1,125
(divided by) Minimum occupancy requirement ÷ 65% 65%
(equals) Projected additional room night supply supportable from 2013 through 2020 488 to 731
Projected Additional Demand versus Existing Supply
Projected additional room night supply supportable from 2013 through 2020 488 to 731
(minus) Excess room supply in 2012 ‐ 3,002 0(equals) Projected number of room nights supportable through 2020 = ‐2,515 to 731
(divided by) 365 days per year ÷ 365 365
(equals) Projected number of rooms supportable through 2020 = ‐7 to 2
(minus) Additional rooms opened in Market Area (weighted competitiveness) = 58 to 58
(equals) Remaining number of rooms supportable through 2007 ‐65 ‐56
(times) Percent of demand supportable in Mound x 25% 25%
(equals) Projected number of rooms supportable in Mound through 2013 ‐16 to ‐14
Sources: Smith Travel Research, Inc.
Maxfield Research Inc.
TABLE 40
PROJECTED LIMITED‐SERVICE ROOM DEMAND
MOUND AREA
2013 through 2020
Pending Developments Two pending hotel and small conference center facilities have been proposed that would be developed in the surrounding area. The first is in Excelsior and would include a boutique hotel with about 58 rooms and additional conference meeting space. The development would be located overlooking Excelsior Bay in Excelsior, just off of and visible from Highway 7. The developer has received some preliminary approvals from the City, but conflicts over a land swap have placed the project on hold and it has moved forward slowly. The devel‐oper would finance the project using his own funds. Discussions are ongoing with the City regarding some infrastructure improvements that would have to be made along with the development and the financial structure for these improvements has not been finalized. A private family is proposing to develop a boutique hotel as part of The Promenade at Wayzata development which is currently underway. The boutique hotel is proposed to have between 50 and 70 rooms, but is planned to be one of the final phases of the devel‐opment. This component is not likely to proceed until sometime in 2015 or later.

HOTEL MARKET ANALYSIS
MAXFIELD RESEARCH INC. 105
Recommendations Our analysis found demand would likely be high for rooms on summer weekends in Mound, as weddings and other events that occur around Lake Minnetonka drive demand for hotel rooms in the area, particularly at the Long Lake AmericInn. Weekend demand in the winter may also be quite strong, as ice fishing, snowmobiling and hockey tournaments in the area are popular in the winter months. Weeknight occupancy is somewhat elusive, as even with a substantial improvement in the economy, the City of Mound and surrounding area is not a significant base for businesses of great size. Mound’s location several miles west of the Interstate 494 beltway inhibits its at‐traction to business travelers necessary for significant weeknight occupancy. The lack of demand in Mound can be further supported by the lack of hotel room night generators presently found in the area. Hotel developers seek several of the following to be located near a potential site, including office buildings, recreational facilities, hospitals, air‐ports, colleges, and major manufacturing plants. Mound has very few of these demand generators. Additional development (including business development) in the Downtown can increase demand however, by adding businesses and increasing the visibility of the City for people visiting the area for recreation. We do not recommend the construction of a hotel at this time. Leisure travel and business travel is rebounding and there is renewed interest in hotel development. However, we would wait to confirm the development and performance of the proposed hotels in Excelsi‐or and in Wayzata before expending significant resources to solicit a hotel for the Down‐town. Even the strong Eden Prairie submarket is just now recovering from the economic downturn. The hotel market is on the rebound, but is not strong enough yet to consider adding significant new product to the market. Current Market Area occupancy trends for hotels have been declining since 2001, and the economy has yet to generate growth sufficient to reverse this trend. Hotels are generally performing at a 60% overall occupancy rate, below the ideal rate of 70% to 75% for limited service hotels. Current market conditions indicate that travel is again increasing because of the economic recovery. However, job growth, the primary generator of hotel usage during the week con‐tinues to fluctuate. Leisure travel has also increased but remains down from pre‐recession totals. A hotel in Mound is likely to experience moderate to strong demand during the late spring, summer and early fall months and then drop significantly during the remainder of the year. Interviews with business owners also indicated some seasonality to retail sales in the Down‐town. In addition, there are currently two hotels proposed for the immediate area, one in

HOTEL MARKET ANALYSIS
MAXFIELD RESEARCH INC. 106
Downtown Wayzata and one in Downtown Excelsior. Both are proposed by private individ‐uals that will leverage their personal wealth to finance the development of these facilities. We recommend that Mound wait to determine the potential impact of these new hotels on the market for additional rooms in the Downtown. As additional development occurs and as residential and commercial growth resumes, demand for a hotel may increase to a level that would be sufficient to support a modest size property of about 40 rooms. The greatest factors however, in determining sufficient demand remain the need for weeknight occu‐pancy and occupancy during the winter months.