Left Ventricular End Diastolic Loading: Comparison of Cardiac ...
14
Page 1/14 Left Ventricular End Diastolic Loading: Comparison of Cardiac MR with Echocardiography Christopher Rumer ( [email protected] ) University of Washington Erica Qiao University of Washington David T. Linker University of Washington Theodore J. Dubinsky University of Washington Research Article Keywords: assessment of cardiac function, heart failure, myocardial bounce, diagnosis and management of systolic and diastolic dysfunction, echocardiography Posted Date: April 6th, 2022 DOI: https://doi.org/10.21203/rs.3.rs-1402383/v2 License: This work is licensed under a Creative Commons Attribution 4.0 International License. Read Full License
-
Upload
khangminh22 -
Category
Documents
-
view
0 -
download
0
Transcript of Left Ventricular End Diastolic Loading: Comparison of Cardiac ...

Page 1/14
Left Ventricular End Diastolic Loading: Comparisonof Cardiac MR with EchocardiographyChristopher Rumer ( [email protected] )
University of WashingtonErica Qiao
University of WashingtonDavid T. Linker
University of WashingtonTheodore J. Dubinsky
University of Washington
Research Article
Keywords: assessment of cardiac function, heart failure, myocardial bounce, diagnosis and managementof systolic and diastolic dysfunction, echocardiography
Posted Date: April 6th, 2022
DOI: https://doi.org/10.21203/rs.3.rs-1402383/v2
License: This work is licensed under a Creative Commons Attribution 4.0 International License. Read Full License

Page 2/14
AbstractPurpose
In a prior publication, loss of myocardial bounce was highly associated with systolic and diastolicdysfunction. The bounce is the rapid change in LV volume at the end of diastole during atrial contractionjust prior to systolic ejection. This study attempts to determine if bounce is associated with diastolicdysfunction determined by echocardiography.
Methods
135 patients with an echocardiogram and a cardiac MR were selected with 38% of those paired of studieswithin three months of each other. The bounce was graded by 3 blinded observers into categories of0=none, 1=minimal/reduced, and 2=normal bounce.
Results
Inter-reader agreement was summarized using the intraclass correlation coe�cient (ICC) and ratings wasmoderate [ICC 0.60, 95% con�dence interval (0.51-0.68)]. The sensitivity and speci�city of lack of bounce(grade 0 or 1) as a screen for diastolic dysfunction on echo were 89% and 47%, respectively.
Conclusion
The simple observation of a normal myocardial bounce in MRs was predictive of normal diastolicfunction and lack of was highly associated with dysfunction determined via echocardiography. Systolicfunction remains normal in some of these patients and this �nding may represent diastolic dysfunction.Further studies examining the relationship between bounce with different types of diastolic function isneeded. This updated study con�rms myocardial bounce seen on various cardiac imaging modalitiesmay be a simple useful tool for detecting cardiac dysfunction.
IntroductionThe prevalence of heart failure in the U.S. is increasing, and it is expected that more than 8 millionpatients will develop heart failure within the next decade. Echocardiography remains the study of choicefor the evaluation of heart failure, and the evaluation of diastolic function in particular depends uponDoppler evaluation including waveforms taken at the mitral valve [1–3].
The mechanics of myocardial contraction and relaxation are well known [4]. The more the myocardiumstretches during diastole [5], the more it contracts during systole [6–8]. In our prior study, we estimatedthat the ventricular wall stretch or loading that occurs at end diastole accounts for 15 to 20% of ejectionvolume [9].

Page 3/14
It is helpful to separately consider the events of early and late diastole. In early diastole, the ventriclecontinues to achieve relaxation, and any slowing of that process will affect early �lling. By late diastole,relaxation of the ventricle is complete, and �lling is determined by the stiffness of the myocardium andvigor of the atrial contraction. Diastolic dysfunction can affect either or both parts of diastole. Dopplerechocardiography of the transmitral �ow demonstrates an early diastolic �ow called the E wave and alate �ow called the A wave, caused by atrial contraction. In normal functioning hearts, the E wave is ofgreater velocity than A wave, indicating that atrial contraction contributes a smaller amount of �lling tothe left ventricle compared to that which occurs early. There are other measures of diastolic functionobtained at echocardiography, one of the most popular being the ratio of the E wave velocity to the mitralannular velocity (e’), or the E/e’ ratio [12–15].
The interpretation of cardiac MR has generally not paid much attention to diagnosing diastolicdysfunction [16]. We have repeatedly observed that healthy adult hearts demonstrate a de�nitemyocardial bounce seen as a rapid change in LV volume at the end of diastole that occurs secondary toatrial contraction just prior to systolic ejection. Given its simplicity, the purpose of this study attempts todetermine if the simple observation of the myocardial bounce can be utilized as a screening tool fordiastolic dysfunction when compared with echocardiographic report as the standard of diseasedetection.
Materials And MethodsFollowing IRB approval, study #STUDY0000327, a search of the echocardiography and cardiac MRdatabases were undertaken from January 2010 through July 2020 to determine the number of patientsthat underwent both exams. These were further re�ned using the following inclusion criteria: Age over 17years, diastolic function assessments at echocardiography including E/e’ and E/A ratios, and a cardiacMR that included a short axis stack. The study excluded echocardiograms where diastolic function wasnot assessed, those with a mass, thrombus, myocardial infarct, arrhythmias including atrial �brillation,the presence of a signi�cant congenital defect, pulmonary venous mapping or MR aortic studies. Allpatients had echocardiographic reports and charts were reviewed for correlation.
All MR images were obtained on Philips Achieva 1.5T (Amsterdam, Holland). The short axis stack andfour chamber views were reviewed. The MR protocol was as follows: Slices total: 12, Slice orientation:Short axis, 4 Chamber Technique: bFFE, Acquisition mode: CARTESIAN, Fat suppression: None, Totalscan duration: 00:32.0, Act. TR/TE (shifted) (ms): 2.7 / 1.37, Scan time / BH:00:10.7, FOV MPS (mm):300 x 300, ACQ matrix M x P: 200 x 200, TFE factor: 14, TFE shots: 3, TFE dur. shot / acq (ms): 38.3 /38.3, TFE shot interval (ms): 38.3, Act. Phase acq (%): 69.6, Local torso SAR: < 92%, Whole body SAR /level: < 2.3 W/kg / 1st level.
The diastolic loading is de�ned as the rapid change over a time period of 100 to 120 ms in LV volumethat occurs at the end of diastole secondary to atrial contraction just prior to systolic ejection. All imageswere reviewed by 3 blinded graders, one with 15 years of experience performing cardiac MR, one medical

Page 4/14
student with 1 year experience, and one with no experience. After the �rst round of independent review of10 cases with discrepant reads (5 grade 0, 1 grade 1, 4 grade 2), they were revisited by two readers (CR,TJD) who viewed the cine loop together and to ensure consensus. An echo report that listed diastolicfunction as normal was interpreted as normal, an echo report that commented on diastolic dysfunction,increased �lling pressures, impaired ventricular relaxation, or reduction in ventricular compliance were allscored as presence of diastolic dysfunction.
Consistency of individual bounce ratings was assessed using the intraclass correlation coe�cient (ICC).The ICC command in Stata version 16 [33] was used to estimate the ICC using a two-way mixed effectsmodel, which corresponds to ICC (3,1) in [34].
Results135 patients’ cardiac MR and echocardiography exams met the inclusion criteria and were graded asfollowing: 0 = no bounce; 1 = minimal/reduced bounce; 2 = strong/normal bounce. At time of exam,patient characteristics and other variables are presented in (Table I). Clinical indications for the cardiacMR included: shortness of breath, dyspnea on exertion, or chest pain. The cohort included 68 females, 67males, age ranged from 18–82 (Median: 53), E/A ratio ranged from 0.45–8.4 (Mean: 1.65) and E/e’ranged from 2.2–34.06 (Mean: 13.07). Sensitivity 0.89, speci�city 0.47, PPV 0.70, NPV 0.75 for bouncegrades 0 or 1 (screen positive for diastolic dysfunction) versus 2 (screen negative for diastolicdysfunction) compared to standard of diastolic dysfunction determination by echocardiography report.
E/A and E/e’ distributions versus degree of bounce are shown in Figs. 1 and 2. There was no signi�cantchange difference in the E/A or E/e’ ratios related to the degree of bounce.
Inter-reader agreementInter-reader agreement is summarized in (Table 2), using the ICC. Overall agreement was moderate withICC = 0.60 (95% CI: 0.51–0.68).
Bounce grade vs. summary report from echocardiographyThe distribution for bounce grade vs the �nal impression of all the data in the echocardiography report issummarized in (Table 3).
Bounce Grade as Screening Test vs. Echo Report DiastolicDysfunction as Standard of Disease StateThe sensitivity and speci�city of bounce grading as a screening test are summarized in (Table 4). Bouncegrades of 0 or 1 as a positive screen for diastolic dysfunction, with Bounce 2 as negative screen fordiastolic dysfunction. Echo report as standard for diastolic dysfunction adjudication (disease state).
Discussion
Page 5/14
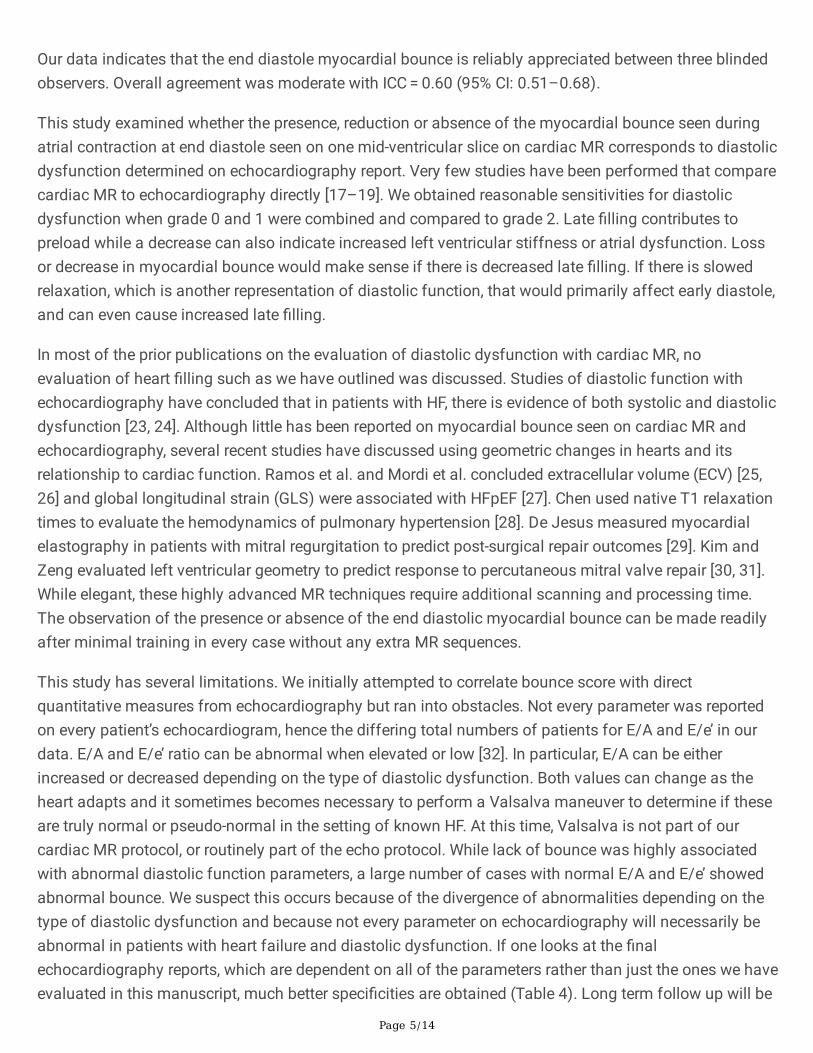
Our data indicates that the end diastole myocardial bounce is reliably appreciated between three blindedobservers. Overall agreement was moderate with ICC = 0.60 (95% CI: 0.51–0.68).
This study examined whether the presence, reduction or absence of the myocardial bounce seen duringatrial contraction at end diastole seen on one mid-ventricular slice on cardiac MR corresponds to diastolicdysfunction determined on echocardiography report. Very few studies have been performed that comparecardiac MR to echocardiography directly [17–19]. We obtained reasonable sensitivities for diastolicdysfunction when grade 0 and 1 were combined and compared to grade 2. Late �lling contributes topreload while a decrease can also indicate increased left ventricular stiffness or atrial dysfunction. Lossor decrease in myocardial bounce would make sense if there is decreased late �lling. If there is slowedrelaxation, which is another representation of diastolic function, that would primarily affect early diastole,and can even cause increased late �lling.
In most of the prior publications on the evaluation of diastolic dysfunction with cardiac MR, noevaluation of heart �lling such as we have outlined was discussed. Studies of diastolic function withechocardiography have concluded that in patients with HF, there is evidence of both systolic and diastolicdysfunction [23, 24]. Although little has been reported on myocardial bounce seen on cardiac MR andechocardiography, several recent studies have discussed using geometric changes in hearts and itsrelationship to cardiac function. Ramos et al. and Mordi et al. concluded extracellular volume (ECV) [25,26] and global longitudinal strain (GLS) were associated with HFpEF [27]. Chen used native T1 relaxationtimes to evaluate the hemodynamics of pulmonary hypertension [28]. De Jesus measured myocardialelastography in patients with mitral regurgitation to predict post-surgical repair outcomes [29]. Kim andZeng evaluated left ventricular geometry to predict response to percutaneous mitral valve repair [30, 31].While elegant, these highly advanced MR techniques require additional scanning and processing time.The observation of the presence or absence of the end diastolic myocardial bounce can be made readilyafter minimal training in every case without any extra MR sequences.
This study has several limitations. We initially attempted to correlate bounce score with directquantitative measures from echocardiography but ran into obstacles. Not every parameter was reportedon every patient’s echocardiogram, hence the differing total numbers of patients for E/A and E/e’ in ourdata. E/A and E/e’ ratio can be abnormal when elevated or low [32]. In particular, E/A can be eitherincreased or decreased depending on the type of diastolic dysfunction. Both values can change as theheart adapts and it sometimes becomes necessary to perform a Valsalva maneuver to determine if theseare truly normal or pseudo-normal in the setting of known HF. At this time, Valsalva is not part of ourcardiac MR protocol, or routinely part of the echo protocol. While lack of bounce was highly associatedwith abnormal diastolic function parameters, a large number of cases with normal E/A and E/e’ showedabnormal bounce. We suspect this occurs because of the divergence of abnormalities depending on thetype of diastolic dysfunction and because not every parameter on echocardiography will necessarily beabnormal in patients with heart failure and diastolic dysfunction. If one looks at the �nalechocardiography reports, which are dependent on all of the parameters rather than just the ones we haveevaluated in this manuscript, much better speci�cities are obtained (Table 4). Long term follow up will be

Page 6/14
necessary to observe the outcomes in these patients. Unfortunately, not every MR was performed within afew weeks of the echocardiogram with some being delayed by over a year. Lastly, we acquired images at26 frames per second, but there is evidence that acquiring images at higher frame rates improves theevaluation of diastolic function [19].
ConclusionThe observation whether myocardial bounce is present or absent is easy to make, requires no advancedMR sequences, and can be implemented in every case if a four-chamber view and a short axis stack areobtained. Reduced or absent myocardial bounce during atrial contraction at end diastole on cardiac MRcorresponds to diastolic dysfunction. Our �ndings suggest the assessment of myocardial bounce incardiac MR could become a simple and useful tool for diagnosis of early diastolic dysfunction.Additional studies with long term outcomes in cases with normal echocardiographic measurements areneeded to determine the potential utility of myocardial bounce in the detection of isolated diastolicdysfunction.
DeclarationsFunding
This research did not receive any speci�c grant from funding agencies in the public, commercial, or not-for-pro�t sectors.
Competing interests
The authors have no relevant �nancial or non-�nancial interests to disclose.
Author Contributions
All authors contributed to the study conception and design. Material preparation and data collection wereperformed by Theodore J. Dubinsky, Christopher Rumer, and Erica Qiao. Statistical analysis wereperformed by Theodore J. Dubinsky. The �rst draft of the manuscript was written by Christopher Rumerand Erica Qiao, and all authors commented on previous versions of the manuscript. All authors read andapproved the �nal manuscript
Ethics Approval
This research study was conducted retrospectively from data obtained for clinical purposes. Ethicalapproval to report this study was obtained via IRB approval study #STUDY0000327 at the University ofWashington.
Consent to participate
All information in this publication is anonymized and does not include images that may identify a person.

Page 7/14
Consent to publish
All information in this publication is anonymized and does not include images that may identify a person.
References1. Amano, M., Izumi, C., Kim, Y. J., Park, S. J., Park, S. W., Tanaka, H., Hozumi, T., Ling, L. H., Yu, C. M.,
Fukuda, S., Otsuji, Y., Song, J. K., & Sohn, D. W. (2020). Changes of echocardiographic parameters inprimary mitral regurgitation and determinants of symptom: an assessment from the Asian ValveRegistry data. Heart and Vessels, 35(4), 555-563. https://doi.org/10.1007/s00380-019-01514-x
2. Aquila I, Fernández-Golfín C, Rincon LM, et al. Fully automated software for mitral annulusevaluation in chronic mitral regurgitation by 3-dimensional transesophageal echocardiography.Medicine. 2016 Dec;95(49):e5387. DOI: https://doi.org/10.1097/md.0000000000005387. PMID:27930514; PMCID: PMC5265986.
3. Aruta P, Muraru D, Guta AC, Mihaila S, Ruozi N, Palermo C, Elnagar B, Iliceto S, Badano LP.Comparison of mitral annulus geometry between patients with ischemic and non-ischemicfunctional mitral regurgitation: implications for transcatheter mitral valve implantation. CardiovascUltrasound. 2018 Oct 12;16(1):27. doi: https://doi.org/10.1186/s12947-018-0145-8. PMID:30314517; PMCID: PMC6186037.
4. Abel FL. Pmax, end systolic elastance, and Starling's law of the heart. Shock (Augusta, Ga.). 2001Jan;15(1):56-59. DOI: https://doi.org/10.1097/00024382-200115010-00009. PMID: 11198358.
5. Baan J, van der Velde ET, Steendijk P. Ventricular pressure-volume relations in vivo. Eur Heart J.1992;13 Suppl E:2-6. doi: https://doi.org/10.1093/eurheartj/13.suppl_e.2
�. Giuliodori, M. J., Lujan, H. L., Briggs, W. S., Palani, G., & DiCarlo, S. E. (2009). Hooke's law:applications of a recurring principle. Advances in physiology education, 33(4), 293–296.https://doi.org/10.1152/advan.00045.2009
7. Babu, A., Sonnenblick, E., & Gulati, J. (1988). Molecular basis for the in�uence of muscle length onmyocardial performance. Science (New York, N.Y.), 240(4848), 74–76.https://doi.org/10.1126/science.3353709
�. BRAUNWALD, E., FRAHM, C. J., & ROSS, J., Jr (1961). Studies on Starling's law of the heart. V. Leftventricular function in man. The Journal of clinical investigation, 40(10), 1882–1890.https://doi.org/10.1172/JCI104412
9. Brady A. J. (1966). Onset of contractility in cardiac muscle. The Journal of physiology, 184(3), 560–580. https://doi.org/10.1113/jphysiol.1966.sp007931
10. Uretsky, S., Aldaia, L., Marcoff, L., Koulogiannis, K., Argulian, E., Lasam, G., & Gillam, L. (2020).Concordance and Discordance of Echocardiographic Parameters Recommended for Assessing theSeverity of Mitral Regurgitation. Circulation. Cardiovascular imaging, 13(5), e010278.https://doi.org/10.1161/CIRCIMAGING.119.010278

Page 8/14
11. Peteiro, J., Barriales-Villa, R., Larrañaga-Moreira, J. M., Bouzas-Mosquera, A., Martinez-Veira, C.,Castro-Dios, D., Fernández-Fernández, X., Monserrat, L., & Vazquez-Rodriguez, J. (2021). Value of acomprehensive exercise echocardiography assessment for patients with hypertrophiccardiomyopathy. Journal of cardiology, 77(5), 525–531. https://doi.org/10.1016/j.jjcc.2020.11.017
12. Nabati, M., Salehi, S., Bagheri, B., & Nouraei, M. (2016). Abnormal left ventricular relaxation andsymptoms of heart failure. Journal of echocardiography, 14(3), 113–119.https://doi.org/10.1007/s12574-016-0287-3
13. Nasser, R., Van Assche, L., Vorlat, A., Vermeulen, T., Van Craenenbroeck, E., Conraads, V., Van derMeiren, V., Shivalkar, B., Van Herck, P., & Claeys, M. J. (2017). Evolution of Functional MitralRegurgitation and Prognosis in Medically Managed Heart Failure Patients With Reduced EjectionFraction. JACC. Heart failure, 5(9), 652–659. https://doi.org/10.1016/j.jchf.2017.06.015
14. Ngiam, J. N., Chew, N., Teng, R., Kochav, J. D., Kochav, S. M., Tan, B. Y., Sim, H. W., Sia, C. H., Kong, W.,Tay, E., Yeo, T. C., & Poh, K. K. (2020). Clinical and echocardiographic features of paradoxical low-�ow and normal-�ow severe aortic stenosis patients with concomitant mitral regurgitation. Theinternational journal of cardiovascular imaging, 36(3), 441–446. https://doi.org/10.1007/s10554-019-01735-1
15. Topilsky, Y., Rozenbaum, Z., Khoury, S., Pressman, G. S., Gura, Y., Sherez, J., Man, A., Shimiaie, J.,Edwards, S., Berookhim, J., Le Tourneau, T., Halkin, A., Biner, S., Keren, G., & Aviram, G. (2017).Mechanisms of Effort Intolerance in Patients With Heart Failure and Borderline Ejection Fraction. TheAmerican journal of cardiology, 119(3), 416–422. https://doi.org/10.1016/j.amjcard.2016.10.026
1�. Capron, T., Cautela, J., Scemama, U., Miola, C., Bartoli, A., Theron, A., Pinto, J., Porto, A., Collart, F.,Lepidi, H., Bernard, M., Guye, M., Thuny, F., Avierinos, J. F., & Jacquier, A. (2020). Cardiac magneticresonance assessment of left ventricular dilatation in chronic severe left-sided regurgitations:comparison with standard echocardiography. Diagnostic and interventional imaging, 101(10), 657–665. https://doi.org/10.1016/j.diii.2020.04.014
17. Rigolli, M., Anandabaskaran, S., Christiansen, J. P., & Whalley, G. A. (2016). Bias associated with leftventricular quanti�cation by multimodality imaging: a systematic review and meta-analysis. Openheart, 3(1), e000388. https://doi.org/10.1136/openhrt-2015-000388
1�. Rosa, I., Marini, C., Stella, S., Ancona, F., Spartera, M., Margonato, A., & Agricola, E. (2016). Mechanicaldyssynchrony and deformation imaging in patients with functional mitral regurgitation. Worldjournal of cardiology, 8(2), 146–162. https://doi.org/10.4330/wjc.v8.i2.146
19. Zhang, J., Chen, J., Cheong, B., Pednekar, A., & Muthupillai, R. (2019). High frame rate cardiac cineMRI for the evaluation of diastolic function and its direct correlation with echocardiography. Journalof magnetic resonance imaging : JMRI, 50(5), 1571–1582. https://doi.org/10.1002/jmri.26791
20. DiBello, V., Bianchi, A. M., Caputo, M. T., Santoro, G., Panichi, V., Parrini, M., Giusti, C., & Palla, R.(1990). Fractional shortening/end-systolic stress correlation in the evaluation of left ventricularcontractility in patients treated by acetate dialysis and lactate haemo�ltration. Nephrology, dialysis,
Page 9/14
transplantation : o�cial publication of the European Dialysis and Transplant Association - EuropeanRenal Association, 5 Suppl 1, 115–118. https://doi.org/10.1093/ndt/5.suppl_1.115
21. Earley J. J. (1991). Simple harmonic motion of tropomyosin: proposed mechanism for length-dependent regulation of muscle active tension. The American journal of physiology, 261(6 Pt 1),C1184–C1195. https://doi.org/10.1152/ajpcell.1991.261.6.C1184
22. Wijnker, P. J., Sequeira, V., Foster, D. B., Li, Y., Dos Remedios, C. G., Murphy, A. M., Stienen, G. J., & vander Velden, J. (2014). Length-dependent activation is modulated by cardiac troponin Ibisphosphorylation at Ser23 and Ser24 but not by Thr143 phosphorylation. American journal ofphysiology. Heart and circulatory physiology, 306(8), H1171–H1181.https://doi.org/10.1152/ajpheart.00580.2013
23. Casas-Rojo, E., Fernández-Gol�n, C., Moya-Mur, J. L., González-Gómez, A., García-Martín, A., Morán-Fernández, L., Rodríguez-Muñoz, D., Jiménez-Nacher, J. J., Martí Sánchez, D., & Zamorano Gómez, J.L. (2016). Area strain from 3D speckle-tracking echocardiography as an independent predictor ofearly symptoms or ventricular dysfunction in asymptomatic severe mitral regurgitation withpreserved ejection fraction. The international journal of cardiovascular imaging, 32(8), 1189–1198.https://doi.org/10.1007/s10554-016-0904-2
24. Kishiki, K., Singh, A., Narang, A., Gomberg-Maitland, M., Goyal, N., Maffessanti, F., Besser, S. A., Mor-Avi, V., Lang, R. M., & Addetia, K. (2019). Impact of Severe Pulmonary Arterial Hypertension on theLeft Heart and Prognostic Implications. Journal of the American Society of Echocardiography :o�cial publication of the American Society of Echocardiography, 32(9), 1128–1137.https://doi.org/10.1016/j.echo.2019.05.008
25. Zeng, M., Qiao, Y., Wen, Z., Liu, J., Xiao, E., Tan, C., Xie, Y., An, J., Zhang, Z., Fan, Z., & Li, D. (2017). TheAssociation between Diffuse Myocardial Fibrosis on Cardiac Magnetic Resonance T1 Mapping andMyocardial Dysfunction in Diabetic Rabbits. Scienti�c reports, 7, 44937.https://doi.org/10.1038/srep44937
2�. Zhang, Y., Zeng, W., Chen, W., Chen, Y., Zhu, T., Sun, J., Liang, Z., Cheng, W., Wang, L., Wu, B., Gong, L.,Ferrari, V. A., Zheng, J., & Gao, F. (2019). MR extracellular volume mapping and non-contrast T1ρmapping allow early detection of myocardial �brosis in diabetic monkeys. European radiology, 29(6),3006–3016. https://doi.org/10.1007/s00330-018-5950-9
27. Arques, S., Ambrosi, P., Roux, E., Sbragia, P., Gelisse, R., Pieri, B., & Luccioni, R. (2008). Tissue Dopplerechocardiography for the diagnosis of new-onset heart failure with normal ejection fraction:in�uence of serum protein concentration on clinical interpretation in elderly patients. Archives ofcardiovascular diseases, 101(5), 343–350. https://doi.org/10.1016/j.acvd.2008.04.002
2�. Chen, Y. Y., Yun, H., Jin, H., Kong, H., Long, Y. L., Fu, C. X., Yang, S., & Zeng, M. S. (2017). Associationof native T1 times with biventricular function and hemodynamics in precapillary pulmonaryhypertension. The international journal of cardiovascular imaging, 33(8), 1179–1189.https://doi.org/10.1007/s10554-017-1095-1

Page 10/14
29. De Jesus, T., Alashry, M. M., Padang, R., Pislaru, S. V., Nkomo, V. T., Pellikka, P. A., & Pislaru, C. (2021).Intrinsic cardiac elastography in patients with primary mitral regurgitation: predictive role after mitralvalve repair. European heart journal. Cardiovascular Imaging, 22(8), 912–921.https://doi.org/10.1093/ehjci/jeaa117
30. Kim, J., Alakbarli, J., Palumbo, M. C., Xie, L. X., Rong, L. Q., Tehrani, N. H., Brouwer, L. R., Devereux, R.B., Wong, S. C., Bergman, G. W., Khalique, O. K., Levine, R. A., Ratcliffe, M. B., & Weinsaft, J. W. (2019).Left ventricular geometry predicts optimal response to percutaneous mitral repair via MitraClip:Integrated assessment by two- and three-dimensional echocardiography. Catheterization andcardiovascular interventions : o�cial journal of the Society for Cardiac Angiography &Interventions, 93(6), 1152–1160. https://doi.org/10.1002/ccd.28147
31. Zeng, D., Wu, J., Wu, S. S., Lin, H. H., & Chen, H. (2020). Three-dimensional echocardiographiccomparison of left ventricular geometry and systolic function between dilated cardiomyopathy andmitral regurgitation with similar left ventricular dilation. Journal of clinical ultrasound : JCU, 48(1),29–37. https://doi.org/10.1002/jcu.22775
32. Teraguchi, I., Hozumi, T., Takemoto, K., Ota, S., Kashiwagi, M., Shimamura, K., Shiono, Y., Kuroi, A.,Yamano, T., Yamaguchi, T., Matsuo, Y., Ino, Y., Kitabata, H., Kubo, T., Tanaka, A., & Akasaka, T. (2019).Assessment of decreased left ventricular longitudinal deformation in asymptomatic patients withorganic mitral regurgitation and preserved ejection fraction using tissue-tracking mitral annulardisplacement by speckle-tracking echocardiography. Echocardiography (Mount Kisco, N.Y.), 36(4),678–686. https://doi.org/10.1111/echo.14290
33. StataCorp. 2019. Stata Statistical Software: Release 16. College Station, TX: StataCorp LLC
34. Shrout, P. E., & Fleiss, J. L. (1979). Intraclass correlations: Uses in assessing rater reliability.Psychological Bulletin, 86(2), 420–428. https://doi.org/10.1037/0033-2909.86.2.420
TablesTable 1 Patient demographics (N=135).

Page 11/14
Variable Value
Sex Female 68(50.4%)
Male 67(49.6%)
Age Age range 18 - 82
Age mean MR 51
Age mean Echo 52
Race and Ethnicity White 102
Black or African American 8
Asian 11
Native Hawaiian or Other Paci�c Islander 1
American Indian or Alaska Native 4
Unknown 9
Echo
Parameters
E/A mean 1.65
E/A standard deviation 1.03
E/A range 0.45 - 8.4
E/e’ mean 13.07
E/e’ standard deviation 5.28
E/e’ range 2.20 -34.06
Time between modalities
38% of exams were within 3 months fromeach other
Median time between MR and Echoexams (days)
233
Mean time between MR and Echo exams(days)
360
Time range between MR and Echo exam(days)
0 - 1309
E/A: Ratio of Early vs. late (atrial) ventricular �lling
E/e’: Ratio of early mitral valve in�ow velocity to mitral annular early diastolic velocity

Page 12/14
Bounce Grade Readers Agreement
CR EQ TD ICC (95% CI)
0: no bounce 57 (43) 58 (43) 62 (46) 0.60 (0.51 – 0.68)
1: minimal bounce 65 (48) 66 (49) 52 (39)
2: normal 12 (9) 10 (8) 20 (15)
Table 2 Number of cases and percentile within each bounce category graded by each reader and Inter-reader agreement during the �rst round.
N=134 (1 patient missing due to no 4-chamber view on MR)
Table 3 Bounce Gradevs. Normal andAbnormal Diastolic
Function per echocardiogram report.
Bounce Grade Normal Diastolic Function
N=57
0: No Bounce 11/57 (19.3%)
0 and 1: Minimal Bounce 30/57 (52.6%)
1: Minimal Bounce 19/57 (33.3%)
2: Normal Bounce 27/57 (47.3%)
Bounce Grade Abnormal Diastolic Function
N=78
0: No Bounce 33/78 (42.3%)
0 and 1: Minimal Bounce 69/78 (88.5%)
1: Minimal Bounce 36/78 (46.2%)
2: Normal Bounce 9/78 (11.5%)
Table 4 Bounce Grade vs. Diastolic function per echocardiogram report

Page 13/14
Screening Result Abnormal DiastolicDysfunction
Normal DiastolicDysfunction
Total
Abnormal Bounce Grade 0or 1
69 30 99
Normal Bounce Grade 2 9 27 36
Total 78 57 135
Sensitivity: 0.89, Speci�city: 0.47
Figures
Figure 1
Box and whisker plots showing the distribution of E/A ratios per bounce grade

Page 14/14
Figure 2
Box and whisker plots showing the distribution of E/e’ ratios per bounce grade
Supplementary Files
This is a list of supplementary �les associated with this preprint. Click to download.
SUPPLEMENTARYFILEVIDEO1.avi
SUPPLEMENTARYFILEVIDEO2.avi
SUPPLEMENTARYFILEVIDEO3.avi
SUPPLEMENTARYFILEVIDEO4.avi