Assessment of left ventricular diastolic function using 4-dimensional phase-contrast cardiac...
10
PICTORIAL REVIEW Assessment of left ventricular diastolic function by MR: why, how and when Ricardo Duarte & Gabriel Fernandez Received: 21 April 2010 / Accepted: 11 May 2010 / Published online: 15 June 2010 # European Society of Radiology 2010 Abstract Cardiovascular magnetic resonance (CMR), a valuable non-invasive technique for the evaluation of the cardiovascular system, has already been accepted as the "gold standard" for the assessment of systolic function. The assessment of diastolic function is important not only for diagnosis purposes, but also in terms of prognosis. ECG-triggering phase-contrast (PC) CMR allows the routine assessment of diastolic function by measuring the transmitral and pulmonary venous flow with high accuracy and reproducibility, using morphological and quantitative parameters similar to those obtained by transthoracic echocardiography, which are so familiar to general cardiol- ogists. Therefore, the increasing role of CMR in the assessment of the cardiovascular system requires a greater awareness and knowledge of this condition by radiologists. The aim of this study is to review the main mechanisms and common causes of left ventricle diastolic dysfunction, provide a practical approach for the assessment of LV diastolic function and illustrate the different degrees of diastolic dysfunction. Keywords Cardiovascular magnetic resonance (CMR) . Systolic function . Diastolic function . Measurement Introduction Congestive heart failure (CHF) is the third most prevalent form of heart disease with 550,000 new cases being reported annually [1]. CHF caused by a predominant abnormality in diastolic function has been increasingly recognised as a common entity and a cause of significant morbidity and mortality, as 40–50% of the patients with heart failure may have isolated diastolic dysfunction with a normal or near normal left ventricle (LV) systolic function [2–4]. Moreover, in the last 2 decades, the proportion of patients with CHF and normal LV systolic function has increased considerably, from 38% to 54% [5]. Primary diastolic dysfunction is usually seen in patients with hypertension, valvular heart disease and hypertrophic, restrictive or ischaemic cardiomyopathy [6]. An early diagnosis is decisive in order to prevent irreversible structural alterations and systolic dysfunction. Distinguishing diastolic from systolic heart failure is crucial, because the treatment for one may exacerbate the other, and with proper treatment the prognosis of diastolic dysfunction is more favourable than that of systolic dysfunction [7, 8]. In this paper, after discussing the mechanisms and common causes of LV diastolic dysfunction, we provide a practical approach for the assessment of LV diastolic function, focusing on the use of phase-contrast imaging (PC) in the evaluation of transmitral and pulmonary vein flow, and illustrate the different degrees of diastolic dysfunction. Mechanisms of diastolic dysfunction Conventionally, diastole can be divided into four phases: isovolumetric relaxation, left ventricle (LV) rapid early filling, diastasis and LV late filling or atrial contraction [9]. R. Duarte (*) Department of Radiology, Centro Hospitalar Gaia/ Espinho, Vila Nova de Gaia, Portugal e-mail: [email protected] G. Fernandez Department of Radiology, Hospital Povisa, Vigo, Spain e-mail: [email protected] Insights Imaging (2010) 1:183–192 DOI 10.1007/s13244-010-0026-7
-
Upload
independent -
Category
Documents
-
view
3 -
download
0
Transcript of Assessment of left ventricular diastolic function using 4-dimensional phase-contrast cardiac...
PICTORIAL REVIEW
Assessment of left ventricular diastolic function by MR:why, how and when
Ricardo Duarte & Gabriel Fernandez
Received: 21 April 2010 /Accepted: 11 May 2010 /Published online: 15 June 2010# European Society of Radiology 2010
Abstract Cardiovascular magnetic resonance (CMR), avaluable non-invasive technique for the evaluation of thecardiovascular system, has already been accepted asthe "gold standard" for the assessment of systolic function.The assessment of diastolic function is important not onlyfor diagnosis purposes, but also in terms of prognosis.ECG-triggering phase-contrast (PC) CMR allows theroutine assessment of diastolic function by measuring thetransmitral and pulmonary venous flow with high accuracyand reproducibility, using morphological and quantitativeparameters similar to those obtained by transthoracicechocardiography, which are so familiar to general cardiol-ogists. Therefore, the increasing role of CMR in theassessment of the cardiovascular system requires a greaterawareness and knowledge of this condition by radiologists.The aim of this study is to review the main mechanisms andcommon causes of left ventricle diastolic dysfunction,provide a practical approach for the assessment of LVdiastolic function and illustrate the different degrees ofdiastolic dysfunction.
Keywords Cardiovascular magnetic resonance (CMR) .
Systolic function . Diastolic function .Measurement
Introduction
Congestive heart failure (CHF) is the third most prevalentform of heart disease with 550,000 new cases being reportedannually [1]. CHF caused by a predominant abnormality indiastolic function has been increasingly recognised as acommon entity and a cause of significant morbidity andmortality, as 40–50% of the patients with heart failure mayhave isolated diastolic dysfunction with a normal or nearnormal left ventricle (LV) systolic function [2–4].
Moreover, in the last 2 decades, the proportion ofpatients with CHF and normal LV systolic function hasincreased considerably, from 38% to 54% [5].
Primary diastolic dysfunction is usually seen in patientswith hypertension, valvular heart disease and hypertrophic,restrictive or ischaemic cardiomyopathy [6].
An early diagnosis is decisive in order to preventirreversible structural alterations and systolic dysfunction.Distinguishing diastolic from systolic heart failure is crucial,because the treatment for one may exacerbate the other, andwith proper treatment the prognosis of diastolic dysfunctionis more favourable than that of systolic dysfunction [7, 8].
In this paper, after discussing the mechanisms and commoncauses of LV diastolic dysfunction, we provide a practicalapproach for the assessment of LV diastolic function, focusingon the use of phase-contrast imaging (PC) in the evaluation oftransmitral and pulmonary vein flow, and illustrate thedifferent degrees of diastolic dysfunction.
Mechanisms of diastolic dysfunction
Conventionally, diastole can be divided into four phases:isovolumetric relaxation, left ventricle (LV) rapid earlyfilling, diastasis and LV late filling or atrial contraction [9].
R. Duarte (*)Department of Radiology, Centro Hospitalar Gaia/ Espinho,Vila Nova de Gaia, Portugale-mail: [email protected]
G. FernandezDepartment of Radiology, Hospital Povisa,Vigo, Spaine-mail: [email protected]
Insights Imaging (2010) 1:183–192DOI 10.1007/s13244-010-0026-7
Diastolic dysfunction results from myocardial relaxationand ventricular compliance abnormalities that lead to anincrease in LV end-diastolic pressure. Myocardial relaxationis an active or ATP-consuming process that affects theisovolumetric relaxation phase and part of the rapid earlyfilling phase, while ventricular compliance is a passiveprocess that influences all three filling phases of diastole.
The mechanisms responsible for the abnormalities indiastolic function can be due to factors intrinsic to themyocardium itself (myocardial) or factors that are extrinsicto the myocardium (extramyocardial) [3]. Myocardialfactors include changes in calcium homeostasis, energetics(e.g., changes in the ADP/ATP ratio and ADP andphosphate concentration), myofilaments, cytoskeleton, neu-rohumoral and cardiac endothelial activation, as well asincreases in the content of extramyofilament cytoskeletalproteins [3, 10].
Diastolic CHF represents the clinical entity, characterisedby signs and symptoms due to increased extravascular waterand decreased tissue/organ perfusion, in which patients withCHF have normal or near normal systolic function andsignificant diastolic dysfunction [10].
Diagnosis and parameters for the assessment of diastolicfunction
Despite the high prevalence of diastolic dysfunction, thediagnosis remains challenging, as differentiation betweensystolic and diastolic CHF cannot be made based on theclinical history, physical examination or ECG, as both havesimilar changes [2], and so the diagnosis of diastolicdysfunction requires the demonstration of elevated fillingpressures. For this reason diagnostic criteria based onmeasurements of systolic and diastolic function have beendeveloped by The Working Group for the European Societyof Cardiology [11].
Because invasive cardiac catheterisation to demonstrateelevated filling pressures is not feasible for routine use,non-invasive techniques have been developed to assessdiastolic function, based on two biomechanical indices: leftventricle (LV) relaxation and compliance, which areinferred by measuring the transmitral inflow data withcorroborating pulmonary venous flow data [11, 12].Transthoracic echocardiograph (TTE) is the most importanttool in the evaluation of diastolic function. Nevertheless,this technique has some limitations: limited field of view,cosine θ errors relative to the flow direction and aninadequate acoustic window in approximately 15–20% ofpatients [13].
Cardiovascular magnetic resonance (CMR) imaging is anon-invasive technique that, on account of its high spatialand temporal resolution, excellent image quality and unique
potential of three-dimensional function analysis with greataccuracy and reproducibility, is already accepted as the"gold standard" for the assessment of LV morphology andsystolic function [14].
Recent technical developments of ECG-triggering PC-CMR allow the routine assessment of diastolic function bymeasuring the transmitral and pulmonary venous flow andevaluating the velocity vs. time curves generated, whichreflect the filling patterns in a similar way to the methodsused in TTE [15, 16].
CMR imaging
Basics and feasibility of phase-contrast imaging
Phase-contrast CMR is a validated and accurate non-invasive technique for the evaluation of velocity, volumeand pattern of blood flow [13, 17–24]. This technique isbased on the shift that moving spins of intravascularprotons acquire when flowing along a magnetic fieldgradient relative to stationary spins, which is directlyproportional to their velocity along the direction of thegradient, allowing velocity encoding of moving structuresand blood in any chosen direction and the calculation ofvelocities of the myocardium and blood flow [15, 25, 26].Phase-contrast sequences are able to encode the velocityperpendicular (through-plane) or parallel (in-plane) to thedirection of flow [15, 25, 26]. Two images are reconstructed,the magnitude "image", which provides anatomical informa-tion, and the velocity-encoding map "image", which providesflow information.
The value of the velocity encoding (VENC) correspondsto the amplitude of the magnetic gradient and is given incentimetres per second [15]. VENC is determined by theuser and establishes the highest and lowest detectablevelocity encoded; the closer it is to the maximum expectedvelocity in the region of interest, the more precise themeasurement becomes [15, 25, 26]. If the VENC is setbelow the peak velocity in the region of interest, aliasing orvelocity wraparound will occur [15, 25, 26].
Pressure gradients can also be calculated using themodified Bernoulli equation: Pressure Gradient mmHgð Þ ¼4� Vmax
2, where Vmax is the peak velocity (m/s) [15].The advantage of PC-CMR over TTE is that the first
quantifies the volume flow over the entire region (i.e., thevalve area) as opposed to TTE in which the flow andvelocity are assessed in a relatively small area, potentiallyproducing sample volume errors because the flow is nothomogeneous over such a region. Another advantage ofPC-CMR is that because of its high temporal and spatialresolution potential, cosine θ errors can easily be avoidedand flow can be measured with a higher level of accuracy.
184 Insights Imaging (2010) 1:183–192
In recent studies, PC-CMR flow measurement revealedlower peak velocities in comparison to Doppler echocar-diography [13, 27–31]. Nevertheless, it has been demon-strated that the measurement of flow by PC-CMR is moreaccurate than by Doppler echocardiography, as in the caseof Doppler, the flow is assessed in a relatively smallvessel area and assumes a constant velocity over thewhole vessel area, while in PC-CMR the volume flow isevaluated over the entire vessel area, explaining whyDoppler tends to overestimate peak velocities by as muchas 25% [13, 32, 33].
How to image the transmitral flow and the pulmonaryvenous flow
At our institution, all CMR examinations are performed in a1.5-T MR unit (Achieva, Philips Healthcare, The Netherlands)with a five-element phased array cardiac dedicated coil.
Localiser images are obtained in all three planes, andinteractive real-time images are acquired to plan the optimalcardiac planes, specifically the LV short axis, the LV
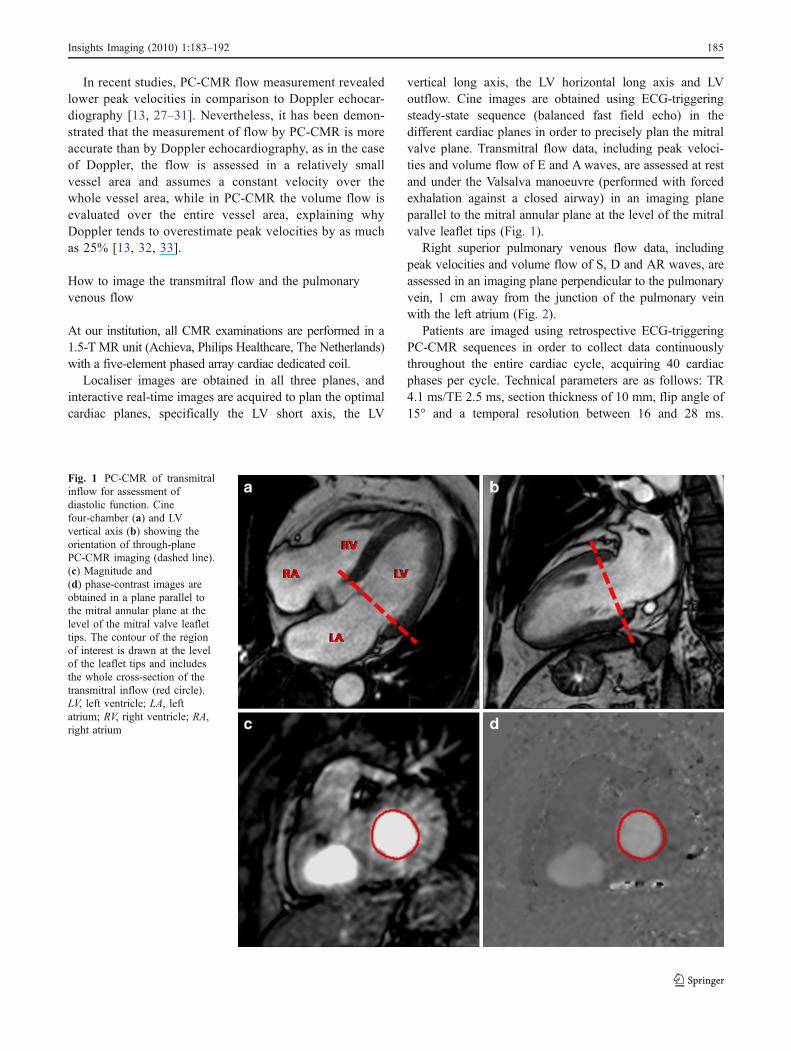
vertical long axis, the LV horizontal long axis and LVoutflow. Cine images are obtained using ECG-triggeringsteady-state sequence (balanced fast field echo) in thedifferent cardiac planes in order to precisely plan the mitralvalve plane. Transmitral flow data, including peak veloci-ties and volume flow of E and Awaves, are assessed at restand under the Valsalva manoeuvre (performed with forcedexhalation against a closed airway) in an imaging planeparallel to the mitral annular plane at the level of the mitralvalve leaflet tips (Fig. 1).
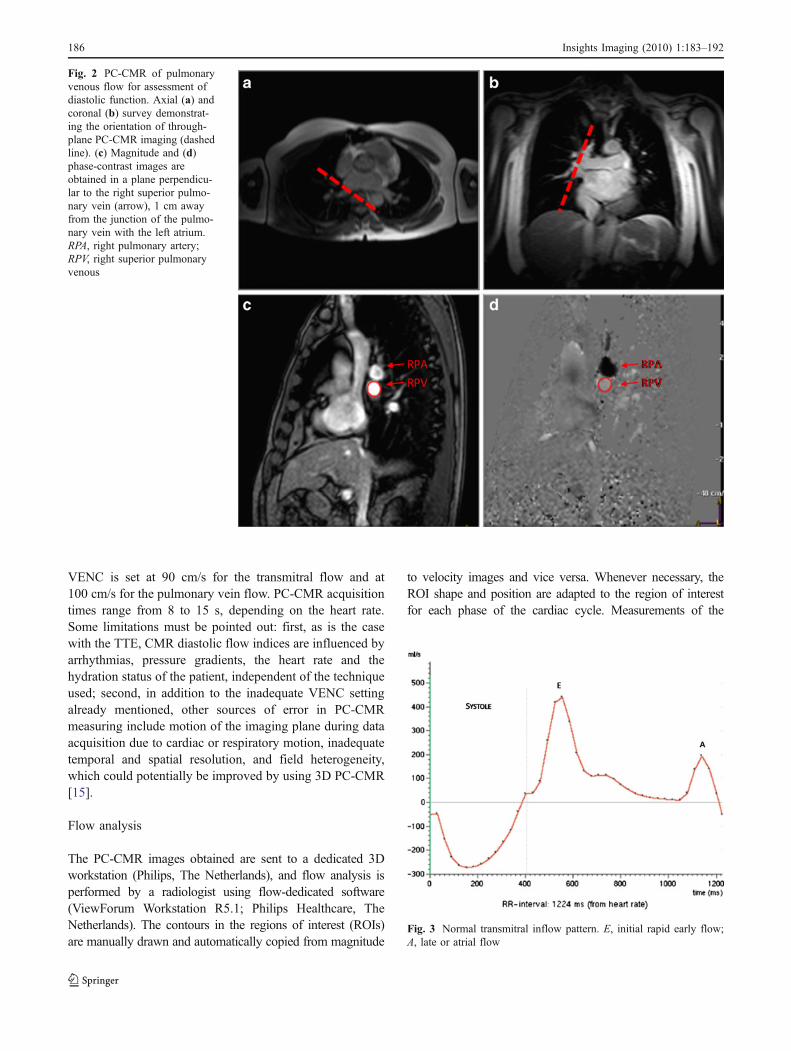
Right superior pulmonary venous flow data, includingpeak velocities and volume flow of S, D and AR waves, areassessed in an imaging plane perpendicular to the pulmonaryvein, 1 cm away from the junction of the pulmonary veinwith the left atrium (Fig. 2).
Patients are imaged using retrospective ECG-triggeringPC-CMR sequences in order to collect data continuouslythroughout the entire cardiac cycle, acquiring 40 cardiacphases per cycle. Technical parameters are as follows: TR4.1 ms/TE 2.5 ms, section thickness of 10 mm, flip angle of15° and a temporal resolution between 16 and 28 ms.
Fig. 1 PC-CMR of transmitralinflow for assessment ofdiastolic function. Cinefour-chamber (a) and LVvertical axis (b) showing theorientation of through-planePC-CMR imaging (dashed line).(c) Magnitude and(d) phase-contrast images areobtained in a plane parallel tothe mitral annular plane at thelevel of the mitral valve leaflettips. The contour of the regionof interest is drawn at the levelof the leaflet tips and includesthe whole cross-section of thetransmitral inflow (red circle).LV, left ventricle; LA, leftatrium; RV, right ventricle; RA,right atrium
Insights Imaging (2010) 1:183–192 185
VENC is set at 90 cm/s for the transmitral flow and at100 cm/s for the pulmonary vein flow. PC-CMR acquisitiontimes range from 8 to 15 s, depending on the heart rate.Some limitations must be pointed out: first, as is the casewith the TTE, CMR diastolic flow indices are influenced byarrhythmias, pressure gradients, the heart rate and thehydration status of the patient, independent of the techniqueused; second, in addition to the inadequate VENC settingalready mentioned, other sources of error in PC-CMRmeasuring include motion of the imaging plane during dataacquisition due to cardiac or respiratory motion, inadequatetemporal and spatial resolution, and field heterogeneity,which could potentially be improved by using 3D PC-CMR[15].
Flow analysis
The PC-CMR images obtained are sent to a dedicated 3Dworkstation (Philips, The Netherlands), and flow analysis isperformed by a radiologist using flow-dedicated software(ViewForum Workstation R5.1; Philips Healthcare, TheNetherlands). The contours in the regions of interest (ROIs)are manually drawn and automatically copied from magnitude
to velocity images and vice versa. Whenever necessary, theROI shape and position are adapted to the region of interestfor each phase of the cardiac cycle. Measurements of the
Fig. 2 PC-CMR of pulmonaryvenous flow for assessment ofdiastolic function. Axial (a) andcoronal (b) survey demonstrat-ing the orientation of through-plane PC-CMR imaging (dashedline). (c) Magnitude and (d)phase-contrast images areobtained in a plane perpendicu-lar to the right superior pulmo-nary vein (arrow), 1 cm awayfrom the junction of the pulmo-nary vein with the left atrium.RPA, right pulmonary artery;RPV, right superior pulmonaryvenous
Fig. 3 Normal transmitral inflow pattern. E, initial rapid early flow;A, late or atrial flow
186 Insights Imaging (2010) 1:183–192
transmitral inflow yielding information on E and Awaves andon pulmonary venous flow and peak velocities of S, D andAR waves are displayed on a velocity or flow vs. time graph.The peak velocity ratio of the E and A waves, called the E/A
ratio, is calculated. The deceleration time (DT) is alsocalculated using the method described by Appleton et al. [34].
Normal transmitral and pulmonary venous flow pattern
The normal transmitral inflow curve is characterised by aninitial rapid early flow (E wave) and a late or atrial flow (Awave). As the E wave is higher than the A wave (E>A), theE/A ratio is greater than 1 (Fig. 3).
The normal pulmonary venous flow curve consists ofone or two systolic peaks and one diastolic peak, withequivalent flow velocities, plus a reversed flow in enddiastole (Fig. 4).
The systolic (S) flow corresponds to flow into the leftatrium (LA) during ventricular systole and consists ofone or two peaks; the first systolic peak (S1) is causedby the reduction of the LA pressure due to LA relaxationand longitudinal LV shortening with subsequent motionof the annulus of the atrioventricular valve, and thesecond systolic peak (S2) reflects right ventricular strokevolume and atrial compliance. The diastolic (D) flowrepresents the reduction of the LA pressure duringventricular filling in early diastole. The reversed flow iscaused by atrial contraction and is called atrial reversed
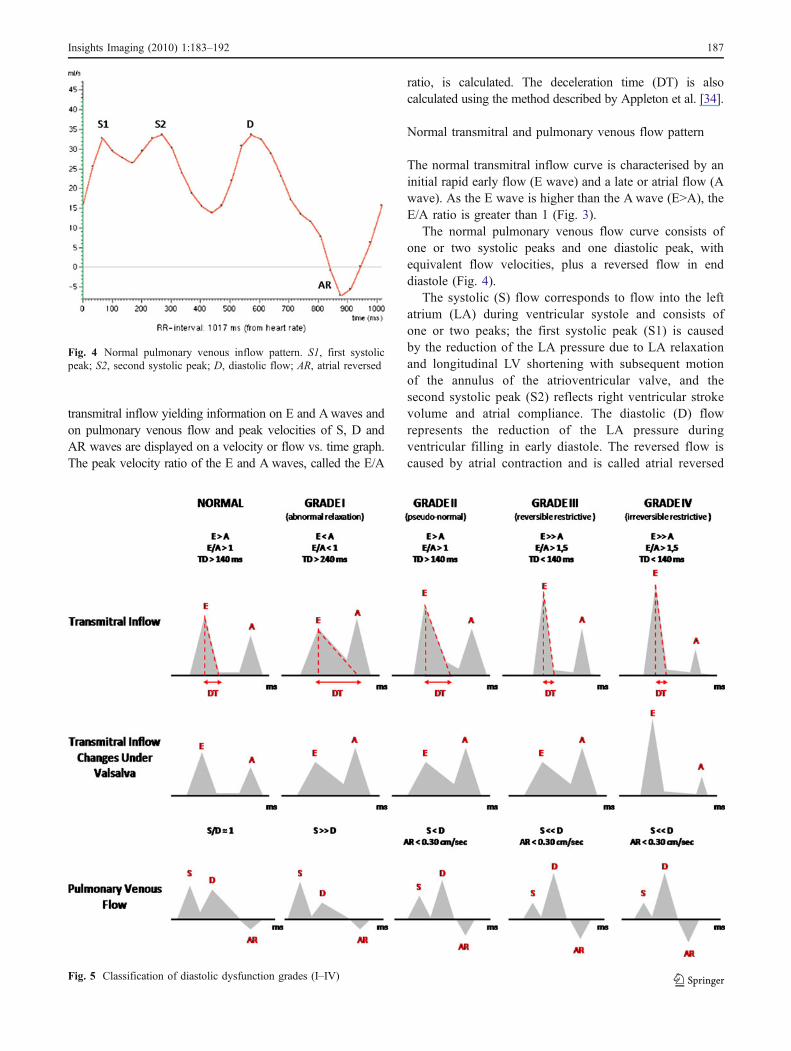
Fig. 4 Normal pulmonary venous inflow pattern. S1, first systolicpeak; S2, second systolic peak; D, diastolic flow; AR, atrial reversed
Fig. 5 Classification of diastolic dysfunction grades (I–IV)
Insights Imaging (2010) 1:183–192 187
(AR). The normal AR wave velocity is less than0.30 cm/s.
Diastolic dysfunction patterns
Diastolic dysfunction can be classified in four grades [35](Fig. 5).
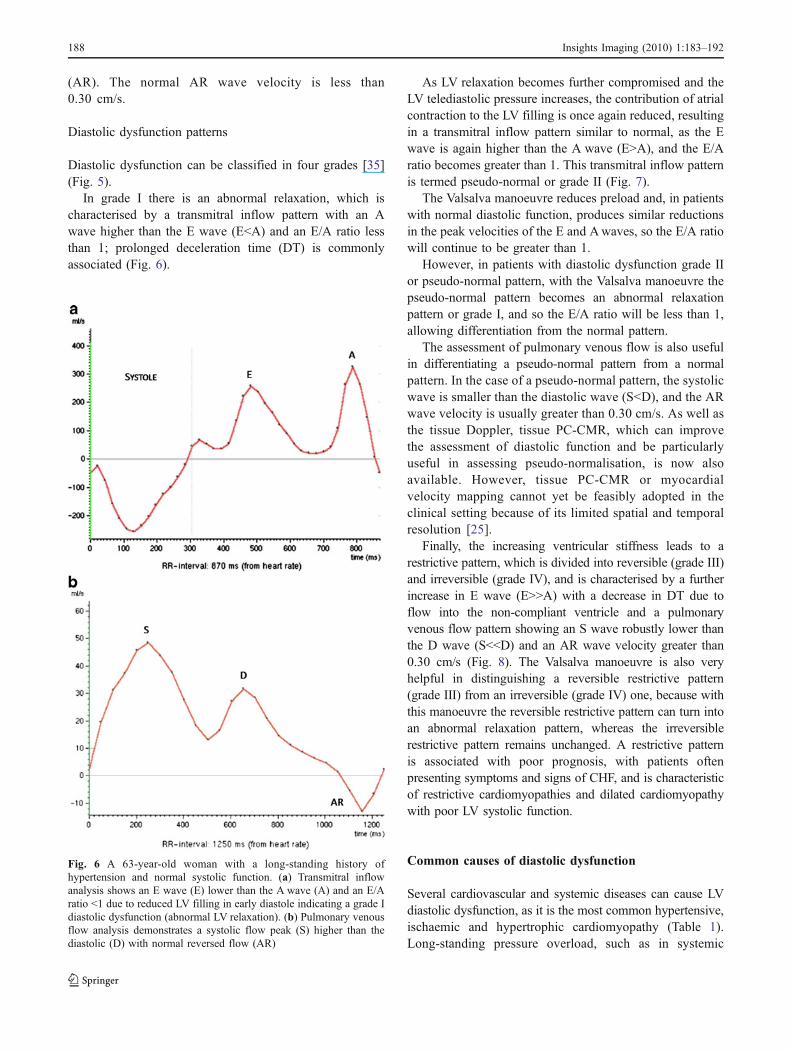
In grade I there is an abnormal relaxation, which ischaracterised by a transmitral inflow pattern with an Awave higher than the E wave (E<A) and an E/A ratio lessthan 1; prolonged deceleration time (DT) is commonlyassociated (Fig. 6).
As LV relaxation becomes further compromised and theLV telediastolic pressure increases, the contribution of atrialcontraction to the LV filling is once again reduced, resultingin a transmitral inflow pattern similar to normal, as the Ewave is again higher than the A wave (E>A), and the E/Aratio becomes greater than 1. This transmitral inflow patternis termed pseudo-normal or grade II (Fig. 7).
The Valsalva manoeuvre reduces preload and, in patientswith normal diastolic function, produces similar reductionsin the peak velocities of the E and Awaves, so the E/A ratiowill continue to be greater than 1.
However, in patients with diastolic dysfunction grade IIor pseudo-normal pattern, with the Valsalva manoeuvre thepseudo-normal pattern becomes an abnormal relaxationpattern or grade I, and so the E/A ratio will be less than 1,allowing differentiation from the normal pattern.
The assessment of pulmonary venous flow is also usefulin differentiating a pseudo-normal pattern from a normalpattern. In the case of a pseudo-normal pattern, the systolicwave is smaller than the diastolic wave (S<D), and the ARwave velocity is usually greater than 0.30 cm/s. As well asthe tissue Doppler, tissue PC-CMR, which can improvethe assessment of diastolic function and be particularlyuseful in assessing pseudo-normalisation, is now alsoavailable. However, tissue PC-CMR or myocardialvelocity mapping cannot yet be feasibly adopted in theclinical setting because of its limited spatial and temporalresolution [25].
Finally, the increasing ventricular stiffness leads to arestrictive pattern, which is divided into reversible (grade III)and irreversible (grade IV), and is characterised by a furtherincrease in E wave (E>>A) with a decrease in DT due toflow into the non-compliant ventricle and a pulmonaryvenous flow pattern showing an S wave robustly lower thanthe D wave (S<<D) and an AR wave velocity greater than0.30 cm/s (Fig. 8). The Valsalva manoeuvre is also veryhelpful in distinguishing a reversible restrictive pattern(grade III) from an irreversible (grade IV) one, because withthis manoeuvre the reversible restrictive pattern can turn intoan abnormal relaxation pattern, whereas the irreversiblerestrictive pattern remains unchanged. A restrictive patternis associated with poor prognosis, with patients oftenpresenting symptoms and signs of CHF, and is characteristicof restrictive cardiomyopathies and dilated cardiomyopathywith poor LV systolic function.
Common causes of diastolic dysfunction
Several cardiovascular and systemic diseases can cause LVdiastolic dysfunction, as it is the most common hypertensive,ischaemic and hypertrophic cardiomyopathy (Table 1).Long-standing pressure overload, such as in systemic
Fig. 6 A 63-year-old woman with a long-standing history ofhypertension and normal systolic function. (a) Transmitral inflowanalysis shows an E wave (E) lower than the A wave (A) and an E/Aratio <1 due to reduced LV filling in early diastole indicating a grade Idiastolic dysfunction (abnormal LV relaxation). (b) Pulmonary venousflow analysis demonstrates a systolic flow peak (S) higher than thediastolic (D) with normal reversed flow (AR)
188 Insights Imaging (2010) 1:183–192
hypertension and aortic valve stenosis, leads to an adaptiveLV hypertrophy in order to normalise myocardial walltension. Nevertheless, diastolic dysfunction can occur evenin the absence of LV hypertrophy because of subnormalhigh-energy phosphate metabolism [6]. For that reason, LVdiastolic dysfunction can be found in only 25% ofasymptomatic hypertensive patients without LV hypertrophybut in 90% of those with LV hypertrophy [6].
Ischaemic cardiomyopathy is also a common cause ofdiastolic dysfunction and is found in approximately 60% ofall patients with acute myocardial infarction [6]. Thisresults from several mechanisms, such as calcium overloadof the myocytes with prolonged and incomplete relaxation,LV asynchrony, papillary muscle dysfunction with valvularincompetence, LV myocardial stunning, hibernation andpost-infarction remodelling [6, 16]. Hypertrophic cardio-myopathy is considered the prototype for diastolic heartfailure. Relaxation abnormalities in hypertrophic hearts aredue to altered myocardial high-energy phosphate metabo-lism and changes in the passive elastic properties of themyocardium, such as non-uniform myocardial hypertrophyand fibrosis [6, 16].
In patients with infiltrative cardiomyopathies, diastolicdysfunction is commonly the primary myocardial disorderand is characterised by increased LV wall thickness andreduced LV compliance, often evolving to a restrictivepattern.
Prognosis of diastolic dysfunction
Several studies have demonstrated the high morbidityassociated with diastolic dysfunction, resulting in frequenthospital admissions with a 1-year readmission rate of closeto 50% in patients with diastolic CHF [36–41], which iscomparable to that of patients with systolic CHF [2]. Themortality rate after 5 years is 68% in patients with diastolicCHF compared with 82% of patients with systolic CHF[42].
However, any degree of diastolic dysfunction is animportant prognostic factor, and it has been demonstratedthat in hypertensive patients the abnormal relaxation isassociated with an increased risk of cardiovascular eventsand mortality [42].
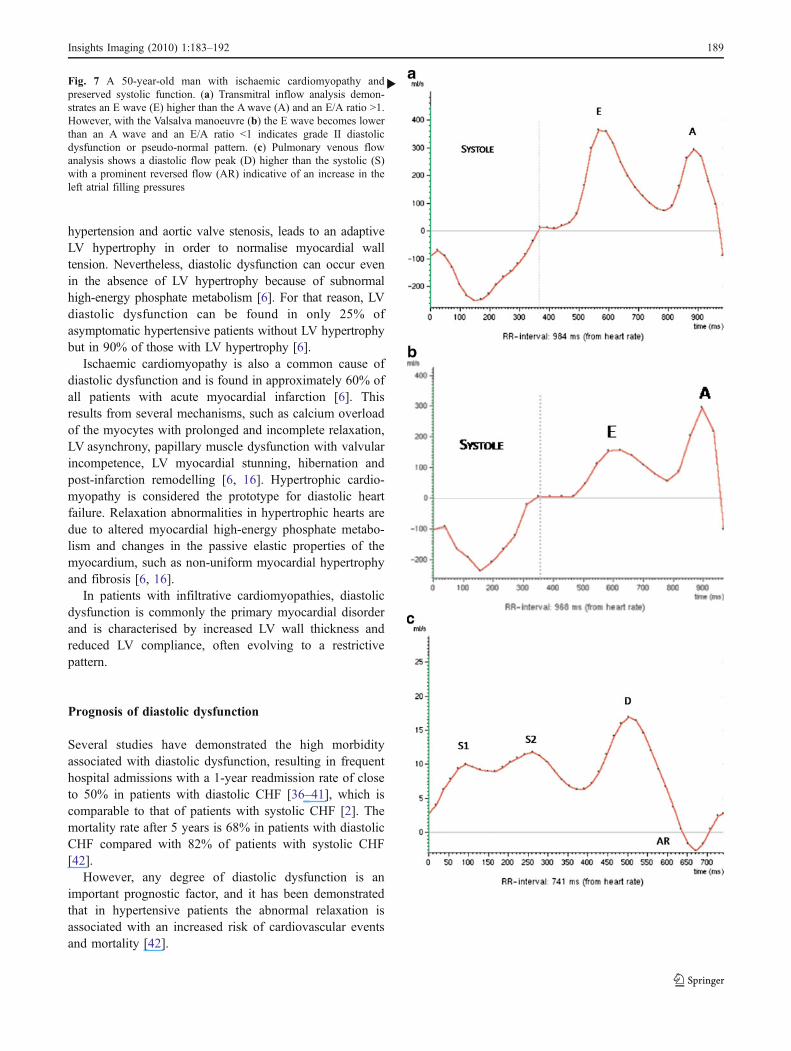
�Fig. 7 A 50-year-old man with ischaemic cardiomyopathy andpreserved systolic function. (a) Transmitral inflow analysis demon-strates an E wave (E) higher than the Awave (A) and an E/A ratio >1.However, with the Valsalva manoeuvre (b) the E wave becomes lowerthan an A wave and an E/A ratio <1 indicates grade II diastolicdysfunction or pseudo-normal pattern. (c) Pulmonary venous flowanalysis shows a diastolic flow peak (D) higher than the systolic (S)with a prominent reversed flow (AR) indicative of an increase in theleft atrial filling pressures
Insights Imaging (2010) 1:183–192 189
Conclusions
In clinical practice, diastolic dysfunction is a common entity,especially in patients with hypertension and ischaemiccardiomyopathy, and it is the predominant cause of CHF in40–50% of patients.
Cardiovascular magnetic resonance imaging is consideredthe "gold standard" for evaluating the morphology and LVsystolic function, and is widely used in the evaluation ofseveral cardiovascular and systemic diseases. As the pres-ence of diastolic dysfunction is associated with a poorprognostic factor, we consider it important to include thesystematic assessment of diastolic function as part of theroutine protocol of many diseases, such as in patients withCHF and normal LV ejection fraction, ischaemia, hyperten-sion, hypertrophy or infiltrative cardiomyopathy. In thisgroup of patients the routine assessment of diastolic functionby CMR using PC-CMR allows the evaluation of LV filling
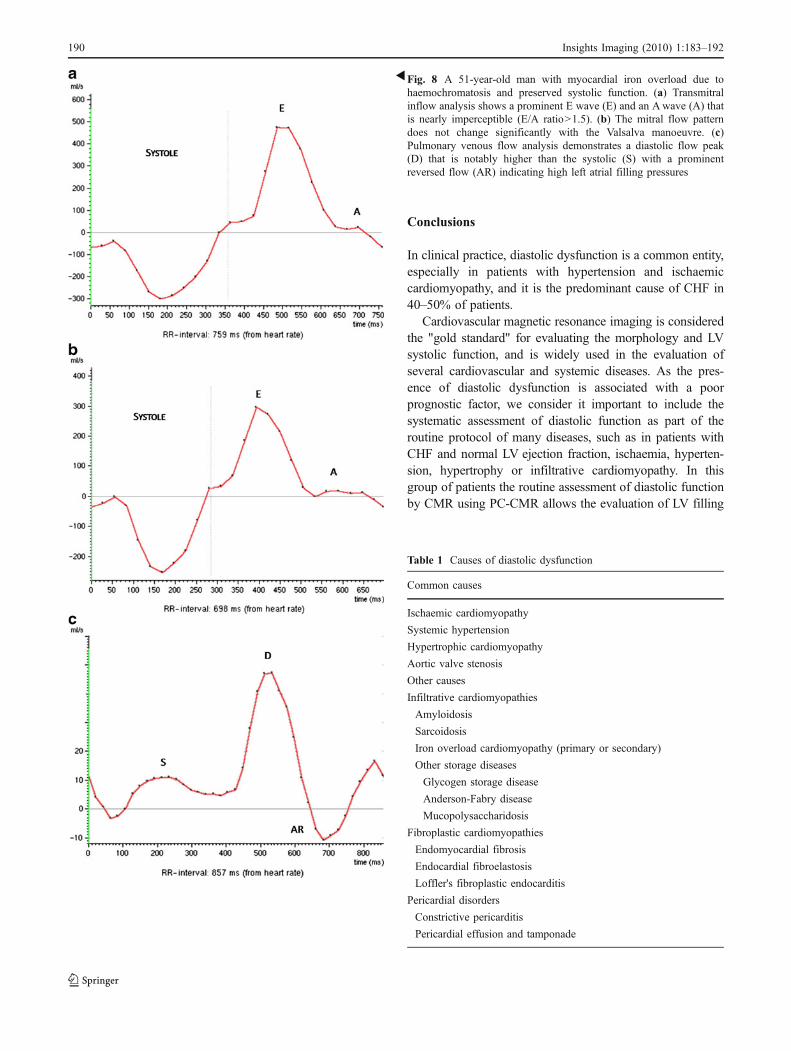
�Fig. 8 A 51-year-old man with myocardial iron overload due tohaemochromatosis and preserved systolic function. (a) Transmitralinflow analysis shows a prominent E wave (E) and an Awave (A) thatis nearly imperceptible (E/A ratio>1.5). (b) The mitral flow patterndoes not change significantly with the Valsalva manoeuvre. (c)Pulmonary venous flow analysis demonstrates a diastolic flow peak(D) that is notably higher than the systolic (S) with a prominentreversed flow (AR) indicating high left atrial filling pressures
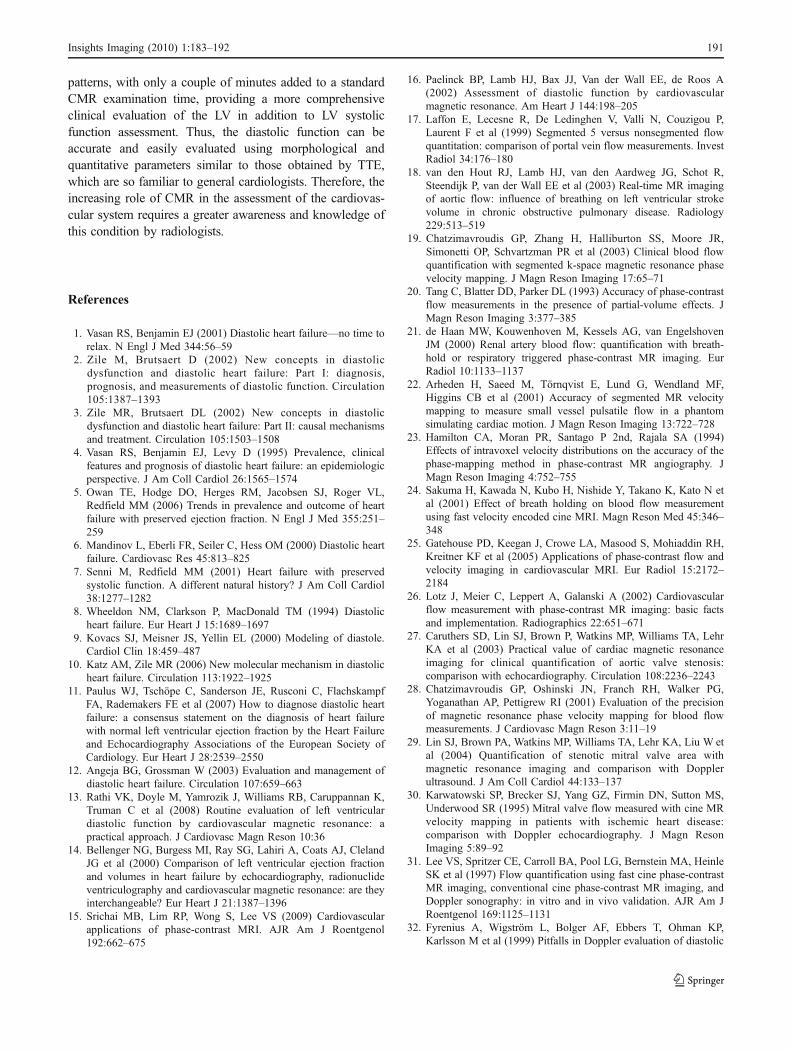
Table 1 Causes of diastolic dysfunction
Common causes
Ischaemic cardiomyopathy
Systemic hypertension
Hypertrophic cardiomyopathy
Aortic valve stenosis
Other causes
Infiltrative cardiomyopathies
Amyloidosis
Sarcoidosis
Iron overload cardiomyopathy (primary or secondary)
Other storage diseases
Glycogen storage disease
Anderson-Fabry disease
Mucopolysaccharidosis
Fibroplastic cardiomyopathies
Endomyocardial fibrosis
Endocardial fibroelastosis
Loffler's fibroplastic endocarditis
Pericardial disorders
Constrictive pericarditis
Pericardial effusion and tamponade
190 Insights Imaging (2010) 1:183–192
patterns, with only a couple of minutes added to a standardCMR examination time, providing a more comprehensiveclinical evaluation of the LV in addition to LV systolicfunction assessment. Thus, the diastolic function can beaccurate and easily evaluated using morphological andquantitative parameters similar to those obtained by TTE,which are so familiar to general cardiologists. Therefore, theincreasing role of CMR in the assessment of the cardiovas-cular system requires a greater awareness and knowledge ofthis condition by radiologists.
References
1. Vasan RS, Benjamin EJ (2001) Diastolic heart failure—no time torelax. N Engl J Med 344:56–59
2. Zile M, Brutsaert D (2002) New concepts in diastolicdysfunction and diastolic heart failure: Part I: diagnosis,prognosis, and measurements of diastolic function. Circulation105:1387–1393
3. Zile MR, Brutsaert DL (2002) New concepts in diastolicdysfunction and diastolic heart failure: Part II: causal mechanismsand treatment. Circulation 105:1503–1508
4. Vasan RS, Benjamin EJ, Levy D (1995) Prevalence, clinicalfeatures and prognosis of diastolic heart failure: an epidemiologicperspective. J Am Coll Cardiol 26:1565–1574
5. Owan TE, Hodge DO, Herges RM, Jacobsen SJ, Roger VL,Redfield MM (2006) Trends in prevalence and outcome of heartfailure with preserved ejection fraction. N Engl J Med 355:251–259
6. Mandinov L, Eberli FR, Seiler C, Hess OM (2000) Diastolic heartfailure. Cardiovasc Res 45:813–825
7. Senni M, Redfield MM (2001) Heart failure with preservedsystolic function. A different natural history? J Am Coll Cardiol38:1277–1282
8. Wheeldon NM, Clarkson P, MacDonald TM (1994) Diastolicheart failure. Eur Heart J 15:1689–1697
9. Kovacs SJ, Meisner JS, Yellin EL (2000) Modeling of diastole.Cardiol Clin 18:459–487
10. Katz AM, Zile MR (2006) New molecular mechanism in diastolicheart failure. Circulation 113:1922–1925
11. Paulus WJ, Tschöpe C, Sanderson JE, Rusconi C, FlachskampfFA, Rademakers FE et al (2007) How to diagnose diastolic heartfailure: a consensus statement on the diagnosis of heart failurewith normal left ventricular ejection fraction by the Heart Failureand Echocardiography Associations of the European Society ofCardiology. Eur Heart J 28:2539–2550
12. Angeja BG, Grossman W (2003) Evaluation and management ofdiastolic heart failure. Circulation 107:659–663
13. Rathi VK, Doyle M, Yamrozik J, Williams RB, Caruppannan K,Truman C et al (2008) Routine evaluation of left ventriculardiastolic function by cardiovascular magnetic resonance: apractical approach. J Cardiovasc Magn Reson 10:36
14. Bellenger NG, Burgess MI, Ray SG, Lahiri A, Coats AJ, ClelandJG et al (2000) Comparison of left ventricular ejection fractionand volumes in heart failure by echocardiography, radionuclideventriculography and cardiovascular magnetic resonance: are theyinterchangeable? Eur Heart J 21:1387–1396
15. Srichai MB, Lim RP, Wong S, Lee VS (2009) Cardiovascularapplications of phase-contrast MRI. AJR Am J Roentgenol192:662–675
16. Paelinck BP, Lamb HJ, Bax JJ, Van der Wall EE, de Roos A(2002) Assessment of diastolic function by cardiovascularmagnetic resonance. Am Heart J 144:198–205
17. Laffon E, Lecesne R, De Ledinghen V, Valli N, Couzigou P,Laurent F et al (1999) Segmented 5 versus nonsegmented flowquantitation: comparison of portal vein flow measurements. InvestRadiol 34:176–180
18. van den Hout RJ, Lamb HJ, van den Aardweg JG, Schot R,Steendijk P, van der Wall EE et al (2003) Real-time MR imagingof aortic flow: influence of breathing on left ventricular strokevolume in chronic obstructive pulmonary disease. Radiology229:513–519
19. Chatzimavroudis GP, Zhang H, Halliburton SS, Moore JR,Simonetti OP, Schvartzman PR et al (2003) Clinical blood flowquantification with segmented k-space magnetic resonance phasevelocity mapping. J Magn Reson Imaging 17:65–71
20. Tang C, Blatter DD, Parker DL (1993) Accuracy of phase-contrastflow measurements in the presence of partial-volume effects. JMagn Reson Imaging 3:377–385
21. de Haan MW, Kouwenhoven M, Kessels AG, van EngelshovenJM (2000) Renal artery blood flow: quantification with breath-hold or respiratory triggered phase-contrast MR imaging. EurRadiol 10:1133–1137
22. Arheden H, Saeed M, Törnqvist E, Lund G, Wendland MF,Higgins CB et al (2001) Accuracy of segmented MR velocitymapping to measure small vessel pulsatile flow in a phantomsimulating cardiac motion. J Magn Reson Imaging 13:722–728
23. Hamilton CA, Moran PR, Santago P 2nd, Rajala SA (1994)Effects of intravoxel velocity distributions on the accuracy of thephase-mapping method in phase-contrast MR angiography. JMagn Reson Imaging 4:752–755
24. Sakuma H, Kawada N, Kubo H, Nishide Y, Takano K, Kato N etal (2001) Effect of breath holding on blood flow measurementusing fast velocity encoded cine MRI. Magn Reson Med 45:346–348
25. Gatehouse PD, Keegan J, Crowe LA, Masood S, Mohiaddin RH,Kreitner KF et al (2005) Applications of phase-contrast flow andvelocity imaging in cardiovascular MRI. Eur Radiol 15:2172–2184
26. Lotz J, Meier C, Leppert A, Galanski A (2002) Cardiovascularflow measurement with phase-contrast MR imaging: basic factsand implementation. Radiographics 22:651–671
27. Caruthers SD, Lin SJ, Brown P, Watkins MP, Williams TA, LehrKA et al (2003) Practical value of cardiac magnetic resonanceimaging for clinical quantification of aortic valve stenosis:comparison with echocardiography. Circulation 108:2236–2243
28. Chatzimavroudis GP, Oshinski JN, Franch RH, Walker PG,Yoganathan AP, Pettigrew RI (2001) Evaluation of the precisionof magnetic resonance phase velocity mapping for blood flowmeasurements. J Cardiovasc Magn Reson 3:11–19
29. Lin SJ, Brown PA, Watkins MP, Williams TA, Lehr KA, Liu W etal (2004) Quantification of stenotic mitral valve area withmagnetic resonance imaging and comparison with Dopplerultrasound. J Am Coll Cardiol 44:133–137
30. Karwatowski SP, Brecker SJ, Yang GZ, Firmin DN, Sutton MS,Underwood SR (1995) Mitral valve flow measured with cine MRvelocity mapping in patients with ischemic heart disease:comparison with Doppler echocardiography. J Magn ResonImaging 5:89–92
31. Lee VS, Spritzer CE, Carroll BA, Pool LG, Bernstein MA, HeinleSK et al (1997) Flow quantification using fast cine phase-contrastMR imaging, conventional cine phase-contrast MR imaging, andDoppler sonography: in vitro and in vivo validation. AJR Am JRoentgenol 169:1125–1131
32. Fyrenius A, Wigström L, Bolger AF, Ebbers T, Ohman KP,Karlsson M et al (1999) Pitfalls in Doppler evaluation of diastolic
Insights Imaging (2010) 1:183–192 191
function: insights from 3-dimensional magnetic resonance imag-ing. J Am Soc Echocardiogr 12:817–826
33. Hoskins PR (1996) Accuracy of maximum velocity estimatesmade using Doppler ultrasound systems. Br J Radiol 69:172–177
34. Appleton CP, Jensen JL, Hatle LK, Oh JK (1997) Dopplerevaluation of left and right ventricular diastolic function: atechnical guide for obtaining optimal flow velocity recordings. JAm Soc Echocardiogr 10:271–292
35. Nishimura RA, Tajik J (1997) Evaluation of diastolic filling of leftventricle in health and disease: Doppler echocardiography is theclinician's Rosetta Stone. J Am Coll Cardiol 30:8–18
36. Senni M, Tribouilloy CM, Rodeheffer RJ, Jacobsen SJ, Evans JM,Bailey KR et al (1998) Congestive heart failure in the community:a study of all incident cases in Olmsted County, Minnesota, in1991. Circulation 98:2282–2289
37. Vasan RS, Larson MG, Benjamin EJ, Evans JC, Reiss CK, LevyD (1999) Congestive heart failure in subjects with normal versusreduced left ventricular ejection fraction: prevalence and mortalityin a population-based cohort. J Am Coll Cardiol 33:1948–1955
38. Kitzman DW, Gardin JM, Gottdiener JS, Arnold A, Boineau R,Aurigemma G et al (2001) Importance of heart failure withpreserved systolic function in patients > or = 65 years of age. CHSResearch Group. Cardiovascular Health Study. Am J Cardiol87:413–419
39. Aurigemma GP, Gottdiener JS, Shemanski L, Gardin J, KitzmanD (2001) Predictive value of systolic and diastolic function forincident congestive heart failure in the elderly: the cardiovascularhealth study. J Am Coll Cardiol 37:1042–1048
40. Dauterman KW, Massie BM, Gheorghiade M (1998) Heart failureassociated with preserved systolic function: a common and costlyclinical entity. Am Heart J 135:S310–S319
41. O'Connor CM, Gattis WA, Shaw L, Cuffe MS, Califf RM (2000)Clinical characteristics and long-term outcomes of patients withheart failure and preserved systolic function. Am J Cardiol86:863–867
42. Galderisi M (2005) Diastolic dysfunction and diastolic heartfailure: diagnostic, prognostic and therapeutic aspects. CardiovascUltrasound 3:9
192 Insights Imaging (2010) 1:183–192