Combined right ventricular systolic and diastolic dysfunction represents a strong determinant of...
10
Combined right ventricular systolic and diastolic dysfunction represents a strong determinant of poor prognosis in patients with symptomatic heart failure Jaroslav Meluzin a, T , Lenka S ˇ pinarova ´ a , Petr Hude a , Jan Krejc ˇı ´ a , Ladislav Dus ˇek b , Jirˇı ´ Vı ´tovec a , Roman Panovsky a a St. Anna Hospital, Masaryk University, First Department of Internal Medicine/Cardioangiology, Brno, Czech Republic b Masaryk University, Centre of Biostatistics and Analyses, Brno, Czech Republic Received 19 July 2004; received in revised form 27 October 2004; accepted 12 December 2004 Available online 5 March 2005 Abstract Background: The presence of right ventricular systolic dysfunction is known to significantly worsen prognosis of patients with heart failure. However, the prognostic impact of right ventricular diastolic dysfunction and of its combination with right ventricular systolic dysfunction and with other prognostic markers has not yet been systematically studied. The aim of this study was to assess the prognostic impact of combined right ventricular systolic and diastolic dysfunction in patients with symptomatic heart failure due to ischemic or idiopathic dilated cardiomyopathy. Methods: The study included 177 consecutive patients with symptomatic heart failure (mean left ventricular ejection fraction of 23%). All patients underwent clinical and laboratory examination, standard echocardiography completed by Doppler tissue imaging of the tricuspid annular motion, and right-sided heart catheterization. They were followed up for a mean period of 16 months (range, 1–48 months). Results: During the follow-up, there were 28 cardiac-related deaths and 35 non-fatal cardiac events (31 hospitalizations for heart failure decompensation and 4 hospitalizations for malignant arrhythmias requiring the implantation of a cardioverter–defibrillator). The multivariate stepwise Cox regression modeling revealed the right ventricular systolic (represented by the peak systolic tricuspid annular velocity—Sa) and diastolic (represented by the peak early diastolic tricuspid annular velocity—Ea) function to be the independent predictors of event-free survival or survival ( p b0.01). The Sa separated better between patients with and without the risk of cardiac events ( p b0.05), while the Ea appeared to further distinguish patients with increased risk (those at risk of late event from those at risk of early non-fatal event and early death). The strongest predictive information was obtained by the combination of Sa and Ea creating the Sa/Ea categories. The Sa/Ea I category of patients (Saz10.8 cm s 1 and Eaz8.9 cm s 1 ) had excellent prognosis. On the other hand, the Sa/Ea IV category (Sab10.8 cm s 1 and Eab8.9 cm s 1 ) was found to be at a very high risk of cardiac events ( pb0.001 vs. Sa/Ea I). Imbalanced categories of patients (Sa/Ea II and III) with only one component (Sa or Ea) pathologically decreased were at medium risk when assessing event-free survival. However, a significantly better survival ( p b0.05) was found in patients with Eaz8.9 cm s 1 (Sa/Ea I and III categories) as compared with those having Eab8.9 cm s 1 (Sa/Ea II and IV categories). Thus, in contrast to event-free survival, the survival pattern was determined mainly by the Ea value with only little additional contribution of Sa. Conclusions: The assessment of right ventricular systolic and diastolic function provides complementary information with a very high power to stratify prognosis of patients with heart failure. The combination of right ventricular systolic and diastolic dysfunction identifies those with a very poor prognosis. D 2005 Elsevier Ireland Ltd. All rights reserved. Keywords: Prognosis; Heart failure; Right ventricular function 0167-5273/$ - see front matter D 2005 Elsevier Ireland Ltd. All rights reserved. doi:10.1016/j.ijcard.2004.12.031 T Corresponding author. E-mail address: [email protected] (J. Meluzin). International Journal of Cardiology 105 (2005) 164 – 173 www.elsevier.com/locate/ijcard
-
Upload
independent -
Category
Documents
-
view
1 -
download
0
Transcript of Combined right ventricular systolic and diastolic dysfunction represents a strong determinant of...
www.elsevier.com/locate/ijcard
International Journal of Cardio
Combined right ventricular systolic and diastolic dysfunction
represents a strong determinant of poor prognosis in patients
with symptomatic heart failure
Jaroslav Meluzina,T, Lenka Spinarovaa, Petr Hudea, Jan Krejcıa, Ladislav Dusekb,
Jirı Vıtoveca, Roman Panovskya
aSt. Anna Hospital, Masaryk University, First Department of Internal Medicine/Cardioangiology, Brno, Czech RepublicbMasaryk University, Centre of Biostatistics and Analyses, Brno, Czech Republic
Received 19 July 2004; received in revised form 27 October 2004; accepted 12 December 2004
Available online 5 March 2005
Abstract
Background: The presence of right ventricular systolic dysfunction is known to significantly worsen prognosis of patients with heart failure.
However, the prognostic impact of right ventricular diastolic dysfunction and of its combination with right ventricular systolic dysfunction
and with other prognostic markers has not yet been systematically studied. The aim of this study was to assess the prognostic impact of
combined right ventricular systolic and diastolic dysfunction in patients with symptomatic heart failure due to ischemic or idiopathic dilated
cardiomyopathy.
Methods: The study included 177 consecutive patients with symptomatic heart failure (mean left ventricular ejection fraction of 23%). All
patients underwent clinical and laboratory examination, standard echocardiography completed by Doppler tissue imaging of the tricuspid
annular motion, and right-sided heart catheterization. They were followed up for a mean period of 16 months (range, 1–48 months).
Results: During the follow-up, there were 28 cardiac-related deaths and 35 non-fatal cardiac events (31 hospitalizations for heart failure
decompensation and 4 hospitalizations for malignant arrhythmias requiring the implantation of a cardioverter–defibrillator). The multivariate
stepwise Cox regression modeling revealed the right ventricular systolic (represented by the peak systolic tricuspid annular velocity—Sa) and
diastolic (represented by the peak early diastolic tricuspid annular velocity—Ea) function to be the independent predictors of event-free
survival or survival ( pb0.01). The Sa separated better between patients with and without the risk of cardiac events ( pb0.05), while the Ea
appeared to further distinguish patients with increased risk (those at risk of late event from those at risk of early non-fatal event and early
death). The strongest predictive information was obtained by the combination of Sa and Ea creating the Sa/Ea categories. The Sa/Ea I
category of patients (Saz10.8 cm s�1 and Eaz8.9 cm s�1) had excellent prognosis. On the other hand, the Sa/Ea IV category (Sab10.8 cm
s�1 and Eab8.9 cm s�1) was found to be at a very high risk of cardiac events ( pb0.001 vs. Sa/Ea I). Imbalanced categories of patients (Sa/Ea
II and III) with only one component (Sa or Ea) pathologically decreased were at medium risk when assessing event-free survival. However, a
significantly better survival ( pb0.05) was found in patients with Eaz8.9 cm s�1 (Sa/Ea I and III categories) as compared with those having
Eab8.9 cm s�1 (Sa/Ea II and IV categories). Thus, in contrast to event-free survival, the survival pattern was determined mainly by the Ea
value with only little additional contribution of Sa.
Conclusions: The assessment of right ventricular systolic and diastolic function provides complementary information with a very high power
to stratify prognosis of patients with heart failure. The combination of right ventricular systolic and diastolic dysfunction identifies those with
a very poor prognosis.
D 2005 Elsevier Ireland Ltd. All rights reserved.
Keywords: Prognosis; Heart failure; Right ventricular function
0167-5273/$ - s
doi:10.1016/j.ijc
T Correspondi
E-mail addr
logy 105 (2005) 164–173
ee front matter D 2005 Elsevier Ireland Ltd. All rights reserved.
ard.2004.12.031
ng author.
ess: [email protected] (J. Meluzin).

J. Meluzin et al. / International Journal of Cardiology 105 (2005) 164–173 165
1. Introduction
The prognosis of patients with symptomatic heart
failure is poor [1–3]. The identification of variables with
the ability to predict a high risk of cardiac events may
result in a more aggressive medical or surgical therapy
leading to the improvement of patient survival. It is now
well established that the right ventricular systolic perform-
ance is a powerful predictor of mortality and morbidity in
patients with heart failure secondary to ischemic or
idiopathic dilated cardiomyopathy [4–6]. However, little
is known about the prognostic importance of the right
ventricular diastolic function which probably affects the
morbidity, but the impact on mortality has not been proven
[7]. Previous reports studying the prognostic power of left
ventricular function convincingly demonstrated that the
combination of significant systolic and diastolic dysfunc-
tion provides better prognostic information than does the
left ventricular systolic dysfunction alone [7,8]. A similar
additive prognostic impact of systolic and diastolic
dysfunction can be expected analogically for the right
ventricle. The Doppler tissue imaging of the tricuspid
annular motion represents a unique opportunity to deter-
mine very quickly and simultaneously both the right
ventricular systolic and diastolic function by measuring
the annular velocities. In our previous report we described
the independent prognostic power of the peak systolic
tricuspid annular velocity in patients with heart failure [4].
However, its combination with parameters defining the
right ventricular diastolic function (the peak early and late
diastolic tricuspid annular velocities or their ratio) may
provide even more powerful prognostic information. Thus,
the purpose of this study was to assess the prognostic
power of combined right ventricular systolic and diastolic
dysfunction identified by Doppler tissue imaging of the
tricuspid annular motion.
2. Materials and methods
2.1. Study population
The study included 177 consecutive patients with
symptomatic heart failure (classes II–IV according to the
New York Heart Association), who were admitted to our
clinic as potential candidates for orthotopic heart trans-
plantation for pre-transplant investigation from May 1999
to May 2003. There were the following inclusion criteria:
(a) sinus rhythm on electrocardiography, (b) a good
quality of echocardiographic imaging of the tricuspid
annular motion, (c) absence of acute coronary event or
coronary revascularization within the last 3 months, (d)
absence of malignancy, advanced liver, renal, and lung
disease, (e) no need for myocardial revascularization or
urgent heart transplantation. Fourteen patients not stabi-
lized on hospital admission (resting dyspnea, need for
parenteral diuretics or catecholamine support, ankle
edema, rales on lung auscultation) were investigated and
included in the study after cardiac compensation. We
excluded 5 patients with bad quality of echocardiographic
imaging of the tricuspid annular motion, and 4 patients
with valvular disease. The etiology of heart failure was
ischemic cardiomyopathy (z70% angiographically verified
luminal diameter narrowing of at least one major coronary
artery or documented myocardial infarction—98 patients)
or idiopathic dilated cardiomyopathy (79 patients). The
diagnosis of idiopathic cardiomyopathy was made on the
basis of echocardiography, electrocardiography (no Q
waves) and clinical criteria; in 30 patients above 40 years
of age with risk factors for coronary artery disease, the
absence of coronary artery disease was confirmed by
coronary angiography. Of patients with ischemic cardio-
myopathy, 21 had a history of coronary artery bypass
surgery. The clinical characteristics of the patient popula-
tion are listed in Table 1. Medical therapy was optimized
before entering the study. One hundred and sixty-six
(94%) patients were taking angiotensin-converting enzyme
inhibitors, 126 (71%) digitalis, 176 (99%) furosemide, 129
(73%) spironolactone, and 132 (75%) beta blockers. In
spite of this intensive therapy, the majority of patients
were in the New York Heart Association classes III (132,
75%) or IV (6, 3%). Only 39 patients (22%) were in class
II. In 45 patients (25%), elective orthotopic heart trans-
plantation was indicated following the initial investigation.
On entering the study, the patients underwent physical
examination, routine blood chemistry and hematologic
measurement, 12-lead electrocardiography, chest radiogra-
phy, standard echocardiography, Doppler tissue imaging of
the tricuspid annular motion, and right-sided heart
catheterization. All the patients gave their written consent
to the investigation. The study complies with the 1975
Declaration of Helsinki and was approved by the institu-
tional ethics committee.
2.2. Echocardiography
Standard echocardiography and pulsed Doppler tissue
imaging of the tricuspid annular motion were obtained in
all the patients. We used a SONOS 5500 (Hewlett Packard,
Andover, MA, USA) equipment with a phased array
transducer of 2.5 MHz, and with a system equipped with
Doppler tissue imaging technology. A detailed concept and
the technical aspects of Doppler tissue imaging were
described previously [9,10]. Doppler tissue measurements
were performed with patients in the left lateral decubitus
position during shallow respiration or end-expiratory
apnea. Guided by the two-dimensional four-chamber view,
a sample volume was placed on the tricuspid annulus at
the place of attachment of the anterior leaflet of the
tricuspid valve. Care was taken to obtain an ultrasound
beam parallel to the direction of the tricuspid annular
motion. Peak systolic (Sa), peak early (Ea) and late (Aa)

Table 1
Baseline patient characteristics
Parameter Whole population Patients without event Patients with event
Sample size 177 115 62
Range of follow-up (months)a 6–45 (28) 8–48 (28) 5–43 (25)
Etiology of heart failure: dilated cardiomyopathyb 79 (44.6%) 43 (37.4%)T 36 (58.1%)TAge (year)c 52 (51; 53) 53 (51; 55) 51 (49; 53)
Male sexb 147 (83.1%) 97 (84.4%) 50 (80.7%)
Clinical historyb
Diabetes mellitus 42 (23.7%) 28 (24.4%) 14 (22.6%)
Systemic hypertension 63 (35.6%) 43 (37.4%) 20 (32.3%)
Hypercholesterolemia 104 (58.8%) 69 (60.0%) 35 (56.5%)
NYHA class
II 39 (22.0%) 27 (23.5%) 12 (19.4%)
III 132 (74.6%) 86 (74.8%) 46 (74.2%)
IV 6 (3.4%) 2 (1.7%) 4 (6.5%)
Clinical characteristicsc
Heart rate (beats min�1) 74 (72; 76) 73 (70; 76) 76 (73; 79)
Systolic BP (mm Hg) 118 (116; 120) 119 (117; 121) 116 (113; 119)
Right heart catheterization variablesc
PAP (mm Hg) 28 (26; 30) 25 (23; 27)T 34 (31; 37)TCardiac index (l min�1/m2) 2.1 (2.0; 2.2) 2.2 (2.1; 2.3) 2.0 (1.9; 2.1)
RAP (mm Hg) 7 (6; 8) 6 (5; 7) 7 (6; 8)
PCWP (mm Hg) 19 (17; 21) 17 (15; 19)T 24 (21; 27)TEchocardiographic variablesc
Sa (cm s�1) 10.7 (10.3; 11.1) 11.3 (10.8; 11.8)T 9.9 (9.3; 10.5)TEa (cm s�1) 10.3 (9.9; 10.7) 10.6 (10.2; 11.0) 9.8 (9.2; 10.4)
Aa (cm s�1) 14.2 (13.5; 14.9) 14.4 (13.6; 15.2) 13.9 (12.6; 15.2)
Ea/Aa 0.81 (0.76; 0.86) 0.81 (0.74; 0.88) 0.81 (0.71; 0.91)
LVEF (%) 23 (22; 24) 24 (23; 25) 23 (21; 25)
LVEDV (ml) 246 (233; 259) 243 (227; 259) 251 (234; 269)
LVESV (ml) 189 (179; 199) 187 (173; 201) 194 (181; 208)
LVEDD (mm) 69 (67; 71) 68 (66; 70)T 72 (70; 74)TLVESD (mm) 59 (57; 61) 58 (56; 60)T 61 (59; 63)TRVEDD (mm) 33 (32; 34) 32 (30; 34)T 36 (34; 38)T
NYHA=New York Heart Association; BP=blood pressure; PAP=pulmonary artery pressure; RAP=right atrial pressure; PCWP=pulmonary capillary wedge
pressure; Sa=peak systolic tricuspid annular velocity; Ea=peak early diastolic tricuspid annular velocity; Aa=peak late diastolic tricuspid annular velocity;
LV=left ventricular; EF=ejection fraction; EDV=end-diastolic volume; ESV=end-systolic volume; EDD=end-diastolic diameter; ESD=end-systolic diameter;
RVEDD=right ventricular end-diastolic diameter.a Follow-up: range of 10–90% percentiles with median follow-up time (parentheses).b Binary/categoric variables: numbers (in parentheses % of cases).c Continuous variables: mean supplied with 95% confidence limits.
T Mark for statistically significant difference ( pb0.05) between patients with or without event.
J. Meluzin et al. / International Journal of Cardiology 105 (2005) 164–173166
diastolic tricuspid annular velocities, along with simulta-
neous electrocardiography, were recorded on videotape at a
speed of 50 mm s�1 for subsequent analysis. When
evaluating peak systolic velocity, the initial peak that
occurs during isometric contraction was ignored. All
pulsed Doppler tissue imaging parameters were measured
on 3–6 consecutive heart cycles and mean value was
calculated. The same methodology was applied in our
previous study demonstrating a good accuracy and
reproducibility of pulsed Doppler tissue imaging of
tricuspid annular motion for the non-invasive detection
of right ventricular systolic function [11]. In addition to
pulsed Doppler tissue imaging, conventional echocardiog-
raphy was performed, including M-mode, two-dimen-
sional, pulsed and color Doppler echocardiography. Left
ventricular ejection fraction was calculated according to
the modified Simpson’s rule [12].
2.3. Right heart catheterization
One hundred and seventy-one patients underwent right
heart catheterization within 24 h of echocardiography. In 6
patients, catheterization was not performed for technical
reasons. The investigations were performed via the right
subclavian vein or the right jugular vein. A 7F thermodilu-
tion catheter (model 131HF7, Baxter Healthcare, Irvine, CA,
USA) was inserted through the right heart cavities into the
pulmonary capillary wedge position. Measurements of mean
right atrial pressure, mean pulmonary artery pressure, and
mean pulmonary capillary wedge pressure were obtained
with patients in supine position using a mechanoelectrical
transducer (model P23XL, Ohmeda Medical Devices Divi-
sion, Oxnard, CA, USA). Cardiac output was measured by
the thermodilution technique. The thermodilution curve was
recorded and calculated using a thermodilution module of
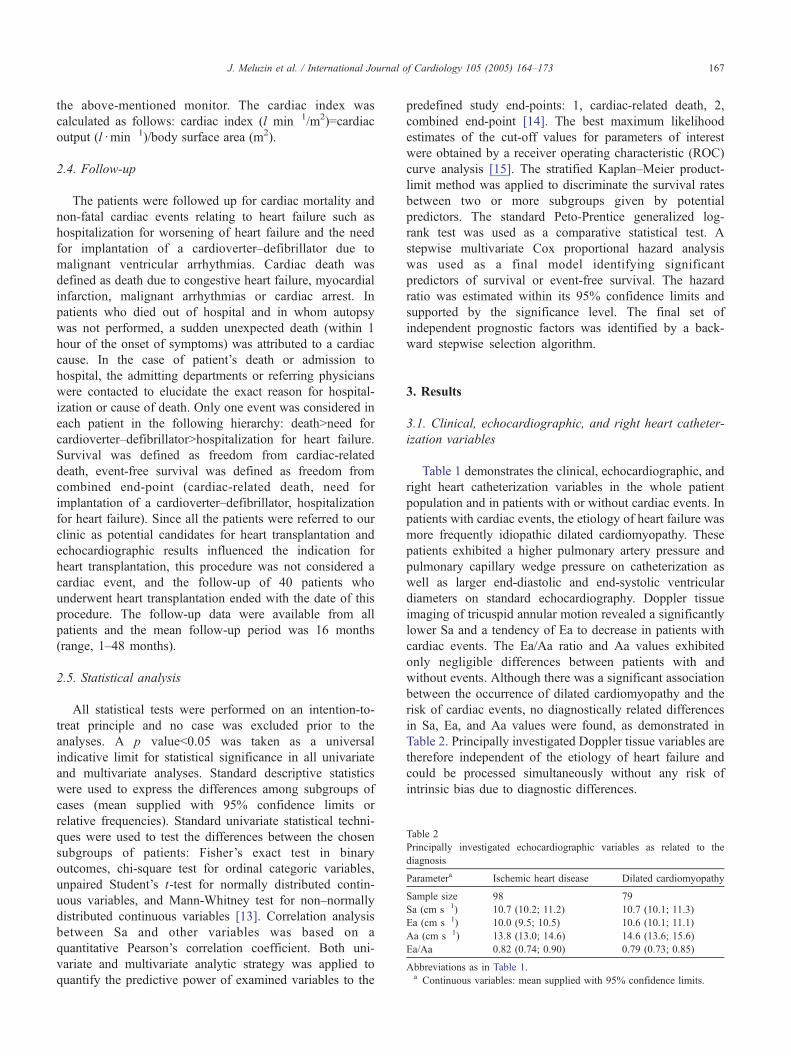
Table 2
Principally investigated echocardiographic variables as related to the
diagnosis
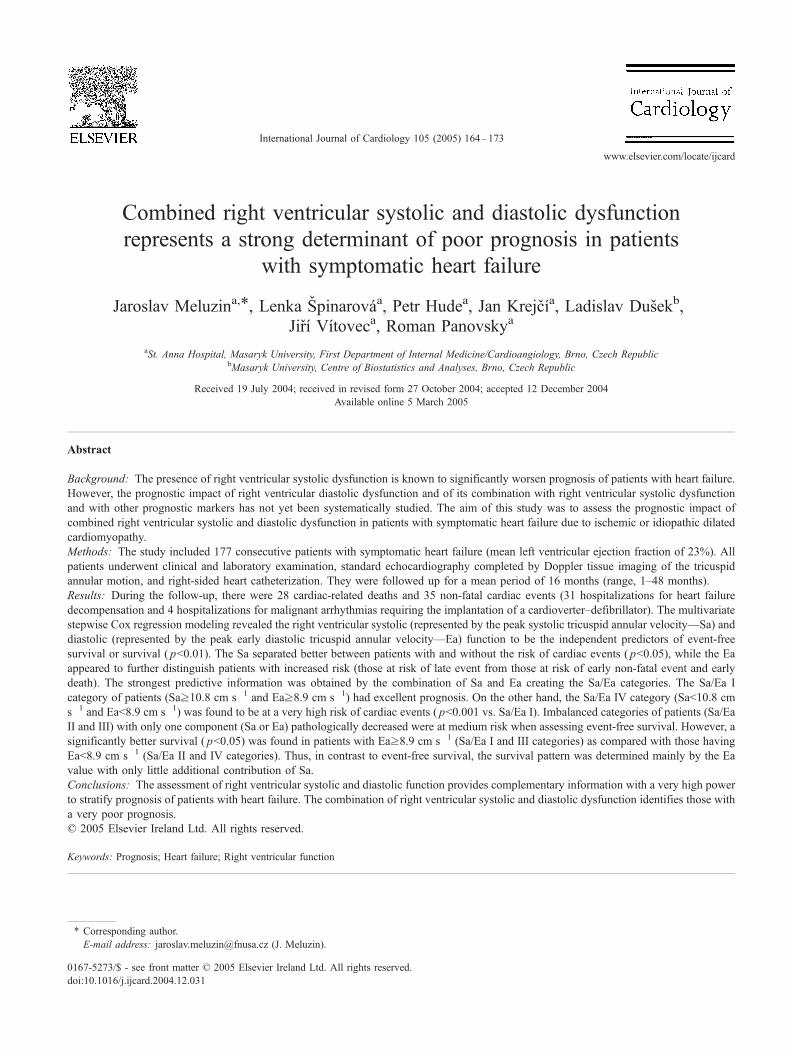
Parametera Ischemic heart disease Dilated cardiomyopathy
Sample size 98 79
Sa (cm s�1) 10.7 (10.2; 11.2) 10.7 (10.1; 11.3)
Ea (cm s�1) 10.0 (9.5; 10.5) 10.6 (10.1; 11.1)
Aa (cm s�1) 13.8 (13.0; 14.6) 14.6 (13.6; 15.6)
Ea/Aa 0.82 (0.74; 0.90) 0.79 (0.73; 0.85)
Abbreviations as in Table 1.a Continuous variables: mean supplied with 95% confidence limits.
J. Meluzin et al. / International Journal of Cardiology 105 (2005) 164–173 167
the above-mentioned monitor. The cardiac index was
calculated as follows: cardiac index (l min�1/m2)=cardiac
output (ldmin�1)/body surface area (m2).
2.4. Follow-up
The patients were followed up for cardiac mortality and
non-fatal cardiac events relating to heart failure such as
hospitalization for worsening of heart failure and the need
for implantation of a cardioverter–defibrillator due to
malignant ventricular arrhythmias. Cardiac death was
defined as death due to congestive heart failure, myocardial
infarction, malignant arrhythmias or cardiac arrest. In
patients who died out of hospital and in whom autopsy
was not performed, a sudden unexpected death (within 1
hour of the onset of symptoms) was attributed to a cardiac
cause. In the case of patient’s death or admission to
hospital, the admitting departments or referring physicians
were contacted to elucidate the exact reason for hospital-
ization or cause of death. Only one event was considered in
each patient in the following hierarchy: deathNneed for
cardioverter–defibrillatorNhospitalization for heart failure.
Survival was defined as freedom from cardiac-related
death, event-free survival was defined as freedom from
combined end-point (cardiac-related death, need for
implantation of a cardioverter–defibrillator, hospitalization
for heart failure). Since all the patients were referred to our
clinic as potential candidates for heart transplantation and
echocardiographic results influenced the indication for
heart transplantation, this procedure was not considered a
cardiac event, and the follow-up of 40 patients who
underwent heart transplantation ended with the date of this
procedure. The follow-up data were available from all
patients and the mean follow-up period was 16 months
(range, 1–48 months).
2.5. Statistical analysis
All statistical tests were performed on an intention-to-
treat principle and no case was excluded prior to the
analyses. A p valueb0.05 was taken as a universal
indicative limit for statistical significance in all univariate
and multivariate analyses. Standard descriptive statistics
were used to express the differences among subgroups of
cases (mean supplied with 95% confidence limits or
relative frequencies). Standard univariate statistical techni-
ques were used to test the differences between the chosen
subgroups of patients: Fisher’s exact test in binary
outcomes, chi-square test for ordinal categoric variables,
unpaired Student’s t-test for normally distributed contin-
uous variables, and Mann-Whitney test for non–normally
distributed continuous variables [13]. Correlation analysis
between Sa and other variables was based on a
quantitative Pearson’s correlation coefficient. Both uni-
variate and multivariate analytic strategy was applied to
quantify the predictive power of examined variables to the
predefined study end-points: 1, cardiac-related death, 2,
combined end-point [14]. The best maximum likelihood
estimates of the cut-off values for parameters of interest
were obtained by a receiver operating characteristic (ROC)
curve analysis [15]. The stratified Kaplan–Meier product-
limit method was applied to discriminate the survival rates
between two or more subgroups given by potential
predictors. The standard Peto-Prentice generalized log-
rank test was used as a comparative statistical test. A
stepwise multivariate Cox proportional hazard analysis
was used as a final model identifying significant
predictors of survival or event-free survival. The hazard
ratio was estimated within its 95% confidence limits and
supported by the significance level. The final set of
independent prognostic factors was identified by a back-
ward stepwise selection algorithm.
3. Results
3.1. Clinical, echocardiographic, and right heart catheter-
ization variables
Table 1 demonstrates the clinical, echocardiographic, and
right heart catheterization variables in the whole patient
population and in patients with or without cardiac events. In
patients with cardiac events, the etiology of heart failure was
more frequently idiopathic dilated cardiomyopathy. These
patients exhibited a higher pulmonary artery pressure and
pulmonary capillary wedge pressure on catheterization as
well as larger end-diastolic and end-systolic ventricular
diameters on standard echocardiography. Doppler tissue
imaging of tricuspid annular motion revealed a significantly
lower Sa and a tendency of Ea to decrease in patients with
cardiac events. The Ea/Aa ratio and Aa values exhibited
only negligible differences between patients with and
without events. Although there was a significant association
between the occurrence of dilated cardiomyopathy and the
risk of cardiac events, no diagnostically related differences
in Sa, Ea, and Aa values were found, as demonstrated in
Table 2. Principally investigated Doppler tissue variables are
therefore independent of the etiology of heart failure and
could be processed simultaneously without any risk of
intrinsic bias due to diagnostic differences.
7
8
9
10
11
12
13
7
8
9
10
11
12
13
R0 R1 R2a R2b R0 R1 R2a R2b
A
B BB
AAB
BB
Val
ues
of
exam
ined
par
amet
ers
Risk groups of patients
Sa (cm.s-1) Ea (cm.s-1)
Arithmetic mean 95% confidencelimits
Fig. 1. The values of the peak systolic tricuspid annular velocity (Sa) and of the peak early diastolic tricuspid annular velocity (Ea) in individual risk groups
R0–R2. R0—patients without any event, R1—patients with any event occurred after 6 months of follow-up, R2a—patients with early non-fatal event occurred
within the first 6 months of follow-up, R2b—patients with early death occurred within the first 6 months of follow-up. A–B: marks for mutual statistical
comparison of risk categories R. Variants marked by the same letter are not significantly different ( pb0.05).
J. Meluzin et al. / International Journal of Cardiology 105 (2005) 164–173168
3.2. Follow-up data
Of 177 patients studied, 63 (36%) suffered a cardiac
event. There were 28 cardiac-related deaths; 15 patients died
from progressive heart failure, 13 died suddenly. Thirty-five
patients suffered a non-fatal cardiac event; 31 were
hospitalized for heart failure decompensation, 4 because of
need for implantation of a cardioverter–defibrillator. No
patient underwent myocardial revascularization during the
follow-up.
3.3. The relation of tricuspid annular velocities and cardiac
events
Based on the occurrence of cardiac events, 4 groups of
patients were defined: R0—patients without any event,
R1—patients with any event occurred after 6 months of
follow-up, R2a—patients with early non-fatal event
occurred within the first 6 months of follow-up, and
R2b—patients with early death occurred within the first 6
0
2
4
6
8
10
12
14
16
18
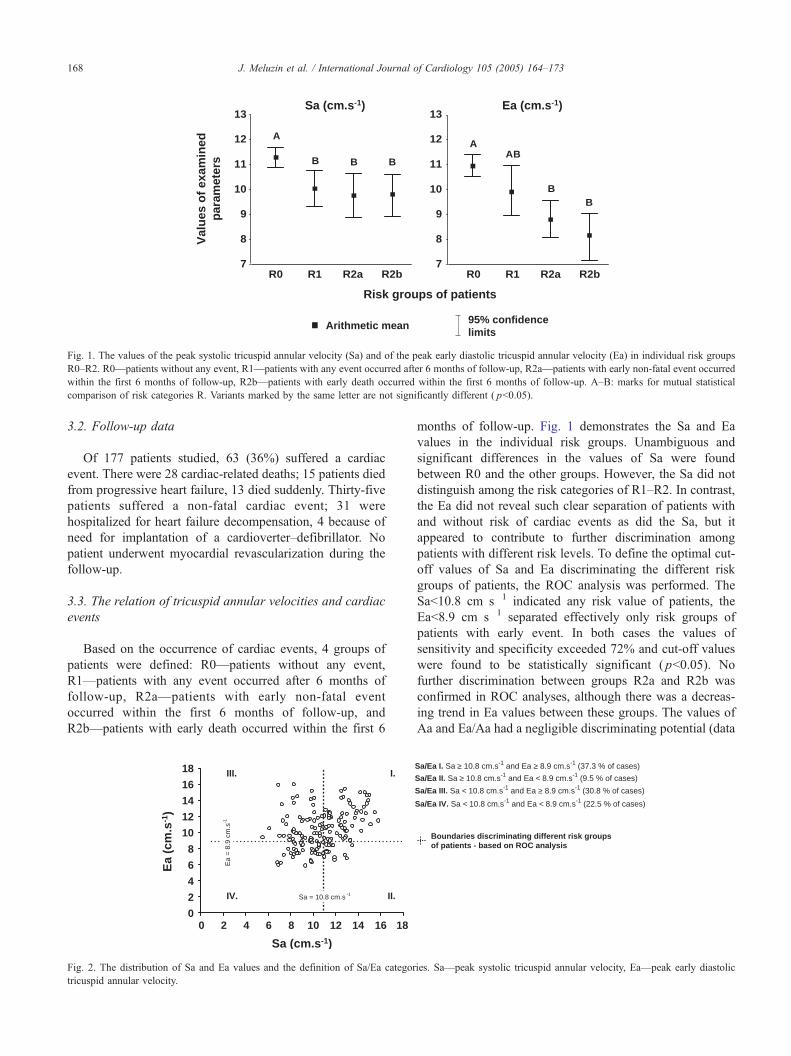
0 2 4 6 8 10 12 14 16 18
Sa = 10.8 cm.s -1
Ea
= 8
.9 c
m. s
- 1
I.
II.
III.
IV.
Ea
(cm
.s-1
)
Sa (cm.s-1)
Fig. 2. The distribution of Sa and Ea values and the definition of Sa/Ea categor
tricuspid annular velocity.
months of follow-up. Fig. 1 demonstrates the Sa and Ea
values in the individual risk groups. Unambiguous and
significant differences in the values of Sa were found
between R0 and the other groups. However, the Sa did not
distinguish among the risk categories of R1–R2. In contrast,
the Ea did not reveal such clear separation of patients with
and without risk of cardiac events as did the Sa, but it
appeared to contribute to further discrimination among
patients with different risk levels. To define the optimal cut-
off values of Sa and Ea discriminating the different risk
groups of patients, the ROC analysis was performed. The
Sab10.8 cm s�1 indicated any risk value of patients, the
Eab8.9 cm s�1 separated effectively only risk groups of
patients with early event. In both cases the values of
sensitivity and specificity exceeded 72% and cut-off values
were found to be statistically significant ( pb0.05). No
further discrimination between groups R2a and R2b was
confirmed in ROC analyses, although there was a decreas-
ing trend in Ea values between these groups. The values of
Aa and Ea/Aa had a negligible discriminating potential (data
Sa/Ea I. Sa ≥ 10.8 cm.s-1 and Ea ≥ 8.9 cm.s-1 (37.3 % of cases)
Sa/Ea II. Sa ≥ 10.8 cm.s-1 and Ea < 8.9 cm.s-1 (9.5 % of cases)
Sa/Ea III. Sa < 10.8 cm.s-1 and Ea ≥ 8.9 cm.s-1 (30.8 % of cases)
Sa/Ea IV. Sa < 10.8 cm.s-1 and Ea < 8.9 cm.s-1 (22.5 % of cases)
Boundaries discriminating different risk groupsof patients - based on ROC analysis
ies. Sa—peak systolic tricuspid annular velocity, Ea—peak early diastolic
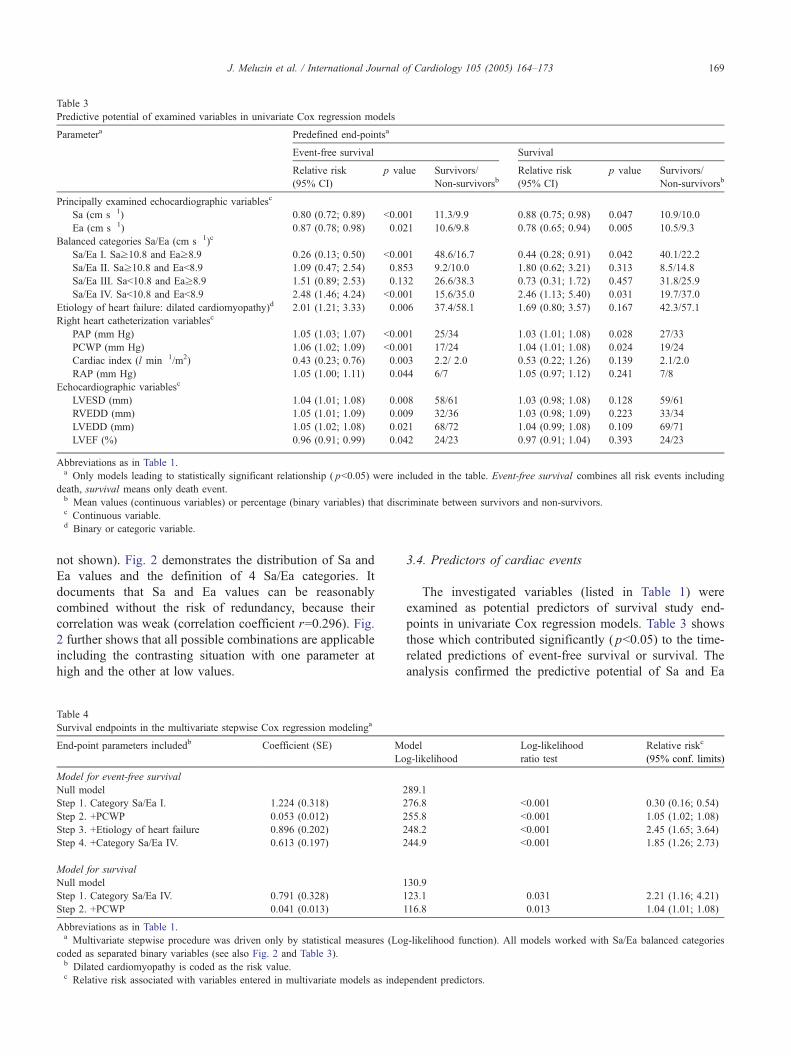
Table 3
Predictive potential of examined variables in univariate Cox regression models
Parametera Predefined end-pointsa
Event-free survival Survival
Relative risk
(95% CI)
p value Survivors/
Non-survivorsbRelative risk
(95% CI)
p value Survivors/
Non-survivorsb
Principally examined echocardiographic variablesc
Sa (cm s�1) 0.80 (0.72; 0.89) b0.001 11.3/9.9 0.88 (0.75; 0.98) 0.047 10.9/10.0
Ea (cm s�1) 0.87 (0.78; 0.98) 0.021 10.6/9.8 0.78 (0.65; 0.94) 0.005 10.5/9.3
Balanced categories Sa/Ea (cm s�1)c
Sa/Ea I. Saz10.8 and Eaz8.9 0.26 (0.13; 0.50) b0.001 48.6/16.7 0.44 (0.28; 0.91) 0.042 40.1/22.2
Sa/Ea II. Saz10.8 and Eab8.9 1.09 (0.47; 2.54) 0.853 9.2/10.0 1.80 (0.62; 3.21) 0.313 8.5/14.8
Sa/Ea III. Sab10.8 and Eaz8.9 1.51 (0.89; 2.53) 0.132 26.6/38.3 0.73 (0.31; 1.72) 0.457 31.8/25.9
Sa/Ea IV. Sab10.8 and Eab8.9 2.48 (1.46; 4.24) b0.001 15.6/35.0 2.46 (1.13; 5.40) 0.031 19.7/37.0
Etiology of heart failure: dilated cardiomyopathy)d 2.01 (1.21; 3.33) 0.006 37.4/58.1 1.69 (0.80; 3.57) 0.167 42.3/57.1
Right heart catheterization variablesc
PAP (mm Hg) 1.05 (1.03; 1.07) b0.001 25/34 1.03 (1.01; 1.08) 0.028 27/33
PCWP (mm Hg) 1.06 (1.02; 1.09) b0.001 17/24 1.04 (1.01; 1.08) 0.024 19/24
Cardiac index (l min�1/m2) 0.43 (0.23; 0.76) 0.003 2.2/ 2.0 0.53 (0.22; 1.26) 0.139 2.1/2.0
RAP (mm Hg) 1.05 (1.00; 1.11) 0.044 6/7 1.05 (0.97; 1.12) 0.241 7/8
Echocardiographic variablesc
LVESD (mm) 1.04 (1.01; 1.08) 0.008 58/61 1.03 (0.98; 1.08) 0.128 59/61
RVEDD (mm) 1.05 (1.01; 1.09) 0.009 32/36 1.03 (0.98; 1.09) 0.223 33/34
LVEDD (mm) 1.05 (1.02; 1.08) 0.021 68/72 1.04 (0.99; 1.08) 0.109 69/71
LVEF (%) 0.96 (0.91; 0.99) 0.042 24/23 0.97 (0.91; 1.04) 0.393 24/23
Abbreviations as in Table 1.a Only models leading to statistically significant relationship ( pb0.05) were included in the table. Event-free survival combines all risk events including
death, survival means only death event.b Mean values (continuous variables) or percentage (binary variables) that discriminate between survivors and non-survivors.c Continuous variable.d Binary or categoric variable.
J. Meluzin et al. / International Journal of Cardiology 105 (2005) 164–173 169
not shown). Fig. 2 demonstrates the distribution of Sa and
Ea values and the definition of 4 Sa/Ea categories. It
documents that Sa and Ea values can be reasonably
combined without the risk of redundancy, because their
correlation was weak (correlation coefficient r=0.296). Fig.
2 further shows that all possible combinations are applicable
including the contrasting situation with one parameter at
high and the other at low values.
Table 4
Survival endpoints in the multivariate stepwise Cox regression modelinga
End-point parameters includedb Coefficient (SE) M
Lo
Model for event-free survival
Null model �2
Step 1. Category Sa/Ea I. �1.224 (0.318) �2
Step 2. +PCWP 0.053 (0.012) �2
Step 3. +Etiology of heart failure 0.896 (0.202) �2
Step 4. +Category Sa/Ea IV. 0.613 (0.197) �2
Model for survival
Null model �1
Step 1. Category Sa/Ea IV. 0.791 (0.328) �1
Step 2. +PCWP 0.041 (0.013) �Abbreviations as in Table 1.a Multivariate stepwise procedure was driven only by statistical measures (Lo
coded as separated binary variables (see also Fig. 2 and Table 3).b Dilated cardiomyopathy is coded as the risk value.c Relative risk associated with variables entered in multivariate models as inde
3.4. Predictors of cardiac events
The investigated variables (listed in Table 1) were
examined as potential predictors of survival study end-
points in univariate Cox regression models. Table 3 shows
those which contributed significantly ( pb0.05) to the time-
related predictions of event-free survival or survival. The
analysis confirmed the predictive potential of Sa and Ea
odel
g-likelihood
Log-likelihood
ratio test
Relative riskc
(95% conf. limits)
89.1
76.8 b0.001 0.30 (0.16; 0.54)
55.8 b0.001 1.05 (1.02; 1.08)
48.2 b0.001 2.45 (1.65; 3.64)
44.9 b0.001 1.85 (1.26; 2.73)
30.9
23.1 0.031 2.21 (1.16; 4.21)
116.8 0.013 1.04 (1.01; 1.08)
g-likelihood function). All models worked with Sa/Ea balanced categories
pendent predictors.

0.00
0.25
0.50
0.75
1.00
0.00
0.25
0.50
0.75
1.00
0 10 20 30 40 50 60
p = 0.691
p < 0.001
p = 0.046
p = 0.524
p = 0.779
p = 0.014C
um
ula
tive
pro
po
rtio
n o
f su
rviv
ors
Time (months)0 10 20 30 40 50 60
Time (months)
A. Event-free survival analysis B. Survival analysis
Censored points
Sa/Ea I.
Sa/Ea II.
Sa/Ea III.
Sa/Ea IV.
Sa/Ea I.
Sa/Ea II. Sa/Ea III.
Sa/Ea IV.
Fig. 3. Event-free survival and survival stratified according to the Sa/Ea categories. Abbreviations as in Figs. 1 and 2.
J. Meluzin et al. / International Journal of Cardiology 105 (2005) 164–173170
values and also very important risk-related predictions based
on Sa/Ea categories. It is apparent that Ea is more related to
cardiac death (i.e. survival) than Sa, while the opposite
situation occurs in the case of event-free survival. To define
the contribution of single parameters to the final predictions
in simultaneous application, the multivariate stepwise Cox
regression models were performed. The values of Sa and/or
Ea were found to be important independent predictors of
event-free survival and survival in all final models.
However, the strongest predictive information was found
with models using Sa/Ea categories (Table 4).
3.5. Event-free survival and survival stratified according to
combined right ventricular functional parameters
Fig. 3 shows the Kaplan–Meier analysis of event-free
survival and survival stratified according to Sa/Ea catego-
ries. Event-free survival was very significantly driven by
categories Sa/Ea I (the lowest risk) and IV (the highest risk).
Imbalanced categories with only one pathologically
decreased component (Sa or Ea, categories Sa/Ea II and
III) fell into the region of medium risk. A different situation
occurred in the survival pattern. A significantly better
prognosis was found in Sa/Ea I and III categories (both
exhibiting Eaz8.9 cm s�1) as compared with Sa/Ea II and
IV categories (both having Eab8.9 cm s�1, p=0.014). Thus,
the survival pattern was determined mainly by the Ea value
with only a little additional contribution of Sa.
4. Discussion
4.1. Evaluation of the right ventricular systolic and diastolic
function using Doppler tissue imaging
The velocities of the tricuspid annular motion assessed
by pulsed-wave tissue Doppler imaging have been repeat-
edly shown to reflect the right ventricular systolic and
diastolic function. The peak systolic tricuspid annular
velocity (Sa) reflects the right ventricular systolic function.
It has been found to significantly correlate with right
ventricular fractional area change (r=0.78, 16) and the right
ventricular ejection fraction determined by the first-pass
radionuclide ventriculography (r=0.65, 11). The Sab11.5
cm s�1 predicts the right ventricular dysfunction (ejection
fractionb45%) with a sensitivity of 90% and a specificity of
85% [11]. Recently, the myocardial acceleration during
isovolumic contraction derived from the isovolumic con-
traction wave pattern has been recommended to assess the
right ventricular systolic function because of its relative
preload and afterload independence [17].
To assess the right ventricular diastolic function, the peak
early diastolic tricuspid annular velocity (Ea) and the peak
late tricuspid annular velocity (Aa) as well as their ratio Ea/
Aa may be used. A significant decrease in Ea and Ea/Aa
was found in many cardiologic diseases or syndromes
including heart failure secondary to coronary artery disease
or idiopathic dilated cardiomyopathy [11], systemic hyper-
tension [18], Chagas’ disease [19], arrhythmogenic right
ventricular cardiomyopathy [20], etc. Despite the overt right
ventricular diastolic dysfunction, the Aa did not differ
significantly from healthy controls in the majority of these
studies [11,18–20]. Thus, the Ea or Ea/Aa rather than Aa
should be utilized to define the right ventricular diastolic
dysfunction. The decrease in Ea and Ea/Aa ratio reflects a
worsening of the right ventricular relaxation analogically as
a decrease in the corresponding mitral diastolic annular
velocities heralds a disturbance in left ventricular relaxation.
The right ventricular Ea/Aa ratio was found to significantly
correlate to the left ventricular Ea/Aa ratio [18]. The
diastolic tricuspid annular velocities are age [21] and right
ventricular systolic function [16] dependent. Nageh et al.
[16] found a weak inverse relation of Ea and Aa to the right
ventricular filling pressures. However, this finding was not
confirmed by Sundereswaran et al. [22]. Irrespective of this
discrepancy, both authors concordantly stressed the ability
of the E/Ea ratio to estimate the mean right atrial pressure (E
represents the peak right ventricular inflow velocity in early
J. Meluzin et al. / International Journal of Cardiology 105 (2005) 164–173 171
diastole). Importantly, there is no bpseudonormalizationQ ofEa during progressive increase in right ventricular filling
pressure [16] indicating that the parameters derived from
annular motion are less preload dependent than those
derived from transtricuspid flow. None of the diastolic
velocities related significantly to heart rate or pulmonary
artery pressure [16].
4.2. Prognostic importance of the right ventricular systolic
and diastolic function
To date, many reports have clearly demonstrated the
prognostic importance of the right ventricular systolic
function in patients with heart failure of both ischemic
and nonischemic etiology [4–6,23–28]. For the risk strat-
ification of such patients, several echocardiographic right
ventricular systolic parameters have been found to possess
independent prognostic power [4–6]. Ghio et al. [6]
measured the tricuspid annular plane systolic excursions
(TAPSE) using the M-mode echocardiography and
described a poor prognosis of patients with TAPSEV14mm. A similar result was obtained by Karatasakis et al. [5].
Meluzin et al. [4] used the peak systolic tricuspid annular
velocity (Sa) derived from pulsed-wave Doppler tissue
imaging and identified Sab10.8 cm s�1 as an independent
predictor of cardiac events. Concerning the right ventricular
diastolic dysfunction, it is known to be a very common
feature in patients with heart failure [11,29]. However, little
is known on its prognostic impact. To quantify the right
ventricular diastolic function, Yu and Sanderson [7] used the
right ventricular Doppler filling parameters and defined the
right ventricular diastolic dysfunction by a shortening of the
tricuspid valve deceleration time of early filling E wave
below 143 ms, and by a reversal in the tricuspid valve-peak
E/peak atrial filling velocity (E/A ratiob1). In this study, the
presence of right ventricular diastolic dysfunction signifi-
cantly predicted cardiac morbidity but not cardiac mortality.
Meluzin et al. [4], who tested the prognostic power of
parameters derived from diastolic tricuspid annular veloc-
ities, did not find any independent prognostic impact of the
diastolic variables tested (the peak rate of tricuspid annular
motion in early and late diastole or their ratio). However, the
combination of systolic and diastolic right ventricular
functional parameters may be more efficient than the
application of these parameters alone.
4.3. The combined left ventricular and right ventricular
systolic and diastolic dysfunction in patient risk stratification
In patients with left ventricular systolic dysfunction and
chronic heart failure, the presence of advanced left
ventricular diastolic dysfunction dramatically increases
mortality and the rate of non-fatal cardiac events [30,31].
This was very convincingly demonstrated in the study of
Xie and co-workers [31], in which the presence of severe
diastolic dysfunction (indicated by the restrictive left
ventricular filling) increased the 2-year mortality by more
than 40%. Rihal et al. [8] and Yu and Sanderson [7] very
clearly documented and confirmed that the prognostic
impact of the presence of severe systolic and diastolic
dysfunction is additive. In the study of Rihal et al. [8]
including a cohort of 102 patients with dilated cardiomy-
opathy, the subgroup of patients with an ejection fraction
b25% and a deceleration time b130 ms (indicating the
restrictive left ventricular filling pattern and severe left
ventricular diastolic dysfunction) had a 2-year survival of
only 35%. The subgroup with an ejection fraction b25% and
a deceleration timeN130 ms had an intermediate 2-year-
survival of 72%, whereas patients with an ejection
fractionz25% had a 2-year survivalz95% regardless of
deceleration time. Similar results were obtained by Yu and
Sanderson [7]. Thus, there is no doubt that the combination
of severe left ventricular systolic and diastolic dysfunction
represents a marker of very poor prognosis, much worse
than that defined by the presence of either left ventricular
systolic or diastolic dysfunction alone. An analogical
relation can be expected for the combination of the right
ventricular systolic and diastolic function in assessing the
patient risk. To date, however, no data are available on the
prognostic impact of the presence of both right ventricular
systolic and diastolic dysfunction in patients with heart
failure and no combined prognostic markers have been
determined. In the present study the information on right
ventricular systolic and diastolic function was obtained
simultaneously and very quickly by measuring peak
tricuspid annulur velocities using pulsed-wave Doppler
tissue imaging of the tricuspid annular motion. Our results
clearly demonstrate the superiority of combining the right
ventricular systolic and diastolic function over the assess-
ment of either systolic or diastolic function alone for the
patient risk stratification. The determination of only Sa
clearly identified low and high risk patients, but it was not
able to distinguish among the categories with increased risk
(R1, R2a, R2b). In contrast, the Ea did not separate the
patients with and without risk of cardiac events with an
acceptable statistical power, though it enabled further
stratification of high risk patients. A combination of Sa
and Ea allowed the creation of 4 Sa/Ea categories dividing
the patients into low, moderate, and high risk groups with a
high statistical power. The low risk category is defined by a
preserved or only mildly depressed right ventricular systolic
and diastolic function (Saz10.8 cm s�1 and Eaz8.9 cm
s�1). On the other hand, the presence of both significant
right ventricular systolic and diastolic dysfunctions
(Sab10.8 cm s�1 and Eab8.9 cm s�1) represents a marker
of very poor prognosis. Patients with only one abnormal
component (Sa or Ea) are at moderate risk of cardiac events.
However, the Eab8.9 cm s�1 predicts a high risk of cardiac-
related death irrespective of Sa. The normal values of Sa and
Ea (meanFstandard deviation) for age-matched healthy
controls were found to reach 15.5F2.6 cm s�1 and
15.6F3.9 cm s�1, respectively [11].
J. Meluzin et al. / International Journal of Cardiology 105 (2005) 164–173172
4.4. Study limitations
The main limitation of this study is the fact that our
patient population is selected and does not represent the
average cohort of patients with heart failure encountered in
daily clinical practice. Since the patients were referred to our
hospital as potential candidates for orthotopic heart trans-
plantation, a significant proportion of patients above 60
years of age and those with serious co-morbidities were not
included. We also excluded patients with atrial fibrillation or
right ventricular pacing, because the accuracy of tricuspid
annular velocities for the evaluation of right ventricular
function has not yet been validated in such patients. In
addition, not all of the parameters known to affect the
prognosis of patients with heart failure (such as peak oxygen
consumption, restrictive left ventricular filling, etc.) were
systematically monitored and included into survival analy-
sis. Irrespective of these limitations, the study provides a
new, easily obtainable non-invasive combined right ven-
tricular systolic and diastolic marker defining the high risk
category of patients with symptomatic heart failure.
5. Conclusions
Our study clearly demonstrates the importance of the
assessment of right ventricular systolic and diastolic
function for the risk stratification of patients with sympto-
matic heart failure. The information on right ventricular
systolic and diastolic function can be obtained by measuring
peak tricuspid annular velocities using pulsed-wave Doppler
tissue imaging. The measurement of the peak systolic
tricuspid annular velocity (Sa) and the peak early diastolic
tricuspid annular velocity (Ea) provides complementary
information with a very high power to predict the adverse
prognosis. The patients with Sab10.8 cm s�1 and Eab8.9 cm
s�1 are at very high risk of cardiac events and should be
intensively treated and carefully followed up.
Acknowledgements
The study was supported in part by a grant of the Ministry
of Education of the Czech Republic (MSM, No. 141100004)
and by a grant of theMinistry of Health of the Czech Republic
(IGA, No. NA7619-3/2003), Prague, Czech Republic.
References
[1] Shah MR, Hasselblad V, Gheorghiade M, Adams KF, Swedberg K,
Califf RM, et al. Prognostic usefulness of the six-minute walk in
patients with advanced congestive heart failure secondary to ischemic
or nonischemic cardiomyopathy. Am J Cardiol 2001;88:987–93.
[2] Morley D, Brozena SC. Assessing risk by hemodynamic profile in
patients awaiting cardiac transplantation. Am J Cardiol 1994;73:
379–83.
[3] Aaronson KD, Schwartz JS, Chen TM, Wong KL, Goin JE, Mancini
DM. Development and prospective validation of a clinical index to
predict survival in ambulatory patients referred for cardiac transplant
evaluation. Circulation 1997;95:2660–7.
[4] Meluzın J, Spinarova L, Dusek L, Toman J, Hude P, Krejcı J.
Prognostic importance of the right ventricular function assessed by
Doppler tissue imaging. Eur J Echocardiography 2003;4:262–71.
[5] Karatasakis GT, Karagounis LA, Kalyvas PA, Manginas A, Atha-
nassopoulos GD, Aggelakas SA, et al. Prognostic significance of
echocardiographically estimated right ventricular shortening in
advanced heart failure. Am J Cardiol 1998;82:329–34.
[6] Ghio S, Recusani F, Klersy C, Sebastiani R, Laudisa ML, Campana C,
et al. Prognostic usefulness of the tricuspid annular plane systolic
excursion in patients with congestive heart failure secondary to
idiopathic or ischemic dilated cardiomyopathy. Am J Cardiol
2000;85:837–42.
[7] Yu HCM, Sanderson JE. Different prognostic significance of right and
left ventricular diastolic dysfunction in heart failure. Clin Cardiol
1999;22:504–12.
[8] Rihal ChS, Nishimura RA, Hatle LK, Bailey KR, Tajik AJ. Systolic
and diastolic dysfunction in patients with clinical diagnosis of dilated
cardiomyopathy. Relation to symptoms and prognosis. Circulation
1994;90:2772–9.
[9] Isaaz K, Thompson A, Ethevenot G, Cloez JL, Brembilla B,
Pernot C. Doppler echocardiographic measurement of low velocity
motion of the left ventricular posterior wall. Am J Cardiol 1989;
64:66–75.
[10] Miyatake K, Yamagishi M, Tanaka N, Uematsu M, Yamazaki N, Mine
Y, et al. New method for evaluating left ventricular wall motion by
color-coded tissue Doppler imaging: in vitro and in vivo studies. J Am
Coll Cardiol 1995;25:717–24.
[11] Meluzın J, Spinarova L, Bakala J, Toman J, Krejcı J, Hude P, et al.
Pulsed Doppler tissue imaging of the velocity of tricuspid annular
systolic motion. A new, rapid and non-invasive method of
evaluating right ventricular systolic function. Eur Heart J 2001;
22:340–8.
[12] Schiller NB, Shah PM, Crawford M, DeMaria A, Deveraux R,
Feigenbaum H, et al. Recommendations for quantitation of the left
ventricle by two-dimensional echocardiography. J Am Soc Echocar-
diogr 1989;2:358–67.
[13] Zar JH. Biostatistical Methods. 2nd ed. London7 Prentice Hall; 1984
765 pp.
[14] Altman DG. Practical Statistics for Medical Research. London7
Chapman and Hall; 1991. 611 pp.
[15] Metz CE. ROC methodology in radiologic imaging. Invest Radiol
1986;21:720–33.
[16] Nageh MF, Kopelen HA, Zoghbi WA, Quinones MA, Nagueh SF.
Estimation of mean right atrial pressure using tissue Doppler imaging.
Am J Cardiol 1999;84:1448–51.
[17] Vogel M, Schmidt MR, Kristiansen SB, Cheung M, White PA,
Sorensen K, et al. Validation of myocardial acceleration during
isovolumic contraction as a novel noninvasive index of right
ventricular contractility. Circulation 2002;105:1693–9.
[18] Cicala S, Galderisi M, Caso P, Petrocelli A, D’Errico AD, de Divitiis
O, et al. Right ventricular diastolic dysfunction in arterial systemic
hypertension: analysis by pulsed Doppler tissue imaging. Eur J
Echocardiogr 2002;3:135–42.
[19] Barros MVL, Machado FS, Ribeiro ALP, Rocha MOC. Detection of
early right ventricular dysfunction in Chagas’ disease using Doppler
tissue imaging. J Am Soc Echocardiogr 2002;15:1197–201.
[20] Lindrfm L, Wilkenshoff UM, Larsson H, Wranne B. Echocardio-
graphic assessment of arrhythmogenic right ventricular cardiomyop-
athy. Heart 2001;86:31–8.
[21] Kukulski T, Hqbbert L, Arnold M, Wranne B, Hatle L, Sutherland
GR. Normal regional right ventricular function and its change with
age: a Doppler myocardial imaging study. J Am Soc Echocardiogr
2000;13:194–204.
J. Meluzin et al. / International Journal of Cardiology 105 (2005) 164–173 173
[22] Sundereswaran L, Nagueh SF, Vardan S, Middleton KJ, Zoghbi WA,
Quinones MA, et al. Estimation of left and right ventricular filling
pressures after heart transplantation by tissue Doppler imaging. Am J
Cardiol 1998;82:352–7.
[23] Di Salvo TG, Mathier M, Semigran MJ, Dec GW. Preserved right
ventricular ejection fraction predicts exercise capacity and survival in
advanced heart failure. J Am Coll Cardiol 1995;25:1143–53.
[24] Ghio S, Gavazzi A, Campana C, Inserra C, Klersy C, Sebastiani R, et
al. Independent and additive prognostic value of right ventricular
systolic function and pulmonary artery pressure in patients with
chronic heart failure. J Am Coll Cardiol 2001;37:183–8.
[25] Gavazzi A, Berzuini C, Campana C, Inserra C, Ponzetta M, Sebastiani
R, et al. Value of right ventricular ejection fraction in predicting short-
term prognosis of patients with severe chronic heart failure. J Heart
Lung Transplant 1997;16:774–85.
[26] De Groote P, Millaire A, Foucher-Hossein C, Nugue O, March-
andise X, Ducloux G, et al. Right ventricular ejection fraction is an
independent predictor of survival in patients with moderate heart
failure. J Am Coll Cardiol 1998;32:948–54.
[27] Juilliere Y, Barbier G, Feldmann L, Grentzinger A, Danchin N,
Cherrier F. Additional predictive value of both left and right
ventricular ejection fractions on long-term survival in idiopathic
dilated cardiomyopathy. Eur Heart J 1997;18:276–80.
[28] Polak JF, Holman L, Wynne J, Colucci WS. Right ventricular ejection
fraction: an indicator of increased mortality in patients with congestive
heart failure associated with coronary artery disease. J Am Coll
Cardiol 1983;2:217–24.
[29] Yu CM, Sanderson JE, Chan SRN, Yeung LRN, Hung YT, Woo KS.
Right ventricular diastolic dysfunction in heart failure. Circulation
1996;93:1509–14.
[30] Morales FJ, Asencio MC, Oneto J, Lozano J, Otero E, Maestre M, et
al. Deceleration time of early filling in patients with left ventricular
systolic dysfunction: Functional and prognostic independent value.
Am Heart J 2002;143:1101–6.
[31] Xie GY, Berk MR, Smith MD, Gurley JC, DeMaria AN. Prognostic
value of Doppler transmitral flow patterns in patients with congestive
heart failure. J Am Coll Cardiol 1994;24:132–9.