Landslide susceptibility mapping for the Urmia Lake basin, Iran: a multi-criteria evaluation...
18
Int. J. Environ. Res., 7(2):319-336, Spring 2013 ISSN: 1735-6865 Received 17 March 2012; Revised 8 July 2012; Accepted 18 July 2012 *Corresponding author E-mail:[email protected] 319 Landslide Susceptibility Mapping for the Urmia Lake basin, Iran: A multi- Criteria Evaluation Approach using GIS Feizizadeh , B. 1,2* , Blaschke, T. 2 , Nazmfar, H. 3 and Rezaei Moghaddam, M.H. 1 1 Department of Physical Geography Centre for Remote Sensing and GIS, University of Tabriz, Iran 2 Department of Geography & Geology Centre for Geoinformatics , University of Salzburg, 5020, Austria 3 Department of Geography and Urban Planning, University of Mohaghegh Ardabili, Ardabil, Iran ABSTRACT:Although typically small in terms of their spatial footprint, landslide hazards are relatively frequent in Northern Iran. We assess landslide susceptibility for the nearly 20.000 km2 large study area of the Urmia lake basin which is dominated by agricultural land use but includes the major settlements areas of the East Azerbaijan province, Iran. Landslide factors are established in form of GIS dataset layers including topography, geology, climatology and land use. After pre-processing all data layers are standardized based on a fuzzy logic model. An Analytical Hierarchical Process (AHP) delivers the weights for the GIS-analysis. Datasets are combined by GIS spatial analysis techniques and a landslide susceptibility map of the study area is created. An existing inventory of known landslides within the case study area was compared with the resulting susceptibility map. We found that high susceptible zones cover about 4.47% (944 km2) of the total area whereby geological outcrops of sedimentary and volcanic formations such as volcanic ash contribute most to the landslide susceptibility. Due to the dynamic growth of settlements especially in the vicinity of the city of Tabriz landslide hazards may cause even more damage in the future.The resulting information of this research is useful for a) a better understanding of existing landslides and their origins in North-Western Iran, b) supporting emergency decisions and c) prioritization of efforts for the reduction and mitigation of future landslide hazards. Key words:Landslide, Susceptibility mapping,GIS- spatial analysis, MCDA,Urmia lake basin, Iran INTRODUCTION Disaster is defined as “a situation or an event which overwhelms local capacity, necessitating a request to a national or international level for external assistance; an unforeseen and often sudden event that causes great damage, destruction and human suffering” (Vos et al., 2010; Akinci et al., 2011; Afandizadeh et al., 2012; Salehi et al., 2012). Disasters are natural hazard events in which a natural phenomenon or a combination of natural phenomena, such as earthquakes, mass movements, floods, volcanic eruptions, tsunamis etc., can cause many loss of lives and damage to the property. It is almost impossible to prevent the occurrence of natural disasters and their damages. However, it is possible to reduce the impact of disasters on human lives, infrastructure and property by adopting suitable disaster mitigation strategies. The term of landslide describes “a wide variety of processes that result in the downward and outward movement of slope-forming materials including rock, soil, artificial hill, or a combination of these. The materials may move by falling, toppling, sliding, spreading, or flowing” (U.S. Geological Survey, 2004). Landslide occurrences are attributable to the resisting strength of the soil or rock forming the slope against gravity, and a landslide results when the balance is tipped in favour of gravity. This balance can be changed by both natural and man- made circumstances. The elements that affect slope stability and landslides are numerous varied and interact in complex and often subtle ways (Varnes, 1984). Landslides can be caused by tectonic factors such as earthquakes or faults, but are often interrelated with climatic factors such as precipitation. Landslides have caused severe human and economic losses (Guzzetti, 2000). Individual slope failures are generally not so spectacular or as costly as earthquakes, major floods, or hurricanes but may cause more damage to properties than any other geological hazards (Varnes,
Transcript of Landslide susceptibility mapping for the Urmia Lake basin, Iran: a multi-criteria evaluation...
Int. J. Environ. Res., 7(2):319-336, Spring 2013ISSN: 1735-6865
Received 17 March 2012; Revised 8 July 2012; Accepted 18 July 2012
*Corresponding author E-mail:[email protected]
319
Landslide Susceptibility Mapping for the Urmia Lake basin, Iran: A multi-Criteria Evaluation Approach using GIS
Feizizadeh , B.1,2*, Blaschke, T.2 , Nazmfar, H.3 and Rezaei Moghaddam, M.H.1
1Department of Physical Geography Centre for Remote Sensing and GIS, University of Tabriz, Iran2 Department of Geography & Geology Centre for Geoinformatics , University of Salzburg,
5020, Austria3 Department of Geography and Urban Planning, University of Mohaghegh Ardabili, Ardabil, Iran
ABSTRACT:Although typically small in terms of their spatial footprint, landslide hazards are relativelyfrequent in Northern Iran. We assess landslide susceptibility for the nearly 20.000 km2 large study area of theUrmia lake basin which is dominated by agricultural land use but includes the major settlements areas of theEast Azerbaijan province, Iran. Landslide factors are established in form of GIS dataset layers includingtopography, geology, climatology and land use. After pre-processing all data layers are standardized based ona fuzzy logic model. An Analytical Hierarchical Process (AHP) delivers the weights for the GIS-analysis.Datasets are combined by GIS spatial analysis techniques and a landslide susceptibility map of the study areais created. An existing inventory of known landslides within the case study area was compared with theresulting susceptibility map. We found that high susceptible zones cover about 4.47% (944 km2) of the totalarea whereby geological outcrops of sedimentary and volcanic formations such as volcanic ash contribute mostto the landslide susceptibility. Due to the dynamic growth of settlements especially in the vicinity of the cityof Tabriz landslide hazards may cause even more damage in the future.The resulting information of thisresearch is useful for a) a better understanding of existing landslides and their origins in North-Western Iran, b)supporting emergency decisions and c) prioritization of efforts for the reduction and mitigation of futurelandslide hazards.
Key words:Landslide, Susceptibility mapping,GIS- spatial analysis, MCDA,Urmia lake basin, Iran
INTRODUCTIONDisaster is defined as “a situation or an event which
overwhelms local capacity, necessitating a request to anational or international level for external assistance;an unforeseen and often sudden event that causes greatdamage, destruction and human suffering” (Vos et al.,2010; Akinci et al., 2011; Afandizadeh et al., 2012; Salehiet al., 2012). Disasters are natural hazard events in whicha natural phenomenon or a combination of naturalphenomena, such as earthquakes, mass movements,floods, volcanic eruptions, tsunamis etc., can causemany loss of lives and damage to the property. It isalmost impossible to prevent the occurrence of naturaldisasters and their damages. However, it is possible toreduce the impact of disasters on human lives,infrastructure and property by adopting suitabledisaster mitigation strategies. The term of landslidedescribes “a wide variety of processes that result inthe downward and outward movement of slope-forming
materials including rock, soil, artificial hill, or acombination of these. The materials may move byfalling, toppling, sliding, spreading, or flowing” (U.S.Geological Survey, 2004). Landslide occurrences areattributable to the resisting strength of the soil or rockforming the slope against gravity, and a landslideresults when the balance is tipped in favour of gravity.This balance can be changed by both natural and man-made circumstances. The elements that affect slopestability and landslides are numerous varied andinteract in complex and often subtle ways (Varnes,1984). Landslides can be caused by tectonic factorssuch as earthquakes or faults, but are often interrelatedwith climatic factors such as precipitation. Landslideshave caused severe human and economic losses(Guzzetti, 2000). Individual slope failures are generallynot so spectacular or as costly as earthquakes, majorfloods, or hurricanes but may cause more damage toproperties than any other geological hazards (Varnes,
320
Feizizadeh , B. et al.
1987). Landslides and slope instabilities are majorhazards for human activities often causing economiclosses, property damages and high maintenance costs,as well as injuries or fatalities (Das et al., 2010).Damages and human casualties are predominantlyattributed to main events. This leads to a substantialunderestimation in the available statistical data onlandslide impact (Castellanos Abella, 2008). In theNorth-West part of the Iran (Sahand Mountain),landslides occur frequently due to climatologic andgeologic conditions with high tectonic activities(Feizizadeh and Blaschke, 2011). The Iranian plateau isa capable area for occurrence various kinds oflandslides because of its mountainous feature, hightectonic activity, geological and climatologic variety(Jadda et al., 2009).
The main objective of this research is to produce adetailed landslide susceptibility map for the Urmia lakebasin in northwest Iran as needed by differentauthorities in the East Azerbaijan Province. Landslidesusceptibility is defined as “the proneness of the terrainto produce slope failures and susceptibility is usuallyexpressed in a cartographic way. Landslidesusceptibility zoning involves a degree of interpretationand spatial distribution rate of the terrain unitsaccording to their propensity to produce landslideswhich is that dependent on topography, geology,geotechnical properties, climate vegetation andanthropogenic factors such as development andclearing of vegetation” (Fell et al., 2008). A landslidesusceptibility map depicts areas likely to havelandslides in the future by correlating some of theprincipal factors that contribute to landslides with thepast distribution of slope failures (Brabb, 1984; Yalcin,2008). They provide important information to theprediction of future landslides hazards and could bebased on the landslide hazard maps which are includesan indication of the time scale within which a particularlandslides are likely to occur (Atkinson and Massari,2011). Landslide susceptibility maps are basic toolsfor land-use planning, especially in mountain areas butalso in areas with moderate terrain complexity butspecific geological conditions such as outcrops.Landslide susceptibility mapping requires a rathercomplex knowledge of slope movements and theircontrolling factors. The reliability of landslidesusceptibility maps mostly depends on the amountand quality of the data available, the working scaleand the selection of the appropriate analysismethodology. The process of creating these mapsinvolves several qualitative or quantitativeapproaches. Early attempts defined susceptibilityclasses by qualitative overlaying of geological andmorphological slope-attributes to landslide inventories
(Nielsen et al., 1979). Enormous progress has beenmade in the development of landslide inventories,landscape susceptibility mapping and hazard zoning,whereby much of this progress is based on theextensive use of GIS, GPS and remote sensingtechniques (van Westen et al., 2008).Today, practicallyall research on landslide susceptibility and hazardmapping makes use of digital tools for handling spatialdata such as GIS, GPS and remote sensing. These toolsalso have deûned, to a large extent, the type of analysisthat can be carried out. It can be stated that GIS hassomehow determined the current state of the art inlandslide hazard and risk assessment (van Westen etal., 2005; 2008). These GIS-based techniques areincreasingly viewed as a key to managing spatial andtemporal data for natural hazards (Kimmance et al.,1999; Parsons and Frost 2000; Lan et al., 2009; 2004;Forte et al., 2005; Kohler et al., 2006). The mainobjectives of this research are a) to analysis landslidepotential using GIS-multicriteria decision analysis andb) to explore the landside susceptibility parameters inUrmia lake basin, Iran.
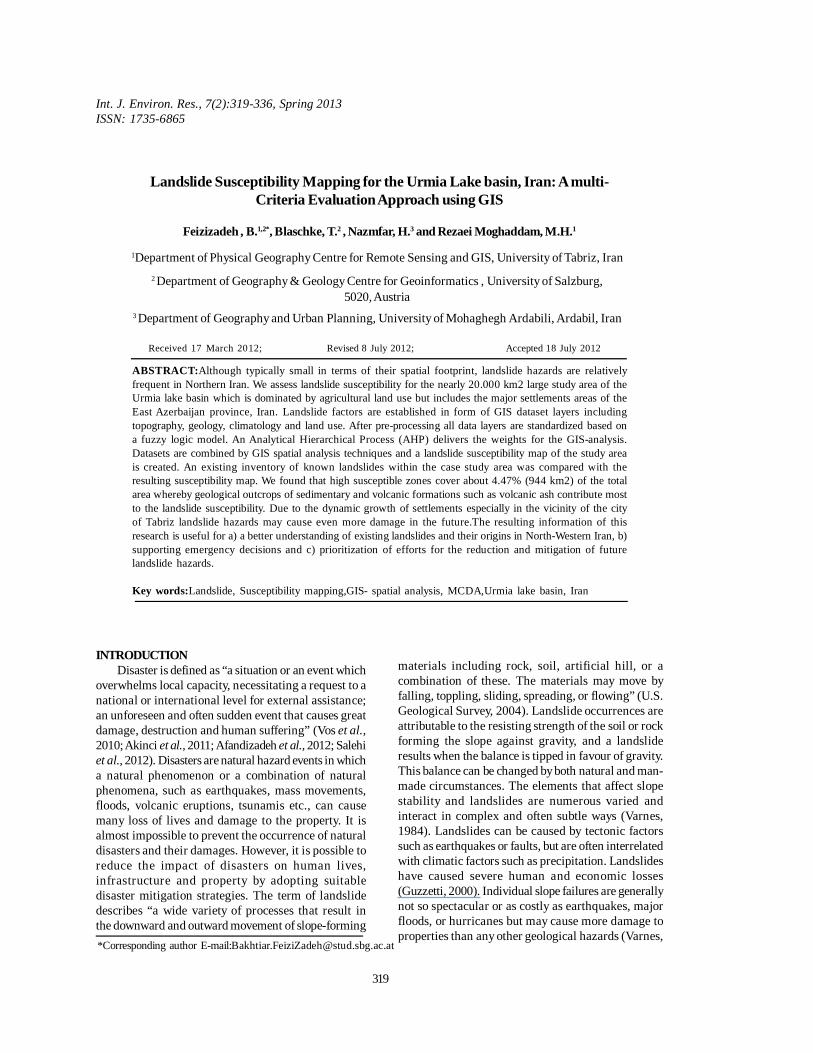
The study area is the Urmia lake basin which islocated in the East Azerbaijan province of Iran. Thisarea with 35 cities and 1018 villages totalling in 3.2million inhabitants is important in terms of housing,industrial and agricultural activities for the EastAzerbaijan province (ICC, 2007; Ahmadi et al., 2011;Farzin et al., 2012). The study area is 19913 km2 in sizeand covers 43.44 % of the East Azerbaijan province. Itis located 36° 56' 36" N to 38° 21' 11" N and 45° 05' 33"E to 47° 55' 10" E as presented in Fig. 1. Urmia Lake asthe largest water body in Iranian plateau is locatednorthwest of Iran. More than 20 permanent andseasonal rivers as well as a few subterranean streamsand springs feed the lake. As an ecological heritageUrmia Lake it a UN protected habitat (AhadnejadReveshty and Maruyama, 2010). The elevation of theUrmia lake basin ranges from 1260 at Urmia Lake to3710 meters above sea level in the Sahand Mountains.The climate is semi-arid and annual precipitation isabout 300 mm (Alijane, 2000). The area’s geology isvery complex and the lithological units compriseseveral formations causing volcanic hazards,earthquakes and landslides. This geophysical settingmakes slopes of this area potentially vulnerable tolandslides and mass movements such as rock fall,creeps, flows, topples and landslides (Alaei Talganei,2009). Landslides are common in Urmia lake basin andthe complexity of the geological structure in theassociated lithological units, comprised with severalformations, cause volcanic hazards, earthquakes andlandslides (Feizizadeh and Blaschke, 2011).
Int. J. Environ. Res., 7(2):319-336, Spring 2013
321
Fig. 1. location of case study area in the East Azerbaijan province (left) and Iran (right)
MATERIALS & METHODSGIS-multicriteria decision analyses (MCDA)
provide a rich collection of techniques for landslidesusceptibility mapping (Feizizadeh et al., 2012). TheMCDA framework is primarily concerned with how tocombine the information from several criteria to form asingle index of evaluation (Yu et al., 2011; Feizizadehand Blaschke, 2012). GIS-MCDA can be thought of as“a process that transforms and combines geographicaldata and value judgments (the decision-maker’spreferences) to obtain information for decision making.It is in the context of the synergetic capabilities of GISand MCDA that one can see the benefit for advancingtheoretical and applied research on GIS-MCDA”(Malczewski, 2006). GIS-MCDA based landslideanalysis allows to combine information derived fromheterogeneous sources to support landslidemonitoring. One of the multi-attribute techniqueswhich have been incorporated into the GIS-basedlandslide analysis procedures is the AnalyticalHierarchy Process (AHP) originally introduced bySaaty (1980). AHP builds a hierarchy of decisionelements (factors) and renders comparisons possiblebetween pairs of factors in form of a matrix. The resultsare weights for each factor and also a consistency ratiowhich quantifies the unambiguity of the pairwiseweighting. It is based on three principles namelydecomposition, comparative judgment and synthesis
of priorities (Malczewski, 1999). AHP is a multiplecriteria decision-making technique that allowssubjective as well as objective factors to be consideredin the decision-making process. It allows the activeparticipation of decision-makers and gives managers arational basis on which to make decisions. In MCDMthe AHP method is widely used to obtain the requiredweightings for different criteria (Saaty, 1977; 1980; Saatyand Vargas, 1991; Wu 1998), AHP has been successfullyemployed in GIS-based MCDM since the early 1990s(Carver, 1991; Malczewski 1999; 2004; Makropoulos etal., 2003). It calculates the required weights associatedwith criterion map layers with the help of a preferencematrix in which all relevant criteria identified arecompared against each other on the basis of preferencefactors. The weights can then be aggregated. GIS-basedAHP has gained popularity because of its capacity tointegrate a large quantity of heterogeneous data, andbecause obtaining the required weights can berelatively straightforward, even for a large number ofcriteria. It has been applied to a variety of decisionmaking problems (Tiwari et al., 1999; Nekhay et al.,2008; Hossain and Das, 2009). Finally, AHP as a multi-objective, multi-criteria decision-making approachenables the user to specify preferences drawn from aset of alternatives. AHP gained wide application in siteselection, suitability analysis and regional planning.
322
Landslide susceptibility mapping
The set of criteria selected should adequately representthe decision-making environment and contributetowards the final goal (Prakash, 2003; Feizizadeh andBlaschke, 2011). There are no universal guidelines forselecting parameters that influence landslides insusceptibility mapping (Yalcin, 2008). In this studytopography, geology, geotechnical properties, climate,vegetation and anthropogenic factors (Table 1) wereselected using expert knowledge based on field studiesrelated to active landslides. Despite the presence ofspatial dependency between parameters, researchresults which consider many causal factors in a singleanalytical task are not uncommon in the literatures,apparently looking for greater detail. The result of thesusceptibility map is determined by factors with highlocal representation such as lineaments and turned tohave artifacts that reduce its reliability. There are alsostudies that used natural (lithology, lineament, etc.)and artificial (roads and other engineering structures),or causal (slope, lithology, etc.) and triggering (rain,seismicity, etc.) factors together (Ayalew andYamagishi, 2005; Yalcin, 2008). The selection of the ninecausal factors in this study is based on these fourcriteria, and also considers general literature inputs anddata availability (Ayalew and Yamagishi, 2005).Lithology, DEM, slope, aspect, land cover, precipitation,distance to streams, distance to roads and faults arethe factors that are most often used for susceptibilitymapping by other researchers (Dai et al., 2002; Lee andMin, 2001; Parise, 2001; Dai et al., 2002; Cevik andTopal, 2003; Ercanoglu et al., 2004; Lee et al., 2004a,b;Lan et al., 2004; Perotto-Baldiviezo et al., 2004; Ayalewand Yamagishi, 2005; Komac, 2006; Pachauri and Pant,1992; Yalcin, 2008; Thanh long, 2008; Feizizadeh et al.,2011; Feizizadeh and Blaschke, 2011; Khezri, 2011; JooOh and Pradhan, 2011; Bai et al., 2011; Padma et al.,2011).
Table 1. Evaluation criteria
Elevation Slope Aspect
Topography
distance to streams Land use/cover Human factors distance to roads lithology Geo logy distance to faults
Climate precipitation
In landslide susceptibility studies, generally it isassumed that the future landslides must occur with theeffects of the same factors as previous therefore thefirst step in landslide susceptibility assessments is toacquire information about the landslides that haveoccurred in the past (Akinci et al., 2011) based on this
idea, the first step in our study is to establish a spatialdatabase for a spatially explicit analysis of the degreeof susceptibility. GIS analytical techniques include:overlays, distance calculations, buffering etc. Majordata sets include: Lithology and fault maps were derived fromgeological maps 1:100,000. Road and drainage maps were extracted froma topographical map of the area with a scale of 1:25000. Digital topographic maps with a scale of1:25000 were used in order to create a TIN and DEM,as well as slope and aspect maps. Land use and land cover maps were derivedfrom Landsat ETM+ satellite images through imageprocesses techniques. Meteorological data, including precipitationdata for a 30 year period was used to create aprecipitation map. The Landslides inventory database for theprovince of East Azerbaijan.
In the preparation phase, all necessary geometricthematic editing was done on the original data setsand a topology was created. In the next step, all vectorlayers were converted into raster format with 20 mresolution and the spatial datasets were processed inArcGIS. In doing so, a pairwise comparison techniquewas used to extraction standard weights, which istypically used for rating and standardizing the ordinalvalues (Malczewski, 2004). This technique is anextension of the classic binary logic, with thepossibility of defining sets without sharp boundariesand allowing for partial assignation of elements to aparticular set. A fuzzy set is essentially a set whosemembers may have degrees of membership between 0and 1, as opposed to a classic binary set in which eachelement must have either 0 or 1 as the membershipdegree (Malczewski, 2004). In this particular landslidehazard analysis for the Urmia lake basin, the criteriaused relate to topography, climate, geology, vegetationand anthropogenic factors all of which wererepresented by separate GIS dataset layers. Theresulting memberships of different potential classeswere subsequently standardized using the maximumeigenvectors approach on a 0 to 1 scale.
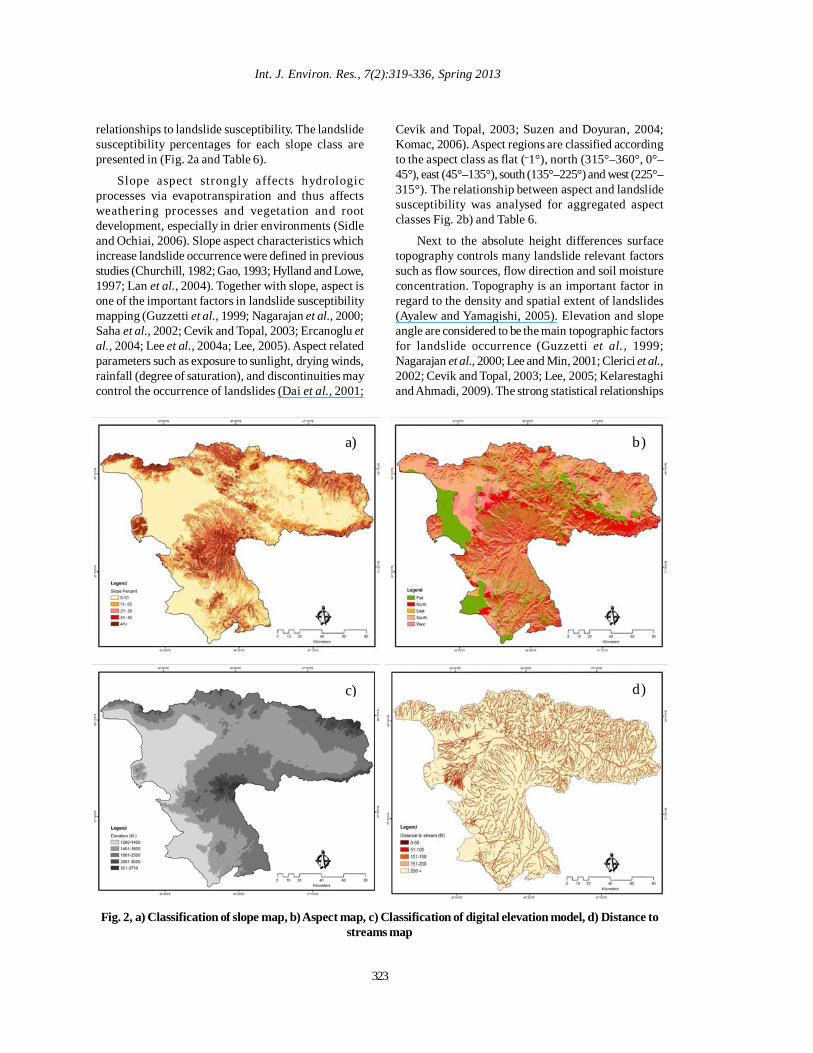
A main parameter of the slope stability is the slopeangle which is directly related to landslides (Lee andMin 2001). It is frequently used in the calculation oflandslide susceptibility maps (Clerici et al., 2002; Sahaet al., 2002; Cevik and Topal, 2003; Ercanoglu et al.,2004; Lee et al., 2004a; Lee, 2005; Yalcin, 2005; 2008).The slope map of the study area was divided into fiveslope categories. ArcGIS software was used for thisclassification and for the calculation of the
323
Int. J. Environ. Res., 7(2):319-336, Spring 2013
relationships to landslide susceptibility. The landslidesusceptibility percentages for each slope class arepresented in (Fig. 2a and Table 6).
Slope aspect strongly affects hydrologicprocesses via evapotranspiration and thus affectsweathering processes and vegetation and rootdevelopment, especially in drier environments (Sidleand Ochiai, 2006). Slope aspect characteristics whichincrease landslide occurrence were defined in previousstudies (Churchill, 1982; Gao, 1993; Hylland and Lowe,1997; Lan et al., 2004). Together with slope, aspect isone of the important factors in landslide susceptibilitymapping (Guzzetti et al., 1999; Nagarajan et al., 2000;Saha et al., 2002; Cevik and Topal, 2003; Ercanoglu etal., 2004; Lee et al., 2004a; Lee, 2005). Aspect relatedparameters such as exposure to sunlight, drying winds,rainfall (degree of saturation), and discontinuities maycontrol the occurrence of landslides (Dai et al., 2001;
a)
c) d)
b)
Cevik and Topal, 2003; Suzen and Doyuran, 2004;Komac, 2006). Aspect regions are classified accordingto the aspect class as flat (–1°), north (315°–360°, 0°–45°), east (45°–135°), south (135°–225°) and west (225°–315°). The relationship between aspect and landslidesusceptibility was analysed for aggregated aspectclasses Fig. 2b) and Table 6.
Next to the absolute height differences surfacetopography controls many landslide relevant factorssuch as flow sources, flow direction and soil moistureconcentration. Topography is an important factor inregard to the density and spatial extent of landslides(Ayalew and Yamagishi, 2005). Elevation and slopeangle are considered to be the main topographic factorsfor landslide occurrence (Guzzetti et al., 1999;Nagarajan et al., 2000; Lee and Min, 2001; Clerici et al.,2002; Cevik and Topal, 2003; Lee, 2005; Kelarestaghiand Ahmadi, 2009). The strong statistical relationships
Fig. 2, a) Classification of slope map, b) Aspect map, c) Classification of digital elevation model, d) Distance tostreams map
324
Feizizadeh , B. et al.
between elevation and landslide occurrence has beencited in many studies (e.g., Pachauri and Pant, 1992;Lineback Gritzner et al., 2001; Dai and Lee, 2002). Fig.2c) and Table 6 depict the classification of elevation todetermine the distribution of landslide susceptibility.An important parameter that controls the stability of aslope is the saturation degree of the material on theslope. The closeness of the slope to drainagestructures is another important factor in terms ofstability. Streams may adversely affect stability byeroding the slopes or by saturating the lower part ofmaterial until resulting in water level increases(Gokceoglu and Aksoy, 1996; Dai et al., 2001; Saha etal., 2002; Cevik and Topal, 2003; Yalcin, 2005; 2008).Five different buffer areas were created to analyse therelationship between distance to streams and slopes.The results of this analysis of stream distances andlandslides are shown in Fig. 2d) and Table 6.
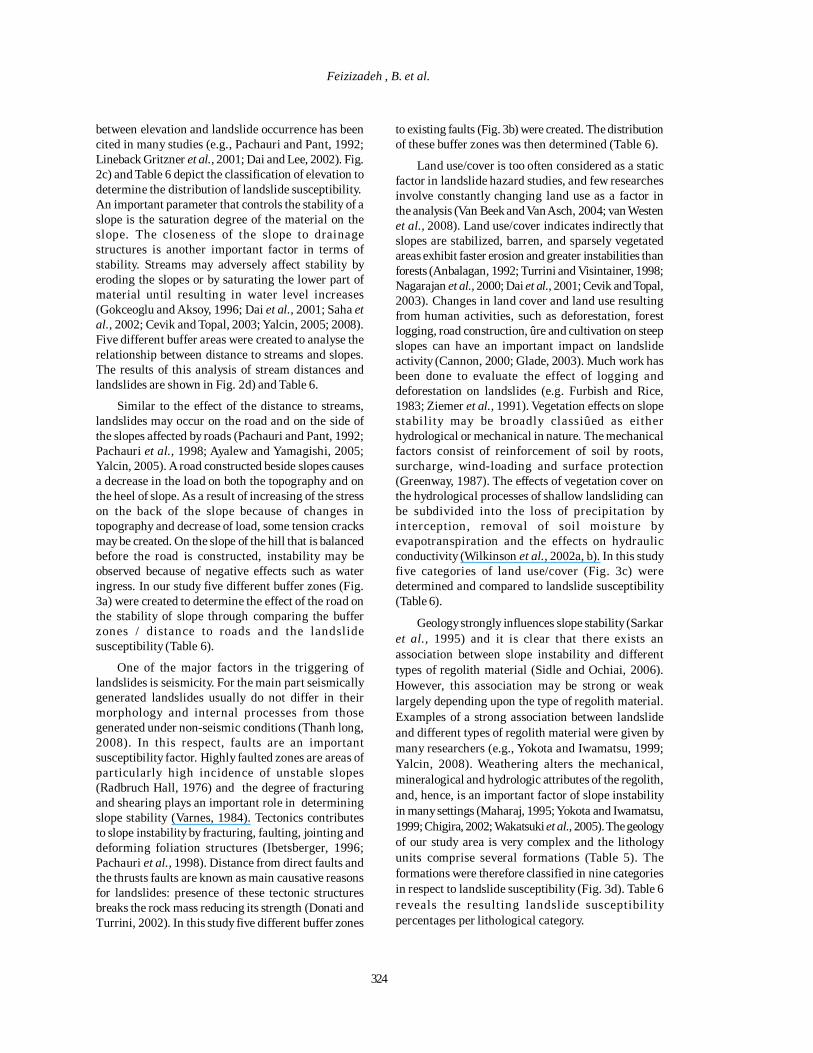
Similar to the effect of the distance to streams,landslides may occur on the road and on the side ofthe slopes affected by roads (Pachauri and Pant, 1992;Pachauri et al., 1998; Ayalew and Yamagishi, 2005;Yalcin, 2005). A road constructed beside slopes causesa decrease in the load on both the topography and onthe heel of slope. As a result of increasing of the stresson the back of the slope because of changes intopography and decrease of load, some tension cracksmay be created. On the slope of the hill that is balancedbefore the road is constructed, instability may beobserved because of negative effects such as wateringress. In our study five different buffer zones (Fig.3a) were created to determine the effect of the road onthe stability of slope through comparing the bufferzones / distance to roads and the landslidesusceptibility (Table 6).
One of the major factors in the triggering oflandslides is seismicity. For the main part seismicallygenerated landslides usually do not differ in theirmorphology and internal processes from thosegenerated under non-seismic conditions (Thanh long,2008). In this respect, faults are an importantsusceptibility factor. Highly faulted zones are areas ofparticularly high incidence of unstable slopes(Radbruch Hall, 1976) and the degree of fracturingand shearing plays an important role in determiningslope stability (Varnes, 1984). Tectonics contributesto slope instability by fracturing, faulting, jointing anddeforming foliation structures (Ibetsberger, 1996;Pachauri et al., 1998). Distance from direct faults andthe thrusts faults are known as main causative reasonsfor landslides: presence of these tectonic structuresbreaks the rock mass reducing its strength (Donati andTurrini, 2002). In this study five different buffer zones
to existing faults (Fig. 3b) were created. The distributionof these buffer zones was then determined (Table 6).
Land use/cover is too often considered as a staticfactor in landslide hazard studies, and few researchesinvolve constantly changing land use as a factor inthe analysis (Van Beek and Van Asch, 2004; van Westenet al., 2008). Land use/cover indicates indirectly thatslopes are stabilized, barren, and sparsely vegetatedareas exhibit faster erosion and greater instabilities thanforests (Anbalagan, 1992; Turrini and Visintainer, 1998;Nagarajan et al., 2000; Dai et al., 2001; Cevik and Topal,2003). Changes in land cover and land use resultingfrom human activities, such as deforestation, forestlogging, road construction, ûre and cultivation on steepslopes can have an important impact on landslideactivity (Cannon, 2000; Glade, 2003). Much work hasbeen done to evaluate the effect of logging anddeforestation on landslides (e.g. Furbish and Rice,1983; Ziemer et al., 1991). Vegetation effects on slopestability may be broadly classiûed as eitherhydrological or mechanical in nature. The mechanicalfactors consist of reinforcement of soil by roots,surcharge, wind-loading and surface protection(Greenway, 1987). The effects of vegetation cover onthe hydrological processes of shallow landsliding canbe subdivided into the loss of precipitation byinterception, removal of soil moisture byevapotranspiration and the effects on hydraulicconductivity (Wilkinson et al., 2002a, b). In this studyfive categories of land use/cover (Fig. 3c) weredetermined and compared to landslide susceptibility(Table 6).
Geology strongly influences slope stability (Sarkaret al., 1995) and it is clear that there exists anassociation between slope instability and differenttypes of regolith material (Sidle and Ochiai, 2006).However, this association may be strong or weaklargely depending upon the type of regolith material.Examples of a strong association between landslideand different types of regolith material were given bymany researchers (e.g., Yokota and Iwamatsu, 1999;Yalcin, 2008). Weathering alters the mechanical,mineralogical and hydrologic attributes of the regolith,and, hence, is an important factor of slope instabilityin many settings (Maharaj, 1995; Yokota and Iwamatsu,1999; Chigira, 2002; Wakatsuki et al., 2005). The geologyof our study area is very complex and the lithologyunits comprise several formations (Table 5). Theformations were therefore classified in nine categoriesin respect to landslide susceptibility (Fig. 3d). Table 6reveals the resulting landslide susceptibilitypercentages per lithological category.
325
Int. J. Environ. Res., 7(2):319-336, Spring 2013
a) b)
c) d)
Fig. 3. a) Distance to roads, b) Distance to faults, c) Geology formation, d) Land use/cover classification
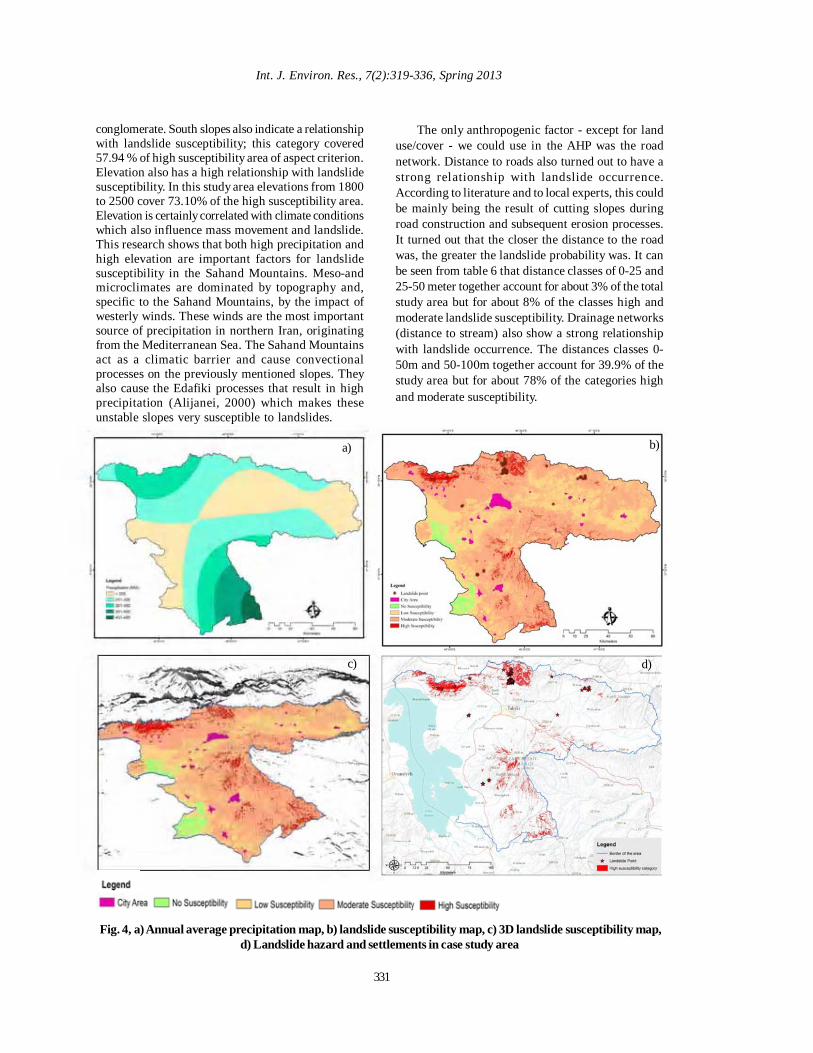
Spatial patterns of rainfall are closely associatedwith landslide initiation (Campbell, 1966; So, 1971,Starkel, 1976) by means of their influence to thegeneration of pore water pressure in unstable hill slopes(Sidle and Swanston, 1982; Iverson and Major, 1987;Tsukamoto and Ohta, 1988). Researchers usually referto one of the four kinds of rainfall as factors of landslideinitiation: (1) total rainfall, (2) short-term intensity, (3)antecedent storm precipitation, or (4) storm duration.However, it may depend on the region and onspecificities what type of rainfall attributes may havethe highest correlation with landslide occurrence. Somestudies conclude that short-term rainfall intensity isthe most important determinant (e.g., Sidle andSwanston, 1982; Keefer et al., 1987). Others (Glade,1998) found a correlation of long-term precipitation withlandslide occurrences. In our methodology we uselong-term precipitation for a 30 year period (1980-2010)and created a precipitation map (Fig. 4a). The landslidesusceptibility percentages were calculated accordingto the category of precipitation by comparing the map
of the precipitation and the landslide susceptibility(Table 6).
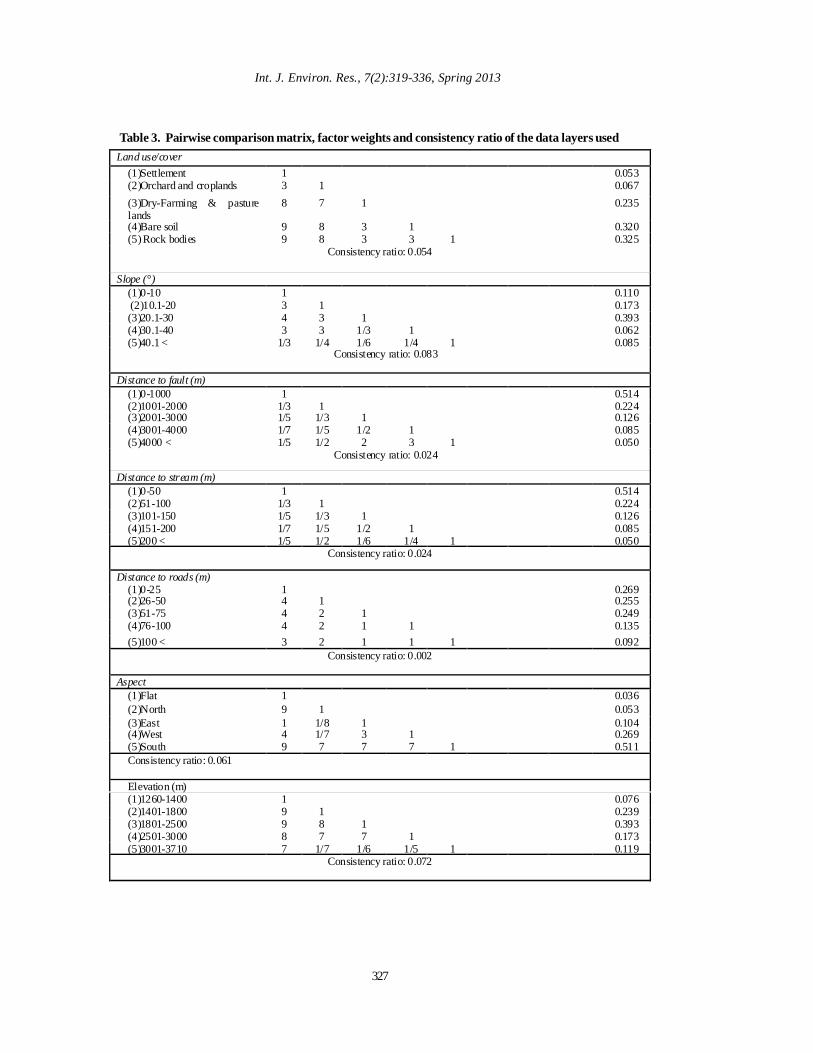
To apply the AHP approach described above, it isnecessary to break a complex unstructured problemdown into its component factors, arrange these factorsin a hierarchic order, assign numerical values tosubjective judgments on the relative importance ofeach factor and synthesize the judgments to determinethe priorities to be assigned to these factors (Saatyand Vargas, 2001). The AHP requires the creation of areciprocal pairwise comparison matrix. Entries into thematrix are found from comparison between each layerbased on a 9-point rating scale as developed by Saaty(1977) ( see Table 2), where a value of 1 is given toimply the criteria under comparison are of equalimportance to the final solution and 9 expressesextreme importance of one criterion over another.Values in between are used for expressing moderateimportance of one criterion over another (3), strongimportance (5) and very strong importance (7). In caseof the criteria being compared are deemed to be closer
326
than indicated by this scale, one can use values inbetween (Robinson et al., 2010). Comparisons are madeby comparing the row criterion to the column criterion.If the row criterion is of less importance to the columncriterion the reciprocal is used (e.g. very strongly lessimportant would be expressed as 1/7). By definitionthe diagonal entries are all equal to 1 (criteria are equallyimportant when compared to themselves) and therating in any position i, j will be the reciprocal of that inposition j, i (Robinson et al., 2010). The principaleigenvector of this matrix yields the weights applicableto each layer (Malczewski, 1999; Robinson et al., 2010).In this study we utilized the AHP’s ability toincorporate different types of input data, and thepairwise comparison method for comparing twoparameters at the same time. However, both thecomparison of the parameters relative to each otherand the determination of the decision alternatives,namely the effect values of the sub-criteria of theparameters (weight), were based on the comparison oflandslide susceptibility map. Consequently the weightvalues were determined accurately for the data setsused (Tables 3 and 4). One of the strengths of AHP is
Table 2. Scales for pairwise comparisons (Saaty and Vargas 1991)
that it allows for inconsistent relationships while, atthe same time, providing a consistency ratio (CR) asan indicator of the degree of consistency orinconsistency (Forman and Selly, 2001; Chen et al.,2009). Therefore, we implemented the AHP in this studywith an option to let the user define an acceptable CRthreshold value. If the CR is greater than 0.10, it isimportant to be careful to accept the resulting weightswithout changing the inputs to the pairwisecomparison matrix, and also to feel confident that thematrix really reflects the user’s beliefs and does notcontain errors (Bodin and Gass, 2003; Chen et al., 2009;Feizizadeh and Blaschke, 2012). In our study theresulting CR for the pairwise comparison matrix for ninedataset layers was 0.053 (Table 3) indicating that thecomparisons of characteristics were perfectlyconsistent and that the relative weights wereappropriate to be subsequently used in the landslidesusceptibility model. Lithology, land use/cover, slope,precipitation, distance to faults, distance to stream andaspect were found to be important parameters for thestudy area, whereas distance to road and elevationreceived a low degree of importance.
Intensity of importance Description
1 Equal importance 3 Moderate importance 5 Strong or essential importance 7 Very strong or demonstrated importance 9 Extreme importance 2,4,6,8 Intermediate values Reciprocals Values for inverse comparison
Eigen values
8 7 6 5 4 3 2 1 F actors
lithology 0.045 1 (1) Altered zone 0.036 1 1 (2) Metamorphic- Plutonic 0.020 1 3 3 (3) Plutonic 0.101 1 7 5 6 (4) Volcanic 0.120 1 4 4 5 6 (5) Metamorphic-Volcanic 0.200 1 4 3 5 3 5 (6) Volcanic-Sedimentary 0.208
1123867 (7) Sedimentary-Volcanic
0.270 1 1 1 2 3 8 6 8 (8) Sedimentary
Consistency ratio: 0.061
Precipitation (mm) 0.083 1 (1)250 > 0.098 1 3 (2)251-300 0.116 1 3 4 (3)301-350 0.301 1 1/3 4 7 (4)350-400 0.402 1 5 7 3 8 (5)401-485
Consistency ratio: 0.075
Table 3. Pairwise comparison matrix, factor weights and consistency ratio of the data layers used
Landslide susceptibility mapping
327
Int. J. Environ. Res., 7(2):319-336, Spring 2013
Table 3. Pairwise comparison matrix, factor weights and consistency ratio of the data layers used
Land use/cover 0.053 1 (1)Settlement 0.067 1 3 (2)Orchard and croplands 0.235 1 7 8 (3)Dry-Farming & pasture
lands 0.320 1 3 8 9 (4)Bare soil 0.325 1 3 3 8 9 (5) Rock bodies
Consistency ratio: 0.054
Slope (°) 0.110 1 (1)0-10 0.173 1 3 (2)10.1-20 0.393 1 3 4 (3)20.1-30 0.062 1 1/3 3 3 (4)30.1-40 0.085 1 1/4 1/6 1/4 1/3 (5)40.1 <
Consistency ratio: 0.083 Distance to fault (m)
0.514 1 (1)0-1000 0.224 1 1/3 (2)1001-2000 0.126 1 1/3 1/5 (3)2001-3000 0.085 1 1/2 1/5 1/7 (4)3001-4000 0.050 1 3 2 1/2 1/5 (5)4000 <
Consistency ratio: 0.024
Distance to stream (m) 0.514 1 (1)0-50 0.224 1 1/3 (2)51-100 0.126 1 1/3 1/5 (3)101-150 0.085 1 1/2 1/5 1/7 (4)151-200 0.050 1 1/4 1/6 1/2 1/5 (5)200 <
Consistency ratio: 0.024
Distance to roads (m) 0.269 1 (1)0-25 0.255 1 4 (2)26-50 0.249 1 2 4 (3)51-75 0.135 1 1 2 4 (4)76-100 0.092 1 1 1 2 3 (5)100 <
Consistency ratio: 0.002 Aspect
0.036 1 (1)Flat 0.053 1 9 (2)North 0.104 1 1/8 1 (3)East 0.269 1 3 1/7 4 (4)West 0.511 1 7 7 7 9 (5)South
Consistency ratio: 0.061 Elevation (m)
0.076 1 (1)1260-1400 0.239 1 9 (2)1401-1800 0.393 1 8 9 (3)1801-2500 0.173 1 7 7 8 (4)2501-3000 0.119 1 1/5 1/6 1/7 7 (5)3001-3710
Consistency ratio: 0.072

328
Feizizadeh , B. et al.
Table 4. Pairwise comparison matrix for dataset layers of landslide analysis
Eigen values 9 8 7 6 5 4 3 2 1 Factors 0.025 1 (1) Aspect 0.036 1 1/5 (2) Distance to road 0.020 1 1/3 1/2 (3) DEM 0.112 1 1/3 1/3 1/3 (4) Distance to stream 0.124 1 1/3 1/5 1/5 1/3 (5) Distance to fault 0.141 1 1/4 1/3 9 1/5 7 (6) Slope 0.160 1 1/3 1/3 1/5 1/5 6 8 (7) Land use 0.172 1 1/5 3 4 7 7 6 8 (8) Precipitation
0.210 1 8 1/5 4 7 8 1/3 7 9 (9) lithology Consistency ratio: 0.053
Table 5. Lithology units of Urmia lake basin
Period Rock Type Main rock Descrieb Cambrian Sedimentary Dolomite Massive cherty, recrystallized dol Cambrian Sedimentary Sandstone sandstone Eocene Plutonic Gabbro Gabbro Lower Cretaceous Sedimentary Shale and other Shale, quartzite sandstone, limestone Lower Cretaceous Volcanic Volcanic rocks Basic volcanic rocks Lower-Middle Eocene Volcanic Undifferentiated lava Undifferentiated lava flows Lower-Middle Pliocene Sedimentary Clastic sediment
Fine clastic sediments with dolomite and fish beds
Lower Pliocene Volcanic Dacite Sahnd dasitic dome and cone
Middle Eocene Volcanic-Metamorphic Latite Metamorphic lalite
Middle Miocene Sedimentary Marl and other Marl and siltstone
Miocene-Pliocene Volcanic-Sedimentary Tuff and other Tuff, sandstone, siltstone, conglomerate
Oligocene Volcanic Andesite and other Basaltic andesite and trachyandesite Oligocene Plutonic Aplite Aplite Oligocene-Miocene Plutonic Syenite Nepheline syenite Paleocene Sub-volcanic Sub-volcanic Dykes, sills, sub-volcanic intrusions Paleocene-Lower Eocene Volcanic Submarine volcanic and other
Submarine volcanic, pyroxene andesite, analcime tephrite and trachyte
Pliocene Volcanic Ignimbrite Ignimbrite
Pliocene Volcanic-Sedimentary
Volcano-sedimentary Conglomerate Volcano sedimentary conglomerate
Pliocene-Quaternary Sedimentary Lacustrine deposits Lacustrine deposits Pliocene-Quaternary Volcanic Trachyandesite and other
Trachyandesite, dacite, rhyodacite flows and volcanic dome
Poorly consolidated conglomerate Sedimentary Conglomerate Poorly consolidated conglomerate
Precambrian Metamorphic-Volcanic Schist and other Chlorite sericite - schist and crystal tuff
Quaternary Sedimentary Alluvium Recent alluvium and Young terraces and alluvial fan
Quaternary Sedimentary Gravel fan Old terraces Quaternary Sedimentary Lahar and other Lahar and conglomerate Quaternary Sedimentary Limestone Young terraces, fresh water limestone
Quaternary Metamorphic Mica schist Andalusite and cordierite mica schist, amphibolite, marble and metadiabase
Quaternary Sedimentary Moraine Moraine deposit Quaternary Sedimentary Salt flat Salt flat Quaternary Sedimentary Siltstone and other Silt, conglomerate and travertine Quaternary Sedimentary Terraces High level terraces Quaternary Sedimentary Travertine Travertine
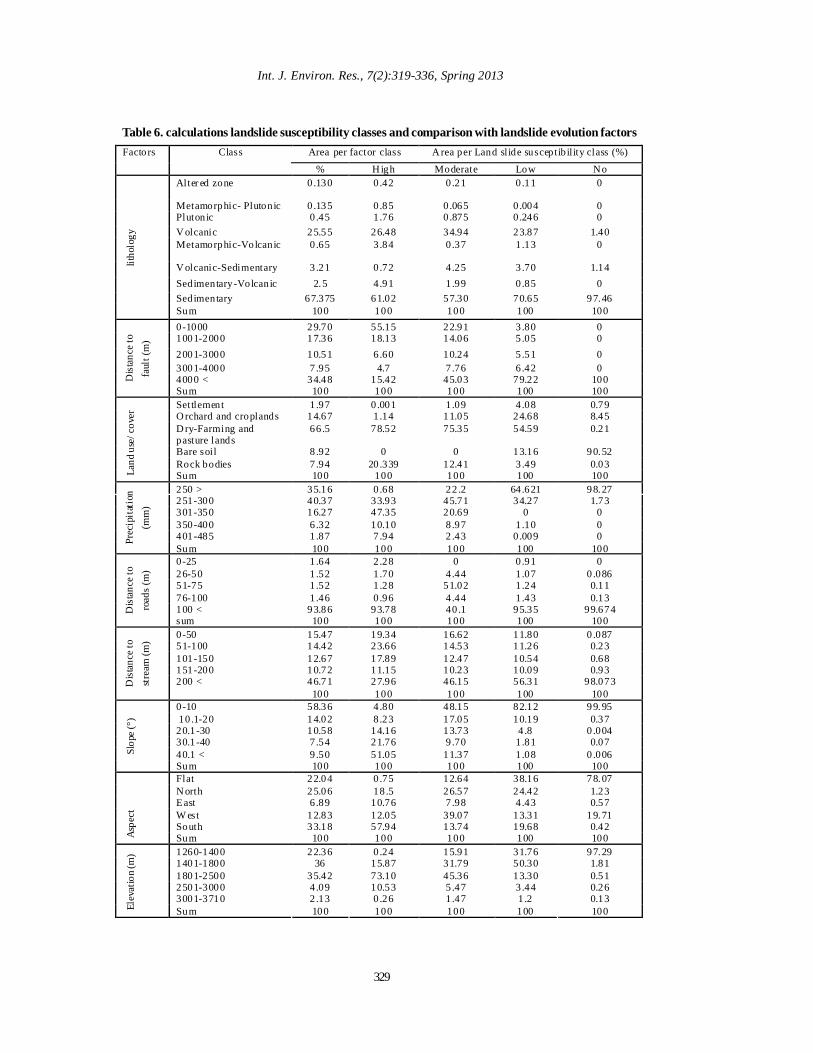
Table 6. calculations landslide susceptibility classes and comparison with landslide evolution factors
Area per factor class A rea per Land slide susceptib ility class (%) Factors Class
% High Moderate Low No Alter ed zone 0 .130 0 .42 0 .21 0 .11 0
Metamorphic- Plutonic 0 .135 0 .85 0 .065 0 .004 0 Pluton ic 0 .45 1 .76 0 .875 0 .246 0 V olcanic 25.55 26.48 34.94 23.87 1.40 Metamorphic-Volcanic 0 .65 3 .84 0 .37 1 .13 0
V olcanic-Sedimentary 3 .21 0 .72 4 .25 3 .70 1.14 Sedimentary-Volcanic 2.5 4 .91 1 .99 0 .85 0 Sedimentary 67.375 61.02 57.30 70.65 97.46
litho
logy
Sum 100 100 100 100 100 0-1000 29.70 55.15 22.91 3 .80 0 1001-2000 17.36 18.13 14.06 5 .05 0 2001-3000 10.51 6 .60 10.24 5 .51 0 3001-4000 7 .95 4.7 7 .76 6 .42 0 4000 < 34.48 15.42 45.03 79.22 100 D
ista
nce
to
faul
t (m
)
Sum 100 100 100 100 100 Settlement 1 .97 0 .001 1 .09 4 .08 0.79 O rchard and croplands 14.67 1 .14 11.05 24.68 8.45 D ry-Farming and pasture lands
66.5 78.52 75.35 54.59 0.21
Bare soil 8 .92 0 0 13.16 90.52 Rock bodies 7 .94 20.339 12.41 3 .49 0.03
Land
use
/ cov
er
Sum 100 100 100 100 100 250 > 35.16 0 .68 22 .2 64.621 98.27 251-300 40.37 33.93 45.71 34.27 1.73 301-350 16.27 47.35 20.69 0 0 350-400 6 .32 10.10 8 .97 1 .10 0 401-485 1 .87 7 .94 2 .43 0 .009 0 Pr
ecip
itat
ion
(mm
)
Sum 100 100 100 100 100 0-25 1 .64 2 .28 0 0 .91 0 26-50 1 .52 1 .70 4 .44 1 .07 0 .086 51-75 1 .52 1 .28 51.02 1 .24 0.11 76-100 1 .46 0 .96 4 .44 1 .43 0.13 100 < 93.86 93.78 40 .1 95.35 99.674 D
ista
nce
to
road
s (m
)
sum 100 100 100 100 100 0-50 15.47 19.34 16.62 11.80 0 .087 51-100 14.42 23.66 14.53 11.26 0.23 101-150 12.67 17.89 12.47 10.54 0.68 151-200 10.72 11.15 10.23 10.09 0.93 200 < 46.71 27.96 46.15 56.31 98.073 D
ista
nce
to
stre
am (m
)
100 100 100 100 100 0-10 58.36 4 .80 48.15 82.12 99.95 10.1-20 14.02 8 .23 17.05 10.19 0.37 20.1-30 10.58 14.16 13.73 4 .8 0 .004 30.1-40 7 .54 21.76 9 .70 1 .81 0.07 40.1 < 9 .50 51.05 11.37 1 .08 0 .006 Sl
ope
(°)
Sum 100 100 100 100 100 Flat 22.04 0 .75 12.64 38.16 78.07 N orth 25.06 18 .5 26.57 24.42 1.23 East 6 .89 10.76 7 .98 4 .43 0.57 W est 12.83 12.05 39.07 13.31 19.71 South 33.18 57.94 13.74 19.68 0.42
Asp
ect
Sum 100 100 100 100 100 1260-1400 22.36 0 .24 15.91 31.76 97.29 1401-1800 36 15.87 31.79 50.30 1.81 1801-2500 35.42 73.10 45.36 13.30 0.51 2501-3000 4 .09 10.53 5 .47 3 .44 0.26 3001-3710 2 .13 0 .26 1 .47 1 .2 0.13
Elev
atio
n (m
)
Sum 100 100 100 100 100
Int. J. Environ. Res., 7(2):319-336, Spring 2013
329
RESULTS & DISCUSSIONIn this study the AHP method was applied to
develop a landslide susceptibility map for the Urmialake basin which is located in north-western Iran. Ninelandslide causal factors were taken into consideration,which include aspect, slope, elevation, distance fromstreams, lithology, distance from roads, distance tofault, precipitation and land use/land cover. Theseparameters were extracted and calculated from theirassociated database. The factors were evaluated, andthen factor weight and class weight were assigned toeach of the associated factors finally datasets arecombined by weighted overlay techniques and alandslide susceptibility map of the study area is created(See Fig. 4b and c). The influences of factors on thelandslide susceptibility map were evaluatedqualitatively to selection of positive factors andimprove the prediction accuracy of the landslidesusceptibility map (Table 6). Based on the result ofthe obtained susceptibility map, high susceptiblezones cover about 4.47% (944 km2) of the total areawhile about 61.25 % (12197.29 km2) were classified asbeing the moderately susceptible and 31.25 % of casestudy area (6224.71 km2) were classified as a lowsusceptible. Remarkably, only 2.72% of case study area(541.85 km2) was classified to having no susceptibilityfor landslide. In respect to the causative forces thisstudy revealed that the most sensitive classes tolandslides in the Urmia lake basin are the factorsgeology formation and seismicity. In particular, thoseQuaternary deposits, sedimentary and volcanicformations that are located within less than 1000m meterdistance to existing faults and which are at the sametime located on slopes steeper than 10° are potentiallywere highly susceptible for landslides.
The landslide susceptibility map was tested basedon the known landslide locations within the study area.The landslide inventory map of the Urmia Lake Basincomprises 132 landslide events (MNR, 2010), whichare used for the validation of the results of this research.The comparison reveals that about 21.2 % of knownlandslides in the case study area fall into the highsusceptibility category, while about 75.7 % of thecurrent (known) landslides fall into the moderatelysusceptible category and about 3.1% of all landslidesare covered by the low susceptibility class. However,no single landslide event occurs in an area classifiedto have no susceptibility. Particularly the extremevalues for high susceptibility and no susceptibilityprove the capability of GIS-MCDA for landslidesusceptibility mapping.
Landslides are natural phenomena which oftenhave detrimental consequences. Existing landslides andlandslide susceptibility can be systematically assessed
using different factors and methods. For this study -and for many other studies cited herein - the majorunderlying assumption is that movements andlandslide predisposing factors in the future will besimilar to those verified in the past. From the largebody of literature in this field - only a fraction could bereferenced in this paper - we may conclude thatpredictions of future landslides are possible in aspatially differentiated although not in terms of time.This is one of the reasons that the term ‘susceptibility’is increasingly used.
In this study a landslide susceptibility map hasbeen constructed using a GIS-based MCDA approach(AHP). Results indicate that geological formations area major controlling factor for landslides in the Urmialake basin. The lithological units comprise severalformations as presented in Table 5. From the resultinglandslide susceptibility classes and from comparisonswith landslide evaluation factors (Table 6), it can beconcluded that the most susceptible groups forlandslide occurrence fall into areas of particulargeological formations. Geological outcrops have a veryhigh susceptibility. Particularly dangerous arecombinations of sedimentary layers (61.02 % of highsusceptibility) and volcanic formations such asvolcanic ash (26.48 % of high susceptibility). Theseismicity factor can only be approximated. In thisstudy, it was evaluated based on distances to faults.Nevertheless, also this second geological factorrevealed a strong relationship with landslidesusceptibility. The first category of distance to fault(0-1000m) covers about 55.15 % of all highsusceptibility area.
Next to the geological factors, precipitation alsoturned out to have a strong relationship with landslideoccurrence: areas with more than 300 mm precipitationcover about 65.39% of the total high susceptibility area.Areas with precipitation less than 300 mm cover only24.46% of the case study area. The combination of theresulting susceptibility map and the land use indicatesthat the most hazardous categories were in dry-farming,pasture lands as well as rock bodies (78.52% and20.34% high susceptibility, respectively). Therelationship between landslide occurrence and slopeshowed that gentle slopes had a low susceptibility oflandslide because of the generally lower shear stresses.At slope of 10° or less, the high susceptibility ratiowas 4.80%, indicating a low probability of landslidesusceptibility. For slopes above 10.1°-20°, the ratio8.23% which indicated higher probability of landslidesusceptibility however the highest rate of landslidesusceptibility was in slope greater than 40° (51.05% ofhigh susceptibility). The areas with slope steepnessgreater than 40° covered less than 9.50% of the areaand are mostly covered by bedrocks including volcanicformation such as Tuff, sandstone, siltstone and
330
Landslide susceptibility mapping
conglomerate. South slopes also indicate a relationshipwith landslide susceptibility; this category covered57.94 % of high susceptibility area of aspect criterion.Elevation also has a high relationship with landslidesusceptibility. In this study area elevations from 1800to 2500 cover 73.10% of the high susceptibility area.Elevation is certainly correlated with climate conditionswhich also influence mass movement and landslide.This research shows that both high precipitation andhigh elevation are important factors for landslidesusceptibility in the Sahand Mountains. Meso-andmicroclimates are dominated by topography and,specific to the Sahand Mountains, by the impact ofwesterly winds. These winds are the most importantsource of precipitation in northern Iran, originatingfrom the Mediterranean Sea. The Sahand Mountainsact as a climatic barrier and cause convectionalprocesses on the previously mentioned slopes. Theyalso cause the Edafiki processes that result in highprecipitation (Alijanei, 2000) which makes theseunstable slopes very susceptible to landslides.
The only anthropogenic factor - except for landuse/cover - we could use in the AHP was the roadnetwork. Distance to roads also turned out to have astrong relationship with landslide occurrence.According to literature and to local experts, this couldbe mainly being the result of cutting slopes duringroad construction and subsequent erosion processes.It turned out that the closer the distance to the roadwas, the greater the landslide probability was. It canbe seen from table 6 that distance classes of 0-25 and25-50 meter together account for about 3% of the totalstudy area but for about 8% of the classes high andmoderate landslide susceptibility. Drainage networks(distance to stream) also show a strong relationshipwith landslide occurrence. The distances classes 0-50m and 50-100m together account for 39.9% of thestudy area but for about 78% of the categories highand moderate susceptibility.
Fig. 4, a) Annual average precipitation map, b) landslide susceptibility map, c) 3D landslide susceptibility map,d) Landslide hazard and settlements in case study area
a)
c)
Int. J. Environ. Res., 7(2):319-336, Spring 2013
331
d)
b)
CONCLUSIONBased on landslide susceptibility map, high
susceptible zones were covering most of the landslidesthat occurred in the unstable slopes over the lastseveral years have been induced by precipitation(MNR, 2010). It is known that the role of precipitationas triggering mechanisms of landslides is stronglyinfluenced by the landscape dynamic and geology. InUrmia lake basin landscapes are common, and rainfalland snowmelt (especially snow melting of Sahandglacier) often have the potential for initiating slopefailures. Susceptible stratigraphy as well as weathering,contribute much for the occurrence of landslides inthis area. With conditions conducive to thedevelopment of slope instability being in place inseveral areas, there was a demand to conduct landslidesusceptibility mapping. Prepared landslide predictionmap could be the basis for decisions making. Theinformation provided by this map could help citizens,planners and engineers to reduce losses caused byexisting and future landslides by means of prevention,mitigation and avoidance. If the factors relevant to thetectonic activity, vulnerability of buildings and otherproperty were available, a hazard and risk analysis couldalso be done. Results of this research could be usefulfor explaining the known existing landslide, makingemergency decisions and relieving the efforts on theavoidance and mitigation of future landslide hazards(Fig. 4d). So far, in Iran as presumably in many otherparts of the world, hazard maps and risk maps usuallyincorporate estimated frequencies of landslides andare not based on quantitative measures and modelswhich utilize the knowledge about existing landslidesfor susceptibility maps. Landslide hazard zoning havemainly been used to manage landslide hazard risk inurban areas by either limiting development in someknown hazard-prone areas, and/or to requiringgeotechnical engineering assessment of slope stability.It was – and still is – difficult to develop accurate mapsfor larger areas and particularly for areas which areless inhabited and the pressure on the planningauthorities is not so high. In the future, this type ofmodel-based susceptibility maps will be more and moreaccepted by local experts as we see already from thisstudy. Future development will also include actions toexplicitly designate areas in agricultural land useplanning. However, in cultural landscapes the“ecological and socio-economic realms are intricatelylinked” (Blaschke, 2006, 201). This requires to takingmore data sets into account beyond the physio-geographical, geological and infrastructure data layers.If the calculations will not get too complex so that theycan still be understood by local planners and decisionmakers as in this study, such maps should ultimatelyenable: a) a better understanding of existing landslides
and their origins, b) supporting emergency decisionsand c) prioritization of efforts for the reduction andmitigation of future landslide hazards.
ACKNOWLEDGEMENTThe authors would like to thank the anonymous
reviewers for their constructive comments on an earlierversion of this paper.
REFERENCESAfandizadeh, Sh., Kalantari, N. and Rezaeestakhruie, H.(2012). A Partial Linearization Method for Multi-ObjectiveContinuous Network Design Problem with EnvironmentalConsiderations. Int. J. Environ. Res., 6 (2), 381-390.
Ahmadi, R., Mohebbi, F., Hagigi, P., Esmailly, L. andSalmanzadeh, R. (2011). Macro-invertebrates in theWetlands of the Zarrineh estuary at the south of UrmiaLake (Iran). Int. J. Environ. Res., 5 (4), 1047-1052.
Akinci, H., Dogan, S., Kiliçoglu, C. and Serhan Temiz, M.(2011). Production of landslide susceptibility map of Samsun(Turkey) City Center by using frequency ratio method,International Journal of the Physical Sciences, 6 (5), 1015-1025.
Alaei Talganei, M. (2009). Geomorphology of Iran, editfifth, published by Gumes, Tehran, Iran.
Atkinson, P. M. and Massari, R. (2011). Autologisticmodelling of susceptibility to landsliding in the CentralApennines, Italy. Geomorphology, 130, 55–64.
Ahadnejad Reveshty, M. and Maruyama, Y. (2010). Studyof Uremia Lake Level Fluctuations and Predict ProbableChanges Using Multi-Temporal Satellite Images and GroundTruth Data Period (1976-2010) New Challenge aboutClimate Change or Human Impact, international conferenceof Map Asia, Kuala Lumpur Malaysia, 26-28 July 2010.
Ayalew, L. and Yamagishi, H. (2005). The application ofGIS-based logistic regression for landslide susceptibilitymapping in the Kakuda-Yahiko Mountains, Central Japan.Geomorphology, 65, 15–31.
Ayalew, L., Yamagishi, H., Marui, H. and Kanno, T. (2005).Landslides in Sado Island of Japan: Part II. GIS-basedsusceptibility mapping with comparisons of results fromtwo methods and verifications. Engineering Geology, 81,432-445.
Ayalew, L. and Yamagishi, H. (2004). Slope movements inthe Blue Nile basin, as seen from landscape evolutionperspective. Geomorphology, 57 (1-2), 95-116.
Alijane, B. (2000). Climatology of Iran, University of Paym-E-Noor, Tehran.
Anbalagan, R. (1992). Landslide hazard evaluation andzonation mapping in mountainous terrain. Eng. Geol., 32,269–277.
Bai, S., Lu, G., Wang, J., Zhou, P. and Ding, L. (2011). GIS-based rare events logistic regression for landslide-susceptibility mapping of Lianyungang, China, Environ.Earth Sci., 62, 139–149.
Feizizadeh , B. et al.
332
Bodin, L. and Gass, S. (2003). On teaching the analytichierarchy process. Computer and Operations Research, 30,1487-1497.
Brimicombe, A. (2003). GIS, environmental modelling andengineering, London, New York, Taylor and Francis, 312.
Brabb, E. E. (1984). Innovative approaches to landslidehazard and risk mapping. Proc., Fourth InternationalSymposium on Landslides, vol. 1. Canadian GeotechnicalSociety, Toronto, Canada, 307–324.
Blaschke, T. (2006). The role of the spatial dimension withinthe framework of sustainable landscapes and natural capital.Landscape and Urban Planning 75(3-4), 198-226.
Campbell, A. P. (1966). Measurement of movement of anearth flow. Soil Water, 2 (3), 23-24.
Chen, Y., Khan S. and Paydar, Z. (2009). To retire or expand.A fuzzy GIS-based spatial multi-criteria evaluationframework for irrigated agriculture. Irrigation and Drainage,59 (2), 174–188.
Chigira, M., Nakamoto, M. and Nakata, E. (2002).Weathering mechanisms and their effects on the landslidingof ignimbrite subject to vapor-phase crystallization in theShirakawa pyroclastic flow, northern Japan. EngineeringGeology, 66 (1-2), 111-125.
Churchill, R. R. (1982). Aspect-induced differences inhillslope processes. Earth Surface Processes and Landforms,7 (2), 171-182.
Cevik, E. and Topal, T. ( 2003). GIS-based landslidesusceptibility mapping for a problematic segment of thenatural gas pipeline, Hendek (Turkey). EnvironmentalGeology, 44, 949–962.
Cannon, S. H. (2000). Debris ûow response of southernCalifornia watersheds burned by wildûre. In: Wieczorec,G.F., Naeser, N.D. (Eds.), Debris Flow Hazards Mitigation:Mechanics, Prediction and Assessment. A.A. BalkemaPublishers, Rotterdam, 45–52.
Clerici, A., Perego, S., Tellini, C. and Vescovi, P. (2002). Aprocedure for landslide susceptibility zonation by theconditional analysis method. Geomorphology, 48, 349–364.
Castellanos Abella, E. A. (2008). Multi-Scale landslide riskassessment in Cuba, PhD thesis, ITC. Netherlands.
Das, I., Sahoo, S., van Westen, C., Stein, A. and Hack, R.(2010) . Landslide susceptibility assessment using logisticregression and its comparisonwith a rockmass classiûcationsystem, along a road section in the northern Himalayas(India). Geomorphology 114, 627–637.
Dai, F. C., Lee, C. F., Li, J. and Xu, Z. W. ( 2001). Assessmentof landslide susceptibility on the natural terrain of LantauIsland, Hong Kong. Environ. Geol., 43 (3), 381–391.
Dai, F. C. and Lee, C. F. (2002). Landslide characteristicsand slope instability modelling using GIS, Lantau Island,Hong Kong. Geomorphology, 42, 213-228.
Donati, L. and Turrini, M. C. (2002). An objective methodto rank the importance of the factors predisposing tolandslides with the GIS methodology: application to an area
of the Apennines (Valnerina; Perugia, Italy). EngineeringGeology, 63 (3-4), 277-289.
Ercanoglu, M., Gokceoglu, C. and Van Asch, TH. W. J.(2004). Landslide susceptibility zoning north of Yenice (NWTurkey) by multivariate statistical techniques. NaturalHazards, 32, 1–23.
Farzin, S., Ifaei, P., Farzin. N., Hassanzadeh, Y. and Aalami,M. T. (2012). An Investigation on Changes and Predictionof Urmia Lake water Surface Evaporation by Chaos Theory.Int. J. Environ. Res., 6 (3), 815-824.
Feizizadeh, B., Blaschke, T. and Rafiq, L. (2011). GIS basedlandslide susceptibility mapping: a case study Bostan AbadCounty, Iran, G4DM - International Conference ofGeoinformatics for Disaster Management, Antalya, Turkey.
Feizizadeh, B. and Blaschke, T. (2011). Landslide RiskAssessment Based on GIS Multi-Criteria Evaluation: A caseStudy Bostan Abad County, Iran. Journal of Earth Scienceand Engineering, 1, 66-71.
Feizizadeh, B. and Blaschke, T. (2012). Land suitabilityanalysis for Tabriz County, Iran: a multi-criteria evaluationapproach using GIS, Journal of Environmental Planning andManagement, DOI:10.1080/09640568.2011.646964.
Feizizadeh, B., Blaschke, T. and Nazmfar, H. (2012). GIS-based Ordered Weighted Averaging and Dempster ShaferMethods for Landslide Susceptibility Mapping in Urmialake Basin, Iran, International Journal of Digital Earth (inpress).
Fell, R., Corominas, J., Bonnard, C., Cascini, L., Leroi, E. Z.and Savage, W. (2008). Guidelines for landslidesusceptibility, hazard and risk zoning for land-use planning.Engineering Geology, 102, 99–111.
Forte, F., Pennetta, L. and Strobl, R. O. (2005). Historicrecords and GIS applications for ûood risk analysis in theSalento peninsula (southern Italy). Nat. Hazards Earth Syst.Sci., 5, 833–844.
Forman, E. H. and Selly, M. A. (2001). Decision by Objective,How to Convince Others That You are Right. WorldScientific Publishing Co. Pte. Ltd, Singapore.
Furbish, D. J. and Rice, R. M. (1983). Predicting landslidesrelated to clearcut logging, Northwestern California, USA.Mountain Research and Development, 3, 253–259.
Kohler, P., Müller, M., Sanders, M. and Wächter, J. (2006).Data management and GIS in the Center for DisasterManagement and Risk Reduction Technology (CEDIM):from integrated spatial data to the mapping of risk. Nat.Hazards Earth Syst. Sci., 6, 621–628.
Kelarestaghi, A., Ahmadi, H. (2009). Landslide susceptibilityanalysis with a bivariate approach and GIS in NorthernIran, Arab J. Geosci., 2, 95-101.
Kimmance, J. P., Bradshaw, M. P. and Seetoh, H. H. (1999).Geographical Information System (GIS) Application toConstruction and Geotechnical Data Management on MRTConstruction Projects in Singapore, Tunnelling UndergroundSpace Tech., 14 (4), 469–479.
Int. J. Environ. Res., 7(2):319-336, Spring 2013
333
Keefer, D. K., Wilson, R. C., Mark, R. K., Brabb, E. E.,Brown, W. M., Ellen, S. D., Harp, E. L., Wieczorek, G. F.,Alger, C. S. and Zatkin, R. S. (1987) .Real-time landslidewarning during heavy rainfall. Science, 238, 921-925.
Hossain, M. S. and Das, N. G. (2009). GIS-based multi-criteria evaluation to land suitability modelling for giantprawn (Macrobrachium rosenbergii) farming inCompanigonj Upazila of Noakhali, Bangladesh. Computersand Electronics in Agriculture, 70, 172–186.
Hylland, M. D. and Lowe, M. (1997). Regional landslide-hazard evaluation using landslide slopes, western WasatchCountry, Utah. Environment and Engineering Geoscience, 3(1), 31-43.
ICC, (2007). Iranian Census Centre. From http://www.amar.org.ir.
Ibetsberger, H. J. (1996). The Tsergo Ri landslide: anuncommon area of high morphological activity in theLangthang valley, Nepal. Tectonophysics, 260, 85-93.
Iverson, R. M. and Major, J. J. (1987). Rainfall, ground-water flow, and seasonal movement at Minor Creeklandslide, northwestern California: physical interpretationof empirical relation. Geological survey. America Bulletin,99, 579-594.
Komac, M. (2006). A landslide susceptibility model usingthe analytical hierarchy process method and multivariatestatistics in perialpine Slovenia. Geomorphology, 74 (1–4),17–28.
Khezri, S. (2011). Landslide susceptibility in the Zab Basin,northwest of Iran. Procedia Social and Behavioral Sciences,19, 726–731.
Lan, H. X., Zhou C. H., Wang, L. J., Zhang, H.Y. and Li R.H. (2004). Landslide hazard spatial analysis and predictionusing GIS in the Xiaojiang watershed, Yunnan, China.Engineering Geology, 76 (1–2), 109–128.
Lan, H. X., Martin, C. D., Froese, C. R., Kim, T. H., Morgn.A. J., Chao, D. and Chowdhury, S. (2009). A web-basedGIS for managing and assessing landslide data for the townof Peace River, Canada, Nat. Hazards Earth Syst. Sci., 9,1433–1443.
Lee, S., Choi, J. and Min, K. (2004a). Probabilistic landslidehazard mapping using GIS and remote sensing data at Boun,Korea. International Journal of Remote Sensing, 25 (11),2037–2052.
Lee, S., Ryu, J., Won, J. and Park, H. (2004b). Determinationand application of the weight for landslide susceptibilitymapping using an artificial neural network. EngineeringGeology, 71, 289–302.
Lee, S. (2005). Application of logistic regression model andits validation for landslide susceptibility mapping using GISand remote sensing data. International Journal of RemoteSensing, 26 (7), 1477–1491.
Lee, S. and Min, K. (2001). Statistical analysis of landslidesusceptibility at Yongin, Korea. Environment Geology, 40,1095–1113.
Lineback Gritzner, M., Marcus, W. A., Aspinall, R. andCuster, S. G. (2001). Assessing landslide potential usingGIS, soil wetness modeling and topographic attributes,Payette River, Idaho. Geomorphology, 37, 149-165.
Malczewski, J. (2004) GIS-based land-use suitabilityanalysis: a critical overview. Progress in Planning, 62 (1), 3-65.
MNR, (2010). Ministry of Natural Resources, EastAzerbaijan Province, Landslide event report, Tabriz, Iran.
Malczewski, J. (2006). GIS-based multicriteria decisionanalysis: a survey of the literature. International Journal ofGeographical Information Science, 20 (7), 703–726.
Malczewski, J. (1999). GIS and Multicriteria DecisionAnalysis, Wiley, Toronto.
Maharaj, R. (1995). Engineering-geological mapping oftropical soils for land-use planning and geotechnicalpurposes: a case study from Jamaica, West Indies.Engineering Geology, 40, 243-286.
Nagarajan, R., Roy, A., Vinod Kumar, R., Mukherjee, A. andKhire, M. V. (2000). Landslide hazard susceptibility mappingbased on terrain and climatic factors for tropical monsoonregions. Bull. Eng. Geol. Environ., 58, 275–287.
Nielsen, T. H., Wrigth, R. H., Vlasic, T. C. and Spangle, W.E. (1979). Relative slope stability and land-use planning inthe San Francisco Bay region, California. US GeologicalSurvey Professional, 944.
Nekhay, O., Arriaza, M., Guzmán-Álvarez, J. R. (2008).Spatial analysis of the suitability of olive plantations forwildlife habitat restoration. Computers and Electronics inAgriculture, 65, 49-64.
Robinson, T. P., van Klinken, D. R. and Metternicht, G.(2010). Comparison of alternative strategies for invasivespecies distribution modelling. Ecological Modelling, 221,2261–2269.
Saaty, T. L. (1980). The Analytical Hierarchy Process,McGraw Hill, New York.
Saaty, T. L. (1977). A scaling method for priorities inhierarchical structures. Journal of Mathematical Psychology,15, 231-281.
Saaty, T. L, Vargas, L. G. (1991). Prediction, Projection andForecasting. Kluwer Academic Publisher, Dordrecht, 251.
Sarkar, S., Kanungo, D. P., Mehrotra, G. S. (1995). Landslidehazard zoning: a case study in Garhwal Himalaya, India.Mountain Research and Development, 15 (4), 301-309.
So, C. L. (1971). Mass movements associated with therainstorm of June 1966 in Hong Kong. Inst. BritishGeographers Trans, 53, 55-65.
Starkel, L. (1976). The role of extreme (catastrophic)meteorological events in the contemporary evolution ofslopes. In: Derbyshire, E. (ed), Geomorphology and Climate,John Wiley and Sons, New York. 203-246.
334
Landslide susceptibility mapping
Sidle. R. C. and Swanston, D. N. (1982). Analysis of a smalldebris slide in coastal Alaska. Canadian geotechnical journal,19, 167-174.
Sidle, R. C. and Ochiai, H. (2006). Landslides: processes,prediction, and landuse. American Geophysical Union, WaterResources Monograph. Washington, D.C.
Suzen, M. L. and Doyuran, V. (2004). Data driven bivariatelandslide susceptibility assessment using geographicalinformation systems: a method and application to Asarsuyucatchment, Turkey. Engineering Geology, 71, 303–321.
Pachauri, A. K. and Pant, M. (1992). Landslide hazardmapping based on geological attributes. Engineering geology,32, 81-100.
Pachauri, A. K., Gupta, P. V. and Chander, R. (1998).Landslide zoning in a part of the Garhwal Himalayas.Environmental Geology, 36, 325–334.
Parsons, R. L., Frost, J. D. (2000). Interactive analysis ofspatial sub-surface data using GIS-Based tool, J. Comput.Civ. Eng., 14 (4), 215–222.
Parise, M. (2001). Landslide mapping techniques and theiruse in the assessment of the landslide hazard. Physics andChemistry of the Earth, 26, 697–703.
Perotto-Baldiviezo, H. L., Fisher, R. F., Wu, X. B., Thurow,T. L., Smith, C. T. (2004). GIS-based spatial analysis andmodeling for landslide hazard assessment in steeplands,Southern Honduras. Agriculture, Ecosystems andEnvironment, 103 (1), 165–176.
Padma, S., Shanmuga, Priyaa, S., Saravanan, K. and Sanjeevi,S. (2011). Landslide susceptibility mapping of the Munnarregion of southern India using remote sensing and grass GIS,Disaster, Risk and Vulnerablity Conference 2011, School ofEnvironmental Sciences, in association with MahatmaGandhi University, India, Applied Geoinformatics forSociety and Environment, Germany.
Prakash, T. N. (2003). Land Suitability Analysis forAgricultural Crops: A Fuzzy Multicriteria Decision MakingApproach. MSc thesis in ITC, http://www.ITC.com.
Radbruch Hall, D. H. (1976). Map showing areal slopestability in part of the northern Coast Ranges, California.U.S. Geol. Survey Map 1-982.
Salehi, E., Zebardast, L. and Yavri, A. R. (2012). DetectingForest Fragmentation with Morphological Image Processingin Golestan National Park in northeast of Iran. Int. J. Environ.Res., 6 (2), 531-536.
Tsukamoto, Y. and Ohta, T. (1988). Runoff processes on asteep forested slope. Journal of Hydrology, 102, 165-178.
Turrini, M. C. and Visintainer, P. (1998). Proposal of amethod to deûne areas of landslide hazard and applicationto an area of the Dolomites, Italy. Eng. Geol., 50, 255–265.
Tiwari, D. N., Loof, R. and Paudyal, G. N. (1999).Environmental-economic decision-making in lowlandirrigated agriculture using multi-criteria analysis techniques.Agricultural Systems, 60, 99-112.
Thanh long, N. (2008). Landslide susceptibility mapping ofthe mountainous area in a Luoi District, thua thien hueprovince, Vietnam, PhD Thesis, Department of Hydrology& Hydraulic Engineering, University of Brussels.
Van Westen, C. J., Van Asch, T. W. J. and Soeters, R. (2005).Landslide hazard and risk zonation; why is it still so difûcult?Bulletin of Engineering geology and the Environment, 65(2), 167–184.
Van Westen, C. J., Castellanos, E. and Kuriakose, S. L.(2008). Spatial data for landslide susceptibility, hazard, andvulnerability assessment: An overview, Engineering Geology,102 (3–4), 112–131.
Varnes, D. J. (1987). Slope movement types and processes.National Academy of Sciences, Washington, D.D, 11-33.
Varnes, D. J. (1984). Intern. Assoc. of Engineering GeologyComm. on Landslides and Other Mass Movements onSlopes: Landslide hazard zonation: a review of principlesand practice, UNESCO Band 63, Paris.
Van Beek, L. P. H. and Van Asch, T. W. J. (2004) Regionalassessment of the effects of land-use change and landslidehazard by means of physically based modeling. NaturalHazards, 30 (3), 289–304.
Vos, F., Rodriguez, J., Below, R. and Guha-Sapir, D. (2010).Annual Disaster Statistical Review 2009: The Numbers andTrends, Centre for Research on the Epidemiology ofDisasters (CRED), Université catholique de Louvain,Brussels, Belgium.
Wakatsuki, T., Tanaka, Y. and Matsukura, Y. (2005) .Soilslips on weathering-limited slopes underlain by coarse-grained granite or fine- grained gneiss near Seoul, Republicof Korea. Catena, 60 (2), 181-203.
Wilkinson, P. L., Anderson, M. G., Lloyd, D. M. and Renaud,J. P. (2002a). Landslide hazard and bioengineering: towardsproviding improved decision support through integratednumerical model development. Environmental Modelling &Software, 17 (4), 333–344.
Wilkinson, P. L., Anderson, M. G. and Lloyd, D. M. (2002b).An integrated hydrological model for rain-induced landslideprediction. Earth Surface Processes and Landforms, 27,1285–1297.
Jadda, M., Shafri, H. M. Z., Mansor, S. B., Sharifikia, M.and Pirasteh, P. (2009). Landslide Susceptibility Evaluationand Factor Effect Analysis Using Probabilistic-FrequencyRatio Model. European Journal of Scientific Research, 33(4), 654-668.
Joo Oh, H. and Pradhan, P. (2011). Application of a neuro-fuzzy model to landslide-susceptibility mapping for shallowlandslides in a tropical hilly area, Computers & Geosciences,37, 1264–1276.
Goetz, J. N., Guthrie R. H. and Brenning, A. (2011).Integrating physical and empirical landslide susceptibilitymodels using generalized additive models. Geomorphology,129, 376–386.
Int. J. Environ. Res., 7(2):319-336, Spring 2013
335
Gao, J. (1993). Identification of topographic settingsconductive to landsliding from DEM in Nelson County.Earth Surface Process and Landforms, 18, 579-591.
Glade, T. (2003). Landslide occurrence as a response to landuse change: a review of evidence from New Zealand.CATENA, 51 (3–4), 297–314.
Glade, T. (1998). Establishing the frequency and magnitudeof landslide- triggering rainstorm events in New Zealand.Environmental Geology, 35 (2-3), 160-174.
Greenway, D. R. (1987). Vegetation and slope stability. In:Anderson, M.G., Richards, K.S. (Eds.), Slope Stability. JohnWiley and Sons Ltd., West Sussex, England.
Guzzetti, F., Carrara, A., Cardinali, M. and Reichenbach, P.(1999). Landslide hazard evaluation: a review of currenttechniques and their application in a multi-scale study,Central Italy. Geomorphology, 31, 181–216.
Guzzetti, F. (2000) Landslide fatalities and the evaluationof landslide risk in Italy. Slop Engineering Geology, 58 (2),89-170.
Feizizadeh , B. et al.
Yokota, S. I. and Wamatsu, A. (1999). Weathering distributionin a steep slope of soft pyroclastic rocks as an indicator ofslope instability. Engineering Geology, 55, 57-68.
Yalcin, A. (2005). An investigation on Ardesen (Rize) regionon the basis of landslide susceptibility. PhD Thesis,Karadeniz Technical University, Trabzon, Turkey.
Yalcin, A. (2008). GIS-based landslide susceptibilitymapping using analytical hierarchy process and bivariatestatistics in Ardesen (Turkey): Comparisons of results andconfirmations. Catena, 72, 1–12.
Yu, J., Chen, Y. and Wu, J. (2011). Cellular automata basedspatial multi-criteria l and suitability simulation for irrigatedagriculture. International Journal of Geographical InformationScience, 25 (1), 131–148.
Ziemer, R. R., Lewis, J., Rice, R. M. and Lisle, T. E. (1991).Modelling the cumulative effects of forest managementstrategies. Journal of Environmental Quality, 20 (1), 36–42.
Zillman, J. (1999). The physical impact of disaster. In. J.Ingleton (Editor), Natural disaster management. Tudor RoseHolding Ltd., Leicester, 320.
336