Landslide susceptibility assessment using the bivariate statistical analysis and the index of...
10
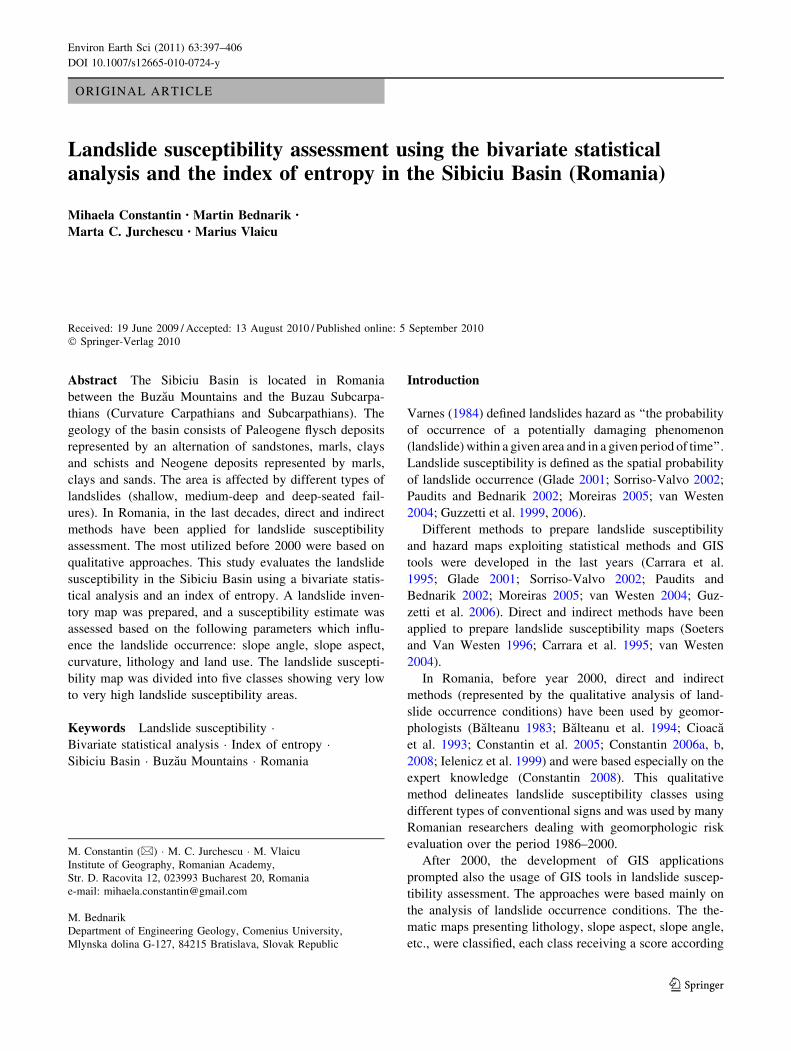
ORIGINAL ARTICLE Landslide susceptibility assessment using the bivariate statistical analysis and the index of entropy in the Sibiciu Basin (Romania) Mihaela Constantin • Martin Bednarik • Marta C. Jurchescu • Marius Vlaicu Received: 19 June 2009 / Accepted: 13 August 2010 / Published online: 5 September 2010 Ó Springer-Verlag 2010 Abstract The Sibiciu Basin is located in Romania between the Buza ˘u Mountains and the Buzau Subcarpa- thians (Curvature Carpathians and Subcarpathians). The geology of the basin consists of Paleogene flysch deposits represented by an alternation of sandstones, marls, clays and schists and Neogene deposits represented by marls, clays and sands. The area is affected by different types of landslides (shallow, medium-deep and deep-seated fail- ures). In Romania, in the last decades, direct and indirect methods have been applied for landslide susceptibility assessment. The most utilized before 2000 were based on qualitative approaches. This study evaluates the landslide susceptibility in the Sibiciu Basin using a bivariate statis- tical analysis and an index of entropy. A landslide inven- tory map was prepared, and a susceptibility estimate was assessed based on the following parameters which influ- ence the landslide occurrence: slope angle, slope aspect, curvature, lithology and land use. The landslide suscepti- bility map was divided into five classes showing very low to very high landslide susceptibility areas. Keywords Landslide susceptibility Bivariate statistical analysis Index of entropy Sibiciu Basin Buza ˘u Mountains Romania Introduction Varnes (1984) defined landslides hazard as ‘‘the probability of occurrence of a potentially damaging phenomenon (landslide) within a given area and in a given period of time’’. Landslide susceptibility is defined as the spatial probability of landslide occurrence (Glade 2001; Sorriso-Valvo 2002; Paudits and Bednarik 2002; Moreiras 2005; van Westen 2004; Guzzetti et al. 1999, 2006). Different methods to prepare landslide susceptibility and hazard maps exploiting statistical methods and GIS tools were developed in the last years (Carrara et al. 1995; Glade 2001; Sorriso-Valvo 2002; Paudits and Bednarik 2002; Moreiras 2005; van Westen 2004; Guz- zetti et al. 2006). Direct and indirect methods have been applied to prepare landslide susceptibility maps (Soeters and Van Westen 1996; Carrara et al. 1995; van Westen 2004). In Romania, before year 2000, direct and indirect methods (represented by the qualitative analysis of land- slide occurrence conditions) have been used by geomor- phologists (Ba ˘lteanu 1983; Ba ˘lteanu et al. 1994; Cioaca ˘ et al. 1993; Constantin et al. 2005; Constantin 2006a, b, 2008; Ielenicz et al. 1999) and were based especially on the expert knowledge (Constantin 2008). This qualitative method delineates landslide susceptibility classes using different types of conventional signs and was used by many Romanian researchers dealing with geomorphologic risk evaluation over the period 1986–2000. After 2000, the development of GIS applications prompted also the usage of GIS tools in landslide suscep- tibility assessment. The approaches were based mainly on the analysis of landslide occurrence conditions. The the- matic maps presenting lithology, slope aspect, slope angle, etc., were classified, each class receiving a score according M. Constantin (&) M. C. Jurchescu M. Vlaicu Institute of Geography, Romanian Academy, Str. D. Racovita 12, 023993 Bucharest 20, Romania e-mail: [email protected] M. Bednarik Department of Engineering Geology, Comenius University, Mlynska dolina G-127, 84215 Bratislava, Slovak Republic 123 Environ Earth Sci (2011) 63:397–406 DOI 10.1007/s12665-010-0724-y
-
Upload
independent -
Category
Documents
-
view
1 -
download
0
Transcript of Landslide susceptibility assessment using the bivariate statistical analysis and the index of...
ORIGINAL ARTICLE
Landslide susceptibility assessment using the bivariate statisticalanalysis and the index of entropy in the Sibiciu Basin (Romania)
Mihaela Constantin • Martin Bednarik •
Marta C. Jurchescu • Marius Vlaicu
Received: 19 June 2009 / Accepted: 13 August 2010 / Published online: 5 September 2010
� Springer-Verlag 2010
Abstract The Sibiciu Basin is located in Romania
between the Buzau Mountains and the Buzau Subcarpa-
thians (Curvature Carpathians and Subcarpathians). The
geology of the basin consists of Paleogene flysch deposits
represented by an alternation of sandstones, marls, clays
and schists and Neogene deposits represented by marls,
clays and sands. The area is affected by different types of
landslides (shallow, medium-deep and deep-seated fail-
ures). In Romania, in the last decades, direct and indirect
methods have been applied for landslide susceptibility
assessment. The most utilized before 2000 were based on
qualitative approaches. This study evaluates the landslide
susceptibility in the Sibiciu Basin using a bivariate statis-
tical analysis and an index of entropy. A landslide inven-
tory map was prepared, and a susceptibility estimate was
assessed based on the following parameters which influ-
ence the landslide occurrence: slope angle, slope aspect,
curvature, lithology and land use. The landslide suscepti-
bility map was divided into five classes showing very low
to very high landslide susceptibility areas.
Keywords Landslide susceptibility �Bivariate statistical analysis � Index of entropy �Sibiciu Basin � Buzau Mountains � Romania
Introduction
Varnes (1984) defined landslides hazard as ‘‘the probability
of occurrence of a potentially damaging phenomenon
(landslide) within a given area and in a given period of time’’.
Landslide susceptibility is defined as the spatial probability
of landslide occurrence (Glade 2001; Sorriso-Valvo 2002;
Paudits and Bednarik 2002; Moreiras 2005; van Westen
2004; Guzzetti et al. 1999, 2006).
Different methods to prepare landslide susceptibility
and hazard maps exploiting statistical methods and GIS
tools were developed in the last years (Carrara et al.
1995; Glade 2001; Sorriso-Valvo 2002; Paudits and
Bednarik 2002; Moreiras 2005; van Westen 2004; Guz-
zetti et al. 2006). Direct and indirect methods have been
applied to prepare landslide susceptibility maps (Soeters
and Van Westen 1996; Carrara et al. 1995; van Westen
2004).
In Romania, before year 2000, direct and indirect
methods (represented by the qualitative analysis of land-
slide occurrence conditions) have been used by geomor-
phologists (Balteanu 1983; Balteanu et al. 1994; Cioaca
et al. 1993; Constantin et al. 2005; Constantin 2006a, b,
2008; Ielenicz et al. 1999) and were based especially on the
expert knowledge (Constantin 2008). This qualitative
method delineates landslide susceptibility classes using
different types of conventional signs and was used by many
Romanian researchers dealing with geomorphologic risk
evaluation over the period 1986–2000.
After 2000, the development of GIS applications
prompted also the usage of GIS tools in landslide suscep-
tibility assessment. The approaches were based mainly on
the analysis of landslide occurrence conditions. The the-
matic maps presenting lithology, slope aspect, slope angle,
etc., were classified, each class receiving a score according
M. Constantin (&) � M. C. Jurchescu � M. Vlaicu
Institute of Geography, Romanian Academy,
Str. D. Racovita 12, 023993 Bucharest 20, Romania
e-mail: [email protected]
M. Bednarik
Department of Engineering Geology, Comenius University,
Mlynska dolina G-127, 84215 Bratislava, Slovak Republic
123
Environ Earth Sci (2011) 63:397–406
DOI 10.1007/s12665-010-0724-y

to the landslide density. The landslide susceptibility map
was prepared using the summation of the scores (Const-
antin 2006a, b, 2008).
This paper presents a landslide susceptibility assess-
ment in the Sibiciu Basin using a bivariate statistical
analysis. Bivariate statistical analysis is based on the
comparison between a landslide inventory map as a
dependent variable and the single input parametric maps
(lithology/landslides, slope angle/landslides, etc.). The
approach used in the study area allows calculation of
weights for each input variable and is based on the
methodology proposed by Vlcko et al. (1980) where the
weight value for each parameter is expressed as an
entropy index.
The study area
The Sibiciu Basin (Fig. 1) is located between the Buzau
Mountains and the Buzau Subcarpathians (the Curvature
Carpathians and Subcarpathians). The basin has an area of
47.11 km2. The elevation is higher in the northern part of the
basin (Zboiu Peak, 1,114 m a. s. l.; Oii Peak, 1,037 m a. s. l)
and decrease towards the Buzau Valley in the south. The
drainage density has different values: in the Buzau Moun-
tains values are typical for medium size fragmented moun-
tains (5–6 km/km2) while in the Buzau Subcarpathians,
values are of 3–4 km/km2, typical for the hilly area. Slopes
with declivity of 12�–24� covers the higher area in the basin
(43.2%) followed by slopes with declivity of 24�–36� (27%).
Fig. 1 The location of the
Sibiciu Basin
398 Environ Earth Sci (2011) 63:397–406
123
The lithology is represented by Paleogene, Neogene and
Quaternary deposits. The Paleogene deposits out crop in
the Buzau Mountains in two different facies: the Colti
facies (Pg1?2 in age) and the Kliwa Sandstone Formation
(lf-ch in age). The Colti deposits are represented by
sandstones, clays and marls. The Kliwa Sandstone For-
mation is represented by sandstones interbedded by bitu-
minous shales and clays. These deposits cover a large area
of the basin (78%) and are responsible for the landslide
occurrence in the basin. The Neogene formations cover an
area of 21.4%, and consist of Helvetian, Badenian and
Sarmatian deposits (marls, clays and sands) occurring in
southeastern part of the basin. (the Buzau Subcarpathians).
The Helvetian deposits were mapped using the geological
map 1:200,000 (year 1968); nowadays, these deposits are
considered to be Burdigalian (bd).The Quaternary (qh1–
qh2) deposits (0.6%) are eluvial, slope and alluvial sedi-
ments represented by sands, clays and loess deposits.
Landslides are frequent on Paleogene and Neogene
deposits (especially on Sarmatian deposits represented by
clays and sands).
The land use is represented by forests (67.9%), pastures
(23.8%), orchards (6.3%) and a small percentage (2%) of
rivers, roads and settlements.
The main landslide triggering factors are rainfall and
snow-melting. The mean annual temperature is 9.6�C at
Patarlagele (10 km South West from the Colti village).
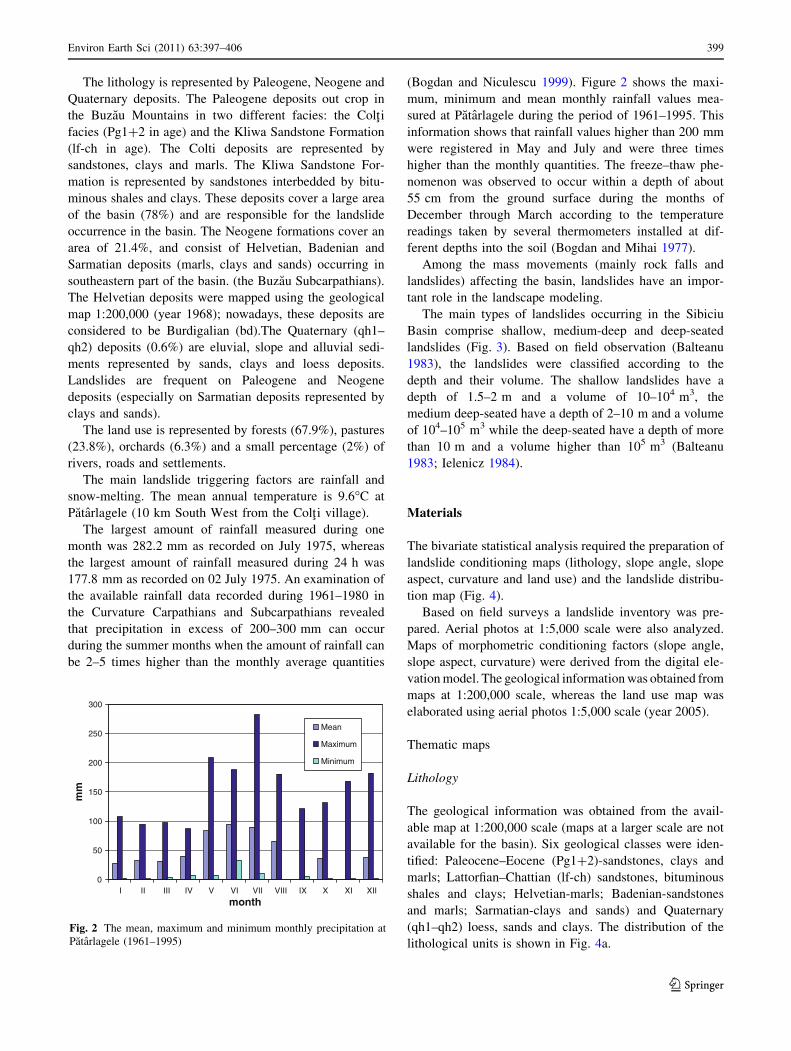
The largest amount of rainfall measured during one
month was 282.2 mm as recorded on July 1975, whereas
the largest amount of rainfall measured during 24 h was
177.8 mm as recorded on 02 July 1975. An examination of
the available rainfall data recorded during 1961–1980 in
the Curvature Carpathians and Subcarpathians revealed
that precipitation in excess of 200–300 mm can occur
during the summer months when the amount of rainfall can
be 2–5 times higher than the monthly average quantities
(Bogdan and Niculescu 1999). Figure 2 shows the maxi-
mum, minimum and mean monthly rainfall values mea-
sured at Patarlagele during the period of 1961–1995. This
information shows that rainfall values higher than 200 mm
were registered in May and July and were three times
higher than the monthly quantities. The freeze–thaw phe-
nomenon was observed to occur within a depth of about
55 cm from the ground surface during the months of
December through March according to the temperature
readings taken by several thermometers installed at dif-
ferent depths into the soil (Bogdan and Mihai 1977).
Among the mass movements (mainly rock falls and
landslides) affecting the basin, landslides have an impor-
tant role in the landscape modeling.
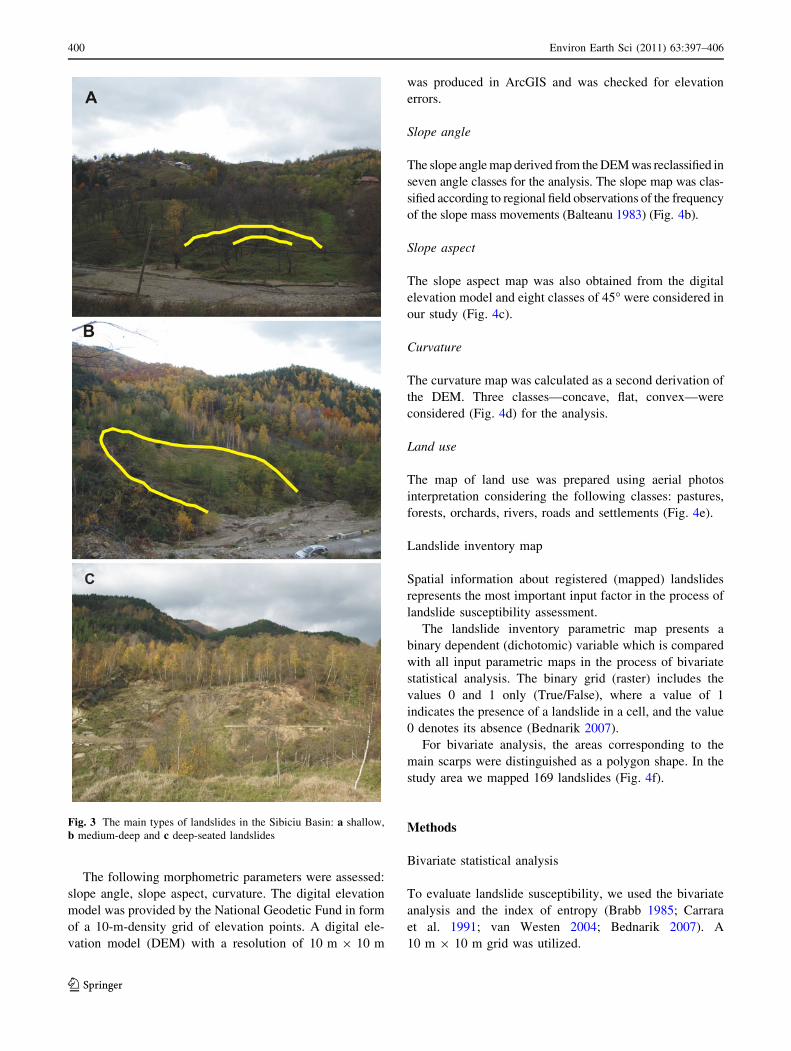
The main types of landslides occurring in the Sibiciu
Basin comprise shallow, medium-deep and deep-seated
landslides (Fig. 3). Based on field observation (Balteanu
1983), the landslides were classified according to the
depth and their volume. The shallow landslides have a
depth of 1.5–2 m and a volume of 10–104 m3, the
medium deep-seated have a depth of 2–10 m and a volume
of 104–105 m3 while the deep-seated have a depth of more
than 10 m and a volume higher than 105 m3 (Balteanu
1983; Ielenicz 1984).
Materials
The bivariate statistical analysis required the preparation of
landslide conditioning maps (lithology, slope angle, slope
aspect, curvature and land use) and the landslide distribu-
tion map (Fig. 4).
Based on field surveys a landslide inventory was pre-
pared. Aerial photos at 1:5,000 scale were also analyzed.
Maps of morphometric conditioning factors (slope angle,
slope aspect, curvature) were derived from the digital ele-
vation model. The geological information was obtained from
maps at 1:200,000 scale, whereas the land use map was
elaborated using aerial photos 1:5,000 scale (year 2005).
Thematic maps
Lithology
The geological information was obtained from the avail-
able map at 1:200,000 scale (maps at a larger scale are not
available for the basin). Six geological classes were iden-
tified: Paleocene–Eocene (Pg1?2)-sandstones, clays and
marls; Lattorfian–Chattian (lf-ch) sandstones, bituminous
shales and clays; Helvetian-marls; Badenian-sandstones
and marls; Sarmatian-clays and sands) and Quaternary
(qh1–qh2) loess, sands and clays. The distribution of the
lithological units is shown in Fig. 4a.
0
50
100
150
200
250
300
I II III IV V VI VII VIII IX X XI XII
month
mm
Mean
Maximum
Minimum
Fig. 2 The mean, maximum and minimum monthly precipitation at
Patarlagele (1961–1995)
Environ Earth Sci (2011) 63:397–406 399
123
The following morphometric parameters were assessed:
slope angle, slope aspect, curvature. The digital elevation
model was provided by the National Geodetic Fund in form
of a 10-m-density grid of elevation points. A digital ele-
vation model (DEM) with a resolution of 10 m 9 10 m
was produced in ArcGIS and was checked for elevation
errors.
Slope angle
The slope angle map derived from the DEM was reclassified in
seven angle classes for the analysis. The slope map was clas-
sified according to regional field observations of the frequency
of the slope mass movements (Balteanu 1983) (Fig. 4b).
Slope aspect
The slope aspect map was also obtained from the digital
elevation model and eight classes of 45� were considered in
our study (Fig. 4c).
Curvature
The curvature map was calculated as a second derivation of
the DEM. Three classes—concave, flat, convex—were
considered (Fig. 4d) for the analysis.
Land use
The map of land use was prepared using aerial photos
interpretation considering the following classes: pastures,
forests, orchards, rivers, roads and settlements (Fig. 4e).
Landslide inventory map
Spatial information about registered (mapped) landslides
represents the most important input factor in the process of
landslide susceptibility assessment.
The landslide inventory parametric map presents a
binary dependent (dichotomic) variable which is compared
with all input parametric maps in the process of bivariate
statistical analysis. The binary grid (raster) includes the
values 0 and 1 only (True/False), where a value of 1
indicates the presence of a landslide in a cell, and the value
0 denotes its absence (Bednarik 2007).
For bivariate analysis, the areas corresponding to the
main scarps were distinguished as a polygon shape. In the
study area we mapped 169 landslides (Fig. 4f).
Methods
Bivariate statistical analysis
To evaluate landslide susceptibility, we used the bivariate
analysis and the index of entropy (Brabb 1985; Carrara
et al. 1991; van Westen 2004; Bednarik 2007). A
10 m 9 10 m grid was utilized.
Fig. 3 The main types of landslides in the Sibiciu Basin: a shallow,
b medium-deep and c deep-seated landslides
400 Environ Earth Sci (2011) 63:397–406
123
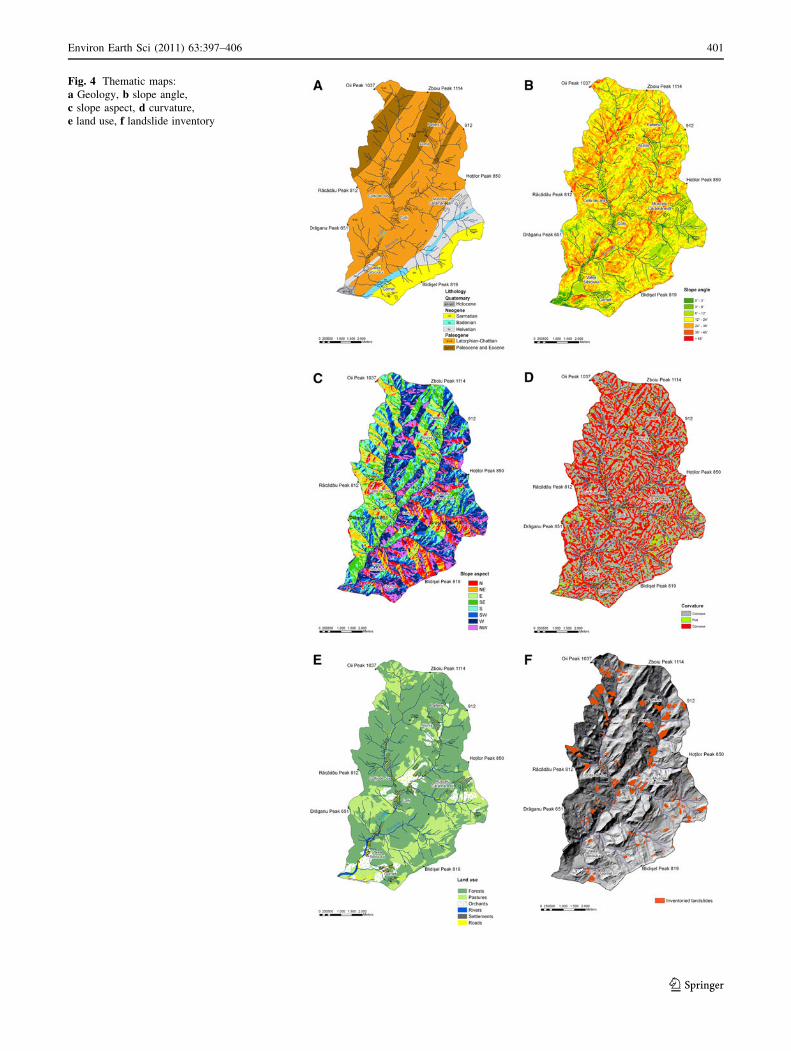
Fig. 4 Thematic maps:
a Geology, b slope angle,
c slope aspect, d curvature,
e land use, f landslide inventory
Environ Earth Sci (2011) 63:397–406 401
123
The bivariate statistical analysis is based on the com-
parison, within a GIS environment, between the landslide
distribution and the selected parametric maps (lithology/
landslides, slope angle/landslides, etc.). This approach
allows calculation of the weight for each input variable.
Herein, the weighting process is based on the methodology
proposed by Vlcko et al. (1980). The weight value for each
parameter taken separately is expressed as an entropy
index.
Weighting process
The weight parameter was obtained from the defined level
of entropy representing the approximation to normal dis-
tribution of the probability. The entropy index indicates the
extent of disorder in the environment. It also expresses
which parameters in a natural environment are most rele-
vant for the development of mass movements. The calcu-
lated weights of individual parameters form the Wi value in
the landslide susceptibility assessment equation (Bednarik
et al. 2009).
The equations used to calculate the information coeffi-
cient Wj representing the weight value for the parameter as
a whole are:
pij ¼Asd
Atð1Þ
pij
� �¼ pijPsj
j¼1 pij
: ð2Þ
Hj and Hj max represent entropy values (Eqs. 3, 4).
Hj ¼ �Xsj
i¼1
ðpijÞ log2 pij
� �; j ¼ 1; . . .; n ð3Þ
Hjmax ¼ log2 sj; sj � number of classes ð4Þ
Ij is the information coefficient (Eq. 5) and Wj represents
the resultant weight value for the parameter as a whole
(Eq. 6).
Ij ¼Hj max � Hj
Hj max
; I ¼ 0; 1ð Þ; j ¼ 1; . . .; n ð5Þ
Wj ¼ Ijpij: ð6Þ
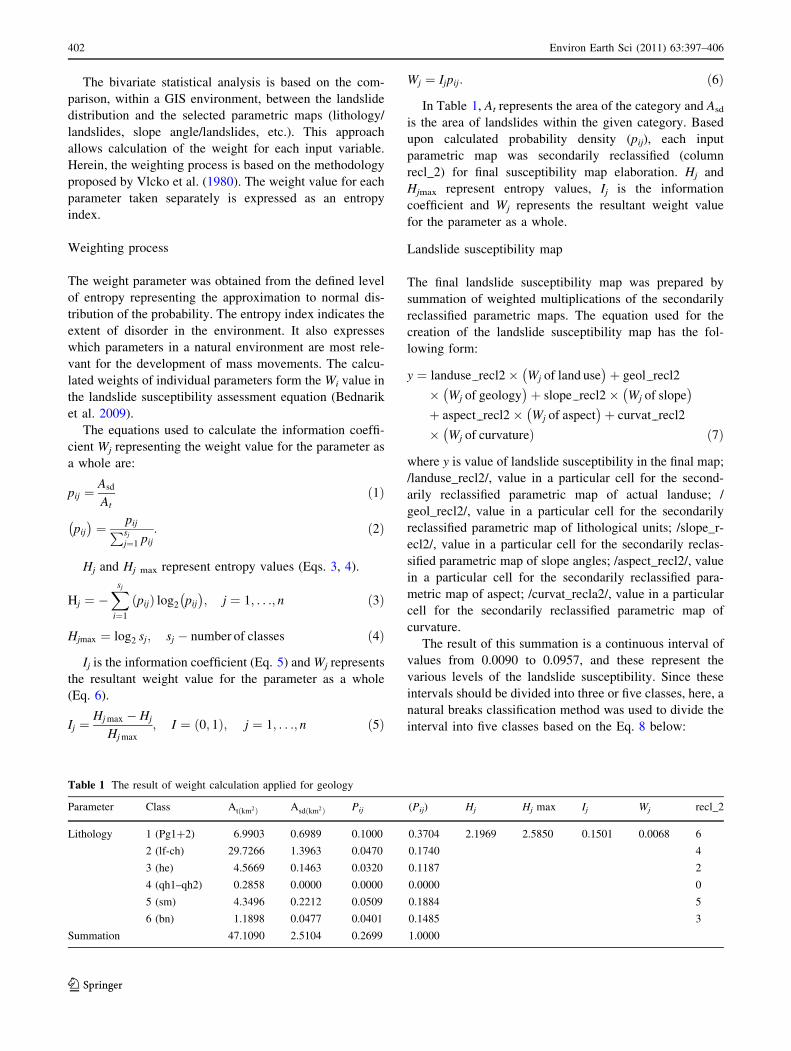
In Table 1, At represents the area of the category and Asd
is the area of landslides within the given category. Based
upon calculated probability density (pij), each input
parametric map was secondarily reclassified (column
recl_2) for final susceptibility map elaboration. Hj and
Hjmax represent entropy values, Ij is the information
coefficient and Wj represents the resultant weight value
for the parameter as a whole.
Landslide susceptibility map
The final landslide susceptibility map was prepared by
summation of weighted multiplications of the secondarily
reclassified parametric maps. The equation used for the
creation of the landslide susceptibility map has the fol-
lowing form:
y ¼ landuse recl2� Wj of land use� �
þ geol recl2
� Wj of geology� �
þ slope recl2� Wj of slope� �
þ aspect recl2� Wj of aspect� �
þ curvat recl2
� Wj of�
curvatureÞ ð7Þ
where y is value of landslide susceptibility in the final map;
/landuse_recl2/, value in a particular cell for the second-
arily reclassified parametric map of actual landuse; /
geol_recl2/, value in a particular cell for the secondarily
reclassified parametric map of lithological units; /slope_r-
ecl2/, value in a particular cell for the secondarily reclas-
sified parametric map of slope angles; /aspect_recl2/, value
in a particular cell for the secondarily reclassified para-
metric map of aspect; /curvat_recla2/, value in a particular
cell for the secondarily reclassified parametric map of
curvature.
The result of this summation is a continuous interval of
values from 0.0090 to 0.0957, and these represent the
various levels of the landslide susceptibility. Since these
intervals should be divided into three or five classes, here, a
natural breaks classification method was used to divide the
interval into five classes based on the Eq. 8 below:
Table 1 The result of weight calculation applied for geology
Parameter Class Atðkm2Þ Asdðkm2Þ Pij (Pij) Hj Hj max Ij Wj recl_2
Lithology 1 (Pg1?2) 6.9903 0.6989 0.1000 0.3704 2.1969 2.5850 0.1501 0.0068 6
2 (lf-ch) 29.7266 1.3963 0.0470 0.1740 4
3 (he) 4.5669 0.1463 0.0320 0.1187 2
4 (qh1–qh2) 0.2858 0.0000 0.0000 0.0000 0
5 (sm) 4.3496 0.2212 0.0509 0.1884 5
6 (bn) 1.1898 0.0477 0.0401 0.1485 3
Summation 47.1090 2.5104 0.2699 1.0000
402 Environ Earth Sci (2011) 63:397–406
123
SSDi...j ¼Xj
n¼i
A½n� �medianð Þ2 ð8Þ
where SSD is the sum of the squared differences; A, data
set (in ascending order).
Natural breaks method follows the Gauss normal dis-
tributions and it was used for classifying the results.
Results
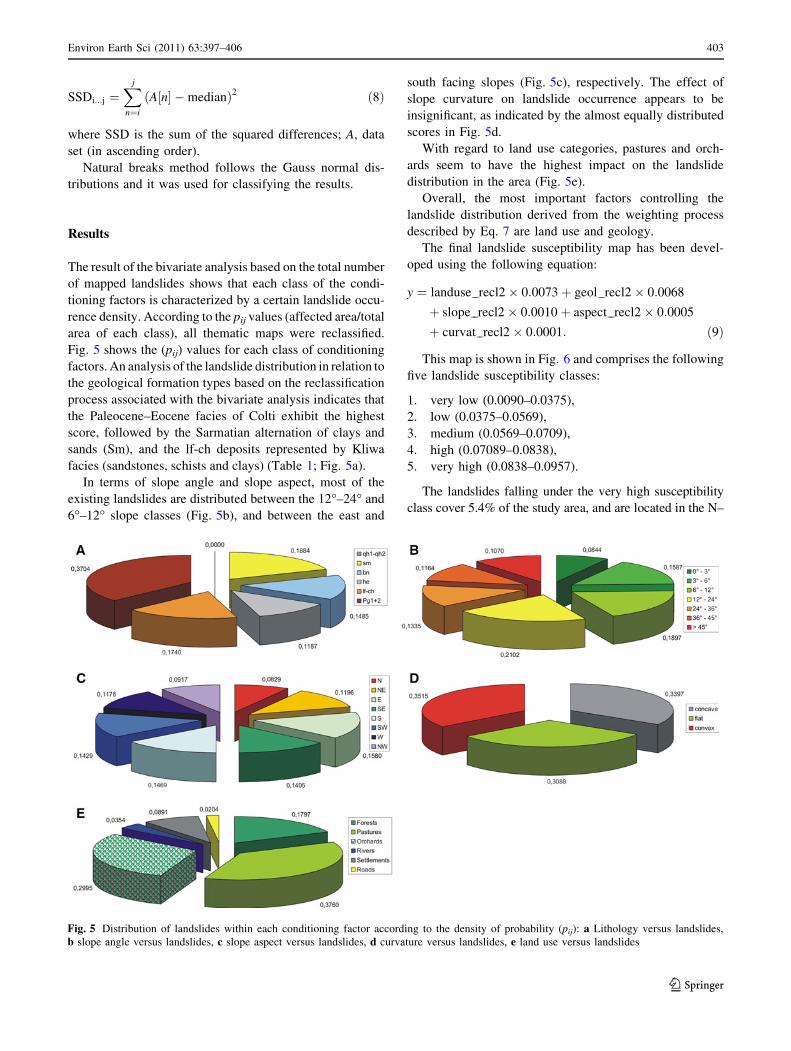
The result of the bivariate analysis based on the total number
of mapped landslides shows that each class of the condi-
tioning factors is characterized by a certain landslide occu-
rence density. According to the pij values (affected area/total
area of each class), all thematic maps were reclassified.
Fig. 5 shows the (pij) values for each class of conditioning
factors. An analysis of the landslide distribution in relation to
the geological formation types based on the reclassification
process associated with the bivariate analysis indicates that
the Paleocene–Eocene facies of Colti exhibit the highest
score, followed by the Sarmatian alternation of clays and
sands (Sm), and the lf-ch deposits represented by Kliwa
facies (sandstones, schists and clays) (Table 1; Fig. 5a).
In terms of slope angle and slope aspect, most of the
existing landslides are distributed between the 12�–24� and
6�–12� slope classes (Fig. 5b), and between the east and
south facing slopes (Fig. 5c), respectively. The effect of
slope curvature on landslide occurrence appears to be
insignificant, as indicated by the almost equally distributed
scores in Fig. 5d.
With regard to land use categories, pastures and orch-
ards seem to have the highest impact on the landslide
distribution in the area (Fig. 5e).
Overall, the most important factors controlling the
landslide distribution derived from the weighting process
described by Eq. 7 are land use and geology.
The final landslide susceptibility map has been devel-
oped using the following equation:
y ¼ landuse recl2� 0:0073þ geol recl2� 0:0068
þ slope recl2� 0:0010þ aspect recl2� 0:0005
þ curvat recl2� 0:0001: ð9Þ
This map is shown in Fig. 6 and comprises the following
five landslide susceptibility classes:
1. very low (0.0090–0.0375),
2. low (0.0375–0.0569),
3. medium (0.0569–0.0709),
4. high (0.07089–0.0838),
5. very high (0.0838–0.0957).
The landslides falling under the very high susceptibility
class cover 5.4% of the study area, and are located in the N–
Fig. 5 Distribution of landslides within each conditioning factor according to the density of probability (pij): a Lithology versus landslides,
b slope angle versus landslides, c slope aspect versus landslides, d curvature versus landslides, e land use versus landslides
Environ Earth Sci (2011) 63:397–406 403
123
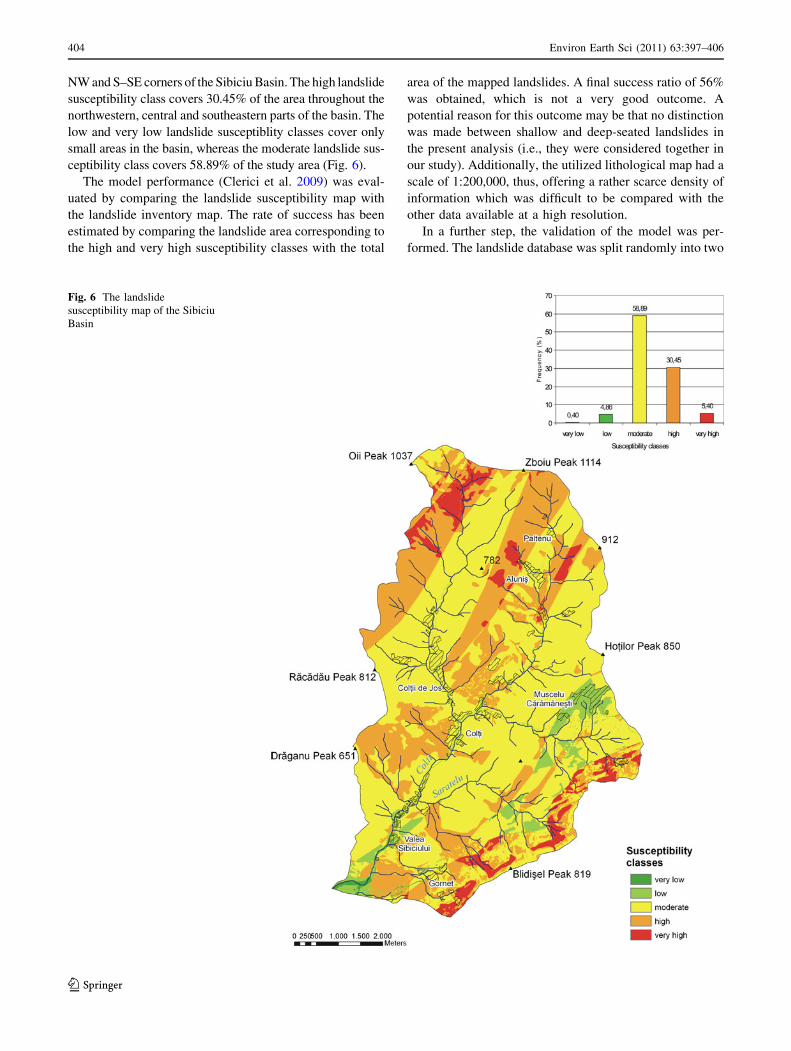
NW and S–SE corners of the Sibiciu Basin. The high landslide
susceptibility class covers 30.45% of the area throughout the
northwestern, central and southeastern parts of the basin. The
low and very low landslide susceptiblity classes cover only
small areas in the basin, whereas the moderate landslide sus-
ceptibility class covers 58.89% of the study area (Fig. 6).
The model performance (Clerici et al. 2009) was eval-
uated by comparing the landslide susceptibility map with
the landslide inventory map. The rate of success has been
estimated by comparing the landslide area corresponding to
the high and very high susceptibility classes with the total
area of the mapped landslides. A final success ratio of 56%
was obtained, which is not a very good outcome. A
potential reason for this outcome may be that no distinction
was made between shallow and deep-seated landslides in
the present analysis (i.e., they were considered together in
our study). Additionally, the utilized lithological map had a
scale of 1:200,000, thus, offering a rather scarce density of
information which was difficult to be compared with the
other data available at a high resolution.
In a further step, the validation of the model was per-
formed. The landslide database was split randomly into two
Fig. 6 The landslide
susceptibility map of the Sibiciu
Basin
404 Environ Earth Sci (2011) 63:397–406
123
datasets based on a 7:3 ratio. The first data set (i.e., 70%,
training set) was employed in the model construction,
whereas the other data set (i.e., 30%, validation set) was
used for the model testing (Clerici et al. 2006). New re-
classifications of each thematic layer were made based on
the not always new relationships established between the
conditioning factors and the 70% landslide distribution
dataset. The new scores were different only in terms of
aspect and curvature. The greatest score is still associated
with the east and the southeast facing slopes. Additionally,
the importance of concave and convex configured slopes is
switched.
Considering the weight of each conditioning factor
resulting from the 70% model construction, it can be seen
from Eq. 10 that the order of the parameters was not
changed.
y ¼ landuse recl2� 0:0062þ geol recl2� 0:0051
þ slope recl2� 0:0009þ aspect recl2� 0:0004
þ curvat recl2� 0:00001: ð10Þ
Only small differences between the two models can be
noticed in the percentage distribution of the susceptibility
classes within the Sibiciu Basin (a maximum difference of
0.6–0.7% in the case of moderate and high classes).
Discussions
The bivariate and multivariate statistical analyses are
mostly used for this kind of works with a high rate of
reliability. A bivariate statistical analysis has been adopted
for the landslide susceptibility assessment processing.
From among of the landslide susceptibility zonation
methods, the statistical analysis supported by GIS envi-
ronment seems to be suitable for medium and large-scale
(1:2,000–1:25,000) approaches (Clerici et al. 2009).
The bivariate statistical analysis and the index of
entropy utilized herein offer the possibility to compare the
landslide distribution map with each conditioning factor
and to assign weights.
The methodology was applied recently for several case
studies in Slovakia (Bednarik 2007; Bednarik et al. 2009)
and the rate of success was high. A number of 47 rock
slides and 268 earth slides were mapped out and were
compared with geology, DEM, aspect, land use and slope.
The findings have revealed that the most important
conditioning factor was geology, the rate of success being
70%. In our case study presented herein, 169 landslides
were taken into account and the result was that land use and
geology are the most important factors which explain better
the landslide occurrence. The rate of success was 58%
which was not a very good result comparing with the case
study from Slovakia where all input data were at similar
resolution (1:10,000). The main disadvantage for our case
study in Romania is the absence of data with similar res-
olution in digital form, which account for the unsatisfactory
rate of success mentioned above.
Conclusions
The Sibiciu Basin, located at the contact between the
Buzau Mountains (built on Paleogene flysch deposits rep-
resented mainly by alternations of sandstones and clays)
and the Buzau Subcarpathians (built by Neogene deposits
consisting of clays, marls and sands), has a large incidence
of landslides.
Based on the consideration that in general future land-
slide processes in the area will occur within old landslide
deposits or will be reactivations of the actual landslides, a
series of direct and indirect methods involving the land-
slide inventory map, landslide conditioning factors and
statistical tools available in a GIS environment were uti-
lized to develop a methodology for assessing the spatial
probability of landslides occurrence throughout the Sibiciu
Basin.
In order to assess the landslide susceptibility, we used
bivariate statistical analysis and the index of entropy with
definition of the weight of the parameters. The landslide
inventory map was compared with all thematic maps,
including lithology/landslides, slope angle/landslides, slope
aspect/landslides, curvature/landslides, land use/landslides).
According to the results of the bivariate statistical
analysis, the highest probability of landslide occurrence is
associated with Paleogene deposits (Pg1?2) comprising
the Colti facies (sandstones, clays and marls) and slope
angles of 12�–24�. Additionally, slope aspects falling in the
east, south and southwest quadrants show the highest
probability of landslide occurrence. Slope curvature is not a
major factor being characterized by an equal probability of
occurrence for each analyzed landslide susceptibility class.
A comparison of the landslide inventory map with the land
use map, revealed that the highest probability of landslide
occurrence is in areas covered by pastures and orchards.
The final map shows an area of very high landslide
susceptibility of 2.5 km2 (i.e., 5.4% of the total study area),
an area of high landslide susceptibility of 14.3 km2 (i.e.,
30.45% of the total study area), and an area of moderate
landslide susceptibility of 27.7 km2 (i.e., 58.9% of the total
study area). The low susceptibility class covers an area of
2.3 km2 (i.e., 4.86% of the total study area), whereas the
very low susceptibility class has an area of 0.19 km2 (i.e.,
0.4% of the total study area).
The model validation was conducted by developing a
new map using 70% of randomly selected landslides from
the first data set, and retaining the rest of 30% as the
Environ Earth Sci (2011) 63:397–406 405
123
validation set. By comparing the two models, only very
small differences between the areas of landslide suscepti-
bility classes were observed.
The analysis based on the entropy index characterizing
the level of chaos in the environment revealed that the most
unfavorable factors controlling the slope instability phe-
nomena throughout the study area are land use (pastures)
and geology (Paleocene–Eocene deposits).
The methodology applied herein can also be used in
landslide susceptibility assessment throughout other basins
with similar landslide occurence conditions. The assessment
based on the proposed methodology can be signficantly
improved if different types of landslides (e.g., shallow,
deep-seated) are considered and input data with similar
resolution are used. The landslide susceptibility maps
obtained using this method may represent a useful tool to the
authorities involved with territorial and land use planning.
Acknowledgments The present study was supported by the Min-
istry of Education and Research through the grant in aid PNII-
IDEI_367 (2007–2010) funded through The National University
Research Council of Romania (CNCSIS). The kind cooperation with
Department of Engineering Geology, Comenius University, Brati-
slava, is fully appreciated.
References
Balteanu D (1983) Experimentul de teren ın geomorfologie, Ed.
Academiei Romane, Bucuresti, pp 157 (in Romanian)
Balteanu D, Badea L, Dinu M, Cioaca A, Sandu M, Constantin M
(1994) Geomorphological hazards in the Buzau Subcarpathians,
Ed. Inst de Geografie, Bucuresti, pp 24 (in Romanian)
Bednarik M (2007) Landslide risk assessment as a base for land use
planning. PhD thesis, Faculty of Natural Sciences, Comenius
University in Bratislava, pp 130
Bednarik M, Magulova B, Matys M, Marschalko M (2009) Landslide
susceptibility assessment of the Kralovany–Liptovsky Mikulas
railway case study. In: Physics and chemistry of the earth, Parts
A/B/C. doi:10.1016/j.pce.2009.12.002 (article in press)
Bogdan O, Mihai E (1977) Ritmicitatea fenomenului inghet-dezghet
in Subcarpatii Buzaului, SCGGG-Geogr, XXIV, pp 31–44 (in
Romanian)
Bogdan O, Niculescu E (1999) Riscurile climatice din Romania, Sega
International, pp 280 (in Romanian)
Brabb EE (1985) Innovative approaches to landslide hazard and risk
mapping. In: Proceedings of the IVth international conference
and field workshop on landslides. Tokyo, pp 17–22
Carrara A, Cardinali M, Detti R, Guzzetti F, Pasqui V, Reichenbach P
(1991) GIS techniques and statistical models in evaluating
landslide hazard. In: Earth surface processes and landforms.
16:427–445
Carrara A, Cardinali M, Guzzetti F, Reichenbach P (1995) GIS-based
technology for mapping landslide hazard. In: Carrara A, Guzzetti
F (eds) Geographical information systems in assessing natural
hazards. Kluwer, Dordrecht, pp 35–175
Cioaca A, Balteanu D, Dinu M, Constantin M (1993) Studiul unor
cazuri de risc geomorfologic ın Carpatii de la Curbura, SCGGG-
Geogr, XL, pp 43–57 (in Romanian)
Clerici A, Perego S, Tellini C, Vescovi P (2006) A GIS-based
automated procedure for landslide susceptibility mapping by the
conditional analysis method: the Baganza valley case study
(Italian Northern Apennines). Environ Geol 50(7):941–961
Clerici A, Perego S, Tellini C, Vescovi P (2009) Landslide failure and
runout susceptibility in the upper T. Ceno valley (Northern
Apennines, Italy), Natural Hazards. doi:10.1007/sl1069-009-
9349-4
Constantin M (2006) The landslides distribution in the Niigata region
(Japan) and the Buzau Subcarpathians (Romania). Comparative
regional study. Civil Eng J 48(4):52–57 (in Japanese)
Constantin M (2006) Prognoza alunecarilor de teren. Abordari
Actuale, Ed.AGIR, Bucuresti, pp99 (in Romanian)
Constantin M (2008) The landslide susceptibility assessment in
Romania. A review of regional approaches. In: Proceedings of
the international conference on management of landslide hazard
in the Asia-Pacific Region, satellite symposium of the first world
landslide forum, 11–15 November 2008, Sendai, Japan, The
Japan Landslide Society, pp 510–518
Constantin M, Rotaru A, Nishimoto H, Yamakoshi T (2005)
Geomorphological hazards in Romania. Some examples from
the area situated at the contact between Buzau Carpathians and
Buzau Subcarpathians. J Jpn Soc Erosion Control Eng
58(1):59–62 (in Japanese)
Glade T (2001) Landslide hazard assessment and historical landslide
data-an inseparable couple. The use of historical data in natural
hazards assessment. Kluwer, Netherlands, pp 153–168
Guzzetti F, Carrara A, Cardinali M, Reichenbach P (1999) Landslide
hazard evaluation; a review of current techniques and their
application in a multi-scale study, Central Italy. Geomorphology
37(1–2):181–216
Guzzetti F, Reichenbach P, Ardizzone F, Cardinali M, Galli M (2006)
Estimating the quality of landslide susceptibility models. Geo-
morphology 81:166–184
Ielenicz M (1984) Muntii Ciucas-Buzau. Studiu geomorfologic., Ed.
Academiei, pp 146 (in Romanian)
Ielenicz M, Patru I, Mihai B (1999) Some geomorphologic types of
landslides in Romania, Transactions, Japanese Geomorpholog-
ical Union, 20–23, Tokyo. Romane, pp 287–299
Moreiras S (2005) Landslide susceptibility zonation in the Rio
Mendoza valley, Argentina. Geomorphology 66:345–357
Paudits P, Bednarik M (2002) Using GIS in evaluation of landslide
susceptibility in Handlovska Kotlina Basin. In: Rybar J,
Stemberk J, Wagner P (eds) Proceedings of the 1st European
conference on landslide. Swets and Zeitlinger, Lisse, Praha,
Czech Republic, 24–26th of June, 2002, pp 437–441. ISBN
90-5809-393 X
Soeters R, Van Westen CL (1996) Slope instability, recognition,
analysis, and zonation. In: Turner AK, Schuster RL (eds)
Landslides: investigation and mitigation. National Academy
Press, Washington, DC, pp 129–177
Sorriso-Valvo M (2002) Landslides: from inventory to risk. Land-
slides, Balkema, Rotterdam
van Westen CJ (2004) Geo-information tools for landslide risk
assessment: an overview of recent developments. In: Lacerda W,
Ehrlich M, Fontoura SAB, Sayao ASF (eds) Landslides:
evaluation and stabilization. Taylor and Francis Group, Balk-
ema, London, pp 39–57
Varnes DJ, Intern. Association of Engineering Geology Commission
on Landslides and Other Mass Movements on Slopes (1984)
Landslide hazard zonation: a review of principles and practice,
UNESCO, Paris, pp 63
Vlcko J, Wagner P, Rychlikova Z (1980) Evaluation of regional slope
stability. Mineralia Slovaca 12(3):275–283
406 Environ Earth Sci (2011) 63:397–406
123