Assessing landslide exposure in areas with limited landslide information
20
1 23 Landslides Journal of the International Consortium on Landslides ISSN 1612-510X Landslides DOI 10.1007/s10346-013-0386-4 Assessing landslide exposure in areas with limited landslide information Roberta Pellicani, Cees J. Van Westen & Giuseppe Spilotro
Transcript of Assessing landslide exposure in areas with limited landslide information
1 23
LandslidesJournal of the International Consortiumon Landslides ISSN 1612-510X LandslidesDOI 10.1007/s10346-013-0386-4
Assessing landslide exposure in areas withlimited landslide information
Roberta Pellicani, Cees J. Van Westen &Giuseppe Spilotro

1 23
Your article is protected by copyright and
all rights are held exclusively by Springer-
Verlag Berlin Heidelberg. This e-offprint is
for personal use only and shall not be self-
archived in electronic repositories. If you
wish to self-archive your work, please use the
accepted author’s version for posting to your
own website or your institution’s repository.
You may further deposit the accepted author’s
version on a funder’s repository at a funder’s
request, provided it is not made publicly
available until 12 months after publication.
LandslidesDOI 10.1007/s10346-013-0386-4Received: 21 March 2012Accepted: 29 January 2013© Springer-Verlag Berlin Heidelberg 2013
Roberta Pellicani I Cees J. Van Westen I Giuseppe Spilotro
Assessing landslide exposure in areas with limitedlandslide information
Abstract Landslide risk assessment is often a difficult task due tothe lack of temporal data on landslides and triggering events(frequency), run-out distance, landslide magnitude and vulnera-bility. The probability of occurrence of landslides is often verydifficult to predict, as well as the expected magnitude of events,due to the limited data availability on past landslide activity. Inthis paper, a qualitative procedure for assessing the exposure ofelements at risk is presented for an area of the Apulia region(Italy) where no temporal information on landslide occurrence isavailable. Given these limitations in data availability, it was notpossible to produce a reliable landslide hazard map and, conse-quently, a risk map. The qualitative analysis was carried out usingthe spatial multi-criteria evaluation method in a global informa-tion system. A landslide susceptibility composite index map andfour asset index maps (physical, social, economic and environ-mental) were generated separately through a hierarchical proce-dure of standardising and weighting. The four asset index mapswere combined in order to obtain a qualitative weighted assetsmap, which, combined with the landslide susceptibility compositeindex map, has provided the final qualitative landslide exposuremap. The resulting map represents the spatial distribution of theexposure level in the study area; this information could be used ina preliminary stage of regional planning. In order to demonstratehow such an exposure map could be used in a basic risk assess-ment, a quantification of the economic losses at municipal levelwas carried out, and the temporal probability of landslides wasestimated, on the basis of the expert knowledge. Although the pro-posedmethodology for the exposure assessment did not consider thelandslide run-out and vulnerability quantification, the resultsobtained allow to rank the municipalities in terms of increasingexposure and risk level and, consequently, to identify the prioritiesfor designing appropriate landslide risk mitigation plans.
Keywords Spatial multi-criteria evaluation . Susceptibility .
Elements at risk . Exposure . Landslide risk
IntroductionThe evaluation, in mathematical terms, of landslide risk canbe very complicated, due to several aspects, related to thecomplexity in assessing landslide hazard and vulnerability(Glade 2003; Uzielli et al. 2008).
For a given category of elements at risk, the specific risk can bequantified as the product of vulnerability, amount of elements at riskand the probability of occurrence of a specific hazard scenario with agiven return period in a given area (VanWesten et al. 2006). In orderto compute the total risk, all the specific risks for all types of elementsat risk, and for a number of hazard scenarios with different returnperiods, are integrated (Glade et al. 2005).
A correct evaluation of the landslide hazard requires the anal-ysis of the probability of occurrence of a specific type of landslidewith a given intensity at a specific location, within a certain timeperiod (Van Westen et al. 2006). However, often, there are not
enough data to make a reliable assessment of the temporal proba-bility of occurrence. This probability may be assessed either bycomputing the probability of failure of a slope (or the reactivationof existing landslides), or through the frequency analysis of pastlandslide events. In the latter case, the temporal frequency of land-slides may be determined, directly, by using records of landslides, or,indirectly, from the recurrence of the landslide triggering events(Corominas and Moya 2008). In many cases the absence or incom-pleteness of landslide records makes it impossible to establish aquantitative relationship between the occurrence of landslides andthe most important triggering events. Because of these difficulties indetermining temporal probability, many landslide studies are onlyfocusing on the evaluation of susceptibility (Van Westen et al.2006), by analysing the relationship between the spatial dis-tribution of instability factors, i.e. the environmental factorsthat are correlated with slope instability, and the distributionof past landslide events (Fell et al. 2008).
Another difficult task is to evaluate the vulnerability of theelements at risk, through the quantification of the degree of damageof the elements at risk resulting from the occurrence of a landslide ofa given intensity (Glade 2003). The vulnerability depends on a seriesof factors which are difficult to assess, such as the type of landslide,the magnitude and intensity of the landslide and the capacity of theelement at risk to withstand the landslide impact (Fuchs et al. 2007).Furthermore, elements at risk vary in space and time, and therefore,the vulnerability varies as well. In this case, the vulnerability shouldbe regarded as depending on the proportion of time that an elementat risk is exposed to the hazard, especially when dealing with persons(Lee and Jones 2004). So, for the determination of the tem-poral vulnerability of the elements at risk, it is important toconsider the probability that the element is present at thetime of impact (Jaiswal et al. 2010).
The spatial overlay of a set of elements at risk with landslidesusceptibility zones is defined as exposure. Generally, the exposureidentifies which elements at risk might experience some degree ofdamage. Lee and Jones (2004) evaluate the exposure as the propor-tion of total value of the element at risk likely to be present andthereby susceptible to being adversely impacted by the landslide,while the vulnerability is defined as the proportion of the total valueof the element at risk likely to be affected detrimentally by a givenmagnitude of landslide. Assessing the exposure of elements at riskmeans evaluating the proportion of the assets that are located in thehazardous areas. Exposure analysis is an intermediate stage of riskassessment, which links the susceptibility and hazard assessmentwith the value of elements at risk. In literature, relatively few studiesare focused on procedures for the assessment of landslide exposure;generally, the landslide exposure is considered as a part of thelandslide risk assessment (Lee and Jones 2004; Sassa et al. 2005).The exposure analysis is widely carried out in other fields, forexample, in studies related to rainstorms or earthquakes (OSFI1998; UNDP 2011; Quan et al. 2011) or in those related to the urbansystems (Masure and Lutoff 2008).
Landslides
Original Paper
Author's personal copy
Generally, landslide risk assessment and management consist inestimating the level of risk, evaluating whether it is acceptable andadopting appropriate control measures for the mitigation of the riskwhen the level of risk cannot be accepted (Aleotti and Chowdhury1999; Dai et al. 2002; Crosta et al. 2005; Sassa et al. 2005; Fell et al.2008). Several methods can be used according to the scale of thestudy, the data availability and the aims of the hazard and riskanalysis (Lee and Jones 2004; Glade et al. 2005; Van Westen et al.2006), which can be grouped in qualitative, semi-quantitative andquantitative methods. In the quantitative methods, the total risk canbe represented by means of a risk curve, expressing the relationbetween all hazard scenarios with different temporal probabilitiesand the corresponding expected losses (Van Westen et al. 2010).Whatever the method for landslide risk assessment is, themain sources of uncertainties stem from the estimation ofthe temporal probability of a specific landslide event withgiven intensity, the analysis of the physical vulnerability andthe evaluation of expected losses.
In order to make a reliable map that predicts the land-slide hazard and risk in a certain area, it is crucial to have aninsight into the spatial and temporal frequency of landslides,run-out distance and landslide magnitude (Remondo et al.2005); therefore, each landslide hazard or risk study shouldstart by making a landslide inventory that is as complete aspossible in both space and time (Ibsen and Brundsen 1996;Lang et al. 1999; Glade 2001; Van Westen et al. 2008). Alandslide inventory map should give an insight into the loca-tion of landslide phenomena, the types, failure mechanisms,causal factors, frequency of occurrence, volumes and thedamage that has been caused (Fell et al. 2008). Furthermore,it should include information on landslide activity, useful todefine the temporal frequency of landslides (Guzzetti et al.2006; Van Westen et al. 2008).
In this paper, a qualitative method for assessing theexposure is presented for an area where no temporal infor-mation on landslide occurrence is available. This is quite acommon situation in many countries. Landslide inventoriesmay be available, but they often lack sufficient informationon dates of landslide occurrence in order to be able toestimate temporal probabilities of landslide occurrence, aswell as the expected magnitude of events. Given these limi-tations in data availability and details, a qualitative exposuremap has been produced from the combination of a landslidesusceptibility map and a weighted assets map, both generatedusing a spatial multi-criteria evaluation (SMCE) procedure ina global information system (GIS) environment. Subsequently,a quantitative assessment of exposure was carried out byevaluating, for each municipality in the study area, locatedin the South of Italy, the exposed assets (or consequences) inmonetary terms. After calculating the economic value, anestimation of the total risk at municipal level was evaluated,by assigning temporal probability values to the various classesand plotting these against the quantified exposure in riskcurves (Van Westen et al. 2010).
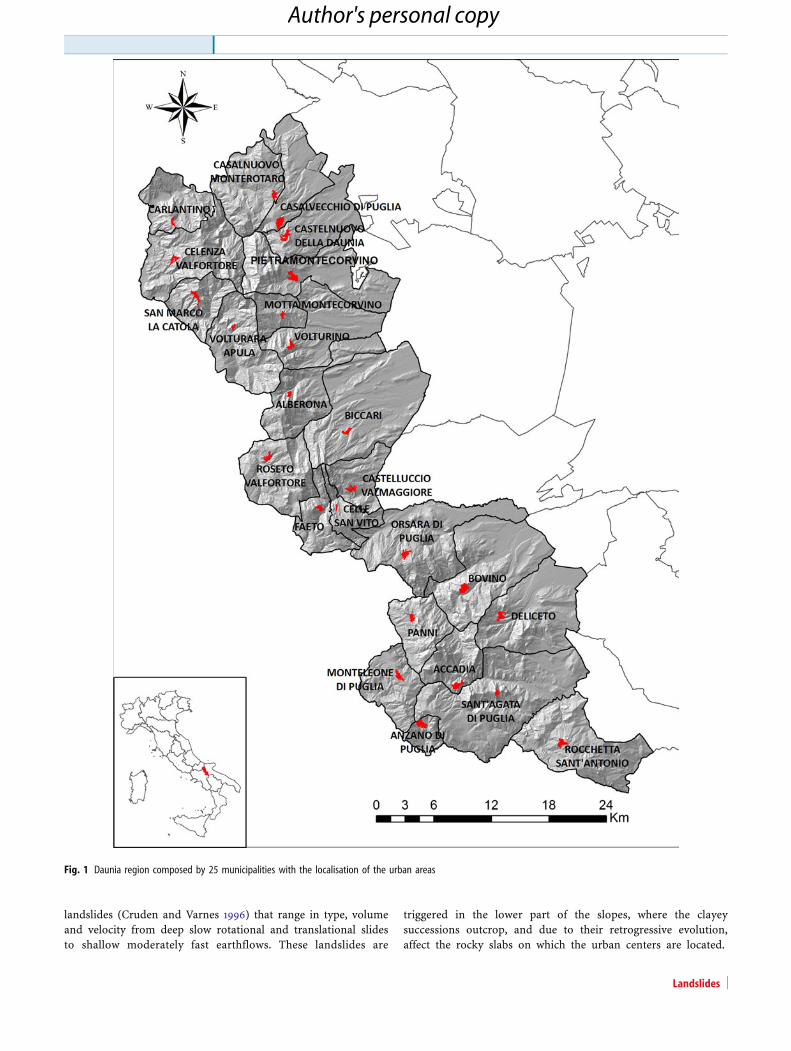
Study areaThe study area extends for 1,282 km2 in the western part of theApulia region, in Southern Italy (Fig. 1). This area represents thegeographical region called Daunia, including 25 municipalities in
Foggia province. Daunia is bordered, in the North by the Fortoreriver, in the East by the Apulian Foreland, in the West by theSouthern Apennines and in the South by the upper drainage basinof Ofanto River.
Elevation in the area ranges from about 50 masl at FortoreRiver to 1,152 masl at Mt. Cornacchia. Due to this large altituderange, the climatic conditions are quite variable and characterisedby cold winters and mild summers. Rainfall is abundant especiallyfrom November to February. The total annual rainfall average is800 mm. The annual average temperature is around 12 °C, andmonthly means range from 2 °C to 21 °C.
The geological setting of Daunia is closely related to thegeological history of the Southern Italian Apennines. TheApulian sector of the Southern Apennines is an allochthonousunit overlaying the terrigenous successions of the BradanicTrough, which in their turn override the Apulian Foreland units.In the study area, two different stratigraphic successions have beenrecognised. These are the Daunia Unit, in the East, and the FortoreUnit, in the West (Dazzaro and Rapisardi 1996). The Daunia Unitis formed by an Oligocene–Miocene succession of clayey andcalcareous strata (Red Flysch and Numidic Flysch Formations), acalcareous-marly turbidite succession (Faeto Flysch Formation),and clay and marly-clay formation (Toppo Capuana Formation).The Fortore Unit consists of Red Flysch and Numidic FlyschFormations, superimposed by pseudotransgressive terrigenousMiocene deposits (San Bartolomeo Flysch and Toppo CapuanaFormations) (Dazzaro et al. 1988). The Faeto Flysch Formationconsists of a lower clayey-marly member and an upper marly-calcareous one.
The geological–structural setting of the area is characterisedby a wide variety of formations with very different mechanicalproperties (rocky successions versus clays), interacting with eachother and often heavily folded and faulted due to the intensetectonic actions occurred during the Apenninic orogeny(Mostardini and Merlini 1986; Patacca and Scandone 2007).
The Red Flysch, in the lower part, is made up of calcareousturbidites, interbedded with red and green clays and marly clays,while in the upper part it is formed by marly clays and scaly clays,grey-green to red in colour. At the top of the Red Flysch, there arestrata of bentonite clays. In both scaly clays part of the Red Flyschand bentonite clays, the fissuring and the very poor strengthproperties control the mechanical behaviour of the soil(Cotecchia et al. 2006).
As a result, the landscape is characterised mainly by clayeyslopes with medium steepness (around 12°), which locallyincreases (until 45°) in the presence of rocky strata. The lowerslopes up to 300–400 masl are covered by arable crops and olivegroves, while the slopes at higher altitudes are occupied bydeciduous forests and areas with herbaceous vegetation usedas pasture.
Due to the lithological, structural, geomorphological andclimatic characteristics of the area, landslides are frequent inthe Daunia region and cover about 12 % of the territory. In thisportion of the Apennines, meteoric events and earthquakesrepresent the main triggering factors of landslides. A peculiaraspect of the landslides occurring in the Daunia region is thewide variety of the soils involved, mainly consisting of rock-liketo soil-like strata interacting with each other and often heavilyfractured. Mass movements consist of composite and complex
Original Paper
Landslides
Author's personal copy
landslides (Cruden and Varnes 1996) that range in type, volumeand velocity from deep slow rotational and translational slidesto shallow moderately fast earthflows. These landslides are
triggered in the lower part of the slopes, where the clayeysuccessions outcrop, and due to their retrogressive evolution,affect the rocky slabs on which the urban centers are located.
Fig. 1 Daunia region composed by 25 municipalities with the localisation of the urban areas
Landslides
Author's personal copy

Therefore, landslides are a major source of damage toproperties in the urban centers of the area, involving especiallythe transportation system and the stability of building’s foun-dations. In the last 50 years, the growing demand for physicaldevelopment of these mountain centers has produced a veryrapid expansion of built-up areas, often with poor planning ofurban and territorial infrastructure, and invasion of the agri-cultural areas. Because of this development of new construc-tions on unstable hillslope areas, human activities such asdeforestation or excavation of slopes for road cuts and buildingsites, etc., have become other important triggers for landslideoccurrence.
Methods and data
Available data and limitationsThe landslide inventory map used in this study was produced by theBasin Authority of Apulia region (POR PUGLIA 2009), throughstereoscopic aerial-photo-interpretation, using black and white aerialphotographs at scale 1:33,000, flown in 2003 by the Italian MilitaryGeographical Institute. The polygons representing landslide areaswere digitised in GIS on georeferenced orthophotos at scale 1:5,000.About 1,320 landslides were detected, mapped and classified accord-ing to movement typology. Five landslide typologies were recognised
(Fig. 2a): rotational slides (2 %), translational slides (5 %), earthflows(27 %), complex movements (24 %) and areas with many undiffer-entiated mass movements (20 %). The first four types are in accor-dance with the classification defined by Varnes (1984), while the lastcategory was introduced to indicate areas characterised by the coa-lescence of different landslides not individually classifiable or byshallow landslides with poorly defined boundaries. The typology ofmovement has been attributed to each landslide polygon through theimage analysis of diagnostic features (morphological, vegetation anddrainage characteristics that allow an image interpreter to classify theidentified landslide phenomena). For 22 % of the landslides, themovement typology could not be determined, due to the absence ofclear diagnostic features or their alteration by external factors (e.g.ploughing, revegetation). The main limitation of the landslideinventory map is the absence of information on the occur-rence date and the landslide activity, since the landslides werenot detected in different years for the lack of a multi-tempo-ral dataset.
The landslide inventory map and all other thematic in-formation layers were stored and managed in a GIS spatialdatabase using both vector and raster (cell size of 10 m)formats. A digital elevation model (DEM) was generatedthrough an interpolation algorithm, using contour lines witha 5-m interval and elevation points, which were extracted
Fig. 2 a Landslide inventory map with indication of movement typology; b lithological map at 1:100,000 scale (Legend: 1 quarzitic sandstone, sand and clayey sand; 2varicoloured clay; 3 clay and sandy clay; 4 blue-grey clay; 5 Toppo Capuana marly clay; 6 breccia; 7 polygenetic gravel of different size; 8 debris deposits; 9 clayey-marlyfacies of Faeto Flysch; 10 calcareous-marly facies of Faeto Flysch; 11 marl, silty clay, calcareous marl; 12 San Bartolomeo Flysch; 13 puddingstone; 14 sand and sandstone; 15sands with clayey intercalations; 16 yellow-gray sands; 17 landslide deposits)
Original Paper
Landslides
Author's personal copy
from the Apulia Regional Technical Map, at scale 1:5,000.From the DEM, standard morphometric information layerswere obtained, i.e. the slope and aspect maps.
The lithological map was produced by integrating theoriginal Geological Map of Italy at 1:100,000 scale with his-torical geological sheets at 1:25,000 scale. More detailed geo-logical sheets were avai lable only for small areas ;consequently, the information was discontinuous, inhomoge-neous and negligible compared with the analysis scale. Thelithological thematic map, shown in Fig. 2b, includes 16 lith-ological units. The land use map at 1:5,000 scale, obtainedfrom the SIT (Sistema Informativo Territoriale) of the ApuliaRegion, was simplified, and the 58 land use types weremerged into six classes: urban area, crops, pasture, shrubs,forests, bare and water bodies (rivers and lakes).
Spatial multi-criteria evaluationBecause of the main limitations concerning the availability of tem-poral data on landslides and triggering events, a qualitative methodwas used in generating the landslide susceptibility map, which wascombined with the elements (or assets) at risk to produce an expo-sure map, through a SMCE method in a Geographic InformationSystem (ILWIS-GIS). Spatial multi-criteria evaluation is a techniquefor decision making, which uses spatial criteria, which are stand-ardised, combined and weighted with respect to a main goal (VanWesten et al. 2010), in this case, the landslide susceptibility map andthe asset maps. The analysis was implemented by using the SMCEmodule of ILWIS-GIS (Integrated Land and Water InformationSystem), in which the input consists of a set of indicator maps,considered as the spatial representation of the criteria, which aregrouped, standardised and weighted in a “criteria tree”(ITC 2001).
The output is represented by a “composite index map”, whichindicated the spatial representation of the main goal.
The theoretical background for the multi-criteria evaluation isbased on the analytic hierarchy process (AHP), developed by Saaty(1980) (Van Westen et al. 2010). The use of AHP in GIS-based multi-criteria decision-making approaches is widely used in urban plan-ning, especially in relation to land use allocation problems (Ceballos-Silva and Lòpez-Blanco 2003; Svoray et al. 2005; Hossain et al. 2007).It is also used in studies related to forest conservation planning at alandscape scale (Phua and Minowa 2005; Greene et al. 2010) and tosite selection for nuclear waste facilities (Carver 1991; Malczewski1996; Sharifi and Retsios 2003). The technique has been applied tolandslide susceptibility and risk assessment, although in a few casesonly. Yoshimatsu and Abe (2006) applied the AHP method for iden-tifying areas susceptible to landsliding in Japan, assigning scores toeach factor ofmicro-topography of landslide-prone areas. Castellanosand VanWesten (2007) developed a procedure for the generation of alandslide risk index map at national level in Cuba, using a SMCE.Finally, Gorsevski and Jankowski (2010), for the landslide susceptibil-ity assessment, used the fuzzy membership functions to standardiseterrain attributes and develop criteria, while the aggregation of thecriteria was achieved by the use of SMCE techniques.
The use of a procedure based on an expert-based SMCE methodallows obtaining of a qualitative evaluation of the susceptibility andexposure at regional scale, also in absence of temporal informationabout input data and, therefore, when it is not possible to use prob-abilistic methods for assessing landslide hazard and vulnerability.
In general, the AHP technique allows decomposing of a specificproblem into a hierarchy of criteria so that decisions can be made byusing the relative importance of the criteria, by weighting the factorsand criteria at each level of hierarchy.
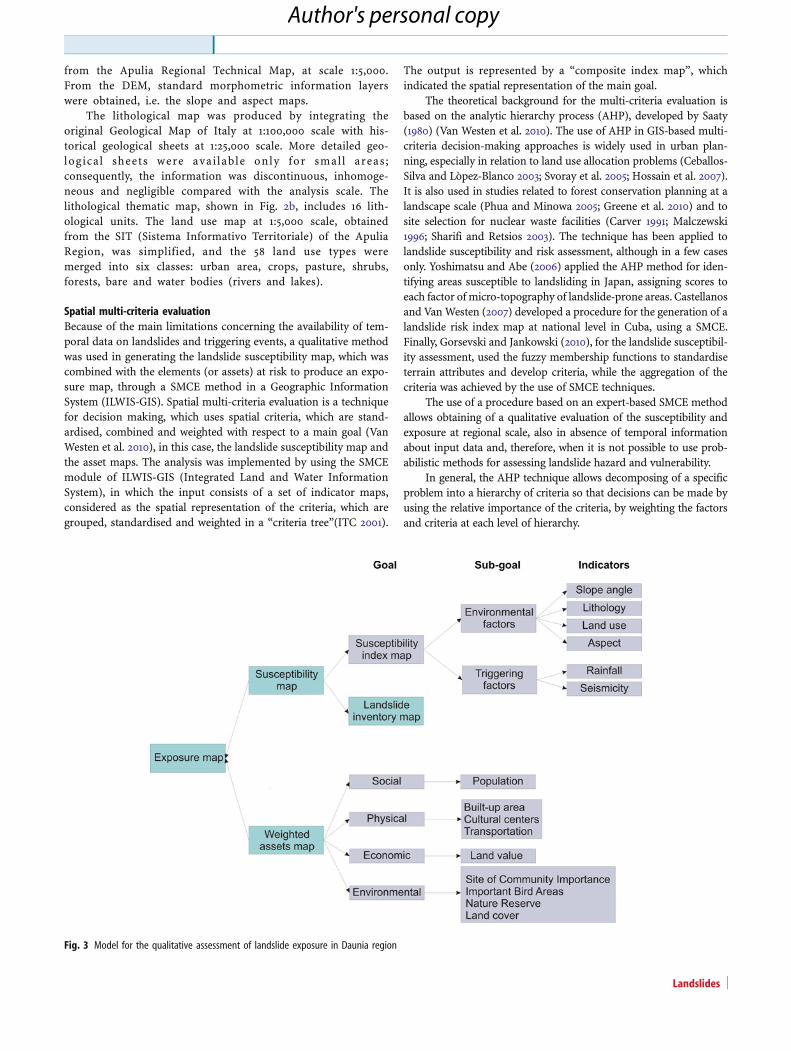
Fig. 3 Model for the qualitative assessment of landslide exposure in Daunia region
Landslides
Author's personal copy
The procedure to generate both the landslide susceptibility mapand the weighted assets map (see Fig. 3), by using SMCE technique, iscomposed by the following general steps: (1) definition of the problem,selecting the criteria and structuring of the problem into a criteria tree,with several branches or groups, and a number of factors and/orconstraints; the “factors” are the criteria that contribute in differentway to the goal; they can be grouped into several “group of factors”,which in turn can be grouped into several “sub-goals”; the “con-straints” are criteria used to mask out the area where the goal cannotbe reached (Van Westen et al. 2010); each factor is represented by an“indicator map”; (2) standardisation of the factors, which may be indifferent format (nominal, ordinal, interval, etc.) and normalisation toa range of 0–1, through the following methods: maximum linear,interval linear, goal linear, convex and concave curves (Van Westenet al. 2010); (3) weighting of the factors (criteria) within each group, bymeans of three main methods: direct method, pairwise comparisonand rank ordering; (4) weighting of the groups (intermediate result),in order to come to an overall weight value; (5) classification of theresults. After selecting the appropriate indicator maps, defining theirstandardisation and the hierarchical structure, it is necessary to clas-sify each indicator as favourable (benefit) or unfavourable (cost) inrelation to the intermediate objective or to the main goal. Anothersignificant aspect to be considered in themodel structuring is definingone or more constrain indicators. Constrain indicators consist ofinput maps containing areas that do not satisfy a particularbinding condition and assign zero values to the resulting com-posite index map.
In this study, the exposure map is not obtained as main goalin SMCE module. The input maps (susceptibility and weightedassets) are generated separately as main goals of different criteriatrees, subdivided into classes and afterward combined in a two-dimensional table or matrix. The landslide susceptibility indexmap consists of environmental conditional factors influencingthe slope stability and triggering factors related to the occurrenceof landslides. Four types of assets are combined in the weightedassets map: (1) physical (buildings, cultural buildings and trans-portation networks), (2) social (population), (3) economic (landvalue) and (4) environmental (land cover and protected areas).Therefore, these categories represent more the relative importanceof the assets than an actual measure of their amount. As previ-ously mentioned, the susceptibility composite index map is divid-ed into three classes (low, medium and high susceptibility level),and the existing landslides are added in the final susceptibilitymap in order to indicate a very high susceptibility level, as in thestudy area, reactivation phenomena are very common. The fourasset maps are computed separately, subdivided into two classes(low and high) according to their histograms and combined inorder to obtain the final weighted assets map, representing differ-ent levels of relative importance of the assets in the area. Theexposure map is generated combining in a two-dimensional table,the susceptibility map and the final weighted assets map. Then,the exposure map could be converted into a qualitative risk mapby assuming values for temporal and spatial probability of occur-rence of landslides in each of the susceptibility classes.
Method for susceptibility assessmentThe first step in the generation of the landslide susceptibility indexmap was the selection of indicator maps and the definition of thestructure of the criteria tree, followed by the standardisation and
weighting of indicator maps. In this study, the susceptibility indexmap was obtained by combining two intermediate mapscorresponding to two main groups of indicators: environmentalfactors and triggering factors.
The environmental and triggering factors consist of a set ofthematic layers that are considered to have an influence on theoccurrence of landslides and can be utilised as causal factors in theprediction of future landslides. The selection of causal factorsdiffers depending on the scale of analysis, the characteristics ofthe study area, the landslide type and the failure mechanisms(Guzzetti et al. 1999; Van Westen et al. 2008). In this study, dueto the lack in temporal data availability, only the spatial variationof triggering agents over the study area has been considered. Afteran analysis of the relationship between a number of factors, usingbivariate statistical analysis, the following predisposing factorswere selected as they had the largest relevance for landslide initi-ation: slope angle, aspect, land use and lithology, while rainfall andseismicity were taken into account as triggering factors.
The slope angle and aspect maps were generated in ArcGISfrom the DEM with a 10 m spatial resolution. The Slope angle mapwas obtained through an algorithm that calculates automaticallythe maximum rate of change between each cell and its neighboursin the steepest downhill direction. The maximum slope angleobtained was 45°, with a mean value of 9.5°. From the analysis ofthe slope angle histogram, we found that the 43.8 % of the studyarea has a slope angle between 0° and 8°. The frequency distribu-tion of slope angles in areas affected by landslides revealed thathillslopes with slope angle lower than 6° are not affected by land-slides, while most of unstable areas (30 %) had a slope anglebetween 10° and 12°. Based on these results, areas with slope anglebetween 0° and 6° were selected as constraints, indicating areaswith no landslide susceptibility. For normalising the slope angleindicator, a direct method was used. The slope angle map wasdivided into 23 classes, each one of 2°. Increasing values, between 0and 1, were assigned to classes with slope angle between 7° and 28°,while unit value was given for slope angles ranging from 29° to 45°.
Also, the Aspect map was generated from the DEM, by usingan algorithm that identifies the downslope direction of the maxi-mum rate of change in value from each cell to its neighbours. Theaspect map was divided into eight classes, each of which is 45°wide. About 37 % of the study area is facing N–NE; however, themost unstable hillslopes are those facing south-east and, secondly,south-west while there are very few landslides located on slopesfacing north. This is due to the winds from SE that cause a strongrise in temperature and simultaneously a marked affect of soildrying, which makes it more vulnerable to erosion. The rankingmethod with an expected value option was used to normalise theaspect classes. Through this method, the higher normalised valueswere assigned to the classes more prone to landsliding.
The land use map with six legend classes was normalised usingthe direct method. To assign weights, the relative importance of theland use classes were determined by analysing their relationship withthe past landslide events through a bivariate statistical analysis. Thisanalysis has showed that land uses where the soil could be moreexposed to erosional processes, such as bare, crops and pastureareas, are those mostly affected by landslides. Water bodies (riversand lakes) were considered constraint factors, such as flat areas.
The lithology indicator map was composed by 16 lithologicalunits. The spatial correlations between lithologies and existing
Original Paper
Landslides
Author's personal copy
landslides were evaluated, in order to define the highest landslide-prone units. It was found that the lithologies more susceptible tolandsliding are those tectonically disturbed and remolded, with poorstrength properties, such as old landslide deposits, varicoloured clays(Red Flysch), marly-clayey facies of Faeto Flysch and debris deposits.Weights ranging between 0 and 1 were assigned to the 16 units usingthe rank-ordering method.
The two triggering factors taken into account in this study wererainfall and seismicity. Rainfall is the main triggering factor in thisarea. Annual total rainfall data were obtained from 24meteorologicalstations located inside the study area or in the direct vicinity. Thespatial variation over the study area was calculated by interpolatingthe point data from 1920 up to 2005, published by Civil ProtectionAuthority of Apulia Region. The values range from 551.3, at lowelevation areas in the eastern part of the study area, to 907.6 mmin the mountainous zones. To standardise the rainfall values, themaximum linear method was used. In this way, the input values weredivided by the maximum value possible (Castellanos and VanWesten 2007), 907.6 mm in this case.
Although earthquakes are less frequent than rainfall events inthe study area, there is a strong correlation between landslides andseismicity. Historical sources revealed that, from the fourth century,seismic events with intensity greater than VIII degree of Mercalli
scale occurred (Boschi et al. 1995, 2000). The epicenters of both thehistorical and recent earthquakes are lined up along a strip, orientedNW–SE, which coincides with the axis of the chain. Maximum peakground acceleration (PGA) data were used from the seismic hazardmap of Italy made by the National Institute of Geophysics andVolcanology (INGV 2004). The PGA values range between 0.14 and0.23 g with a mean of 0.18 g. The highest values are localised on thesouth-western border of the study area, near the Apennine Chain.The standardisation of PGA value was made using the maximumlinear method.
After generating the hierarchical structure, selecting and stand-ardising the indicators, weights were assigned to each indicator andintermediate map. The four environmental factors were weightedusing the direct method, considering lithology and slope angle indi-cators as the most important. The weights for the triggering factorswere evaluated through a pairwise comparison. The standardisationand weighting methods are summarised in Table 1.
Method for generation of the weighted assets mapConsidering the limitations in the input data, a qualitative assess-ment of the importance of the assets was carried out.Subsequently, the information on the assets was used for theexposure analysis and later also for estimating landslide risk.
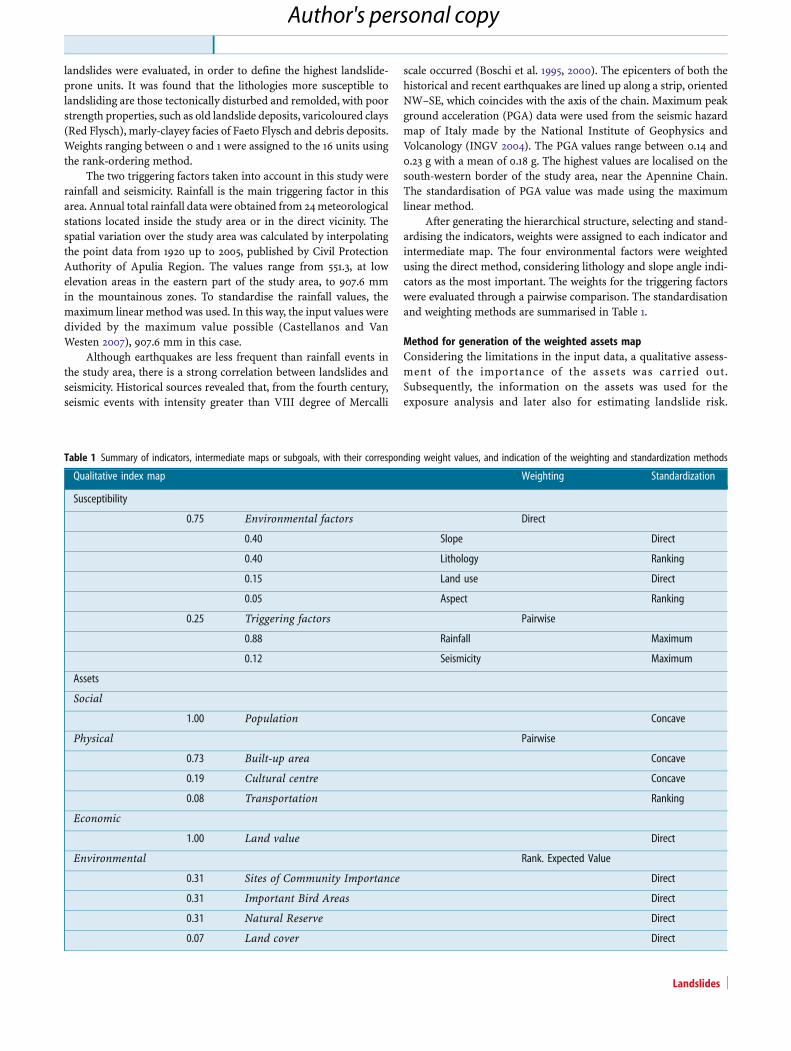
Table 1 Summary of indicators, intermediate maps or subgoals, with their corresponding weight values, and indication of the weighting and standardization methods
Qualitative index map Weighting Standardization
Susceptibility
0.75 Environmental factors Direct
0.40 Slope Direct
0.40 Lithology Ranking
0.15 Land use Direct
0.05 Aspect Ranking
0.25 Triggering factors Pairwise
0.88 Rainfall Maximum
0.12 Seismicity Maximum
Assets
Social
1.00 Population Concave
Physical Pairwise
0.73 Built-up area Concave
0.19 Cultural centre Concave
0.08 Transportation Ranking
Economic
1.00 Land value Direct
Environmental Rank. Expected Value
0.31 Sites of Community Importance Direct
0.31 Important Bird Areas Direct
0.31 Natural Reserve Direct
0.07 Land cover Direct
Landslides
Author's personal copy
Note that in this study we did not consider vulnerability separate-ly, as we lacked information on expected intensities of landslides.
The identification and mapping of asset indicators were madeconsidering the main known effects of landsliding in the studyarea (Cotecchia 1963; Spilotro et al. 1992; Guzzetti et al. 1994; Zezzaet al. 1994; Spilotro et al. 2000; Puglisi et al. 2005; Pennetta 2006).Most of the assets affected by landslides are the buildings and thetransportation networks, followed by agricultural lands, serviceinfrastructures and public service structures. Damages to publicand private buildings and to transportation network result inindirect damages to the population, in the form of temporaryhomelessness, permanent or temporary unavailability of agricul-ture and farming structures, disruption of services, longer traveltimes and so on (Galli and Guzzetti 2007).
For the qualitative assessment of the relative importance, theassets were divided into four different types, i.e. physical, social,economic and environmental (UNPD 2004). A total of nine indi-cators were considered: built-up area, cultural centers and trans-portation (physical indicators), population (social indicators),land value (economic indicators), sites of community importance,important bird areas, nature reserve and land cover (environmen-tal indicators).
The first two physical indicators were generated using theinformation obtained from the Regional Technical Map of Apulia(at 1:5,000 scale), which contains information about the size andtypology of buildings, subdivided into buildings (private and pub-lic), sheds, castles and churches. Additional information about thenumber of people in each municipality was inserted in the map.The built-up area indicator represents the number of buildings perhectare (building density) within each of the 25 urban centers. Itwas defined by dividing the number of buildings, in each urbancentre, by the total area (hectares) of the urban centre. The buildingdensity in an urban centre was considered more relevant than thetotal number of buildings per centre as the last one does not considerthe area of the centre. For the same reason, the population densitywas used instead of the total population per administrative unit.
Population data were obtained from the annual demographicbalance made by ISTAT (National Institute of Statistics). Most urbancenters have a building density ranging from 10 to 25 buildings/haand a population density ranging from 15 to 50 persons/ha. Themaximum values of building and population density respectively50 buildings/ha and 700 persons/ha are related to Anzano di Pugliamunicipality in the southern part of Daunia region. To avoid adisproportionately distribution of buildings and population on thestudy area, a concave curve-standardising method was used for boththe indicators, with an inflection point at 36 buildings/ha for thebuilt-up indicator and at 80 persons/ha for the population indicator.
The cultural centres indicator is given by the number ofcultural buildings (only castles and churches) in each munic-ipality. Especially the municipalities located in the central partof Daunia, such as Faeto, Celle San Vito and Bovino, have arich cultural, historical and artistic heritage. Each of theselocalities, as crossed by an important Roman road, ViaAppia Traiana, has between seven and ten cultural buildings.For the other municipalities, these values range from two tofour. The standardisation was done using the concave methodwith an inflection point at 5.
The transportation indicator represents the distribution ofthe road system in the study area. The road network was
extracted from the Regional Technical Map of Apulia andwas subdivided into four categories: motorway, paved road,unpaved road and bridges. The latter are located mainly alongpaved roads at river crossings. To standardise the classes oftransportation indicator, the ranking method with an expectedvalue option was used. The motorway was considered the firstpriority, secondly, paved roads and bridges, and finally, un-paved roads.
The land use map was used as indicator for both theeconomic (land value indicator) and environmental (land cov-er indicator) maps. In the first case, the 32 land use classeswere classified according to their importance for the regionalproduction. Therefore, industrial areas, commercial areas, sitesfor production and distribution of energy and new urbanisa-tion sites were considered the most important elements. Forthe environmental exposure, the same elements were evaluat-ed in terms of their environmental value. The highest valuehas been assigned to deciduous and conifer forests and toreforestation areas. A slightly lower value has been given toolive groves, vineyards and orchards, because they representan important resource for the regional rural environment. Tostandardise both the indicators, weights ranging between 0 and 1were assigned to the land use classes using the direct method.
Besides the land cover indicator, the protected areas were usedas indicators for the environmental index map. From the ItalianNational Geoportal, three indicators were selected: sites of commu-nity importance (SCI), important bird areas (IBA) and nature re-serve. SCI are defined in the European Commission HabitatsDirective as sites which, in a biogeographical region, contributesignificantly to the maintenance of biological diversity and to themaintenance or restoration at a favourable conservation status of anatural habitat type or of a species. In Daunia region, there are sixSCI units with a total area of about 400 km2, which is 31 % of thestudy area. The important bird areas aim at the conservation ofspecific bird species and other biodiversity. There is only one IBA,Daunia Mountains, in the northern part of the study area, with anarea of 750 km2, which includes three of the six SIC. Finally, a limitedarea of the Regional Nature Park of Ofanto River is included in themost southern part of Daunia region. These three environmentalindicators were considered equally important, so a unit standardisedvalue was assigned to them.
After the selection of the indicators and their normalisation,the definition of indicator weights was carried out. Table 1 givesan overview of the indicators, standardisation and weightingmethods, and the resulting weights. The economic and socialindex maps were composed only of one indicator. For thephysical indicators, the weights were established through thepairwise comparison method, considering the built-up areasmore important than cultural sites and transportation network.Finally, the environmental indicators were weighted using theranking method with the expected value option, through whichthe three protected areas were considered the same way withweights greater than that relating to the land cover indicator. Arepresentation of the model used for the qualitative assessmentof exposure is given in Fig. 3.
Method for exposure assessmentA quantitative assessment of the exposure of assets was carried outfor each municipality. The quantification of the amount of the
Original Paper
Landslides
Author's personal copy
elements at risk could be done in terms of monetary values (i.e.value of buildings, forest or crops) or by expressing the number ofbuildings, persons, etc.
As the population is a mobile asset (Lee and Jones 2004), theevaluation of exposure of persons in building requires the calcu-lation of conditional probability of persons being present in build-ing, given the time of the day that the landslide might occur (VanWesten et al. 2006). Due to the difficulties both in assessing thetemporal and spatial distribution of people in an urban centre andthe ethical dilemma in quantifying the economic value associatedto injuries or deaths, we decided to remove the number of peoplein buildings from the list of assets that would be represented inmonetary values.
With regard to cultural buildings, they are located in theoldest part of urban centres that is the most stable. For this reasonand also because the economical quantification of damage tocastles and churches needs the evaluation of restoration costs,we have not considered this asset in the quantitative analysis.
Finally, the quantitative assessment of exposure was carriedout for 25 types of assets, obtained from the four previous men-tioned asset maps, which are: residential buildings, commercialbuildings, arable crops, orchards, olive groves, pastures, shrubs,vineyards, crops, conifer forests, deciduous forests, mixed forests,building sites, cemeteries, landfills, farms, hospitals, industrialareas, energy areas, sport areas, motorways, paved roads, unpavedroads and wind turbine generators. The quantification, in terms ofareal extent (squared meters and hectares), of assets has been done
for each municipality. The information on the amount of assetswas combined with the landslide susceptibility index map.
Therefore, in order to evaluate the economic exposure atmunicipal level associated to the different susceptibility classes,the unit market values or unit construction costs have been takeninto account for each asset class. As far as residential and com-mercial buildings are concerned, the unit market value (Euros persquare meter) relative to 2010 was obtained from the Observatoryof Real Estate Market instituted by the National Territorial Agency.For each municipality, the maximum, minimum and mediumvalues were used. The minimum value has been assumed as unitconstruction costs (Euros per square meter) for the building sites.For industrial areas, hospitals, cemeteries, sports areas, landfillsand farms, the unit construction costs were calculated from fixedvalues for the entire region, defined in 1988 by the NationalTerritorial Agency. Subsequently, these values were updated, bycalculating the inflation rate using data of ISTAT (NationalInstitute of Statistics). Also, the unit agricultural values (Eurosper hectare) for the year 2008 were obtained from the NationalTerritorial Agency. For the three types of road, unit constructioncosts obtained from the Regional Price List of Apulia for 2010 wereused. Finally, the economic value of wind farms was evaluated. Thelocation of each wind generator was mapped from orthophotos forthe entire study area. As a result, a map with 460 wind mills wasobtained, of which about 240 were installed in the area between2007 and 2010. The economic value of a wind farm was based onthe following main parameters: investment costs, operating and
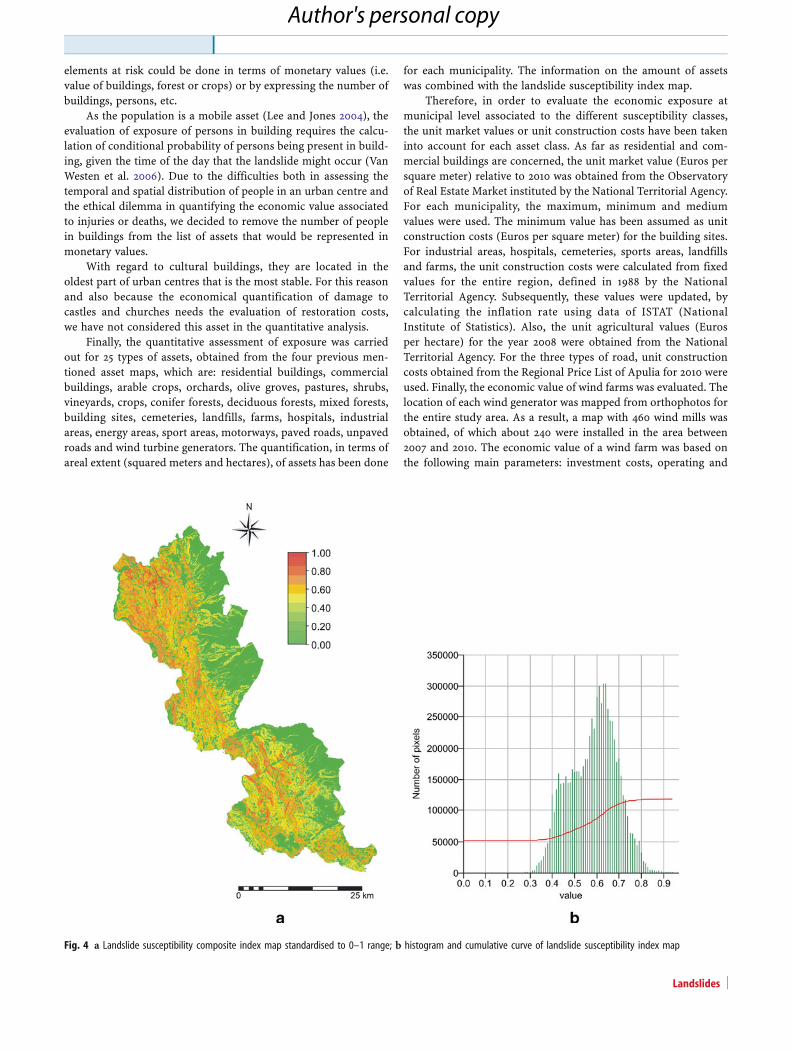
Fig. 4 a Landslide susceptibility composite index map standardised to 0–1 range; b histogram and cumulative curve of landslide susceptibility index map
Landslides
Author's personal copy
maintenance costs, annual production of energy and life of theturbine (Graniglia 2010). Considering these aspects, a total cost of1,200 € for kilowatts installed (Euros per kilowatt) was calculated.
After the definition of the monetary value of the 25 assetclasses for each municipality, a quantitative analysis of their
exposure has been carried out. Therefore, the exposed valuesassociated to each susceptibility class, at municipal level, werequantified by multiplying the number of the individual exposedassets (squared meters, hectares and number) with their uniteconomic value, for each susceptibility class.
Table 2 Summary statistics of the landslide susceptibility index map and the asset maps, with indication of their threshold values
Maps Summary statistics
Min Max Mean Median Predominant SD Threshold
Environmental factors 0.04 0.96 0.40 0.40 0.14 0.18
Triggering factors 0.62 0.96 0.80 0.82 0.88 0.09
Susceptibility 0.00 (0.28) 0.93 0.32 0.43 0.00 0.3
Physical indicators 0.01 0.75 0.01 0.01 0.01 0.04 0.04
Social indicators 0.00 1.00 0.00 0.00 0.00 0.05 0.13
Economic indicators 0.01 1.00 0.66 0.65 0.70 0.09 0.65
Environmental indicators 0.07 0.73 0.29 0.13 0.11 0.21 0.13
Weighted assets map 0.03 0.91 0.13 0.12 0.12 0.04
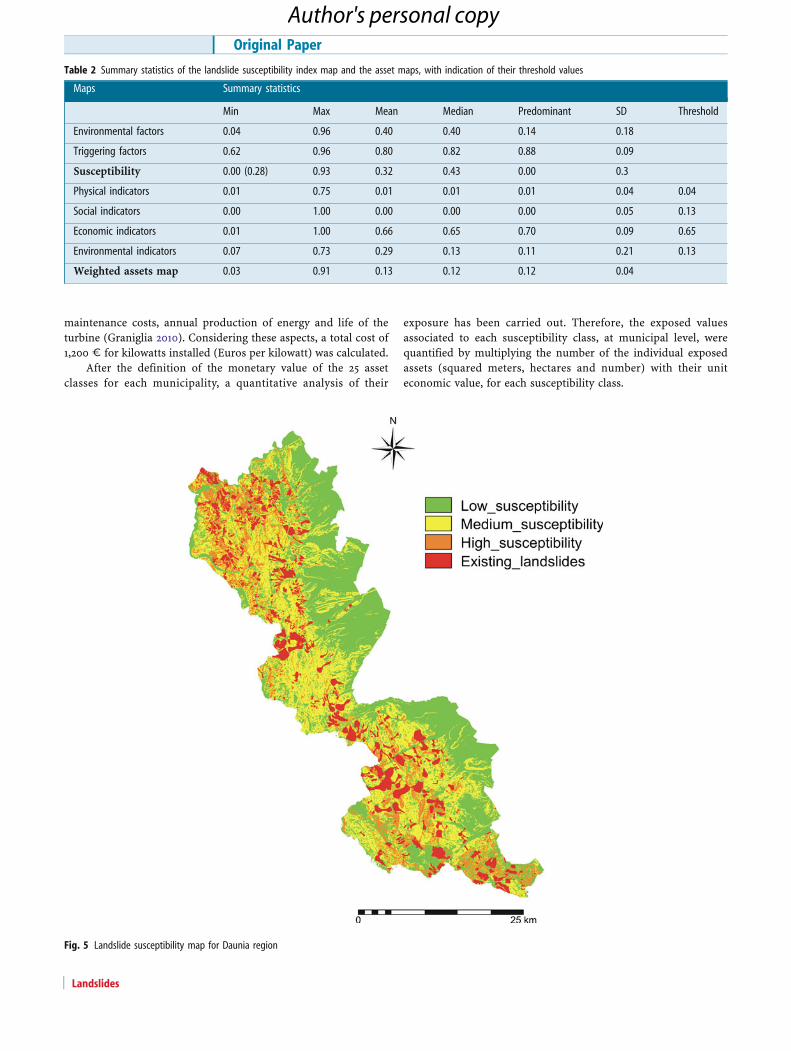
Fig. 5 Landslide susceptibility map for Daunia region
Original Paper
Landslides
Author's personal copy
ResultsThe susceptibility composite index map is presented in Fig. 4a.This map is characterised by a large number of pixels with zerovalues, which are 44.18 % of the total area of the composite indexmap. These pixels correspond to the before selected constraint
areas, i.e. flat areas and water bodies. The susceptibility indexvalues range between 0.00 (0.28 excluding the zeros) and 0.93 witha mean of 0.32 (see Table 2).
The cumulative curve shown in Fig. 4b represents the sum-mation of the number of pixels with a given susceptibility index
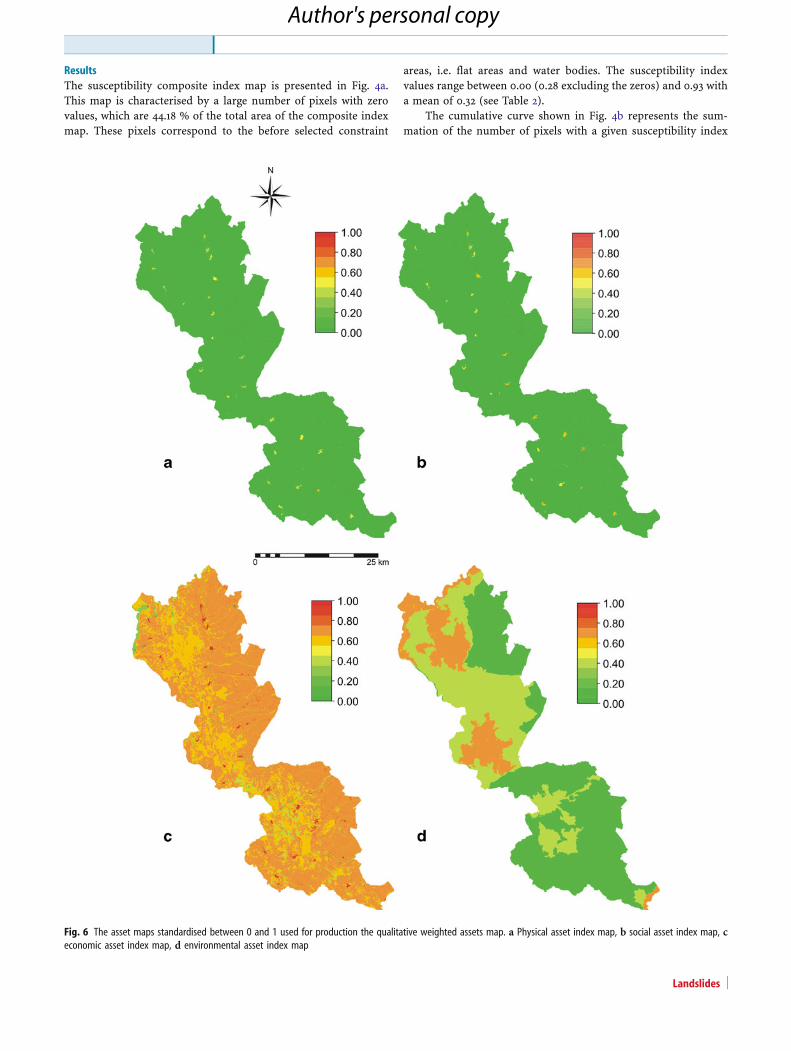
Fig. 6 The asset maps standardised between 0 and 1 used for production the qualitative weighted assets map. a Physical asset index map, b social asset index map, ceconomic asset index map, d environmental asset index map
Landslides
Author's personal copy
value, ranging between 0 and 1. In order to interpret the mapbetter, the susceptibility composite index map was subdivided intothree susceptibility classes: low susceptibility (for index valuessmaller than 0.35), medium susceptibility (for index values be-tween 0.35 and 0.65) and high susceptibility (for index valueslarger than 0.65). These threshold values were evaluated in aninteractive way, by considering different thresholds, deriving foreach one the areas belonging to susceptibility classes and compar-ing these with the known landslides.
In the landslide susceptibility index map, the highly suscepti-ble areas coincide with the most landslide-prone lithological units,such as landslide deposits, Red Flysch, clayey-marly facies of FaetoFlysch and San Bartolomeo Flysch, and with high values of slopeangle. In particular, two ranges of slope angle values characterisethe high susceptibility areas: values between 10° and 16°, relative tothe slopes with outcropping clayey and debris deposits, and valuesbetween 22° and 30°, corresponding to the slopes with flysch soils.
After splitting the landslide susceptibility index map intothree classes, by using the landslide inventory for defining the bestclass boundaries, the landslides contained in the inventory mapwere added, and a fourth susceptibility class was created, consist-ing of old and recent existing landslides, because in the study areathe reactivation of pre-existing landslides is very frequent.
Finally, the landslide susceptibility map (Fig. 5) shows thespatial distribution of the areas with different susceptibility levelfor the Daunia region. This map represents the basis for a moredetailed study on exposure, in qualitative and quantitative terms.
The asset maps show the spatial distribution and relative im-portance of physical, social, economic and environmental indicators(Fig. 6). The physical index values range between 0.01 and 0.75, witha mean, a median and a predominant value of 0.01 (Table 2). Thelarge number of pixels with 0.01 values is due to the multiplication ofthe intermediate maps of Built-up area, Cultural centers andTransportation, which present the highest values within the urbancentres and along the road network. The social index map is char-acterised by values ranging from 0 to 1 (Table 2).
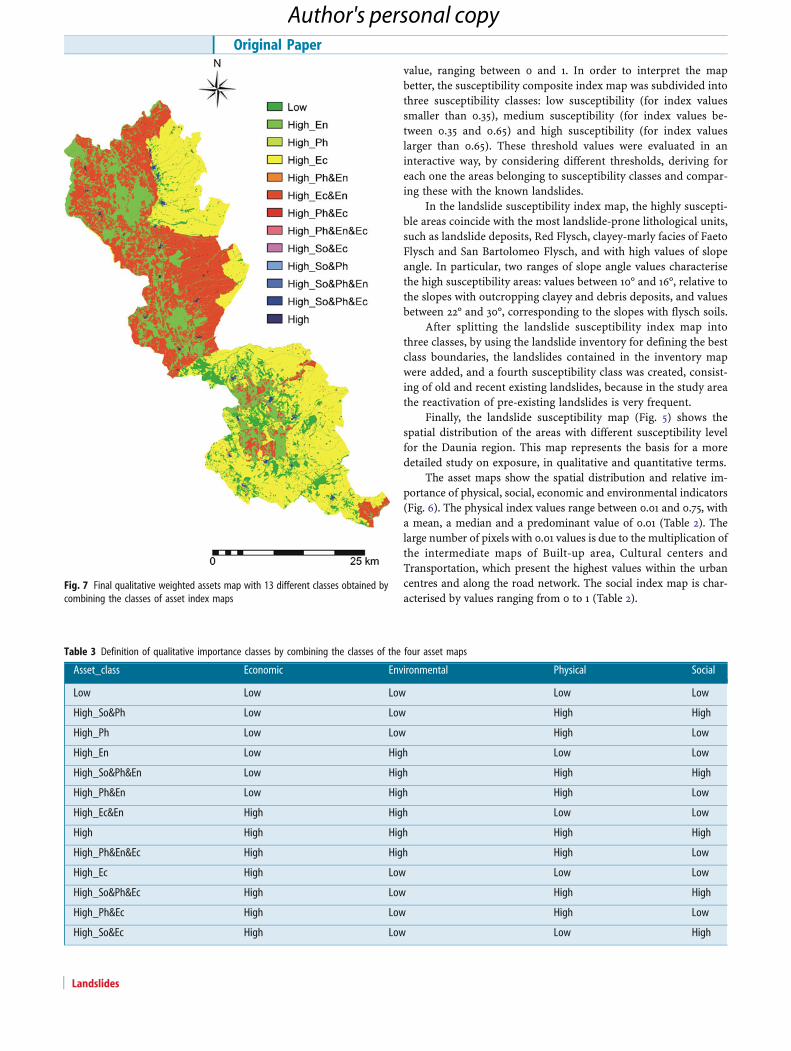
Fig. 7 Final qualitative weighted assets map with 13 different classes obtained bycombining the classes of asset index maps
Table 3 Definition of qualitative importance classes by combining the classes of the four asset maps
Asset_class Economic Environmental Physical Social
Low Low Low Low Low
High_So&Ph Low Low High High
High_Ph Low Low High Low
High_En Low High Low Low
High_So&Ph&En Low High High High
High_Ph&En Low High High Low
High_Ec&En High High Low Low
High High High High High
High_Ph&En&Ec High High High Low
High_Ec High Low Low Low
High_So&Ph&Ec High Low High High
High_Ph&Ec High Low High Low
High_So&Ec High Low Low High
Original Paper
Landslides
Author's personal copy
Initially, the four index maps were combined in a “criteria tree”,as intermediatemaps, in order to obtain, by using the SMCEmethod,a weighted assets map. All the maps were standardised between 0and 1 through the same method, i.e. the maximum linear method.For the weight assignation, the ranking method (expected value) wasused. Through this method, the relative ranking of the factors wasindicated, and the software has converted these in quantitativeweights; in this case, the weights were assigned considering the socialindex as the most important factor (0.52), followed by the physical(0.27), economic (0.15) and environmental (0.06) indices. The result-ing weighted index map is characterised by index values rangingbetween 0.03 and 0.91, with a mean of 0.13, a median of 0.12 and apredominant value of 0.12 (Table 2). The higher index values wereconcentrated in the urban centres. In order to avoid this problem,the qualitative analysis was carried out through a different proce-dure. The four index maps, after being computed separately, weresubdivided into two classes (low and high importance) according totheir histograms. The respective threshold values were evaluated inan interactive way (see Table 2). Subsequently, the reclassified assetmaps were overlain in order to obtain a unique map (Fig. 7). Thisfinal qualitative weighted assets map consists of 13 classes, whichrepresent the combinations of the eight classes of importance(Table 3).
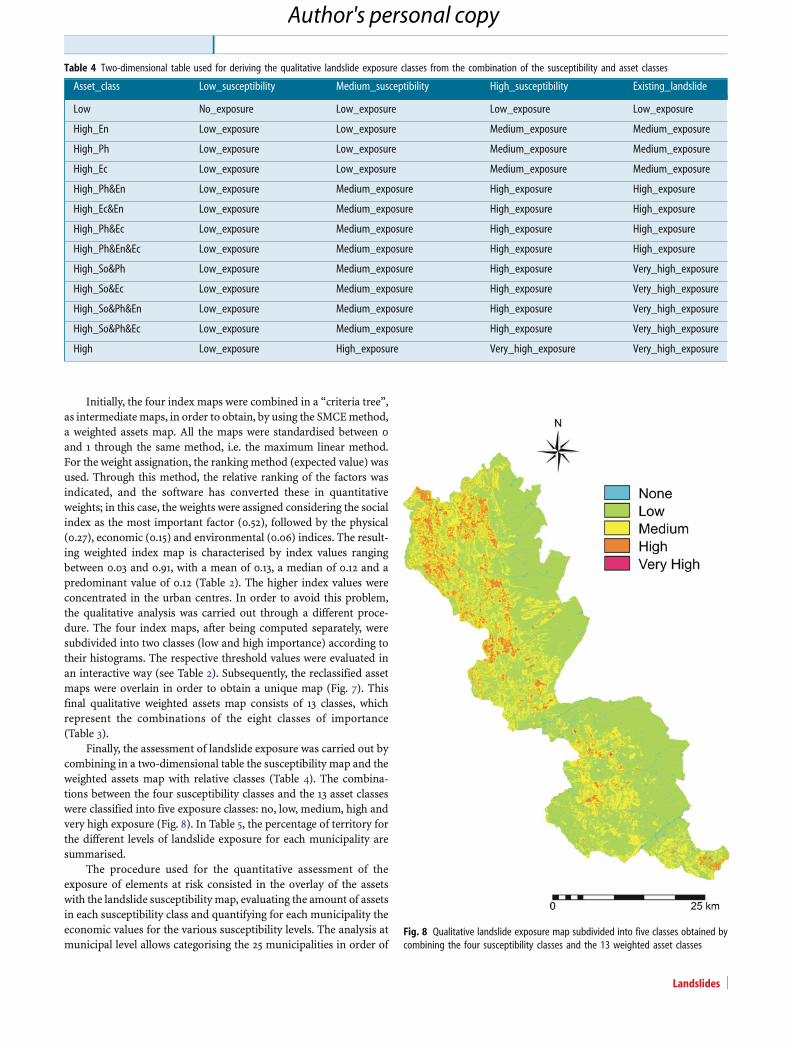
Finally, the assessment of landslide exposure was carried out bycombining in a two-dimensional table the susceptibility map and theweighted assets map with relative classes (Table 4). The combina-tions between the four susceptibility classes and the 13 asset classeswere classified into five exposure classes: no, low, medium, high andvery high exposure (Fig. 8). In Table 5, the percentage of territory forthe different levels of landslide exposure for each municipality aresummarised.
The procedure used for the quantitative assessment of theexposure of elements at risk consisted in the overlay of the assetswith the landslide susceptibility map, evaluating the amount of assetsin each susceptibility class and quantifying for each municipality theeconomic values for the various susceptibility levels. The analysis atmunicipal level allows categorising the 25 municipalities in order of
Table 4 Two-dimensional table used for deriving the qualitative landslide exposure classes from the combination of the susceptibility and asset classes
Asset_class Low_susceptibility Medium_susceptibility High_susceptibility Existing_landslide
Low No_exposure Low_exposure Low_exposure Low_exposure
High_En Low_exposure Low_exposure Medium_exposure Medium_exposure
High_Ph Low_exposure Low_exposure Medium_exposure Medium_exposure
High_Ec Low_exposure Low_exposure Medium_exposure Medium_exposure
High_Ph&En Low_exposure Medium_exposure High_exposure High_exposure
High_Ec&En Low_exposure Medium_exposure High_exposure High_exposure
High_Ph&Ec Low_exposure Medium_exposure High_exposure High_exposure
High_Ph&En&Ec Low_exposure Medium_exposure High_exposure High_exposure
High_So&Ph Low_exposure Medium_exposure High_exposure Very_high_exposure
High_So&Ec Low_exposure Medium_exposure High_exposure Very_high_exposure
High_So&Ph&En Low_exposure Medium_exposure High_exposure Very_high_exposure
High_So&Ph&Ec Low_exposure Medium_exposure High_exposure Very_high_exposure
High Low_exposure High_exposure Very_high_exposure Very_high_exposure
Fig. 8 Qualitative landslide exposure map subdivided into five classes obtained bycombining the four susceptibility classes and the 13 weighted asset classes
Landslides
Author's personal copy
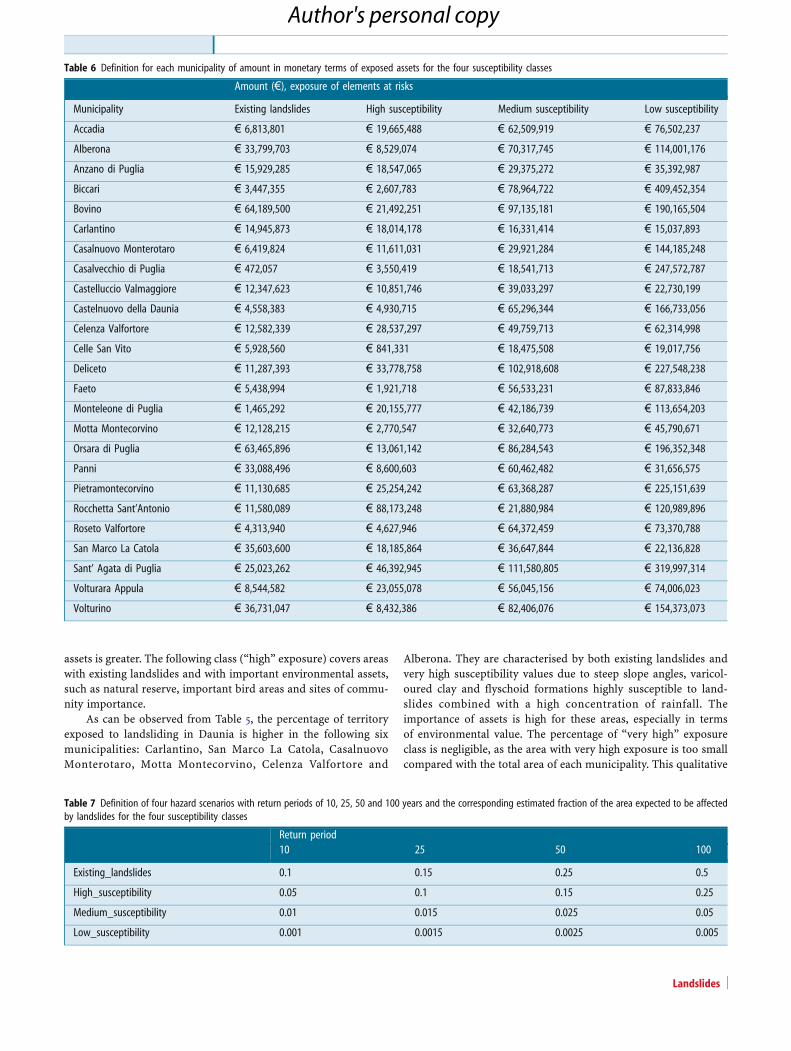
economic exposed values. Table 6 provides, for each municipality,the economic value of the assets exposed to different landslidesusceptibility classes.
As no information is available on the temporal and spatialprobability of landslide events, it is not possible to generate landsliderisk map based on historical information. In order to demonstratehow the exposure map could be used to obtain an estimation of theexpected losses, a number of assumptions were made. Four hazardscenarios were assumed with a return period of 10, 25, 50 and100 years, respectively. For each hazard scenario, the percentage ofarea, covered by the four susceptibility classes that will be affected bylandslides was estimated, on the basis of expert knowledge of theauthors on landslide mechanisms of the area (Table 7). The conse-quences of a specific hazard scenario were obtained by multiplyingthe exposed value of assets, shown in Table 6, by the spatial proba-bility of occurrence of landslides, indicated as the fraction of the areaof each susceptibility class likely to be affected. Note that we did notinclude an estimation of the vulnerability as we have no informationon the expected size-frequency distribution and considered V01.The sum of the consequence of the four hazard scenarios was
calculated. In Fig. 9, the risk curves of the 25 municipalities wereplotted, with the temporal probability against the total expectedlosses.
Finally, the total landslide risk in monetary terms was evaluatedfor each municipality by calculating the area under the curves(Table 8).
DiscussionThe analysis provides the spatial distribution of the exposure levelin the study area. The resulting exposure map (Fig. 8) and the two-dimensional table containing the exposure classes (Table 4) showthat the areas with low susceptibility level and low asset impor-tance are not exposed areas. A low susceptibility involves a lowexposure for all types of assets. The area with high exposure islocated, on the contrary, where the susceptibility is high, and theimportance of almost two types of elements at risk is high. A veryhigh exposure characterises areas where existing landslide arepresent, and the social importance of assets is high. The higherlevel of exposure (“very high” exposure class) is localised in urbanareas where the importance of social, physical and economical
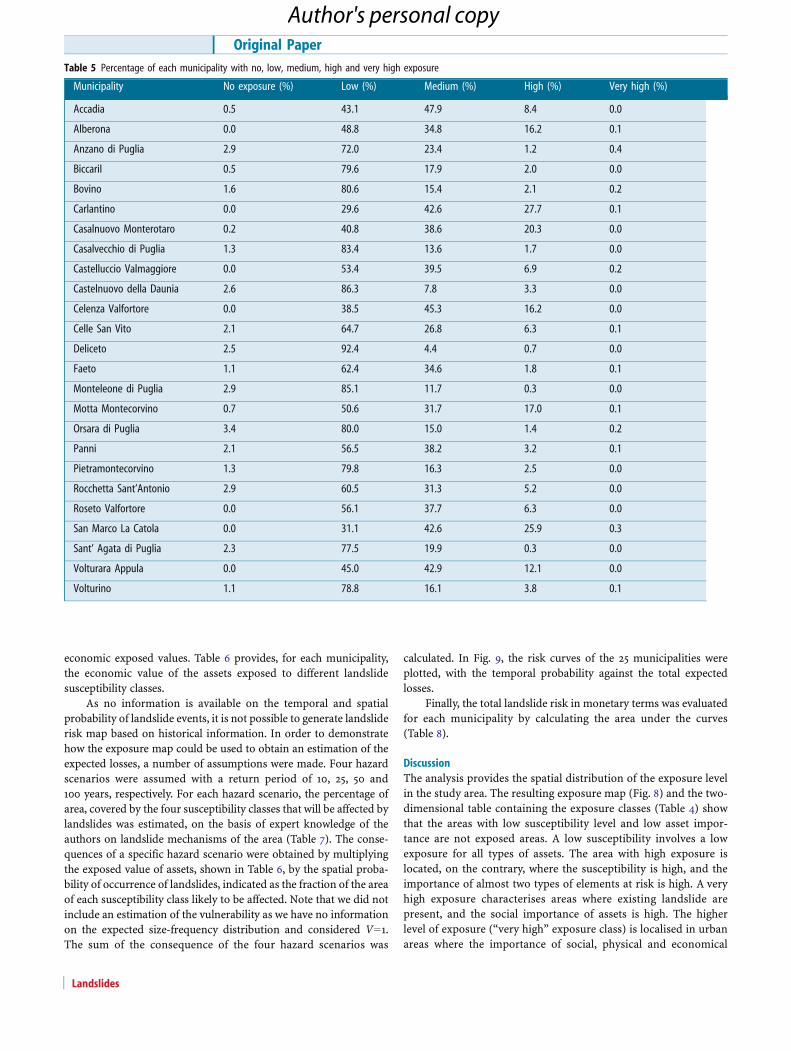
Table 5 Percentage of each municipality with no, low, medium, high and very high exposure
Municipality No exposure (%) Low (%) Medium (%) High (%) Very high (%)
Accadia 0.5 43.1 47.9 8.4 0.0
Alberona 0.0 48.8 34.8 16.2 0.1
Anzano di Puglia 2.9 72.0 23.4 1.2 0.4
BiccariI 0.5 79.6 17.9 2.0 0.0
Bovino 1.6 80.6 15.4 2.1 0.2
Carlantino 0.0 29.6 42.6 27.7 0.1
Casalnuovo Monterotaro 0.2 40.8 38.6 20.3 0.0
Casalvecchio di Puglia 1.3 83.4 13.6 1.7 0.0
Castelluccio Valmaggiore 0.0 53.4 39.5 6.9 0.2
Castelnuovo della Daunia 2.6 86.3 7.8 3.3 0.0
Celenza Valfortore 0.0 38.5 45.3 16.2 0.0
Celle San Vito 2.1 64.7 26.8 6.3 0.1
Deliceto 2.5 92.4 4.4 0.7 0.0
Faeto 1.1 62.4 34.6 1.8 0.1
Monteleone di Puglia 2.9 85.1 11.7 0.3 0.0
Motta Montecorvino 0.7 50.6 31.7 17.0 0.1
Orsara di Puglia 3.4 80.0 15.0 1.4 0.2
Panni 2.1 56.5 38.2 3.2 0.1
Pietramontecorvino 1.3 79.8 16.3 2.5 0.0
Rocchetta Sant’Antonio 2.9 60.5 31.3 5.2 0.0
Roseto Valfortore 0.0 56.1 37.7 6.3 0.0
San Marco La Catola 0.0 31.1 42.6 25.9 0.3
Sant’ Agata di Puglia 2.3 77.5 19.9 0.3 0.0
Volturara Appula 0.0 45.0 42.9 12.1 0.0
Volturino 1.1 78.8 16.1 3.8 0.1
Original Paper
Landslides
Author's personal copy
assets is greater. The following class (“high” exposure) covers areaswith existing landslides and with important environmental assets,such as natural reserve, important bird areas and sites of commu-nity importance.
As can be observed from Table 5, the percentage of territoryexposed to landsliding in Daunia is higher in the following sixmunicipalities: Carlantino, San Marco La Catola, CasalnuovoMonterotaro, Motta Montecorvino, Celenza Valfortore and
Alberona. They are characterised by both existing landslides andvery high susceptibility values due to steep slope angles, varicol-oured clay and flyschoid formations highly susceptible to land-slides combined with a high concentration of rainfall. Theimportance of assets is high for these areas, especially in termsof environmental value. The percentage of “very high” exposureclass is negligible, as the area with very high exposure is too smallcompared with the total area of each municipality. This qualitative
Table 6 Definition for each municipality of amount in monetary terms of exposed assets for the four susceptibility classes
Amount (€), exposure of elements at risks
Municipality Existing landslides High susceptibility Medium susceptibility Low susceptibility
Accadia € 6,813,801 € 19,665,488 € 62,509,919 € 76,502,237
Alberona € 33,799,703 € 8,529,074 € 70,317,745 € 114,001,176
Anzano di Puglia € 15,929,285 € 18,547,065 € 29,375,272 € 35,392,987
Biccari € 3,447,355 € 2,607,783 € 78,964,722 € 409,452,354
Bovino € 64,189,500 € 21,492,251 € 97,135,181 € 190,165,504
Carlantino € 14,945,873 € 18,014,178 € 16,331,414 € 15,037,893
Casalnuovo Monterotaro € 6,419,824 € 11,611,031 € 29,921,284 € 144,185,248
Casalvecchio di Puglia € 472,057 € 3,550,419 € 18,541,713 € 247,572,787
Castelluccio Valmaggiore € 12,347,623 € 10,851,746 € 39,033,297 € 22,730,199
Castelnuovo della Daunia € 4,558,383 € 4,930,715 € 65,296,344 € 166,733,056
Celenza Valfortore € 12,582,339 € 28,537,297 € 49,759,713 € 62,314,998
Celle San Vito € 5,928,560 € 841,331 € 18,475,508 € 19,017,756
Deliceto € 11,287,393 € 33,778,758 € 102,918,608 € 227,548,238
Faeto € 5,438,994 € 1,921,718 € 56,533,231 € 87,833,846
Monteleone di Puglia € 1,465,292 € 20,155,777 € 42,186,739 € 113,654,203
Motta Montecorvino € 12,128,215 € 2,770,547 € 32,640,773 € 45,790,671
Orsara di Puglia € 63,465,896 € 13,061,142 € 86,284,543 € 196,352,348
Panni € 33,088,496 € 8,600,603 € 60,462,482 € 31,656,575
Pietramontecorvino € 11,130,685 € 25,254,242 € 63,368,287 € 225,151,639
Rocchetta Sant’Antonio € 11,580,089 € 88,173,248 € 21,880,984 € 120,989,896
Roseto Valfortore € 4,313,940 € 4,627,946 € 64,372,459 € 73,370,788
San Marco La Catola € 35,603,600 € 18,185,864 € 36,647,844 € 22,136,828
Sant’ Agata di Puglia € 25,023,262 € 46,392,945 € 111,580,805 € 319,997,314
Volturara Appula € 8,544,582 € 23,055,078 € 56,045,156 € 74,006,023
Volturino € 36,731,047 € 8,432,386 € 82,406,076 € 154,373,073
Table 7 Definition of four hazard scenarios with return periods of 10, 25, 50 and 100 years and the corresponding estimated fraction of the area expected to be affectedby landslides for the four susceptibility classes
Return period10 25 50 100
Existing_landslides 0.1 0.15 0.25 0.5
High_susceptibility 0.05 0.1 0.15 0.25
Medium_susceptibility 0.01 0.015 0.025 0.05
Low_susceptibility 0.001 0.0015 0.0025 0.005
Landslides
Author's personal copy

procedure for evaluating the landslide exposure in Daunia doesnot intend to quantify the risk but to provide information for riskassessment, useful in a preliminary stage of regional planning orfor more detailed studies on the high-exposure areas.
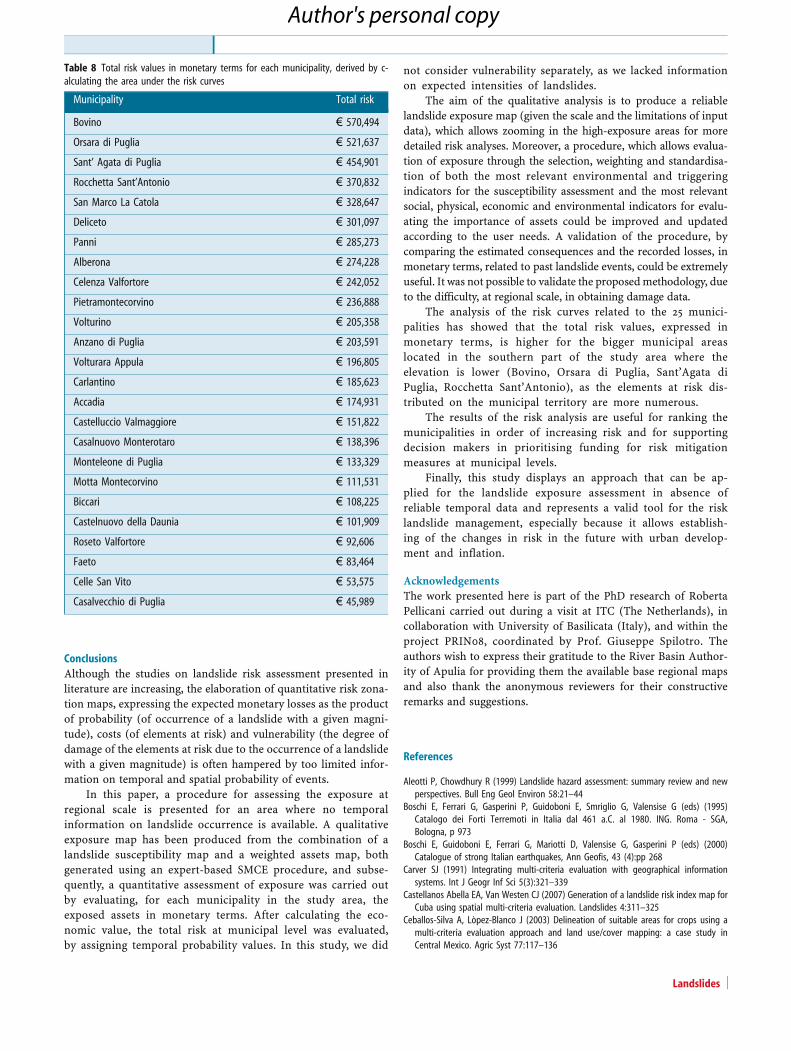
In order to perform a general estimation of the risk level inDaunia territory, an estimation of the temporal and spatial prob-abilities of landslides was made based on expert opinion. Thisconversion from exposure to risk is the most uncertain step inthe analysis, as unfortunately there is no database available withdates of landslide occurrence. This could be improved consider-ably if a multi-temporal landslide inventory would be carried out,using aerial photographs and satellite images from different dec-ades. Also, archive studies could be used to get a better idea on thehistory of landslide processes in the past. However, this is rathertime-consuming, and in Italy, there have been several projectsaiming for this (e.g. AVI project, IFFI project). Unfortunately, upto now, this has not resulted in a sufficiently large dataset oflandslides with known dates of occurrence. Therefore, the methodproposed in this study can be carried out in the absence of suchdata in order to quantify the exposure, which is a basic input inspatial planning and risk reduction planning. The landslide riskvalues, obtained, in monetary terms, as the integration of allspecific consequences over all probabilities, allowed the rankingof the municipalities in order of increasing landslide risk. InTable 8, it can be observed that the first six municipalities withhigher values of risk are: Bovino, Orsara di Puglia, Sant’Agata di
Puglia, Rocchetta Sant’Antonio, San Marco La Catola and Deliceto.They are all located, except San Marco La Catola, in the southernpart of Daunia. By comparing these results with those of thequalitative analysis of exposure, it can be noted that high valuesof risk (Table 8) correspond to low levels of exposure (Table 5).This is due to the fact that, in the qualitative analysis, the spatialdistribution of exposure is affected by the geometrical representa-tion (size) of elements at risk and susceptibility indicators.Although the social and physical assets have more importancethan the economic and environmental ones, their size is smaller,and consequently, they produce small areas with high exposurevalues. These areas compared with the whole municipal territorygenerate a low percentage of exposure. The results of quantitativeanalysis of landslide risk show that the higher risk values aredistributed in the southern municipalities, which are characterisedby lower altitude and, consequently, by a major distribution ofelements at risk on territory.
It is important to mention that, as the temporal probabilitiesof landslides were assumed, the landslide risk values are notabsolute, but relative and allow making of a significant the com-parison between the municipalities.
A method which allows quantifying of the landslide risk, evenwith limited hazard and vulnerability data, through the quantifi-cation of the expected losses, in monetary terms, allows also toestablish the changes of risk in future with urban development andinflation.
Fig. 9 Risk curves calculated for the 25 municipalities of Daunia region
Original Paper
Landslides
Author's personal copy
ConclusionsAlthough the studies on landslide risk assessment presented inliterature are increasing, the elaboration of quantitative risk zona-tion maps, expressing the expected monetary losses as the productof probability (of occurrence of a landslide with a given magni-tude), costs (of elements at risk) and vulnerability (the degree ofdamage of the elements at risk due to the occurrence of a landslidewith a given magnitude) is often hampered by too limited infor-mation on temporal and spatial probability of events.
In this paper, a procedure for assessing the exposure atregional scale is presented for an area where no temporalinformation on landslide occurrence is available. A qualitativeexposure map has been produced from the combination of alandslide susceptibility map and a weighted assets map, bothgenerated using an expert-based SMCE procedure, and subse-quently, a quantitative assessment of exposure was carried outby evaluating, for each municipality in the study area, theexposed assets in monetary terms. After calculating the eco-nomic value, the total risk at municipal level was evaluated,by assigning temporal probability values. In this study, we did
not consider vulnerability separately, as we lacked informationon expected intensities of landslides.
The aim of the qualitative analysis is to produce a reliablelandslide exposure map (given the scale and the limitations of inputdata), which allows zooming in the high-exposure areas for moredetailed risk analyses. Moreover, a procedure, which allows evalua-tion of exposure through the selection, weighting and standardisa-tion of both the most relevant environmental and triggeringindicators for the susceptibility assessment and the most relevantsocial, physical, economic and environmental indicators for evalu-ating the importance of assets could be improved and updatedaccording to the user needs. A validation of the procedure, bycomparing the estimated consequences and the recorded losses, inmonetary terms, related to past landslide events, could be extremelyuseful. It was not possible to validate the proposedmethodology, dueto the difficulty, at regional scale, in obtaining damage data.
The analysis of the risk curves related to the 25 munici-palities has showed that the total risk values, expressed inmonetary terms, is higher for the bigger municipal areaslocated in the southern part of the study area where theelevation is lower (Bovino, Orsara di Puglia, Sant’Agata diPuglia, Rocchetta Sant’Antonio), as the elements at risk dis-tributed on the municipal territory are more numerous.
The results of the risk analysis are useful for ranking themunicipalities in order of increasing risk and for supportingdecision makers in prioritising funding for risk mitigationmeasures at municipal levels.
Finally, this study displays an approach that can be ap-plied for the landslide exposure assessment in absence ofreliable temporal data and represents a valid tool for the risklandslide management, especially because it allows establish-ing of the changes in risk in the future with urban develop-ment and inflation.
AcknowledgementsThe work presented here is part of the PhD research of RobertaPellicani carried out during a visit at ITC (The Netherlands), incollaboration with University of Basilicata (Italy), and within theproject PRIN08, coordinated by Prof. Giuseppe Spilotro. Theauthors wish to express their gratitude to the River Basin Author-ity of Apulia for providing them the available base regional mapsand also thank the anonymous reviewers for their constructiveremarks and suggestions.
References
Aleotti P, Chowdhury R (1999) Landslide hazard assessment: summary review and newperspectives. Bull Eng Geol Environ 58:21–44
Boschi E, Ferrari G, Gasperini P, Guidoboni E, Smriglio G, Valensise G (eds) (1995)Catalogo dei Forti Terremoti in Italia dal 461 a.C. al 1980. ING. Roma - SGA,Bologna, p 973
Boschi E, Guidoboni E, Ferrari G, Mariotti D, Valensise G, Gasperini P (eds) (2000)Catalogue of strong Italian earthquakes, Ann Geofis, 43 (4):pp 268
Carver SJ (1991) Integrating multi-criteria evaluation with geographical informationsystems. Int J Geogr Inf Sci 5(3):321–339
Castellanos Abella EA, Van Westen CJ (2007) Generation of a landslide risk index map forCuba using spatial multi-criteria evaluation. Landslides 4:311–325
Ceballos-Silva A, Lòpez-Blanco J (2003) Delineation of suitable areas for crops using amulti-criteria evaluation approach and land use/cover mapping: a case study inCentral Mexico. Agric Syst 77:117–136
Table 8 Total risk values in monetary terms for each municipality, derived by c-alculating the area under the risk curves
Municipality Total risk
Bovino € 570,494
Orsara di Puglia € 521,637
Sant’ Agata di Puglia € 454,901
Rocchetta Sant’Antonio € 370,832
San Marco La Catola € 328,647
Deliceto € 301,097
Panni € 285,273
Alberona € 274,228
Celenza Valfortore € 242,052
Pietramontecorvino € 236,888
Volturino € 205,358
Anzano di Puglia € 203,591
Volturara Appula € 196,805
Carlantino € 185,623
Accadia € 174,931
Castelluccio Valmaggiore € 151,822
Casalnuovo Monterotaro € 138,396
Monteleone di Puglia € 133,329
Motta Montecorvino € 111,531
Biccari € 108,225
Castelnuovo della Daunia € 101,909
Roseto Valfortore € 92,606
Faeto € 83,464
Celle San Vito € 53,575
Casalvecchio di Puglia € 45,989
Landslides
Author's personal copy
Corominas J, Moya J (2008) A review of assessing landslide frequency for hazard zoningpurposes. Eng Geol 102:193–213
Cotecchia V (1963) I dissesti franosi del Subappennino Dauno con riguardo alle stradeprovinciali. La Capitanata, vol.1, n. 5–6, Foggia
Cotecchia F, Vitone C, Cafaro F, Santaloia F (2006) The mechanical behaviour of intenselyfissured high plasticità clays from Daunia. Proceedings of the Second InternationalWorkshop on Characterization and Engineering properties of Natural Soils, InvitedLecture, Singapore, 3, 1975–2003
Crosta GB, Frattini P, Fugazza F, Caluzzi L, Chen H (2005) Cost–benefit analysis for debrisavalanche risk management. In: Hungr O, Fell R, Couture R, Eberhart E (eds) Landsliderisk management. Balkema, Rotterdam, pp 517–524
Cruden DM, Varnes DJ (1996) Landslides types and processes. In: Turner AK, Schuster RL(eds) Landslides: investigation and mitigation, Transportation Research Board SpecialReport 247. National Academy Press, WA, pp 36–75
Dai FC, Lee CF, Ngai YY (2002) Landslide risk assessment and management: an overview.Eng Geol 64:65–87
Dazzaro L, Di Nocera S, Pescatore T, Rapisardi L, Romeo M, Russo B, Senatore MR, TorreM (1988) Geologia del margine della catena appenninica tra il Fiume Fortore ed ilTorrente Calaggio (Monti della Daunia-Appennino meridionale). Mem Soc Geol It41:411–422
Dazzaro L, Rapisardi L (1996) Schema geologico del margine appenninico tra il fiumeFortore e il fiume Ofanto. Mem Soc Geol Ital 51:143–147
Fell R, Corominas J, Bonnard C, Cascini L, Leroi E, Savage WZ (2008) Guidelines forlandslide susceptibility, hazard and risk zoning for land use planning. Eng Geol102:85–98
Fuchs S, Heiss K, Hόbl J (2007) Towards an empirical vulnerability function for use indebris flow risk assessment. Nat Hazards Earth Syst Sci 7:495–506
Galli M, Guzzetti F (2007) Landslide vulnerability criteria: a case study from Umbria,Central Italy. Environ Manag 40:649–664
Glade T (2001) Landslide hazard assessment and historical landslide data—an insepa-rable couple? In: Glade T, Albini P, Frances F (eds) The use of historical data in naturalhazards assessment (advances in natural and technological hazard research). KluwerAcademic Publications, Dordrecht, The Netherlands, pp 153–168
Glade T (2003) Vulnerability assessment in landslide risk analysis. Die Erde 134:121–138Glade T, Anderson M, Crozier MJ (2005) Landslide hazard and risk. Wiley, New York, p 802Gorsevski PV, Jankowski P (2010) An optimized solution of multi-criteria evaluation
analysis of landslide susceptibility using fuzzy sets and Kalman filter. Comput Geosci36:1005–1020
Graniglia N (2010) Impianti eolici: progettazione, criteri di inserimento ambientale evalutazione economica. Grafill, pp378
Greene R, Luther JE, Devillers R, Eddy B (2010) An approach to GIS-based multiple criteriadecision analysis that integrates exploration and evaluation phases: case study in aforest-dominated landscape. For Ecol Manag 260:2102–2114
Guzzetti F, Cardinali M, Reichenbach P (1994) The Avi project: a bibliographical andarchive inventory of landslide and flood in Italy”. Environ Manag 18(4):623–633
Guzzetti F, Carrara A, Cardinali M, Reichenbach P (1999) Landslide hazard evaluation: areview of current techniques and their application in a multi-scale study, Central Italy.Geomorphology 31:181–216
Guzzetti F, Reichenbach P, Ardizzone F, Cardinali M, Galli M (2006) Estimating the qualityof landslide susceptibility models. Geomorphology 81:166–184
Hossain MS, Chowdhury SR, Das NG, Rahaman MM (2007) Multi-criteria evaluationapproach to GIS-based and suitability classification for tilapia farming inBangladesh. Aquacult Int 15:425–443
Ibsen M, Brunsden D (1996) The nature, use and problems of historical archives for thetemporal occurrence of landslides, with specific reference to the south coast ofBritain, Ventnor, Isle of Wight. Geomorphology 15:241–258
INGV (2004) Mappa di pericolosità sismica del territorio nazionale. MilanoITC (2001) ILWIS 3.0 Academic–user’s guide. ITC, Enschede, p 520Jaiswal P, van Westen CJ, Jetten V (2010) Quantitative landslide hazard assessment along
a transportation corridor in southern India. Eng Geol 116(3–4):236–250Lang A, Moya J, Corominas J, Schrott L, Dikau R (1999) Classic and new dating methods
for assessing the temporal occurrence of mass movements. Geomorphology 30:33–52Lee EM, Jones DKC (2004) Landslide risk assessment. Thomas Telford, London, p 454Malczewski J (1996) A GIS-based approach to multiple criteria group decision-making. Int
J Geogr Inf Sci 10(8):955–971Masure P, Lutoff C (2008) Urban system exposure to natural disasters: an integrated
approach. System analysis and risk, part III, chapter 11:239–260Masure P, Lutoff C (2008) Urban system exposure to natural disasters: an integrated
approach. System analysis and risk, part III, chapter 11:239–260OSFI (1998) Guideline: earthquake exposure sound practices. Ottawa, Canada, 22
Patacca E, Scandone P (2007) Geology of the Southern Apennines. Boll Soc Geol It SpecIssue 7:75–119
Pennetta L (2006) Rapporto sulle frane in Italia—Analisi del dissesto da frana in Puglia.Progetto IFFI 21:547–576
Phua MH, Minowa M (2005) A GIS-based multi-criteria decision making approach toforest conservation planning at a landscape scale—a case study in the Kinabalu Area,Sabah, Malaysia. Landsc Urban Plan 71:207–222
POR PUGLIA (2009) Sistema informativo delle aree soggette a fenomeni di instabilitànella Regione Puglia e individuazione sperimentale di alcune aree campione a rischiodi instabilità. AdB Puglia, Bari
Puglisi S, Spilotro G, Trisorio Liuzzi G (2005) La frana di Carlantino nel subappenninoDauno e i criteri per la sua sistemazione. AIIA, Conv: L’Ingegneria Agraria per losviluppo sostenibile dell’area Mediterranea, Catania, giugno 2005
Quan R, Liu M, Zhang L, Lu M, Wang J, Niu H, Xu S (2011) Exposure assessment ofrainstorm waterlogging on buildings in central urban area of Shanghai based onscenario simulation. Scientia Geographica Sinca, vol. 31, no. 2
Remondo J, Bonachea J, Cendrero A (2005) A statistical approach to landslide riskmodelling at basin scale: from landslide susceptibility to quantitative risk assessment.Landslides 2:321–328
Saaty TL (1980) The analytic hierarchy process: planning, priority setting, resourceallocation. McGraw-Hill, New York, p 287
Sassa K., Fukuoka H., Wang F., Wang G. (2005). Risk analysis and sustainable disastermanagement. Landslides, XXX, 386 p
Sharifi MA, Retsios V (2003) Site selection for waste disposal through spatial multiplecriteria decision analysis. III International Conference on Decision Support forTelecommunications and Information Society, 4–6 September 2003, Warsaw, Poland
Spilotro G, Fidelibus C, Lenti V (1992) In: Bell DH (ed) A model for evaluating progressivefailure in earth slopes. Proc. of 6th Int. Symp. on Landslides, Christchurch (N.Z.), Feb.1992. Balkema, Rotterdam, pp 565–571
Spilotro G, Coviello L, Trizzigno R (2000) Post failure behaviour of landslide bodies. VIIIInt. Symp on Landslides, Cardiff, June 2000
Svoray T, Bar P, Bannet T (2005) Urban land-use allocation in a Mediterranean ecotone:habitat heterogeneity model incorporated in a GIS using a multi-criteria mechanism.Landsc Urban Plan 72:337–351
UNPD (2004) Reducing disaster risk. A challenge for development. A global report. UNPD,New York, p161
UNDP (2011) Multi hazard risk assessment in the Rankhine state of Myanmar. Part II:Exposure analysis & risk profile. Pp 48
Uzielli M, Nadim F, Lacasse S, Kaynia AM (2008) A conceptual frame work for quanti-tative estimation of physical vulnerability to landslides. Eng Geol 102:251–256
Van Westen CJ, Van Asch TWJ, Soeters R (2006) Landslide hazard and risk zonation—why is it still so difficult? Bull Eng Geol Environ 65:167–184
Van Westen CJ, Castellanos E, Kuriakose SL (2008) Spatial data for landslide susceptibil-ity, hazard, and vulnerability assessment: an overview. Eng Geol 102:112–131
Van Westen CJ, Quan Luna B, Vargas Franco RD [et al ] (2010) Development of trainingmaterials on the use of geo-information for multi-hazard risk assessment in amountainous environment. In: Mountain risks: bringing science to society:Proceedings of the Mountain Risks International Conference, Firenze, Italy, 24–26November 2010/ed. by J.-P. Malet, T. Glade and N. Casagli. Strasbourg: CERG, 2010.pp 469–475
Varnes DJ (1984) Landslide hazard zonation: a review of principles and practice. UnitedNations International, Paris
Yoshimatsu H, Abe S (2006) A review of landslide hazards in Japan and assessment oftheir susceptibility using an analytical hierarchic process (AHP) method. Landslides3:149–158
Zezza F, Merenda L, Bruno G, Crescenzi E, Iovine G (1994) Condizioni di rischio da frananei comuni dell’Appennino Dauno. Geol Appl Idrogeol 29:77–141
R. Pellicani ()) : G. SpilotroDepartment of Structures, Geotechnics and Engineering Geology,University of Basilicata,Potenza, Italye-mail: [email protected]
C. J. Van WestenDepartment of Earth System Analysis, Faculty of Geo-Information Science and EarthObservation (ITC),University of Twente,Enschede, The Netherlands
Original Paper
Landslides
Author's personal copy