Topographic uncertainty quantification for flow-like landslide ...

1 23
Environmental Earth Sciences ISSN 1866-6280 Environ Earth SciDOI 10.1007/s12665-012-2181-2
Landslide temporal analysis andsusceptibility assessment as bases forlandslide mitigation, Machu Picchu, Peru
Jan Klimeš

1 23
Your article is protected by copyright and
all rights are held exclusively by Springer-
Verlag Berlin Heidelberg. This e-offprint is
for personal use only and shall not be self-
archived in electronic repositories. If you
wish to self-archive your work, please use the
accepted author’s version for posting to your
own website or your institution’s repository.
You may further deposit the accepted author’s
version on a funder’s repository at a funder’s
request, provided it is not made publicly
available until 12 months after publication.
ORIGINAL ARTICLE
Landslide temporal analysis and susceptibility assessmentas bases for landslide mitigation, Machu Picchu, Peru
Jan Klimes
Received: 7 August 2012 / Accepted: 3 December 2012
� Springer-Verlag Berlin Heidelberg 2012
Abstract Multi-temporal landslide occurrence informa-
tion acquired through aerial photo interpretation and field
mapping was used to assess occurrence frequencies on the
slopes around the UNESCO cultural world heritage site of
Machu Picchu, Peru. This showed that the coarse time res-
olution of the historical landslide information may lead to
inaccurate interpretations regarding landslide occurrence
frequencies in some parts of the study area. In addition, the
assumption that the past landslide frequency can be used to
describe the future landslide occurrence was not proved in
the study area. Thereafter, unique conditional analyses were
undertaken to assess landslide susceptibility using a limited
number of preparatory factor maps. It showed that large
majority of the Inca City is located on least susceptible areas
within the region. The results of the susceptibility assess-
ment combined with landslide occurrence frequencies may
serve as a basis for the landslide hazard mitigation in the
studied area. For these purposes, pixel-based susceptibility
maps were generalized into expert-defined landslide man-
agement units. These units provide site managers with easily
understandable and applicable hence reliable information
about future landslide occurrences. An approach describing
usage of the resulting susceptibility maps for onsite miti-
gation purposes was described with respect to the needs of
Machu Picchu site managers.
Keywords Landslide inventory � Landslide frequency �Susceptibility map � Conditional analysis � Machu Picchu �Peru
Introduction
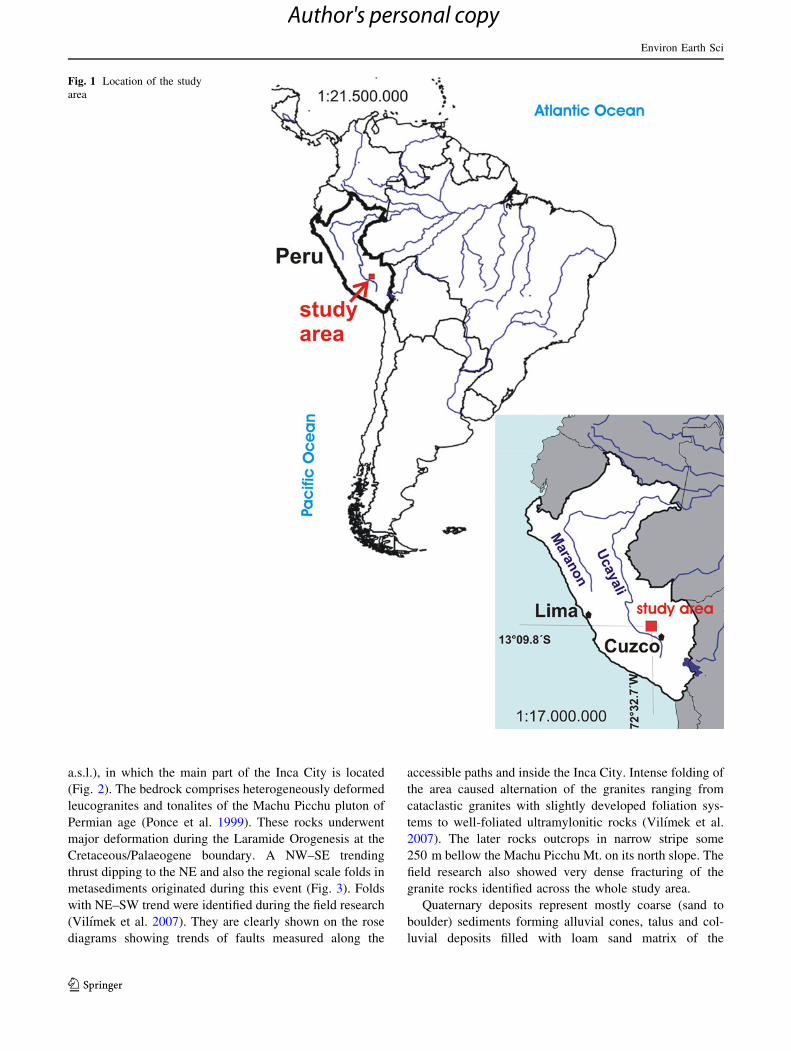
The UNESCO cultural world heritage site of Machu Picchu
is the most famous historic tourist attraction in Peru
(Fig. 1). It is considered an important national, cultural,
and political symbol. The site is also an important local
and national centre of economic activities. Therefore, it
receives great attention from local and central govern-
mental agencies which are managing not only the archeo-
logical site itself, but also the surrounding natural protected
area and all related tourist facilities.
Different types of landslides frequently occur on the
slopes surrounding the archeological site (Carreno and
Bonnard 1997; Sassa et al. 2000). These mainly cause
damage to access road and tourist paths avoiding the
archeological site itself. Despite the large number of sci-
entific works dealing with landslide phenomena at the Inca
City (e.g. Canuti et al. 2005; Casagli et al. 2005, Sassa
et al. 2005), so far no attempt has been made to evaluate
spatial and temporal landslide occurrence frequencies and
susceptibility zonation maps to support landslide hazard
mitigation of the valuable archeological site.
This work aims to assess the landslide susceptibility of
slopes surrounding Machu Picchu using historical landslide
inventory covering last 46 years. Attention is paid to
evaluate the applicability of its results for practical land-
slide management purposes.
The study area
The area under consideration is limited by the Urubamba
River, which meanders around the Machu Picchu (3,051 m
a.s.l.) and Huayna Picchu (2,700 m a.s.l.) Mts. These
mountains are connected by a narrow saddle (2,450 m
J. Klimes (&)
IRSM CAS, p.r.i., V Holesovickach 41,
Prague 8 18209, Czech Republic
e-mail: [email protected]
123
Environ Earth Sci
DOI 10.1007/s12665-012-2181-2
Author's personal copy
a.s.l.), in which the main part of the Inca City is located
(Fig. 2). The bedrock comprises heterogeneously deformed
leucogranites and tonalites of the Machu Picchu pluton of
Permian age (Ponce et al. 1999). These rocks underwent
major deformation during the Laramide Orogenesis at the
Cretaceous/Palaeogene boundary. A NW–SE trending
thrust dipping to the NE and also the regional scale folds in
metasediments originated during this event (Fig. 3). Folds
with NE–SW trend were identified during the field research
(Vilımek et al. 2007). They are clearly shown on the rose
diagrams showing trends of faults measured along the
accessible paths and inside the Inca City. Intense folding of
the area caused alternation of the granites ranging from
cataclastic granites with slightly developed foliation sys-
tems to well-foliated ultramylonitic rocks (Vilımek et al.
2007). The later rocks outcrops in narrow stripe some
250 m bellow the Machu Picchu Mt. on its north slope. The
field research also showed very dense fracturing of the
granite rocks identified across the whole study area.
Quaternary deposits represent mostly coarse (sand to
boulder) sediments forming alluvial cones, talus and col-
luvial deposits filled with loam sand matrix of the
Fig. 1 Location of the study
area
Environ Earth Sci
123
Author's personal copy

Fig. 2 Study site divided into
the landslide management units
named according local usage
Fig. 3 Overview geological
map prepared according to
Carlotto et al. (1999). Machu
Picchu citadel is indicated with
yellow letters IC—Inca City,
black lines are folds, blue linesare rivers
Environ Earth Sci
123
Author's personal copy
weathered rocks with usually up to 0.2 m of top soil.
Slopes often expose fractured bed rock. More gentle slopes
are covered by deeply weathered elluvium with a thin layer
of top soil.
The climate in the vicinity of Machu Picchu is warm and
humid. The mean annual precipitation is 1,950 mm, whilst
the mean annual temperature varies between 12 and 15 �C
(Wright et al. 1997). Rainfall is most abundant from Jan-
uary to March with an average precipitation of
300 mm month-1 during this period. It is least abundant
from May to July with an average precipitation of only
40 mm month-1 during this period. The monthly air tem-
peratures range from a minimum of 6.8 �C to a maximum
of 23.4 �C (Wright et al. 2000). The mountain ranges
surrounding Machu Picchu are covered by forest, even on
high-altitude and steep slopes. The forest is subject to both
natural and human induced fires that result in a complex
pattern of vegetation cover. The forest fires are one of the
natural hazards possibly affecting the Inca City. Agricul-
tural activity is very limited within the study area and is
confined to the narrow valley floor. The seismic activity in
the vicinity of Machu Picchu is low. The nearest earth-
quake epicenter recorded during the last 30 years was
located 50 km away with magnitude of 4.9 mbGS
(6.3.1980, 19:17 local time, 13.44�S, 72.62�W, USGS
Earthquake Catalogue).
The first report of landslide activity near the archeo-
logical site describes four events that occurred between
December 1995 and January 1996 (Carreno et al. 1996).
Two rock slides affected the only access road to the site
that is located on the front slope. Carreno and Bonnard
(1997) considered that these landslides provided evidence
for the present-day activity of a much larger deep-seated
landslide. The estimated volume of this supposed landslide
was calculated to be 6 9 106 m3. Sassa et al. (2000)
defined several large rock slides on this slope and later
(Sassa et al. 2005) suggested semi circular shearing plane
for the deep-seated landslide which starts and divides the
archeological site in place of the Main Square (Fig. 2). The
authors think that possible future activity of such landslide
may be dangerous for the archeological site. In contrast,
other researchers have argued that there are no evidences of
dangerous slope movements that could possibly affect the
Inca City (McEvan and Wright, 2001). Debris flow activity
assessment on slopes surrounding the site was performed
by Casagli et al. (2005) focusing on the use of satellite data
for their mapping. All the identified features were rather
shallow landslides. A detailed geomorphological map of
the Front Slope shows different landslide types with dif-
ferent activity (Canuti et al. 2005). Only stabilized or
dormant slides were identified to border the archeological
site on the Front Slope area (Fig. 2). The authors also
suggest possible sagging which may affect the historical
site of Machu Picchu. Its areal extend roughly corresponds
with precursory landslide stage as described by Sassa et al.
(2005). Nevertheless, GPS and interferometric synthetic
aperture radar measurements of the area show no signifi-
cant down slope displacements during 1 year of observa-
tion (Canuti et al. 2005). In addition, no evidence of deeper
slope movements within the Inca City was detected by
dilatometric and extensometric measurements (Vilımek
et al. 2007).
Methods
Landslide inventory mapping
An historical landslide inventory map (Malamud et al.
2004) has been prepared from remote imagery and field
surveys. The interrogated remote imagery comprises aerial
photography from 1963, 1991, and 2000, GoogleEarth
images from 2004, and QuickBird images from 2002 and
2006. Field surveys were conducted in 2003, 2004, 2005,
2006, 2008, and 2009. Field mapping was confined to
accessible paths surrounding the archeological site and,
thus, the whole area has not been mapped in equal detail. In
addition, archive photographs from 1949 and 1960
(Museum of Southeastern Moravia, Zlın, Czech Republic)
of Machu Picchu were used to identify historical land-
slides. Homogeneity of the landslide historical inventory
map is affected by merging the results of field investiga-
tions and the interpretation of remotely sensed data. To
evaluate the effects of inhomogeneity of the data, two time
intervals of the historical landslide inventory maps are used
for landslide frequency assessment. The first map covers
the period from 1963 to 2000 and the second map covers
the period from 2001 to 2009. A single historical landslide
inventory map (1963–2009) has been used for suscepti-
bility analysis.
The following landslide types have been distinguished:
debris flows, rock slides, debris slides, and rock falls
(Cruden and Varnes 1996). Debris flows are usually char-
acterized by channelized flows that mainly comprise
angular blocks of fractured bedrock with a minor portion of
fine-grained sediments. They have high damaging potential
due to their high velocities. Rock slides mainly occur along
major fractures in bedrock exposed on the slope surface.
Slides mainly mobilize colluvial deposits and soil, and
have predominantly planar shear planes. Rock falls may be
represented by single boulder falls or events that move
large volumes of rock. In the majority of cases, falling
material is deposited on the upper parts of the talus slopes
or, in some cases, even the valley floor. Scarp areas were
identified during the photo interpretation and field work.
Landslide activity was defined based on the appearance of
Environ Earth Sci
123
Author's personal copy
the mapped features. Freshly looking (seen usually in
bright light colors on the aerial photos), un-vegetated
landslides were defined as ‘‘active’’. Landslides partly
covered by vegetation or the features in more dark colors
were defined as temporarily inactive and such definitions
are largely subjective and do not respect the suggested
classification criteria (Cruden and Varnes 1996), thus the
landslide activity information was not used during the
landslide inventory analysis. Shear plane depth was not
used to further refine landslide types as no significant
variations were found during the field mapping and it is
very difficult to determine from remotely sensed imagery.
Very small features, less than 30 m, have not been included
in the landslide inventory map.
Geomorphological mapping
A geomorphological map was compiled based on the
interpretation of black and white aerial photography and
the results of previous field mapping (Vilımek et al. 2007).
The geomorphic classes were defined to characterize
homogenous units with similar slope stability characteris-
tics. Their definitions have been based on the landform
types and forming material.
Block fields are formed by individual rock blocks with a
diameter of C2 m placed chaotically over each other. In
the majority of the block fields, caves have been described
(Proyecto Ukhupacha 2003). Saddles are flat or slightly
dipping narrow in section, in the mountain ridges. They are
conditioned by the regional faults and their crossing. Flu-
vial sediments represent flat lying material transported by
rivers. Talus deposits have an inclined surface and occur at
the toe of a slope. They comprised boulders with varying
dimensions and degrees of angularity. Colluvial slopes
were divided according their dip, with a break value of 40�defined based on the field observations. Cliffs are bare rock
surfaces with a slope angle of greater than 50�. Gullies
formed in rock or colluvial material are not distinguished.
They were mapped in the field and verified through aerial
photo interpretation.
Slopes in the study area were further divided according
to the main process responsible for their formation. Three
genetic slope types were distinguished. Erosional slopes
are those affected by the recent erosion of streams. Struc-
tural slopes are mainly controlled by the tectonic and
structural setting (e.g. the presence of faults or well
developed fissure plains). Denudational slopes constitute
all other slopes within the study area. They represent slopes
previously eroded by the river network, without clear tec-
tonic or structural controls, which have been reshaped by
different types of geomorphic processes (e.g. sheet erosion,
slope movements).
Landslide susceptibility assessment
Statistical methods use information from known landslides
to evaluate the importance of preparatory factors for their
future occurrence at the same time (Carrara et al. 1995).
Regardless of the applied statistical method, all use infor-
mation about landslide density on selected preparatory
factor variables as weights for the modeling process
(Clerici et al. 2002, Suzen and Doyuran 2004, Van Den
Eeckhaut et al. 2006, Yilmaz et al. 2012). Thus, the spatial
accuracy and completeness of the used landslide invento-
ries directly affects modeling results.
Only a limited number of preparatory factors that affect
the spatial distribution of landslides are available and can be
mapped with equal detail for the whole study area. These
include slope dip and aspect information, geomorphological
units and a map of genetic slope types. The landslide sus-
ceptibility was assessed by conditional analysis (Clerici
et al. 2002), which calculates the probability of landslide
occurrence (P) on each unique conditional units, which
helps explain conditions of the landslide occurrence. In this
case, 25 m2 pixels were used as the mapping unit. Only
scarp areas extracted from the available landslide inventory
were used for the susceptibility analysis. When combining
the available input factor maps resulted in 1,444 unique
conditional units for which the landslide density was cal-
culated (Table 1). The resulting probability of landslide
occurrence was reclassified into three susceptibility classes:
stable, conditionally stable, and unstable. Intervals of pre-
dictive variables defining each susceptibility class were
determined subjectively so the unstable class is capable of
capturing maximum landslide scarps on minimum study
area. This susceptibility classification scheme was com-
pared with classes defined using the mean value of P as a
pivot point to which standard deviation is added or sub-
tracted (Suzen and Doyuran 2004). Then, the debris flows,
rock slides and rock falls were extracted from the historical
landslide inventory and separate susceptibility maps were
prepared for each of the landslide types.
Pixel-based susceptibility maps are very convenient for
data handling and analyses, but finding the correct location
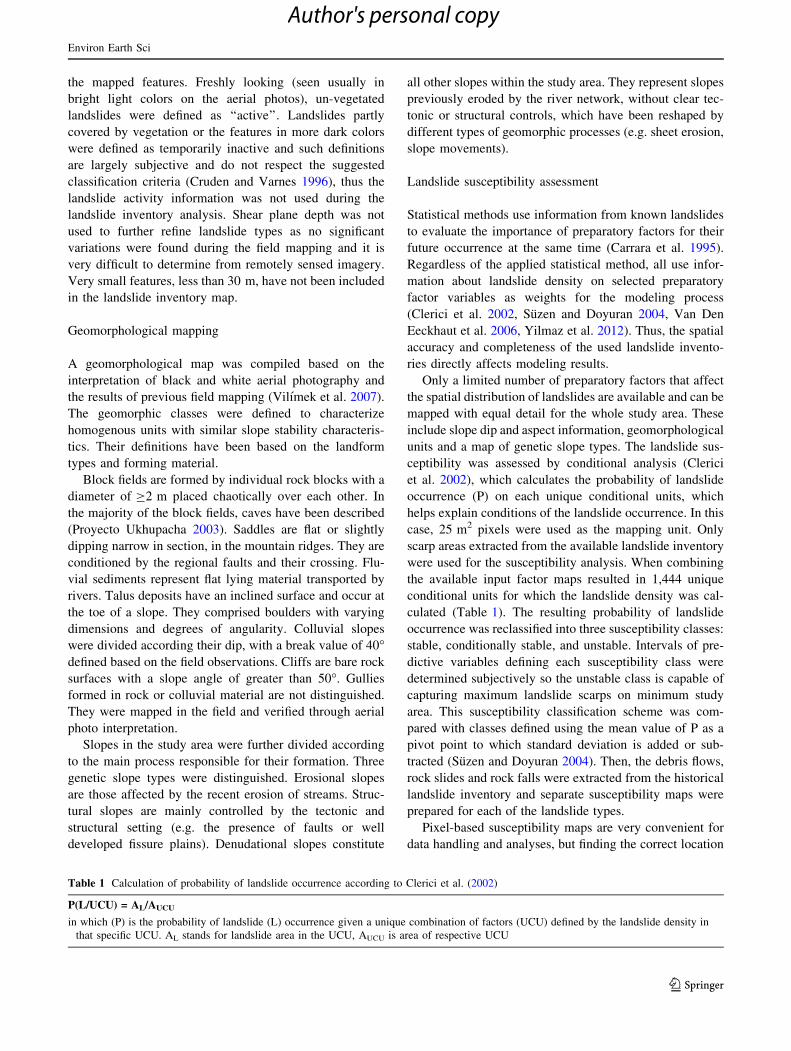
Table 1 Calculation of probability of landslide occurrence according to Clerici et al. (2002)
P(L/UCU) = AL/AUCU
in which (P) is the probability of landslide (L) occurrence given a unique combination of factors (UCU) defined by the landslide density in
that specific UCU. AL stands for landslide area in the UCU, AUCU is area of respective UCU
Environ Earth Sci
123
Author's personal copy

of the susceptibility zones defined by pixels is very difficult
in the rugged terrain of the study area. Therefore, so-called
landslide management units (Fig. 2) were defined based on
the expert knowledge of the local topography, lithology,
and structural settings, including identified and assumed
faults. These management units define zones on which
degree of susceptibility can be easily identified in the field
by the site managers and (ii) these units are thought to be
quasi-homogenous with respect to the environmental fac-
tors affecting landslide occurrence, type, and magnitude so
similar landslide mitigation techniques may be applied in
each of the zones. The management units were ranked
according to the percentage of respective unit covered by
the unstable susceptibility class identified during the sus-
ceptibility analyses. Rank number 3 (unstable) was
assigned to those landslide management units in which
more than 10 % of the area was associated with the
unstable susceptibility class. Rank number 2 (conditionally
stable) was assigned to that landslide management units in
which between 6 and 10 % of the area were associated with
the unstable susceptibility class. Rank number 1 (stable)
was assigned to those landslide management units in which
less than 6 % of the area was associated with the unstable
susceptibility class.
Landslide frequency assessment
Landslide persistency (Cardinali et al. 1999) and average
landslide occurrence frequencies in each mapping unit and
for each landslide type were calculated as ratio of number
of identified landslides and time span of the historical
landslide inventory (Guzzetti 2005; Corominas and Moya
2008). Two time periods, 1963–2000 and 2001–2009, were
evaluated separately because of the different methods of
inventory mapping.
Results
Geomorphological map
Gullies evolved on rock slopes along prominent structural
or lithological boundaries (e.g. fractures, different rock
type units) and have almost vertical sides built by base rock
and their width does not exceed 20 m. It contrasts with
gullies developing on colluvial slopes which have usually
wide and shallow forms and are often more than 5-m wide.
In the most cases, there is no permanent stream flowing
through the gullies although during the rainy season they
conduct large amounts of water. Several permanent fissure
springs are also found within them. The results of the
previous field investigation suggested that gullies are
closely related with the landslide occurrence since they
often act as source areas and transport channel for debris
flows. Nevertheless, ascertained landslide densities within
the gullies unit reach less than half of the value for the cliff
unit.
Two double ridges have been identified within the study
area. The first crosses the Inca City in NW–SE direction. It
probably developed due to the local structural setting
which was responsible for the development of an elongated
depression up to 4 m deep and subsequently filled with soil
and sub-soil material by the builders of the city (Mucho
Mamani et al. 2005). The second crosses the Sun Gate
saddle and continues along the top of the ridge to the
southwest. This runs parallel with a mapped fault. Due to
the very steep surrounding slopes and highly disintegrated
rocks inside the extension trench (up to 3 m wide), it is
assumed that creep movement may occur here. No mea-
surement data are available to confirm this assumption.
Accumulation forms are largely constrained to the val-
ley bottom and are represented by fluvial sediments (e.g.
flood plain sediments and river terraces), talus deposits,
and ancient rock slide accumulations. Talus deposits have
the highest landslide density of all the geomorphological
units. Slope sediments vary greatly in their thickness and
character even though the parent material is quasi-
homogenous. They vary from slightly weathered and
intensively fractured base rock outcropping at the surface
with only a thin soil layer formed primarily by organic rests
to well developed elluvium or colluvium formed by well
sorted loamy sandy matrix with small, auxiliary, or slightly
rounded and weathered granitic boulders (around 0.3 m).
Such colluvium was found on less steep slopes and flat
parts of the saddles and ridges. Their ascertained depth is
1.2 m. The most abundant slope sediment type contains
large, less weathered boulders (with diameter of around
0.7 m) covering the slope surface with a minor portion of
loamy sandy matrix.
Based on the geomorphological mapping, it is consid-
ered that the geomorphological map provides a useful
proxy for the main lithological conditions within the study
area. In general, the morphological features result from the
interaction of formative processes (e.g. erosion and
weathering, seismicity, and gravity) and the properties of
the bedrock. Specifically, some classes on the presented
map are directly defined as superficial deposits with dif-
ferent characteristics (e.g. talus, block fields, slopes with
colluvium) and these define landslide occurrence condi-
tions. In addition, the genetic slope types may also be used
as a lithological proxy. In particular, structural slopes
represent lithologically distinct areas that have been jux-
taposed by tectonic movements, as described in Vilımek
et al. (2007).
Environ Earth Sci
123
Author's personal copy

Landslide inventory mapping
Within the study area, 59 landslides with an area greater
than 0.001 km2 have been mapped since 1963 (Table 2)
from which 29 landslides have been recorded since 2000.
From the total landslide number, 53 % were mapped as
active and 47 % as temporarily inactive landslides.
Debris flows and rock slides/debris flows are closely
related to concave surface topography. Both most com-
monly develop in gullies, due to high water saturation of
the material during rain events. Rock slides/debris flows
commence with sliding in a well-developed depletion zone.
They then transform into channelized flow due to the high
water content of the material. Rock slides/debris flows are
considerably larger than debris flows. The latter do not
usually have morphologically well-developed source areas.
Rock slides have often shear planes in the highly fractured
bedrock that outcrops near or at the surface. In contrast,
slides mobilize only weathered colluvium. Rock fall
occurrence is closely related to the steep Back Slope
(Fig. 2). This area is highly fractured and steepened by
deeply incised river erosion (Fig. 4).
More than 60 % of all the mapped landslides develop in
fractured rocks, whereas only 27 % (slides and debris
flows) incorporate a considerable amount of highly
weathered colluvium. In terms of average area, the largest
types of landslides are rock fall, whereas the smallest types
are slides. The average slope dip for each type of landslide
is quite similar, varying from 41� to 47�. The maximum
and minimum slope angles are very similar for debris
flows, rock slides, and rock slide/debris flow. Each of these
landslide types, start on very steep slopes and extend down
to the flat valley floor thereby proving their high mobility.
In contrast, slides show the smallest range of slope angle,
suggesting that their accumulation areas do not extend very
far and rest on the slopes. This is also evident for rock falls,
which have highest maximum (85�) and lowest minimum
slope dip (21�).
Evaluating landslide persistence by comparing different
time steps of the historical landslide inventory map reveals
that almost 59 % (34) of the mapped landslides occurred at
the same location or within 20 m of previously mapped
events. Therefore, most of these cases represent reactiva-
tion of dormant landslides. There are two sites, where the
historical landslide inventory map shows repeat landslide
activity. The first occurs on the cliff above the historic Inca
Table 2 Basic statistics of the historical landslide inventory 1963–2009 (X—value close to 0)
Number Total
area
(km2)
Landslide coverage
of the are under
study
Average
area
(km2)
Min.
area
(km2)
Max.
area
(km2)
Average
frequencies
1963–2009
Average
slope dip
(�)
Min.
slope
dip (�)
Max.
slope dip
(�)
(%)
Debris
flow
12 0.367 0.4 0.031 0.001 0.095 0.2 46 4 78
Rock slide 22 0.766 0.9 0.035 0.002 0.194 0.5 47 5 77
Slide 4 0.079 0.1 0.020 0.003 0.060 X 41 16 49
Rock fall 12 2.375 2.7 0.198 0.002 1.406 0.2 46 21 85
Rock
slide/
debris
flow
9 0.809 0.9 0.090 0.010 0.263 0.2 43 4 75
Total 59 4.40 5
Fig. 4 Geomorphological map (a) and map of genetic slope types
(b): 1—fluvial sediments, 2—talus deposits including ancient rock
slide accumulations, 3—colluvial slopes with dip less than 40�, 4—
colluvial slopes with dip more than 40�, 5—rock slopes (rock slope
bare or with less than 1 m of weathering mantle), 6—cliffs, 7—
gullies, 8—prominent ridge lines, 9—double ridges, 10—block fields,
11—prominent peaks, 12—saddle, 13—fissure springs, 14—Inca
Citadel, 15—Urubamba River; a—erosional slopes, b—denudational
slopes, c—structural slopes, d—valley floor
Environ Earth Sci
123
Author's personal copy

Bridge on the Back Slope (Fig. 5a), where rock falls have
been detected in all years except 2000 and 2006. The
second occurs on the colluvial slope located on the north-
eastern flank of Huayna Picchu (Fig. 5b), which exhibited
activity has been recorded every year except 2008. This
area is also characterized by less dense vegetation cover.
Several other sites show reactivation after longer periods of
time. For example, fresh debris flow accumulations on the
Front Slope (Fig. 5c) are visible in the archive photograph
from 1949 with a new event in March 2006; thus, it reac-
tivated after 55 years. The site on the southeastern slope of
Machu Picchu Mt. (Fig. 5d) produced debris flows in 1963,
2000, and 2004. The latter damaged an important trail for
tourist access to the ruins of Machu Picchu. There are six
further sites where landslide activity has occurred twice
during the time span covered by the historical landslide
inventory map.
When evaluating landslide persistence as the percentage
of the landslide area identical with the preceding landslide
distribution (Guzzetti 2005), highly variable results were
obtained (Table 3). Years with similar number of land-
slides (1991 and 2004) give similar results for all the
mapped landslide types.
Landslide distribution on unique conditional units
The most susceptible UCU (with L [ 0.1) for debris flows
are associated with slopes that dip more than 60�, slopes
orientated north or northeast, cliffs or gullies, and denu-
dational slope types. When considering all UCU in which
there are debris flow scarp areas, 23 % of the total occurs
in gullies and 11 % on cliffs. However, 58 % of the totals
are associated with colluvial slopes equally distributed
among the two classes. Debris flows occur most frequently
(43 %) on slopes with dip 40�–50�, while 29 % occur on
slopes with dip greater than 60�. Of the UCU, 69 % are
defined by denudational slopes and the remainder by
structural slopes.
The most susceptible UCU for rock slide scarp areas are
associated with slopes that dip between 50� and 60�, slopes
orientated east, gullies, and denudational slope types. 21 %
of the total UCU with landslides occur in gullies whilst
72 % are associated with colluvial slopes. 99 % are con-
fined to the denudational slopes. No single slope orienta-
tion prevails and this preparatory factor is clearly highly
variable.
The most susceptible UCU for rock falls are markedly
different from those of the other landslide types as they
show the clear domination of just one class from each
factor map. 77 % of rock fall source areas are associated
with slopes that dip more than 60� and 58 % of the slopes
are orientated south, southeast or north, northwest; 75 %
are defined by cliffs and 79 % are defined by structural
slopes.
Landslide frequency
Inca Bridge landslide management unit provides an
example of how the method of landslide inventory map-
ping affects the ascertained landslide frequencies. High
increase of the landslide occurrence (Table 4) is caused by
field mapping. It allows identification of events, which are
otherwise masked on the aerial or satellite images by pre-
vious rock falls. The Sun Gate and Huayna Picchu land-
slide management units maintain similar recurrence
frequencies through whole time period evaluated.
The precise date of landslide origin or reactivation is
known in only two cases. The month of their occurrence is
known in six further cases. If we combine these data with
recorded debris flows in the wider vicinity of the study area
Fig. 5 The historical landslide
inventory maps (in the legend—
C city, R river, contour lines
have 50 m interval, capital
letters on a map are referred in
the text)
Environ Earth Sci
123
Author's personal copy

(Vilımek et al. 2006), it is seen that all landslides are
constrained within the rainy season with peak occurrence
in the months of February and March. Only one landslide
was reported to occur in May.
Landslide susceptibility assessment
The prepared susceptibility model explained well the spa-
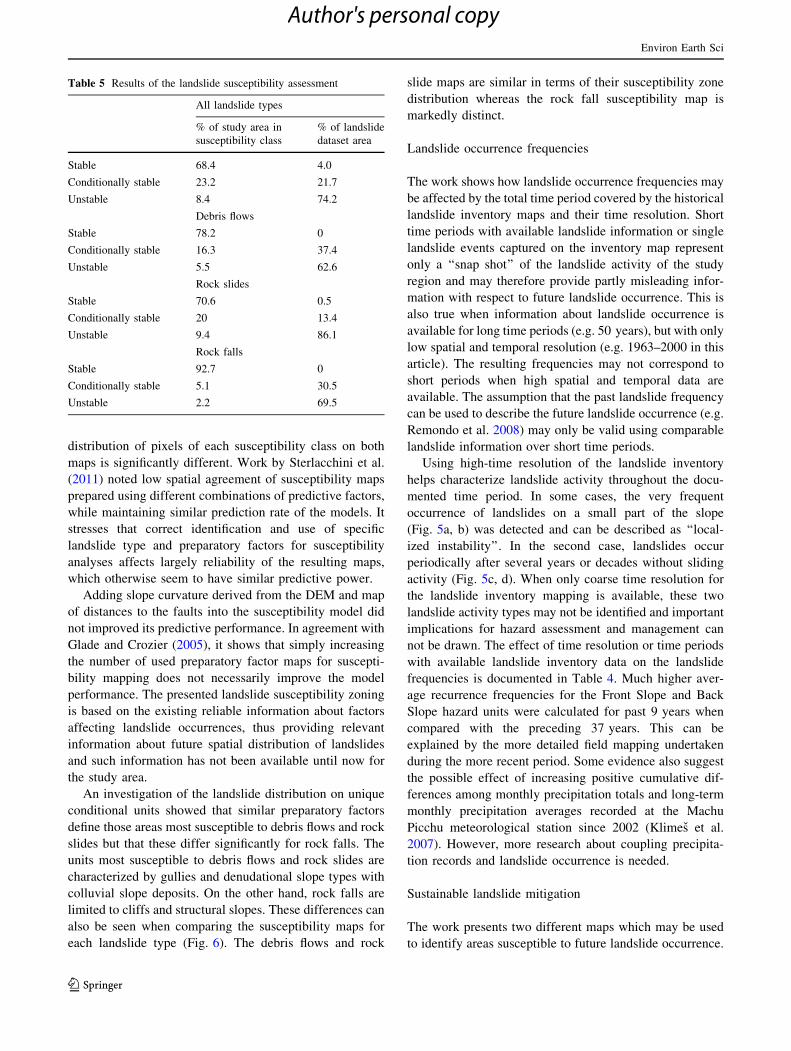
tial distribution of modeled landslides (Table 5). The
models were able to correctly depict from 69.5 % up to
86.1 % of the landslides. Incorrect model prediction,
defined by pixels of landslide dataset contained within the
stable susceptibility class, is only 4 % for the combined
landslide types model and 0 % for the debris flows and
rock fall models. The model performance did not improve
when the susceptibility classes were defined by standard
deviation of the P values.
The landslide susceptibility maps prepared through
unique conditional analyses are shown in Fig. 6. In all
cases, the majority of the Inca City belongs to the stable
class. The only area which exhibits landslide susceptibility
is on the south part of the agricultural sector and west rim
of the City. All together conditionally stable and unstable
susceptibility classes cover 12.7 % in the case of the all
landslides and 23 % for the debris flows susceptibility
maps of the Inca City.
It is evident that the spatial distribution of unstable
classes is quite different depending on whether the map
considers all landslide types together or specific landslide
types. For example, a comparison of the susceptibility maps
for all landslide types and debris flows shows that only 6
and 9 % of the unstable susceptibility class have common
spatial location. The largest spatial agreement was achieved
for stable classes, where 87 %, respectively, 76 % of the
class overlay. Common location of conditionally unstable
class share 32 % of pixels for the all landslide types and
45 % of the debris flows susceptibility maps.
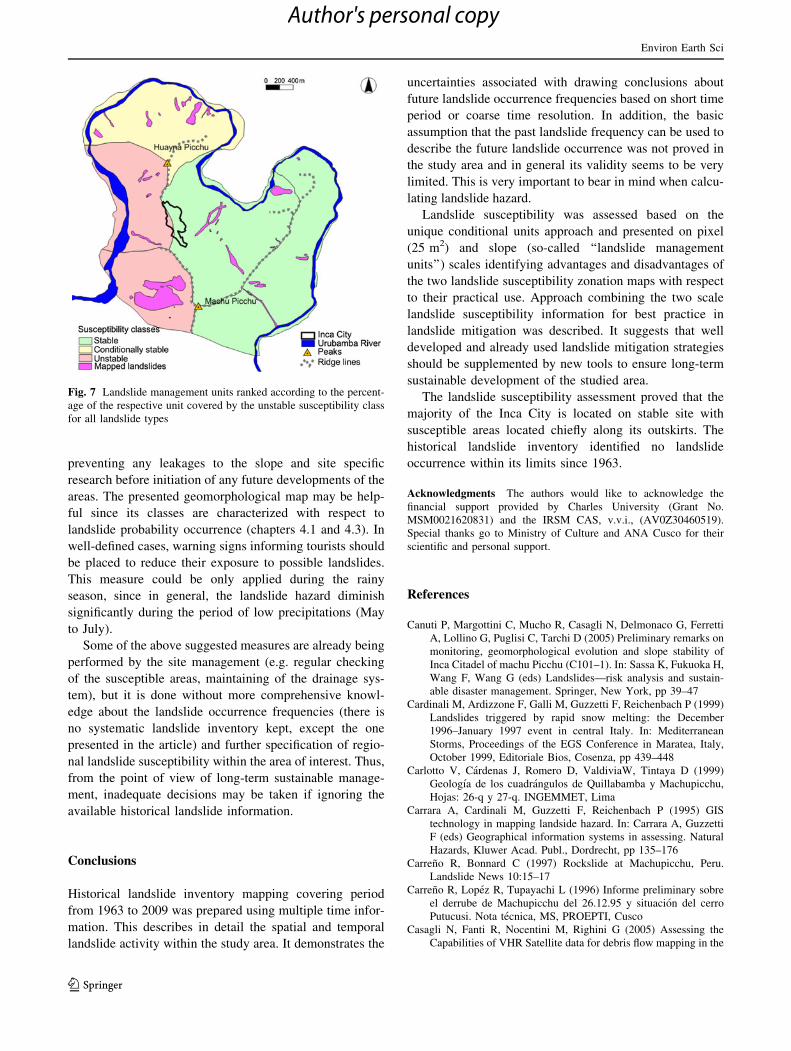
Uncertainties related with the susceptibility assessment
performed in a large detail for each pixel, is used as an
argument to portray the results of susceptibility zoning on
larger mapping units, in this case called landslide man-
agement units (Fig. 2). Considerable details about suscep-
tibility information are lost with this transformation, thus
preventing possible overestimation of available suscepti-
bility information when used in management praxis. Gen-
eralized landslide susceptibility map is combined with
landslide inventory (Fig. 7) resulting into complex though
easy to understand information about future landslide
occurrence. It is quite easy to identify each susceptibility
class in the field as compared to the pixel-based suscepti-
bility maps.
Discussion
Landslide susceptibility
Landslide susceptibility assessment proved small propen-
sity of the Inca City to future landslide occurrence. It
reflects good site selection as well as considerable engi-
neering and construction works done by Incas, which lar-
gely affected the natural conditions of the site, mainly
slope angle and drainage. Landslide susceptibility maps
prepared separately for debris flows and rock falls show
similar distribution of the landslide data among the sus-
ceptibility classes (Table 4). Nevertheless, the spatial
Table 3 Landslide persistence
(X—no occurrence of specific
landslide type)
1991 (%) 2000 (%) 2002 (%) 2004 (%) 2006 (%) 2008 (%)
Debris flows 0 0 72 8 32 X
Rock slide 8 0 X 0 X X
Slide 0 X X 0 X X
Rock falls 65 X 2 23 X 79
Rock slide/debris flows X X X 73 0 X
All types 37 14 5 38 28 79
Table 4 Average landslide
frequency for each landslide
management unit (X—close to
zero)
Spatial units Average frequency
1963–2000
Average frequency
2001–2009
Average frequency
1963–2009
Sun gate 0.2 0.1 0.2
Front slope 0.1 0.9 0.2
Huayna Picchu 0.3 0.5 0.4
Back Slope X 0.7 0.2
Inca Bridge X 0.5 0.1
Study area 0.6 2.7 1.1
Environ Earth Sci
123
Author's personal copy
distribution of pixels of each susceptibility class on both
maps is significantly different. Work by Sterlacchini et al.
(2011) noted low spatial agreement of susceptibility maps
prepared using different combinations of predictive factors,
while maintaining similar prediction rate of the models. It
stresses that correct identification and use of specific
landslide type and preparatory factors for susceptibility
analyses affects largely reliability of the resulting maps,
which otherwise seem to have similar predictive power.
Adding slope curvature derived from the DEM and map
of distances to the faults into the susceptibility model did
not improved its predictive performance. In agreement with
Glade and Crozier (2005), it shows that simply increasing
the number of used preparatory factor maps for suscepti-
bility mapping does not necessarily improve the model
performance. The presented landslide susceptibility zoning
is based on the existing reliable information about factors
affecting landslide occurrences, thus providing relevant
information about future spatial distribution of landslides
and such information has not been available until now for
the study area.
An investigation of the landslide distribution on unique
conditional units showed that similar preparatory factors
define those areas most susceptible to debris flows and rock
slides but that these differ significantly for rock falls. The
units most susceptible to debris flows and rock slides are
characterized by gullies and denudational slope types with
colluvial slope deposits. On the other hand, rock falls are
limited to cliffs and structural slopes. These differences can
also be seen when comparing the susceptibility maps for
each landslide type (Fig. 6). The debris flows and rock
slide maps are similar in terms of their susceptibility zone
distribution whereas the rock fall susceptibility map is
markedly distinct.
Landslide occurrence frequencies
The work shows how landslide occurrence frequencies may
be affected by the total time period covered by the historical
landslide inventory maps and their time resolution. Short
time periods with available landslide information or single
landslide events captured on the inventory map represent
only a ‘‘snap shot’’ of the landslide activity of the study
region and may therefore provide partly misleading infor-
mation with respect to future landslide occurrence. This is
also true when information about landslide occurrence is
available for long time periods (e.g. 50 years), but with only
low spatial and temporal resolution (e.g. 1963–2000 in this
article). The resulting frequencies may not correspond to
short periods when high spatial and temporal data are
available. The assumption that the past landslide frequency
can be used to describe the future landslide occurrence (e.g.
Remondo et al. 2008) may only be valid using comparable
landslide information over short time periods.
Using high-time resolution of the landslide inventory
helps characterize landslide activity throughout the docu-
mented time period. In some cases, the very frequent
occurrence of landslides on a small part of the slope
(Fig. 5a, b) was detected and can be described as ‘‘local-
ized instability’’. In the second case, landslides occur
periodically after several years or decades without sliding
activity (Fig. 5c, d). When only coarse time resolution for
the landslide inventory mapping is available, these two
landslide activity types may not be identified and important
implications for hazard assessment and management can
not be drawn. The effect of time resolution or time periods
with available landslide inventory data on the landslide
frequencies is documented in Table 4. Much higher aver-
age recurrence frequencies for the Front Slope and Back
Slope hazard units were calculated for past 9 years when
compared with the preceding 37 years. This can be
explained by the more detailed field mapping undertaken
during the more recent period. Some evidence also suggest
the possible effect of increasing positive cumulative dif-
ferences among monthly precipitation totals and long-term
monthly precipitation averages recorded at the Machu
Picchu meteorological station since 2002 (Klimes et al.
2007). However, more research about coupling precipita-
tion records and landslide occurrence is needed.
Sustainable landslide mitigation
The work presents two different maps which may be used
to identify areas susceptible to future landslide occurrence.
Table 5 Results of the landslide susceptibility assessment
All landslide types
% of study area in
susceptibility class
% of landslide
dataset area
Stable 68.4 4.0
Conditionally stable 23.2 21.7
Unstable 8.4 74.2
Debris flows
Stable 78.2 0
Conditionally stable 16.3 37.4
Unstable 5.5 62.6
Rock slides
Stable 70.6 0.5
Conditionally stable 20 13.4
Unstable 9.4 86.1
Rock falls
Stable 92.7 0
Conditionally stable 5.1 30.5
Unstable 2.2 69.5
Environ Earth Sci
123
Author's personal copy

The most detailed information is provided by the pixel-
based susceptibility maps. Nevertheless, its practical use
has few drawbacks, which needs to be considered. It is very
difficult to identify correctly each pixel or their groups in
the rugged terrain of the study area. Calculated suscepti-
bilities have inherent uncertainties related mainly to the
accuracy of the input data (topographic and geomorpho-
logic maps) and completeness of the landslide inventory
limited by available historical information. When consid-
ering the limited number of known landslides within the
study area, the prediction of future landslides at the pixel
scale may be ambitious goal. The second option is land-
slide zoning performed for landslide management units
combined with historical landslide inventory. This map
offers susceptibility zones easily identified in the terrain
combined with reliable landslide inventory map which
shows high landslide occurrence persistency, thus it is good
indicator of possible future instabilities. Its very rough
spatial resolution could be seen as disadvantage or
advantage when seeking reliable and spatially consistent
susceptibility information.
It is suggested that the landslide management unit sus-
ceptibility map is used to constrain those areas where
possible future development is most likely to be affected by
landslides. It enables general management decisions iden-
tifying regions, where greater attention should focus on
dangerous slope processes. Pixel-based susceptibility map
could be used for further identification of areas of special
interest, where set of tools mitigating possible landslide
damages should be applied. These may include regular
checking of the identified sites for any signs of landslide
initiation, careful maintaining water drainage system
Fig. 6 The landslide
susceptibility maps based on the
unique conditional analyses
Environ Earth Sci
123
Author's personal copy
preventing any leakages to the slope and site specific
research before initiation of any future developments of the
areas. The presented geomorphological map may be help-
ful since its classes are characterized with respect to
landslide probability occurrence (chapters 4.1 and 4.3). In
well-defined cases, warning signs informing tourists should
be placed to reduce their exposure to possible landslides.
This measure could be only applied during the rainy
season, since in general, the landslide hazard diminish
significantly during the period of low precipitations (May
to July).
Some of the above suggested measures are already being
performed by the site management (e.g. regular checking
of the susceptible areas, maintaining of the drainage sys-
tem), but it is done without more comprehensive knowl-
edge about the landslide occurrence frequencies (there is
no systematic landslide inventory kept, except the one
presented in the article) and further specification of regio-
nal landslide susceptibility within the area of interest. Thus,
from the point of view of long-term sustainable manage-
ment, inadequate decisions may be taken if ignoring the
available historical landslide information.
Conclusions
Historical landslide inventory mapping covering period
from 1963 to 2009 was prepared using multiple time infor-
mation. This describes in detail the spatial and temporal
landslide activity within the study area. It demonstrates the
uncertainties associated with drawing conclusions about
future landslide occurrence frequencies based on short time
period or coarse time resolution. In addition, the basic
assumption that the past landslide frequency can be used to
describe the future landslide occurrence was not proved in
the study area and in general its validity seems to be very
limited. This is very important to bear in mind when calcu-
lating landslide hazard.
Landslide susceptibility was assessed based on the
unique conditional units approach and presented on pixel
(25 m2) and slope (so-called ‘‘landslide management
units’’) scales identifying advantages and disadvantages of
the two landslide susceptibility zonation maps with respect
to their practical use. Approach combining the two scale
landslide susceptibility information for best practice in
landslide mitigation was described. It suggests that well
developed and already used landslide mitigation strategies
should be supplemented by new tools to ensure long-term
sustainable development of the studied area.
The landslide susceptibility assessment proved that the
majority of the Inca City is located on stable site with
susceptible areas located chiefly along its outskirts. The
historical landslide inventory identified no landslide
occurrence within its limits since 1963.
Acknowledgments The authors would like to acknowledge the
financial support provided by Charles University (Grant No.
MSM0021620831) and the IRSM CAS, v.v.i., (AV0Z30460519).
Special thanks go to Ministry of Culture and ANA Cusco for their
scientific and personal support.
References
Canuti P, Margottini C, Mucho R, Casagli N, Delmonaco G, Ferretti
A, Lollino G, Puglisi C, Tarchi D (2005) Preliminary remarks on
monitoring, geomorphological evolution and slope stability of
Inca Citadel of machu Picchu (C101–1). In: Sassa K, Fukuoka H,
Wang F, Wang G (eds) Landslides—risk analysis and sustain-
able disaster management. Springer, New York, pp 39–47
Cardinali M, Ardizzone F, Galli M, Guzzetti F, Reichenbach P (1999)
Landslides triggered by rapid snow melting: the December
1996–January 1997 event in central Italy. In: Mediterranean
Storms, Proceedings of the EGS Conference in Maratea, Italy,
October 1999, Editoriale Bios, Cosenza, pp 439–448
Carlotto V, Cardenas J, Romero D, ValdiviaW, Tintaya D (1999)
Geologıa de los cuadrangulos de Quillabamba y Machupicchu,
Hojas: 26-q y 27-q. INGEMMET, Lima
Carrara A, Cardinali M, Guzzetti F, Reichenbach P (1995) GIS
technology in mapping landside hazard. In: Carrara A, Guzzetti
F (eds) Geographical information systems in assessing. Natural
Hazards, Kluwer Acad. Publ., Dordrecht, pp 135–176
Carreno R, Bonnard C (1997) Rockslide at Machupicchu, Peru.
Landslide News 10:15–17
Carreno R, Lopez R, Tupayachi L (1996) Informe preliminary sobre
el derrube de Machupicchu del 26.12.95 y situacion del cerro
Putucusi. Nota tecnica, MS, PROEPTI, Cusco
Casagli N, Fanti R, Nocentini M, Righini G (2005) Assessing the
Capabilities of VHR Satellite data for debris flow mapping in the
Fig. 7 Landslide management units ranked according to the percent-
age of the respective unit covered by the unstable susceptibility class
for all landslide types
Environ Earth Sci
123
Author's personal copy
machu Picchu Area (C101–1). In: Sassa K, Fukuoka H, Wang F,
Wang G (eds) Landslides—risk analysis and sustainable disaster
management. Springer, New York, pp 60–70
Clerici A, Perego S, Tellini C, Vescovi P (2002) A procedure for
landslide susceptibility zonation by the conditional analysis
method. Geomorphology 48:349–364
Corominas J, Moya J (2008) A review of assessing landslide
frequency for hazard zoning purposes. Eng Geol 102:193–213
Cruden DM, Varnes DJ (1996) Landslide types and processes. In:
Turner AK, Shuster RL (eds) Landslides: investigation and
mitigation. Transp Res Board, Spec Rep 247, pp 36–75
Glade T, Crozier MJ (2005) A review of scale dependency in
landslide hazard and risk analysis. In: Glade T, Anderson M,
Crozier MJ (eds) Landslide hazard and risk. Wiley, Chichester,
pp 75–138
Guzzetti F (2005) Landslide hazard and risk assessment. Dissertation,
Rheinischen Friedrich-Wilhelms Universtitat Bonn
Klimes J, Vilımek V, Vlcko J (2007) Debris flows in the vicinity of
the Machu Picchu village, Peru. In: Sassa K, Fukuoka H, Wang
F, Wang G (eds) Progress in landslide science. Springer, New
York, pp 313–314
Malamud BD, Turcotte DL, Guzzetti F, Reichenbach P (2004)
Landslide inventories and their statistical properties. Earth Surf
Proc Land 29:687–711
McEvan G, Wright KR, (2001) Machu Picchu Will Endure. New
Science, April 3, 2001
Mucho Mamani R, Caillaux VC, Pinto WP, Oviedo MJ, Douma M,
Best M, Bobrowsky P (2005) Application of ground penetrating
radar (GPR) at Machu Picchu, Peru (C101–1). In: Sassa K,
Fukuoka H, Wang F, Wang G (eds) Landslides—risk analysis
and sustainable disaster management. Springer, New York,
pp 55–59
Ponce CF, Solano P, Suarez G (1999) Plan Maestro del Santuario
Historico de Machupichu. Instituto Nacional de Recursos
Naturales, Instituto Nacional de Cultura, Lima
Proyecto Ukhupacha (2003). In: Informe Annual 2003. Available via
DIALOG. http://www.ukhupacha.com. Accessed 29 Sept 2009
Remondo J, Bonachea J, Cendrero A (2008) Quantitative landslide
risk assessment and mapping on the basis of recent occurrences.
Geomorphology 94:496–507
Sassa K, Fukuoka H, Shuzui H (2000) Field investigation of the slope
instability at Inca’s world heritage, in Machupicchu, Peru.
Landslide News 13:37–41
Sterlacchini S, Ballabio C, Blahut J, Masetti M, Sorichetta A (2011)
Spatial agreement of predictive patterns in landslide suscepti-
bility maps. Geomorphology 125:51–61
Suzen ML, Doyuran V (2004) Data driven bi-variety landslide
susceptibility assessment using geographical information sys-
tems: a method and application to Asarsuyu catchment, Turkey.
Eng Geol 71:303–321
Van Den Eeckhaut M, Vanwallegem T, Poesen J, Govers G,
Verstraeten G, Vandekerckhove L (2006) Prediction of landslide
susceptibility using rare events logistic regression: a case-study in
the Flemish Ardennes (Belgium). Geomorphology 76:411–429
Vilımek V, Klimes J, Vlcko J, Carreno R (2006) Catastrophic debris
flows near Machu Picchu village (Aguas Calientes), Peru.
Environ Geol 50:1041–1052
Vilımek V, Zvelebil J, Klimes J, Patzelt Z, Astete F, Kachlık V,
Hartvich F (2007) Geomorphological research of large-scale
slope instability at Machu Picchu, Peru. Geomorphology 89:
241–257
Wright KR, Witt GD, Zegarra AV (1997) Hydrogeology and
paleohydrology of ancient Machu Picchu. Ground Water
4:660–666
Wright KR, Zegarra AV, Wright RM, McEvan G (2000) Machu
Picchu, a civil engineering marvel. ASCE Press, Reston
Yilmaz C, Topal T, Suzen ML (2012) GIS-based landslide suscep-
tibility mapping using bivariate statistical analysis in Devrek
(Zonguldak-Turkey). Environmental earth sciences 65(7):2161–
2178
Environ Earth Sci
123
Author's personal copy
Copyright © 2022 FDOKUMEN