Topographic uncertainty quantification for flow-like landslide ...
Upload
khangminh22Category
view
3download
0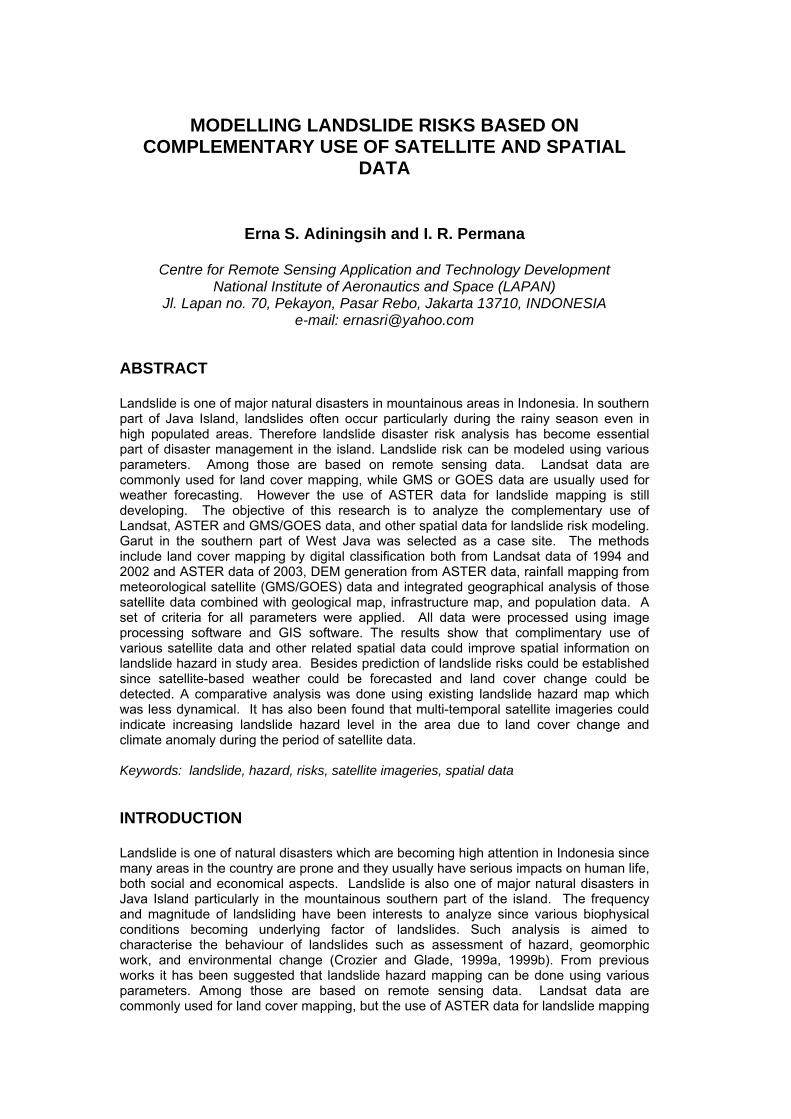
MODELLING LANDSLIDE RISKS BASED ON COMPLEMENTARY USE OF SATELLITE AND SPATIAL
DATA
Erna S. Adiningsih and I. R. Permana
Centre for Remote Sensing Application and Technology Development National Institute of Aeronautics and Space (LAPAN)
Jl. Lapan no. 70, Pekayon, Pasar Rebo, Jakarta 13710, INDONESIA e-mail: [email protected]
ABSTRACT
Landslide is one of major natural disasters in mountainous areas in Indonesia. In southern part of Java Island, landslides often occur particularly during the rainy season even in high populated areas. Therefore landslide disaster risk analysis has become essential part of disaster management in the island. Landslide risk can be modeled using various parameters. Among those are based on remote sensing data. Landsat data are commonly used for land cover mapping, while GMS or GOES data are usually used for weather forecasting. However the use of ASTER data for landslide mapping is still developing. The objective of this research is to analyze the complementary use of Landsat, ASTER and GMS/GOES data, and other spatial data for landslide risk modeling. Garut in the southern part of West Java was selected as a case site. The methods include land cover mapping by digital classification both from Landsat data of 1994 and 2002 and ASTER data of 2003, DEM generation from ASTER data, rainfall mapping from meteorological satellite (GMS/GOES) data and integrated geographical analysis of those satellite data combined with geological map, infrastructure map, and population data. A set of criteria for all parameters were applied. All data were processed using image processing software and GIS software. The results show that complimentary use of various satellite data and other related spatial data could improve spatial information on landslide hazard in study area. Besides prediction of landslide risks could be established since satellite-based weather could be forecasted and land cover change could be detected. A comparative analysis was done using existing landslide hazard map which was less dynamical. It has also been found that multi-temporal satellite imageries could indicate increasing landslide hazard level in the area due to land cover change and climate anomaly during the period of satellite data. Keywords: landslide, hazard, risks, satellite imageries, spatial data INTRODUCTION Landslide is one of natural disasters which are becoming high attention in Indonesia since many areas in the country are prone and they usually have serious impacts on human life, both social and economical aspects. Landslide is also one of major natural disasters in Java Island particularly in the mountainous southern part of the island. The frequency and magnitude of landsliding have been interests to analyze since various biophysical conditions becoming underlying factor of landslides. Such analysis is aimed to characterise the behaviour of landslides such as assessment of hazard, geomorphic work, and environmental change (Crozier and Glade, 1999a, 1999b). From previous works it has been suggested that landslide hazard mapping can be done using various parameters. Among those are based on remote sensing data. Landsat data are commonly used for land cover mapping, but the use of ASTER data for landslide mapping
is still developing. Higher spectral characteristics of ASTER data consist of 15 bands including 4 bands of Visible Near-Infrared (VNIR), 6 bands of Short Wave Infrared (SWIR), 5 bands of Thermal Infrared (TIR). Meanwhile, rainfall is one of major causes of most landslide occurrences. The application of meteorological satellite data (GMS, GOES, and others) is therefore important to support the dynamic aspect of landslide analysis. The use of remote sensing data and geographic information system for landslide mapping has been studied in various sites (Matternicht et al., 2005; Kelarestaghi, 2003). Combined remote sensing and other spatial data would therefore beneficial for development of spatial landslide modeling and mapping in order to provide information for disaster management. There are growing interests on how ASTER image data could be used for various applications. The use of ASTER SWIR bands to derive geological features was done with good result by Poursaleh (2003). Major factors of landslide occurrences in Garut are geological structure, soil type, slope and rainfall. Most landslide occurrences in Garut were related to rainfall. Previous work revealed that total rainfall in 1961-1990 (2877 mm/year) was higher than in 1970-2002 (2701 mm/year) (Adiningsih et al., 2005). It means that total rainfall is decreasing over the last 30 years. On the other side landslide occurrence tends to increase. This is because higher rainfall variability for the period of 1970-2002 in the study area has led to increasing anomalous rainfall occurrences. Crozier and Glade (1999a) have found that high rainfall of values greater than 140 mm have always been associated with landslide occurrences. Other research results have suggested that combinations of antecedent soil moisture and rainfalls of less than 20 mm will never been sufficient for the slope to attain critical water content (Crozier, 1997). To some extent, land cover changes also influence the vulnerability to landslide (Glade, 2003). Therefore the use of satellite imageries in updating land cover maps is important. The application of ASTER in such purposes is relatively still limited compared with other high resolution imageries such as Landsat and SPOT. Another potential use of ASTER, which does not exist in Landsat, is to derive geological features and topography. Based on the similarities and differences of various satellite data for landslide applications, the objective of this research is to analyze the complementary use of Landsat and ASTER data for landslide risk mapping. Garut in the southern part of West Java was chosen as sample site since this area is very prone to landslide disasters. MATERIAL AND METHOD Satellite and Spatial Data Satellite data used in this research include Landsat imageries of 1994 and 2002, ASTER imagery of 2003 and SRTM data. Spatial data collected include geological map, landslide hazard map, and base-map. This study also uses rainfall data of several stations around the study area. Ground checking was done in September 2005 and May 2006 to obtain data on geographic positions of various land cover and elevation, particularly in very vulnerable areas in Garut. Field observation sites are selected to represent high vulnerability areas, which are located in several sub districts of the area. Satellite Data Processing Landsat data of two periods were processed to obtain land cover change. Combination of band 2, 4, and 5 were used to extract such information. ASTER data was processed to obtain land cover and geological characteristics. Combination of band 1, 3, and 6 of ASTER data were used to derived land cover maps. Meanwhile combination of band 5, 6, 8, and 9 of ASTER data were processed using Principle Component Analysis and resulted PC2 image was then used to derive geological map. DEM from SRTM data was used to generate topographic and slope maps. All satellite data were processed using image processing software. To combine with other spatial data, the results were then processed using GIS software to produce thematic maps.

Analysis and Interpretation
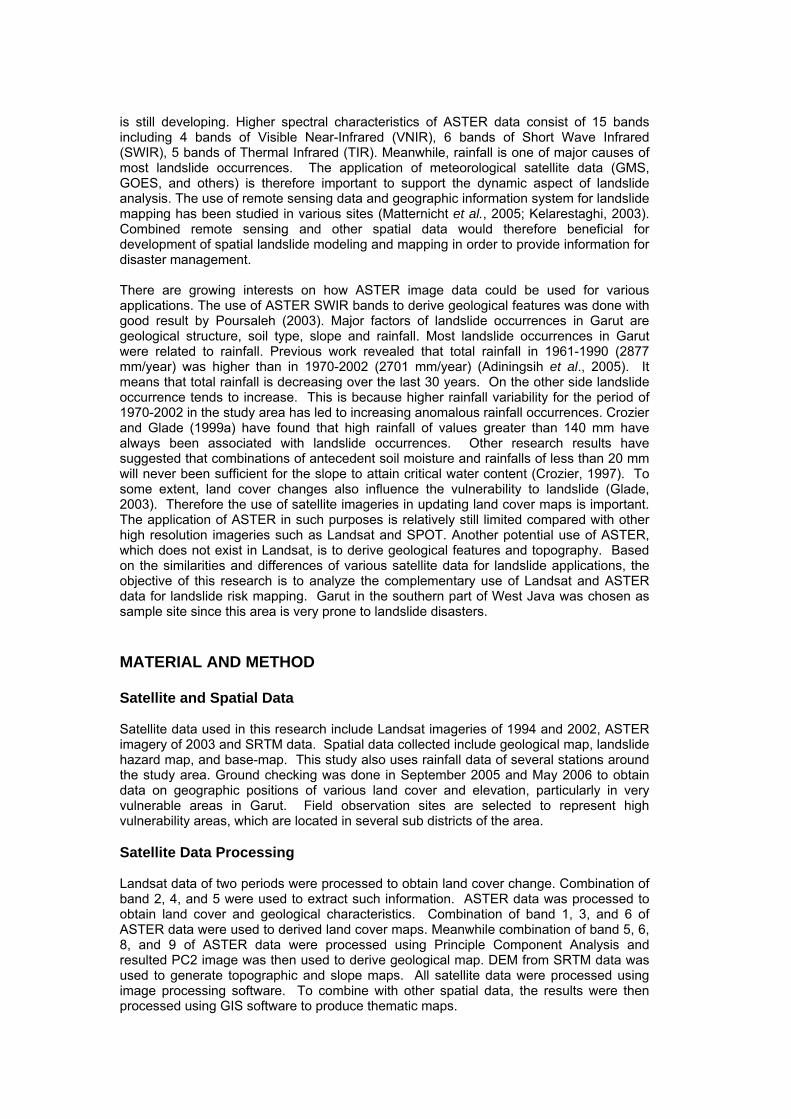
Land cover types extracted from satellite imageries include settlement, paddy field, cropland, plantation, mixed garden, shrubs, forest, bare land, river, and lake. Comparative analysis of land cover changes during the period of 1994 – 2004 was done using Landsat and Aster data. Analyses on land cover, DEM, geological features, rainfall, networks, and population are then used for landslide risks mapping. Table 1 below presents the criteria for landslide risks. Simulations of landslide risk scenarios were done by applying different weights on parameters. The weights for respective parameters are presented in Table 2. As presented in the table, there are seven scenarios which employ different weights for the parameters. Resulted maps are then compared with landslide hazard maps and landslide occurrences. The analysis was focused on high landslide hazard level areas. Overall methods in this research are presented in Figure 1. RESULT AND DISCUSSION Land Cover Change from Landsat and ASTER Imageries Land cover maps have been generated from Landsat imageries of 1994 and 2002. The results were then validated based on field observations. Landsat and ASTER imageries of Garut are shown in Figure 1. Land cover maps derived from Landsat imageries are shown in Figure 2. As the ground truth sites were selected over high landslide hazard areas, we focused our analysis on these sites. From Landsat and ASTER imageries and land cover map we can see that there are significant land cover changes over the study area during the period of 1994 and 2003, particularly in the northeastern and southern parts of study area. The changes include increasing cropland areas, plantations, and shrubs. Meanwhile the forest areas are decreasing as indicated by circled areas on land cover map.
Table 1. Landslide Risk Criteria Based on Satellite and Spatial Data
Landslide Risk Level No Parameter High Moderate Low Very Low
1 Rainfall (mm/month)
> 300 200 – 300 100 – 200 < 100
2 Land cover type
Bare land, grass land, agricultural land
Plantation Forest Settlement
3 Slope (degrees)
> 54 36-54 18-36 0-18
4 Soil type Alluvial, Regosol
Podsolik, Renzina
Andosol Latosol
5 Geology Qhg, Qypu, Qkp, Qyc, QTv
Tmb, Qwb, Qmn, Qsu, Qyp, Qyc, QTv
Tmb, Qwb, Qopu, Qsu, Qkl, QTv
Qa, Qd, Qopu.
6a Distance from main road (m)
< 50 m 50 – 75 m 75 – 100 m > 100 m
6b Distance from secondary road (m)
< 20 m 20 – 35 m 35 – 50 m > 50 m
6c Distance from local roads(m)
< 10 m 10 – 20 m 20 – 25 m > 25 m

Table 2. Weighing methods for seven scenarios of landslide risk assessment
Weights for Each Scenario No Parameter 1 2 3 4 5
1 Rainfall 0.2 0.233 0.25 0.25 0.20 2 Land Cover 0.2 0.233 0.25 0.20 0.25 3 Slope 0.2 0.233 0.20 0.25 0.25 4 Soil Type 0.2 0.15 0.15 0.15 0.15 5 Geology 0.2 0.15 0.15 0.15 0.15
Landsat Imageries
ASTER Imageries
SRTM Data
GMS/GOES Imageries
Base Maps
Rainfall Data
Infrastructure Map
Population Data
Radiometric and/or Geometric Corrections
Band Selections
PCA of SWIR Bands
Geology Map
Soil Type Map
DEM Generation
Slope Map Rainfall Maps
Land Cover Classification (band 5, 4, 3)
Land Cover Maps
Land Cover Classification (band
4, 3N, 2)
Landslide Risk MapsLandslide Occurrence
Data
Rainfall Estimation and Mapping
Landslide Scenarios and Overlaying
Figure 1. Landslide risks assessment method based on satellite and spatial data.
1994 2003
Figure 1. Landsat imagery of 1994 and ASTER imagery of 2003 of Garut District, West Java.
1994 2002
Figure 2. Land Cover Map and Land Cover Change of Garut – West Java derived from
Landsat imageries. (Circled areas indicate the ones with significant land cover changes).
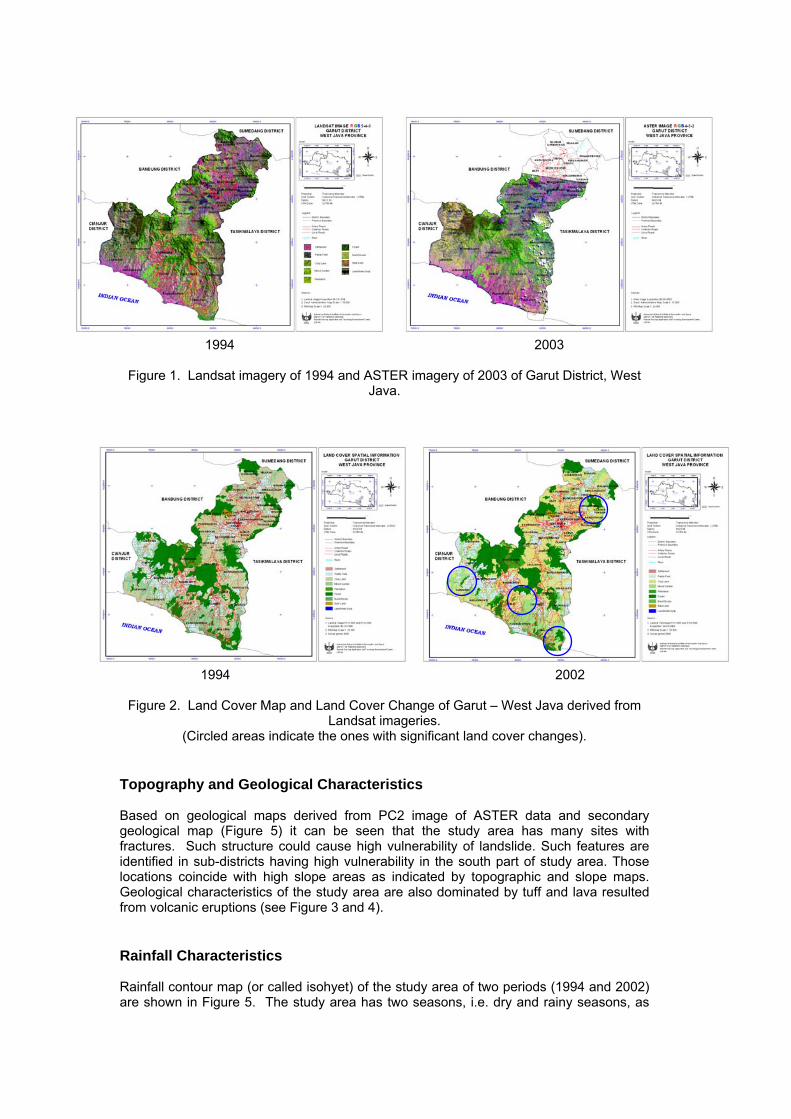
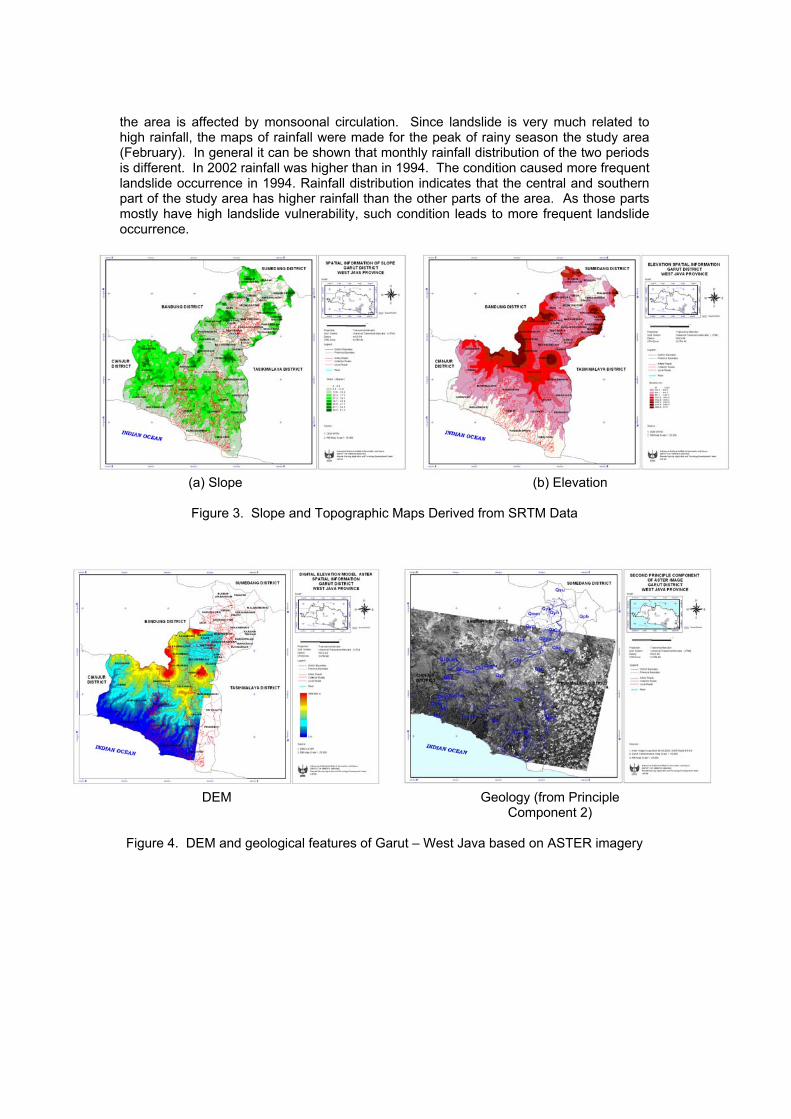
Topography and Geological Characteristics Based on geological maps derived from PC2 image of ASTER data and secondary geological map (Figure 5) it can be seen that the study area has many sites with fractures. Such structure could cause high vulnerability of landslide. Such features are identified in sub-districts having high vulnerability in the south part of study area. Those locations coincide with high slope areas as indicated by topographic and slope maps. Geological characteristics of the study area are also dominated by tuff and lava resulted from volcanic eruptions (see Figure 3 and 4). Rainfall Characteristics Rainfall contour map (or called isohyet) of the study area of two periods (1994 and 2002) are shown in Figure 5. The study area has two seasons, i.e. dry and rainy seasons, as
the area is affected by monsoonal circulation. Since landslide is very much related to high rainfall, the maps of rainfall were made for the peak of rainy season the study area (February). In general it can be shown that monthly rainfall distribution of the two periods is different. In 2002 rainfall was higher than in 1994. The condition caused more frequent landslide occurrence in 1994. Rainfall distribution indicates that the central and southern part of the study area has higher rainfall than the other parts of the area. As those parts mostly have high landslide vulnerability, such condition leads to more frequent landslide occurrence.
(a) Slope (b) Elevation
Figure 3. Slope and Topographic Maps Derived from SRTM Data
DEM Geology (from Principle
Component 2) Figure 4. DEM and geological features of Garut – West Java based on ASTER imagery

1994 2002
Figure 5. Rainfall distribution of study area of 1994 and 2002 derived from satellite and
station data
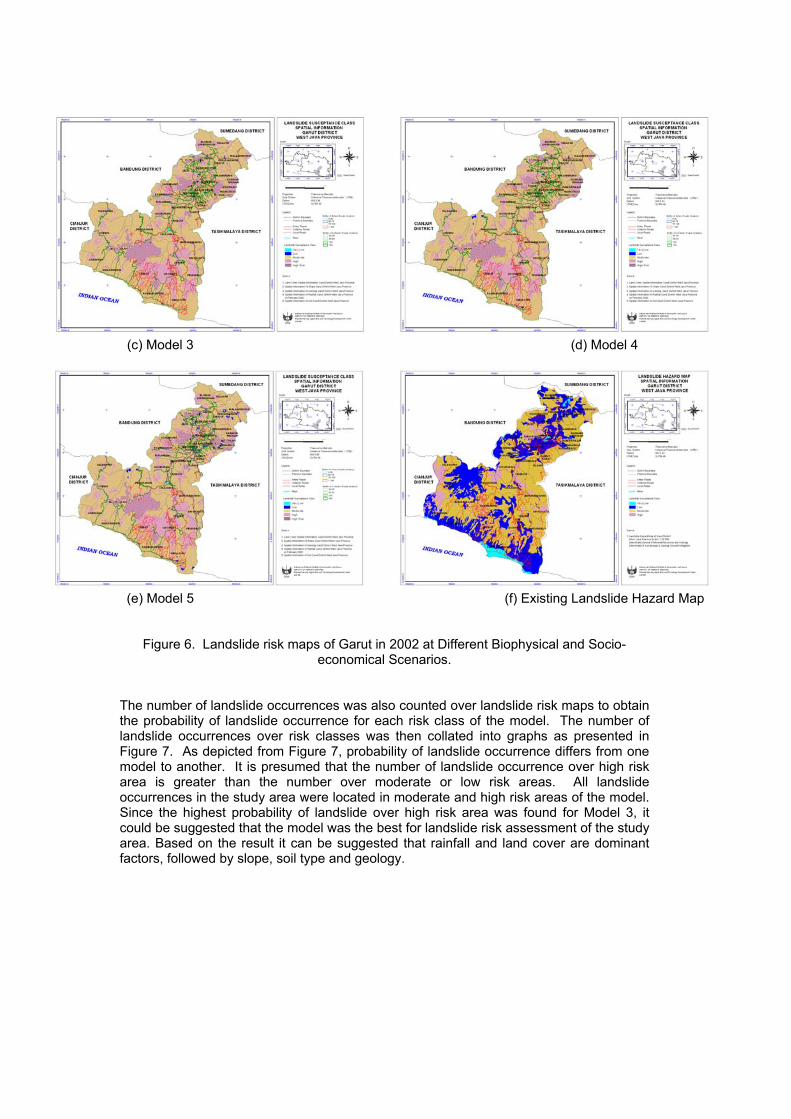
Landslide Risks and Simulation Since it has been found from satellite imageries and field survey that there have been changes in land cover in the study areas which have steep slope, such changing could cause increasing landslide vulnerability. An evident has been found in one sub-district (Kecamatan Pakenjeng) from field survey. Landslide has occurred several times during 2001-2004 in the sub-district and the last one occurred in November 2004 which caused serious damage in the area. Landslide risks derived from the simulations were also compared with existing landslide hazard maps and landslide occurrences (see Figure 6). From Figure 6 it is shown that low landslide hazard areas of existing map are much wider than of model. However, as we did field observations in the study area, there were many landslides occurred in low hard areas of the existing map. It means that existing landslide hazard map tends to be underestimated and should be improved.
(a) Model 1 (b) Model 2
(c) Model 3 (d) Model 4
(e) Model 5 (f) Existing Landslide Hazard Map
Figure 6. Landslide risk maps of Garut in 2002 at Different Biophysical and Socio-economical Scenarios.
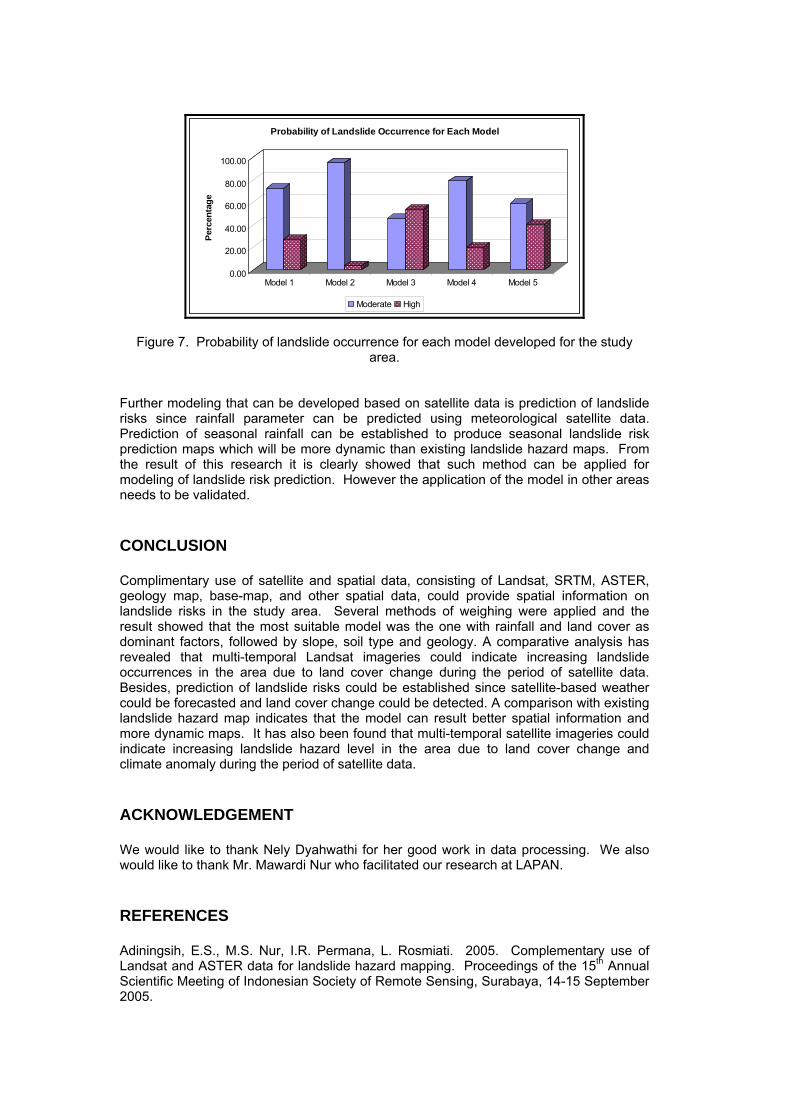
The number of landslide occurrences was also counted over landslide risk maps to obtain the probability of landslide occurrence for each risk class of the model. The number of landslide occurrences over risk classes was then collated into graphs as presented in Figure 7. As depicted from Figure 7, probability of landslide occurrence differs from one model to another. It is presumed that the number of landslide occurrence over high risk area is greater than the number over moderate or low risk areas. All landslide occurrences in the study area were located in moderate and high risk areas of the model. Since the highest probability of landslide over high risk area was found for Model 3, it could be suggested that the model was the best for landslide risk assessment of the study area. Based on the result it can be suggested that rainfall and land cover are dominant factors, followed by slope, soil type and geology.
0.00
20.00
40.00
60.00
80.00
100.00
Perc
enta
ge
Model 1 Model 2 Model 3 Model 4 Model 5
Probability of Landslide Occurrence for Each Model
Moderate High
Figure 7. Probability of landslide occurrence for each model developed for the study
area. Further modeling that can be developed based on satellite data is prediction of landslide risks since rainfall parameter can be predicted using meteorological satellite data. Prediction of seasonal rainfall can be established to produce seasonal landslide risk prediction maps which will be more dynamic than existing landslide hazard maps. From the result of this research it is clearly showed that such method can be applied for modeling of landslide risk prediction. However the application of the model in other areas needs to be validated.
CONCLUSION Complimentary use of satellite and spatial data, consisting of Landsat, SRTM, ASTER, geology map, base-map, and other spatial data, could provide spatial information on landslide risks in the study area. Several methods of weighing were applied and the result showed that the most suitable model was the one with rainfall and land cover as dominant factors, followed by slope, soil type and geology. A comparative analysis has revealed that multi-temporal Landsat imageries could indicate increasing landslide occurrences in the area due to land cover change during the period of satellite data. Besides, prediction of landslide risks could be established since satellite-based weather could be forecasted and land cover change could be detected. A comparison with existing landslide hazard map indicates that the model can result better spatial information and more dynamic maps. It has also been found that multi-temporal satellite imageries could indicate increasing landslide hazard level in the area due to land cover change and climate anomaly during the period of satellite data. ACKNOWLEDGEMENT We would like to thank Nely Dyahwathi for her good work in data processing. We also would like to thank Mr. Mawardi Nur who facilitated our research at LAPAN. REFERENCES Adiningsih, E.S., M.S. Nur, I.R. Permana, L. Rosmiati. 2005. Complementary use of Landsat and ASTER data for landslide hazard mapping. Proceedings of the 15th Annual Scientific Meeting of Indonesian Society of Remote Sensing, Surabaya, 14-15 September 2005.

Avci, M., and Akyurek, Z., A Hirarchical Classification of Landsat TM Imagery for Landcover Mapping. General Command of Mapping, 06100 Cebeci Ankara, Turkey. not published. Bauerhansl, C., F. Rottenstrener, and C.Briese. “Determination Of Terrain Models By Digital Image Matching Methods”, not published. Bektas, F. and C. Goksel, Remote Sensing and GIS Integration for Land Cover Analysis, A case Study : Gokceada Island, not published. Chalermpong. Patiwet., Guidelines For Commutnity Management In Landslide Risk Areas Of East-Coast Of The Gulf Of Watershed, Thailand, Geo-Informatics Scientist, Geo-Informatics Center . Not published. Chrysoulakis, N., Diamandakis, M., and Prastacos, P. GIS Integration of ASTER Stereo Imagery for the Support of Watershed Management. Foundation for Research and Technology-Hellas, Institute of Applied and Computational Mathematics, Regional Analysis Division, Heraklion, Crete, Greece. not published. Crozier, M.J. and T. Glade. 1999a. A Fundamental Research on Landslide: Analysis of Frequency of Rainfall and Landslide Occurrence. Not published. Esmali. 2003. Using GIS & RS in Mass Movements Hazard Zonation-A Case Study in Germichay Watershed, Ardebil, Iran, Map India 2003. Given, K., Gűrcan, B., and Karsten, J., Analysis of Digital Elevation Models Determined by high Resolution space Image. Karaelmas University Zonguldak, Turkey. not published. Glade, T. 2003. Landslide occurrence as a response to land use change: a review of evidence from New Zealand. Catena, 51: 297 - 314 Goncalves J. A., and Oliviera A. M., Accuracy Analysis of DEMS derived from ASTER Imagery. Science Faculty-University of Porto, Portugal. Not published. Hirano, A., R. Welch, and H. Lang. 2003. Mapping from ASTER Stereo image data : DEM validation and accuracy assesment. ISPRS J. Photogrammetry & Remote Sensing, 57: 356-370. Junek. P., Geological Mapping In The Cheleken Peninsula, Turkmenistan Area Using Advanced Spaceborn Thermal Emission And Reflection Radiometer (Aster) Data, not published. Kamp, U., Bolch, T., and Olsenholler, J . DEM Generation from ASTER Satellite Data for Geomorphometric Analysis of Cerro Sillajhuay, Chile/Bolivia, Department of Geography. not published. Kelarestaghi, A. 2003. Landslide hazard zonation in shirin Rood Drainage basin with using Geographic Information System, sari, Iran. Map Asia Conference 2003. Matternicht, G., L. Hurni, R. Gogu. 2005. Remote sensing of landslides: an analysis of the potential contribution to geo-spatial systems for hazard assessment in mountainous environments. Remote Sensing of Environment, 98: 284 – 303. Patanakanog B. Landslide hazard Potential Area in 3 Dimension by Remote Sensing and GIS Technique. Land Development Department. not published. Petley. D. N., Crick W. D.O., and Hart, B. A,. The use satellite imagery in Landslide Studies in High Mountain Areas. Lecture, Department of Geography, University of Durham. not published. Ravikumar, G. 2003. Remote Sensing based Drougth Information System for Palar and Thamiravaruni Basins using GIS, Map Asia 2003. Subramanian S. K. S., Singh A., and Sudhakar M., 2003. Evaluation of Digital Elevation Models created from different satellite images. Map India 2003. Tangestani. M H., 2003. Landslide susceptibility mapping the fuzzy gamma operation in a GIS, Kakan catchment area, Iran. Map India 2003. Vohora, V.K. and Donoghue. S.L., Applications Of Remote Sensing Data To Landslide Mapping In Hongkong, not published. Wang, S., Yang, Y., and Hseu, S. Problems and Accuracy of Photogrammetric Volume Estimation of Landslide induced by Earthquake. Dept. Of Surveying Engineering National Cheng Kung University Tainan, China Taipei. not published. Watanabe. H., Kannari. Y., and Miura, A,. Evaluation of ASTER operation at the Ground Data System. Earth Remote Sensing Data Analysis Center. not published.
1
SPACE SCIENCE AND TECHNOLOGY IMPACT ON MONITORING AND MANAGEMENT FOR PIPELINE
SECURITY SERVICE
Sefer Kurnaz The Aeronautics and Space Technologies Institute Air Force Academy, Istanbul,
Turkey
Rustam Rustamov International Astronautical Federation;
Caspian Business Center, 4 Floor, 40 J. Jabbarly str. Baku, AZ 1065, Azerbaijan, Phone: (994 12) 497 80 80; Fax: (994 12) 492 98 89; e-mail:
ABSTRACT
Safe pipeline transportation of energy resources is a major concern for the public and the pipeline industry. From the first stage a pipeline has been built and buried, geologic and natural hazards, corrosions and third-party damages all pose cumulative internal and environmental risks to the pipeline’s integrity. As today’s pipeline engineering and operation become more reliant on geospatial data for safety in the pipeline’s life cycle of design, construction, maintenance, and emergency response of pipeline facilities, the rapid and cost-affordable acquisition of terrain data along the pipeline corridor becomes increasingly critical. Security and reliability oil and gas operational and transportation infrastructures are one of the significant technological elements of energy safety maintenance. Geographical scope of the transportation infrastructure is a huge - from Western Siberia and Central Asia up to the western territory of the European Union and from Northern Europe and adjoining Arctic regions up to Northern Africa and Middle East. The general aspects of the security of oil and gas pipeline can be identified as the following: • Geohazard studies • Environmental monitoring • Geographic Information Systems (GIS) applications • General risk assessment • Environmental Impact Assessment (EIA) studies • Environmental Management and Monitoring Plan (EMMP) and other related plans • Social Impact Assessment (SIA) studies
The Baku-Tbilisi-Ceyhan (BTC) project is a $3 billion investment to unlock a vast store of energy from the Caspian Sea by providing a new crude oil pipeline from Azerbaijan, through Georgia, to Turkey for onward delivery to world markets. Traversing 1,768 km of often remote and challenging terrain, the BTC pipeline will be able to transport up to one million barrels of crude oil per day from a cluster of discoveries in the Caspian Sea, known collectively as the Azeri, Chirag, deepwater Gunashli (ACG) field. By creating the first direct pipeline link between the landlocked Caspian Sea and the Mediterranean, the BTC project will bring positive economic advantage to the region and avoid increasing oil traffic through

2
the vulnerable Turkish Straits. A programme of social and environmental investment is ensuring that the people of the three host nations also share in the benefits. INTRODUCTION Application and use of the variety of advanced technologies are available to improve and enhance planning, design, management, operation and maintenance of pipeline system. Aerial and satellite remote sensing integrated with GIS represents one area of rapid development that can be leveraged to assist pipeline risk assessment to assure the safety of pipeline facilities. Industrial and scientific advances in satellite remote sensing systems and data processing technologies are creating a new technological opportunities and positive environment to develop an increased capability to accomplish the pipeline mapping and safety needs of the industry. These technologies when combined with GIS have significant and unique potential and contribution for application to a number of cross cutting system security issues. APPROACHES TO PIPELINE MONITORING AND THE RESULTING BENEFITS Research activities and application needs and efforts are developing cost-effective ways to enhance pipeline integrity, inspection and monitoring, as well as new tools and techniques for managing the risk involved in pipeline operations. Some of these efforts have investigated the use of satellite-based technology for pipeline protection. It has been identified the potential for satellite imagery to detect significant slope motion and ground movements that could threaten nearby pipelines with a less expensive means. Pipelines and their associated facilities pose potential environmental pollution risk that can also be monitored by a variety of remote sensing systems. Pipelines are required to meet all environmental pollution risk hazardous waste management standards. Hazardous wastes related to the transport process of oil and gas in pipelines is fully covered by environmental pollution risk regulations for the control of hazardous material. Advances in information systems, satellites imaging systems and improved software technologies have led to opportunities for a new level of information products from remote sensed data. The integration of these new products into existing response systems can provide a wide range of analysis tools and information products that were not possible before. Using the higher resolution imagery and change detection analysis pipeline situational awareness and damage assessment can be conducted rapidly and accurately. Power utility infrastructure and system wide evaluations over a broad area could also be addressed using remote sensing data sources. All of those information products can be useful in the response, recovery and rehabilitation phases of infrastructure management preparedness. THE MAIN AND NECESSARY ACTIONS The main and necessary actions which should be executed for safety purposes are a detailed monitoring and review of the pipeline operator requirements and the currently available remote sensing technologies that could meet these. From these actions a best practice approach will be evolved, identifying suitable approaches that could be considered now and those that will be available in the foreseeable future. For investigation of these fantastic approaches, several of the partners will provide state-of-the-art monitoring equipment that will be flown over pipeline test sites to assess the performance of new techniques and the processing of multi-sensor data sets.

3
Outcomes of those investigations will be compared with imagery collected from current satellite instrumentation to enable the technology limits of the various approaches to be compared. The pipeline operator companies will provide access to their pipeline right-of-ways and will develop models for the risk and cost benefits of the various approaches considered. The requirements for the structure of a computer based management system that will collect the information, undertake the processing of the data and disseminate it to the end user pipeline operators will be established and a pilot demonstration system developed. EXPECTED CONTRIBUTIONS The major advantage of used means are anticipated by replacing conventional monitoring techniques with remote surveillance sensing and employing advanced data processing of imagery to supply feature identification with improved response times compared with current practice. It has to be taking into account that there are three key aspects which hold particular interest for pipeline operators: the priority is to assess how satellite monitoring from space could be used to identify and anticipate third party interference, such as tractors and large earth moving equipment, to the pipeline network. The second aspect of concern is land movement, landslide or landslip. The last third aspect is oil and gas leakage. Current pipeline monitoring is undertaken routinely using a number of techniques, the most common being as it called "flying-the-line" using helicopters or fixed wing aircraft with trained observers on board. These routine and regular flights perform a key role but they are enough expensive and bear the inherent safety concerns of all helicopter flights. NEW DEVELOPMENTS AND ACHIEVEMENTS For successful implementation of pipeline safety and security aims it has to be involved the development of mathematical modeling software, image processing software and software to extract and select features from needed data collected from a wide range of detector instrumentation. A remote monitoring system would be transmitted images to Earth from satellites in space, following the route of a pipeline and identified a key threats to pipeline safety and security. The final information will need to be presented to the end user in a simple and manageable format that will enable the recipient to respond to incidents in a measured way, without the probability of false alarms causing the quality, safety or integrity of the system being called into question. APPLICATION ADVANCE TECHNOLOGY AND NEW OBJECTIVES EXECUTIONS Variety of space technology methods such as Lidar, Synthetic Aperture Radar (SAR) as well as interferometric SAR (InSAR) and point scatter InSAR (PsinSAR) can be combined very successfully for implementation foregoing issues. In the meantime application InfraRed (IR) and optical (multispectral) surveillance technology create positive environment on receiving high-quality images and obviously image processing. CONCLUSION Modern multispectral materials of space images are the unique data on detection of the geodynamic and hazardous processes occurring in the oil and gas pipeline systems. It is an

4
excellent instrument for application on security and safety purposes of appropriate infrastructures. Application of space technology has a variety of advantages which cover such areas as high accuracy and resolution of information and availability of the difficult of access areas and many other reasons make a space technology for solution of pipeline security and safety problems.
DETERMINATION OF AIR TEMPERATURE USING MODIS BASED ON THERMODYNAMIC APPROACH
M. Rokhis Khomarudin* and Orbita Roswintiarti* *Indonesian National Institute of Aeronautics and Space
LAPAN, Jalan LAPAN 70 Pekayon Pasar Rebo Jakarta Timur Phone/Fax: +62 21 8710065/+62 21 8710274
Abstract Air temperature is the important element for human life, especially for human and animal’s comfortable activity, and plant growth. The plant, increasing of air temperature could increase the biochemical process. In the hot environment the growing season of paddy more rapid than in the cold environment. Because of the importance of air temperature for life, we must observe this element. The measurement of air temperature usually used thermometer in the meteorology or climate station under Berau of Meteorology and Geophysics. In Indonesia, there are some limitations of air temperature measurement and they couldn’t provide the spatial information. For example, in Surabaya, Gresik, and Sidoarjo have only there stations that measure air temperature. So, they couldn’t explain the air temperature in the whole area and the districts. However, when data were sparse, the underlying assumptions about the variation among sampled points often differed and the choice of interpolation method and parameters then became critical. Often though data may be too sparse to use any of the interpolation methods and so alternate ways to derive spatially representative values of air temperature need to be researched. The data that could provide spatial information are remote sensing. The objective of this research is to estimate air temperature using remote sensing data. The objective of this research is to estimate air temperature from MODIS Land Surface Temperature and Reflectance 500 m resolution. The methods of this research are used thermodynamic approach. In this research used Reflectance 500 m to calculate surface albedo and to generate the net radiation and NDVI to calculate soil heat flux. MODIS Land Surface Temperature used to estimate crop water stress index, sensible heat flux, and latent heat for evaporation. In this research also used incoming solar radiation and surface wind speed from observation to calculate net radiation and aerodynamic resistance. For validation, we used air temperature observation in the field from 15 June 2004 until 4 July 2004. The results of the air temperature estimation have good correlation between model and the observation. The have the biggest error is 1.4 °C and the smallest is 0.1. The coefficient of determination (R2) is about 0.77 and the mean square error (MSE) is 0.77°C. Crop Water Stress Index (CWSi) have negative correlation with Normalized Difference Vegetation Index (NDVI) The correlation is only 0.58.. KEYWORDS : air temperature, spatial information, remote sensing, thermodynamics
INTRODUCTION Background Air temperature is the important element for human life, especially for human and animal’s comfortable activity, and plant growth. The plant, increasing of air temperature could increase the biochemical process. In the hot environment the growing season of paddy more rapid than in the cold environment. Because of the importance of air temperature for life, we must observe this element. The measurement of air temperature usually used thermometer in the meteorology or climate station under Berau of Meteorology and Geophysics. In Indonesia, there are some limitations of air temperature measurement and they couldn’t provide the spatial information. For example, in Surabaya, Gresik, and Sidoarjo have only there stations that measure air temperature. So, they couldn’t explain the air temperature in the whole area and the districts. However, when data were sparse, the underlying assumptions about the variation among sampled points often differed and the choice of interpolation method and parameters then became critical. Often though data may be too sparse to use any of the interpolation methods and so alternate ways to derive spatially representative values of air temperature need to be researched. The data that could provide spatial information are remote sensing. The new method to describe spatial information is remote sensing. Some the benefits of this data are good for the large area, have a little observation, and provide the historical data. Good for large area, it’s means that remote sensing data could capture the large area. LANDSAT TM could capture 185 x 185 km2 in one picture and NOAA AVHRR could be 2800 x 2800 km2, or near ¾ Indonesian areas. If we compare with the manual measurement from climatology station, remote sensing data will more effective. Beside of the some benefits, remote sensing data also have some limitations. Some limitations are clouds and for Landsat TM data is not capture daily. Some research to estimate air temperature from satellite have develop by Dong (2004) with Neural Network model, Sun, et al (2004) with thermodynamics models, and Han, et al. (2003) with the multiple regression model. Only Sun, et al (2004) has physical approach to estimate air temperature. Neural network model and the regression model only explained the influences of some parameters to air temperature, but they don’t explained physically. The inputs of these models have a lot things and very complex. Based on the previous study, this research will try to estimate air temperature with little parameters, not complex, and easy to do. The previous study Khomarudin et. al. (2004), estimation of air temperature using remote sensing based on thermal diffusivity approach have low correlated with the observation. . Physically, the research could estimate air temperature from satellite data. But statistically, this research have not enough significant to describe the field observation. The model describes the field observation only 40 %. The coefficient determinations (R2) between air temperature from satellite with the observation not more 0.4. Some errors have identified are determination of amplitude and the air condition. Objectives The obejective of this research is to estimate air temperature using thermodynamics approach, MODIS Land Surface Temperature and MODIS reflectance 500 m. The target of this research is the models have higher correlation than the previous study. The spatial resolution is 500 m. DATA AND METHODOLOGY The data that used in this research is MODIS Land Surface Temperature and MODIS reflectance 500 m 15-30 June 2004 and the area is East Java and Bali. MODIS Land
Surface Temperature used as the main element to estimate air temperature. MODIS reflectance 500 m used to calculate albedo and Normalized Difference Vegetation Index (NDVI). For the validation, this research used the air temperature observation data. To calculate aerodynamic resistance used wind speed data from meteorology station. Step by Step Formula According Sun et al (2004) to estimate air temperature using thermodynamics approach and remote sensing used the formula. The below formula is the step to calculate air temperature.
LEGHRn ++= (1)
GRnLECWSI−
−= 1
(2)
raTaTsCpH −
= ρ
(3)
CpraHTsTaρ
−=
(4)
CpGRn
HGRnraTsTa
ρ)(
)..(−
−−=
(5)
CpGRn
LEGRnGRnraTsTa
ρ)(
)..(−−−
−−=
(6)
CpCWSIGRnraTsTa
ρ)..( −
−=
(7) Where, Ta = Air Temperature (K) Ts = Land surface temperature (K) (MODIS Land Surface Temperature) ρ = Air density (Kg m-3) Cp = Air heat Capacity (1004 J Kg-1 K-1) ra = Aerodynamics resistance (s m-1) Rn = Net Radiation (W m-2) G = Soil heat flux (W m-2) H = Sensible heat flux (W m-2) CWSI = Crop Water Stress Index

Calculation of Net Radiation
Rn = Rsin + Rlin – Rsout – Rlout (8)
Rn = (1- α) Rs + Rl - εσ (Ts + 273.16)4 (9) Where,
Rn = Net Radiation (MJ m-2 day-1)
Rs = Incoming Shortwave Radiation (MJ m-2 day-1) (FAO, 1998) Rl = Outgoing Longwave Radiation (MJ m-2 day-1) (Swinbank, 1963)
α = Surface Albedo (MODIS) Ts = Surface Temperature (°C) (MODIS) ε = Surface Emisivity (0.95) σ = Stefan Bolztman Constants (4.90 X 10⁻⁹ MJ m-2 day-1 K-4)
Calculation of Soil Heat Flux (G)
Base on Allen, et al., 2001 and Chemin, 2003 the calculation of G as follow:
( )( )42 98.010074.00038.0 NDVITRnG s −+= αα
α (10) Where, NDVI = Normalized Different Vegetation Index (ASTER) Crop Water Stress Index (CWSI) To calculate Crop Water Stress Index used the linear assumption between surface temperature with CWSI (Tasumi, 2000) :
Tshot LE ≈ 0 CWSI = 1 Tscold H ≈ 0 CWSI = 0
Figure 1. The Illustration of CWSI Calculations
TsCold Tshot
0
1
CWSI = a Ts + b
Table 1 showed the equation to calculate CWSI in the difference date.
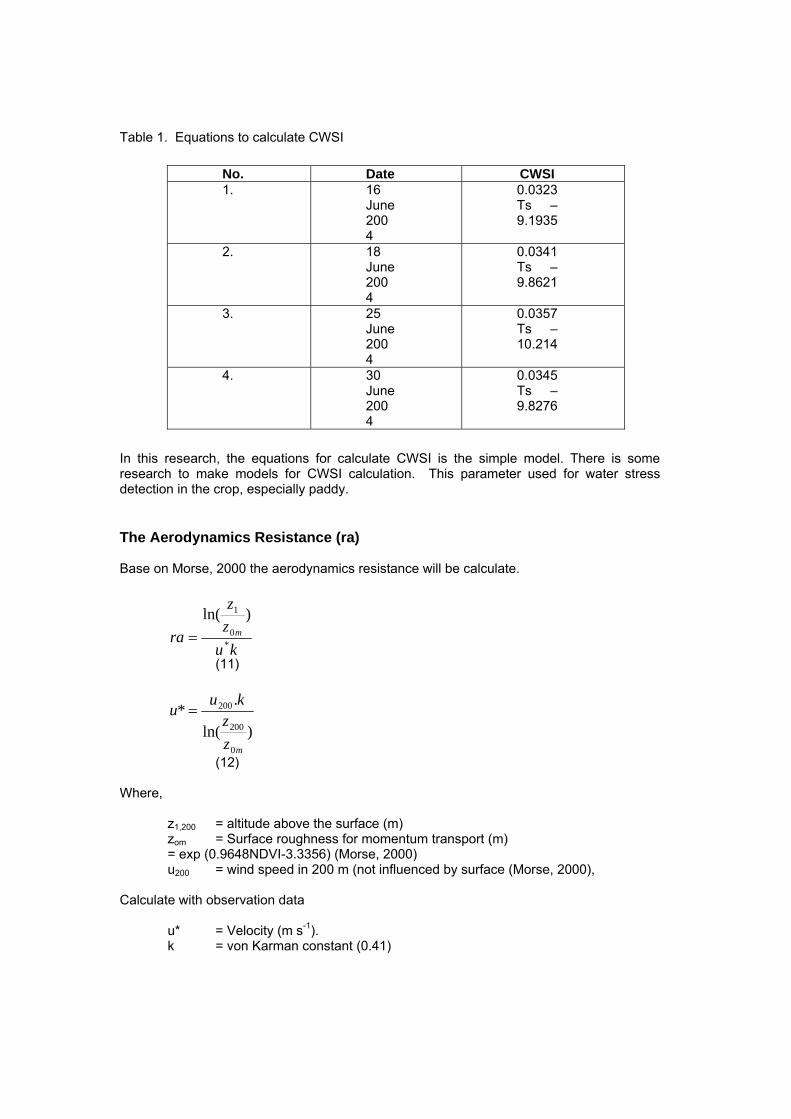
Table 1. Equations to calculate CWSI No. Date CWSI
1. 16 June 2004
0.0323 Ts – 9.1935
2. 18 June 2004
0.0341 Ts – 9.8621
3. 25 June 2004
0.0357 Ts – 10.214
4. 30 June 2004
0.0345 Ts – 9.8276
In this research, the equations for calculate CWSI is the simple model. There is some research to make models for CWSI calculation. This parameter used for water stress detection in the crop, especially paddy. The Aerodynamics Resistance (ra) Base on Morse, 2000 the aerodynamics resistance will be calculate.
kuzz
ra m*
0
1 )ln(=
(11)
)ln(
.*
0
200
200
mzz
kuu =
(12)
Where, z1,200 = altitude above the surface (m) zom = Surface roughness for momentum transport (m)
= exp (0.9648NDVI-3.3356) (Morse, 2000) u200 = wind speed in 200 m (not influenced by surface (Morse, 2000),
Calculate with observation data u* = Velocity (m s-1). k = von Karman constant (0.41)
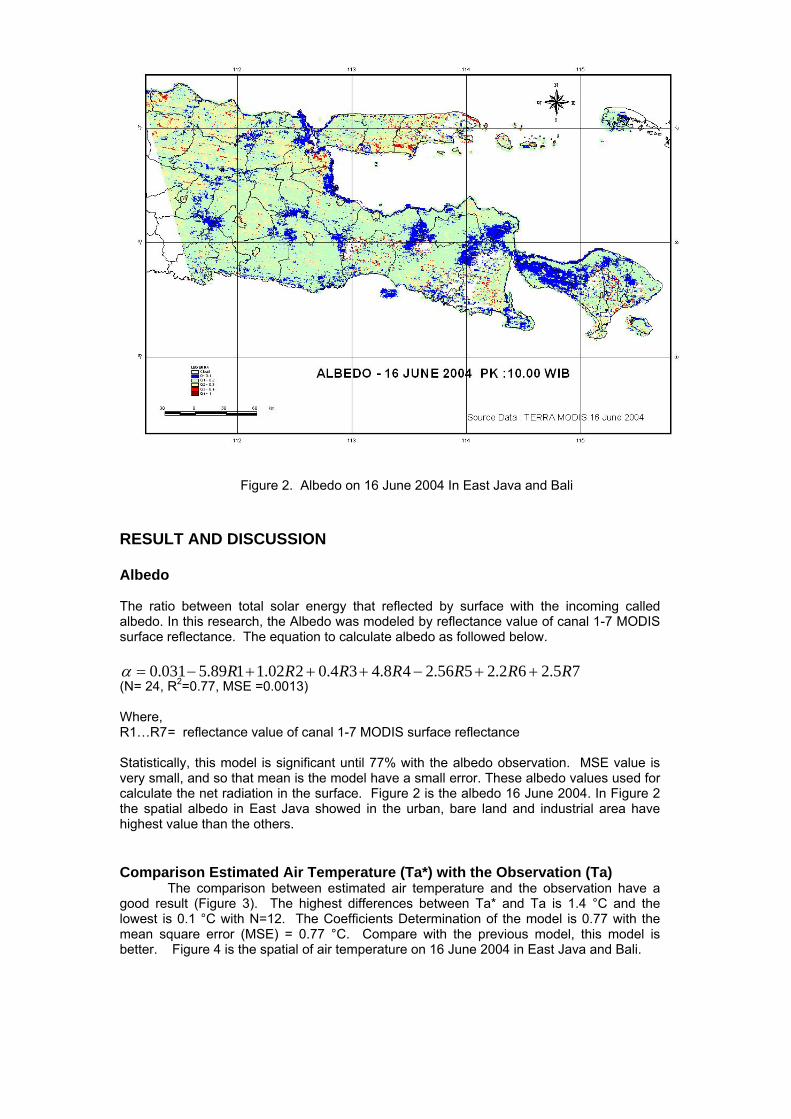
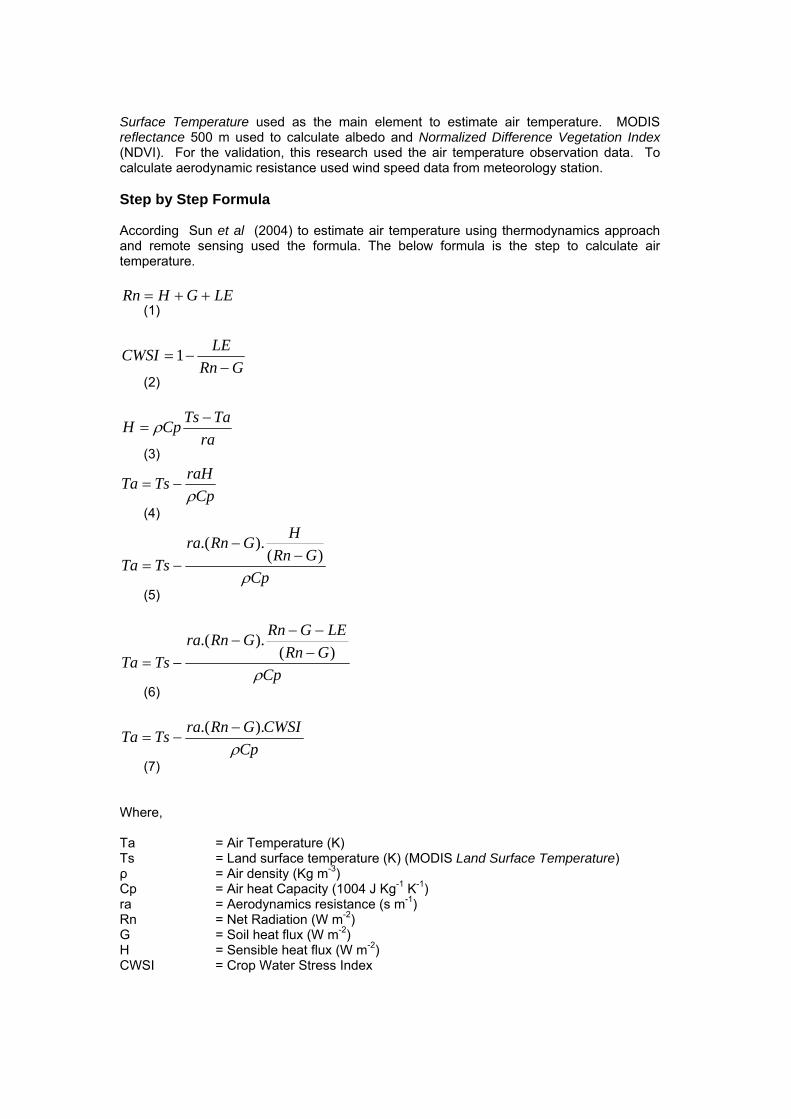
Figure 2. Albedo on 16 June 2004 In East Java and Bali RESULT AND DISCUSSION Albedo The ratio between total solar energy that reflected by surface with the incoming called albedo. In this research, the Albedo was modeled by reflectance value of canal 1-7 MODIS surface reflectance. The equation to calculate albedo as followed below.
75.262.2556.248.434.0202.1189.5031.0 RRRRRRR ++−+++−=α (N= 24, R2=0.77, MSE =0.0013) Where, R1…R7 = reflectance value of canal 1-7 MODIS surface reflectance Statistically, this model is significant until 77% with the albedo observation. MSE value is very small, and so that mean is the model have a small error. These albedo values used for calculate the net radiation in the surface. Figure 2 is the albedo 16 June 2004. In Figure 2 the spatial albedo in East Java showed in the urban, bare land and industrial area have highest value than the others. Comparison Estimated Air Temperature (Ta*) with the Observation (Ta) The comparison between estimated air temperature and the observation have a good result (Figure 3). The highest differences between Ta* and Ta is 1.4 °C and the lowest is 0.1 °C with N=12. The Coefficients Determination of the model is 0.77 with the mean square error (MSE) = 0.77 °C. Compare with the previous model, this model is better. Figure 4 is the spatial of air temperature on 16 June 2004 in East Java and Bali.
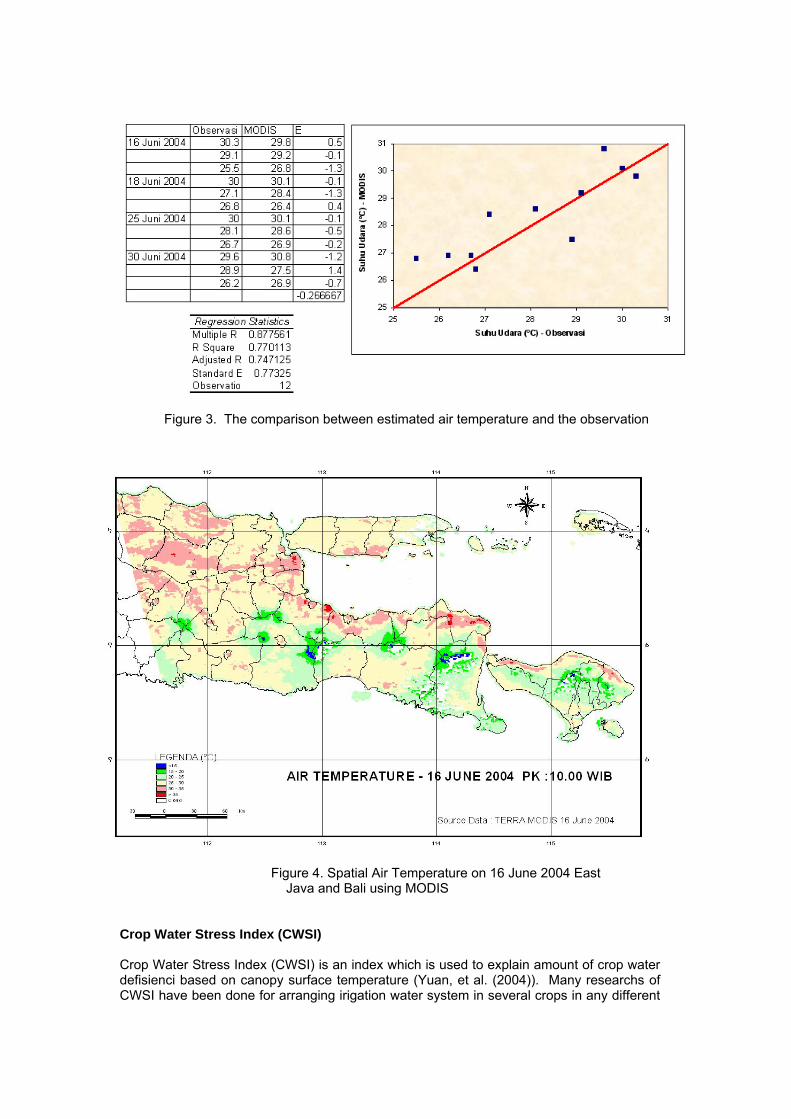
Figure 3. The comparison between estimated air temperature and the observation
Figure 4. Spatial Air Temperature on 16 June 2004 East
Java and Bali using MODIS Crop Water Stress Index (CWSI) Crop Water Stress Index (CWSI) is an index which is used to explain amount of crop water defisienci based on canopy surface temperature (Yuan, et al. (2004)). Many researchs of CWSI have been done for arranging irigation water system in several crops in any different
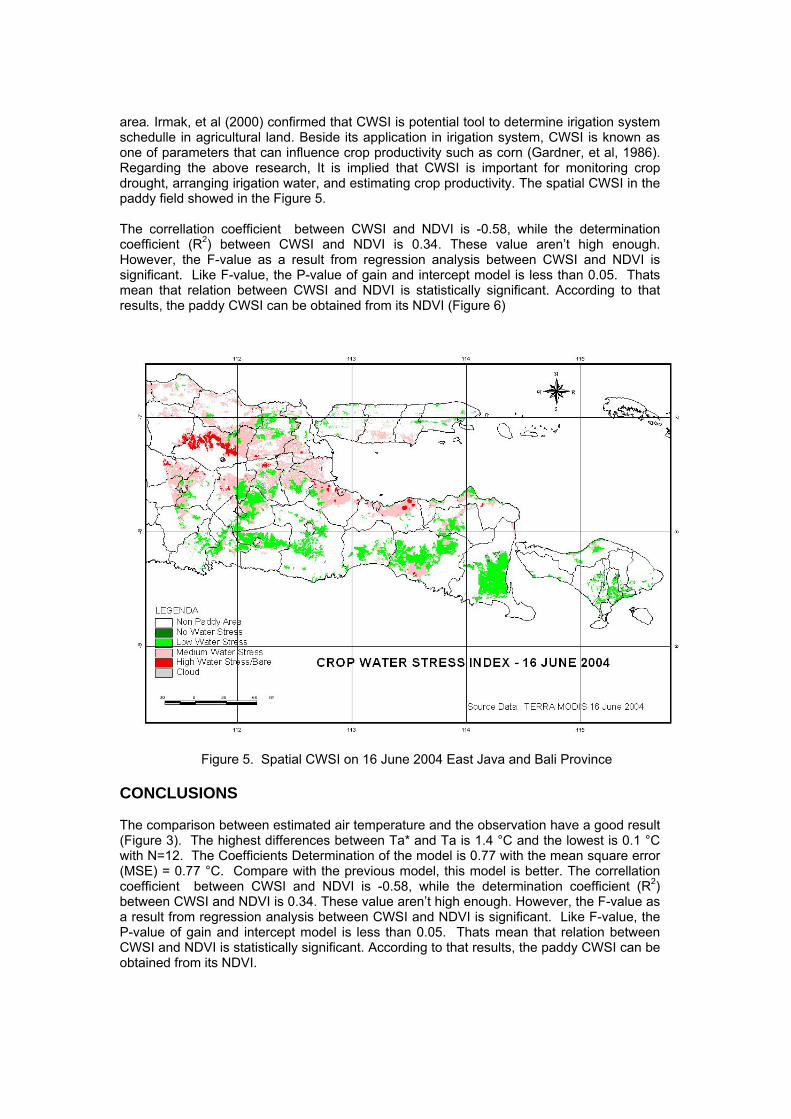
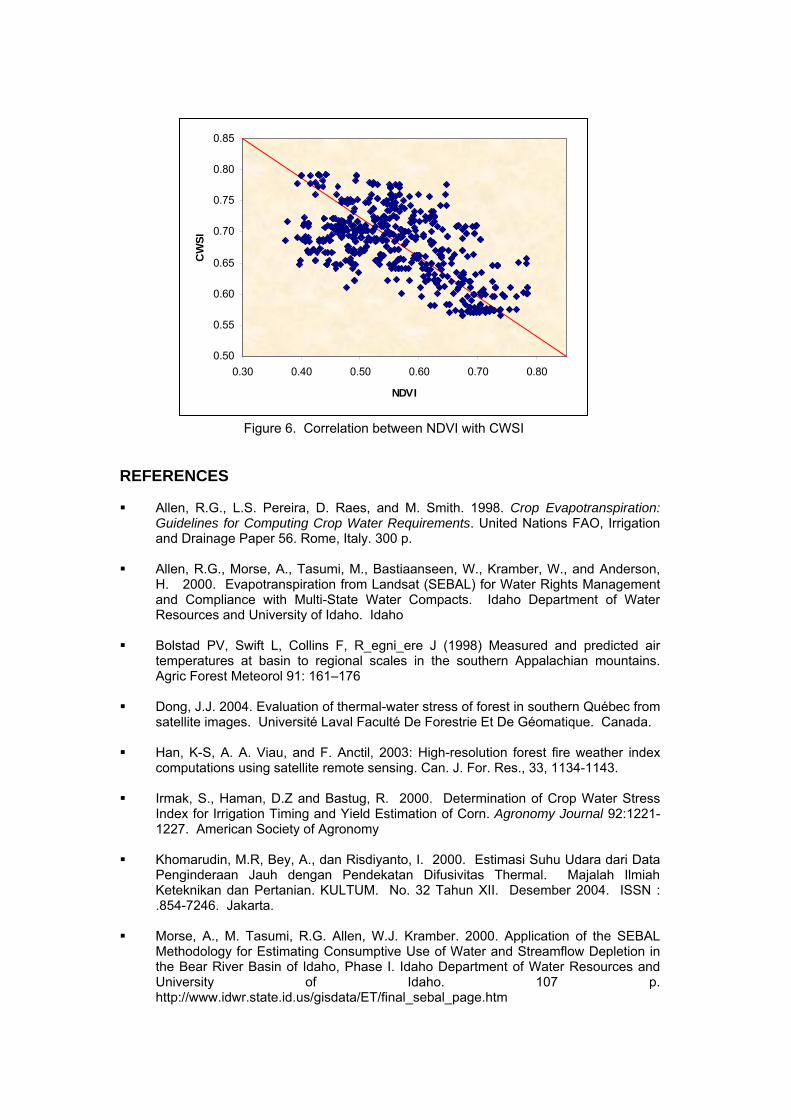
area. Irmak, et al (2000) confirmed that CWSI is potential tool to determine irigation system schedulle in agricultural land. Beside its application in irigation system, CWSI is known as one of parameters that can influence crop productivity such as corn (Gardner, et al, 1986). Regarding the above research, It is implied that CWSI is important for monitoring crop drought, arranging irigation water, and estimating crop productivity. The spatial CWSI in the paddy field showed in the Figure 5. The correllation coefficient between CWSI and NDVI is -0.58, while the determination coefficient (R2) between CWSI and NDVI is 0.34. These value aren’t high enough. However, the F-value as a result from regression analysis between CWSI and NDVI is significant. Like F-value, the P-value of gain and intercept model is less than 0.05. Thats mean that relation between CWSI and NDVI is statistically significant. According to that results, the paddy CWSI can be obtained from its NDVI (Figure 6)
Figure 5. Spatial CWSI on 16 June 2004 East Java and Bali Province
CONCLUSIONS The comparison between estimated air temperature and the observation have a good result (Figure 3). The highest differences between Ta* and Ta is 1.4 °C and the lowest is 0.1 °C with N=12. The Coefficients Determination of the model is 0.77 with the mean square error (MSE) = 0.77 °C. Compare with the previous model, this model is better. The correllation coefficient between CWSI and NDVI is -0.58, while the determination coefficient (R2) between CWSI and NDVI is 0.34. These value aren’t high enough. However, the F-value as a result from regression analysis between CWSI and NDVI is significant. Like F-value, the P-value of gain and intercept model is less than 0.05. Thats mean that relation between CWSI and NDVI is statistically significant. According to that results, the paddy CWSI can be obtained from its NDVI.
0.50
0.55
0.60
0.65
0.70
0.75
0.80
0.85
0.30 0.40 0.50 0.60 0.70 0.80
NDVI
CW
SI
Figure 6. Correlation between NDVI with CWSI
REFERENCES
Allen, R.G., L.S. Pereira, D. Raes, and M. Smith. 1998. Crop Evapotranspiration:
Guidelines for Computing Crop Water Requirements. United Nations FAO, Irrigation and Drainage Paper 56. Rome, Italy. 300 p.
Allen, R.G., Morse, A., Tasumi, M., Bastiaanseen, W., Kramber, W., and Anderson,
H. 2000. Evapotranspiration from Landsat (SEBAL) for Water Rights Management and Compliance with Multi-State Water Compacts. Idaho Department of Water Resources and University of Idaho. Idaho
Bolstad PV, Swift L, Collins F, R_egni_ere J (1998) Measured and predicted air
temperatures at basin to regional scales in the southern Appalachian mountains. Agric Forest Meteorol 91: 161–176
Dong, J.J. 2004. Evaluation of thermal-water stress of forest in southern Québec from
satellite images. Université Laval Faculté De Forestrie Et De Géomatique. Canada.
Han, K-S, A. A. Viau, and F. Anctil, 2003: High-resolution forest fire weather index computations using satellite remote sensing. Can. J. For. Res., 33, 1134-1143.
Irmak, S., Haman, D.Z and Bastug, R. 2000. Determination of Crop Water Stress
Index for Irrigation Timing and Yield Estimation of Corn. Agronomy Journal 92:1221-1227. American Society of Agronomy
Khomarudin, M.R, Bey, A., dan Risdiyanto, I. 2000. Estimasi Suhu Udara dari Data
Penginderaan Jauh dengan Pendekatan Difusivitas Thermal. Majalah Ilmiah Keteknikan dan Pertanian. KULTUM. No. 32 Tahun XII. Desember 2004. ISSN : .854-7246. Jakarta.
Morse, A., M. Tasumi, R.G. Allen, W.J. Kramber. 2000. Application of the SEBAL
Methodology for Estimating Consumptive Use of Water and Streamflow Depletion in the Bear River Basin of Idaho, Phase I. Idaho Department of Water Resources and University of Idaho. 107 p. http://www.idwr.state.id.us/gisdata/ET/final_sebal_page.htm

Sun, J.-F. Wang, R.-H. Zhang, R. R. Gillies, Y. Xue and Y.-C. Bo. 2004. Air
Temperature Retrieval From Remote Sensing Data Based On Thermodynamics. Theor. Appl. Climatol. 80, p. 37-48. Springer-Verlag. Austria.
Yuan, Guofu, Luo, Yi, Sun, Xiaomin., Tang , Dengyin. 2004. Evaluation of a crop
water stress index for detecting water stress in winter wheat in the North China Plain. Elsevier. Agricultural Water Management 64 (2004) 29–40

1
FLOOD ASSESSMENT ALONG RIVER KABUL USING MODIS DATA
Mateeul Haq and Rahmatullah Jilani Space & Atmospheric Science Division
Pakistan Space and Upper Atmosphere Research Commission (SUPARCO)
P.O. Box: 8402, Karachi-75270, Fax: 021-4644928 Email: [email protected] & [email protected]
ABSTRACT Northern mountains of Pakistan received a 30 years record snow fall in the month of February 2005. This was followed by a heat wave in third week of June 2005 which caused snowmelt and consequent stream runoff causing flooding in river Kabul. Low lying areas in the districts of Charsadda, Noshehra and Peshawar in NWFP province were inundated and remained flooded for at least two months. The River Kabul is mainly snow fed originating from the Unai pass of the southern Hindukush range. Satellite images (MODIS onboard Terra/Aqua satellites) pertaining to pre and post-flooding periods have been processed using ER Mapper software for quantitative assessment of flood inundation. Approximately 140 sq km (excluding the normal flow area which is 18 sq km) has been estimated to be affected by flood inundation in Charsadda, Noshehra and Peshawar. It has been analyzed that River Swat, which originates from Hindukush range and passes through Swat, Malakand and Charsadda districts, is one of the main contributors of flooding at the point where it joins river Kabul. This analysis has been possible due to the synoptic coverage of multi-temporal satellite images which enabled visualization of the land features and associated dynamic phenomena. Construction of the proposed Munda Dam and Kalam Dam on River Swat, and increase in the storage capacity of Warsak Dam will help to avoid flooding along the low lying areas of river Kabul.
Introduction
Flood is actually accumulation of too much water at the wrong place. Among the trigger mechanisms are dam or levee failures; more rain than the landscape can dispose off; the torrential rains; tsunamis; ocean storm surges; rapid snow melts; ice floes etc. Flooding is generally defined as any abnormal high stream flow that overtops the natural or artificial banks of a stream. Flooding is a natural characteristic of rivers. If more runoff is generated than the banks of a stream channel can accommodate, the water will overtop the stream banks and spread over the floodplain. Of all the disasters except droughts, flood disasters affect the most. In fact, flooding is one of natural hazards that are becoming a greater threat for the man kind. It is a universal kind of natural hazards which occurs almost on each continent and is a potential threat wherever there is rainfall or snowmelt runoff. The most noted floods are associated with the world's great rivers. However, the lesser floods on smaller rivers or tributaries may cause cumulatively more damage, but receives less public attention.
Remote Sensing Monitoring
2
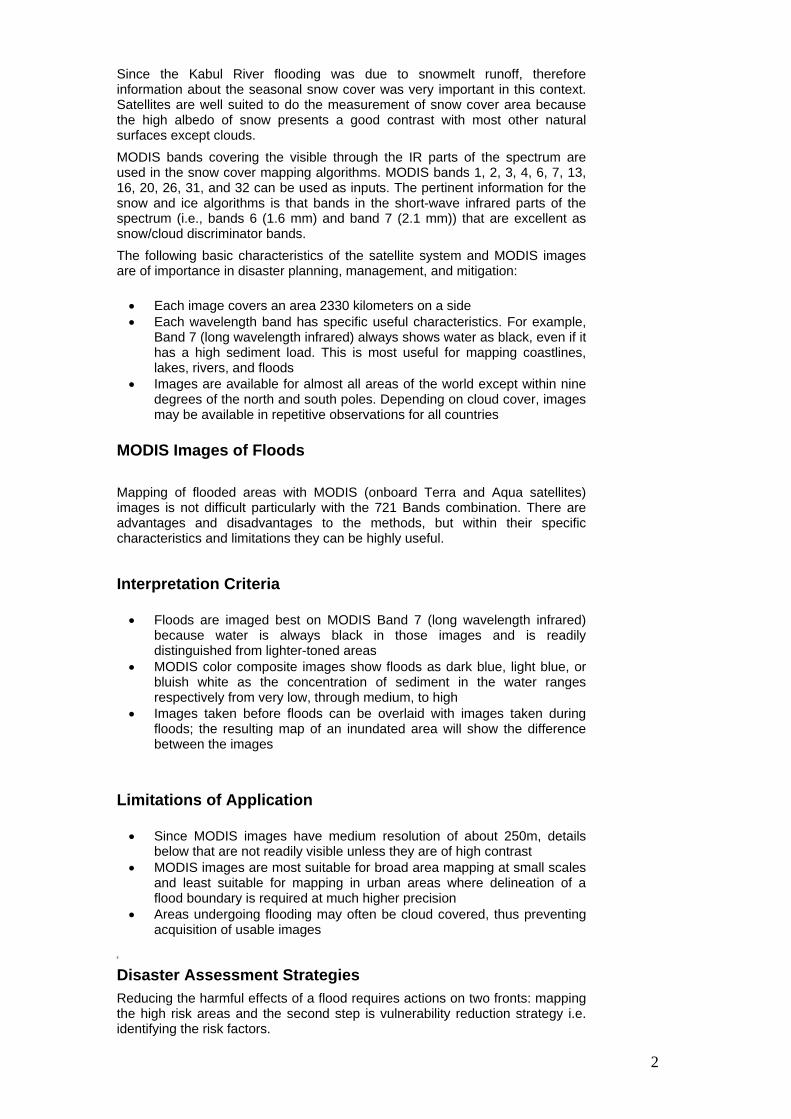
Since the Kabul River flooding was due to snowmelt runoff, therefore information about the seasonal snow cover was very important in this context. Satellites are well suited to do the measurement of snow cover area because the high albedo of snow presents a good contrast with most other natural surfaces except clouds. MODIS bands covering the visible through the IR parts of the spectrum are used in the snow cover mapping algorithms. MODIS bands 1, 2, 3, 4, 6, 7, 13, 16, 20, 26, 31, and 32 can be used as inputs. The pertinent information for the snow and ice algorithms is that bands in the short-wave infrared parts of the spectrum (i.e., bands 6 (1.6 mm) and band 7 (2.1 mm)) that are excellent as snow/cloud discriminator bands. The following basic characteristics of the satellite system and MODIS images are of importance in disaster planning, management, and mitigation:
• Each image covers an area 2330 kilometers on a side • Each wavelength band has specific useful characteristics. For example,
Band 7 (long wavelength infrared) always shows water as black, even if it has a high sediment load. This is most useful for mapping coastlines, lakes, rivers, and floods
• Images are available for almost all areas of the world except within nine degrees of the north and south poles. Depending on cloud cover, images may be available in repetitive observations for all countries
MODIS Images of Floods
Mapping of flooded areas with MODIS (onboard Terra and Aqua satellites) images is not difficult particularly with the 721 Bands combination. There are advantages and disadvantages to the methods, but within their specific characteristics and limitations they can be highly useful.
Interpretation Criteria
• Floods are imaged best on MODIS Band 7 (long wavelength infrared) because water is always black in those images and is readily distinguished from lighter-toned areas
• MODIS color composite images show floods as dark blue, light blue, or bluish white as the concentration of sediment in the water ranges respectively from very low, through medium, to high
• Images taken before floods can be overlaid with images taken during floods; the resulting map of an inundated area will show the difference between the images
Limitations of Application
• Since MODIS images have medium resolution of about 250m, details below that are not readily visible unless they are of high contrast
• MODIS images are most suitable for broad area mapping at small scales and least suitable for mapping in urban areas where delineation of a flood boundary is required at much higher precision
• Areas undergoing flooding may often be cloud covered, thus preventing acquisition of usable images
[[
Disaster Assessment Strategies Reducing the harmful effects of a flood requires actions on two fronts: mapping the high risk areas and the second step is vulnerability reduction strategy i.e. identifying the risk factors.

3
The first step in vulnerability reduction for human settlements is to identify the high-risk areas. This is done by relating a natural hazard, such as a flood, to the terrain and to the probability that such an event will occur. This activity is known as risk mapping. Flood risk mapping, for example, would indicate the areas likely to be covered by water during floods of given magnitude.
The second step is vulnerability reduction strategy consisting of construction/expansion of new dams to store/control the over flow of water in rivers hence reducing the chances of riverine flooding.
Case Study
The objectives of the study are:
Assessment of flooding along river Kabul Mapping of high risk areas Identification of high risk factors Identifying vulnerability reduction strategies
Methodology Quantitative assessment of area under snow and related river-runoff and flood inundation to analyze the temporal variations in temperature and snowfall in the northern mountainous areas of Pakistan basically involved estimation of snow covered areas based on remote sensing data. For this purpose, Moderate Resolution Imaging Spectrometer (MODIS) data, onboard Terra/Aqua satellites, with spatial resolution 250m has been used both for snow cover and flooded area estimation. For precise assessment of area under snow and flood, geometric correction of all images (including images of snow periods) was performed aiming at obtaining comparable and super-imposable images. Several algorithms of change detection, based on ratios and differences between channels (radiometry) of Multi-temporal data, were tested, in order to produce a map of damage assessment; the flooded area has been delineated and demarcated using visual interpretation supported by ER Mapper software. Geo-referencing is in-fact a process that establishes relationship between images coordinates (row and column numbers of the pixels) and the corresponding coordinates on the earth’s surface. Rectification process uses GCPs to transform the geometry of an image so that each pixel corresponds to a position in a real world coordinate system (such as Latitude/Longitude or Eastings/Northings). A ground control point (GCP) is a point on the earth's surface where both image coordinates (measured in rows and columns) and map coordinates (measured in degrees of latitude and longitude, meters, or feet) can be identified. The study also involved change detection through multi-temporal datasets to analyze the possible causes and magnitude of change. In ER Mapper, an algorithm that enables selection of two satellite images and assesses the quantitative change in spatial context was used. Obviously, for such a change monitoring, both the images are required to be co-registered and have the same datum and projection. This is most likely to be useful in cases where there is a large and consistent difference between the pixel values corresponding to the feature of interest and those corresponding to the background are desirable. Another approach to change detection using two or more (geometrically registered) images is to combine the images into a single image. This combined image was then analyzed and digitized for getting various statistical data including snow covered and flooded areas. The general term for this approach is composite analysis.

Analysis Northern Pakistan saw its heaviest snowfall in 30 years, the worst of it coming during the first two weeks of February 2005. The heavy snow devastated the countries in the region including Pakistan, Afghanistan, and India. Pakistan Space and Upper Atmosphere Research Commission (SUPARCO) monitored the extent of snow cover through satellite images. In comparison to the year 2004, there has been a marked increase in snow covered area in 2005. The increase in extent of snow in the entire image has been estimated to be 15,000/- sq km (image-1).
Image-1 As far as Abbottabad district and surroundings is concerned, while in 2004 area under snow is quite negligible, where as in 2005 the same is estimated to be 624 Sq Km (image-2). The above analyses were also performed using images pertaining to May in 2004, 2005 and 2006 respectively.
Image-2: Snow cover area in magenta color in Abottabad district and adjoining areas under the yellow closed polygon has been calculated to be 624 sq km
4
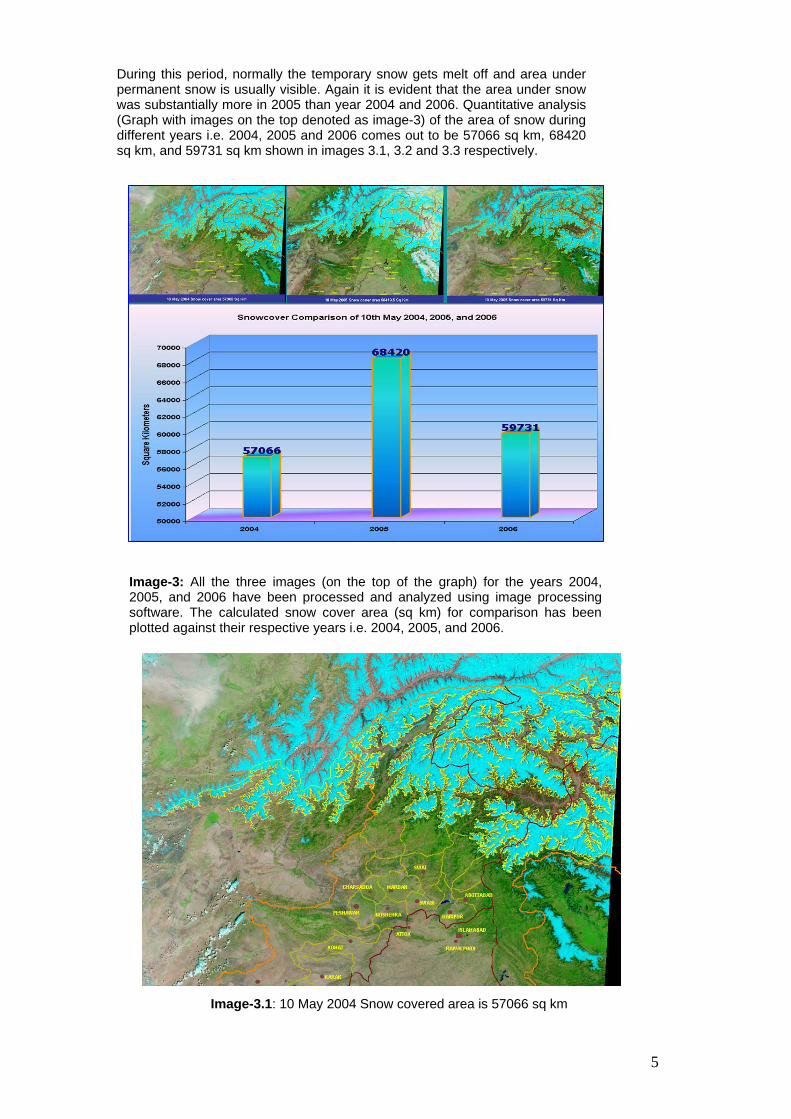
During this period, normally the temporary snow gets melt off and area under permanent snow is usually visible. Again it is evident that the area under snow was substantially more in 2005 than year 2004 and 2006. Quantitative analysis (Graph with images on the top denoted as image-3) of the area of snow during different years i.e. 2004, 2005 and 2006 comes out to be 57066 sq km, 68420 sq km, and 59731 sq km shown in images 3.1, 3.2 and 3.3 respectively.
Image-3: All the three images (on the top of the graph) for the years 2004, 2005, and 2006 have been processed and analyzed using image processing software. The calculated snow cover area (sq km) for comparison has been plotted against their respective years i.e. 2004, 2005, and 2006.
Image-3.1: 10 May 2004 Snow covered area is 57066 sq km
5
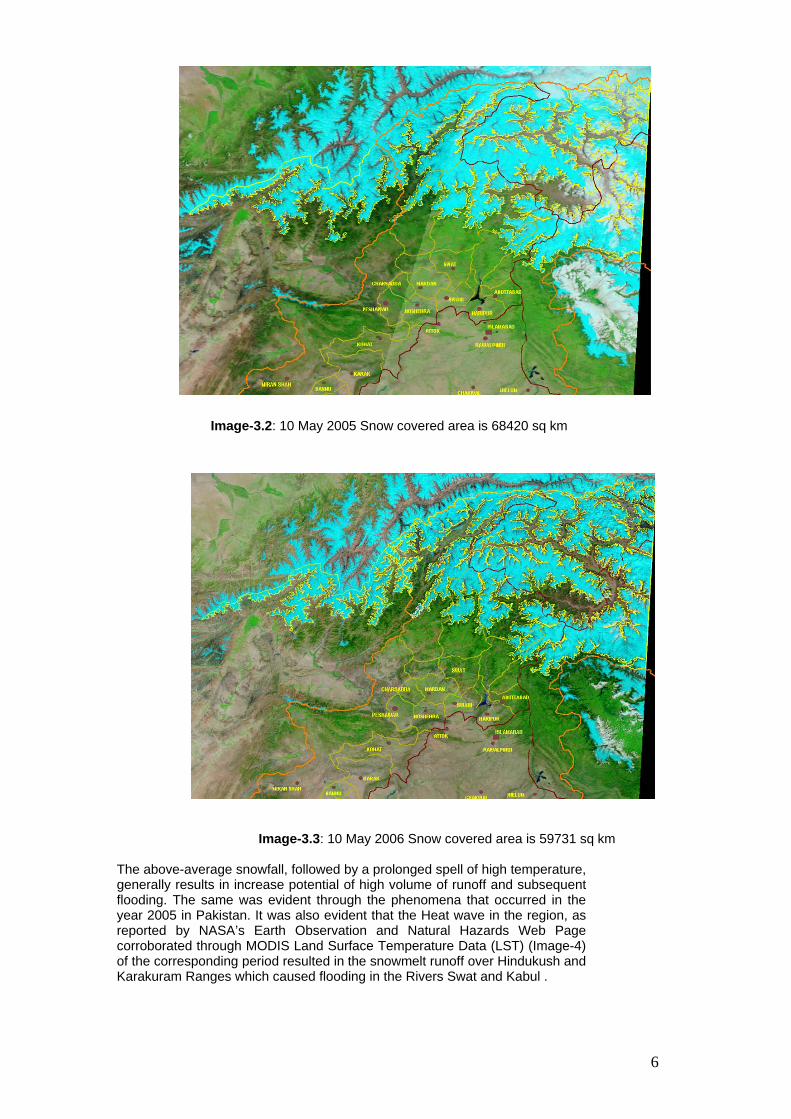
Image-3.2: 10 May 2005 Snow covered area is 68420 sq km
Image-3.3: 10 May 2006 Snow covered area is 59731 sq km
The above-average snowfall, followed by a prolonged spell of high temperature, generally results in increase potential of high volume of runoff and subsequent flooding. The same was evident through the phenomena that occurred in the year 2005 in Pakistan. It was also evident that the Heat wave in the region, as reported by NASA’s Earth Observation and Natural Hazards Web Page corroborated through MODIS Land Surface Temperature Data (LST) (Image-4) of the corresponding period resulted in the snowmelt runoff over Hindukush and Karakuram Ranges which caused flooding in the Rivers Swat and Kabul .
6
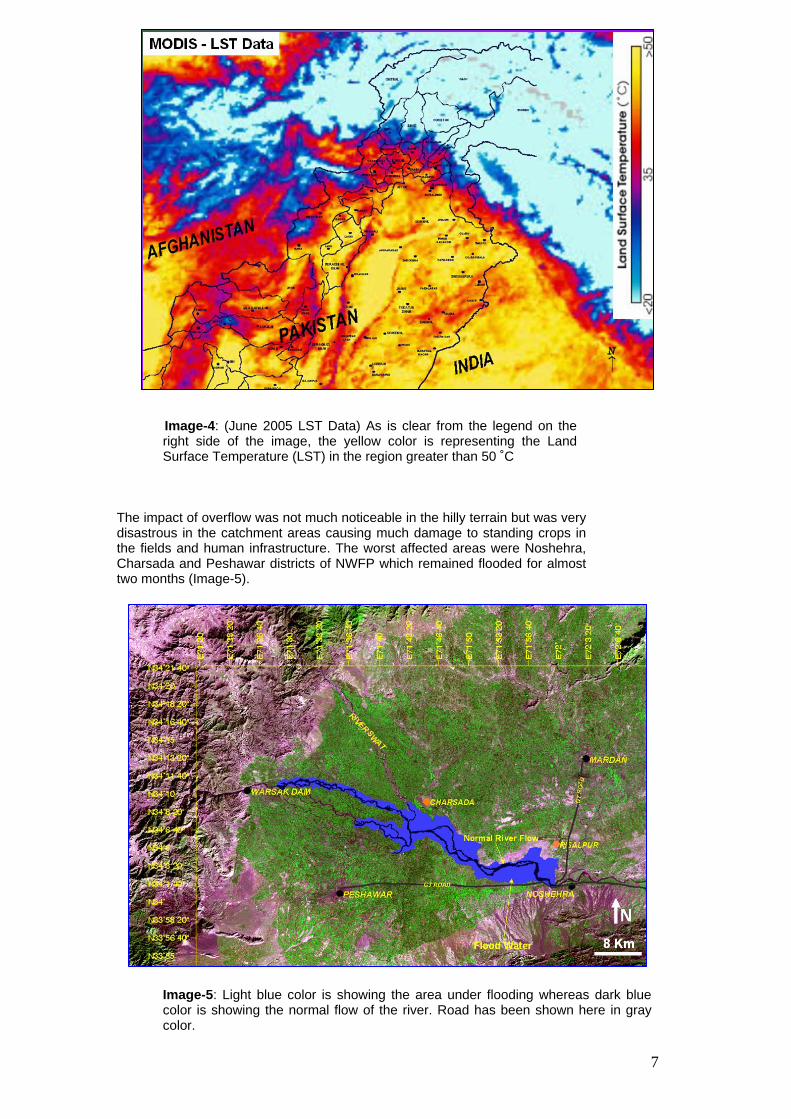
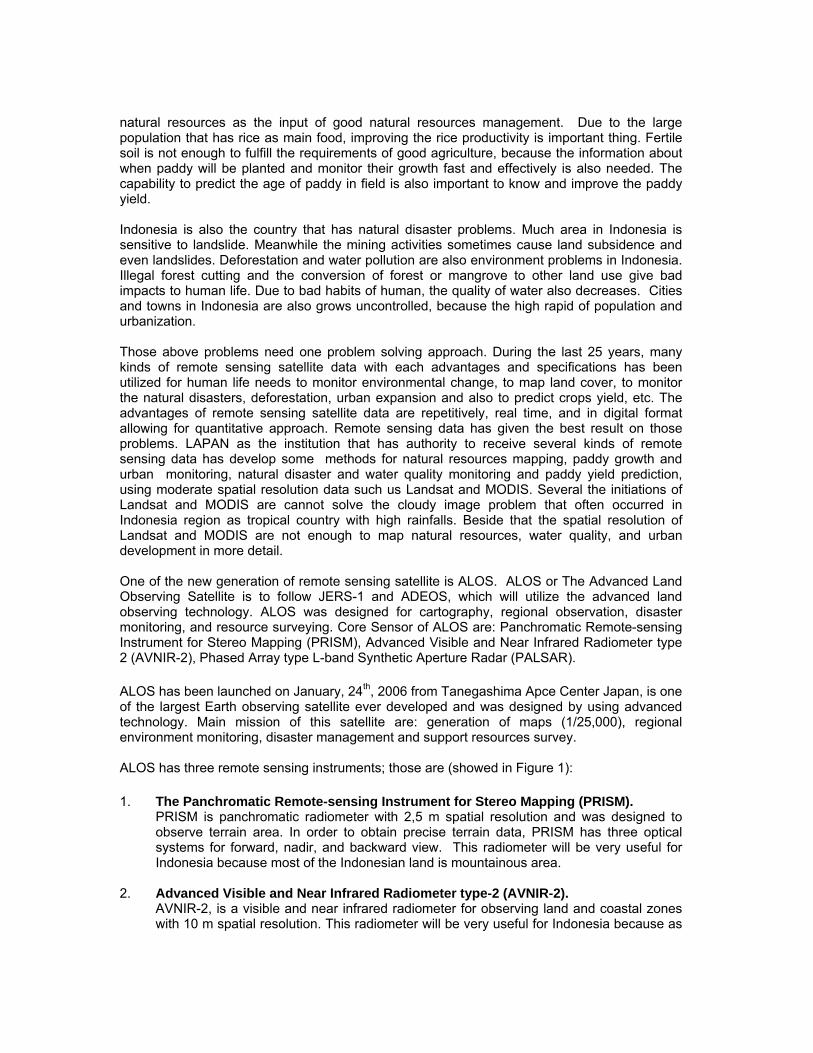
Image-4: (June 2005 LST Data) As is clear from the legend on the right side of the image, the yellow color is representing the Land Surface Temperature (LST) in the region greater than 50 ˚C
The impact of overflow was not much noticeable in the hilly terrain but was very disastrous in the catchment areas causing much damage to standing crops in the fields and human infrastructure. The worst affected areas were Noshehra, Charsada and Peshawar districts of NWFP which remained flooded for almost two months (Image-5).
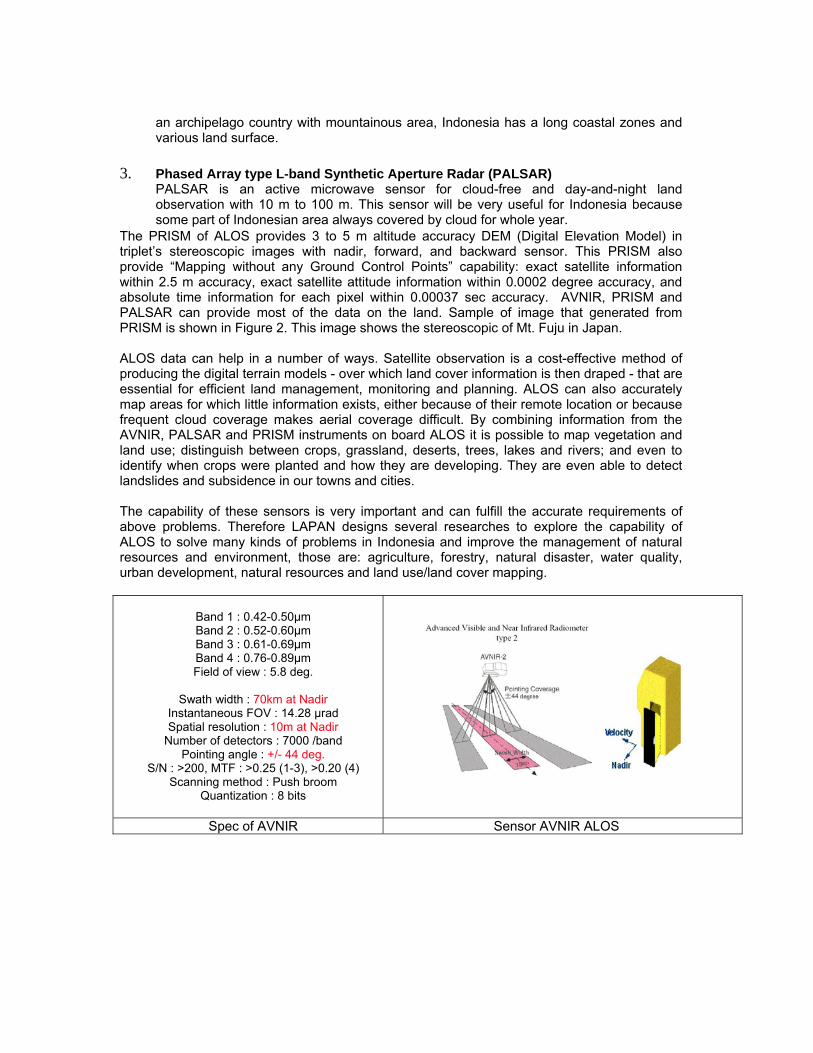
Image-5: Light blue color is showing the area under flooding whereas dark blue color is showing the normal flow of the river. Road has been shown here in gray color.
7

8
Severity of flooding remained at the confluence of Kabul and Swat Rivers and 30 km after the confluence. The river Kabul was in high flood at Nowshera with a discharge of 139,800 cusecs as compared with 23,900 cusecs during normal flow. The closed polygon in light blue color shows the flooded area measurement about 140 Sq Km (Excluding the normal flow area shown in dark blue color which is 18 sq km) (Image-5).
Conclusions & Recommendations
Multi-temporal remote sensing data has been found as a valuable tool for quantitative assessment of changes taking place in a spatial context. With the help of relevant supporting/ ancillary data a variety of information can be extracted to serve operational applications, replacing the primitive methods which are laborious, time taking, in efficient and some time lack accuracies. Medium resolution satellite data have been used in the study. High resolution data together with more enhanced image processing capabilities will be utilized in future studies. New methodologies can be developed employing precise DEM/DTM together with ground based parameters pertaining to the precise volume of snow melt-off and its corresponding river run-off. Suitable models will be developed for precise assessment required operational needs. As far as analysis of flood inundation due to snow fall and corresponding river runoff is concerned, there are a variety of factors that are required to be taken in consideration for such investigations. These factors may include, but are not limited to the following:
Developing database of flood risk zones Developing suitable models to assess flood inundation due to snowmelt
and/or heavy rains Develop database of relevant meteorological parameters as well as
historic flood events Study impacts of different manmade irrigation systems including
dams/reservoirs Make quantitative assessment of sediment load coming down to rivers,
dams, reservoirs Develop database of urban settlements and other infrastructure
Acknowledgement The authors are indebted to Dr. Badar Ghauri for his kind help in preparation of this paper. Acknowledgments are also due to Mr. Khliquzzaman and Mr. Javed Iqbal for their assistance in data acquisition and processing. References NASA’s MODIS Rapid Response System , MODIS subsets of the study area.

INDONESIA ALOS PILOT PROJECT COOPERATION BETWEEN LAPAN AND JAXA, FOR SOME
APPLICATIONS
Ita Carolita* , Mawardi Nur**, Arum T*National Institute of Aeronautics and Space (LAPAN), INDONESIA
ABSTRACT
Since the end of operational JERS-1 satellite in 1998, Japan had designed new earth observing satellite which based on mission of the previous satellite JERS-1. This new satellite was known as ALOS (Advanced Land Observation Satellite). For the operational it has accomplished with three sensors: PRISM (The Panchromatic Remote Sensing Instrument for Stereo Mapping) that designed for terrain observation with 2.5 m spatial resolution, AVNIR (Advanced Visible and Near Infrared Radiometer type-2) that can observed coastal zone at 10 m resolution and PALSAR (Phased Array type L-Band Synthetic Aperture Radar) that able to observe in day and night. LAPAN as authorized government institute has an obligation to develop the updated remote sensing technologies and GIS data application as well as to overspread these applications to related users. Furthermore for this continuity of project between Indonesia-Japan, JAXA has pointed LAPAN as authorized institute to coordinate the research that designed by related agencies who are interested who are interested in ALOS application. These cooperation expectations are: 1. to build strong network between LAPAN and related agencies 2. Get as many as valuable results to apply in various sectors from ALOS applications. 3. Improve and develop the knowledge on RS technology. The research topics that will be conducted for 3 years are below: (The Pilot Project of Utilization by Using The Advanced Land Observation Satellite): 1. Space map for Jakarta and Papua (by LAPAN and BAKOSURTANAL) 2. Forestry Application (by LAPAN and Ministry of Forestry) 3. Natural Resources Mapping (by LAPAN and Ministry of Mineral and Energy Resources) 4. Natural Disaster in Agriculture field (by LAPAN and Ministry of Agriculture) 5. Coastal Natural Resources Mapping (by LAPAN and CreSOS) 6. Land Use, Land Cover and Land Terrain Change (by LAPAN and Bogor Agricultural University and Syiah Kuala University) INTRODUCTION
Background and Reasonable Indonesia is the large country that has various kinds of natural resources, both in the land and in the sea. As an archipelago country and lies at tropical region, Indonesia is known as rich country with large tropical forest, fertile soil for agriculture and plantation, oil and many kinds of mineral resources, also coastal and marine resources. Therefore, it is necessary to map those
natural resources as the input of good natural resources management. Due to the large population that has rice as main food, improving the rice productivity is important thing. Fertile soil is not enough to fulfill the requirements of good agriculture, because the information about when paddy will be planted and monitor their growth fast and effectively is also needed. The capability to predict the age of paddy in field is also important to know and improve the paddy yield. Indonesia is also the country that has natural disaster problems. Much area in Indonesia is sensitive to landslide. Meanwhile the mining activities sometimes cause land subsidence and even landslides. Deforestation and water pollution are also environment problems in Indonesia. Illegal forest cutting and the conversion of forest or mangrove to other land use give bad impacts to human life. Due to bad habits of human, the quality of water also decreases. Cities and towns in Indonesia are also grows uncontrolled, because the high rapid of population and urbanization. Those above problems need one problem solving approach. During the last 25 years, many kinds of remote sensing satellite data with each advantages and specifications has been utilized for human life needs to monitor environmental change, to map land cover, to monitor the natural disasters, deforestation, urban expansion and also to predict crops yield, etc. The advantages of remote sensing satellite data are repetitively, real time, and in digital format allowing for quantitative approach. Remote sensing data has given the best result on those problems. LAPAN as the institution that has authority to receive several kinds of remote sensing data has develop some methods for natural resources mapping, paddy growth and urban monitoring, natural disaster and water quality monitoring and paddy yield prediction, using moderate spatial resolution data such us Landsat and MODIS. Several the initiations of Landsat and MODIS are cannot solve the cloudy image problem that often occurred in Indonesia region as tropical country with high rainfalls. Beside that the spatial resolution of Landsat and MODIS are not enough to map natural resources, water quality, and urban development in more detail. One of the new generation of remote sensing satellite is ALOS. ALOS or The Advanced Land Observing Satellite is to follow JERS-1 and ADEOS, which will utilize the advanced land observing technology. ALOS was designed for cartography, regional observation, disaster monitoring, and resource surveying. Core Sensor of ALOS are: Panchromatic Remote-sensing Instrument for Stereo Mapping (PRISM), Advanced Visible and Near Infrared Radiometer type 2 (AVNIR-2), Phased Array type L-band Synthetic Aperture Radar (PALSAR). ALOS has been launched on January, 24 , 2006 from Tanegashima Apce Center Japan, is one of the largest Earth observing satellite ever developed and was designed by using advanced technology.
th
Main mission of this satellite are: generation of maps (1/25,000), regional environment monitoring, disaster management and support resources survey. ALOS has three remote sensing instruments; those are (showed in Figure 1): 1. The Panchromatic Remote-sensing Instrument for Stereo Mapping (PRISM). PRISM is panchromatic radiometer with 2,5 m spatial resolution and was designed to
observe terrain area. In order to obtain precise terrain data, PRISM has three optical systems for forward, nadir, and backward view. This radiometer will be very useful for Indonesia because most of the Indonesian land is mountainous area.
2. Advanced Visible and Near Infrared Radiometer type-2 (AVNIR-2). AVNIR-2, is a visible and near infrared radiometer for observing land and coastal zones
with 10 m spatial resolution. This radiometer will be very useful for Indonesia because as
an archipelago country with mountainous area, Indonesia has a long coastal zones and various land surface.
3. Phased Array type L-band Synthetic Aperture Radar (PALSAR) PALSAR is an active microwave sensor for cloud-free and day-and-night land
observation with 10 m to 100 m. This sensor will be very useful for Indonesia because some part of Indonesian area always covered by cloud for whole year.
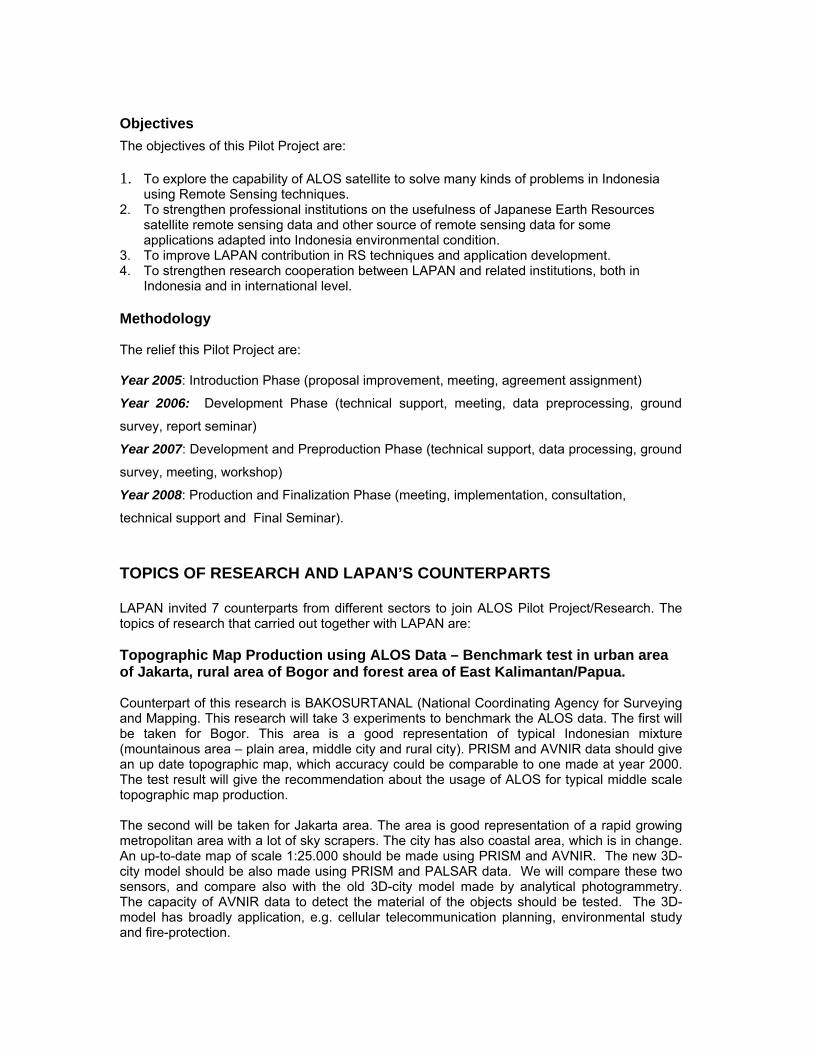
The PRISM of ALOS provides 3 to 5 m altitude accuracy DEM (Digital Elevation Model) in triplet’s stereoscopic images with nadir, forward, and backward sensor. This PRISM also provide “Mapping without any Ground Control Points” capability: exact satellite information within 2.5 m accuracy, exact satellite attitude information within 0.0002 degree accuracy, and absolute time information for each pixel within 0.00037 sec accuracy. AVNIR, PRISM and PALSAR can provide most of the data on the land. Sample of image that generated from PRISM is shown in Figure 2. This image shows the stereoscopic of Mt. Fuju in Japan. ALOS data can help in a number of ways. Satellite observation is a cost-effective method of producing the digital terrain models - over which land cover information is then draped - that are essential for efficient land management, monitoring and planning. ALOS can also accurately map areas for which little information exists, either because of their remote location or because frequent cloud coverage makes aerial coverage difficult. By combining information from the AVNIR, PALSAR and PRISM instruments on board ALOS it is possible to map vegetation and land use; distinguish between crops, grassland, deserts, trees, lakes and rivers; and even to identify when crops were planted and how they are developing. They are even able to detect landslides and subsidence in our towns and cities. The capability of these sensors is very important and can fulfill the accurate requirements of above problems. Therefore LAPAN designs several researches to explore the capability of ALOS to solve many kinds of problems in Indonesia and improve the management of natural resources and environment, those are: agriculture, forestry, natural disaster, water quality, urban development, natural resources and land use/land cover mapping.
Band 1 : 0.42-0.50μm Band 2 : 0.52-0.60μm Band 3 : 0.61-0.69μm Band 4 : 0.76-0.89μm Field of view : 5.8 deg.
Swath width : 70km at Nadir
Instantaneous FOV : 14.28 μrad Spatial resolution : 10m at Nadir
Number of detectors : 7000 /band Pointing angle : +/- 44 deg.
S/N : >200, MTF : >0.25 (1-3), >0.20 (4) Scanning method : Push broom
Quantization : 8 bits
Spec of AVNIR Sensor AVNIR ALOS
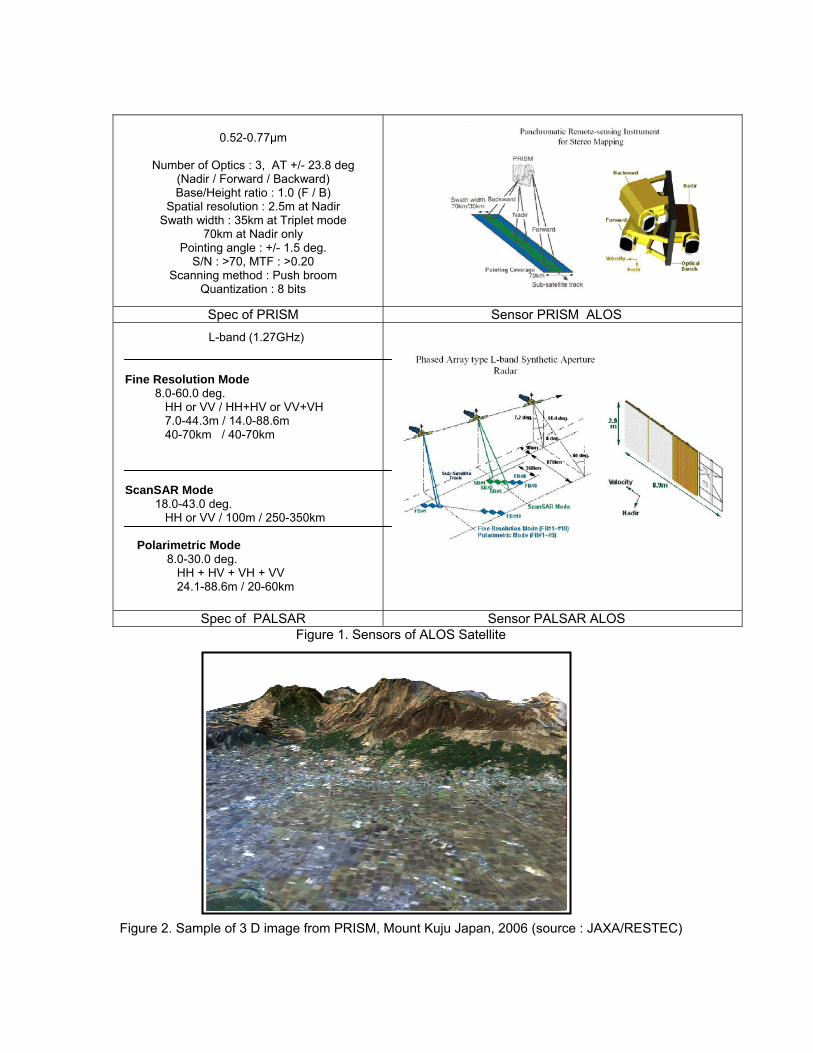
0.52-0.77μm
Number of Optics : 3, AT +/- 23.8 deg
(Nadir / Forward / Backward) Base/Height ratio : 1.0 (F / B)
Spatial resolution : 2.5m at Nadir Swath width : 35km at Triplet mode
70km at Nadir only Pointing angle : +/- 1.5 deg.
S/N : >70, MTF : >0.20 Scanning method : Push broom
Quantization : 8 bits
Spec of PRISM Sensor PRISM ALOS
Spec of PALSAR Sensor PALSAR ALOS
L-band (1.27GHz)
Fine Resolution Mode 8.0-60.0 deg. HH or VV / HH+HV or VV+VH 7.0-44.3m / 14.0-88.6m 40-70km / 40-70km
ScanSAR Mode 18.0-43.0 deg. HH or VV / 100m / 250-350km
Polarimetric Mode 8.0-30.0 deg. HH + HV + VH + VV 24.1-88.6m / 20-60km
Figure 1. Sensors of ALOS Satellite
Figure 2. Sample of 3 D image from PRISM, Mount Kuju Japan, 2006 (source : JAXA/RESTEC)
Objectives The objectives of this Pilot Project are: 1. To explore the capability of ALOS satellite to solve many kinds of problems in Indonesia
using Remote Sensing techniques. 2. To strengthen professional institutions on the usefulness of Japanese Earth Resources
satellite remote sensing data and other source of remote sensing data for some applications adapted into Indonesia environmental condition.
3. To improve LAPAN contribution in RS techniques and application development. 4. To strengthen research cooperation between LAPAN and related institutions, both in
Indonesia and in international level. Methodology The relief this Pilot Project are: Year 2005: Introduction Phase (proposal improvement, meeting, agreement assignment)
Year 2006: Development Phase (technical support, meeting, data preprocessing, ground
survey, report seminar)
Year 2007: Development and Preproduction Phase (technical support, data processing, ground
survey, meeting, workshop)
Year 2008: Production and Finalization Phase (meeting, implementation, consultation,
technical support and Final Seminar).
TOPICS OF RESEARCH AND LAPAN’S COUNTERPARTS
LAPAN invited 7 counterparts from different sectors to join ALOS Pilot Project/Research. The topics of research that carried out together with LAPAN are:
Topographic Map Production using ALOS Data – Benchmark test in urban area of Jakarta, rural area of Bogor and forest area of East Kalimantan/Papua. Counterpart of this research is BAKOSURTANAL (National Coordinating Agency for Surveying and Mapping. This research will take 3 experiments to benchmark the ALOS data. The first will be taken for Bogor. This area is a good representation of typical Indonesian mixture (mountainous area – plain area, middle city and rural city). PRISM and AVNIR data should give an up date topographic map, which accuracy could be comparable to one made at year 2000. The test result will give the recommendation about the usage of ALOS for typical middle scale topographic map production. The second will be taken for Jakarta area. The area is good representation of a rapid growing metropolitan area with a lot of sky scrapers. The city has also coastal area, which is in change. An up-to-date map of scale 1:25.000 should be made using PRISM and AVNIR. The new 3D-city model should be also made using PRISM and PALSAR data. We will compare these two sensors, and compare also with the old 3D-city model made by analytical photogrammetry. The capacity of AVNIR data to detect the material of the objects should be tested. The 3D-model has broadly application, e.g. cellular telecommunication planning, environmental study and fire-protection.
The third experiment should be production of topographic map 1:50.000 for a selected area in East Kalimantan and/or Papua where the larger area are dominated by forest and the sky is oftener cloudy. In East Kalimantan, the benchmark could be the existing topographic maps made by photogrammetry and additional data from airborne interferometric SAR, SRTM, LANDSAT-TM and ASTER. In Papua, the benchmark could be only DEM of SRTM or older map produced by Indonesian Army (DITTOP-AD). The area is a good representation of ever-cloudy area. East Kalimantan (Berau County) would be good representation of jungle in plain and marsh area, while Papua (Timika County) is good representation of jungle in mountainous area. In all test area, there are enough GPS Ground Control Points already. Definitive area should be selected after a complete path-row-index of ALOS received. This research has objectives to test the capability of several sensors of ALOS comprehensively, especially in mapping with more concerned in geometrical aspect. Assessment of Land Degradation and Mass Movement Using ALOS Satellite Data Counterpart of this research is Indonesian Soil Research Institute (ISORI), Soil and Agroclimate Research and Development, Ministry of Agriculture. This research carried out as an answer in solving of land degradation and mass movement troubles in Indonesia. The study area of this research is Citarum watershed – West Java. This research has objectives to investigate ALOS with 3 sensors in disaster management mainly for land degradation and mass movement. AVNIR will be used to classify land use and vegetation covering the area, PRISM and PALSAR will be used to generate DEM as one of main parameters in land slide assessment, PALSAR also will be used to investigate soil moisture and land surface characteristics as main parameters too. Integration of these parameters in GIS will result spatial information of the level and intensity of land degradation and mass movement. This information is very essential task for saving human life, natural resources and its saving human life, natural resources and its anticipation. Furthermore, detail information about suffered areas by its hazard needed to know, according location of land and human life that need rehabilitation. Development of Algorithms for Coastal Zone Management and Vessels Monitoring Using ALOS Data Counterpart of this research is CreSos (Center for Remote Sensing and Ocean Science).This research will be conducted as an answer of a needed of remote sensing capability in coastal management in Indonesia –a largest archipelago nation. The area study of this research is Bali and Surabaya seas – East Java. Bali is known has large mangrove forest and enormous coral reef areas. On the other hand Surabaya has a port with high vessels mobilization and has industrial area. Changes of mangrove and coral reef needed to monitoring, as well ass water quality and vessels mobilization. Study about coral reef will be conducted by adaptation of Lyzenga formula by using optic sensor (in this case using AVNIR). Study about mangrove will be conducted by using AVNIR and PALSAR-related with radar multipolarization. Water quality will be investigated using AVNIR. Modeling For Natural Resources Mapping Counterpart of this research is Geology Development and Research Centre, Ministry of Energy & Mineral Resources (DESDM). This research was conducted because Indonesia is the largest rich country with many kind mineral resources. Therefore it’s necessary to map natural resources as consideration for resource management. PALSAR and PRISM are the ALOS’s sensors that will be used in investigate more detail and accurate geology structures as indicators of oil and mineral sources place.
Land Use, Land Cover and Terrain Changes in Nanggroe Aceh Darussalam, Indonesia Counterparts of this research are GIS & Remote Sensing Center - Syiah Kuala University, Banda Aceh and Regional Development Study Center, Bogor Agricultural University (IPB). A devastating earthquake of high magnitude has occurred on December 26th, 2004 off the west coast of Sumatera, Indonesia. Mostly transportation infrastructures, buildings were destroyed as well as paddy fields and mangrove forests. The accurate information of actual land cover condition and its changes as well as information of terrain and soil characteristics are important for decision maker to rebuild Aceh. AVNIR of ALOS is the suitable choice to detect land use changes and land cover accurately and effectively. The other hand PALSAR of ALOS suitable for detect soil character as well as terrain. PRISM of ALOS is also will be used to compare the terrain that generated from PALSAR Interferometry. Application of ALOS Satellite Imagery For Indonesian Forest Resources Monitoring Counterpart of this research is Center for Forestry Mapping, Ministry of Forestry. This research was proposed as an answer about the technology needed in monitoring of forest resources including forest density changes, wood potential estimation, illegal logging. ALOS has 3 instruments including PRISM that can generate elevation map, AVNIR that can observes land cover precisely and PALSAR that has L-canal with 3 kinds of polarizations. By using these instruments we can distinguish between forest cover, clear cut logging and agricultural land, as well as monitor land use changes, the reduction of forest tree height and even can build model to predict the forest characteristics using PALSAR and AVNIR data. PROGRESS OF INDONESIA ALOS PILOT PROJECT Capacity Building – Technical Supports/Training LAPAN proposed three kinds of training for learning and technical assistants to support this Pilot Project. Those are: basic training, advanced training and specific training. The training was conducted from 6 to 10 March, 2006 at LAPAN office Jakarta, fully supported by JAXA, RESTEC and Asian Institute of Technology (AIT). It aims to introduce Remote Sensing in general perspective, specifically will be focused on Hi Resolution Optical Data and SAR Data, ALOS Satellite and its instruments and also for ALOS pre processing and processing. Participants of this training consisted of each Indonesian counterparts in this pilot project. The number of participants was 32 persons. The training also was used as discussion forum for research and processing problems among researchers from each counterpart. Scope of this training were: to introduce remote sensing in general perspective, especially about Hi Resolution Optical and SAR, to introduce DEM Model by using satellite; related with PRISM instrument that will produce 3 D image, to learn ALOS pre processing data, to learn ALOS processing data.
Processing of Data Sample ALOS was successfully launched on Jan 24, 2006. ALOS completed the initial on-orbit check-out for 3 months and currently in Cal/Val phase for 6 months. ALOS rapid response images have been provided to the International Disaster Charter and Asian countries. Routine of ALOS operations are expected to start in October 2006.
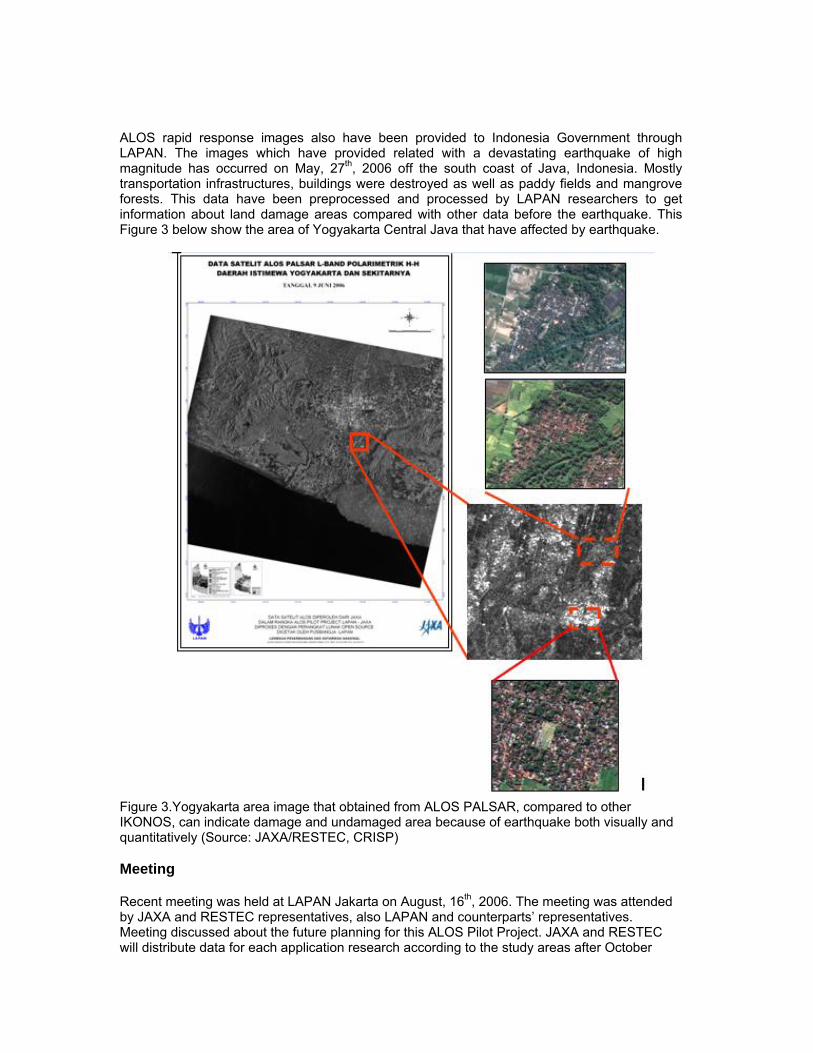
ALOS rapid response images also have been provided to Indonesia Government through LAPAN. The images which have provided related with a devastating earthquake of high magnitude has occurred on May, 27th, 2006 off the south coast of Java, Indonesia. Mostly transportation infrastructures, buildings were destroyed as well as paddy fields and mangrove forests. This data have been preprocessed and processed by LAPAN researchers to get information about land damage areas compared with other data before the earthquake. This Figure 3 below show the area of Yogyakarta Central Java that have affected by earthquake.
Figure 3.Yogyakarta area image that obtained from ALOS PALSAR, compared to other IKONOS, can indicate damage and undamaged area because of earthquake both visually and quantitatively (Source: JAXA/RESTEC, CRISP) Meeting Recent meeting was held at LAPAN Jakarta on August, 16th, 2006. The meeting was attended by JAXA and RESTEC representatives, also LAPAN and counterparts’ representatives. Meeting discussed about the future planning for this ALOS Pilot Project. JAXA and RESTEC will distribute data for each application research according to the study areas after October

2006, and the next training will be conducted in November 2006 to learn about ALOS itself processing for each application.
REFERENCEES
Carolita, Ita; Nur, Mawardi, Syafrina; Report of LAPAN ALOS PP, annual report (not published); Remote Sensing Application and Technology Development Center – LAPAN, Jakarta, 2005.
Ono, Atsushi; Report of JAXA Earth Observation Application and Promotion Center
(not published), JAXA/RESTEC, 2006.
Tjahjaningsih, Arum; Carolita, Ita; Trisakti, Bambang; Prasasti, Indah; Report of LAPAN ALOS PP, annual report (not published); Remote Sensing Application and Technology Development Center – LAPAN, Jakarta, 2006.
Copyright © 2022 FDOKUMEN