Landslide susceptibility mapping by using a geographic ...
24
Nat. Hazards Earth Syst. Sci., 19, 999–1022, 2019 https://doi.org/10.5194/nhess-19-999-2019 © Author(s) 2019. This work is distributed under the Creative Commons Attribution 4.0 License. Landslide susceptibility mapping by using a geographic information system (GIS) along the China–Pakistan Economic Corridor (Karakoram Highway), Pakistan Sajid Ali 1,2 , Peter Biermanns 1 , Rashid Haider 3 , and Klaus Reicherter 1 1 Neotectonics and Natural Hazards, RWTH Aachen University, Lochnerstr. 4–20, 52056 Aachen, Germany 2 Department of Earth Sciences, COMSATS Information Technology, Abbottabad, Pakistan 3 Geological Survey of Pakistan, Islamabad, Pakistan Correspondence: Sajid Ali ([email protected]) Received: 12 February 2018 – Discussion started: 5 March 2018 Revised: 25 February 2019 – Accepted: 31 March 2019 – Published: 7 May 2019 Abstract. The Karakoram Highway (KKH) is an important route, which connects northern Pakistan with Western China. Presence of steep slopes, active faults and seismic zones, sheared rock mass, and torrential rainfall make the study area a unique geohazards laboratory. Since its construction, land- slides constitute an appreciable threat, having blocked the KKH several times. Therefore, landslide susceptibility map- ping was carried out in this study to support highway au- thorities in maintaining smooth and hazard-free travelling. Geological and geomorphological data were collected and processed using a geographic information system (GIS) en- vironment. Different conditioning and triggering factors for landslide occurrences were considered for preparation of the susceptibility map. These factors include lithology, seismic- ity, rainfall intensity, faults, elevation, slope angle, aspect, curvature, land cover and hydrology. According to spatial and statistical analyses, active faults, seismicity and slope angle mainly control the spatial distribution of landslides. Each controlling parameter was assigned a numerical weight by utilizing the analytic hierarchy process (AHP) method. Additionally, the weighted overlay method (WOL) was em- ployed to determine landslide susceptibility indices. As a re- sult, the landslide susceptibility map was produced. In the map, the KKH was subdivided into four different suscepti- bility zones. Some sections of the highway fall into high to very high susceptibility zones. According to results, active faults, slope gradient, seismicity and lithology have a strong influence on landslide events. Credibility of the map was val- idated by landslide density analysis (LDA) and receiver oper- ator characteristics (ROC), yielding a predictive accuracy of 72 %, which is rated as satisfactory by previous researchers. 1 Introduction Landslides are a result of different geodynamic processes and represent a momentous type of geohazard, causing eco- nomic and social loss by damaging infrastructure and build- ings (Vallejo and Ferrer, 2011). Landslides are mainly caused by conditioning and triggering factors. Conditioning factors include relief, lithology, geological structure, geomechanical properties and weathering, whereas precipitation, seismic- ity, change in temperature, and static or dynamic loads are triggering factors. Variations in these factors affect the oc- currence of landslides. Heterogeneity in lithology influences hydrological and mechanical characteristics of rock mass. Slope morphology (curvature) depends upon lithology and structure within it. Size and type of mass movement changes with variations in lithology and structures. Some lithologies are more permeable and allow water to infiltrate and to in- crease the pore water pressure. This increase in pore wa- ter pressure during rainfall events ultimately affects shear strength of the rock mass and slope stability (Barchi et al., 1993; Cardinali et al., 1994), whereas the less pervious rock masses have low infiltration and high runoff leading to de- bris and mud flows (Dramis et al., 1988; Ellen et al., 1993; Canuti et al., 1993). Sheared and highly jointed rock masses contain shallow slope failures, whereas rockfalls are concen- Published by Copernicus Publications on behalf of the European Geosciences Union.
-
Upload
khangminh22 -
Category
Documents
-
view
1 -
download
0
Transcript of Landslide susceptibility mapping by using a geographic ...

Nat. Hazards Earth Syst. Sci., 19, 999–1022, 2019https://doi.org/10.5194/nhess-19-999-2019© Author(s) 2019. This work is distributed underthe Creative Commons Attribution 4.0 License.
Landslide susceptibility mapping by using a geographic informationsystem (GIS) along the China–Pakistan Economic Corridor(Karakoram Highway), PakistanSajid Ali1,2, Peter Biermanns1, Rashid Haider3, and Klaus Reicherter1
1Neotectonics and Natural Hazards, RWTH Aachen University, Lochnerstr. 4–20, 52056 Aachen, Germany2Department of Earth Sciences, COMSATS Information Technology, Abbottabad, Pakistan3Geological Survey of Pakistan, Islamabad, Pakistan
Correspondence: Sajid Ali ([email protected])
Received: 12 February 2018 – Discussion started: 5 March 2018Revised: 25 February 2019 – Accepted: 31 March 2019 – Published: 7 May 2019
Abstract. The Karakoram Highway (KKH) is an importantroute, which connects northern Pakistan with Western China.Presence of steep slopes, active faults and seismic zones,sheared rock mass, and torrential rainfall make the study areaa unique geohazards laboratory. Since its construction, land-slides constitute an appreciable threat, having blocked theKKH several times. Therefore, landslide susceptibility map-ping was carried out in this study to support highway au-thorities in maintaining smooth and hazard-free travelling.Geological and geomorphological data were collected andprocessed using a geographic information system (GIS) en-vironment. Different conditioning and triggering factors forlandslide occurrences were considered for preparation of thesusceptibility map. These factors include lithology, seismic-ity, rainfall intensity, faults, elevation, slope angle, aspect,curvature, land cover and hydrology. According to spatialand statistical analyses, active faults, seismicity and slopeangle mainly control the spatial distribution of landslides.Each controlling parameter was assigned a numerical weightby utilizing the analytic hierarchy process (AHP) method.Additionally, the weighted overlay method (WOL) was em-ployed to determine landslide susceptibility indices. As a re-sult, the landslide susceptibility map was produced. In themap, the KKH was subdivided into four different suscepti-bility zones. Some sections of the highway fall into high tovery high susceptibility zones. According to results, activefaults, slope gradient, seismicity and lithology have a stronginfluence on landslide events. Credibility of the map was val-idated by landslide density analysis (LDA) and receiver oper-
ator characteristics (ROC), yielding a predictive accuracy of72 %, which is rated as satisfactory by previous researchers.
1 Introduction
Landslides are a result of different geodynamic processesand represent a momentous type of geohazard, causing eco-nomic and social loss by damaging infrastructure and build-ings (Vallejo and Ferrer, 2011). Landslides are mainly causedby conditioning and triggering factors. Conditioning factorsinclude relief, lithology, geological structure, geomechanicalproperties and weathering, whereas precipitation, seismic-ity, change in temperature, and static or dynamic loads aretriggering factors. Variations in these factors affect the oc-currence of landslides. Heterogeneity in lithology influenceshydrological and mechanical characteristics of rock mass.Slope morphology (curvature) depends upon lithology andstructure within it. Size and type of mass movement changeswith variations in lithology and structures. Some lithologiesare more permeable and allow water to infiltrate and to in-crease the pore water pressure. This increase in pore wa-ter pressure during rainfall events ultimately affects shearstrength of the rock mass and slope stability (Barchi et al.,1993; Cardinali et al., 1994), whereas the less pervious rockmasses have low infiltration and high runoff leading to de-bris and mud flows (Dramis et al., 1988; Ellen et al., 1993;Canuti et al., 1993). Sheared and highly jointed rock massescontain shallow slope failures, whereas rockfalls are concen-
Published by Copernicus Publications on behalf of the European Geosciences Union.

1000 S. Ali et al.: Landslide susceptibility mapping by using GIS
trated in well-bedded massive rock masses (Hu and Cruden,1993). Distance from a tectonic feature has an inverse re-lation with rock fracturing and degree of weathering (Prad-han et al., 2010). State of weathering and fracturing makesslopes unstable (Ruff and Czurda, 2008). Slope is an impor-tant driving parameter for slope failures in the same geolog-ical and climatic setting (Coco and Buccolini, 2015). Shearstrength decreases with increase in slope. Therefore, land-slide density increases with increase in steepness (Pradhanet al., 2010). Kartiko et al. (2006) found that more than halfof the landslides occur in areas where the slope is greaterthan 25 %. Curvature expresses the shape of the slope. If it ispositive, then slope will be upwardly convex and will be con-cave in the case of a negative value. The later has the abilityto retain water for longer time leading to increase in porewater pressure and hence in slope failures (Pradhan et al.,2010). Assessment of risks related to landslides was a long-term challenge for geologists but was significantly facilitatedwith the eventual availability of remote sensing (Shahabi andHashim, 2015). Preparation of landslide inventory maps, ac-quisition of geomorphological data (elevation, slope, slopecurvatures, aspect), hydrological parameters and extractionof lineaments from remote sensing products is now compar-atively an easier task.
Landslide susceptibility mapping is the spatial predic-tion of landslide occurrence by considering causes of pre-vious events (Guzzetti et al., 1999). It largely depends uponknowledge of slope movement and controlling factors (Yal-cin, 2008). It has hitherto been carried out by many re-searchers in order to denominate potential landslide hazardzones through evaluation of responsible factors (Basharat etal., 2016; Komac, 2006; Lee et al., 2002, 2004; Shahabi andHashim, 2015; Süzen and Doyuran, 2004). Preparation oftheir maps was based broadly on qualitative and quantita-tive approaches. Early research work (Nilsen et al., 1979)was largely quantitative, utilizing deterministic and statisticalcorrelations and regression analysis of landslides and theircontrolling factors. In this context, safety factors, calculatedon the basis of engineering parameters, are adduced to im-ply deterministic methods. In more recent works, statisticalmethods are favoured, attempting to draw correlations be-tween spatial distribution of landslides and their controllingfactors. Among these are the analytical hierarchy process, bi-variate and multi-variate methods, logistic regression neuralnetworks, fuzzy logic, etc. (Basharat et al., 2016; Guzzetti etal., 1999; Komac, 2006; Lee et al., 2002, 2004; Shahabi andHashim, 2015; Süzen and Doyuran, 2004). These techniqueswere proven to be better options for comparatively large andcomplex areas (Cardinali et al., 2000). Expert opinion andlandslide inventories are the decisive components of qual-itative approaches (Yalcin, 2008). In most cases, landslideinventories were adduced to estimate failure susceptibilitybased on previous hazards in locations with similar geolog-ical, geomorphological and hydrological set-ups. Some geo-scientists (Ahmed et al., 2014; Ayalew et al., 2004; Basharat
et al., 2016; Kamp et al., 2008; Kanwal et al., 2016; Sha-habi and Hashim, 2015; Yalcin, 2008) incorporated statisti-cal techniques (Analytical Hierarchy Approach, AHP, withweighted linear combination, WLC, and weighted overlaymethod, WOM) into qualitative methods to provide the iden-tified factors with a numerical weighting. The combination ofAHP and weighted overlay method (WOM) was termed asmultiple-criteria decision analysis (MCDA) (Ahmed, 2015;Basharat et al., 2016; Kanwal et al., 2016). AHP is a sim-ple and flexible method to analyse and solve complex prob-lems (Saaty, 1987, 1990). It facilitates the estimation of influ-ence that different factors might have on landslide develop-ment by comparing them in possible pairs in a matrix. Thisapproach involves field experience and background knowl-edge of the researcher. A field campaign along the Karako-ram Highway (KKH) in May 2016 enhanced our knowledgeabout factors controlling landslide events. Previous researchconsidered MCDA as a better choice because of its accuracyto predict landslide hazard (Ahmed, 2015; Basharat et al.,2016; Kamp et al., 2008; Komac, 2006; Park et al., 2013;Pourghasemi et al., 2012). MCDA (combination of AHP withqualitative approaches) was declared a better option for re-gional studies (Soeters and van Westen, 1996). Previous wideusage in landslide susceptibility mapping, high accuracy, asimple process and flexibility according to local variation inlandslide controlling parameters compelled us to choose thismodel. Furthermore, the use of a geographic information sys-tem (GIS) facilitated the extraction of geomorphic and hy-drological parameters required for susceptibility assessment.Digital elevation models (DEMs) are commonly processedin GIS to extract crucial parameters for susceptibility as-sessment such as elevation, slope, aspect, curvature, water-shed, etc. (Ayalew et al., 2004, 2005; Basharat et al., 2016;Ohlmacher and Davis, 2003; Rozos et al., 2011; Shahabi andHashim, 2015; Süzen and Doyuran, 2004). Previously, land-slide susceptibility maps of different fragments of northernPakistan were prepared (Bacha et al., 2018; Basharat et al.,2016; Ahmed et al., 2014; Kamp et al., 2008; Kanwal et al.,2016; Khan et al., 2018; Rahim et al., 2018) (Table 1). Theyused a single model-based method, except two (Ahmed etal., 2014; Bacha et al., 2018) compared performances of twodifferent models. Ahmed et al. (2014), Kanwal et al. (2016)and Rahim et al. (2018) used a regional geological map(1 : 500 000) to produce a landslide susceptibility map of theUpper Indus basin, whereas inventories were based on pub-lished rock avalanche maps (Kanwal et al., 2016), geomor-phological mapping (Ahmed et al., 2014), co-seismic land-slides (Basharat et al., 2016) and remote sensing along withfield mapping (Bacha et al., 2018; Khan et al., 2018). Ge-ological, geomorphological and human-induced parameterswere also considered for production of susceptibility maps(Table 1).
Nat. Hazards Earth Syst. Sci., 19, 999–1022, 2019 www.nat-hazards-earth-syst-sci.net/19/999/2019/

S. Ali et al.: Landslide susceptibility mapping by using GIS 1001
Table 1. Previous work in some parts of northern Pakistan. MCE is multi-criteria evaluation, NDVI is normalized difference vegetationindex, SPI is stream power index, TWI is topographic wetness index, WOE is weight of evidence, and FR is frequency ratio.
Authors Method Causative factors Study area
Kamp et al. (2008) MCE and AHP aspect, elevation, faults, lithology, land cover, rivers,roads, slope, tributaries, aspect
Muzaffarabad District
Ahmed et al. (2014) WOM and fuzzylogic
relief slope, curvature, aspect, rain, seismic hazardfaults, drainage, NDVI, geology
Upper Indus watershed
Basharat et al.(2016)
MCE and AHP aspect, elevation, faults, lithology, land cover, hydrol-ogy, roads, slope, curvature
BalaKot Tehsil
Kanwal et al.(2016)
AHP-basedheuristic approach
slope, aspect, lithology, land cover, faults, road network,streams
Shigar and Shyok Basinin Karakoram range
Khan et al. (2018) FR slope, aspect, curvature, lithology, land cover, faults,road network, distance from stream, SPI, TWI
Haramosh valley,Bagrote valley andparts of Nagar valley
Bacha et al. (2018) WOE, FR aspect, fault, geology, land cover, proximity to road,slope, proximity to stream
Hunza–Nagar valley
Rahim et al. (2018) AHP and WLC slope, aspect, elevation, drainage network, SPI, TWI,lithology, fault lines, rainfall, road network, land cover,soil texture
Ghizer District
This study AHP and WOM elevation, slope angle, aspect, curvature, lithology, seis-micity, faults, land cover, rainfall intensity and distancefrom streams
KKH (CPEC)
2 General situation of the study area
The Karakoram Highway (KKH), a part of the China–Pakistan Economic Corridor (CPEC), connects northern Pak-istan with Western China (Fig. 1). It passes through rapidlyrising mountain ranges of the Himalaya, Karakoram andHindu Kush forming the junction between the Indian andEurasian plates including the Kohistan Island Arc (Der-byshire et al., 2001). The area is characterized by frac-tured and weathered rock masses, diverse lithologies (ig-neous, metamorphic, and sedimentary), high seismicity, deepgorges, high relief, arid to monsoon climate and locally highrates of tectonic activity. These conditions make the studyarea a unique geohazards laboratory. Starting with its con-struction in 1979, KKH’s stability has been endangered by avariety of geohazards.
The study area is the 840 km long (10 km buffer) Karako-ram Highway (KKH), N35, located in the Karakoram Moun-tains, Himalaya. The area hosts some of the highest re-liefs and highest peaks (Nanga Parbat: 8126 m, Rakaposhi:7788 m) in the world (Hewitt, 1998). Goudie et al. (1984)termed the study area the steepest place on the earth whereelevation drops from 7788 to 2000 m over a horizontal dis-tance of 10 km (Fig. 2b, d).
From Abbottabad, the highway leads northwards throughthe sub-Himalayas entering the Indus Valley at Thakot, andthe Hunza Valley at Gilgit, running parallel to the eponymous
rivers. From Thakot onwards, it passes through deeply in-cised valleys and gorges.
Weather conditions along the KKH are not uniform andare characterized by a wide range of annual mean tempera-tures (− 5 to 46 ◦C) and precipitation (15 to 1500 mm). Thedistribution of precipitation is additionally strongly fluctu-ating throughout the year. During the westerlies (January,February and March) and the monsoon period (July, August),the study area receives heavy rainfall. According to meteo-rological data, average annual precipitation between Abbot-tabad and Dassu is 1444 mm. However, north of Dassu, anabrupt change from monsoon to semi-arid to arid conditionsis recorded which is owed to a change in valley orientationfrom north–south to east–west (Figs. 1 and 3). Furthermore,vertical climatic zonation exists in the Hunza Valley alongthe KKH. The surrounding peaks and slopes higher than5000 m receive precipitation greater than 1000 mm per year,whereas the valley floor below is characterized by a semi-aridto arid climate (Hewitt, 1998).
The Karakoram and Himalaya host some of the world’slongest continental glaciers with the steepest gradient andhighest glacial erosion rates (Goudie et al., 1984). The snoutsof some glaciers (Batura, Ghulkin, Pasu, Gulmit, Gulkin) areclose to the KKH and partly cross it (Fig. 2a, c). Relativelywarm temperatures in the valleys result in sudden melting ofice, frequent surges, catastrophic debris flows and blockageof rivers.
www.nat-hazards-earth-syst-sci.net/19/999/2019/ Nat. Hazards Earth Syst. Sci., 19, 999–1022, 2019

1002 S. Ali et al.: Landslide susceptibility mapping by using GIS
Figure 1. Overview of tectonics and precipitation in the study area. (a) Location of the study area in the region. (b) Active faults and majorearthquake events in the region (USGS Earthquake Catalog, 2017). (c) Locations of the weather stations with mean annual rainfall (PakistanMeteorological Department) and overview of tectonics and topography of the study area (After Hodges 2000): boxes 2a and 2b representlocations of Fig. 2. KKH it the Karakoram Highway, MBT is main boundary thrust, MMT is main mantle thrust, MKT is main Karakoramthrust (modified after Ali et al., 2017).
Figure 2. (a) Glaciers along the KKH. (b) Relief along the KKH. (c) Pasu Glacier’s snout approaching the KKH. (d) Profile drawn alongaxis drawn in Fig. 2b: elevation drops from 7788 to 2000 m over a horizontal distance of 10 km.
Nat. Hazards Earth Syst. Sci., 19, 999–1022, 2019 www.nat-hazards-earth-syst-sci.net/19/999/2019/

S. Ali et al.: Landslide susceptibility mapping by using GIS 1003
Figure 3. (a) Overview of precipitation (mean annual rainfall) and landslide frequency along the KKH (after Khan et al., 2000; PakistanMeteorological Department 1982, 1983, 1996, 1997, 1998, 1999, 2000, 2014, 2015, 2016, Frontier Works Organization archives). (b) Cor-relation between landslide events and precipitation (Ali et al., 2017).
www.nat-hazards-earth-syst-sci.net/19/999/2019/ Nat. Hazards Earth Syst. Sci., 19, 999–1022, 2019

1004 S. Ali et al.: Landslide susceptibility mapping by using GIS
3 Geology along the KKH
Tectonically, the area is characterized by orogenic featuresthat started forming with the onset of the Indo–Eurasian col-lision 50 Myr ago. Crustal shortening, subduction and ac-tive faulting are still ongoing with convergence rates of ∼ 4–5 cm per year (Jade, 2004) and uplift rates of ∼ 7 mm peryear (Zeitler, 1985). Main mantle thrust (MMT), Kamila Jalshear zone (KJSZ), Raikot Fault, main Karakoram thrust(MKT) and Karakoram Fault are important tectonic featuresresponsible for brittle deformation along the highway (Fig. 4)(Bishop et al., 2002; Burg et al., 2006; DiPietro and Pogue,2004; Goudie et al., 1984). Due to this brittle deformation,the rock mass is highly jointed and fractured. The generalgeology along the KKH consists of sedimentary, igneousand metamorphic rocks. Highly active landslide zones wereidentified from the multi-temporal landslide inventory of theKKH (Fig. 6). Jijal–Dassu, Raikot Bridge, Hunza Valley andKhunjerab valley sections are characterized by a large num-ber of mass movements, and therefore a detailed geology isonly discussed for these sections.
The geology of the Jijal–Dassu section is composed ofultramafic and low- to high-grade metamorphic rocks. TheMansehra granite, the Besham group, the Jijal Complex, theKamila amphibolite and the Chilas Complex are importantlithological units in this section. The Besham group com-prises biotitic gneisses, cataclastic gneisses and quartzite,which were metamorphosed during the Himalayan orogeny∼ 65 Myr ago (Ding et al., 2016). It shares a faulted con-tact with the Jijal Complex (Kohistan Island arc) along thenorthward dipping MMT (Williams, 1989). The ultramaficrocks with garnet granulites and Alpine-type metamorphicrocks between Jijal and Pattan are collectively termed as Ji-jal Complex (Tahirkheli and Jan, 1979). The Besham groupshows signs of crushing of individual minerals and stainingof quartz, whereas the Jijal Complex is massive and sheared(Khan et al., 1989). Owing to the contact of the Jijal Com-plex with the MMT in the north and the Pattan Fault in thesouth, it is highly tectonic and deformed. The Kamila amphi-bolite consists of sheared basic lavas and intrusive plutons(Treloar et al., 1996). It is classified into two types: garnet-bearing and garnet-free amphibolites. The former is massiveand sheared due to the presence of Pattan and Kamila Jalshear zones (KJS), whereas the latter is banded. The garnet-free amphibolite shares a sheared contact with the ChilasComplex, mafic intrusions of predominantly gabbronorites,sheared gabbronorites and diorites (Searle et al., 1999).
The Raikot Bridge section exhibits continuous mass move-ment process because of its location at the seismically activewestern limb of the MMT known as Raikot Fault, a strike–slip fault with right-lateral movement. It is marked by a con-centration of hot springs and a large shear zone. Graniticgneisses, quartzites, gabronorite, schists and Quaternary sed-iments are the main lithological units in this section. Contin-
uous erosion by the Indus River and highly deformed rocksare responsible for landslide events.
MKT is a part of the Hunza valley section and is re-sponsible for many landslide events. The pre-dominant lo-cal lithologies of the Baltit Group, Chalt schists, Karakorambatholith as well as Quaternary sediments are highly tectonicand deformed.
The highly deformed Misgar slates, along with the Gu-jhal dolomite and Kilk formation, are the main componentsof the Sost section. The Karakoram fault is an important tec-tonic feature in this section. Highly fissile and closely jointedslates are important sources of scree on steep slopes along thehighway. Intense weather conditions aggravate the situationin this section.
4 Seismology
The highway passes through one of the seismically mostactive areas in the world. The presence of active thrustsand strike–slip faults gives rise to earthquakes, anon trig-gering numerous landslides. The seismic activity alongKKH is demonstrated by 317M > 5 and 10M > 7 recordedearthquake events (Muzaffarabad October, 2005: M = 7.6,Afghanistan October, 2015: M = 7.5) since 1904 (Zhiquanand Yingyan, 2016). The highway passes through importantseismic zones: the Indus Kohistan seismic zone (IKSZ), theHamran seismic zone (HSZ), the Raikot–Sassi seismic zone(RSSZ) and the Yasin seismic zone (YSZ) (Fig. 4). The Jijal–Dassu section of the KKH passes through the northern partof IKSZ. IKSZ is 50 km wide and represents a highly activewedge-shaped structure containing a shallow and midcrustalzone (MonaLisa et al., 2009). The Muzaffarabad (2005,M =7.6) and Pattan earthquakes (1974, M = 6.2) are recent de-structive earthquakes in this seismic zone.
Sazin section of the highway is a part of HSZ, an activeseismic zone hosting recent events with magnitudes of 3 to6.2. The active Raikot Fault traverses RSSZ and is respon-sible for shallow seismicity of magnitudes 3 to 6.3. Boththe fault and the KKH run, in direct vicinity, on the west-ern banks of the Indus River. The YSZ encompasses the re-gion surrounding the small town of Yasin. It is characterizedby earthquakes with magnitudes between 3 and 5 and focaldepths of less than 50 km. The MKT is suspected to be themain source of seismicity for this seismically active region.
5 Methodology
The flow chart (Fig. 5) describes the steps and techniquesinvolved in preparation of the susceptibility map, involvingmultiple techniques, literature review, field observation andremote sensing.
Nat. Hazards Earth Syst. Sci., 19, 999–1022, 2019 www.nat-hazards-earth-syst-sci.net/19/999/2019/

S. Ali et al.: Landslide susceptibility mapping by using GIS 1005
Figure 4. (a) Regional location of Himalaya. (b) Overview of Himalayan geology. (c) Geology along the KKH (compiled from Khan andJan, 1991; Derbyshire et al., 2001; DiPietro and Pogue, 2004; DiPietro et al., 2000; Hewitt et al., 2011). Four boxes represent four sections(a is Jijal–Dassu section, b is Raikot Bridge section, c is Hunza Valley section and d is Khunjerab valley section). MMT is main mantlethrust, KJS is Kamila Jal shear zone, MKT is main Karakoram thrust, KF is Karakoram Fault, KSF is Kamila strike–slip fault, IKSZ isIndus Kohistan seismic zone, HSZ is Harman seismic zone, RSSZ is Raikot Sassi seismic zone, YSZ is Yasin seismic zone, SV is sedimentsand volcanics, KaB is Karakoram batholith, CVS is Chalt volcanics and schist, KoB is Kohistan batholith, CC is Chilas Complex, KA isKamila amphibolites, JC is Jijal Complex, PG is Precambrian gneisses, PMLS is Palaeozoic and Mesozoic limestones and sandstones, MRSis Miocene redstones.
5.1 Literature review
In the first step, existing information and data for the studyarea were collected from archives of the Frontier Works Or-ganization (FWO), Geological Survey of Pakistan (GSP),Pakistan Meteorological department (PMD) and research
catalogues (Khan et al., 2000). FWO is responsible for clear-ance and maintenance of the KKH after its potential block-age. Road maintenance logs were collected and digitized.The following three important maps were prepared from datacollected:
www.nat-hazards-earth-syst-sci.net/19/999/2019/ Nat. Hazards Earth Syst. Sci., 19, 999–1022, 2019

1006 S. Ali et al.: Landslide susceptibility mapping by using GIS
Figure 5. Flow chart showing multiple steps involved in the preparation of the susceptibility map: FWO is Frontier Works Organization,PMD is Pakistan Meteorological Department, GSP is Geological Survey of Pakistan and DEM is digital elevation model.
i. A multi-temporal landslide inventory map (Fig. 6)was prepared using GIS, based on GSP’s publications(Fayaz et al., 1985; Khan et al., 1986, 2003) and roadmaintenance logs of FWO.
ii. A comprising geological and seismo-tectonic map(1 : 50 000 and 1 : 250 000) of the area was preparedby digitizing and compiling various pre-existing maps(Khan et al., 2000). Data related to lithology, faults andseismicity have been extracted from these maps.
iii. An annual precipitation map of the study area was pre-pared by using rainfall data of six weather stations andprevious map (Figs. 1 and 3) along the KKH.
Landslide inventory
A landslide inventory map is an important instrument to dis-play the location, date of occurrence and type of mass move-ment (Guzzetti et al., 2012). Landslide inventory maps are
prepared to define and record the extent of mass movementsin different regions; to investigate an impact of lithology, ge-ological structures (fault, fold, etc.) on types, distribution andoccurrence of landslides; to use for preparation of landslidesusceptibility mapping; and to analyse geomorphic evolutionof an area. Preparation of these maps involves multiple tech-niques based on satellite imagery, field interpretations andcompilation of previous publications (Guzzetti et al., 2000;van Westen et al., 2006).
In this study, we used real-time data of landslide occur-rences acquired from road clearance logs of Frontier WorksOrganization (FWO) for different periods (1982, 1983, 1996,1997, 1998, 1999, 2000, 2014, 2015, 2016), publications ofGeological Survey of Pakistan (GSP) (Fayaz et al., 1985;Khan et al., 1986, 2003), a research article (Hewitt, 1998),Google Earth imagery and field surveys to prepare a multi-temporal landslide inventory along the highway (Fig. 6).Polygon outlines for clearly visible landslides on satellite im-agery (based on data of FWO and GSP) were drawn. This
Nat. Hazards Earth Syst. Sci., 19, 999–1022, 2019 www.nat-hazards-earth-syst-sci.net/19/999/2019/

S. Ali et al.: Landslide susceptibility mapping by using GIS 1007
Figure 6. Temporal distribution of landslides along the highway: boxes (a) and (b) represent two problematic sections shown in Fig. 11.
landslide inventory map was then validated during a fieldcampaign. Spatial analysis and validation of the final suscep-tibility map were performed by using these polygons. Due tothe small scale of the inventory map, visibility of polygonswas extremely low. Therefore, these polygons were then con-verted and displayed as points in the inventory map (Fig. 7).
5.2 Field observation
Locations of landslides, lithological contacts and faults werevalidated and supplemented during a field visit. In addition tolocations, types, size, failure mechanisms and structural con-trol of landslides were determined. Acquired data were fur-ther used to prepare a landslide inventory map within 2 km2
around the highway.
5.3 Remote sensing
Geomorphological parameters (elevation, slope, aspect,curvature) and drainage were extracted from a DEMbased on the Shuttle Radar Topography Mission (SRTM)(30 m× 30 m). Thematic layers were prepared and classifiedusing the natural break method in GIS. Satellite images ofLandsat 8 (19–21 November 2017) were acquired from theUSGS web portal and then pre-processed by using QGIS2.18’s semi-automatic classification plug-in (SCP), followedby supervised classification of composite images in GIS toprepare a land cover map.
Figure 7. Types of mass movements along the highway. (a) Thakotto Raikot Bridge and (b) Raikot Bridge to Khunjerab Pass (locationsshown in Fig. 6).
www.nat-hazards-earth-syst-sci.net/19/999/2019/ Nat. Hazards Earth Syst. Sci., 19, 999–1022, 2019

1008 S. Ali et al.: Landslide susceptibility mapping by using GIS
Table 2. Fundamental scale for pairwise comparisons (Saaty, 1987).
Intensity of Explanationimportance
1 Equal importance2 Weak or slight3 Moderate importance4 Moderate plus5 Strong importance6 Strong plus7 Very strong8 Very very strong9 Extreme importance
Construction of thematic maps
Thematic layers of elevation, slope, aspect and curvaturewere prepared and classified using the natural break methodin GIS. Drainage was extracted from the SRTM-based DEMby the Arc Hydro Tools. A buffer polygon of 300 m was cre-ated to measure distance around streams to form thematiclayer of distance from drainage. Faults, lithology and seis-mic zones were digitized from previously published geolog-ical and seismic maps. Multiple ring buffer polygons of 500,1000, 1500 and 2000 m around digitized faults were pro-duced. Vector layers of distance from fault and drainage,lithology and seismic intensities were then rasterized. An-nual rainfall data were interpolated to create a precipitationmap and it was then combined with a previously publishedannual rainfall map of PMD. Thematic layer of land coverwas produced from a land cover map.
5.4 Analytical hierarchy process
Analytical hierarchy process (AHP) is a multi-criteria de-cision making approach to prepare landslide susceptibilitymaps. It has been used by previous researchers to assign aweighting to landslide-controlling factors (Basharat et al.,2016; Kanwal et al., 2016; Shahabi and Hashim, 2015; Yal-cin, 2008). It is based on the user’s decision to weigh factorsthrough their pairwise comparisons. Each factor is assigneda score (1–9) depending upon its relative importance, withincreasing impact from 1 to 9 (Table 2, Saaty, 1990). Thevalues assigned are based on spatial analysis of data, fieldobservations and experience of the user. If the parameter onthe x axis is more important than the one on the y axis, thevalue ranges between 1 and 9. Conversely, when the factoron the y axis is more important, the values are in reciprocals(1/2–1/9).
Consistency ratio (CR) is a tool to check and avoid incon-sistencies and bias in the whole process of rating controllingparameters (Basharat et al., 2016; Kanwal et al., 2016; Ko-mac, 2006; Pourghasemi and Rossi, 2017; Sarkar and Ka-
Table 3. Random consistency index (RI).
n 2 3 4 5 6 7 8 9 10
RI 0 0.58 0.9 1.12 1.24 1.32 1.41 1.45 1.51
nungo, 2004; Taherynia et al., 2014; Yalcin, 2008).
CR= CI/RI, (1)
where CR is consistency ratio, CI is consistency index andRI is random index.
CI was calculated by using following equation:
CI= (λmax− n)/n− 1, (2)
where λmax is the maximum eigenvalue of matrix and n isthe number of controlling parameters involved (Zhou et al.,2016).
Saaty (1987) produced a table (Table 3) of random consis-tency index (RI) after calculation from 500 samples. Valuesof RI from this table and calculated CI were then comparedto find CR.
The value of CR indicates the inconsistency in the expert’sdecision during weighing of the parameters. Values of CRlower than 0.1 prove the decision to be consistent, while val-ues greater than 0.1 indicate inconsistency and suggest a re-vision of judgement. Subclasses in each factor were priori-tized by using a pairwise comparison procedure (Table 4).Curvature and distance from drainage comprised of two andone classes, respectively. Therefore, influence of these sub-classes was easily scaled without the AHP procedure. In thenext step, each parameter was assigned a weighting on thecompletion of the procedure (Table 5). Value of CR in ourstudy remained below 0.1, which proves comparisons andweighting criteria reliable, unbiased and consistent.
5.5 Weighted overlay method
Weighted overlay method (WOM) is a simple and direct toolof Arc GIS to produce a susceptibility maps (Bachri andShresta, 2010; Intarawichian and Dasananda, 2010). Manyresearchers used WOM to produce landslide susceptibilitymap (Bachri and Shresta, 2010; Basharat et al., 2016; In-tarawichian and Dasananda, 2010; Roslee et al., 2017; Shitet al., 2016). We used an overlay of raster layers of all con-trolling factors to prepare a susceptibility map. Raster lay-ers of each controlling factor were reclassified and weightedaccording to their importance determined by AHP (Ta-bles 4 and 5). The cumulative weight of all input layers wasmaintained at 100. All layers were combined by using theweighted overlay tool based on Eq. (3):
S =
∑WiSij∑Wi
, (3)
where Wi is the weight of ith factor, Sij represents subclassweight of j th factor and S is the spatial unit of the final map.
Nat. Hazards Earth Syst. Sci., 19, 999–1022, 2019 www.nat-hazards-earth-syst-sci.net/19/999/2019/

S. Ali et al.: Landslide susceptibility mapping by using GIS 1009
Table 4. Pairwise matrix and weights of factor subclasses.
Class (1) (2) (3) (4) (5) (6) (7) (8) % Importance
Aspect
(1) North 1.00 2.59 2(2) Northeast 2.00 1.00 5.89 3(3) East 3.00 2.00 1.00 7.70 4(4) Southeast 6.00 3.00 2.00 1.00 12.68 5(5) South 7.00 4.00 2.00 1.00 1.00 16.71 6(6) Southwest 8.00 4.00 3.00 2.00 2.00 1.00 21.95 7(7) West 9.00 5.00 4.00 2.00 3.00 2.00 1.00 24.54 8(8) Northwest 3.00 2.00 1.00 0.50 0.25 0.50 0.33 1.00 7.94 4
Elevation (m)
(1) 432–1000 1.00 4.05 1(2) 1000–2000 7.00 1.00 41.46 8(3) 2000–3000 6.00 0.50 1.00 22.26 6(4) 3000–4000 6.00 0.33 1.00 1.00 20.73 6(5) 4000–4700 4.00 0.20 0.50 0.50 1.00 11.50 4
Slope
(1) 0–15 1.00 3.92 1(2) 15–30 3.00 1.00 11.00 4(3) 30–45 9.00 4.00 1.00 41.46 9(4) 45–65 8.00 3.00 0.50 1.00 30.83 6(5) > 65 5.00 1.00 0.25 0.30 1.00 12.80 4
Land cover
(1) Vegetation 1.00 9.68 2(2) Water 0.33 1.00 4.75 1(3) Snow 3.00 5.00 1.00 23.08 4(4) Bare Rock/Soil 6.00 9.00 4.00 1.00 62.49 7
Rainfall intensity (mm per year)
(1) 0–250 1.00 5.68 1(2) 250–500 3.00 1.00 12.65 3(3) 500–1000 5.00 3.00 1.00 27.35 5(4) 1000–1500 8.00 5.00 3.00 1.00 60.00 9
Lithology
(1) Group A (SI, AF, HF, KgB, MG, TaF) 2.00 4.52 1(2) Group B (BeG, SC, TeF) 4.00 1.00 8.14 2(3) Group C (KoB, KaB, CC, GilF, GJ) 6.00 2.00 1.00 14.83 4(4) Group D (KA, GirF, KF, RPV, SC) 8.00 3.00 2.00 1.00 26.02 6(5) Group E (Qu, JC, OM, MS, PS, NPG, BaG) 4.00 5.00 4.00 2.00 1.00 46.49 9
Seismic intensity
(1) I–III 1.00 3.74 2(2) IV–V 3.00 1.00 7.63 3(3) V–VI 5.00 3.00 1.00 14.22 6(4) VII–VIII 7.00 5.00 3.00 1.00 29.77 8(5) IX–X 8.00 6.00 4.00 2.00 1.00 44.64 9
Distance from a fault (m)
(1) 0–500 1.00 50.50 9(2) 501–1000 0.50 1.00 27.04 7(3) 1001–1500 0.25 0.50 1.00 15.30 5(4) 1501–2000 0.20 0.25 0.33 1.00 7.15 4
www.nat-hazards-earth-syst-sci.net/19/999/2019/ Nat. Hazards Earth Syst. Sci., 19, 999–1022, 2019

1010 S. Ali et al.: Landslide susceptibility mapping by using GIS
Table 5. Pairwise matrix and weights of all controlling parameters.
Controlling Aspect Elevation Fault Lithology Land Distance from Rainfall Slope Curvature Seismicity Weightfactors cover drainage intensity
Aspect 1 1.77Elevation 3 1 3.05Distance from fault 9 7 1 23.28Lithology 6 5 1/3 1 10.28Land cover 4 3 1/4 1/3 1 7.04Distance from drainage 6 5 1/3 1 2 1 8.90Rainfall intensity 5 4 1/4 1/2 2 1/2 1 7.08Slope 9 7 1 3 5 3 4 1 23.74Curvature 1 1/3 1/9 1/6 1/5 1/5 1/5 1/7 1 1.82Seismicity 7 5 1/3 1 4 2 3 1/3 7 1 13.03
The completion of this process resulted in the ultimate pro-duction of a landslide susceptibility map of the highway.
6 Results
6.1 Landslides along the KKH
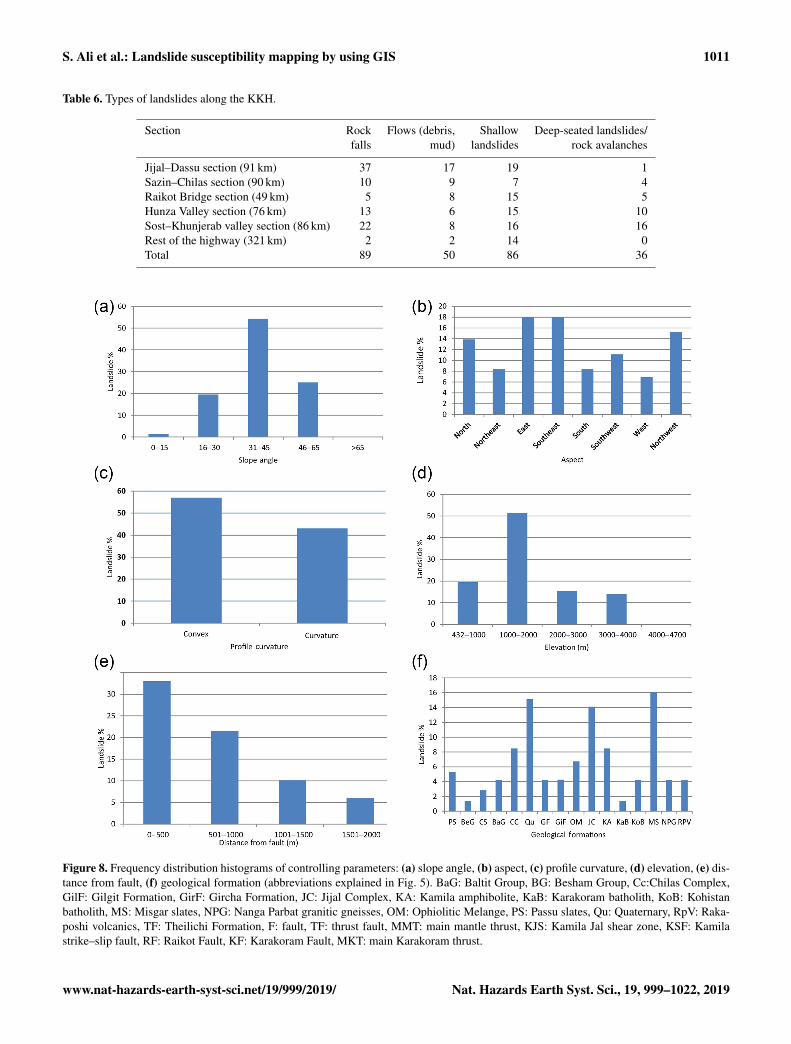
A total 261 landslides were used to prepare the map (Ta-ble 6). Broadly, we grouped these into shallow and deep-seated landslides (rock avalanches). Shallow landslides werefurther divided into slides, falls and flows based on the sim-plified version of Varnes (1978). Four sections (Table 6) arecharacterized by a large number of landslides during heavyrainfall and snowmelt. Highway blockage and traffic inter-ruption in these sections is a regular phenomenon. Presenceof a large number of rock/debris falls (37) in Jijal–Dassusection is due to steep topography formed by deep river in-cision in ultramfics (Jijal Complex), amphibolites (Kamilaamphibolites) and gabbronorites (Chilas Complex) of Ko-histan Island Arc, whereas stress release joints with shortpersistence in Sazin–Chilas section are responsible for hugeboulder falls (> 6 m3). A large number of slides (rock, debrisand mud) and flows (debris and mud) in large old landslidedeposits characterize the Raikot Bridge section. Hunza val-ley section is dominated by slides (rock, debris and mud) inhighly sheared rock mass and falls (rock and debris) in over-steepened parts of the valley. Steady flow of traffic alongthe highest section (Sost–Khunjerab Pass) of the highwayis a major problem due to seasonally influenced falls andslides. This section has a large number of large landslides(16), which dammed the Hunza and Khunjerab rivers in thepast.
6.2 Causative factors and spatial distribution analysis
Geological, morphological, seismo-tectonic, topographicand climatic factors are generally considered landslide-controlling parameters (Kamp et al., 2008). The following 10causative factors were considered for preparation of the map:lithology, distance from faults, seismicity, elevation, slope,
aspect, curvature, land cover, rainfall intensity and distancefrom drainage. Size and distribution of the landslides varieslocally, depending on the values of the parameters mentionedabove. Thus, the creation of an accurate and precise GIS-based landslide susceptibility map is entirely dependent onthe availability of data related to controlling factors (Ayalewet al., 2004). Rockslides, debris slides, rock avalanches, rockfall, toppling, wedging, mudflows and debris flows are im-portant landslide processes along the KKH.
6.2.1 Lithology
Time and type of slope failure is determined by the slope-building lithology. Each lithology is unique in terms of re-sponse to stresses and therefore features a particular suscep-tibility to potential slope failure (Vallejo and Ferrer, 2011).The KKH traverses a great variety of lithologies comprisingsedimentary, igneous and metamorphic rocks. According tospatial analysis, Quaternary deposits, the Jijal Complex andthe Misgar slates exhibit the highest numbers of mass move-ment events (Fig. 8f).
6.2.2 Distance from faults
The main mantle thrust (MMT), the Kamila Jal shear zone(KJSZ), the Kamila strike-slip fault (KSF), the Raikot Fault,the main Karakoram thrust (MKT) and the Karakoram Faultare important structural features in close proximity to thehighway (Fig. 4). Landslides are concentrated along theseactive faults where rock mass is highly deformed (Ali et al.,2017). The fact that 54 % of mapped landslides were foundwithin a maximum distance of 1 km from these faults, while69 % were found within a 2 km range, impressively sub-stantiates the postulated strong control of structural features(Fig. 8e).
6.2.3 Geomorphologic factors
Slope angle is an important geomorphic factor responsiblefor initiation of slope movements (Lee et al., 2004) to beconsidered for preparation of landslide susceptibility maps.
Nat. Hazards Earth Syst. Sci., 19, 999–1022, 2019 www.nat-hazards-earth-syst-sci.net/19/999/2019/
S. Ali et al.: Landslide susceptibility mapping by using GIS 1011
Table 6. Types of landslides along the KKH.
Section Rock Flows (debris, Shallow Deep-seated landslides/falls mud) landslides rock avalanches
Jijal–Dassu section (91 km) 37 17 19 1Sazin–Chilas section (90 km) 10 9 7 4Raikot Bridge section (49 km) 5 8 15 5Hunza Valley section (76 km) 13 6 15 10Sost–Khunjerab valley section (86 km) 22 8 16 16Rest of the highway (321 km) 2 2 14 0Total 89 50 86 36
Figure 8. Frequency distribution histograms of controlling parameters: (a) slope angle, (b) aspect, (c) profile curvature, (d) elevation, (e) dis-tance from fault, (f) geological formation (abbreviations explained in Fig. 5). BaG: Baltit Group, BG: Besham Group, Cc:Chilas Complex,GilF: Gilgit Formation, GirF: Gircha Formation, JC: Jijal Complex, KA: Kamila amphibolite, KaB: Karakoram batholith, KoB: Kohistanbatholith, MS: Misgar slates, NPG: Nanga Parbat granitic gneisses, OM: Ophiolitic Melange, PS: Passu slates, Qu: Quaternary, RpV: Raka-poshi volcanics, TF: Theilichi Formation, F: fault, TF: thrust fault, MMT: main mantle thrust, KJS: Kamila Jal shear zone, KSF: Kamilastrike–slip fault, RF: Raikot Fault, KF: Karakoram Fault, MKT: main Karakoram thrust.
www.nat-hazards-earth-syst-sci.net/19/999/2019/ Nat. Hazards Earth Syst. Sci., 19, 999–1022, 2019

1012 S. Ali et al.: Landslide susceptibility mapping by using GIS
Steep slopes are more susceptible to failure as compared togentle ones. The study area demonstrates variation in topog-raphy ranging from steep to gentle slopes, high plains tonarrow gorges and high cliffs. Slope steepness in the areahas been divided into five classes. Division of slope steep-ness into classes was based on statistical analysis. Differentclasses were tried but we found this division to be better inour study area. More than 50 % of landslides occurred inclass III (30–45◦) areas, whereas the least landslide events(2 %) occurred in class I and class V (0–15 and > 65◦) ar-eas (Fig. 8a). In addition to slope and elevation, aspect andcurvature were also considered important factors for prepa-ration of the landslide susceptibility map. However, in ourarea these parameters seem to have a reduced influence onlandslide occurrence (Fig. 8b, c, d).
6.2.4 Hydrology
The proximity of streams has been considered for the prepa-ration of landslide susceptibility maps by many researchers(Akgun et al., 2008; Basharat et al., 2016; Kanwal et al.,2016; Wang et al., 2015). In our study area, many small trib-utaries feed main rivers (Indus and Hunza). During monsoonseason and after heavy precipitation events, these streams ex-hibit high-energy flows and large discharge, and are the mainsource of mud and debris flows. Heavy precipitation dur-ing the monsoon and the westerlies triggers many landslidesby increasing pore water pressure in unconsolidated sedi-ments. Annual precipitation map of the area was preparedbased on the Pakistan Meteorological Department (PMD)data (Fig. 3a). A strong association between precipitation andmass movements along the highway has been found (Fig. 3b)(Ali et al., 2017). Peaks in mass movement curve is clearlysynchronizing with high precipitation in respective months(Fig. 3b). A large number of landslides along the KKH oc-curred in 1999 leading to traffic blockade. The precipitationmap was then overlaid to landslide events (1999). A largenumber of landslide events were found south of Sazin withannual precipitation more than 1000 mm per year. The sec-tion of the KKH east of Sazin contained comparatively lesslandslides due to its location in semi-arid to arid climatezones (> 250 mm per year). Similar control of rainfall overlandslide events has also been found in the rest of the KKH.
6.2.5 Land cover
Variations in land cover control the spatial distribution oflandslides along with other conditioning parameters (lithol-ogy, seismology, slope geometry) (Malek et al., 2015).Changes in land cover influence the hydrological conditionof the slopes, leading to slope instability. Generally, vege-tation tends to resist the erosion process, whereas bare rockor soil is more susceptible to slope failure (Reichenbach etal., 2014). Restrepo and Alvarez (2006) found a strong re-lationship between land use and landslide events. Previous
experts used a variety of software and techniques to pro-duce a land cover map from satellite imagery. Many of themused the maximum likelihood (ML) supervised classificationtool (Ahmad and Quegan, 2012; Butt et al., 2015; Escapeet al., 2013; Pourghasemi et al., 2012; Reis, 2008; Rwangaand Ndambuki, 2017; Ulbricht et al., 1993). All land covermaps produced by this technique had an accuracy of morethan 80 %. Optical images of Landsat 8 (19–21 November2017) were downloaded from the USGS database. These im-ages were then orthorectified and atmospherically correctedby using the semi-automatic classification plug-in (SCP) ofQGIS 2.18. Composite images were classified by using GIS’smaximum likelihood (ML) supervised classification tool.Training data and spectral signature file were created to rep-resent four uniform classes (vegetation, water bodies, snowand bare rock/soil). The produced map was divided into fourclasses: vegetation, water bodies, snow and bare rock/soil.The final land cover map was assessed using the confusionmatrix method. Randomly distributed test pixels for eachclass were taken on the same image that had previously beenclassified. The accuracy of the land cover map added up to87 %. Due to variations in the mountain ecosystem from Has-san Abdal to Khunjerab Pass, the KKH is surrounded by veg-etation, bare rock/soil, water bodies and ice/snow coveredslopes. The section of the highway between Hassan Abdaland Thakot is heavily vegetated due to considerable meanannual rainfall. From Thakot to Sazin, slopes are sparselyvegetated. From Sazin onward, barren rock slopes character-ize the area.
In the end, spatial density analysis was performed to checkthe influence of land cover changes on landslide events. Re-sults revealed that more than 50 % of landslides were locatedin bare rock/soil category, whereas vegetation and snow-covered areas contain 23 % each. Processed satellite im-ages were captured at the start of the winter season (19–21 November 2016). Most of the slopes in north of Gilgitwere covered by snow at this specific time. It justifies thepresence of 23 % landslides in the snow/glacial ice class.
6.3 Landslide susceptibility map
The produced landslide susceptibility map was classified intofour classes: low susceptibility, moderate susceptibility, highsusceptibility and very high susceptibility (Figs. 9 and 10).Nine susceptibility levels were converted into four levels.Each has an interval of two except for the high susceptibilitylevel, which contains three susceptibility levels: 5, 6 and 7.It was done to distinguish the locations that are more haz-ardous.
Areas of 49.9 % and 10.4 % of the classified map, respec-tively, belong to the high susceptibility and very high suscep-tibility classes, particularly owing to the presence of activefaults, seismic zones and steep slopes (Table 7). Percentagesof 34.1 % and 5.4 % of the highway fall into intermediate andlow susceptibility areas, respectively.
Nat. Hazards Earth Syst. Sci., 19, 999–1022, 2019 www.nat-hazards-earth-syst-sci.net/19/999/2019/
S. Ali et al.: Landslide susceptibility mapping by using GIS 1013
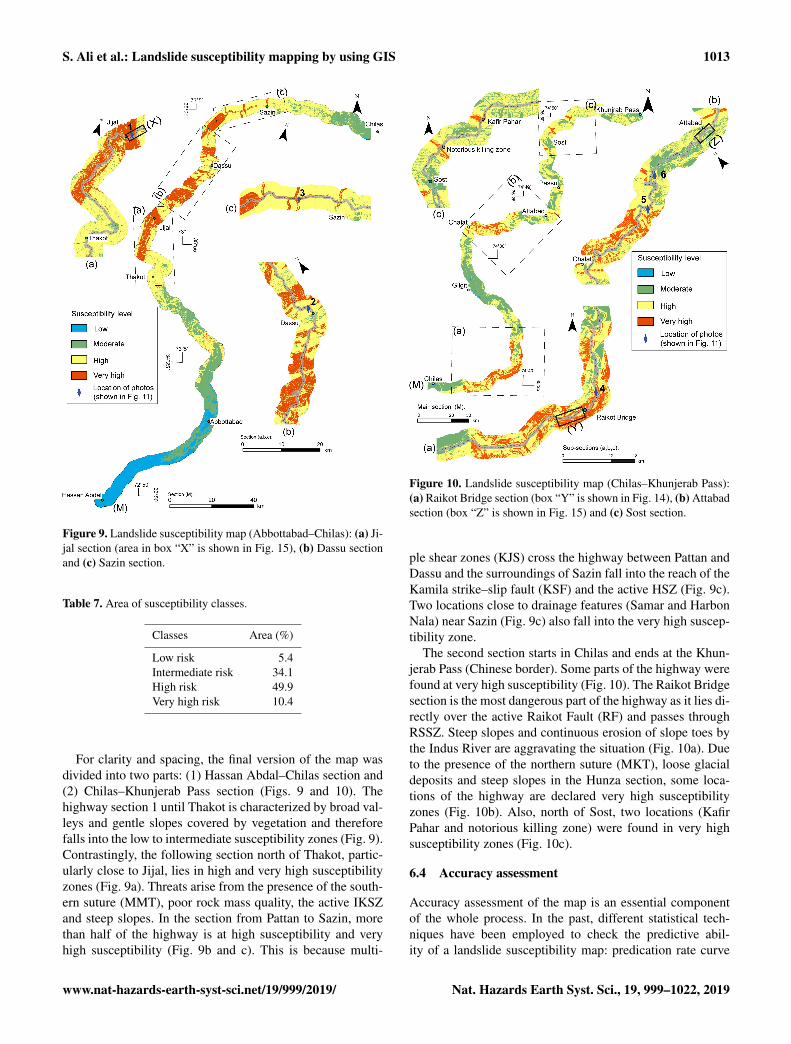
Figure 9. Landslide susceptibility map (Abbottabad–Chilas): (a) Ji-jal section (area in box “X” is shown in Fig. 15), (b) Dassu sectionand (c) Sazin section.
Table 7. Area of susceptibility classes.
Classes Area (%)
Low risk 5.4Intermediate risk 34.1High risk 49.9Very high risk 10.4
For clarity and spacing, the final version of the map wasdivided into two parts: (1) Hassan Abdal–Chilas section and(2) Chilas–Khunjerab Pass section (Figs. 9 and 10). Thehighway section 1 until Thakot is characterized by broad val-leys and gentle slopes covered by vegetation and thereforefalls into the low to intermediate susceptibility zones (Fig. 9).Contrastingly, the following section north of Thakot, partic-ularly close to Jijal, lies in high and very high susceptibilityzones (Fig. 9a). Threats arise from the presence of the south-ern suture (MMT), poor rock mass quality, the active IKSZand steep slopes. In the section from Pattan to Sazin, morethan half of the highway is at high susceptibility and veryhigh susceptibility (Fig. 9b and c). This is because multi-
Figure 10. Landslide susceptibility map (Chilas–Khunjerab Pass):(a) Raikot Bridge section (box “Y” is shown in Fig. 14), (b) Attabadsection (box “Z” is shown in Fig. 15) and (c) Sost section.
ple shear zones (KJS) cross the highway between Pattan andDassu and the surroundings of Sazin fall into the reach of theKamila strike–slip fault (KSF) and the active HSZ (Fig. 9c).Two locations close to drainage features (Samar and HarbonNala) near Sazin (Fig. 9c) also fall into the very high suscep-tibility zone.
The second section starts in Chilas and ends at the Khun-jerab Pass (Chinese border). Some parts of the highway werefound at very high susceptibility (Fig. 10). The Raikot Bridgesection is the most dangerous part of the highway as it lies di-rectly over the active Raikot Fault (RF) and passes throughRSSZ. Steep slopes and continuous erosion of slope toes bythe Indus River are aggravating the situation (Fig. 10a). Dueto the presence of the northern suture (MKT), loose glacialdeposits and steep slopes in the Hunza section, some loca-tions of the highway are declared very high susceptibilityzones (Fig. 10b). Also, north of Sost, two locations (KafirPahar and notorious killing zone) were found in very highsusceptibility zones (Fig. 10c).
6.4 Accuracy assessment
Accuracy assessment of the map is an essential componentof the whole process. In the past, different statistical tech-niques have been employed to check the predictive abil-ity of a landslide susceptibility map: predication rate curve
www.nat-hazards-earth-syst-sci.net/19/999/2019/ Nat. Hazards Earth Syst. Sci., 19, 999–1022, 2019

1014 S. Ali et al.: Landslide susceptibility mapping by using GIS
Figure 11. Example of landslide events (Ali et al., 2017) (locations of the photos are given in Figs. 9 and 10).
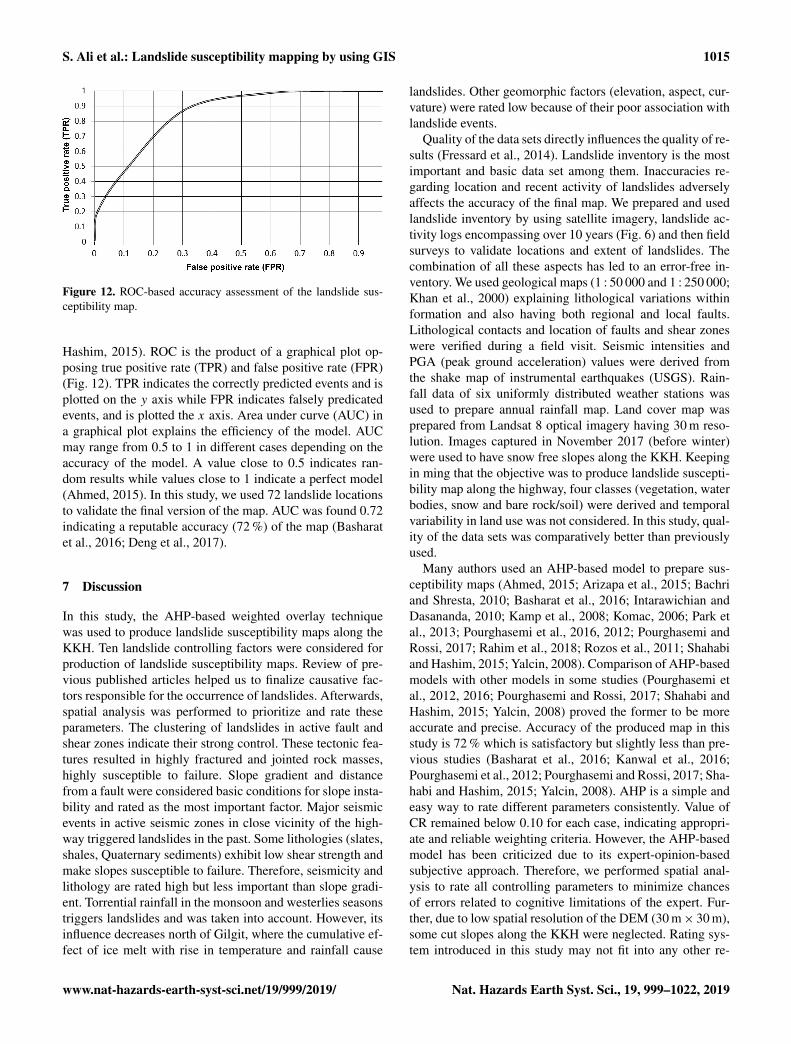
(PRC), landslide density analysis (LDA), receiver operat-ing curve (ROC) and area under curve (AUC) (Deng et al.,2017). ROC is a better choice than other techniques as it isthreshold independent and measures both accuracy and er-ror rate (Fawcett, 2006; Vakhshoori and Zare, 2018). Multi-ple researchers used ROC for validation of produced maps(Ahmed, 2015; Basharat et al., 2016; Lee, 2005; Zhou et al.,2016). In this study, we also used ROC and LDA to estimatethe predictive accuracy of the map.
In the first step, map classes were compared with landslidedensities in their respective classes. Spatial analysis of themap and landslide events was performed on GIS using thetabulate area tool. According to the obtained results, most ofthe landslide events were found in high and very high suscep-tibility areas and very few landslides were present in moder-ate and low susceptibility zones (Table 8). These statisticsconfirm a strong connection between susceptibility zonationand landslide events. Thus, this assessment indicates an ade-quate accuracy of the map.
Table 8. Areas of susceptibility level of map and observed land-slides.
Susceptibility Area Landslideslevel (km2)
1 1.3 02 342.1 03 627.2 04 1517.1 15 1819.0 86 1316.1 297 585.3 208 67.4 139 0.2 1
In the second step, we used ROC for validation and accu-racy assessment of the map, following the example of previ-ous studies (Ahmed, 2015; Basharat et al., 2016; Brenning,2005; Deng et al., 2017; Pradhan et al., 2010; Shahabi and
Nat. Hazards Earth Syst. Sci., 19, 999–1022, 2019 www.nat-hazards-earth-syst-sci.net/19/999/2019/
S. Ali et al.: Landslide susceptibility mapping by using GIS 1015
Figure 12. ROC-based accuracy assessment of the landslide sus-ceptibility map.
Hashim, 2015). ROC is the product of a graphical plot op-posing true positive rate (TPR) and false positive rate (FPR)(Fig. 12). TPR indicates the correctly predicted events and isplotted on the y axis while FPR indicates falsely predicatedevents, and is plotted the x axis. Area under curve (AUC) ina graphical plot explains the efficiency of the model. AUCmay range from 0.5 to 1 in different cases depending on theaccuracy of the model. A value close to 0.5 indicates ran-dom results while values close to 1 indicate a perfect model(Ahmed, 2015). In this study, we used 72 landslide locationsto validate the final version of the map. AUC was found 0.72indicating a reputable accuracy (72 %) of the map (Basharatet al., 2016; Deng et al., 2017).
7 Discussion
In this study, the AHP-based weighted overlay techniquewas used to produce landslide susceptibility maps along theKKH. Ten landslide controlling factors were considered forproduction of landslide susceptibility maps. Review of pre-vious published articles helped us to finalize causative fac-tors responsible for the occurrence of landslides. Afterwards,spatial analysis was performed to prioritize and rate theseparameters. The clustering of landslides in active fault andshear zones indicate their strong control. These tectonic fea-tures resulted in highly fractured and jointed rock masses,highly susceptible to failure. Slope gradient and distancefrom a fault were considered basic conditions for slope insta-bility and rated as the most important factor. Major seismicevents in active seismic zones in close vicinity of the high-way triggered landslides in the past. Some lithologies (slates,shales, Quaternary sediments) exhibit low shear strength andmake slopes susceptible to failure. Therefore, seismicity andlithology are rated high but less important than slope gradi-ent. Torrential rainfall in the monsoon and westerlies seasonstriggers landslides and was taken into account. However, itsinfluence decreases north of Gilgit, where the cumulative ef-fect of ice melt with rise in temperature and rainfall cause
landslides. Other geomorphic factors (elevation, aspect, cur-vature) were rated low because of their poor association withlandslide events.
Quality of the data sets directly influences the quality of re-sults (Fressard et al., 2014). Landslide inventory is the mostimportant and basic data set among them. Inaccuracies re-garding location and recent activity of landslides adverselyaffects the accuracy of the final map. We prepared and usedlandslide inventory by using satellite imagery, landslide ac-tivity logs encompassing over 10 years (Fig. 6) and then fieldsurveys to validate locations and extent of landslides. Thecombination of all these aspects has led to an error-free in-ventory. We used geological maps (1 : 50 000 and 1 : 250 000;Khan et al., 2000) explaining lithological variations withinformation and also having both regional and local faults.Lithological contacts and location of faults and shear zoneswere verified during a field visit. Seismic intensities andPGA (peak ground acceleration) values were derived fromthe shake map of instrumental earthquakes (USGS). Rain-fall data of six uniformly distributed weather stations wasused to prepare annual rainfall map. Land cover map wasprepared from Landsat 8 optical imagery having 30 m reso-lution. Images captured in November 2017 (before winter)were used to have snow free slopes along the KKH. Keepingin ming that the objective was to produce landslide suscepti-bility map along the highway, four classes (vegetation, waterbodies, snow and bare rock/soil) were derived and temporalvariability in land use was not considered. In this study, qual-ity of the data sets was comparatively better than previouslyused.
Many authors used an AHP-based model to prepare sus-ceptibility maps (Ahmed, 2015; Arizapa et al., 2015; Bachriand Shresta, 2010; Basharat et al., 2016; Intarawichian andDasananda, 2010; Kamp et al., 2008; Komac, 2006; Park etal., 2013; Pourghasemi et al., 2016, 2012; Pourghasemi andRossi, 2017; Rahim et al., 2018; Rozos et al., 2011; Shahabiand Hashim, 2015; Yalcin, 2008). Comparison of AHP-basedmodels with other models in some studies (Pourghasemi etal., 2012, 2016; Pourghasemi and Rossi, 2017; Shahabi andHashim, 2015; Yalcin, 2008) proved the former to be moreaccurate and precise. Accuracy of the produced map in thisstudy is 72 % which is satisfactory but slightly less than pre-vious studies (Basharat et al., 2016; Kanwal et al., 2016;Pourghasemi et al., 2012; Pourghasemi and Rossi, 2017; Sha-habi and Hashim, 2015; Yalcin, 2008). AHP is a simple andeasy way to rate different parameters consistently. Value ofCR remained below 0.10 for each case, indicating appropri-ate and reliable weighting criteria. However, the AHP-basedmodel has been criticized due to its expert-opinion-basedsubjective approach. Therefore, we performed spatial anal-ysis to rate all controlling parameters to minimize chancesof errors related to cognitive limitations of the expert. Fur-ther, due to low spatial resolution of the DEM (30 m× 30 m),some cut slopes along the KKH were neglected. Rating sys-tem introduced in this study may not fit into any other re-
www.nat-hazards-earth-syst-sci.net/19/999/2019/ Nat. Hazards Earth Syst. Sci., 19, 999–1022, 2019

1016 S. Ali et al.: Landslide susceptibility mapping by using GIS
gions due to variations in geological, seismic, hydrologicaland other controlling parameters. Lastly, change in exist-ing conditions (undercutting of landslide toes for highwayexpansion) of landslide controlling parameters may changepresent susceptibility along the highway.
7.1 Case study
To supplement results and finalize the landslide susceptibil-ity map, three sub-sections were discussed: Jijal sub-section,Raikot Bridge sub-section and Attabad sub-section.
7.1.1 Jijal sub-section
Part of the highway north of Jijal town lies in a zone of veryhigh susceptibility (box b of Fig. 9a). It comprises highlyfragmented ultramafic rocks of the Jijal Complex. Due to itsposition in the hanging wall of MMT, it is highly jointed andlocally sheared. The area is seismically active and locatedjust 3 km away from the epicentre of the Pattan Earthquakeon 28 December, 1974 (M = 6.2, D = 22 km). The seismicintensity (Modified Mercalli Intensity Scale) of this eventalong this part of the highway reached VIII (Ambraseys etal., 1981). Furthermore, the S of this area is seismically veryactive (Fig. 4c). During the catastrophic October 2005 Kash-mir Earthquake (M = 7.6), some landslides were reactivated,leading to a closure of the highway. Topography in this partis steep, with slope angles ranging between 40 and 70◦. Thearea lies in the monsoon region where average annual rainfallexceeds 1000 mm. The dotted yellow lines (Fig. 13a) indicatea big catchment area (1.34 km2), capable of collecting largeamounts of water during rainfall, leading to debris flows anddebris slides in sheared and highly fragmented rock masses.Rock and debris falls are further promoted by clayey soilsthat form in joint apertures as a result of serpentinization.Due to heavy rainfall (617 mm) in March and April 2016, alarge number of landslides were reactivated leading to block-age of the highway for 2 weeks. All these factors (closenessto fault, high seismicity, fragmented rock mass, heavy rain-fall, steep topography) are responsible for the very high land-slide susceptibility in this area.
7.1.2 Raikot Bridge sub-section
Stability of the highway is a challenge for geologists, civilengineers and highway authorities. The highway subsidencedue to river undercutting and presence of the active RaikotFault (RF) is a continuous threat. Hot water springs and ashear zone (ca. 125 m wide) indicate the presence of RF. Itmarks the boundary between Precambrian granitic gneissesof the Indian plate and batholiths and gabronorites of theKohistan Island Arc. RF is responsible for shallow seismic-ity along the highway (Fig. 4c). Seismic intensity (Modi-fied Mercalli Intensity Scale) in this part reaches VI. Therock mass is highly jointed and sheared due to the pres-ence of the fault. Furthermore, the continuous seepage from
Figure 13. Very high landslide susceptibility along the KKH nearJijal (Google Earth, 2017a, Bing Maps) (for location see Box “X” inFig. 12a). (a) Overview of 7.5 km long small section of the highwaynortheast of Jijal: dotted black line represents MMT; dotted yellowline marks the boundary of catchment area (1.34 km2); pink arrowsshow ongoing rock/debris falls, which travel downslope along withwater during heavy rainfall; gully erosion is prominent. (b) Famous“Shaitan Pari Slide” with partially damaged retaining wall. Reac-tivation of this slide is mostly during heavy rainfall. (c) Highlyjointed rock mass is highly susceptible to rock/debris fall.
hot water springs results in weathering and a lower shearstrength of the rock mass. In the past, two large land-slides dammed the Indus River (Fig. 14a). Deposits of theselandslides contain retrogressive slope movements and de-bris flows (Fig. 14a). Landslide damming had several effectson terraces and slopes, including the deposition of alluvialand lake deposits. In addition to this, continuous rockfall isadding large quantities of debris to the slopes. Topographi-cally, this section is also very steep. Climatically, it lies in asemi-arid to arid zone with an average annual rainfall of 0–
Nat. Hazards Earth Syst. Sci., 19, 999–1022, 2019 www.nat-hazards-earth-syst-sci.net/19/999/2019/

S. Ali et al.: Landslide susceptibility mapping by using GIS 1017
Figure 14. Very high landslide susceptibility near Raikot Bridge(Google Earth, 2017b, Bing Maps) (for location see Box “Y” inFig. 13b). (a) Overview of 13.4 km long small section west of theRaikot Bridge: white lines represent main scarps of large land-slides/rock avalanches, which dammed the Indus River in the past;dotted yellow circles represent deposits of these old landslides;white arrows are showing sagging in landslide deposit which is dueto retrogressive rotational failure. (b) White line represents scarp ofshallow landslide in alluvial deposits (area in red box of panel a);area in dotted yellow circles represents ongoing rock/debris fall sup-plying scree/talus for debris flow during rainy season. (c) One ofthe hot water springs (90–96 ◦C) along the highway in this section.(d) Another view of small section: white arrows are marking upperlimit of the shear zone (ca. 125 m wide); dotted black represent-ing active RF marked along shear zone; overhangs above and rivererosion below the highway makes this section highly susceptible toslope failures.
250 mm. Rainfall, however, is restricted to a couple of eventsper year. On 3 and 4 April, 2016, 105 mm rainfall reactivateddebris flows and slides. The prevailing circumstances makethis part of the highway highly susceptible to landslides.
Figure 15. High landslide susceptibility along the highway inHunza Valley (Google Earth, 2017c, Bing Maps) (for location seeBox “Z” in Fig. 13b). (a) Overview of 11 km long small section westof the Attabad Lake: white lines are representing the main scarpsof old large landslides/rock avalanches which dammed the HunzaRiver in past; dotted yellow circles represent deposits of these oldlandslides; white arrows are showing location of local fault. (b) At-tabad landslide (in red box of panel a); blue arrows are showing thehighway submerged in lake water.
7.1.3 Attabad sub-section
Hunza section has a variety of slope failures depending uponprevailing geological and climatic conditions. However, thearea shown in Fig. 15 is characterized by falls (rock, de-bris) and some slides (rock, debris). Historically, large land-slides (1858, 1980, and 2010) dammed Hunza River in thispart (Fig. 15a). The area is characterized by highly weath-ered and jointed granodiorites, orthogneisses and pegmatiticveins of the Kohistan Batholith. The orientation of joints(dipping in the same direction as the slope) has an adverseimpact on slope stability. The area is located in the hang-ing wall of MKT, the main fault in this region, and a localfault exists in the close vicinity (Fig. 15a). Past earthquakes(Astore, 2002; M = 6.3 and Muzaffarabad, 2005; M = 7.6)produced ground shaking intensity of up to V–VI (Modi-fied Mercalli Intensity Scale). Climatically, the valley flooris part of a semi-arid zone (250–500 mm per year) while thehigher slopes and peaks (> 5000 m) receive precipitation of
www.nat-hazards-earth-syst-sci.net/19/999/2019/ Nat. Hazards Earth Syst. Sci., 19, 999–1022, 2019

1018 S. Ali et al.: Landslide susceptibility mapping by using GIS
≥ 1000 mm per year. Therefore, the area is sparsely vege-tated. Rainfall coupled with snowmelt in early spring reacti-vates old landslides (Ali et al., 2017). Undercutting of land-slide toes by Hunza River below the highway and rock/debrisfall upslope are major concerns in this section. All of theabovementioned circumstances yield a high landslide sus-ceptibility for this section (Fig. 11).
8 Conclusions
A set of landslide susceptibility maps of the KKH (CPEC)was prepared using GIS involving multiple techniques: lit-erature review, remote sensing and field surveys. Ten con-trolling parameters (lithology, seismicity, rainfall intensity,distance from fault, elevation, slope angle, aspect, curvature,land cover and hydrology) were considered of which eachone was assigned a numerical weight using AHP. Thematiclayers of these parameters were then overplayed using theWOL tool of GIS. Four different classes of landslide suscep-tibility were then applied to the final map: low susceptibil-ity, moderate susceptibility, high susceptibility and very highSusceptibility. Percentages of 10 % and 50 % of the highwaywere found in very high and high susceptibility zones, re-spectively. Active faults (MMT, KJS, KSF, RF, MKT, KF),seismic zones (IKSZ, HSZ, RSSZ) and steep slopes are re-sponsible for the associated susceptibility in these areas. Thehighway is characterized by a variety of mass movements:rockfall, debris fall, rockslide, debris slide, debris flows andmudflows. The threatened sections are especially unstablein monsoon and westerlies seasons every year. Altogether,a detailed investigation is inevitable to enable hazard-freeand safe travelling. About 40 % of the highway lies in lowand moderate susceptibility zones, which remain almost sta-ble throughout the year. The highway sections from HassanAbdal to Thakot, near Chilas, Gilgit and Sost fall into thesemoderate and low susceptibility zones and are quite stabledue to their course in broad U-shaped valleys with gentleslopes. Although the part of the highway between HassanAbdal and Thakot receives heavy precipitation in the mon-soon season, the area is stable owing to a mature geomor-phology. Due to closeness with MMT, higher seismic in-tensity and steep topography, the KKH near Raikot Bridgeand Jijal was found to be at very high risk. Furthermore,extreme weather conditions, highly shattered and weatheredrock masses, active faults and long, steep slopes are respon-sible for very high and high susceptibility around Attabad,notorious killing zone and Kafir Pahar sites. According to re-sults, active faults, slope gradient, seismicity and lithologyhave a strong influence on landslide events along the high-way. In the final step, the predictive accuracy of the map wasdetermined by using LDA and ROC. The accuracy of the mapwas rated to a satisfactory 72 %, which is suitable for mitiga-tion planning.
Data availability. Data cannot be shared at this stage as authors arecurrently analysing for further work.
Author contributions. SA constructed an idea, planned methodol-ogy, interpreted results, and then reached conclusions. KR super-vised the whole process and provided personal, environmental, andfinancial support for the research work. PB and RH took responsi-bility for literature review and assisted SA in finalising the wholepaper and in the end critically reviewed the paper before submis-sion.
Competing interests. The authors declare that they have no conflictof interest.
Special issue statement. This article is part of the special issue“Landslide–road network interactions”. It is not associated with aconference.
Acknowledgements. We would like to thank the Higher Educa-tion Commission (HEC) of Pakistan and the German AcademicExchange Service (DAAD) for financial support for the researchproject. Also, we thank Paolo Tarolli, anonymous referees, Muham-mad Basharat and Aram Fathian Baneh for their valuable sugges-tions. Further, we would like acknowledge the Frontier Works Or-ganization (FWO) and the Pakistan Meteorological Department forprovision of data for analysis.
Review statement. This paper was edited by Paolo Tarolli and re-viewed by Ananta Man Singh Pradhan and four anonymous refer-ees.
References
Ahmad, A. and Quegan, S.: Analysis of Maximum Likelihood Clas-sification on Multispectral Data, Appl. Math. Sci., 6, 6425–6436,https://doi.org/10.12988/ams.2013.34214, 2012.
Ahmed, B.: Landslide susceptibility mapping using multi-criteria evaluation techniques in Chittagong Metropoli-tan Area, Bangladesh, Landslides, 12, 1077–1095,https://doi.org/10.1007/s10346-014-0521-x, 2015.
Ahmed, M. F., Rogers, J. D., and Ismail, E. H.: A regionallevel preliminary landslide susceptibility study of the up-per indus river basin, Eur. J. Remote Sens., 47, 343–373,https://doi.org/10.5721/EuJRS20144721, 2014.
Akgun, A., Dag, S., and Bulut, F.: Landslide susceptibility mappingfor a landslide-prone area (Findikli, NE of Turkey) by likelihood-frequency ratio and weighted linear combination models, Envi-ron. Geol., 54, 1127–1143, https://doi.org/10.1007/s00254-007-0882-8, 2008.
Ali, S., Schneiderwind, S., and Reicherter, K.: Advancing Cultureof Living with Landslides, edited by: Mikoš, M., Casagli, N.,
Nat. Hazards Earth Syst. Sci., 19, 999–1022, 2019 www.nat-hazards-earth-syst-sci.net/19/999/2019/

S. Ali et al.: Landslide susceptibility mapping by using GIS 1019
Yin, Y., and Sassa, K., Springer International Publishing, Cham,Switzerland, 2017.
Ambraseys, N., Lensen, G., Moinfart, A., and Penningtons, W.: ThePattan (Pakistan) earthquake of 28 December 1974: field obser-vations The earliesknownt earthquakes of the Northwest FrontierProvinces (NWFP) Geological and tectonic setting Evidence ofregional Quarternary and Recent movements, Q. J. Eng. Geol.Hydrogeol., 14, 1–16, 1981.
Arizapa, J. L., Combalicer, E. A., and Tiburan, C. J. L.: LandslideSusceptibility Mapping of Pagsanjan – Lumban Watershed usingGIS and Analytical Hierarchy Process, Ecosyst. Dev. J., 5, 23–32, 2015.
Ayalew, L., Yamagishi, H., and Ugawa, N.: Landslide susceptibil-ity mapping using GIS-based weighted linear combination, thecase in Tsugawa area of Agano River, Niigata Prefecture, Japan,Landslides, 1, 73–81, https://doi.org/10.1007/s10346-003-0006-9, 2004.
Ayalew, L., Yamagishi, H., Marui, H. and Kanno, T.: Land-slides in Sado Island of Japan: Part II. GIS-based sus-ceptibility mapping with comparisons of results fromtwo methods and verifications, Eng. Geol., 81, 432–445,https://doi.org/10.1016/j.enggeo.2005.08.004, 2005.
Bacha, A. S., Shafique, M., and van der Werff, H.: Landslide in-ventory and susceptibility modelling using geospatial tools, inHunza-Nagar valley, northern Pakistan, J. Mt. Sci., 15, 1354–1370, https://doi.org/10.1007/s11629-017-4697-0, 2018.
Bachri, S. and Shresta, R. P.: Landslide hazard assessment usinganalytic hierarchy processing (AHP) and geographic informationsystem in Kaligesing mountain area of Central Java Province In-donesia, 5th Annu. Int. Work. Expo on Sumatra Tsunami Dis-aster Recover, 23–24 November 2010, Banda Aceh, Indonesia,2010.
Barchi, M., Brozzetti, F., and Lavecchia, G.: Analisi strutturale ege-ometrica dei bacini della media valle del Tevere e dellavalle um-bra, Boll. Soc. Geol. Ital., 110, 65–76, 1993.
Basharat, M., Shah, H. R., and Hameed, N.: Landslide suscepti-bility mapping using GIS and weighted overlay method: a casestudy from NW Himalayas, Pakistan, Arab, J. Geosci., 9, 1–19,https://doi.org/10.1007/s12517-016-2308-y, 2016.
Bishop, M. P., Shroder, J. F., Bonk, R., and Olsenholler,J.: Geomorphic change in high mountains: A western Hi-malayan perspective, Global Planet. Change, 32, 311–329,https://doi.org/10.1016/S0921-8181(02)00073-5, 2002.
Brenning, A.: Spatial prediction models for landslide hazards: re-view, comparison and evaluation, Nat. Hazards Earth Syst. Sci.,5, 853–862, https://doi.org/10.5194/nhess-5-853-2005, 2005.
Burg, J. P., Jagoutz, O., Dawood, H., and Shahid Hussain, S.:Precollision tilt of crustal blocks in rifted island arcs: Struc-tural evidence from the Kohistan Arc, Tectonics, 25, 1–13,https://doi.org/10.1029/2005TC001835, 2006.
Butt, A., Shabbir, R., Ahmad, S. S., and Aziz, N.: Landuse change mapping and analysis using Remote Sensingand GIS: A case study of Simly watershed, Islamabad,Pakistan, Egypt. J. Remote Sens. Sp. Sci., 18, 251–259,https://doi.org/10.1016/j.ejrs.2015.07.003, 2015.
Canuti, P., Garduño, V. H., Garzonio, C. A., and Iotti, A.: Slopeevolution and mass movements in the Mt. Amiata region (Tus-cany, Italy), in: International Workshop on environmental Vol-canology, 35–36, Riassunto, 1993.
Cardinali, M., Galli, M., Guzzetti, F., Reichenbach, P., and Borri,G.: Relazioniframovimenti diversantee fenomenitettonicinel ba-cino del Torrente Carpina (Umbria settentrionale), Geogr. Fis.eDinamica Quat., 17, 3–17, 1994.
Cardinali, M., Ardizzone, F., Galli, M., Guzzetti, F., and Reichen-bach, P.: Landslides triggered by rapid snow melting: the De-cember 1996–January 1997 event in Central Italy, in: Proceed-ings Plinius Conference ’99, 14–16 October 1999, Maratea, Italy,439–448, 2000.
Coco, L. and Buccolini, M.: The Effect of Morphometry, Land-use and Lithology on Landslides Susceptibility: An ExploratoryAnalysis, IOS Press, 779–784, https://doi.org/10.3233/978-1-61499-580-7-779, 2015.
Deng, X., Li, L., and Tan, Y.: Validation of Spatial PredictionModels for Landslide Susceptibility Mapping by ConsideringStructural Similarity, ISPRS Int. J. Geo-Information, 6, 103,https://doi.org/10.3390/ijgi6040103, 2017.
Derbyshire, E., Fort, M., and Owen, L. A.: Geomorphologicalhazards along the Karakoram Highway: Khunjerab Pass tothe Gilgit River, northernmost Pakistan, Erdkunde, 55, 49–71,https://doi.org/10.3112/erdkunde.2001.01.04, 2001.
Ding, L., Qasim, M., Jadoon, I. A. K., Khan, M. A., Xu, Q., Cai,F., Wang, H., Baral, U., and Yue, Y.: The India–Asia collision innorth Pakistan: Insight from the U-Pb detrital zircon provenanceof Cenozoic foreland basin, Earth Planet. Sc. Lett., 455, 49–61,https://doi.org/10.1016/j.epsl.2016.09.003, 2016.
DiPietro, J. A. and Pogue, K. R.: Tectonostratigraphic subdivisionsof the Himalaya: A view from the west, Tectonics, 23, TC5001,https://doi.org/10.1029/2003TC001554, 2004.
Dramis, F., Garzonio, C. A., Leoperdi, S., Nanni, T., Pontoni, F.,and Rainone, M. L.: Damage due to landslides in the ancient vil-lage of Sirolo (Marche, Italy): preliminary analysis of risk miti-gation on the historical site., in: Int. Symp. Eng. Geol. of AncientWork, Monuments and Historical Sites, 19–23 September 1988,Athens, Greece, 1988.
Ellen, S. D., Mark, R. K., Cannon, S. H., and Knifong, D. L.: Mapof Debris-flow Hazard in the Honolulu District of Oahu, Hawaii,U.S. Geological Survey, Washington, D.C., USA, 1993.
Escape, C. M., Alemania, M. K., Luzon, P. K., and Felix, R.:Comparison of various remote sensing classification methodsfor landslide detection using ArcGIS, UP NOAH Cent, availableat: https://center.noah.up.edu.ph/comparison-of-various-remote-sensing-classification-methods-for-landslide-detection-using-arcgis/ (last access: 5 March 2017), 2013.
Fawcett, T.: An introduction to ROC analysis, Pattern Recognit.Lett., 27, 861–874, https://doi.org/10.1016/j.patrec.2005.10.010,2006.
Fayaz, A., Latif, M., and Khan, K. S. A.: Landslide Evaluation andStabilization Between Gilgit ans Thakot Along the KarakoramHighway, Geological Survey of Pakistan, Islamabad, Pakistan,1985.
Fressard, M., Thiery, Y., and Maquaire, O.: Which data forquantitative landslide susceptibility mapping at operationalscale? Case study of the Pays d’Auge plateau hillslopes (Nor-mandy, France), Nat. Hazards Earth Syst. Sci., 14, 569–588,https://doi.org/10.5194/nhess-14-569-2014, 2014.
Google Earth Pro: Jijal, Pakistan (October 18, 2014).35◦2′39.38′′ N, 72◦56′22.80′′ E, Eye alt 3.40 km, 2019
www.nat-hazards-earth-syst-sci.net/19/999/2019/ Nat. Hazards Earth Syst. Sci., 19, 999–1022, 2019

1020 S. Ali et al.: Landslide susceptibility mapping by using GIS
CNES/Airbus, available at: https://www.google.com/earth/,last access: 9 June 2017a.
Google Earth Pro: Raikot Bridge, Pakistan (October 18,2014). 35◦28′6.88′′ N, 74◦32′57.44′′ E, Eye alt 5.74 km, 2019CNES/Airbus, available at: https://www.google.com/earth/, lastaccess: 9 June 2017b.
Google Earth Pro: Attabad, Pakistan (October 18, 2014).36◦17′33.18′′ N, 74◦46′29.82′′ E, Eye alt 11.69 km, 2019 Digit.Globe, available at: https://www.google.com/earth/, last access:9 June 2017c.
Goudie, A. S., Brunsden, D., Collins, D. N., Derbyshire, E., Fergu-son, R. I., Hashnet, Z., Jones, D. K. C., Per-Rott, F. A., Said, M.,Waters, R. S., and Whalley, W. B.: The geomorphology of theHunza Valley, Karakoram mountains, Pakistan, Int. Karakoram-Project, 2, 359–411, 1984.
Guzzetti, F., Carrara, A., Cardinali, M., and Reichenbach, P.: Land-slide hazard evaluation: A review of current techniques and theirapplication in a multi-scale study, Central Italy, Geomorphology,31, 181–216, https://doi.org/10.1016/S0169-555X(99)00078-1,1999.
Guzzetti, F., Cardinali, M., Reichenbach, P., and Carrara, A.:Comparing landslide maps: A case study in the upper TiberRiver basin, central Italy, Environ. Manage., 25, 247–263,https://doi.org/10.1007/s002679910020, 2000.
Guzzetti, F., Mondini, A. C., Cardinali, M., Fiorucci, F., San-tangelo, M., and Chang, K. T.: Landslide inventory maps:New tools for an old problem, Earth-Sci. Rev., 112, 42–66,https://doi.org/10.1016/j.earscirev.2012.02.001, 2012.
Hewitt, K.: Catastrophic landslides and their effects on the Up-per Indus streams, Karakoram Himalaya, northern Pakistan,Geomorphology, 26, 47–80, https://doi.org/10.1016/S0169-555X(98)00051-8, 1998.
Hu, X. and Cruden, D.: Buckling deformation in the HighwoodPass, Alberta, Can. Geotech. J., 30, 276–286, 1993.
Intarawichian, N. and Dasananda, S.: Analytical hierarchy processfor landslide susceptibility mapping in lower Mae Chaem wa-tershed, Northern Thailand, Suranaree J. Sci. Technol., 17, 277–292, 2010.
Jade, S.: Estimates of plate velocity and crustal deformation in theIndian subcontinent using GPS geodesy, Curr. Sci., 86, 1443–1448, 2004.
Kamp, U., Growley, B. J., Khattak, G. A., and Owen, L.A.: GIS-based landslide susceptibility mapping for the 2005Kashmir earthquake region, Geomorphology, 101, 631–642,https://doi.org/10.1016/j.geomorph.2008.03.003, 2008.
Kanwal, S., Atif, S., and Shafiq, M.: GIS based landslide suscep-tibility mapping of northern areas of Pakistan, a case study ofShigar and Shyok Basins, Geomat. Nat. Haz. Risk, 5705, 1–19,https://doi.org/10.1080/19475705.2016.1220023, 2016.
Kartiko, R. D., Brahmantyo, B., and Sadisun, I. A.: Slope and Litho-logical Controls on Landslide Distribution in West, in: Interna-tional Symposium on Geotechnical Hazards: Prevention, Mitiga-tion and Engineering Response, Utomo, Tohari, Murdohardono,Sadisun, April 2006, Yogyakarta, Indonesia, 177–184, 2006.
Khan, H., Shafique, M., Khan, M. A., Bacha, M. A., Shah,S. U., and Calligaris, C.: Landslide susceptibility assess-ment using Frequency Ratio, a case study of northernPakistan, Egypt. J. Remote Sens. Sp. Sci., 22, 11–24,https://doi.org/10.1016/j.ejrs.2018.03.004, 2018.
Khan, K. S. A., Fayaz, A., Latif, M., and Wazir, A. K.: Rock and De-bris Slides Between Khunjrab Pass and Gilgit along the Karako-ram Highway, Geological Survey of Pakistan, Islamabad, Pak-istan, 1986.
Khan, K. S. A., Latif, M., Fayaz, A., Khan, N. A., and Khan, S.Z.: Geological Roadlog along the Karakorum Highway from Is-lamabad to Khunjrab Pass, Geological Survey of Pakistan, Islam-abad, Pakistan, 2000.
Khan, K. S. A., Fayaz, A., Hussain, M., and Latif, M.: Land-slides Problems and Their Mitigation along the Karakoram High-way, 1st ed., Geological Survey of Pakistan, Islamabad, Pakistan,2003.
Khan, M. A., Jan, M. Q., Windley, B. F., Tarney, J., and Thirlwall,M. F.: The Chilas mafic-ultramafic igneous complex; the root ofthe Kohistan island arc in the Himalaya of northern Pakistan,Geol. Soc. Am. Spec. Pap., 232, 75–94, 1989.
Komac, M.: A landslide susceptibility model using the An-alytical Hierarchy Process method and multivariate statis-tics in perialpine Slovenia, Geomorphology, 74, 17–28,https://doi.org/10.1016/j.geomorph.2005.07.005, 2006.
Lee, S.: Application of logistic regression model and its val-idation for landslide susceptibility mapping using GIS andremote sensing data, Int. J. Remote Sens., 26, 1477–1491,https://doi.org/10.1080/01431160412331331012, 2005.
Lee, S., Chwae, U., and Min, K.: Landslide susceptibility map-ping by correlation between topography and geological struc-ture: The Janghung area, Korea, Geomorphology, 46, 149–162,https://doi.org/10.1016/S0169-555X(02)00057-0, 2002.
Lee, S., Ryu, J.-H., Won, J.-S., and Park, H.-J.: Determinationand application of the weights for landslide susceptibility map-ping using an artificial neural network, Eng. Geol., 71, 289–302,https://doi.org/10.1016/S0013-7952(03)00142-X, 2004.
Malek, Ž., Zumpano, V., Schröter, D., Glade, T., Balteanu, D., andMicu, M.: Scenarios of land cover change and landslide suscep-tibility: An example from the buzau subcarpathians, romania,Eng. Geol. Soc. Territ., 5, 743–746, https://doi.org/10.1007/978-3-319-09048-1_144, 2015.
MonaLisa, Khwaja, A. A., Jan, M. Q., Yeats, R. S., Hussain,A., and Khan, S. A.: New data on the Indus Kohistan seis-mic zone and its extension into the Hazara-Kashmir Syn-taxis, NW Himalayas of Pakistan, J. Seismol., 13, 339–361,https://doi.org/10.1007/s10950-008-9117-z, 2009.
Nilsen, T. H., Wright, R. H., Vlasic, T. C., and Spangle, W.: Relativeslope stability and land-use planning. Selected examples from theSan Francisco Bay region, California., US Geol. Surv. Prof. Pap.,944, 1–96, available at: http://www.scopus.com/inward/record.url?eid=2-s2.0-0018731268&partnerID=tZOtx3y1 (last access:11 July 2017), 1979.
Ohlmacher, G. C. and Davis, J. C.: Using multiple logis-tic regression and GIS technology to predict landslide haz-ard in northeast Kansas, USA, Eng. Geol., 69, 331–343,https://doi.org/10.1016/S0013-7952(03)00069-3, 2003.
Park, S., Choi, C., Kim, B., and Kim, J.: Landslide suscepti-bility mapping using frequency ratio, analytic hierarchy pro-cess, logistic regression, and artificial neural network methodsat the Inje area, Korea, Environ. Earth Sci., 68, 1443–1464,https://doi.org/10.1007/s12665-012-1842-5, 2013.
Pourghasemi, H. R. and Rossi, M.: Landslide susceptibilitymodeling in a landslide prone area in Mazandarn Province,
Nat. Hazards Earth Syst. Sci., 19, 999–1022, 2019 www.nat-hazards-earth-syst-sci.net/19/999/2019/

S. Ali et al.: Landslide susceptibility mapping by using GIS 1021
north of Iran: a comparison between GLM, GAM, MARS,and M-AHP methods, Theor. Appl. Climatol., 130, 609–633,https://doi.org/10.1007/s00704-016-1919-2, 2017.
Pourghasemi, H. R., Pradhan, B., and Gokceoglu, C.: Application offuzzy logic and analytical hierarchy process (AHP) to landslidesusceptibility mapping at Haraz watershed, Iran, Nat. Hazards,63, 965–996, https://doi.org/10.1007/s11069-012-0217-2, 2012.
Pourghasemi, H. R., Beheshtirad, M., and Pradhan, B.: Acomparative assessment of prediction capabilities of mod-ified analytical hierarchy process (M-AHP) and Mamdanifuzzy logic models using Netcad-GIS for forest fire sus-ceptibility mapping, Geomat. Nat. Haz. Risk, 7, 861–885,https://doi.org/10.1080/19475705.2014.984247, 2016.
Pradhan, B., Lee, S., and Buchroithner, M. F.: Remote Sens-ing and GIS-based Landslide Susceptibility Analysis andits Cross-validation in Three Test Areas Using a Fre-quency Ratio Model, Photogramm. Fernerkun., 2010, 17–32,https://doi.org/10.1127/1432-8364/2010/0037, 2010.
Rahim, I., Ali, S. M., and Aslam, M.: GIS Based Landslide Suscep-tibility Mapping with Application of Analytical Hierarchy Pro-cess in District Ghizer, Gilgit Baltistan Pakistan, J. Geosci. En-viron. Prot., 06, 34–49, https://doi.org/10.4236/gep.2018.62003,2018.
Reichenbach, P., Busca, C., Mondini, A. C., and Rossi, M.: The In-fluence of Land Use Change on Landslide Susceptibility Zona-tion: The Briga Catchment Test Site (Messina, Italy), Environ.Manage., 54, 1372–1384, https://doi.org/10.1007/s00267-014-0357-0, 2014.
Reis, S.: Analyzing land use/land cover changes using remote sens-ing and GIS in Rize, North-East Turkey, Sensors, 8, 6188–6202,https://doi.org/10.3390/s8106188, 2008.
Restrepo, C. and Alvarez, N.: Landslides and their contri-bution to land-cover change in the mountains of Mex-ico and Central America, Biotropica, 38, 446–457,https://doi.org/10.1111/j.1744-7429.2006.00178.x, 2006.
Roslee, R., Mickey, A. C., Simon, N., and Norhisham, M.N.: Landslide Susceptibility Analysis (Lsa) Using WeightedOverlay Method (Wom) Along the Genting Sempah ToBentong Highway, Pahang, Malays. J. Geosci., 1, 13–19,https://doi.org/10.26480/mjg.02.2017.13.19, 2017.
Rozos, D., Bathrellos, G. D., and Skillodimou, H. D.: Compari-son of the implementation of rock engineering system and an-alytic hierarchy process methods, upon landslide susceptibilitymapping, using GIS: A case study from the Eastern AchaiaCounty of Peloponnesus, GREECE, Environ. Earth Sci., 63, 49–63, https://doi.org/10.1007/s12665-010-0687-z, 2011.
Ruff, M. and Czurda, K.: Landslide susceptibility anal-ysis with a heuristic approach in the Eastern Alps(Vorarlberg, Austria), Geomorphology, 94, 314–324,https://doi.org/10.1016/j.geomorph.2006.10.032, 2008.
Rwanga, S. S. and Ndambuki, J. M.: Accuracy Assess-ment of Land Use/Land Cover Classification Using Re-mote Sensing and GIS, Int. J. Geosci., 08, 611–622,https://doi.org/10.4236/ijg.2017.84033, 2017.
Saaty, R. W.: The analytic hierarchy process-what it is and how itis used, Math. Model., 9, 161–176, https://doi.org/10.1016/0270-0255(87)90473-8, 1987.
Saaty, T. L.: How to make a decision: The analytic hierarchy pro-cess, Eur. J. Oper. Res., 48, 9–26, https://doi.org/10.1016/0377-2217(90)90057-I, 1990.
Sarkar, S. and Kanungo, D. P.: An integrated approachfor landslide susceptibility mapping using remote sensingand GIS, Photogramm. Eng. Remote Sens., 70, 617–628,https://doi.org/10.14358/PERS.70.5.617, 2004.
Searle, M. P., Khan, M. A., Fraser, J. E., Gough, S. J., and Jan, M.Q.: The tectonic evolution of the Kohistan-Karakoram collisionbelt along the Karakoram Highway transect, north Pakistan, Tec-tonics, 18, 929–949, 1999.
Shahabi, H. and Hashim, M.: Landslide susceptibility map-ping using GIS-based statistical models and Remote sens-ing data in tropical environment, Sci. Rep., 5, 9899,https://doi.org/10.1038/srep09899, 2015.
Shit, P. K., Bhunia, G. S., and Maiti, R.: Potential landslide suscep-tibility mapping using weighted overlay model (WOM), Model.Earth Syst. Environ., 21, 1–10, https://doi.org/10.1007/s40808-016-0078-x, 2016.
Soeters, R. and van Westen, C. J.: Slope instability recognition,analysis, and zonation, in: Landslides, investigation and mitiga-tion, edited by: Turner, A. K. and Schuster, R. L., Washington,D.C., USA, 1996.
Süzen, M. L. and Doyuran, V.: A comparison of the GISbased landslide susceptibility assessment methods: Mul-tivariate versus bivariate, Environ. Geol., 45, 665–679,https://doi.org/10.1007/s00254-003-0917-8, 2004.
Taherynia, M. H., Mohammadi, M., and Ajalloeian, R.: Assess-ment of Slope Instability and Risk Analysis of Road CutSlopes in Lashotor Pass, Iran, J. Geol. Res., 2014, 1–12,https://doi.org/10.1155/2014/763598, 2014.
Tahirkheli, R. A. K. and Jan, M. Q.: Geology of Kohistan, Karako-rum Himalaya, northern Pakistan, Geol. Bull. Univ. Peshawar,Pakistan, 11, 1–30, 1979.
Treloar, P. J., Petterson, M. G., Jan, M. Q., and Sullivan, M. A.:A re-evaluation of the stratigraphy and evolution of the Kohis-tan arc sequence, Pakistan Himalaya: implications for magmaticand tectonic arc-building processes, J. Geol. Soc., 153, 681–693,https://doi.org/10.1144/gsjgs.153.5.0681, 1996.
Ulbricht, K. A., Teotia, H. S., and Civco, D. L.: SupervisedClassification to Land Cover Mapping in Semi-Arid Envi-ronment of NE Brazil Using Landsat-TM and SPOT Data,Int. Arch. Photogramm. Remote Sens., 29, 821–821, availableat: http://www.isprs.org/proceedings/XXIX/congress/part7/821_XXIX-part7.pdf (last access: 16 February 2016), 1993.
USGS Earthquake Catalog: USGS Earthquake Catalog, Earthq.Cat., available at: https://earthquake.usgs.gov/earthquakes/search/, last access: 23 July 2017.
Vakhshoori, V. and Zare, M.: Is the ROC curve a reli-able tool to compare the validity of landslide suscep-tibility maps?, Geomat. Nat. Haz. Risk, 9, 249–266,https://doi.org/10.1080/19475705.2018.1424043, 2018.
Vallejo, G. L. and Ferrer, M.: Geological Engineering, 1st ed., CRCPress/Balkema, AK Leiden, the Netherlands, 2011.
van Westen, C. J., van Asch, T. W. J., and Soeters, R.: Landslidehazard and risk zonation - Why is it still so difficult?, Bull. Eng.Geol. Environ., 65, 167–184, https://doi.org/10.1007/s10064-005-0023-0, 2006.
www.nat-hazards-earth-syst-sci.net/19/999/2019/ Nat. Hazards Earth Syst. Sci., 19, 999–1022, 2019

1022 S. Ali et al.: Landslide susceptibility mapping by using GIS
Varnes, D. J.: Slope movements types and processes, in: Landslidesanalysis and control, edited by: Schuster, R. L. and Krizek, R. J.,Washington, D.C., USA, 1978.
Wang, Q., Li, W., Chen, W., and Bai, H.: GIS-based assessment oflandslide susceptibility using certainty factor and index of en-tropy models for the Qianyang county of Baoji city, China, J.Earth Syst. Sci., 124, 1399–1415, 2015.
Williams, M. P.: The Geology of the Besham area, North Pakistan:Deformation and Imbrication in the footwall of the Main MantleThrust, Geol. Bull. Univ. Peshawar, 22, 65–82, 1989.
Yalcin, A.: GIS-based landslide susceptibility mapping using an-alytical hierarchy process and bivariate statistics in Ardesen(Turkey): Comparisons of results and confirmations, Catena, 72,1–12, https://doi.org/10.1016/j.catena.2007.01.003, 2008.
Zeitler, P. K.: Cooling history of the NW Himalaya, Pakistan, Tec-tonics, 4, 127–151, https://doi.org/10.1029/TC004i001p00127,1985.
Zhiquan, Y. and Yingyan, Z.: Types and Space Distribution Char-acteristics of Debris Flow Disasters Along China-Pakistan High-way, Electron. J. Geotech. Eng., 21, 191–200, 2016.
Zhou, S., Chen, G., Fang, L., and Nie, Y.: GIS-based integra-tion of subjective and objective weighting methods for re-gional landslides susceptibility mapping, Sustain., 8, 1–15,https://doi.org/10.3390/su8040334, 2016.
Nat. Hazards Earth Syst. Sci., 19, 999–1022, 2019 www.nat-hazards-earth-syst-sci.net/19/999/2019/